1. Introduction
In view of the increasing pace of global warming, a significant reduction in greenhouse gas (GHG) emissions through energy consumption reduction on the one hand, but also through increased use of renewable energies is imperative. The decarbonisation of the energy supply of the current building sector is of utmost importance, as it accounts for about 37% of global final energy consumption [
1]. The current energy crisis has further reinforced the need to substitute fossil fuels. In Germany, 75% of the building stock is heated by fossil fuels such as oil or gas [
2]. Among existing buildings, non-residential buildings are particularly relevant. Although in Germany their share of the total number of all buildings is only about 9%, they are responsible for about one third of the final energy consumption in the building sector. In this group, non-residential buildings with office-like use have the largest shares of floor space [
2]. Accordingly, the leverage for GHG savings per building is significantly greater here compared to residential buildings. The choice of the case study building, as an existing non-residential building with mainly office-like use derives from this.
In the building sector, lowering system temperatures is an important strategy for saving GHG. Firstly, it reduces heat distribution losses in district heating networks and in intra-building heat distribution systems. Østergaard estimates heat savings of 30% when supply and return temperatures in buildings are lowered from 80 °C/40 °C to 60 °C/30 °C [
3]. Secondly, it will allow efficiently integrating a higher share of renewable energies and excess heat into district heating networks in order to gradually decarbonize them in the future. Lund et al. [
4] state that for a fourth generation district heating network (4GDH), supply temperatures are lowered below 70 °C. Therefore, on the building side, the authors recommend not to exceed flow temperatures of 50 °C. Thirdly, in the case of an alternative heat supply by a heat pump, efficient operation can only be achieved by lowering the temperature in the heating system [
5].
Temperature reduction in buildings can mainly be achieved by reducing the heating load, improving the heat transfer coefficient of the heat transfer system, by the improvement of the heating control, or by increasing the size of the heating transfer systems [
6]. Temperature reduction by reducing the heating load as a result of renovation measures is studied by Brand and Svendsen [
5] and Wang et al. [
7], respectively, using Scandinavian single-family houses from the 1960s and 1970s, while Harrestrup and Svendsen [
8] studied this using multi-storey residential buildings from the turn of the century (1900). Although the renovation of the building envelope enables a particularly high TR by reducing the heating loads, it is also associated with high costs. In contrast, Schmidt et al. evaluate low-investment measures to improve the controllability of the heating system. With the installation of string-balanced valves and pre-set radiator valves, including a hydraulic balancing [
9], the heating curve can be optimized. Temperature reduction by improving heat transfer can be achieved, for example, by forced convection with a fan radiator, and has also been studied extensively in the past [
7,
10,
11]. To a limited extent, TR can also be realized by increasing the mass flow rate [
5].
In this work, the TR is instead achieved by increasing the size of the heating surfaces. In a case study of four Danish single-family houses from the 1930s, Østergaard demonstrates that by replacing undersized radiators with enlarged models the supply temperature can be lowered to 50 °C [
12]. In addition, Brand and Svendsen replaced the existing radiators with larger low temperature radiators in an otherwise unrenovated 1970s Danish single-family home and calculated a reduction in the heating curve from 78 °C to 67.3°C [
5]. Few studies deal with the integration of surface heating systems, such as floor, wall, or ceiling heating systems into existing buildings. In a parameter study for a generic test room, Ploskić demonstrates a particularly high TR-potential of underfloor heating compared to alternative radiator heating systems [
13]. Hasan et al. also investigated the installation of underfloor heating in three apartments of a residential multi-storey building built in 2003 in Helsinki, Finland and calculated a reduction of the supply temperature from 70 °C to 40 °C compared to the original radiator system [
14]. Nagy et al. developed a simulation model with which the TR-potential can be estimated by varying the parameters of building envelope quality and heating surface size. Subsequently, they apply the simulation model to a real, historic residential building in Zurich, Switzerland for further numerical studies. The results demonstrate that the building could be heated with a supply temperature of 45 °C by installing underfloor heating, even with an unrenovated building envelope. The authors conclude that this is an interesting renovation strategy, particularly for listed buildings where there are restrictions on retrofitting façade insulation [
15]. Oravec et al. and Bojić et al. used dynamic simulations to compare different surface heating systems for floors, walls and ceilings and also evaluated them in terms of their suitability for building renovation. Even if the thermal output of ceiling heating systems is lower in comparison, Oravec et al. recommend ceiling heating panels as the most suitable renovation option due to their controllability and lower obstacles for installation [
16,
17].
The term TR is not universally defined and often refers to the return temperature, especially when improving the efficiency of district heating systems [
18,
19,
20,
21]. However, this work focusses on the reduction of the supply temperature and the logarithmic temperature difference.
Studies on the TR-potential often focus on detailed comparisons of surface heating systems and on the evaluation of indoor thermal comfort. For the retrofit integration of surface heating systems in existing office buildings, the ceiling area is often the only available surface reservoir. However, especially for ceiling heating systems, the performance is limited by the compliance with normative thermal comfort limits [
22,
23,
24]. Critical aspects are the vertical air temperature difference between floor and ceiling or the radiation temperature asymmetry, as a measure for the differences in the local distribution of the radiant heat output [
25,
26].
With regard to the vertical air temperature difference, studies on different ceiling heating systems demonstrated an almost linear distribution of the air temperatures over the room height, even with different heating capacities [
26,
27,
28]. Makulla emphasizes the influence of room ventilation on the vertical air temperature gradient. Under the restriction that a temperature increase of 2 K/m is not exceeded, he determines a maximum heating capacity of 50 W/m
2 for a 2.5 m high, unventilated room heated by suspended heating panels (SHP). It can be increased to 100 W/m
2 with turbulent mixed ventilation [
26].
The normative limits for the radiation temperature asymmetry in ISO 7730 [
22] are based on Fanger’s studies from the 1980s [
29]. More recent climatic chamber studies question the general applicability of Fanger’s limits when ceiling heating systems are used and show inconsistent thermal sensation of subjects at asymmetric radiant temperatures [
30,
31]. The standard way of demonstrating radiation temperature asymmetry (
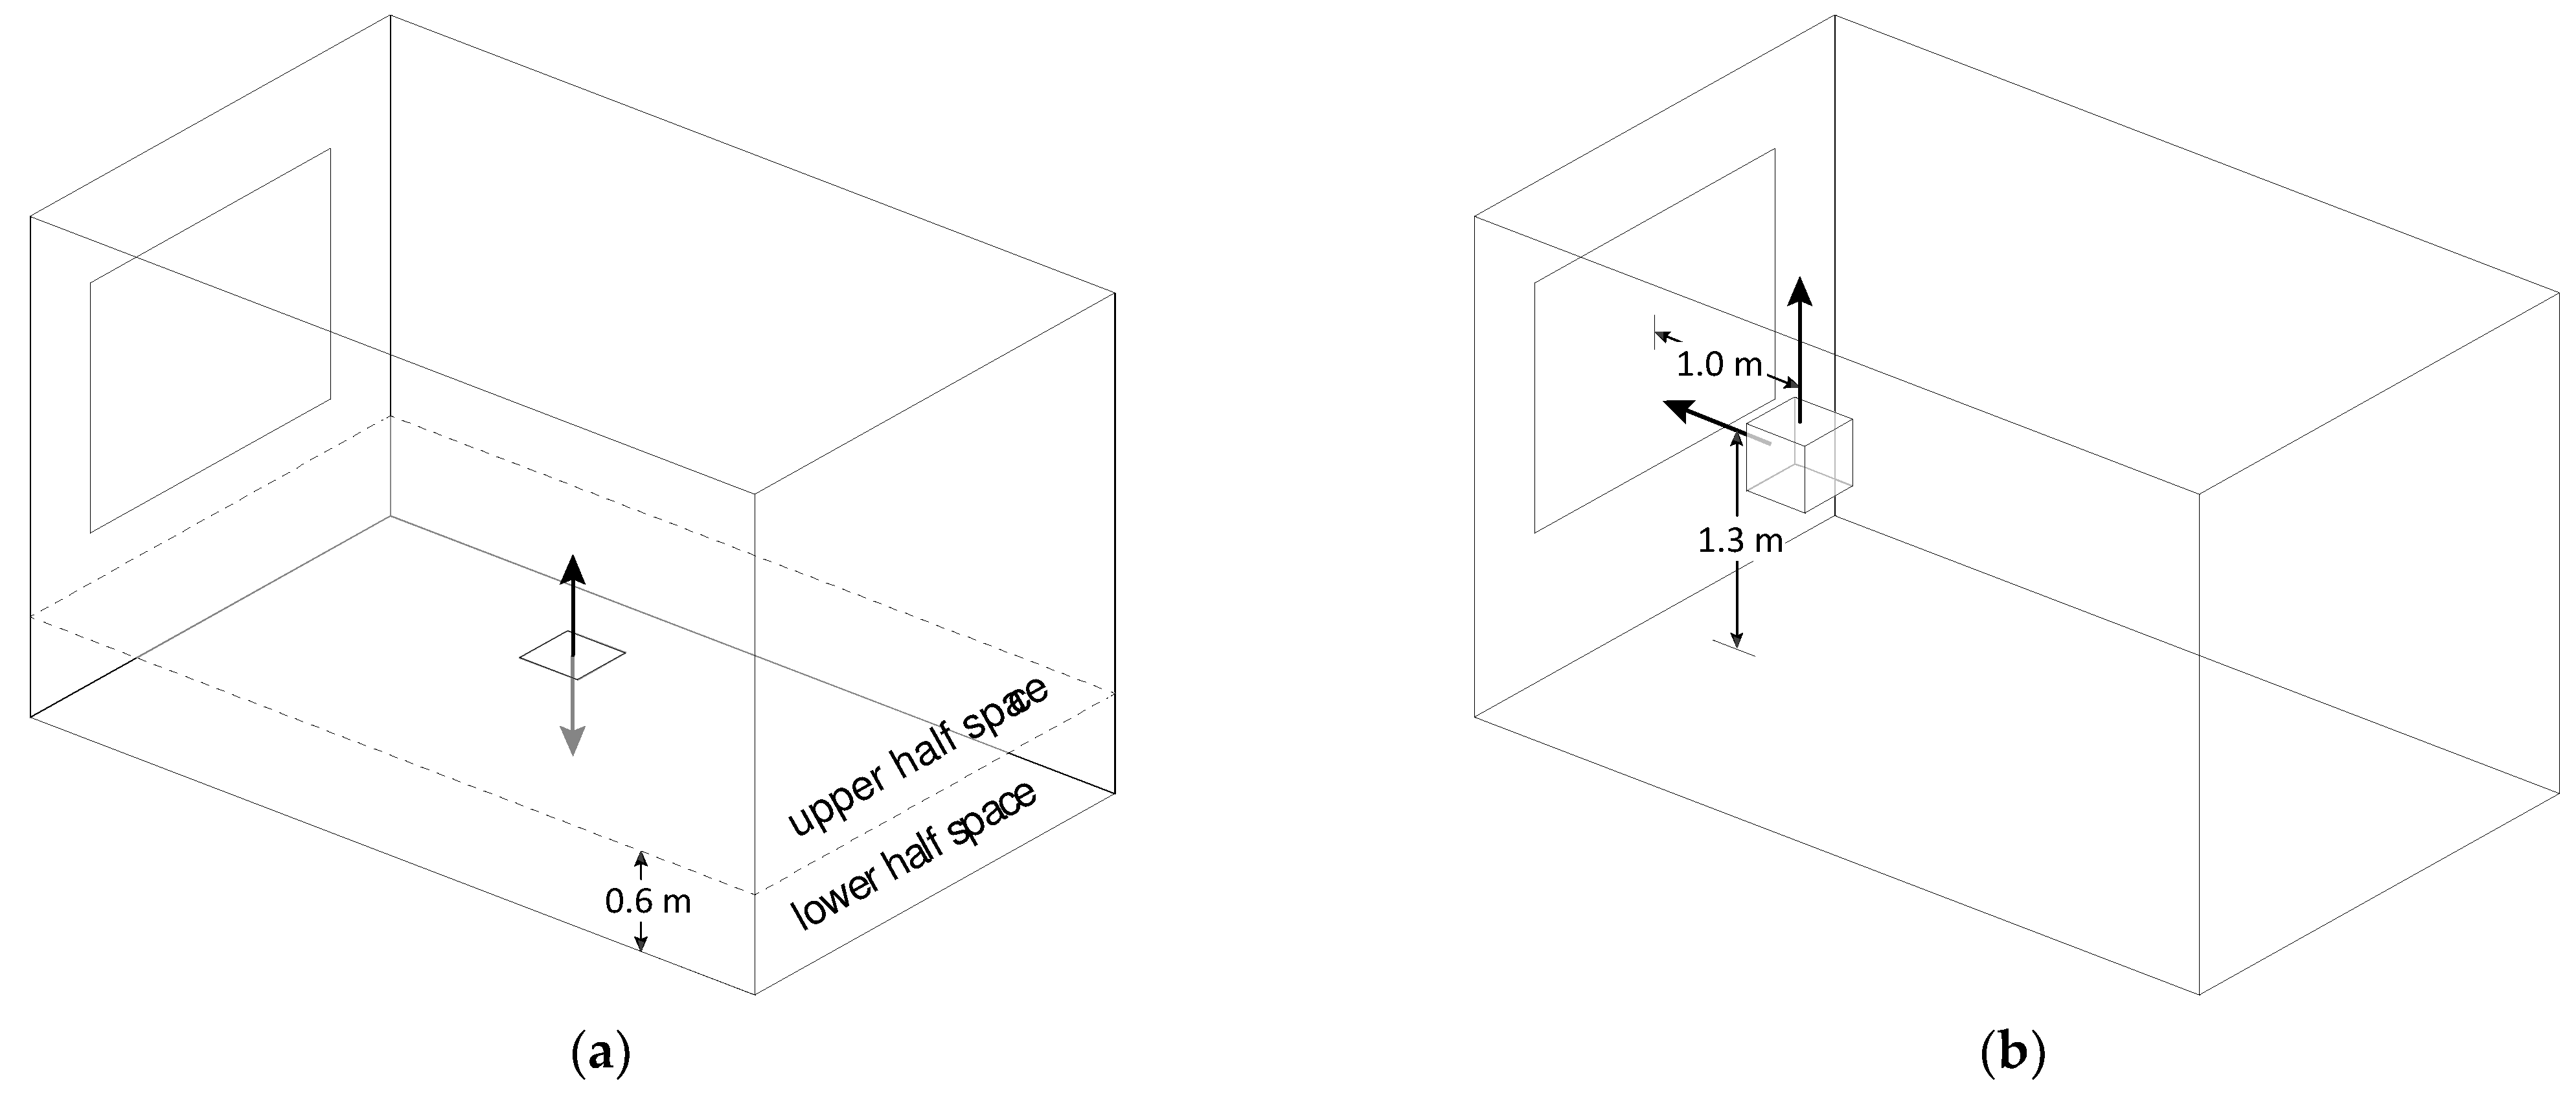
) is to use the “half-space method” [
22] by calculating the difference between the mean radiation temperatures of an upper and lower half-space of the room on a point at the centre of the body (0.6 m above floor level) [
25]. Glück criticizes this approach and evaluates the radiation asymmetry at head height (1.3 m) using a cube element by calculating radiation temperatures for each cube surface and then forming the difference of minimum value and maximum value [
32,
33]. The visualization of the calculation methods can be seen in
Figure A1.
The controllability of heating systems is a relevant field of research, since especially structurally integrated heating systems react to parameter changes with a time delay and therefore tend to have a “transient behaviour”. Oravec et al. show in a comparative study that the response behaviour is influenced by the materials and sequence of the material layers in which plastered heating meanders (PHM) is integrated [
16]. A characterisation is often performed by responses to sudden changes in the settings [
34,
35]. As an evaluation indicator, either the time required for a heat transfer system to reach a certain set point is determined [
36], or time constants for heating or cooling processes are calculated [
37].
Low-temperature heat transfer systems in well-insulated new buildings (e.g., nearly zero-energy buildings) are state of the art and the majority of scientific papers also focus on their use in new buildings. The literature research showed that fewer studies deal with the TR of heating systems in older building stock. Furthermore, hardly any work could be found that addressed the installation of ceiling heating systems in unrenovated existing buildings. If at all, only underfloor heating systems were investigated numerically using simulation models. The authors are not aware of any demonstrators that experimentally and numerically investigate the performance of low-temperature ceiling heating systems in unrenovated buildings. The comprehensive analysis by Ovchinnikov et al. and Wahi et al. on the state of research regarding completed work on low-temperature heating systems also confirms this finding [
38,
39].
Realized projects with the use of low-temperature heat transfer systems in unrenovated buildings are also rare because there is often a fear of insufficient thermal comfort. There is a lack of holistic system comparisons of surface heating systems by which their suitability in existing buildings and their potential for temperature reduction can be assessed.
1.1. Objective
This work is intended to fill this gap by quantifying the temperature reduction (TR) potential of two ceiling heat transfer systems, which have been realized in the architecture building of the Technical University of Darmstadt, Germany while taking thermal comfort requirements into account. For this purpose, suspended heating panels (SHP) and plastered heating meanders (PHM) have been numerically and experimentally investigated.
The novelty presented in this research is the proof that even in buildings where the renovation of the building envelope is only possible to a limited extent (e.g., listed buildings), there is a high TR-potential through the integration of ceiling heating systems while thermal comfort requirements are met. The findings give stakeholders in building planning technical and practical support to estimate the achievable TR in existing buildings.
1.2. Case Study
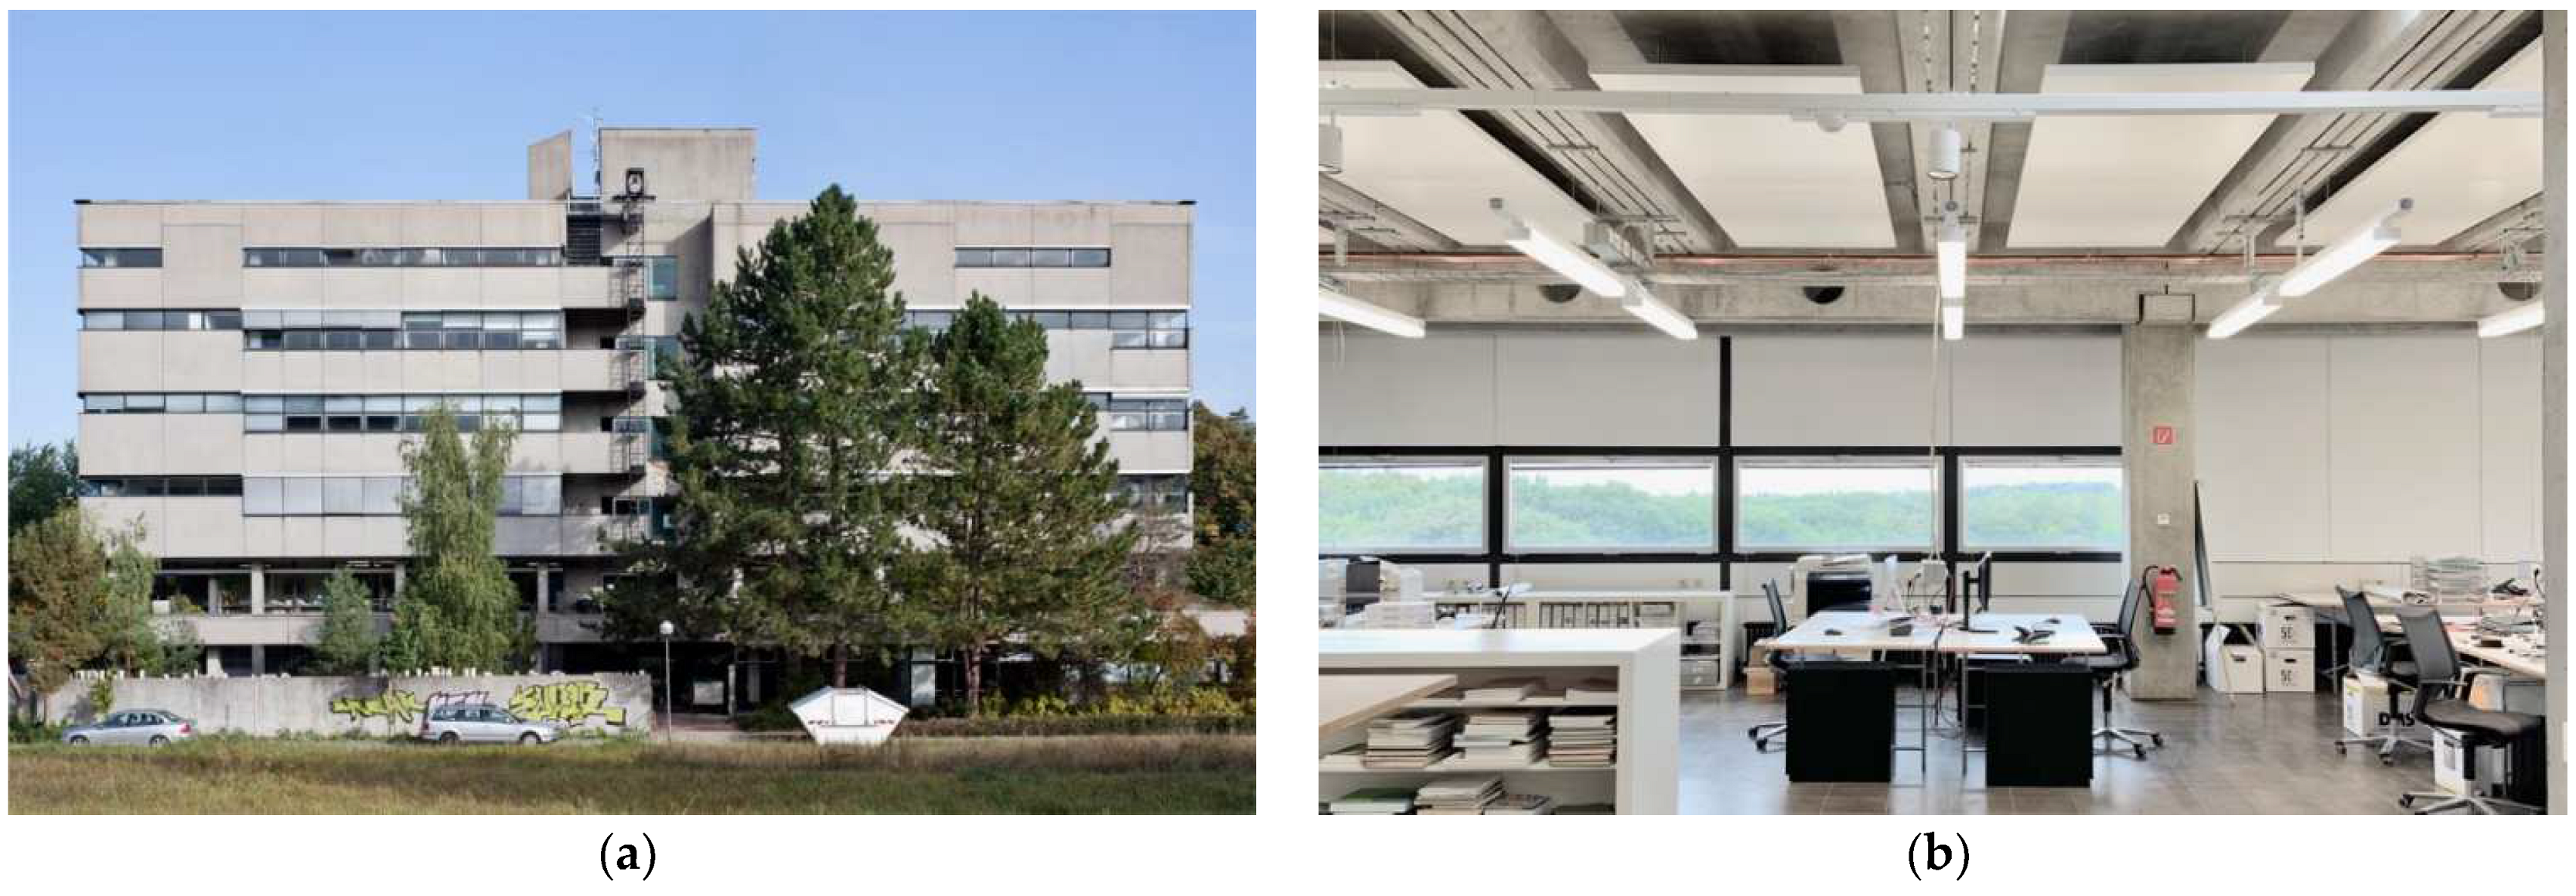
The architecture building was built in 1967 on Campus Lichtwiese as a part of the Technical University of Darmstadt (
Figure 1a). It is a listed building of post-war modernism and was chosen as the object of study because it has a high transferability potential with two other nearly identical buildings on campus. The averaged and weather-adjusted heat consumption of approximately 2.5 GWh per year is comparatively high, so that renovation measures have a great leverage for GHG savings. For reasons of heritage protection, the application of exterior thermal insulation is not desired. An innovative renovation concept must therefore reconcile GHG reduction targets with conservation restrictions.
The architecture building houses teaching and research on six full storeys which consist of a heavy reinforced concrete skeleton construction. With its largely uninsulated concrete façade and single-glazed windows, the building envelope has a very low energetic quality. It is connected to the campus’ own district heating network. Heat is transferred to the rooms via radiators. Hot water is supplied decentrally and directly electrically.
2. Methods, Key Indicators and Measurement Concept
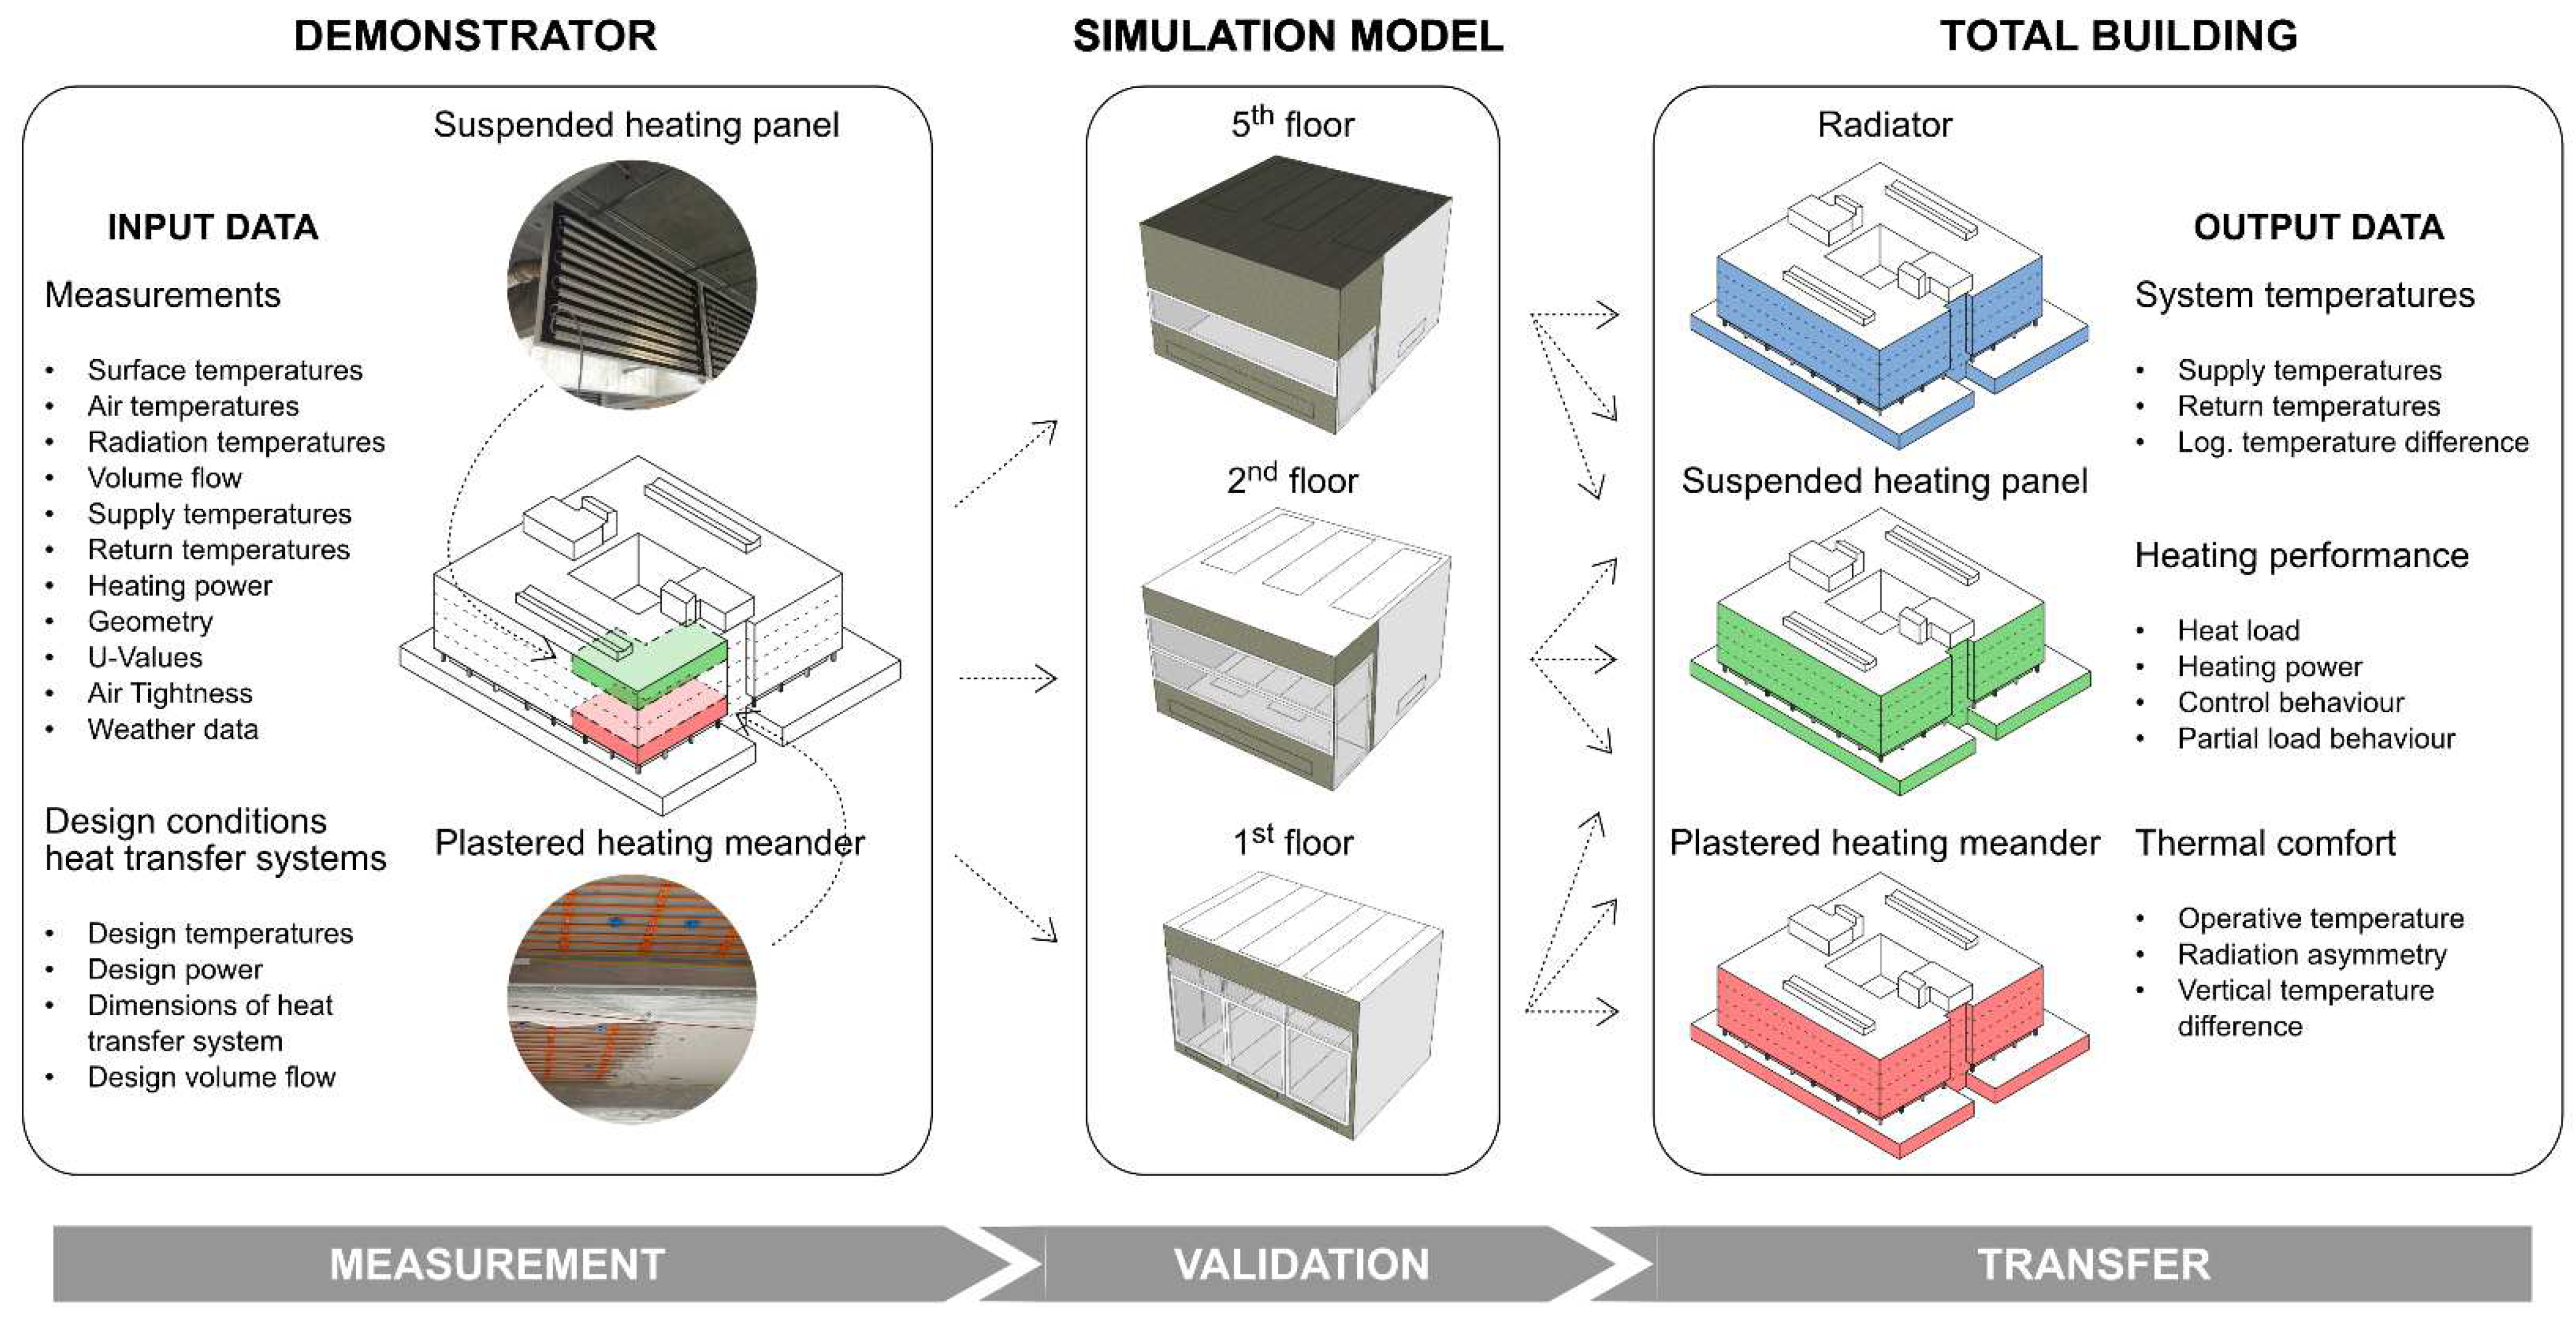
This study is conducted as part of the project “EnEff: Stadt Campus Lichtwiese II”, in which measures for the improvement of the overall energy system of Campus Lichtwiese are analysed and implemented. In the demonstrator, a suspended heating panel (SHP) system was implemented on the top floor (5th floor) and a plastered heating meander (PHM) attached to the underside of the ceiling in a standard floor (2nd floor) (
Figure 2).
Within the scope of the research project, the ceiling heating systems could only be installed in two small building areas. In order to find out whether the respective system could also be implemented in other building areas, the following research design is developed.
The starting point is a comprehensive monitoring of the newly installed ceiling heating systems and the existing radiator system, which has already collected data from two heating periods. Three meeting rooms of approximately 30 m
2 on the 1st, 2nd and 5th floor on the north side were identified as critical rooms. They have the highest specific heating loads due to their orientation and their window area ratio. These rooms are modelled in the simulation environment IDA ICE 4.8 and validated using measured data (
Section 3.2).
Subsequently, a statement can be made about the TR-potential of the entire building. In addition, the model is used to conduct different parameter studies (
Section 3.3). Based on these findings, a set of tools applicable for planners is developed (
Section 3.4).
2.1. Key Indicators and Restrictions
In order to evaluate the temperature reduction potential and assess its feasibility in terms of thermal comfort, the following key indicators and limit values are defined.
The systems are designed based on a simulative calculation of the heating load at a static outdoor temperature of −10 °C. According to DIN EN 12831 [
40], the calculation is performed without applying internal heat loads or solar gains. Compared to the normative heating load which corresponds to the heating demand by balancing transmission and ventilation heat losses, the required heating power can vary slightly depending on the heat transfer system. Since the type of heat transfer varies between the heat transfer systems, the operative room temperature, which is composed of air and radiant temperatures, is achieved with different heating powers.
The overall objective is to determine the TR-potential. This is evaluated using the temperature reduction index (TRI) according to (1). This dimensionless key indicator is defined as the quotient of the average logarithmic excess temperatures between a reference scenario (status quo) and a scenario with used TR [
41]:
where TRI is the temperature reduction index;
is the averaged logarithmic temperature difference of the scenario with TR, K;
is the averaged logarithmic temperature difference of the reference scenario, K.
The logarithmic temperature difference is defined as the difference between the average water temperature and the room air temperature and is calculated according to (2). It is a clearly defined parameter for the design of a heat transfer system. An evaluation based on the supply temperature would be less meaningful, as it is strongly dependent on the operating mode of the heat transfer system. With different spreads between supply and return temperature, it can vary despite the same heating load:
where
is the logarithmic temperature difference, K;
is the supply temperature, °C;
is the return temperature, °C;
is the air temperature, °C.
The control behaviour of heat transfer systems is particularly relevant for structurally integrated heat transfer systems, as they can only react to setpoint changes with great delay due to the high system inertia. In addition to setpoint undershoots, thermal comfort can be negatively affected by “overshoot behaviour” during rapid load changes. The investigation is conducted at an outside temperature of −10 °C for a typical night setback scenario with the aid of step responses as a result of an abrupt change in the setpoint for the operative room temperature. The control behaviour is evaluated using time constants for heating-up and cooling-down processes. During the time-of-use, the operative start temperature should be 21 °C (
and during setback operation 19 °C (
. A time constant corresponds to the duration until 63.2% (1.26 K) of the temperature difference (2 K) between the temperature setpoint during daytime and the setpoint of the night setback is reached. For cooling-down operations,
according to (3) is 19.74 °C, while ϑ
e,heat for heating-up operations corresponds to 20.26 °C.
where
is the critical temperature after reducing by 63.2% of the night setback, K;
is the critical temperature after heating by 63.2% of the night setback, °C;
is the lower temperature during night setback, °C;
is the higher temperature during daytime operation, °C.
Thermal comfort requirements define minimum heating powers, but at the same time they also limit their performance. The system is designed for an operative room temperature set point of 21 °C. It is calculated as the arithmetic mean between the average air temperature and the area-weighted radiation temperature of the surrounding surfaces. The measuring point is located at a distance of 1 m from the façade and at 0.6 m room height (
Figure A1b).
When integrating ceiling heating systems in existing buildings with an unrenovated building envelope, large differences of radiant heat between the warm ceiling and the cold façade can occur, which is why the radiation temperature asymmetry
is a particularly relevant parameter. It is verified as standard using the “half-space method” (ISO 7730) [
22] by calculating the difference between the mean radiation temperatures received on two opposite sides of an ideal surface element at a height of 0.6 m in the centre of the room. For this purpose, the room is divided into an upper and lower half-space and the mean radiant temperature is calculated using the surface temperatures of the room enclosure surfaces with their respective visibility factors (4) [
25]:
where
is the radiation asymmetry according to the half-space method, K;
is the averaged radiation temperature of the upper half-space, °C;
is the averaged radiation temperature of the lower half-space, °C;
is the radiation asymmetry according to ceiling-façade calculation, K;
is the radiation temperature of the ceiling area, °C;
is the radiation temperature of the façade, °C.
In addition to this, an alternative method of calculating
according to Sauerwein is used [
41]. Here, the measuring point is raised to 1.3 m, since it is assumed for the “heat from above” constellation that the head is the most exposed and sensitive area, not the centre of the body. On the other hand, a horizontal distance of 1 m to the façade is chosen, as a workplace located here represents the most critical case. The calculation of the ΔT
R,CF is performed according to (5) as the difference between the mean radiant temperatures of the ceiling area
and the façade area
. For both verification methods, a limit value of 5 K according to DIN EN 16798-1 [
23] category II should not be exceeded.
Figure A1 illustrates the different assessment methods graphically.
Excessive temperature differences between the head and ankles also have a negative effect on thermal comfort. In the norm, the examination of this phenomenon is conducted via the vertical air temperature difference between 0.1 m and 1.1 m above the floor. The limit value of 2 K/m is based on DIN EN 16798-1 category II. In this survey, the upper measurement is taken at 1.3 m, therefore the results are on the safe side.
2.2. Heating System Concept
The heat distribution from the district heating in the basement to the areas under investigation is not taken into account. The distribution losses therefore are only considered between decentralized heat exchangers and the rooms under investigation. The two different low-temperature heat transfer systems can be operated both in monovalent and bivalent mode with the existing radiators.
The steel pipe radiators (RAD) are located in all rooms and are currently fed with a maximum supply temperature () of 85 °C. The system operates with a spread between supply and return of approximately 20 K. For the demonstrator, the heating circuits of the radiators were also decoupled from the district heating using heat exchangers, so that the flow rate and supply temperature can be individually adjusted.
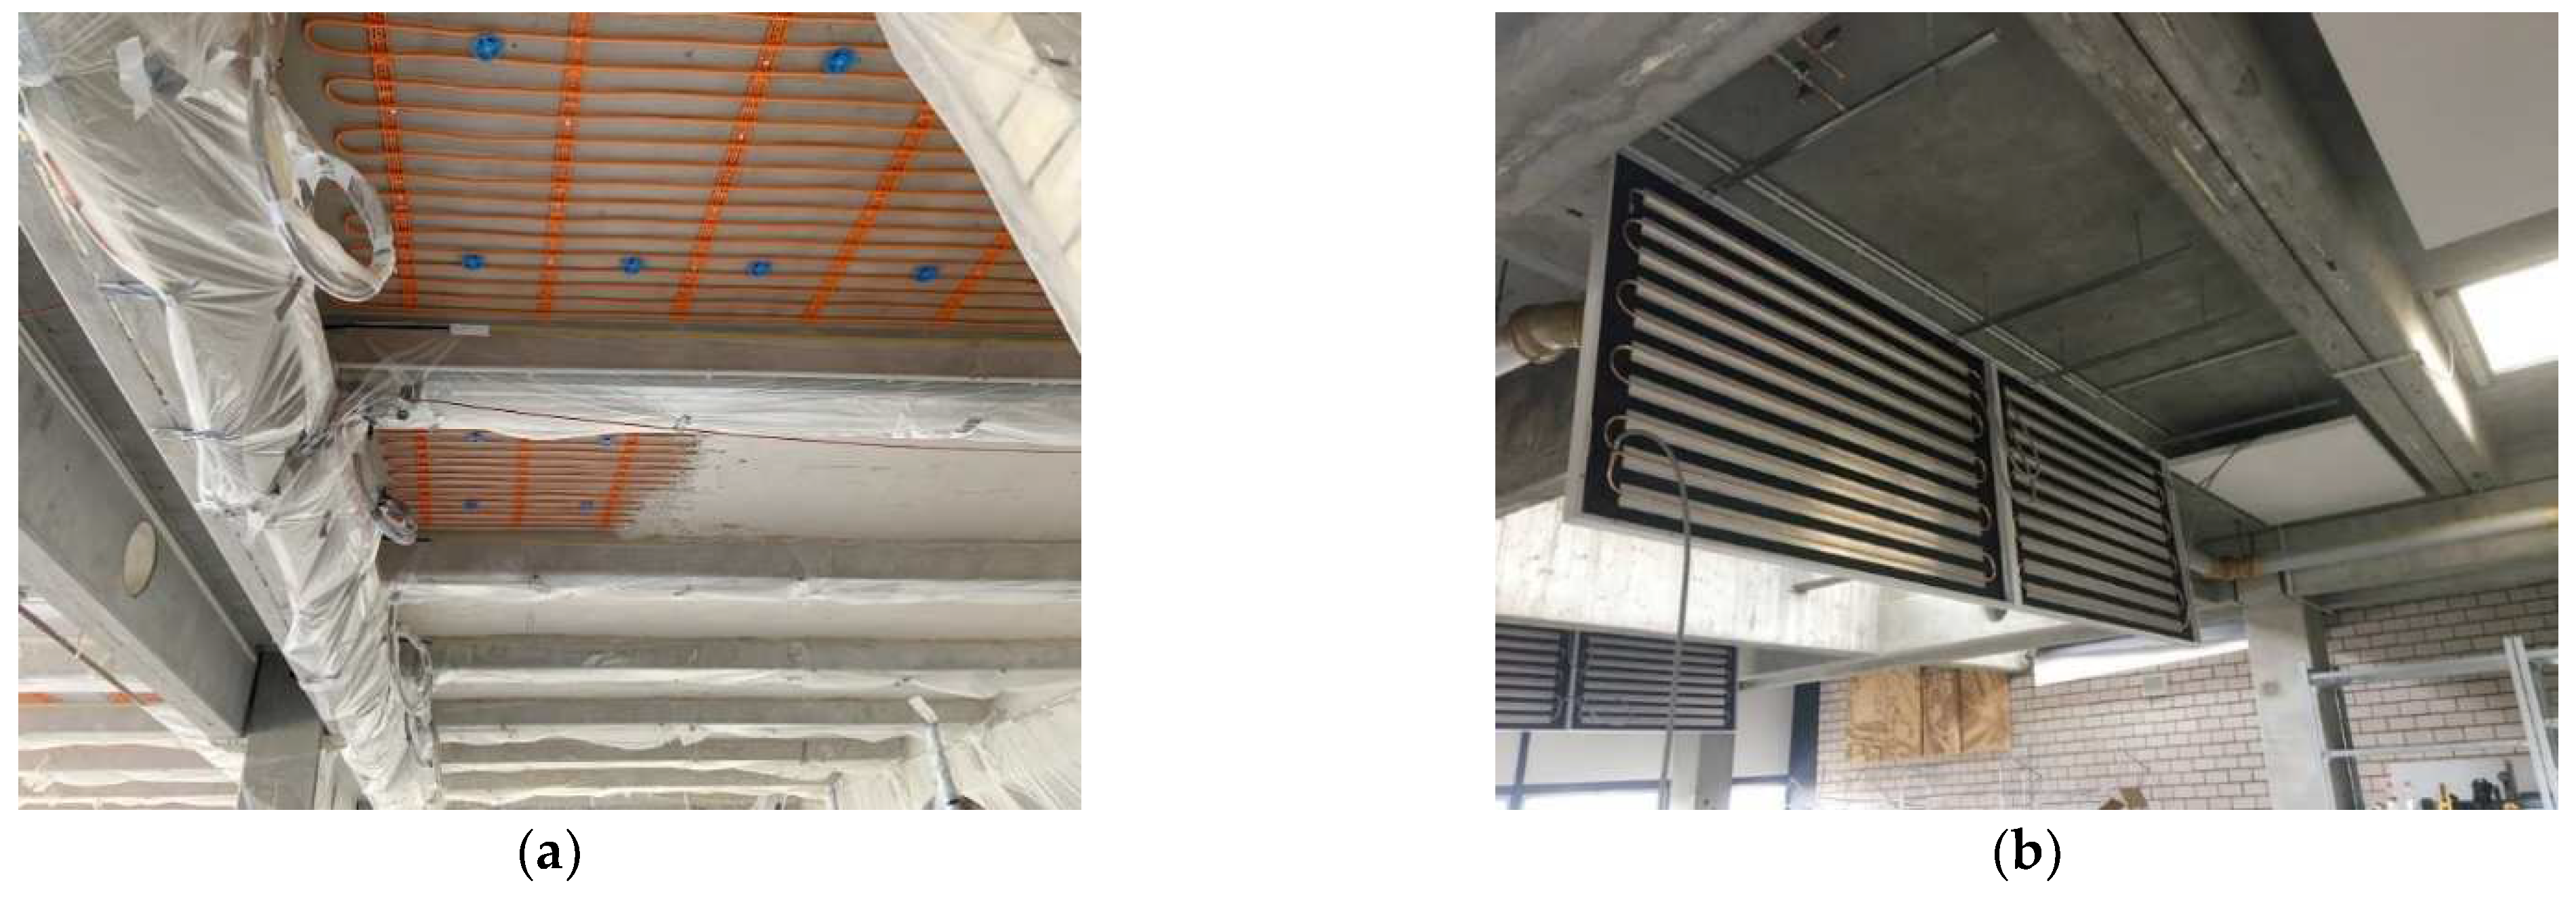
On the 2nd floor (standard floor), a plastered heating meander (PHM) was implemented in form of heating pipes in a plaster layer on the underside of the ceiling (
Figure 3a). A product from the manufacturer “Variotherm Heizsysteme GmbH” was used, which, according to the manufacturer, has a standard heating capacity of 86 W/m
2 at a logarithmic temperature difference
of 15 K. In total, the implemented heating surface is 112.7 m
2 with a ceiling occupancy percentage of 36.5%. The supply temperatures must not exceed 45 °C, otherwise the load-bearing capacity of the ceiling plaster could be impaired. An aluminium multilayer composite pipe was installed with an inner diameter of 8.6 mm and a pipe spacing of 77 mm. The ceiling plaster is a 4 cm thick layer of gypsum plaster with a dry bulk density of 1.250 kg/m
3. The pipe cover is approximately 2.5 cm. The heat transfer to the room is mainly radiation-based.
On the top floor (5th floor), suspended heating panels (SHP) from the manufacturer “Schmid GmbH” were installed (
Figure 3b). The manufacturer specifies a standard heating capacity of 154 W/m
2 at a
of 15 K. The copper pipes with an internal diameter of 11 mm have a spacing of 10 cm. The supply temperatures should not exceed 45 °C because at higher temperatures the adhesive bond between the pipe and the heat conducting plate loosens. As it is a free-hanging heat transfer system in the room, it has a higher convective share of the heat output compared to the PHM. All heat transfer systems are controlled via proportional integral controllers. The design of the ceiling heating systems in the architecture building aimed to maximize temperature reduction. Therefore, the highest possible ceiling occupancy percentage and a small spread of 5 K between supply and return were chosen.
2.3. Measurement Concept
During all measurements within the northward facing rooms the blinds were closed, thus eliminating most indirect radiation and corresponding solar gains. Static monitoring records supply and return temperatures and volume flows at all relevant points. In addition, variables such as pump or valve settings are measured. The thermal comfort is assessed using a mobile measurement infrastructure.
Figure 4 shows the position and type of sensors used.
The operational room temperature is determined by measuring the air temperature with PT100 sensors and the radiation temperature with a globe thermometer.
The vertical air temperature difference is measured in the centre of the room using PT100 sensors at heights of 0.1 m, 1.3 m and 2.8 m above the floor. Air temperature measurements are conducted at different power outputs of the heat transfer systems. These occur due to different outdoor temperatures or depending on the different room temperature setpoints. Monovalent operation (without radiators) was always selected when observing the influence of the surface heating system in isolation. The measurement results are only determined for steady-state conditions since during strong changes in performance the air temperature differences are also subject to high dynamics.
To determine the radiation temperature asymmetry , directional radiation temperatures must be measured. For this purpose, surface temperatures of all relevant interior room surfaces were measured with thermocouples. Taking visibility factors into account, it was then possible to determine directional radiation temperatures and finally the by calculation.
3. Results
In the following, the experiences from the realisation of the demonstrator are described. Subsequently, the validation of the simulation models with regard to performance and comfort is conducted. Based on this, the results of a parameter study are presented. Finally, a planning tool for estimating the temperature reduction potential is developed.
3.1. Building Process
In the construction process, the SHP could be implemented significantly faster due to its high degree of prefabrication. Within two weeks, all panels and the heat distribution network were installed for a net floor area of approximately 300 m
2. In contrast, the installation of the PHM was much more labour-intensive and time-consuming due to the manual attachment of the plastered heating meander to the concrete ceiling and the multi-layered plastering work. In addition, drying times of several weeks had to be waited for before commissioning. Furthermore, filling with water and venting the heat transfer system was more difficult in the PHM, as the fittings are located lower than the heat transfer system [
41].
3.2. Modelling and Validation
Thermodynamic simulations in existing buildings require a validated simulation model based on measurements of the initial situation. The climate data set is based on measurement data from a local weather station. Air temperature stratifications or air flows within the room cannot be precisely validated, since IDA ICE 4.8 calculates convective heat transport processes with a simplified node model.
3.2.1. Building Structure and Envelope
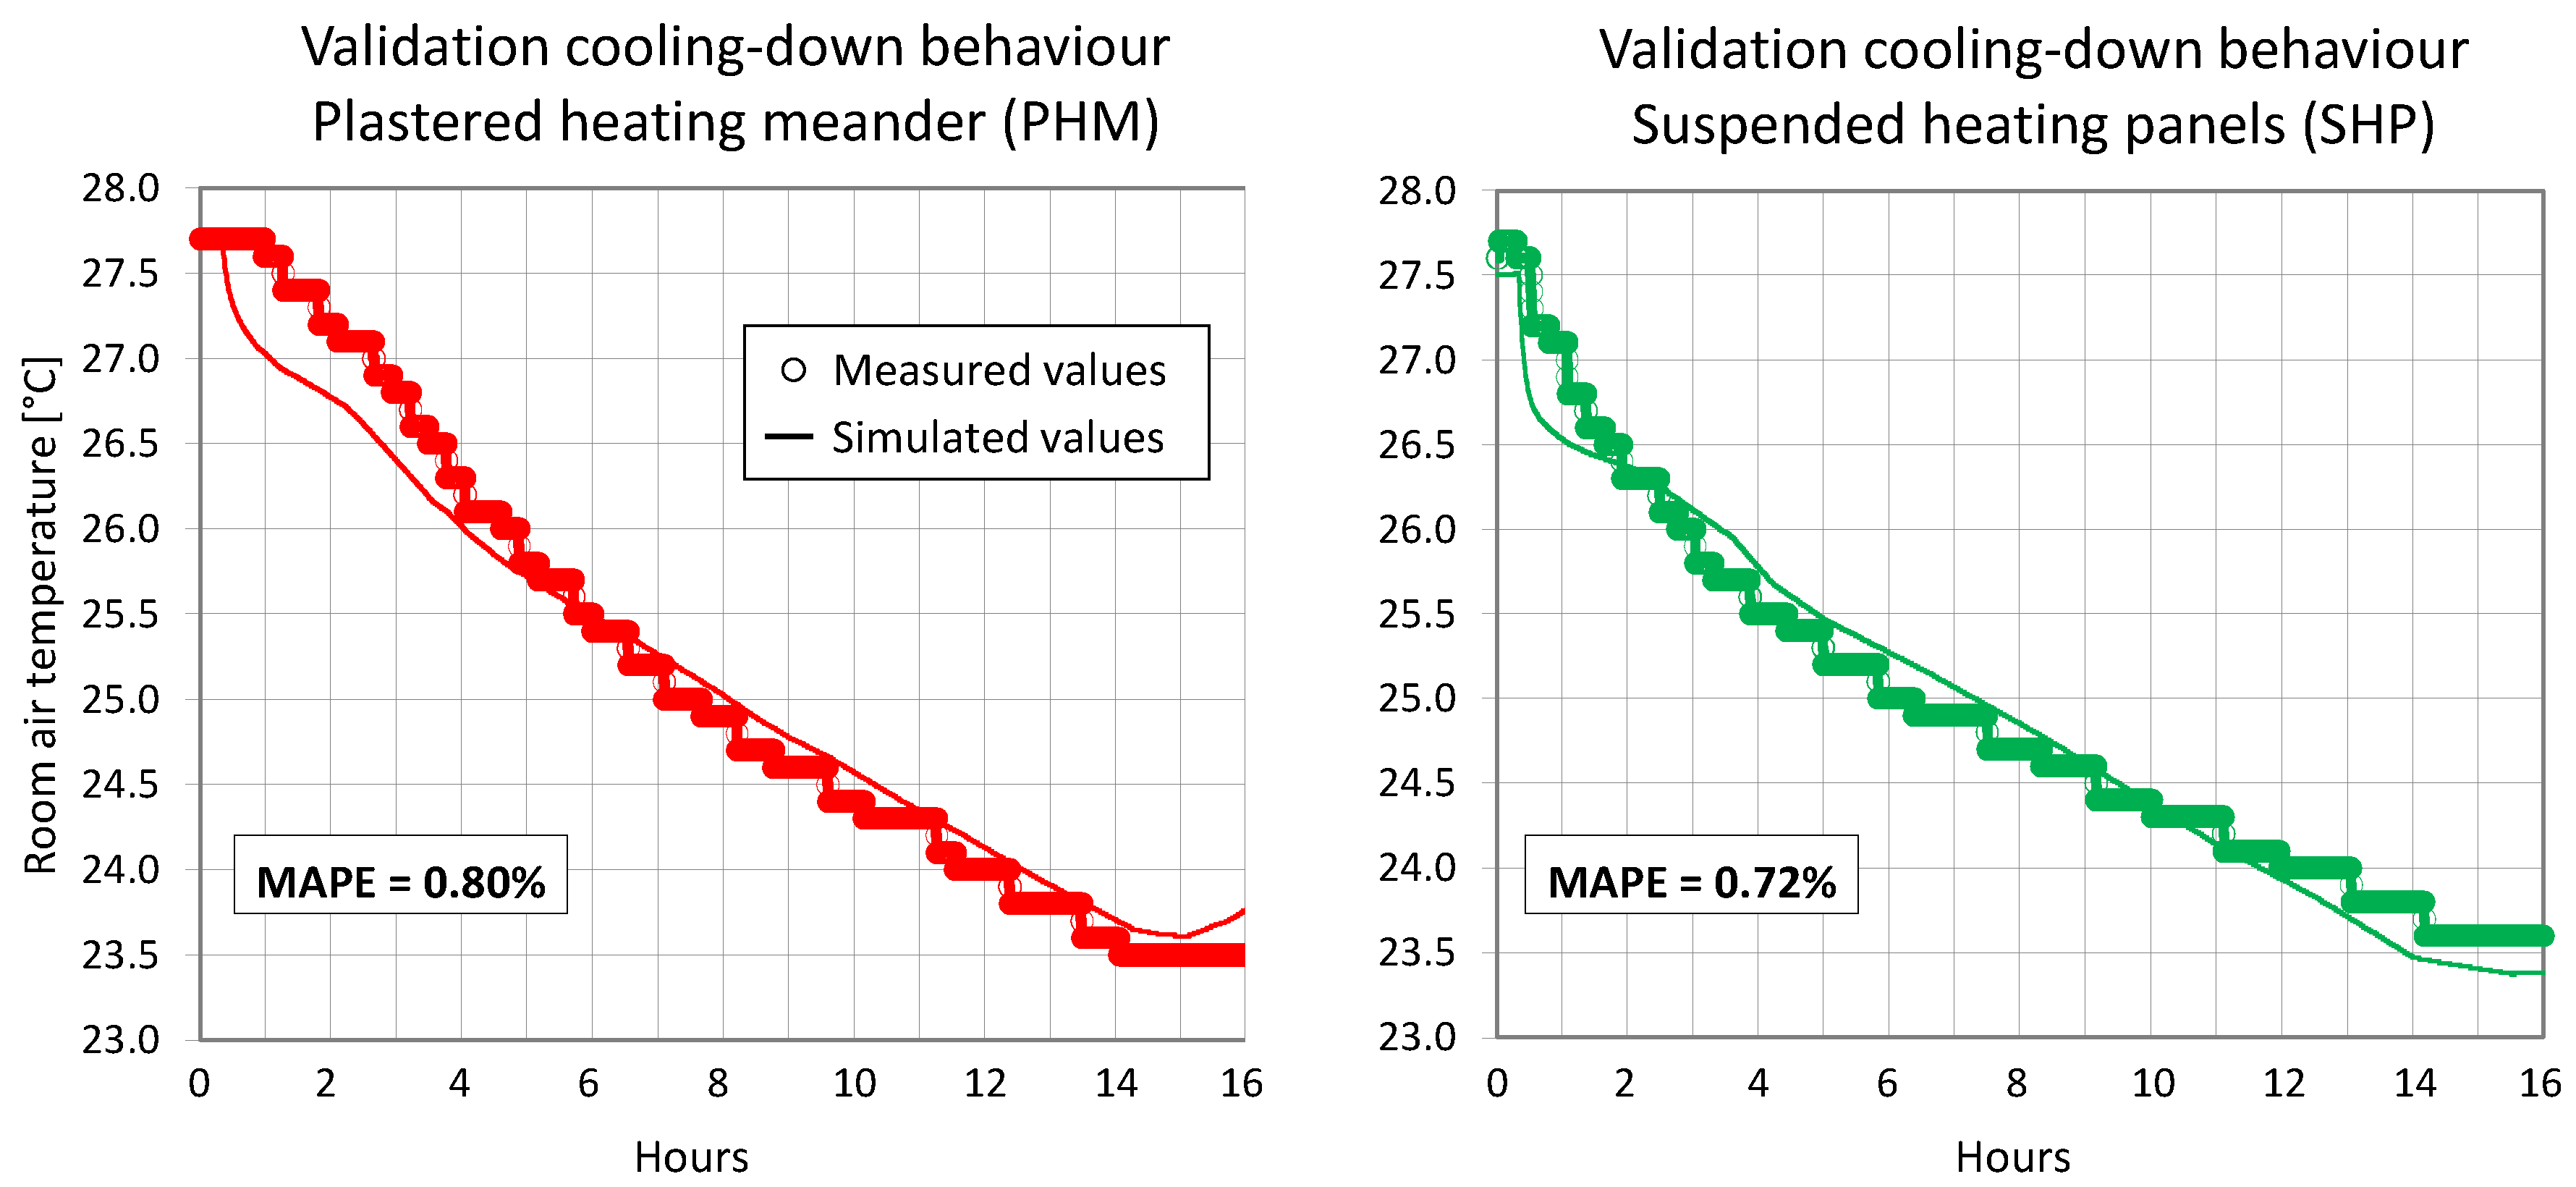
For the validation of the building structure and envelope parameters, surface temperatures are measured simultaneously on the interior and exterior surfaces. On the one hand, the model is validated by adjusting the thermal conductivities. On the other hand, the dynamic behaviour is validated by step responses. Taking unavoidable deviations between model and reality into account (climate, heat transport processes from adjacent rooms), the deviations of <0.5 K and a Mean Absolute Percentage Error (MAPE) < 1% shown in
Figure A3 and
Table A1 are considered tolerable. The used boundary conditions can be found in
Table 1. The validation of the ceiling construction is described in detail in
Section 3.2.3.
3.2.2. Heat Distribution
On the one hand, the experimental determination of the heat distribution losses is important in order to be considered in the simulation model. On the other hand, knowledge of the temperature loss in the distribution system is needed to precisely set the desired supply temperature for the heat transfer system in the room. Since its control does not take place in the room itself, but at the central, upstream point via the heat exchanger, the temperature loss within the pipe network must be added to the setpoint. The distribution loss averages 8% of the supplied energy, which is equivalent to a temperature loss of 0.5 K for the surface heating systems.
3.2.3. Heat Transfer from the Heat Transfer System to the Room
The design output of heat transfer systems is usually specified for a fixed operating point and is based on measurements under laboratory conditions. The heat output on the water side was determined by measuring supply and return temperatures and volume flows. Based on the air temperature, the logarithmic temperature difference () can be calculated and a conversion of the power output to standard conditions at 9.83 K can be made. As a rule, the real output of the heat transfer systems deviates from the standard output due to the specific installation and connection situation.
The capacity of the existing radiators was initially determined using literature values [
25] and historical calculation documents from the construction period. This original design output (100 °C/60 °C/20 °C) was then adjusted to the current design operating point (85 °C/65 °C/20 °C). As a result, a good agreement of the standard normative heating capacity with the measured output of the heat transfer system could be determined, if an output reduction for installation and connection type of 10% to 15% is taken into account.
The standard output of the suspended heating panel (SHP) is related to one square metre of active surface (DIN EN 14240) [
42] and to a logarithmic temperature difference
of 15 K. In a test operation, good agreement with the manufacturer’s specifications was observed at an average of 158 W/m
2 at
15 K. Deviations are not unusual here either, as the manufacturer’s data is determined under standardized test conditions. Differences between the examined room and the normative test conditions exist, for example, in the heat flows through the surrounding components, the room geometry and in convection.
In contrast to the SHP, which is located as a free heating surface in the room, the experimental determination of the heat output to the room through the plastered heating meander (PHM) is more demanding, as it is a component-integrated heat transfer system. Here, the water-side power output is divided into a heat flow downwards (into the zone) and a heat loss flow upwards into the floor above. Depending on the ceiling construction, the proportions of both heat flows can vary significantly. In the simulation, it is assumed that the installation situation corresponds to a standard storey with the same heat transfer system in the storey above and below. The heat loss flow upwards thus approximately equals the heat input through the floor from the storey below.
The installation situation of the PHM in the demonstrator deviates from this. Here, the PHM is only installed in a single storey, so that the heat input via the floor is missing. For the validation, it is therefore necessary to first determine the downward heat flux from the PHM before the actual heat output of the PHM to the room can be calculated by multiplying the heat output on the water side with the percentage of the heat flux which is directed to the room side. The manufacturer specifies the heat output for the PHM at 86 W/m2 at at 15 K, a plaster overlap of 1 cm below the centre of the pipe and a pipe spacing of 77 mm. In the performance data, it is generally assumed that components that are adjacent to the outside air are designed with structural thermal insulation according to the current state of the art.
The measurements on the demonstrator showed an average heat output of 87 W/m2 at 15 K on the water side and confirmed a good correlation with the manufacturer’s specifications. It should be mentioned that the power reference of the PHM can be very volatile due to the high mass, which is why the measurements were taken in a “quasi-steady state” with approximately steady thermal conditions.
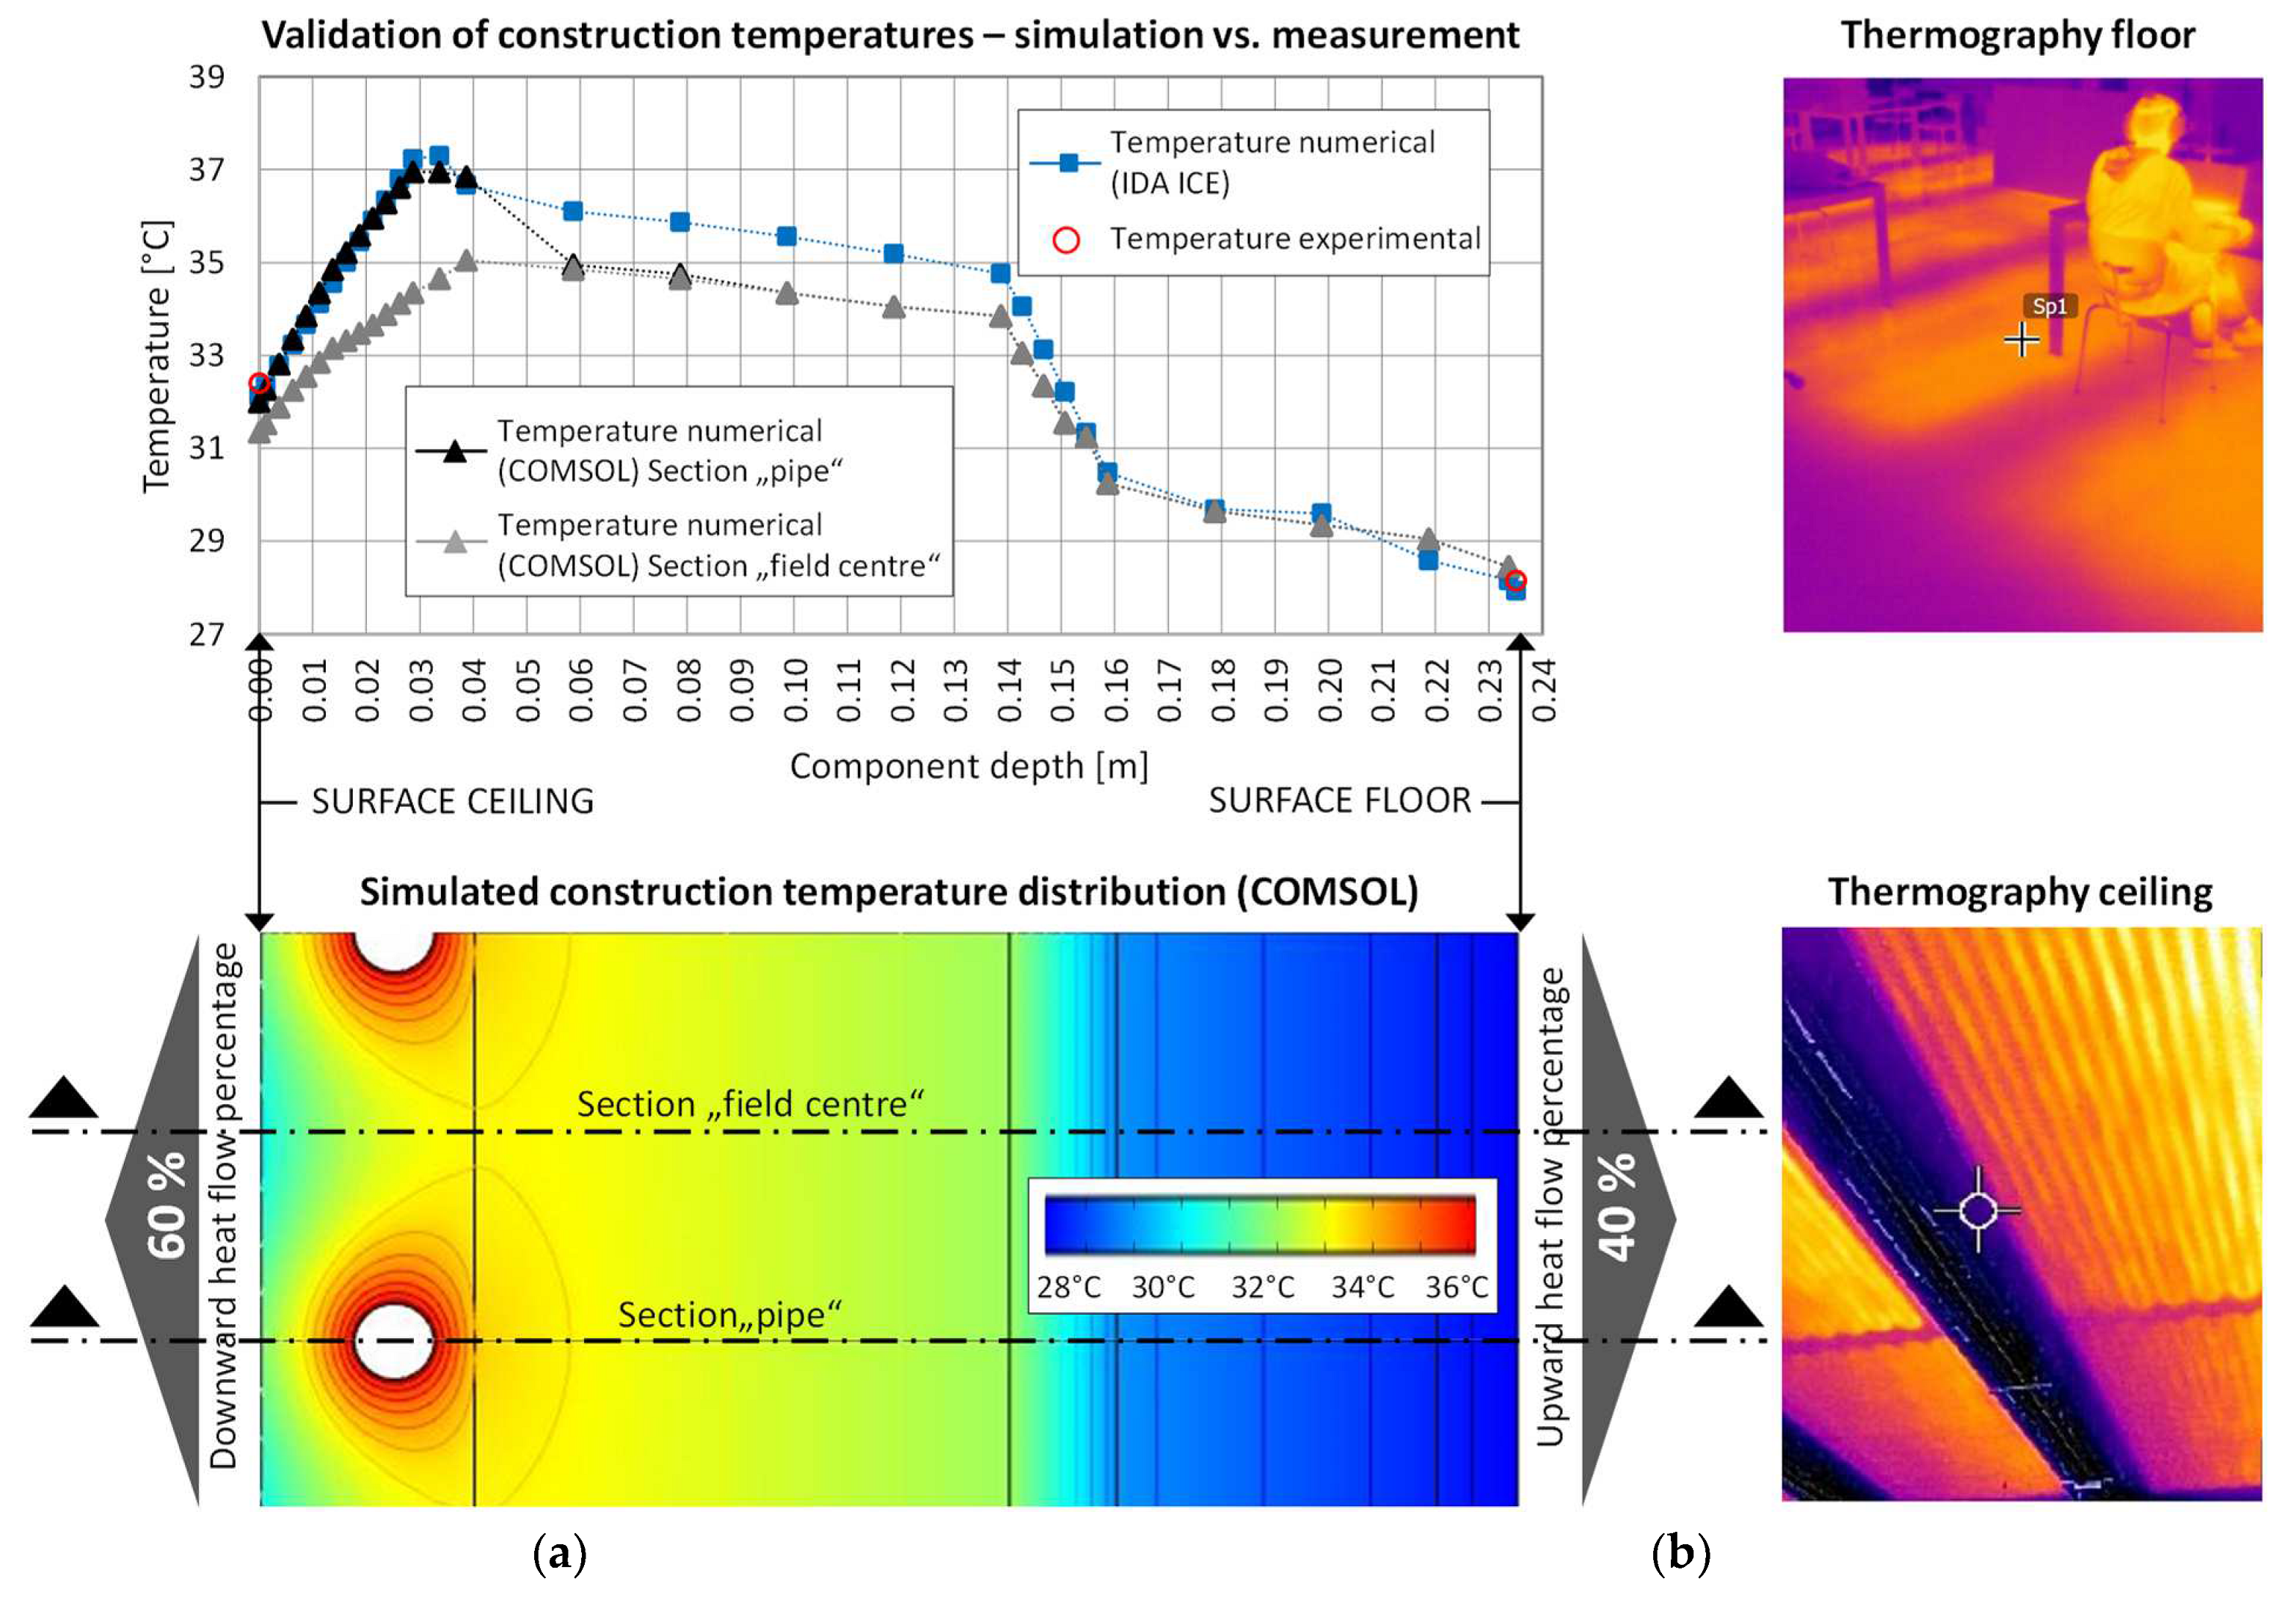
During heating operation with high supply temperatures, the surface temperatures on the floor above the PHM rose to over 30 °C. This is an indication of a high heat loss due to insufficient thermal insulation in the ceiling. The validation of the insulation was conducted simulatively with the software COMSOL Multiphysics, in which temperatures and heat flows in building components are calculated. In the model, the thicknesses of the individual material layers was determined on the basis of planning documents. Physical properties of the individual materials were initially assumed based on standard values. The model was then iteratively adjusted by parameter variations until the calculated surface temperatures matched the measured values. With the validated model, the temperature distribution and heat flows can now be mapped exactly (
Figure 5).
where
is the surface temperature of the floor (upper side), °C;
is the supply temperature of the plastered heating meander, °C.
To avoid too high floor temperatures, the supply temperature was limited. The surface temperature should not exceed 29 °C to ensure thermal comfort according to DIN EN 16798-1. EN 1264-3 requires a limit of 29 °C for floors with tile covering to prevent structural damage due to thermal expansion. As there are no expansion joints in the floor construction in the demonstrator, it was decided to reduce the limit value to 27 °C.
As a result, a relatively large heat loss of 40% into the storey above was calculated. The reasons for this are the larger plaster covering of the PHM of 2.5 cm and a deteriorated insulation layer within the floor construction. The heat emission of the PHM to the room is thus reduced to approximately 60% to only 52 W/m2 with a of 15 K. The dependency between floor temperature and supply temperature of the PHM can be shown by a regression analysis. By (6), a of 37 °C is calculated for a surface temperature of the floor of 27 °C and is defined as the maximum for all further simulations with PHM.
3.2.4. Partial Load Behaviour
According to (7), the performance of heat transfer systems can be adjusted by changing the logarithmic temperature difference
, which can be influenced by the supply temperature
or the mass flow. In heat transfer systems, the output increases disproportionately as the
increases [
43]. This is defined by the radiator exponent (n) and varies depending on the heat transfer system due to different proportions of radiative and convective heat output. In the study, typical literature values of radiator exponents are assumed for the steel tube radiator (n = 1.28) and for the two ceiling heating systems (n = 1.1) [
44]:
where
is the power of the heat transfer system, W;
n is the standard power of the heat transfer system, W;
is the logarithmic temperature difference, K;
is the logarithmic temperature difference at standard conditions, K; n is the radiator exponent.
The change in performance by adjusting the mass flow is represented by the characteristic heat exchanger curve and can be determined mathematically by (8). It is strongly dependent on the characteristic heat exchanger value (a) which is calculated according to (9) [
45]. For the validation of the heat transfer systems, it should be investigated how well the measured change in performance due to an increase or reduction in the mass flow correlates with the calculated characteristic curve:
where
is the output of the heat transfer system, W;
is the standard power of the heat transfer system, W;
is the volume flow, m
3/h;
is the volume flow at standard conditions, m
3/h, a is the heat exchanger characteristic value;
is the supply temperature, °C;
is the return temperature, °C;
is the room air temperature, °C.
Due to the low operating temperatures, the relative volume flow
/
is equated with the relative mass flow because the water density can be assumed to be constant. As expected,
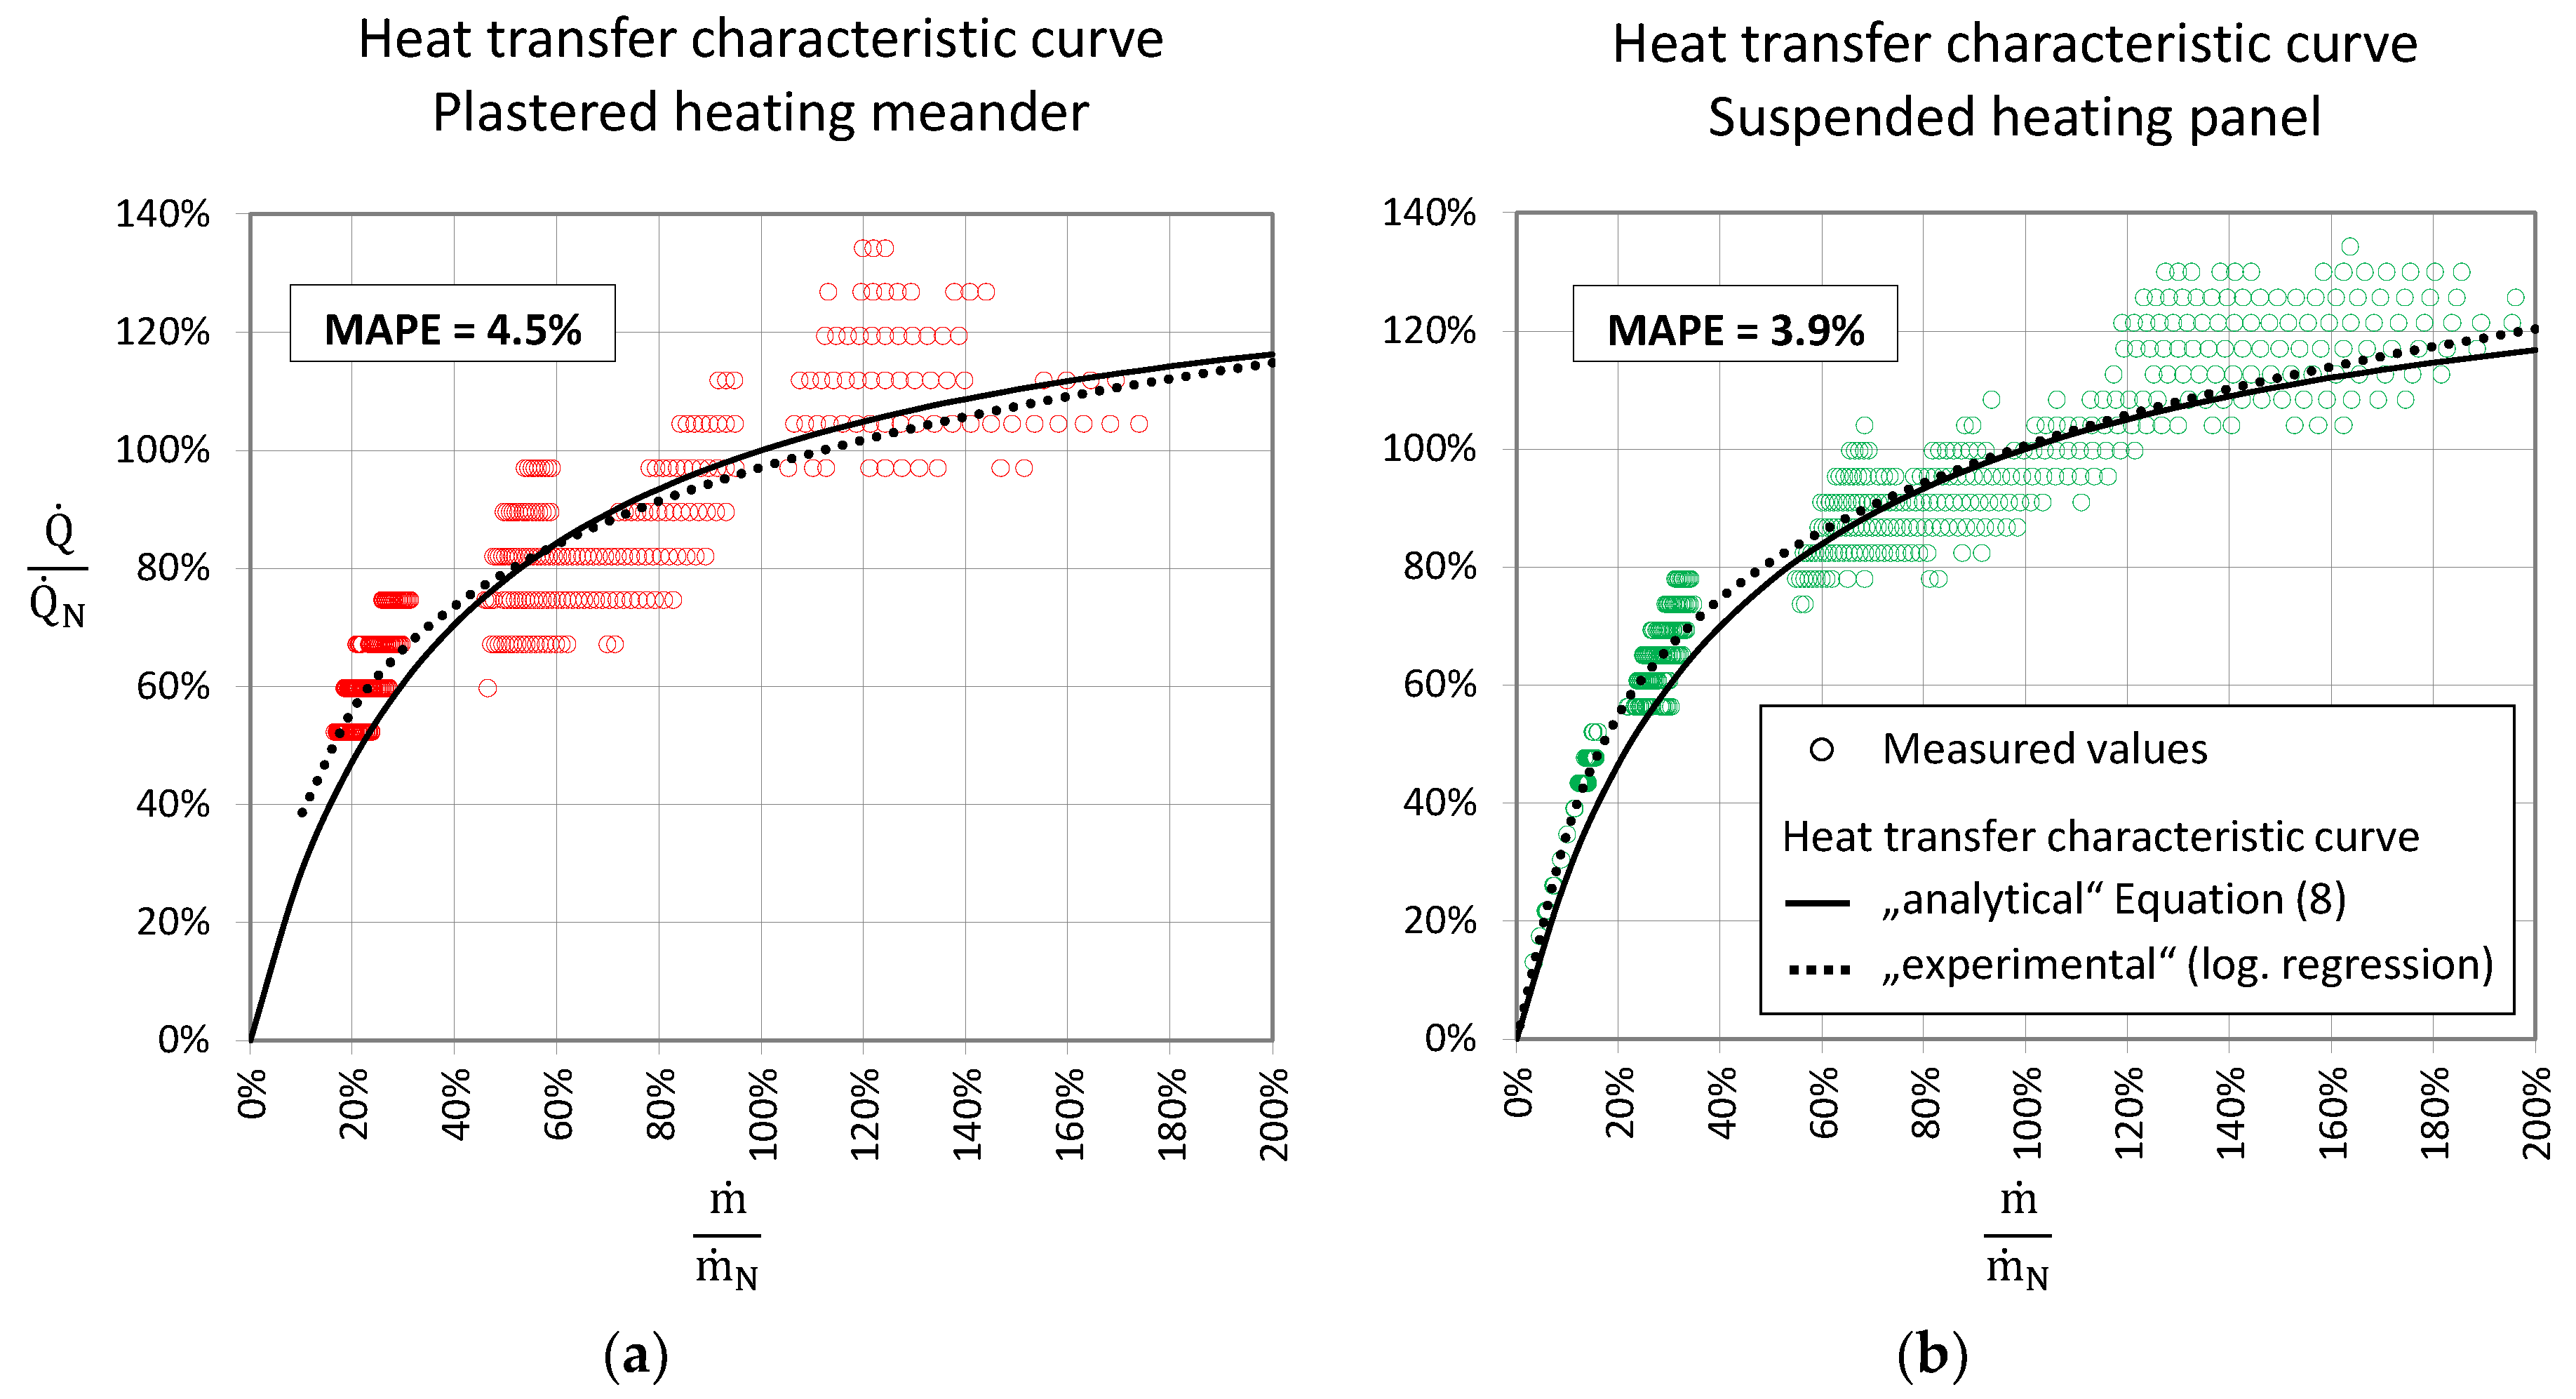
Figure 6 shows that the PHM (6a) leads to a greater scattering of the measured values due to stronger storage and delay effects in the building mass in contrast to the SHP (6b). The correlation coefficient of the individual measured values against a logarithmic trend line is 89.6% for the PHM and 96.5% for the SHP. The agreement between measured and calculated values is expressed through the Mean Absolute Percentage Error [
46]. The logarithmic trend line of the measured values is compared with the calculated heat exchanger curve. The result shows good agreement, whereby the SHP has a moderately lower MAPE (3.9%) compared to the PHM (4.5%). The strong non-linear relationship makes it clear that only a small increase in performance can be achieved with an increase in mass flow, beyond the design mass flow. This makes it clear, that TR cannot be achieved solely by increasing the mass flow.
3.2.5. Thermal Comfort
The validation of the thermal comfort indicators is performed by matching measurements with the calculated values in the simulation model. After validating the building envelope, the simulation model shows good agreement between the simulated operative room temperature and the corresponding measured air and radiation temperatures. Minor deviations are mainly due to deviating wind speeds or temperature differences in neighbouring rooms or draughts through doors.
The vertical air temperature difference was determined experimentally.
Figure 7 shows an almost linear correlation between the vertical air temperature difference and the power output for all heat transfer systems investigated. The system behaviour is linearly extrapolated by a regression analysis. The operation of the RAD is uncritical even at a very high power output (up to 239 W/m
2 heating surface). With PHM and SHP, the vertical air temperature difference between the ankle and the head (left side of diagram) increases almost identically, but more strongly than with the radiator. The limit value according to DIN EN 16798-1 [
23] of 2 K/m is only exceeded at 106 W/m
2 (PHM) or at 108 W/m
2 (SHP) while the height deviates from the standard (1.1 m). The selected height of 1.3 m corresponds to the head of a seated person. Due to the larger height difference while maintaining the limit value, the evaluation in this criterion is conservative.
Figure 7 (right side of diagram) shows a stronger temperature increase for the SHP between floor and ceiling compared to the PHM.
The experimental evaluation of the radiation temperature asymmetry with a globe thermometer is not trivial, especially in a fully furnished office space. It requires precise geometric shielding so that the radiation temperature of a specific component surface can be measured in isolation. Therefore, it is determined purely numerically using the validated simulation model.
For this purpose, the surface temperatures of the simulation model were first validated using the measured surface temperatures. Even for the high temperature level of the RAD, the mean deviation is less than 1 K. The low standard deviation indicates a limited scatter of the results. Subsequently, directional radiation temperatures can be calculated by taking visibility factors into account and finally, depending on the evaluation method (half-room or ceiling-façade method), the radiation asymmetry can be calculated.
3.3. Parameter Study
In order to transfer the knowledge gained on the demonstrator to the building as a whole, both the current condition with an unrenovated building envelope and a future energetic improvement of the building envelope are to be taken into account. For this purpose, a scenario matrix is developed in which, in addition to the energy quality of the building envelope (renovated/unrenovated), the location (1st floor/2nd–fourth floor/5th floor) and the heat transfer system (RAD, SHP, PHM) are varied. The results of the scenarios are presented in
Table 2.
Table 1 gives an overview of the main boundary conditions of the simulation models “renovated” and “unrenovated”. The renovation concept for the building envelope takes into account 6 cm of internal insulation made of foam glass, 14 cm polystyrene as a roof insulation and an improved quality of thermal bridges. For the renovation of the windows, openable windows with double glazing and fixed triple glazing are planned in alternation. In accordance with DIN EN 12831 [
40], a minimum hygienic air exchange of 0.5 air changes per hour via windows is taken into account for the renovated scenarios.
To determine the maximum temperature reduction, the design of radiators and ceiling heating systems is based on different strategies: In the case of an unrenovated building envelope, a maximum ceiling occupancy percentage is specified with a small spread of 5 K. Afterwards the supply temperature for radiators and ceiling heating is reduced until the operative setpoint temperature is reached. After the renovation of the building envelope, the existing radiators are replaced and re-dimensioned. By specifying uniform system temperatures (55 °C/45 °C), the surface area and power output of the radiators is adapted to the reduced heating load. For the ceiling heating systems, the ceiling occupancy percentage and the spread of 5 K remain unchanged. Subsequently, the supply temperature can also be reduced iteratively here.
The heating load predefines the requested performance of heat transfer systems. In the simulations, an outdoor temperature of −10 °C and no internal or solar loads are taken into account. In deviation from the standardized heating load calculation, in which the standard inside temperature corresponds to the air temperature, the operative setpoint temperature is used here. Since the examined heat transfer systems are characterised by a different type of heat delivery, different power requirements arise depending on the heat transfer system. Basically, a moderately higher power demand is recognisable for the PHM. On the fifth floor it results from the higher heat losses through the roof. It must be taken into account that the PHM heats the building mass the most and therefore the highest heat losses occur. However, its installed capacity is significantly lower than that of the SHP, so that the residual load must be covered with an increased power output of the RAD. After the building envelope renovation and the elimination of the RAD, the PHM on the top floor shows the highest power demand.
With an unrenovated building envelope, the heating load is provided at different coverage rates by the different heat transfer systems. While the SHP covers between 60% and 70% of the heating load, the PHM can only deliver half as much power to the room. This is due to the limitation of the supply temperature to 37 °C. The residual load is provided by the RAD.
After the elimination of the existing RAD in course of renovation the output of the PHM is not sufficient to cover the remaining heating load. This would only be possible on the top floor, as the supply temperature limitation of 37 °C is not required here. On the fifth floor this limitation is not given as there is no storey above it. Therefore, here the operative temperature can be reached. On the first floor, the ceiling occupation rate of the heating system is higher than in the second to fourth floor, therefore the installed heating power is enough to cover the heating load. On the second to fourth floor the installed power per m2 is not sufficient to cover the heating load. Therefore, the operative temperature cannot be reached.
The control capability of the heat transfer systems is evaluated using time constants (
) for heating-up and cooling-down processes and is shown in
Figure 8 as an example for the second floor. To enable reheating behaviour in a reasonable time, a 10% over dimensioning is achieved by increasing the supply temperature. All proportional integral controllers have a proportional coefficient of 0.3 and a reset time of 300 s.
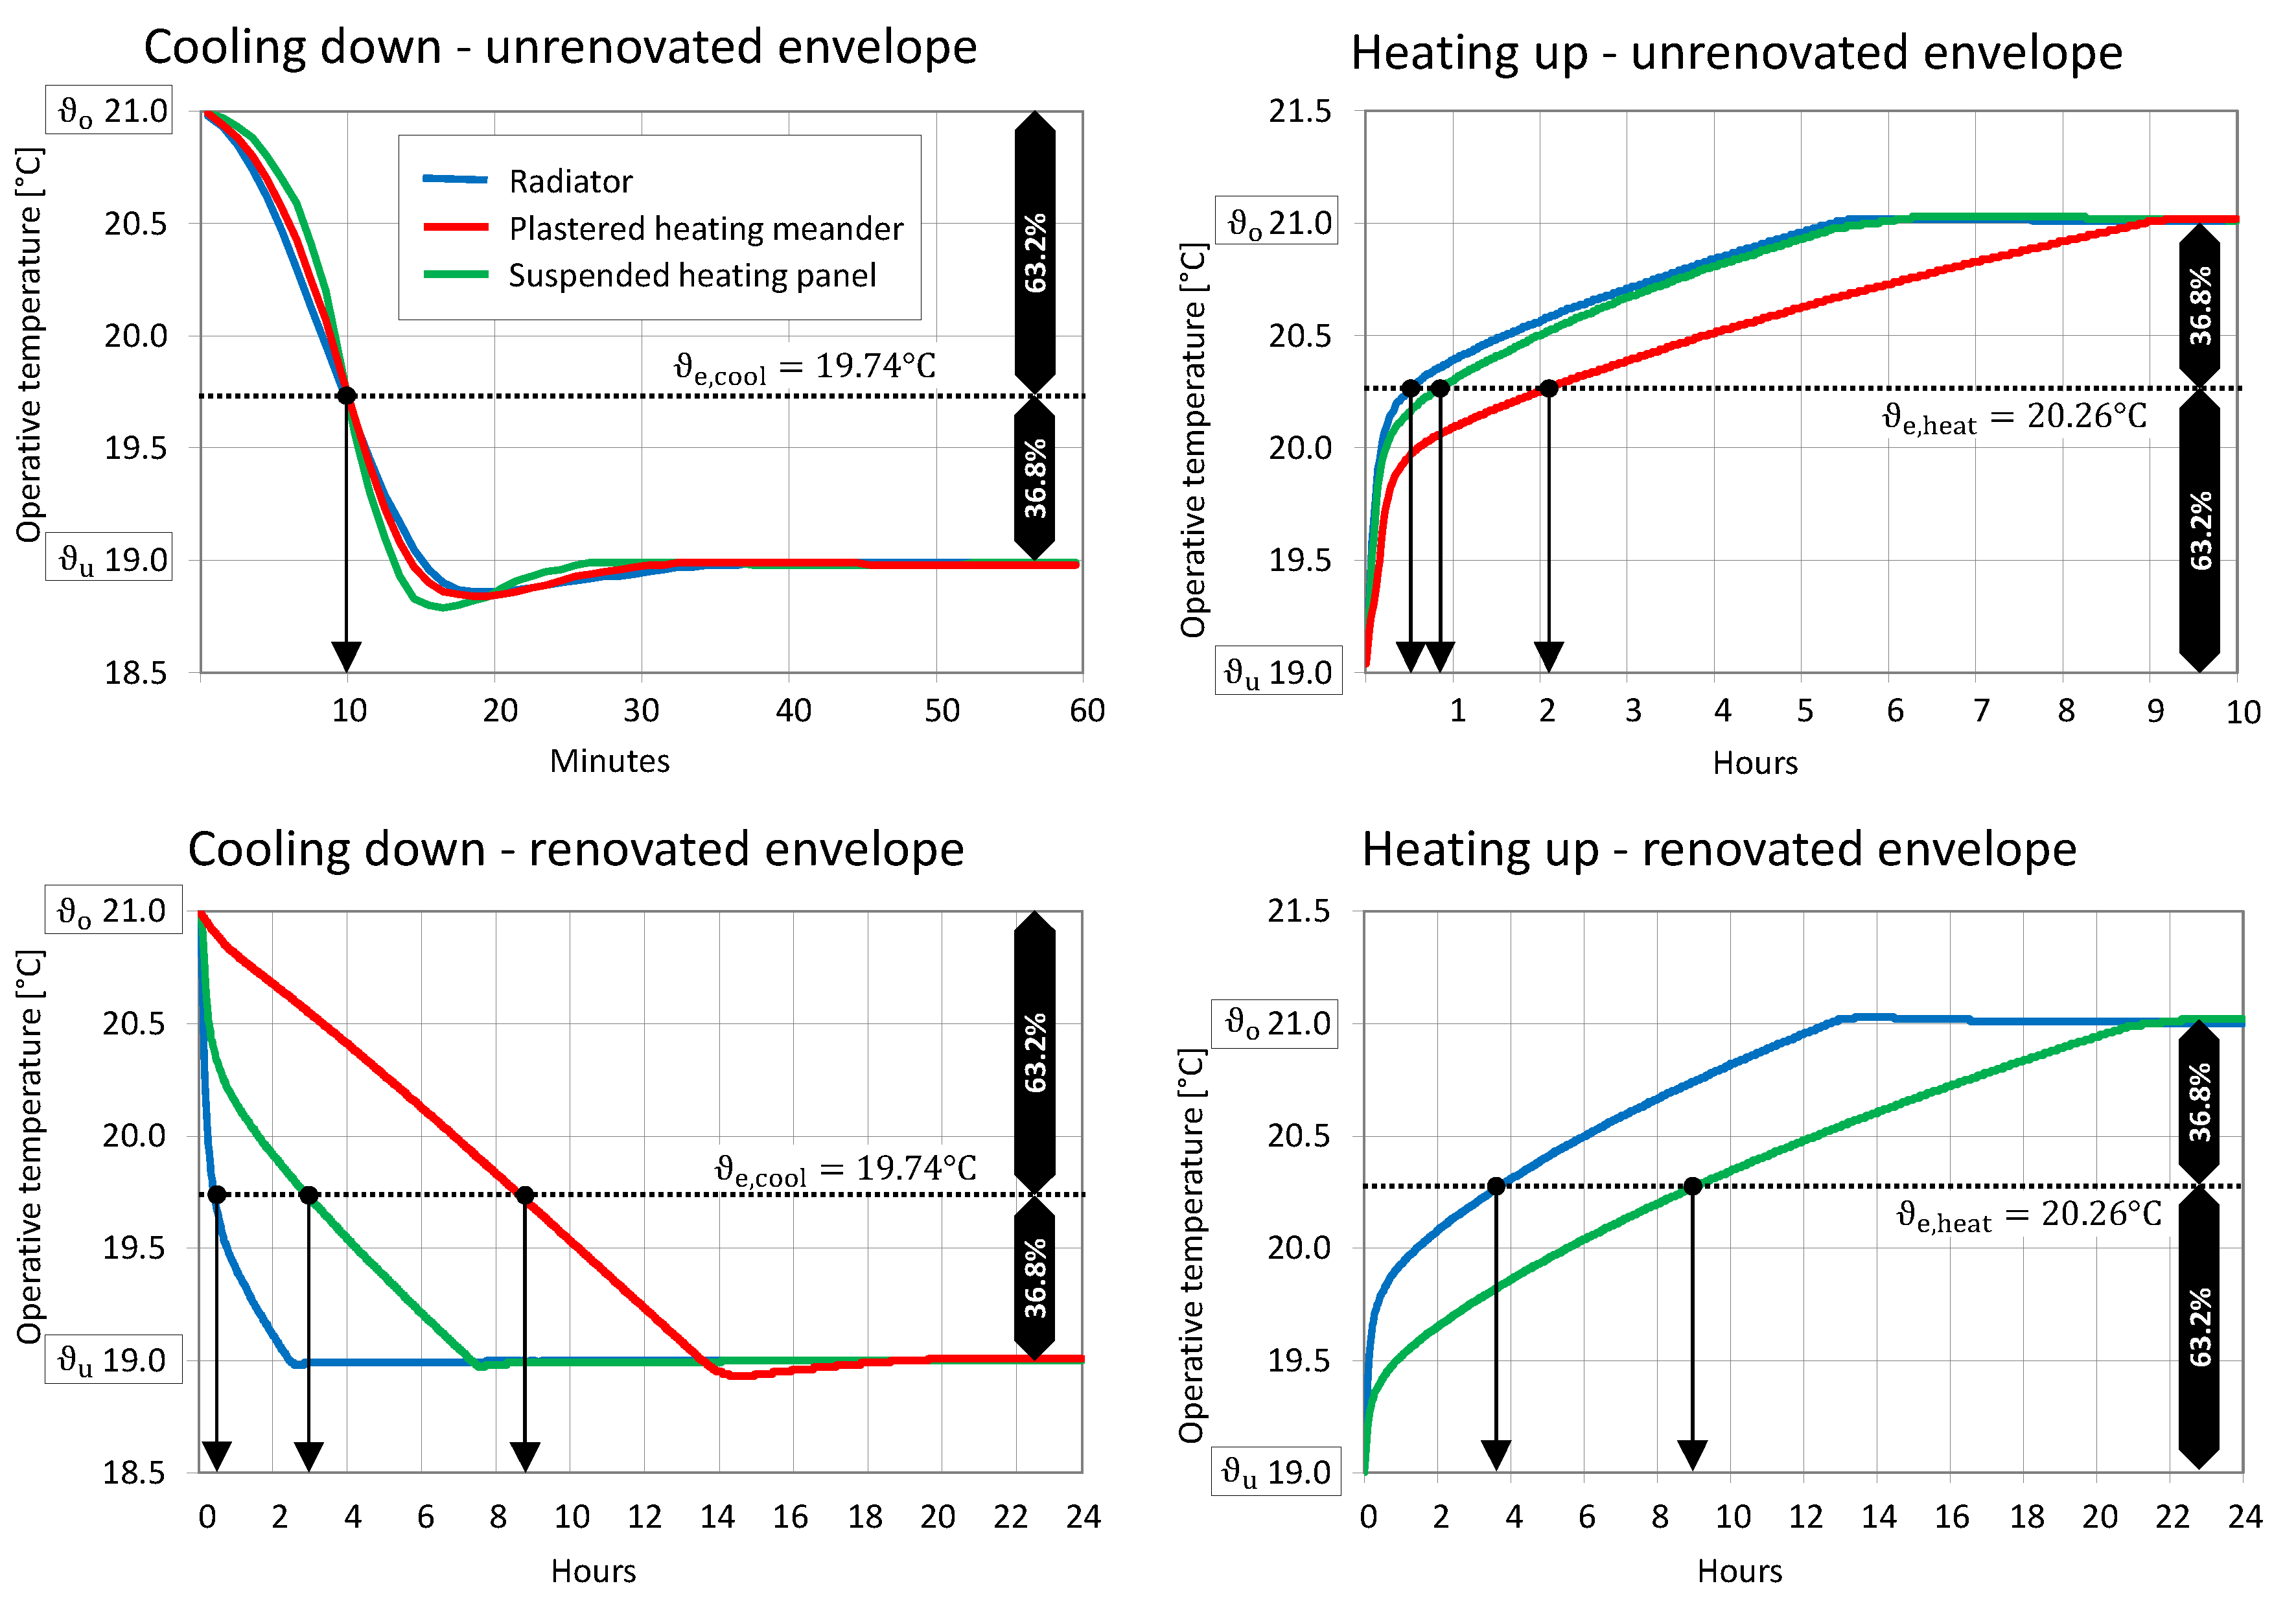
In the unrenovated scenarios, the heat loss through the façade by transmission and ventilation is so high that the room cools down from 21.00 °C to 19.74 °C within only 10 min, regardless of the chosen heat transfer system (see
Figure 8, top left). Even the additional storage mass heated by the PHM has no delaying effect. With the building envelope renovation, a significant increase in the time constants is achieved (see
Figure 8, bottom left). The reduced heat loss through the façade increases the storage efficiency of the thermal storage of the building. The surface heating systems can charge the storage mass more efficiently than the RAD. The RAD heats the storage mass the least, because it releases its power mainly convectively. The SHP can store a higher proportion of heat in the storage mass due to its large-surface and radiative heat emission. Compared to the RAD (25 min),
increases by a factor of 7 to almost 3 h. The PHM, as a structurally integrated heat transfer system, heats the storage mass the most through conductive heat emission and achieves a further increase of
to approximately 8 ½ h, a factor of three compared to the SHP.
The cooling-down behaviour described above can also be transferred to heating-up events. Here, too, the RAD (31 min) and the SHP (50 min) show the fastest reaction, while the PHM needs approximately 2 h to heat up the room from 19.00 °C to 20.26 °C due to the strong coupling with the storage mass. Since the installed capacity of the heat transfer systems is lower after the façade renovation, but the available storage mass remains constant, the time constants become significantly greater. The RAD requires approximately 3.5 h, while the SHP reaches ϑ
e,heat only after approximately 9 h [
41]. The PHM cannot reach the setpoint temperature at all due to the supply temperature limitation and the time constants are therefore not shown.
The heat transfer systems show different potentials for TR. The reference scenario for calculating the temperature reduction index (TRI) is the radiator system on the first floor. The results show in the comparison of the heat transfer systems that the SHP basically enables the greatest TRI compared to the PHM. In the unrenovated building, the first floor is decisive for the TR-potential of the entire building. Here, a TRI of 24% could be achieved with the PHM and up to 63% with the SHP. The lower potential of the PHM is due to the supply temperature limitation of 37 °C. After the building envelope renovation, a TRI of approximately 45% can even be achieved by reducing the heating load through the use of a RAD system. With the use of ceiling heating systems, the potential increases to 73% (SHP) and 58% (PHM). Only one PHM scenario on the second–fourth floor cannot reach the operative setpoint temperature with a renovated building envelope due to the supply temperature limitation.
The vertical air temperature difference
was only recorded experimentally, which is why only the existing situation can be evaluated here. The measurement was conducted with an isolated view of the ceiling heating systems although in reality there is a bivalent operation with the RAD. The findings from the monitoring suggest that the limit value of 2 K/m can be complied with for all heat transfer systems in the entire building. The high leakage of the unrenovated building envelope has a reducing effect, because the increased air exchange leads to turbulent air movements in the room, which counteract a strong vertical air temperature stratification [
26]. The evaluation of the radiation asymmetry (
) is important for the evaluation of surface heating systems (warm ceiling) in unrenovated buildings (cold façade), because here, with the same
, the level of dissatisfied users is higher in contrast to temperature control of wall or floor surfaces (ISO 7730). Therefore, RAD-only scenarios without surface heating systems are excluded from the assessment. Due to the numerous, mutually interacting parameters such as window area proportions, thermal envelope and combinations of heat transfer systems, generalized recommendations for compliance with
are not possible. Instead, an individual consideration of the specific case must always take place. The evaluation is conducted separately according to the half-room method and the ceiling-façade method.
All examined scenarios comply with the limit value of 5 K for for both calculation methods. In addition to the large room height in the architecture building, which decreases irradiation numbers, the bivalent operation of the heat transfer systems also has a reducing effect on the , because this effectively raises the surface temperatures of the lower half of the façade. When applying the half-space method, the PHM in the existing building represents the most critical case for the second floor. A of 4.2 K results from a comparatively warm lower half-space. The high thermal output of the RAD heats the façade area, while the floor is particularly warm due to the loss heat flux of the PHM. When applying the ceiling-façade method, the SHP in the existing building is the most critical case for the first floor. On the ceiling side, the high ceiling occupancy percentage of the SHP and the high supply temperature increase the radiant temperature, while the high glazing percentage with single glazing lower the radiant temperature. As a result, this leads to the highest of 4.4 K. The renovation of the building envelope causes a reducing of the , because higher internal façade temperatures and lower heating outputs have a positive effect. The results also show that after the façade renovation, the RAD can be omitted.
3.4. Planning Tool for TR-Potential
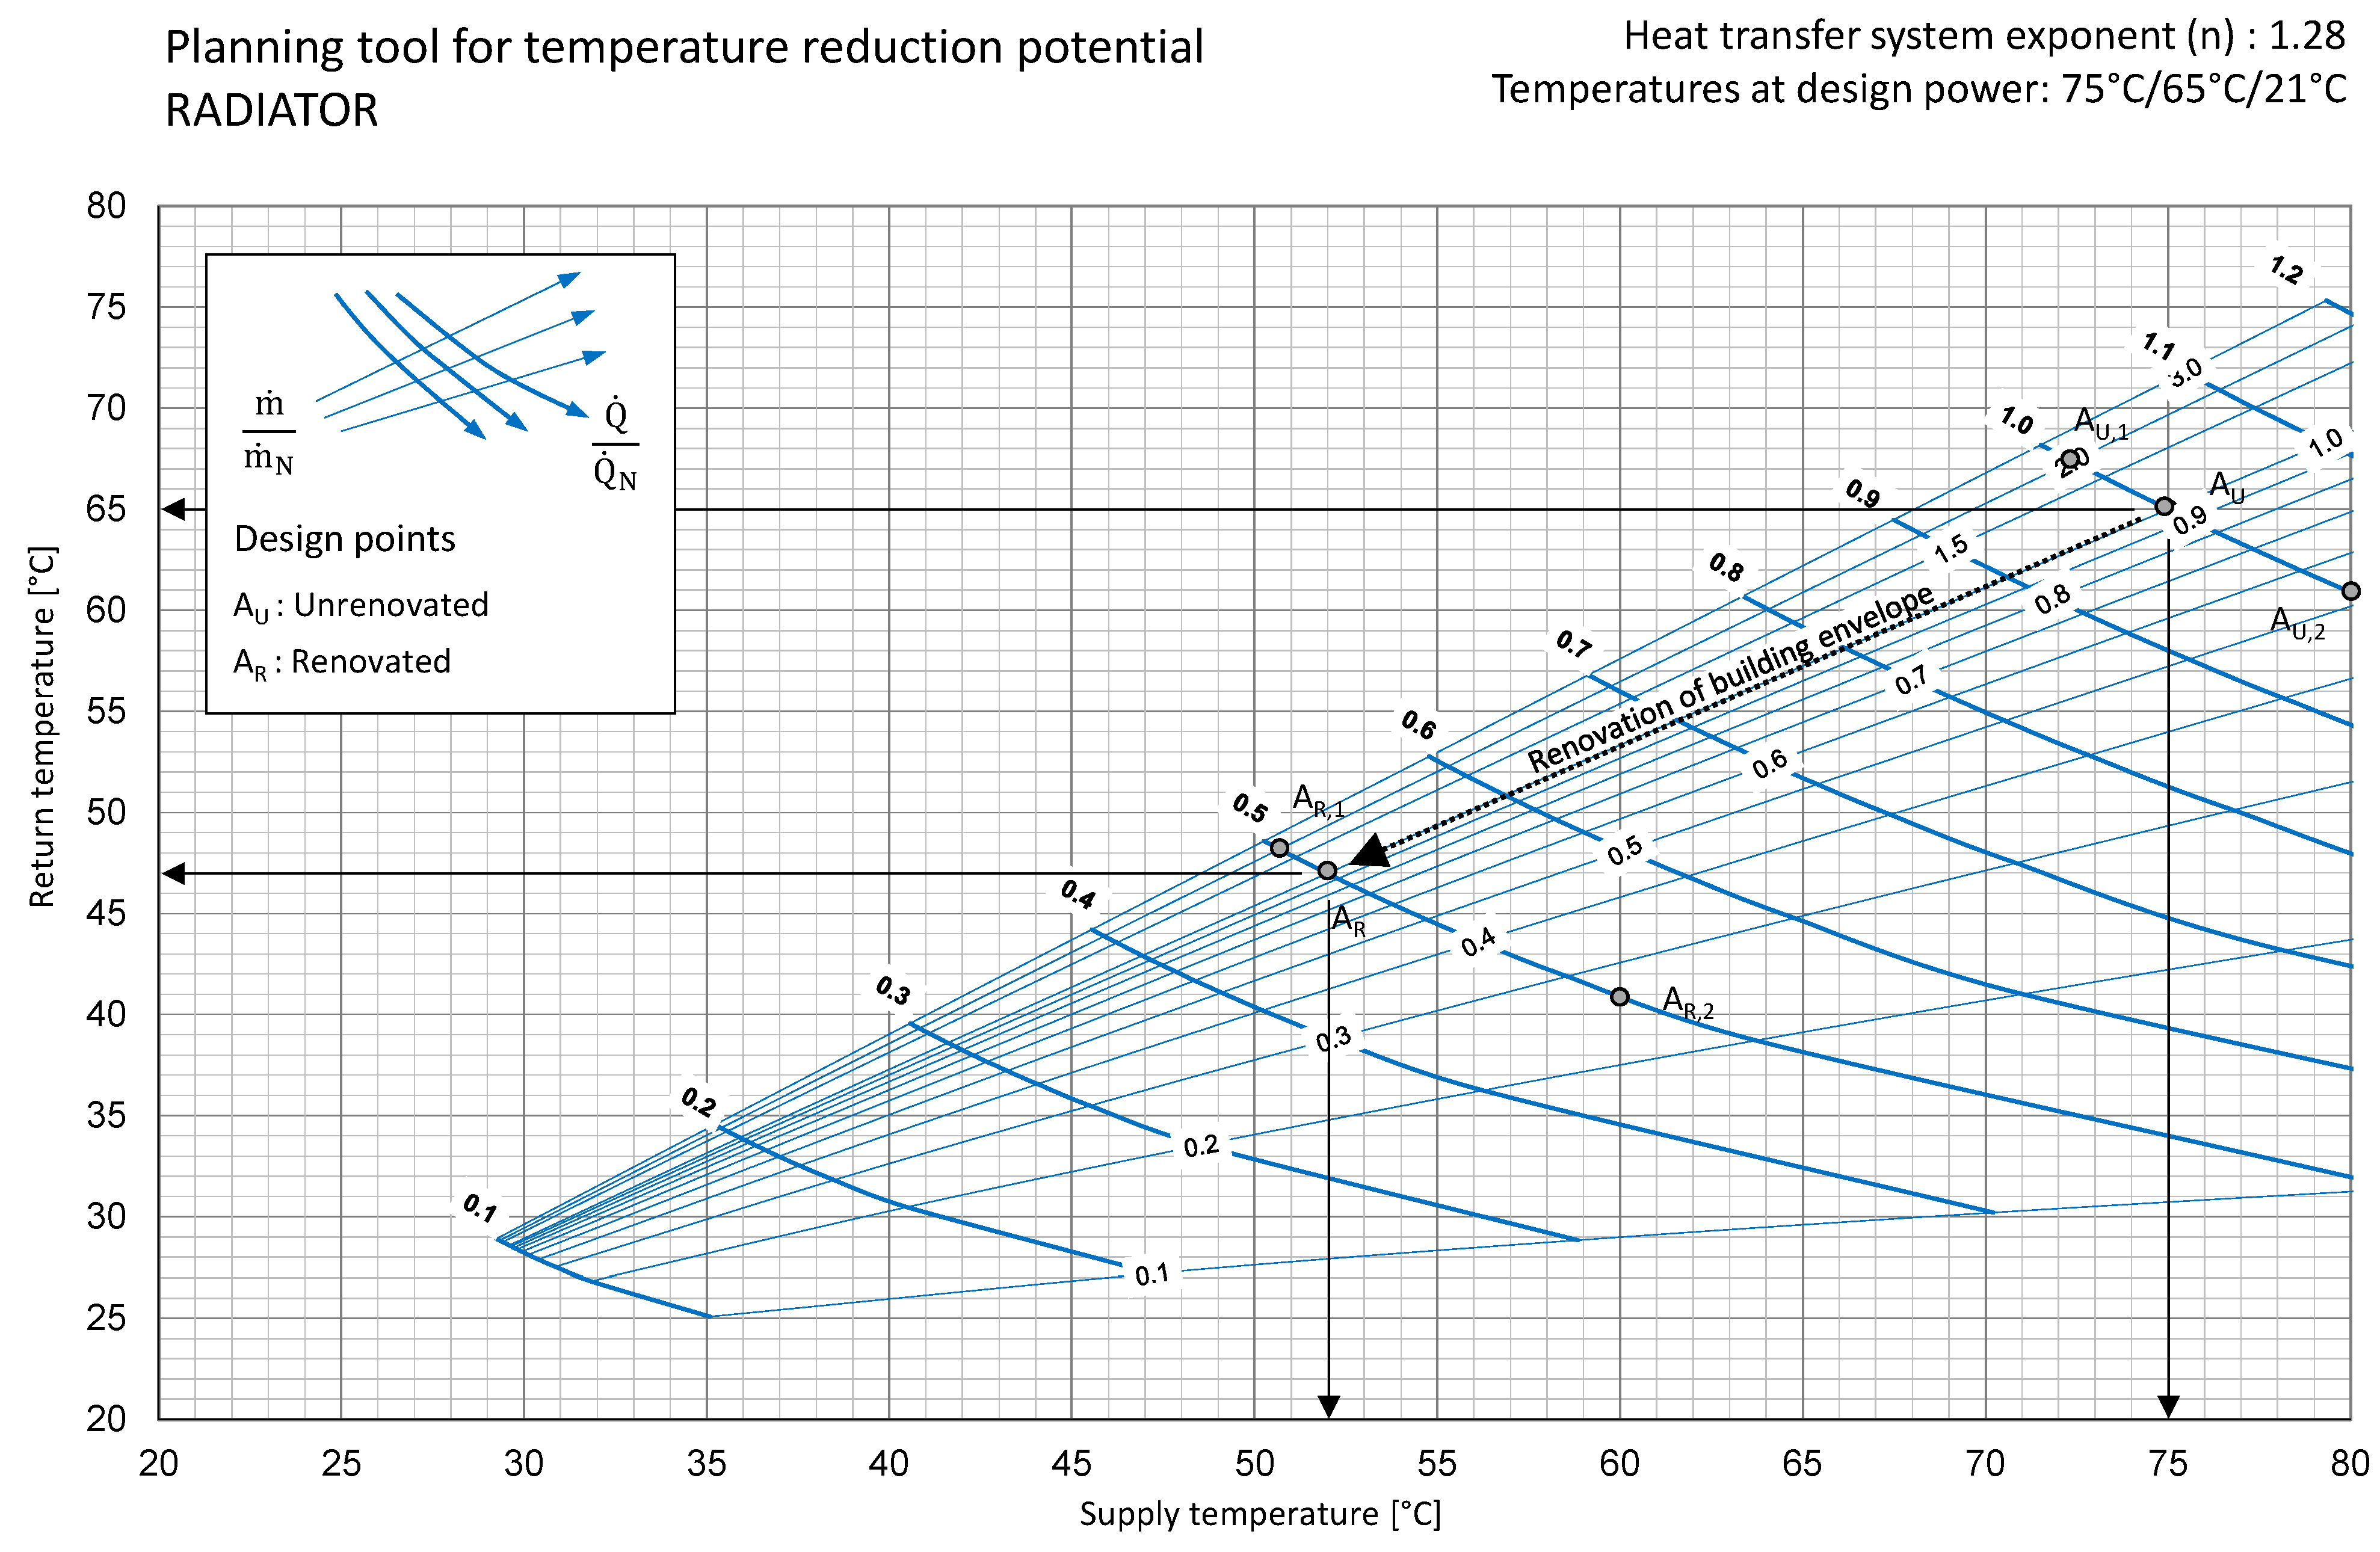
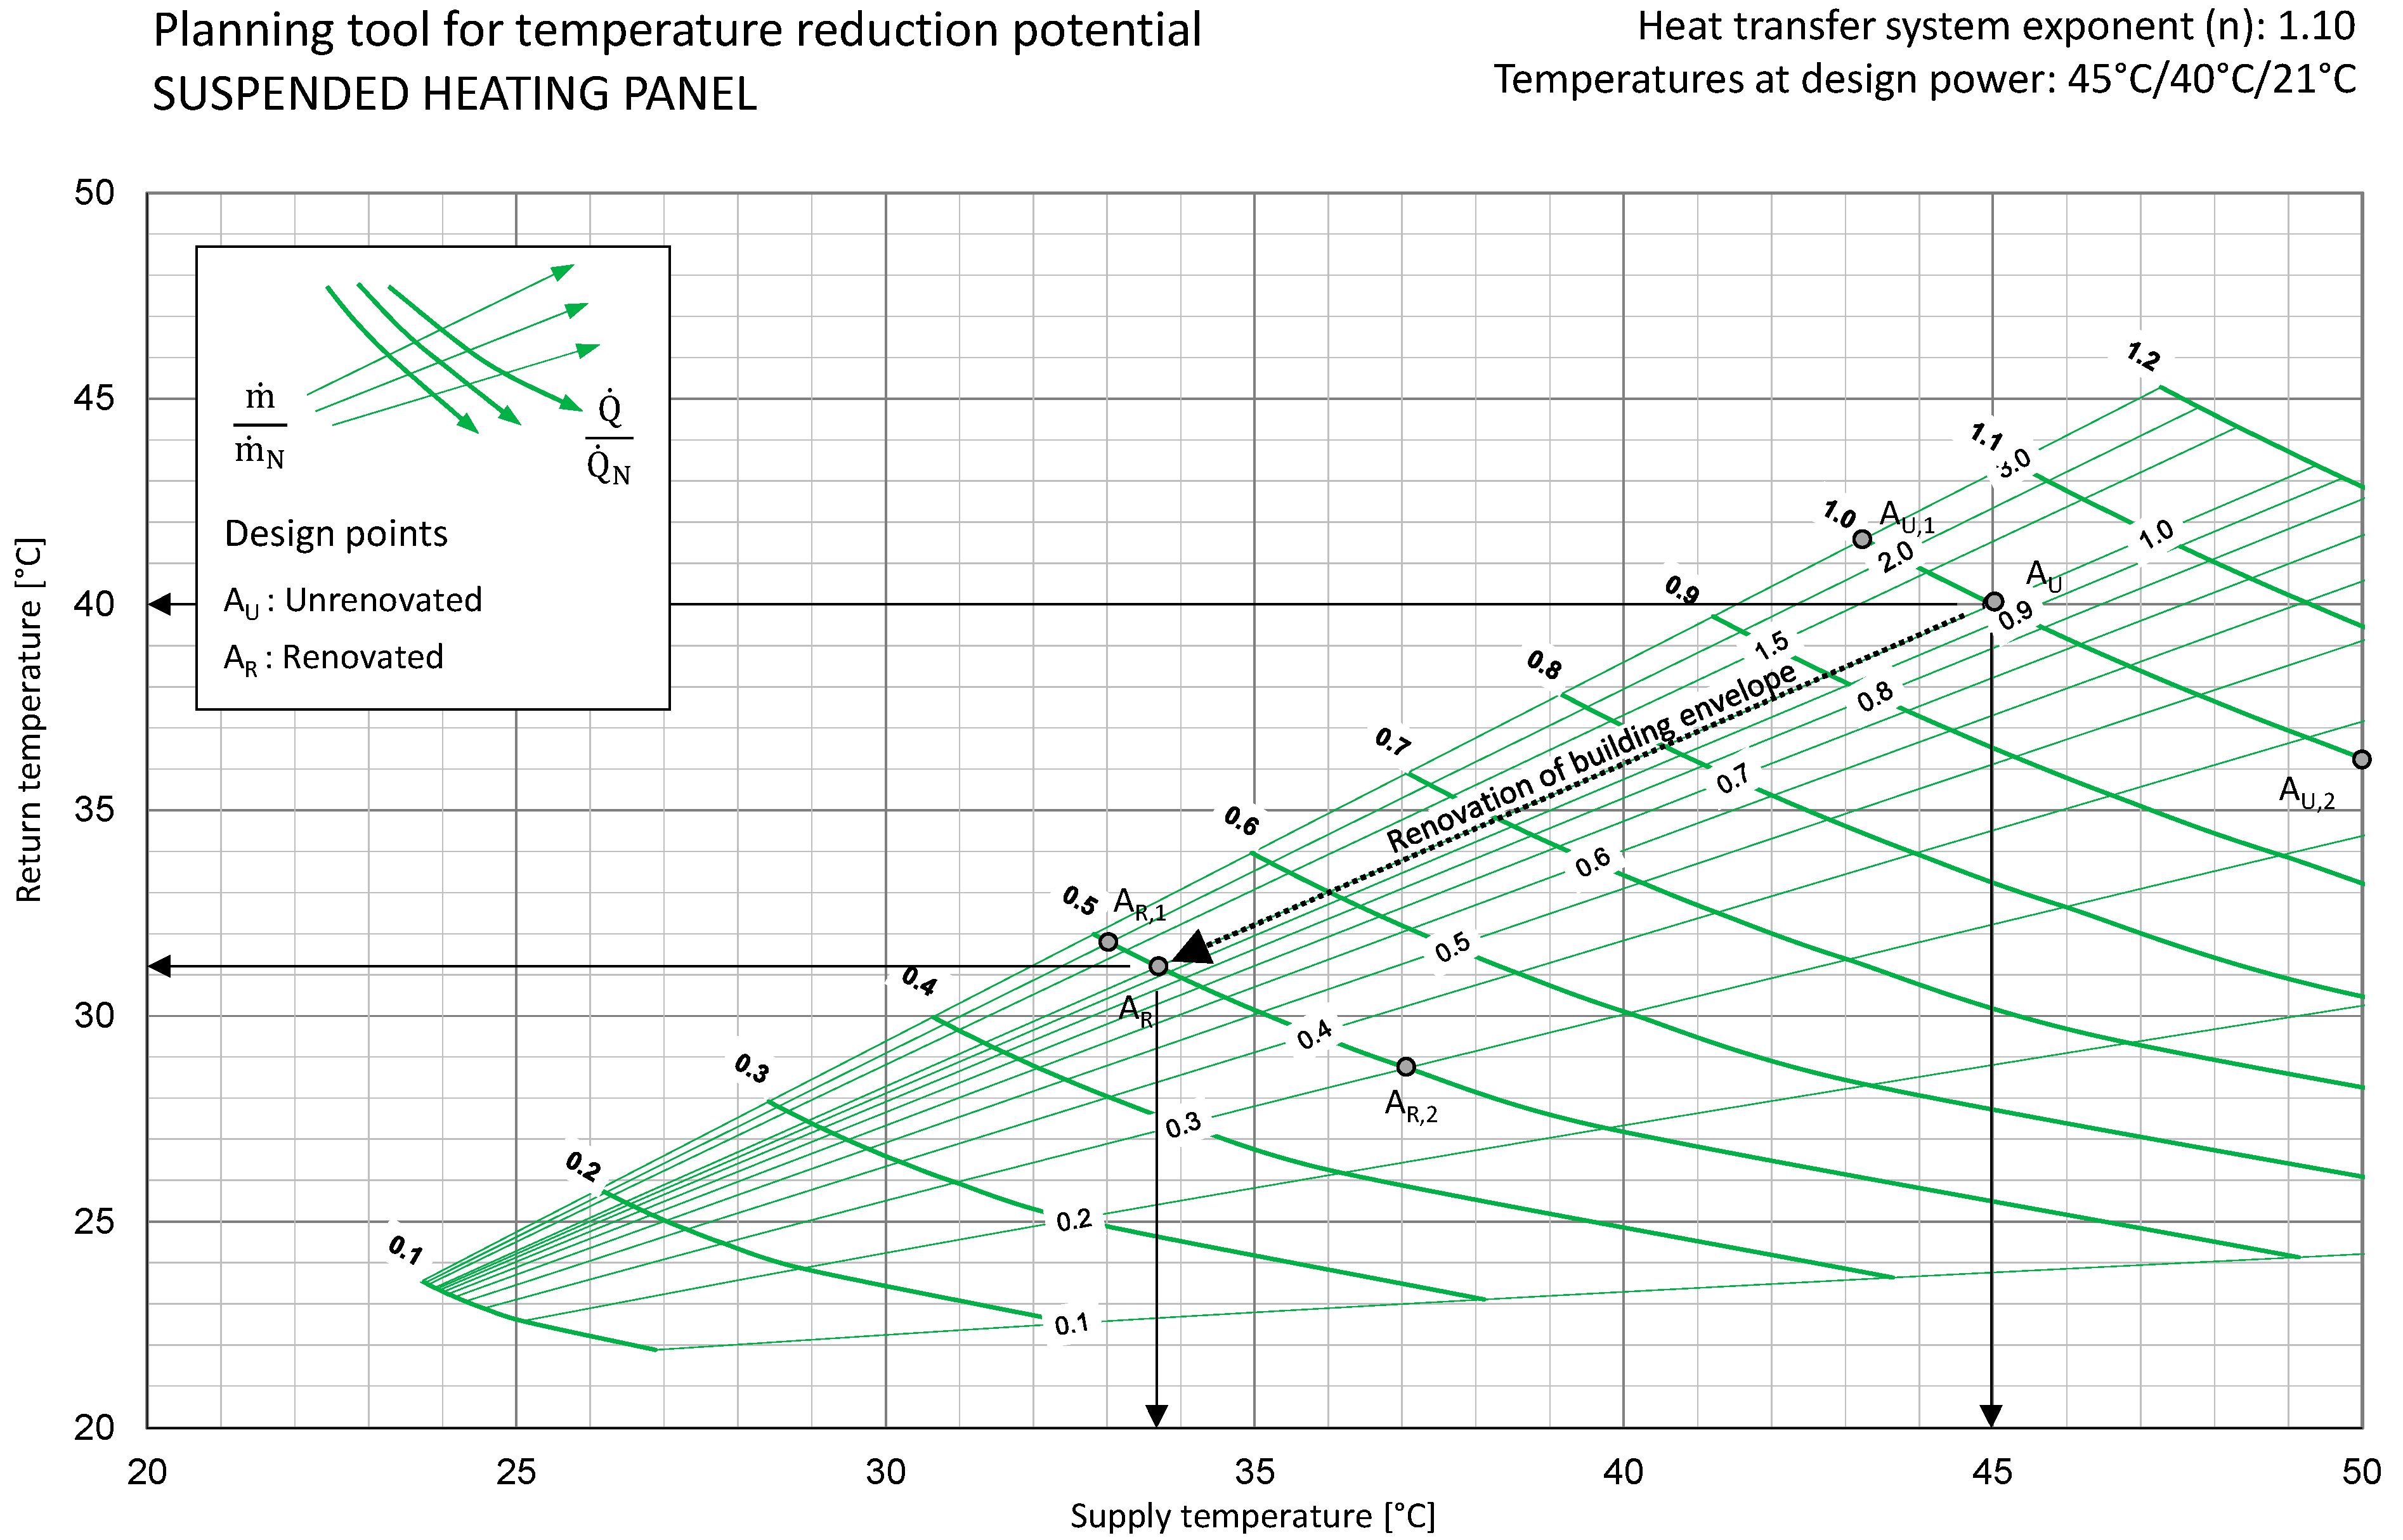
Based on the measurement results for the partial load behaviour of the heat transfer systems, the diagrams in
Figure 9 and
Figure A2 provide a set of tools that building planners can use to estimate the TR-potential. The diagram was originally developed by Jagnow and Wolff [
47] and adapted for this work. It shows the dependencies between supply and return temperature, mass flow and output of heat transfer systems. Input parameters are their design temperatures (
/
/
) and the respective radiator exponent. Mass flow and heat output are shown as relative change compared to the design point (A). The calculation is based on the following radiator equations. The first radiator Equation (10) describes the power output of the heating water to the heat transfer system and the second radiator Equation (11) describes the power output of the heat transfer system to the room air [
25]:
where
is the power of the heat transfer system at the operating point N/1/2, W;
is the mass flow at the operating point N/1/2, kg/s;
is the supply temperature at the operating point N/1/2, °C;
is the return temperature at the operating point N/1/2, °C;
is the area of the heat transfer system, m
2;
, is the logarithmic temperature difference at the operating point N/1/2, °C; and n is the heat transfer system exponent.
The radiator equations can also be applied to the SHP because, such as the radiators, it is in direct radiative and convective heat exchange with the room. It cannot be applied to the PHM, because as a component-integrated heat transfer system it gives off its heat to the room air via the building construction. Since the heat loss into the storey above depends strongly on the installation location, the ceiling construction and the room air temperatures of adjacent storeys, it is not possible to develop a generally valid set of planning tools for the PHM. In this case, the system behaviour should always be evaluated based on the individual situation.
Figure 9 shows a typical design point (
) of 45 °C/40 °C/21 °C for 100% output power and 100% mass flow for a heating surface exponent of 1,10 for the SHP in an unrenovated building. By tripling the mass flow (
), the
could be lowered to 43 °C at the same heating output, but this would also increase the
to 41 °C. By reducing the mass flow (
) to 33%, the temperature spread can be increased to 14 K at a temperature pair of approximately 50 °C (
) and 36 °C (
). After a heating load reduction of 50% through a building envelope renovation (
), the required heating load can be provided again with different temperature pairs:
: 33.5 °C/31 °C at
/
= 100%;
: 33 °C/31.8 °C at
/
= 200%;
: 37 °C/29 °C at
/
= 30%. The planning tool for the radiator can be used accordingly, as shown in
Figure A2.
4. Discussion
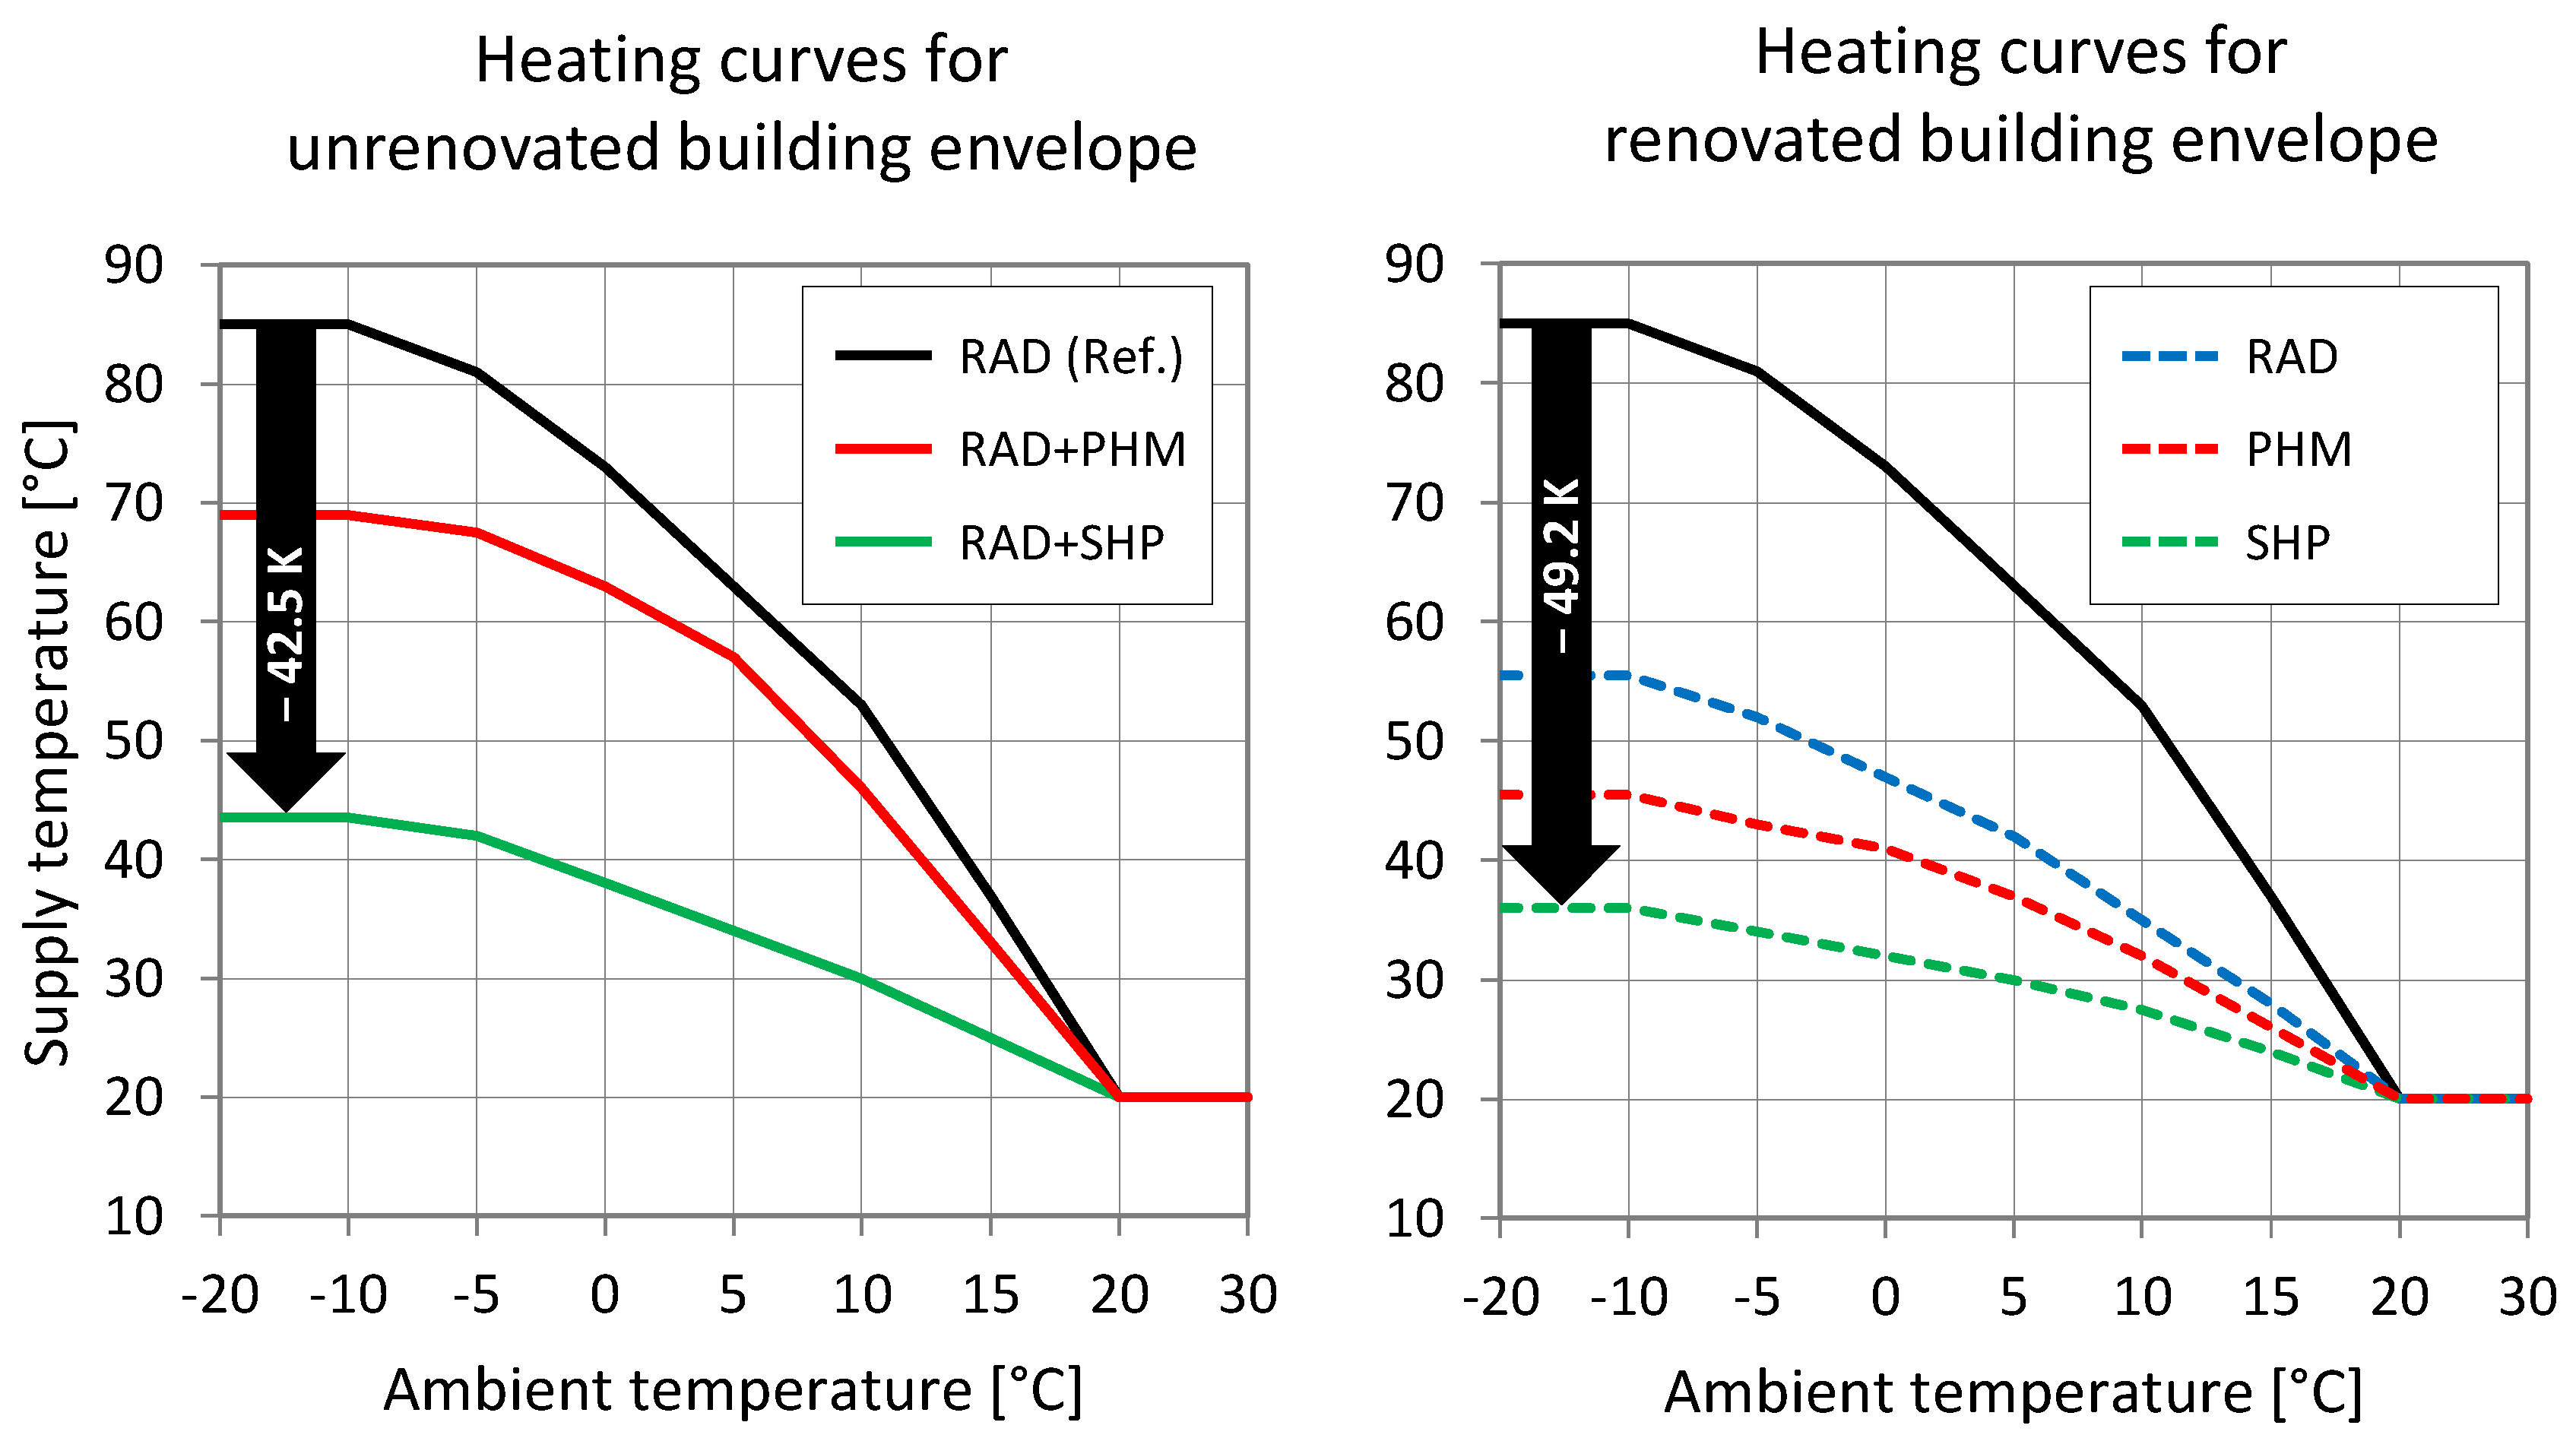
During the heating operation of the demonstrator, both ceiling heating systems showed that a significant TR is possible even during an extremely cold week in February 2021 with outdoor temperatures of −10 °C. Based on the highest supply temperature in the building of 85 °C for the RAD system on the first floor (reference system),
Figure 10 shows the TR-potential for both surface heating systems. The SHP in parallel operation with the RAD (fifth floor) enables a TR of 42.5 K to 44 °C in the supply temperature. For the PHM, the TR-potential is lower due to the risk of structural damage and thermal comfort restrictions due to high floor temperatures on the floor above. Therefore, the supply temperature of the PHM had to be limited to 37 °C. Its share in covering the heating load is therefore only 28% and the residual heat output must be provided by the RAD. A supply temperature of 67.5 °C is required for the RAD, which is why the TR is reduced to 26 K. Through the renovation, further TR can be achieved as the heating load is reduced and a maximum reduction of 49.2 K can be reached by use of the SHP.
Initial reservations about insufficient thermal comfort could be disproved. Even with an unrenovated building envelope, the limit values of category II DIN 16798-1 for the criteria of operative room temperature, floor temperature, vertical air temperature difference and for radiation asymmetry could be met in the demonstrator.
Within the numeric parameter study, the heat transfer systems were tested on all floors and a renovated building envelope was also taken into account. It was found that only monovalent heating via a PHM (without RAD) is not possible for the second to the fourth floor and can therefore not be used for the entire building. Due to the supply temperature limitation to 37 °C, the heat output is not sufficient.
All other scenarios fulfil all examined requirements for thermal comfort. It was shown that in the architecture building the limit values for radiation asymmetry are met even with an unrenovated building envelope. The large room height and the heating of the inside of the façade by the existing RAD have an advantageous effect. The results of the parameter study also show that a renovated façade generally has a reducing effect on the radiation asymmetry.
The linear increase in the vertical air temperature difference with increasing heat output confirms the study results of Wu et al. and Seifert et al. [
27,
28]. An interesting finding is the stronger air temperature stratification of the SHP compared to the PHM between floor and ceiling. However, the results between SHP and PHM are not directly comparable. Although the air temperature was measured at a height of 2.8 m for both systems, in the demonstrator the SHP is suspended at 2.9 m, while the PHM is mounted 80 cm higher on the concrete ceiling. Therefore, the measurement configuration should be adjusted in the future as follows: Air temperatures are to be measured at identical heights of the heating surfaces. In addition, the number of measuring points should be increased in order to map an exact vertical air temperature gradient. After the envelope renovation, it must be assumed that the vertical air temperature difference will increase with the higher air tightness.
The investigations also serve another goal of this work: the provision of a planning tool for quantifying the TR-potential of the integrated heat transfer systems.
Figure 9 and
Figure A2 show that a reduction of the supply temperature by increasing the mass flow can only be achieved to a limited extent. The reduction of the return temperature can be achieved by throttling the mass flow. However, if the power demand remains unchanged, this is accompanied by a higher supply temperature. After a heating load reduction due to a renovation, new temperature pairs of flow and return temperature can be determined with the help of the planning tool. Jagnow and Wolff point out that after a heating load change, a new hydraulic balancing must be conducted, as the thermal and hydraulic properties of the heat transfer systems change fundamentally [
47].
The installation of SHP is recommended for the renovation of the architecture building. It offers the greatest TR compared to the reference scenario while at the same time complying with the thermal comfort limits and also has good controllability. However, until the building envelope is renovated, the RAD must continue to operate in order to cover the residual heating load and to effectively reduce the cold air drop on the façade side. In the construction process, the SHP showed a much simpler and faster installation compared to the PHM. Additionally, the bright panel undersides increase the light reflectance of the ceiling and thus improve the daylight availability in the room. Due to its acoustic fleece and perforations, it significantly improves the acoustic comfort of the interior. Furthermore, the system makes it possible to cool the interior with moderate structural adaptation measures. This is a useful feature against the background of increasing heat events.
5. Conclusions
The research objective was to quantify the temperature reduction (TR)-potential of two ceiling heat transfer systems, which have been realized in the architecture building of the Technical University of Darmstadt while taking thermal comfort requirements into account.
The study results show that the highest TR can be achieved with the suspended heating panel (SHP). It is possible to lower the supply temperature from 85 °C (reference scenario) down to 43.3 °C. These results are encouraging because this TR is achieved without a renovation of the building envelope. However, the continued operation of the existing radiators is required. With a moderate improvement of the building envelope with interior insulation and replacement of the windows the supply temperature can be lowered down to 35.8 °C. This complies with the guide value of 50 °C suggested by Lund et al. [
4], so that heat pumps could run efficiently and renewable and excess heat can be integrated better in the building heating system.
In contrast, the plastered heating meander (PHM) showed a significantly lower TR-potential. This is due to the unexpectedly high heat flow into the floor above. To avoid structural damage and too high floor temperatures, the supply temperatures had to be reduced to 37 °C so that the radiators have to provide more power at higher supply temperatures (67.5 °C). These temperatures exceed the previously defined goal of 50 °C.
With the exception of the PHM combined with a renovated building envelope without radiators, the normative requirements of the thermal comfort are met in all scenarios.
Outlook
The Technical University of Darmstadt intends to renovate the architecture building in the coming years. The knowledge gained so far has great potential for subsequent use as it has already been incorporated into the preliminary planning and the building department will implement low-temperature suspended heating panels (SHP) throughout the building.
The TR makes it possible to integrate renewable heat for heating the architecture building. A potential study investigated how the excess heat from a nearby high-performance computer could be used. The results show that achieving TR with SHP could displace about 62% of fossil district heating, even with an unrenovated building envelope [
48].
While this paper focuses purely on the design of the systems, the energy demand should also be investigated. Due to the reduced spread and the potentially higher pressure losses inherent in the system, the demand for electrical energy for the circulation pumps will have to be investigated in particular.
The used simulation software does not calculate air flow within zones therefore the influence of air movements upon thermal comfort was not included in this paper. This will become more relevant, when the studies are expanded by analysing the performance under volatile conditions, which will have impact on thermal comfort as well as the TR-potential in different part load cases.
The findings refer to the specific conditions of the architecture building and cannot simply be transferred to other buildings. The next phase of the research project will investigate how the knowledge gained on TR-potential could be transferred to other buildings on the Campus Lichtwiese.
