Abstract
To produce a valuable final product from anaerobic digestion (AD), one of the preferred methods of organic recycling, high quality feedstock must be ensured. In this study, separately collected real biowaste (B) was used, consisting of 90% food waste and 10% green waste. The priority issues of AD are both high methane production (MP) and high organics removal efficiency (as organic matter, OM and dissolved organics, and DCOD), which may be improved after pre-treatment. In this study, the effect of hydrothermal pre-treatment (BHT) and enzymatic additives (BE) on MP and organics removal from biowaste in mesophilic (37 °C) conditions was analyzed. To assess the adequacy of pre-treatment application, biowaste without treatment (BWT) was used. Pre-treatment of biowaste prior to AD affected the maximal MP, the removal effectiveness of both OM and DCOD, and the kinetic parameters of these processes. For BWT, the maximal cumulative MP reached 239.40 ± 1.27 NL/kg OM; the kinetic coefficient of MP (kCH4) and the initial MP rate (rCH4) were 0.32 ± 0.02 d−1 and 76.80 ± 1.10 NL/(kg OM·d), respectively. After hydrothermal pre-treatment, the MP of BHT (253.60 ± 1.83 NL/kg OM) was 6.3% higher than BWT. However, the highest MP was found for BE, 268.20 ± 1.37 NL/kg OM; to compare, it increased by 12.1% and 5.5% with BWT and BHT, respectively. However, the kinetic parameters of MP were highest with BHT:kCH4 0.56 ± 0.02 d−1 vs. 0.32 ± 0.02 d−1 (BWT) and 0.34 ± 0.02 d−1 (BE); rCH4 141.80 ± 0.02 NL/(kg OM·d) (BHT) vs. 76.80 ± 1.10 NL/(kg OM·d) (BWT) and 89.80 ± 0.50 NL/(kg OM·d) (BE). The effectiveness of OM removal was highest with BE, similarly to the MP with the use of an enzymatic additive. The kinetics of OM removal (rOM, kOM) were highest with BHT, similarly to the kinetics of MP (rCH4, kCH4). The highest effectiveness of OM and, consequently, its lowest final content obtained with BE means that the organics were used most efficiently, which, in turn, may result in obtaining a more stable digestive system.
1. Introduction
The growth of urbanization and the global population have caused an increase in the mass of municipal solid waste (MSW) that is produced. In recent years, there have been visible changes in the waste management hierarchy. According to the EU’s “waste management hierarchy”, prevention and reuse are the most desirable scenarios, followed by recycling (including organic recycling), then recovery (e.g., incineration of waste to generate energy), and finally, disposal (e.g., by landfilling), which is the most harmful option for both the environment and health, although one of the cheapest [1]. Unfortunately, in some EU countries, over 60% of household waste goes to landfills, and the problem of landfilled biodegradable municipal waste has been increasing in recent decades. Landfilling of biodegradable municipal waste is especially dangerous for the environment because it is associated with the emission of greenhouse gases and leachate generation. The Council Directive indicated that the amount of biodegradable municipal waste had to be significantly reduced (to 50% of levels in 1995 by 2009 and 35% by 2016) [2]. To fulfill this requirement in the EU, mechanical-biological treatment (MBT) installations were developed in many countries. Previously, these installations were managed with mixed MSW. In the mechanical part of MBT plants, secondary materials are recovered (e.g., plastics, glass, metals, and high-calorific alternative fuel, so-called Refuse Derived Fuel RDF). In the biological part of the plants, the organic fraction of municipal solid waste (OFMSW) that has been mechanically separated on a sieve is stabilized [3,4,5]. Because OFMSW is separated from mixed MSW, it is contaminated with various wastes, e.g., plastic, glass, stones, etc. Although the biological stabilization of OFMSW decreases its biodegradability and ensures its stability, thus reducing the emission of greenhouse gases, the final product of OFMSW stabilization can only be landfilled [6,7]. Moreover, the amounts of landfilled stabilization (that cannot be considered compost) are not taken into account in recycling rates. A total of 50% of municipal waste (at least four categories, i.e., paper, glass, metals, plastics) in EU Member States should have been recycled and prepared for reuse by 2020 [8]. In 2015, the European Commission published “Closing the loop—An EU action plan for the circular economy (Circular Economy Package)” [9]. This led to the adoption of new targets: 55% of municipal waste should be recycled and prepared for reuse by 2025, 60% by 2030, and 65% by 2035 [8].
The overall recycling rate in the EU (material recycling, composting, and digestion) increased from 31% in 2004 to 45% in 2016. If data from non-EU and EEA member countries (Iceland, Liechtenstein, Norway, Switzerland, and Turkey) are added to the aggregated EU country data, the increase was from 28 to 41%. This improvement comes from a combination of a reduction in the amount of MSW generated and an increase in the total quantity undergoing material and organic recycling. MSW recycling rates differ widely between European countries, ranging from 70% in Germany to 11% in Malta in 2020 [10]. In 2017, 3 countries were already recycling 55% or more of their MSW, 28 countries were recycling 55% or more of their packaging waste, and 15 countries were recycling 65% or more of their packaging waste. To meet the target of 65% by 2035, while also taking into account the new method by which recycling levels are calculated, changes in waste management are required. Existing MBT plants should not manage mixed MSW, but separately collected waste materials. MBT plants should serve as centers for recycling in which waste materials, such as paper, glass, metals, and plastics, should only be cleaned to be received by the recyclers. Then, after recycling, waste materials can be used on the market as secondary materials that can be included in the production cycle in accordance with the functioning of a circular economy. Due to the new method of calculating recycling levels, achieving the required recycling rates without organic recycling is impossible. Thus, organic recycling methods (composting and digestion) for selectively collected biowaste should be implemented to increase the recycling rate. In Poland, recycling biowaste is one of the essential elements in the transformation of the economy into a circular economy.
Organic recycling (composting or methane fermentation) of selectively collected biowaste, which allows the recovery of organic compounds from compost or digestate, is a part of sustainable municipal waste management. Nowadays, anaerobic digestion (AD) has received increasing attention as an approach to both organic waste treatment and renewable energy generation. AD is a cost-effective option due to its potential to produce energy and limited environmental impact [11,12,13]. Furthermore, it is a promising alternative to incineration and composting [14,15]. Although biowaste accounts for ca. 40% of MSW, only 16% was recycled in the EU [15]. The amount of biowaste in MSW indicates that a large amount of methane can be generated with this substrate. To produce a valuable final product from AD, it is necessary to ensure the quality of the biowaste; thus, it should be separately collected. Polish regulations specify what kinds of organic waste can be collected together. Biowaste may include food and kitchen waste (produced by households, catering establishments, or restaurants) and green waste from gardens and parks (e.g., leaves, grass, or branches). This means that lignocellulosic materials with a high share of lignin may be present in separately collected biowaste, which are considered to be less degradable than, e.g., proteins, carbohydrates, or fats. Therefore, to increase the efficiency of AD and methane production, the biodegradability of lignocellulosic materials must be increased. This can be achieved with the use of pre-treatment methods. For pre-treatment, mechanical, chemical, thermal, and biological methods have been used [16,17,18,19]. These methods cause disruption of the recalcitrant structure of lignocellulosic materials as a result of the breakage of the lignin sheath. Pre-treatments increase the breakdown of the long cellulose and hemicellulose chains into sugar monomers, enabling the degradation of hemicellulose and reduction in the crystallinity and degree of polymerization of cellulose. For example, alkaline chemical pre-treatment modified the crystalline and morphological structure of cellulose and, in turn, polysaccharide chain breakdown and crystal saponification take place [20,21]. Chemical pre-treatment under acidic conditions damages lignin structure, dissolves hemicellulose, and decomposes cellulose into simple sugars [22,23]. In high-temperature pre-treatment (240 °C), hemicellulose and lignin can be degraded faster than cellulose [24,25]. All of these pre-treatment methods allow for converting less degradable materials into more biodegradable ones. However, it is important to assess to what extent the increase in biodegradability results in an increase in biogas/methane production, and the objective of the present study was to undertake such an assessment. More specifically, this study aimed to determine the effect of different real biowaste pre-treatments (hydrothermal and enzymatic pre-treatment) on methane production. Moreover, kinetic models were used to describe both methane production and the removal of organics. In this way, the rates of methane production and the removal of organics were determined, as well as the kinetic coefficients. For comparison, prior research did not combine the analyses of kinetics to describe methane production and removal of both (i) organic matter (OM) and (ii) dissolved organic compounds (expressed as COD, DCOD).
2. Materials and Methods
2.1. Selectively Collected Biowaste and the Inoculum Used in the Measurements of Methane Production
In the present study, real biowaste, comprising kitchen waste (90%) and green waste (10%), was used as a substrate. The biowaste for analyses of methane production was randomly collected from containers for selective collection (total mass ca. 200 kg) located in a city with 200,000 inhabitants (north-eastern Poland). For standardization, the biowaste was dried (at 60 °C), then ground to a 0.5–1 mm diameter for storage and further physicochemical analyses and analyses of methane potential.
The biowaste was relatively wet with a moisture content of 70.88 ± 1.20%. Although biowaste before grinding was dried, the minimal moisture content of the ground material was due to the absorption of a small amount of water from the air. The OM content was about 88.50 ± 0.85% DM. The moisture and OM content were considered when calculating the mass of biowaste needed to ensure the appropriate initial organic loading rate (OLR) during the measurement of methane production. The water extract had high contents of dry residue (DR) (ca. 31 g DM/L and ca. 22 g DM/L, respectively, before and after filtration). Organic residue (OR) constituted more than 90% of DR in the water extract before filtration and more than 80% in the water extract after filtration. In the water extract after filtration, the concentration of organic compounds (expressed as COD) was high, 245.03 ± 1.60 g COD/kg DM, whereas the concentration of total nitrogen (TN) was merely 0.87 ± 0.10 g/kg DM (Table 1).

Table 1.
The characteristics of biowaste and the inoculum used in the measurements of methane production.
Anaerobically digested sewage sludge was used as the inoculum for the analysis of the methane potential of biowaste (Table 1). Digested sewage was collected from a closed mesophilic (37 °C) chamber in the municipal wastewater treatment plant for a city with 200,000 inhabitants (north-eastern Poland). The plant has a designed capacity of 60,000 m3/day. The alkalinity and the reaction of the inoculum were 34.10 ± 0.30 mval/L and 7.26 ± 0.20, respectively.
2.2. Experimental Setup for the Measurements of Methane Production
The Automatic Methane Potential Test System II (AMPTS II) was used for analyses of mesophilic methane production. The equipment has three units. In the sample incubator, 15 bioreactors (500 mL) containing sample and inoculum were incubated at 37 °C. The bioreactors possessed small stirrers and were mixed at a speed of 80 rpm for 1 min every hour. In the CO2-absorbing unit, the biogas produced in each bioreactor passes through an individual vial containing an alkaline solution, including 1200 mL of 3 M NaOH solution with 0.4% thymolphthalein pH-indicator (a ratio of 1 L NaOH/0.5 mL thymolphthalein). Several acidic gas fractions, such as CO2 and H2S, are retained by chemical interaction with NaOH, allowing only CH4 to pass through to the device for measuring biomethane gas volume. The volume of CH4 gas released in the bioreactors was measured using a wet gas flow measuring device with a multi-flow cell arrangement (15 cells). This measuring device works according to the principle of liquid displacement and buoyancy and can monitor ultra-low gas flows; a digital pulse is generated when a defined volume of gas flows through the device. Finally, the computer was used to record, display, and analyze the results.
2.3. Experimental Variants
In the present study, variant number 1 consisted of the inoculum only (I). Variant number 2 contained inoculum and biowaste (without treatment) (I+BWT). Variant number 3 comprised inoculum and biowaste (after hydrothermal (HT) pre-treatment) (B/water (w/w) of 0.2, 90 °C, 1 h) (I+BHT). HT pre-treatment may cause organic compounds and nutrients to liquefy and be released from the biowaste into the water solution. Variant number 4 consisted of inoculum, biowaste, and an enzymatic additive (I+BE). The enzymatic additive (1500 mg) was mixed in 2500 mL of the inoculum resulting in a dose of 600 mg/L (0.6 g/L); this inoculum was supplied for the AMPTS bioreactors in variant 4. The enzymatic additive contained mainly cellulase, xylanase, beta-glucanase, and carbohydrase. Enzymatic pre-treatment can promote hydrolysis of lignocellulosic materials. Microcrystalline cellulose (reference material) was used as a positive control to confirm the experimental setup and the performance of the inoculum.
Three repetitions of each variant were performed. Each AMPTS bioreactor was connected by Tygon tubing to the carbon dioxide trap mentioned above. Using pressure and temperature measurements taken by the system, the volume of methane was automatically observed by the device and recorded by the software. In each bioreactor, the volume of the inoculum was 300 mL, and the doses of biowaste were identical, 1.7 g DM, which ensured adjusted initial organic loading rates (OLR) of 5 kg OM/m3 (Table 2).
Table 2.
Experimental variants used for the AMPTS II tests; doses of the inoculum, the enzymatic additive, and biowaste are given.
To determine the physicochemical properties of the mixture of inoculum and biowaste without interruption of methane production (as in the AMPTS), additional bioreactors were prepared in the same manner as those prepared for AMPTS. Seven of these bioreactors were prepared for each variant. In the bioreactors, the weight of the inoculum and the biowaste were 150 mL and 0.85 g, respectively, to ensure the same inoculum and biowaste ratio and the same initial OLR of 5 kg OM/m3 as in the AMPTS bioreactors.
2.4. Kinetics Model
Anaerobic methane production (MP) can be assumed to follow pseudo-first-order kinetics, and thus, MP can be described with the Equation (1):
where:
- Ct,CH4 (NL/kg DM; NL/kg OM) is the cumulative MP at digestion time t (days);
- C0,CH4 (NL/kg DM; NL/kg OM) is the maximal MP;
- kCH4 (d−1) is the kinetic coefficient of MP.
The rate of MP (rCH4 in NL/(kg DM·d) or NL/(kg OM·d)) is the product of kCH4 and C0,CH4.
The removal of OM (in I+BWT, I+BHT, and I+BE) follows first-order kinetics according to this Equation (2):
where:
- Ct,OM (% DM) is the OM content at digestion time t (days);
- C0,OM (% DM) is the OM removed during the period of digestion;
- C1,OM (% DM) is the final OM content;
- kOM (d−1) is the kinetic coefficient of the OM removal.
The rate of OM removal (rOM in % DM/d) is the product of kOM and C0,OM.
The concentration of dissolved organic compounds (expressed as COD, DCOD) was calculated by subtracting the DCOD concentration in the supernatant of I only from that in the supernatants of I+BWT, I+BHT, and I+BE (separately for each). For this, in the latter part of the manuscript, the following statement was used: DCOD concentration in the supernatant of BWT or BHT or BE.
The DCOD removal follows first-order kinetics, as given in this Equation (3):
where:
- Ct,DCOD (mg COD/L) is the DCOD concentration at digestion time t (days);
- C0,DCOD (mg COD/L) is the DCOD removed during the period of digestion;
- C1,DCOD (mg COD/L) is the final DCOD concentration;
- kDCOD (d−1) is the kinetic coefficient of DCOD removal.
The rate of DCOD removal (rDCOD in mg/(L·d)) is the product of kDCOD and C0,DCOD.
The values of C0,CH4, C0,DCOD, C0,OM and kCH4, kDCOD, kOM were obtained by non-linear regression analysis with Statistica software, version 13.3 (StatSoft 13.3).
2.5. Energetic Effectiveness of Methane Production
The energy obtained from methane production (ECH4) was calculated according to the following Equation (4):
where:
ECH4 = YCH4 × CVCH4
- YCH4 (NL/kg) is methane yield obtained in the present study;
- CVCH4 (Wh/NL) is methane calorific value (9.17 Wh/NL) [26,27].
2.6. Analytical Procedures
To characterize the fresh biowaste used in the experiment, the contents of moisture and of DM were determined at 105 °C. In the ground biowaste and the inoculum, the moisture content, DM content, and organic matter content OM (%DM) as loss after ignition (at 550 °C) were determined. In the water extract from the biowaste (before and after filtration), dry residue (DR) after evaporation in the water bath then after drying at 105 °C and organic residue (OR) at 550 °C, as loss after ignition, were determined. In the water extract from the biowaste after filtration, the following characteristics were determined: COD (with potassium dichromate), VFA, TN and N-NH4 (distillation method with titration), P-PO4 (spectrophotometric method with a use of ammonium molybdate), pH (TitroLine 6000), and alkalinity (TA) (titration to pH 4.5 using a device of TitroLine 6000). Every 2–4 days during the 30 days of methane fermentation, samples from the additional bioreactors (mentioned above) were taken to determine, in the whole sample, the contents of DM and OM, whereas in the supernatant pH, TA, DCOD, VFA, N-NH4, and P-PO4 were determined. All analyses were determined according to standard methods [28].
3. Results and Discussion
3.1. Conditions during the Measurements of Methane Production from BWT, BHT, and BE
The pH and TA are essential characteristics of anaerobic digestion that should be monitored during the process. These characteristics influence the performance and growth of the various microorganisms involved in the different stages of the fermentation process. Therefore, for highly effective methane production, the pH needs to be maintained in the desired range (7–8.5). In the present study, it was maintained by feeding the bioreactors at an OLR of 5 kg OM/m3 which did not disturb the process. Figure 1 shows the pH and TA in the supernatants from all variants of the experiment: I, I+BWT, I+BHT, and I+BE.
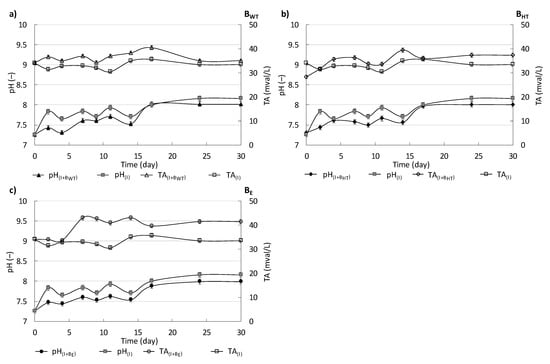
Figure 1.
pH and TA in the supernatant from I, I+BWT, I+BE, and I+BHT during the measurements of methane production from BWT (a), BHT (b) and BE (c).
The pH values in the supernatants from the variants with biowaste were slightly lower than that in the supernatant from I. Generally, a slight increase in pH values in all variants was observed during measurements. In contrast, the TA values in the supernatants from variants with the addition of biowaste were higher than that in the supernatant from I. During the 30 days of measurement, with the dosage of 150 mL of inoculum and 0.85 g of biowaste and at the initial load of 5 kg OM/m3, the pH in the supernatant from I, I+BWT, I+BHT, and I+BE ranged from 7.26 ± 0.20 to 8.02 ± 0.20 and the alkalinity (TA) ranged from 30.00 ± 1.50 mval/L to 42.00 ± 1.50 mval/L.
Figure 2 shows the concentrations of P-PO4 (Figure 2a–c) and N-NH4 (Figure 2d–f) in the supernatant from I, I+BWT, I+BE, and I+BHT during the measurements of methane production. As was mentioned (Section 2), the N-NH4 and P-PO4 concentrations of the water extract from the biowaste did not affect the concentrations of these parameters much.
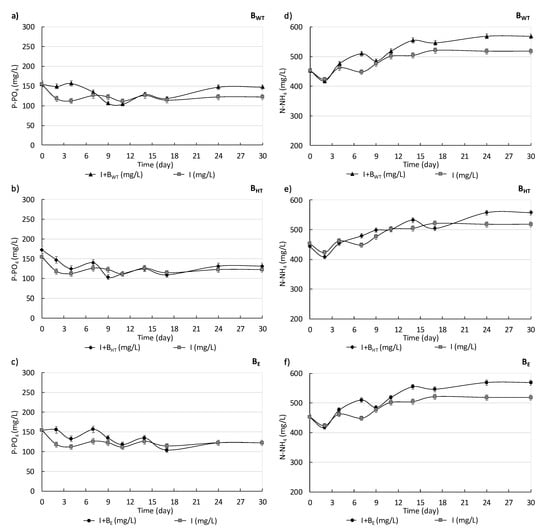
Figure 2.
P-PO4 (a–c) and N-NH4 (d–f) concentrations in supernatants from I, I+BWT, I+BE, and I+BHT during the measurements of methane production.
At the beginning of the measurements, the P-PO4 concentrations from I, I+BWT, and I+BE equaled 150.50 ± 1.75 mg/L. The P-PO4 concentrations of I, I+BWT, I+BHT, and I+BE remained at the same value from the 9th day to the 17th day. On the last day, the P-PO4 concentrations from I, I+BWT, I+BHT, and I+BE were 122.20 ± 1.36 mg/L, 147.60 ± 1.70 mg/L, 131.20 ± 1.25 mg/L, and 122.50 ± 1.25 mg/L, respectively (Figure 2a–c).
Generally, the N-NH4 concentrations of I, I+BWT, and I+BE increased during the first 17 days. The N-NH4 concentration of I was the lowest during the time of measuring. It was 453.50 ± 2.80 mg/L initially and then did not change until the final day (520.60 ± 2.90 mg/L). In the case of I+BWT, the concentration increased slightly until the 24th day, and on the final day, the value reached its highest value (568.20 ± 3.10 mg/L). The N-NH4 concentration of I+BHT on the first day was lower than that in I (443.40 ± 2.40 mg/L). The N-NH4 concentration on the final day reached its peak of 557.50 ± 2.60 mg/L. In the first 10 days, the N-NH4 concentration of I+BE and I were at about the same value. Over the next days, the N-NH4 concentration of I+BE increased slightly more than that of I. Then, the concentration in I+BE was only slightly higher than that of I on the last day (Figure 2d–f).
In the case of a BMP test, the use of inoculum is necessary. Mostly, the inoculum constitutes fermented sludge or any other fermented material from the AD chamber that provides fermentative microorganisms which initiate anaerobic biodegradation with methane production. According to BMP test methodology, the inoculum should be used in excess, and the dosage of the substrate should be assumed to obtain the adjusted OLR. This means that the dosage of organic substrate, for which methane potential is measured, is low in comparison to the dosage of the inoculum. This also means that the characteristics of the inoculum (for example, pH or TA and other physicochemical parameters) determine the conditions during anaerobic degradation. This is the appropriate approach because it means the appropriate conditions for MP from the tested substrates. In the present study, the values of pH, the alkalinity, or the concentrations of ammonium or orthophosphate in the variants with the addition of biowaste were similar to those in the inoculum only.
The same relationship was also found in a previous study by Bernat et al. [29]. During measurements of the biogas potential of organic substrates with the use of a BMP test, the authors found that the pH remained stable at about 7.70 ± 0.20 and TA ranged from 45.50 ± 2.30 to 62.50 ± 2.40 mval/L in a solution with an inoculum dose of 100 g and a starting load of 5 kg OM/m3. The obtained values resulted from the use of inoculum with specific characteristics.
3.2. Kinetic Parameters of Methane Production, DCOD and OM Removal
The results expressed in NL were recalculated to express methane production based on the biowaste’s OM and DM content. Changes in methane production are presented in Figure 3. Overall, the changes in the profiles of methane volume were similar with BHT, BE, and BWT. In all cases, methane was produced very intensively in the first days of anaerobic digestion. Then, the production rose slightly, and finally it plateaued. After the first few days, over 80% of the total methane production had been achieved, and the maximum cumulative methane production was reached by the 15th day.
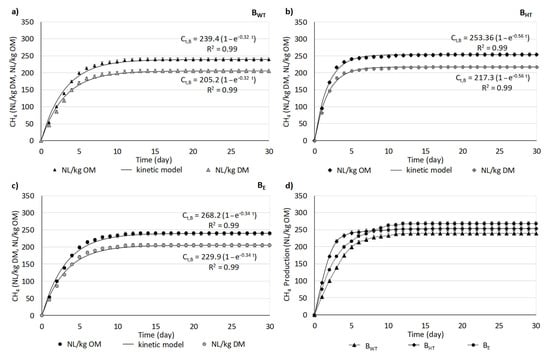
Figure 3.
Changes in methane production during measurements. Pseudo-first-order kinetic models for methane production are provided (a–c); the average methane volume from BHT, BE, and BWT (d).
Figure 3d shows a comparison of the values of methane production between BHT, BE, and BWT over 30 days. In general, the methane production differed between the three variants: BE was the highest value, ca. 270 NL CH4/kg OM, BHT was 253.60 ± 0.83 NL CH4/kg OM, and BWT was the lowest value of 239.40 ± 1.27 NL CH4/kg OM. However, from the analyses of the curve of methane production from BHT, it can be found that methane was produced very intensively during the first five days. This is because the higher the availability of organic compounds, especially in dissolved form (as it was noted in the variant with HT pre-treatment of biowaste), the higher the methane production. The methane production from BE increased more slowly, but it surpassed that of BHT from day 8, and finally achieved the highest value.
In a study by Heo et al. [30], the methane production from food waste (FW) (with an OM concentration 18% DM) during 40 days at a mesophilic temperature (35 °C) with an OLR of 2.43 kg OM/m3 was 489 L/kg OM. This FW consisted of boiled rice (10–15%), vegetables (65–70%), and meat and eggs (15–20%) and was crushed to a size of 2–4 mm. The methane production in that study was also higher than what was obtained in the present study. However, it should be emphasized that, in the study by Heo et al. [30], the FW was prepared in laboratory conditions and contained only highly biodegradable components. In the present study, real biowaste was used, which was collected in containers for separate collection in the city; this biowaste may have contained not only highly biodegradable components but also components that are less degradable like lignocellulosic compounds. In contrast, Suhartini et al. [31] estimated low biogas potential (166–191 L/kg VS) despite the use of similar organic substrates (food waste with more than 96% of vs. in TS, and the mixture (50:50) of food waste and tofu solid waste/dreg waste).
Our results indicate that pre-treatment improved methane production. Moreover, comparing the two methods of pre-treatment, biowaste with the enzymatic additive produced more methane than biowaste after hydrothermal treatment. An increase in biogas/methane production with pre-treated substrates was also demonstrated in previous studies [32,33]. The pre-treatment process improves the disintegration of material and, therefore, accelerates biodegradation during anaerobic digestion, increasing methane yield [16,17,18,19,32,33].
In the present study, it was found that not only was methane production from BE higher than from BWT, but also that it was produced faster from BE than from BWT. Bochmann et al. [34] indicated that enzymatic pre-treatment promoted hydrolysis of lignocellulosic materials which can be a limiting step in anaerobic degradation. The enzymatic pre-treatment causes a breaking down of lignocellulosic materials into lower molecular weight materials, and thus increases their biodegradability. The authors found that enzyme application to spent grain increased its solubility, biogas production, and the quality of the biogas. Dubrovskis et al. [35] used Alpha-amylase enzyme (protein enzyme that hydrolyses polysaccharides, e.g., starch and glycogen, yielding glucose and maltose) to assess the impact of enzymatic pre-treatment on methane production from two plant substrates differing in their methane productivity (pellets from lucerne and birch leaves with 401 and 214 L/g OM, respectively). In both cases, the addition of Alpha-amylase enzyme caused ca. 20% increase in MP.
Bonilla et al. [36] used enzymes to enhance the anaerobic digestibility of biosludge produced during wastewater treatment processes in pulp and paper mills. The biosludge characterized low methane yields and was considered as hardly biodegradable under anaerobic conditions due to the complexity and resistance [37]. Four out of the six enzymes tested by Bonilla et al. [36] improved biogas production from biosludge. A maximum improvement of 26% in biogas yield was observed with protease from Bacillus licheniformis.
Yin et al. [38] used the fungal mash, rich in hydrolytic enzymes originated form Aspergillus awamori, for enzymatic pre-treatment of sewage sludge, food waste, and their mixture. The pre-treatment (hydrolysis step) lasted 24 h at 60 °C. The authors showed the soluble organic compounds (expressed as COD) concentrations released from activated sludge, food waste, and their mixture and the concentrations were as follows 3470.5 ± 344.3 mg/L, 6853.8 ± 223.7 mg/L, and 7650.0 ± 831.0 mg/L, respectively. Methane production with these substrates was 367, 817, and 600 L/g VS, and was 52, 34, and 45% higher than without enzymatic pre-treatment.
In the present study, methane production from biowaste during anaerobic fermentation was accompanied by the removal of the organic compounds from the substrate (expressed as DCOD and OM content). Generally, only the DCOD concentration in the supernatant of I remained at almost the same level throughout the entire time of measurements (ranging from 551 ± 32 to 497 ± 22 mg/L). As mentioned in the Materials and Methods, the COD concentration of the water extract from biowaste was very high (23,400 ± 5.74 mg/L). Thus, the addition of biowaste into the inoculum increased its DCOD concentration. As a result, the DCOD concentrations in the supernatant of I+BWT, I+BHT, and I+BE were higher than that of the supernatant of I, and it decreased moderately during the first days. The changes in the concentrations of DCOD with BWT, BHT, and BE are shown in Figure 4a–c. The initial DCOD concentration with BWT was 1062 ± 3.48 mg/L and was the lowest of all three variants. The DCOD concentration with BHT reached a peak on the starting day at 1352 ± 4.62 mg/L, and this value was highest among all variants. HT pre-treatment caused organics release from the biowaste, and thus increased DCOD concentration. In the case of BE, DCOD concentration peaked already after 2 days. This indicates that organics were probably released in time from the biowaste due to the use of the enzymatic additive.
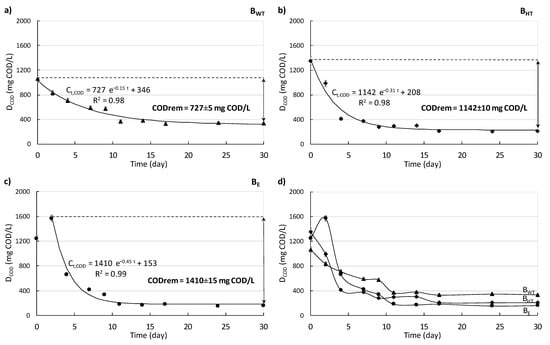
Figure 4.
Changes in the DCOD concentrations with BWT, BHT, and BE. First-order kinetic models (black lines) for DCOD removal are provided on (a–c), the changes in DCOD concentration from BHT, BE, and BWT (d).
The initial intensive decrease in DCOD content with BWT, BHT, and BE was associated with intensive daily methane production. The DCOD concentration with BWT decreased moderately from 1062.50 ± 6.40 mg COD/L to a value over 800.50 ± 5.90 mg COD/L in the first 2 days. Then, it remained at values above 340.00 ± 4.90 mg COD/L until day 30. Similarly, the DCOD concentration with BHT dropped rapidly in the first 5 days (from 1350.50 ± 14.60 to 400.20 ± 5.20 mg COD/L), after which it decreased only slightly to 210.20 ± 2.40 mg COD/L. In contrast, the concentration of DCOD with BE peaked at 1570.50 ± 17.30 mg COD/L after 2 days, and then the concentration decreased significantly to a value of about 180.40 ± 2.60 mg COD/L on day 12. After this, it remained stable until the end of the process. However, at the end of the process, the DCOD concentration with BWT was the highest (335.00 ± 4.20 mg COD/L), and the DCOD concentration with BE was the lowest (160.50 ± 1.50 mg COD/L). This means that considering the initial and final DCOD concentration, the amount of dissolved COD that was removed was lowest in case of BWT and highest in case of BE (Figure 4a–c).
Figure 5a–c shows the changes in the organic matter (OM) content in I only, I+BWT, I+BHT, and I+BE. Due to the addition of biowaste into the inoculum at the beginning of the experiment, the OM content in I+BWT, I+BHT, and I+BE peaked at ca. 74% DM. During measurements, the OM content in I+BWT decreased intensively during the first 7 days to 66.60 ± 0.50% DM, and then it only decreased slightly by the 18th day when it reached ca. 65% DM. In I+BWT, during the measurements of methane production, the overall removal of OM content was 8.68 ± 0.10% DM. However, with the pre-treatment step, the OM content in I+BHT decreased sharply during the first 4 days from ca. 74% DM to 66 ± 1.50% DM. In contrast, the OM content in I+BE decreased to 65.20 ± 1.23% DM over 7 days. On the 11th day of the experiment, the OM content in I+BE reached a value similar to that in I (ca. 64% DM) and remained at about the same level as in I until the end of the measurements.
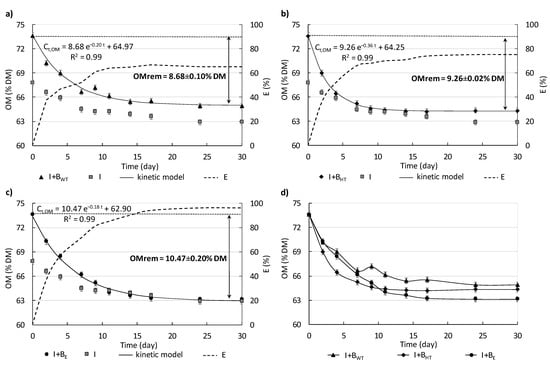
Figure 5.
Changes in the OM content in I+BWT, I+BHT, and I+BE. First-order kinetic models for OM removal are provided (a–c) (arrows show the amount of OM removed). The dotted line refers to the effectiveness of OM removal (E), taking into consideration that 100% effectiveness of OM removal is when OM content in the I+BWT, I+BHT, and I+BE would equal OM content in I. The changes in OM content from I+BWT, I+BHT, and I+BE (d).
The OM removed from I+BE was the highest, around 11% DM, 20% higher than the amount removed from BWT, and 13% higher than the amount removed from BHT (Figure 5a–c). The use of the pre-treatment prior to AD of biowaste also affected the effectiveness of OM removal. It was assumed that 100% effectiveness of OM removal is when OM content in the I+BWT, I+BHT, and I+BE would equal OM content in variant with I only. Thus, the highest efficiency of OM removal, more than 95%, was found with the enzymatic additive. The highest effectiveness of OM removal and, consequently, the lowest final content of OM with BE means that in this case the organics were degraded most efficiently. In turn, it may mean that in technological scale more stable digestate can be obtained.
The summary of the kinetic parameters of MP, DCOD and OM removal were provided in Figure 6a–c. The first-order kinetic model accounted for nearly all of the variation in methane production during the anaerobic digestion of biowaste (R2 > 0.98) (Figure 3a–c). The maximal MP from BWT was equal to 239.4 ± 1.27 NL/kg OM. In this variant, the kinetic coefficient of MP (kCH4) and the initial MP rate (rCH4) were lowest, 0.32 ± 0.02 d−1 and 76.8 ± 1.10 NL/(kg OM·d). The use of the pre-treatment step prior to AD affected both (i) the maximal MP and (ii) the kinetic parameters of MP. After HT pre-treatment, the maximal MP of BHT was 6% higher than that of BWT. However, when enzymatic additives were added to the biowaste, the maximal MP from BE was the highest.
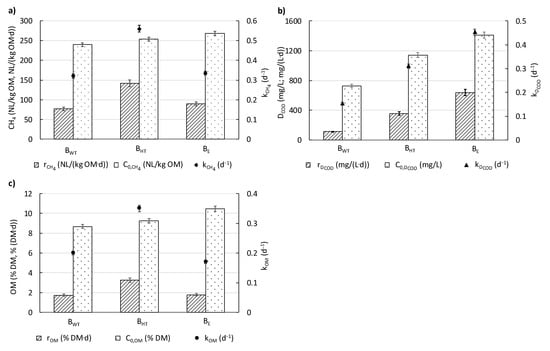
Figure 6.
The kinetic parameters of (a) MP, (b) DCOD removal, and (c) OM removal.
Taking into consideration kinetic parameters, the kinetic coefficient of MP (kCH4) from BHT was higher than that of BWT and BE (0.56 ± 0.02 vs. 0.32 ± 0.02 and 0.34 ± 0.02 d−1). Furthermore, the initial methane production rate (rCH4) was highest for BHT at 141.8 ± 1.2 NL/(kg OM·d) (Figure 6a). As mentioned, the use of biowaste after HT pre-treatment increased the initial dissolved organics in the highest extent. This means that just from the beginning of the measurements, the organic dissolved substances were easily available for microorganisms for methane production. The use of the pre-treatment step prior to AD of biowaste affected both (i) the amount of DCOD and OM that was removed during the period of digestion and (ii) the kinetics of DCOD and OM removal (Figure 6b). The changes in DCOD concentration and OM content during AD were described with a first-order kinetic model, which appeared to explain these changes well (R2 values of 0.99) (Figure 4 and Figure 5). In the case of BWT, the DCOD removed during digestion was the lowest, equaled to 727.50 ± 5.00 mg/L. The kinetic parameters were also the lowest. The kinetic coefficient of DCOD removal (kDCOD) was 0.15 ± 0.01 d−1, whereas the rate of organic compound removal (rDCOD) was 112.00 ± 6.30 mg/(L·d). After HT pre-treatment, the DCOD concentration removed was 57% higher than with BWT. Moreover, with the enzymatic additive, the DCOD concentration removed was the highest (1410.00 ± 25.00 mg COD/L). For BHT and BE, the kinetic coefficients of DCOD removal (kDCOD) were 0.31 ± 0.01 and 0.45 ± 0.01 d−1, and the rates of DCOD removal (rDCOD) were 355.20 ± 4.20 and 638.70 ± 4.30 mg/(L·d), respectively.
In the case of BWT, the OM content removed was the lowest, equalizing to 8.68 ± 0.10% DM. The kinetic coefficient of the removal of OM content (kOM) was 0.20 ± 0.01 d−1, whereas the rate of OM removal (rOM) was 1.74 ± 0.02% DM/d. After HT pre-treatment, the OM content removed was about 7% higher than without pre-treatment. Moreover, the OM content removed from BE was the highest (10.47 ± 0.20% DM). For BHT and BE, the kinetic coefficients of OM removal were 0.35 ± 0.01 d−1 and 0.17 ± 0.01 d−1, and the rates of OM removal were 3.24 ± 0.02% DM/d and 1.78 ± 0.02% DM/d, respectively (Figure 6c).
The kinetic parameters of methane/biogas production are shown in the literature. However, the kinetic parameters of OM and of DCOD removal have been presented rarely. For example, in our previous study, the kinetic parameters (MP and OM removal) during biodegradation of food waste (FW) and green waste (GW) were determined, but DCOD was not considered [29]. The authors found a lower rate and kinetic coefficient of organic matter removal with green waste (GW) (0.91 ± 0.10 kg VS/(m3·d), 0.36 ± 0.02 d−1) than with FW (2.99 ± 0.10 kg VS/(m3·d), 0.68 ± 0.02 d−1).
3.3. Energy Effectiveness of Methane Production from Biowaste without and after Pre-Treatment
The energy obtained from methane production from BWT was 2195.30 ± 0.10 kWh/ton OM (548.13 ± 0.10 kWh/ton FM) (Table 3). The application of both pre-treatment methods resulted in an increase in the amount of energy gained. A greater increase in energy production of ca. 12% was gained with BE than it was gained with BWT. Regarding hydrothermally pre-treated biowaste energy production, it was more than 5.8% higher than without pre-treatment.
Table 3.
The energy effectiveness of MP from biowaste without and after pre-treatment.
Banks et al. [39] calculated the net energy production from methane produced from food waste (95.5% of source-segregated domestic food waste, 2.9% of commercial food waste from restaurants and local businesses (including a small amount of whey), and 1.6% grass cuttings) at 405 kWh/ton FM. This net recoverable energy considered energy consumption for heating the anaerobic chamber (mesophilic conditions). Suhartini et al. [31] estimated the electricity potential of biogas from food waste, without considering a comprehensive energy balance, at 307.2–473.8 kWh/ton. Despite the high organic matter content in organic substrates, the energy production was much lower than those from the present study.
Demichelis et al. [40] compared energy production from the following types of organic waste: wastewater and sewage sludge, organic fraction of municipal solid waste, waste from agricultural livestock, and waste from the food industry. The authors found that the highest energy productions were obtained with wastes from the food industry, especially dairy waste (12.9–13.6 kWh/kg) and olive and oil waste (11.6 kWh/kg). These high values are related to the high content of proteins and lipids in these kinds of food industry waste.
4. Conclusions
The present study has shown that although separately collected biowaste effectively produced methane, both pre-treatments allowed for obtaining higher MP and a higher rate of MP compared to biowaste without pre-treatment. The highest MP, 268 NL/kg OM, was obtained using the enzymatic additive (12.1% increase compared to BWT). However, the hydrothermal pre-treatment had a greater effect on the kinetic parameters of MP (1.75-fold increase in the kinetic coefficient of MP and 1.85-fold increase in the rate of MP compared to BWT). The biowaste pre-treatments also affected the effectiveness of dissolved organics and organic matter removal, as well as the kinetic parameters of these processes. The enzymatic additive gave the highest effectiveness of OM removal and, in turn, the lowest final OM content in the digestate. Both the highest MP and the lowest OM content in the digestate mean that the enzymatic additive was most efficient in utilizing the organic matter in the biowaste.
Author Contributions
Conceptualization, K.B. and D.K.; methodology, K.B. and M.Z.; formal analysis, K.B. and D.K.; validation, M.Z. and T.C.T.L.; investigation, K.B., M.Z. and T.C.T.L.; resources, M.Z. and K.B.; data curation, M.Z. and T.C.T.L.; writing—original draft preparation, K.B., D.K., M.Z. and T.C.T.L.; visualization, T.C.T.L. and K.B.; supervision, K.B. and D.K.; funding acquisition, K.B. and D.K. All authors have read and agreed to the published version of the manuscript.
Funding
We are grateful for the financial support of the Ministry of Education and Science, Poland (statutory project No. 29.610.024-110). Linguistic verification of the paper was financed from the Project supported by the Minister of Education and Science under the program entitled “Regional Initiative of Excellence” for the years 2019–2023, Project No. 010/RID/2018/19, amount of funding 12.000.000 PLN.
Data Availability Statement
Not applicable.
Conflicts of Interest
The authors declare no conflict of interest.
References
- European Commission. 2008 Directive 2008/98/EC on Waste (Waste Framework Directive)—Environment; European Commission: Brussels, Belgium, 2008.
- European Union. Council Directive 1999/31/EC of 26 April 1999 on the Landfill of Waste. Off. J. Eur. Union 1999, 182, 1–19. [Google Scholar]
- Bayard, R.; Benbelkacem, H.; Gourdon, R.; Buffiere, P. Characterization of selected municipal solid waste components to estimate their biodegradability. J. Environ. Manag. 2018, 216, 4–12. [Google Scholar] [CrossRef]
- Bernat, K.; Wojnowska-Baryła, I.; Kamińska, A.; Zaborowska, M. Towards a circular economy for stabilized residual from organic municipal solid waste processed at an MBT installation—The potential of SR recycling and recovery. Desalination Water Treat. 2021, 244, 63–76. [Google Scholar] [CrossRef]
- Bernat, K.; Zaborowska, M.; Wojnowska-Baryła, I.; Samul, I. Insight into the composition of the stabilized residual from a full-scale mechanical-biological treatment (MBT) plant in terms of the potential recycling and recovery of its contaminants. Sustainability 2021, 13, 5432. [Google Scholar] [CrossRef]
- Jędrczak, A.; den Boer, E.; Kamińska-Borak, J.; Kozłowska, B.; Szpadt, R.; Mierzwiński, A.; Krzyśków, A.; Kundegórski, M. Analysis of Waste Management Costs—Assessment of Investment Needs in the Country in the Field of Waste Prevention and Waste Management in Connection with the New EU Financial Perspective 2021–2027; Unpublished Report; IOŚ-PIB, NFOŚiGW: Warsaw, Poland, 2020. (In Polish)
- Połomka, J.; Jędrczak, A. Efficiency of waste processing in the MBT system. Waste Manag. 2019, 96, 9–14. [Google Scholar] [CrossRef]
- European Union. Directive (EU) 2018/850 of the European Parliament and of the Council of 30 May 2018 Amending Directive 1999/31/EC on the Landfill of Waste (Text with EEA Relevance). Off. J. Eur. Union 2018, 150, 100–108. [Google Scholar]
- European Commission. Communication from the Commission to the European Parliament, the Council, the European Economic and Social Committee and the Committee of the Regions—Closing the Loop—An EU Action Plan for the Circular Economy (COM(2015) 614 Final). 2015. Available online: https://eur-lex.europa.eu/legal-content/EN/TXT/?uri=CELEX%3A52015DC0614 (accessed on 24 January 2023).
- EEA. Waste Recycling in Europe. 2021. Available online: https://www.eea.europa.eu/ims/waste-recycling-in-europe (accessed on 16 December 2022).
- Mata-Alvares, J. Biomethanization of the Organic Fraction of Municipal Solid Wastes; IWA Publishing: Barcelona, Spain, 2003. [Google Scholar]
- Xiao, H.; Zhang, A.; Tang, Z.; Li, Z.; Guo, H.; Niu, X.; Li, L. Comparative environmental and economic life cycle assessment of dry and wet anaerobic digestion for treating food waste and biogas digestate. J. Clean. Prod. 2022, 338, 130674. [Google Scholar] [CrossRef]
- Duan, N.; Zhang, D.; Khoshnevisan, B.; Kougias, P.G.; Treu, L.; Liu, Z.; Liu, H.; Zhang, Y.; Angelidali, I. Human waste anaerobic digestion as a promising low-carbon strategy: Operating performance, microbial dynamics and environmental footprint. J. Clean. Prod. 2020, 256, 120414. [Google Scholar] [CrossRef]
- Wang, S.; Xu, C.; Song, L.; Zhang, J. Anaerobic digestion of food waste and its microbial consortia: A historical review and future perspectives. Int. J. Environ. Res. Public Health 2022, 19, 9519. [Google Scholar] [CrossRef]
- European Environment Agency (EEA). Biowaste in Europe Turning Challenges into Opportunities; Report No 4/2020; EEA: Copenhagen, Denmark, 2020; ISSN 1977-8449. [CrossRef]
- Shrestha, B.; Hernandez, R.; Fortela, D.L.B.; Sharp, W.; Chistoserdov, A.; Gang, D.; Revellame, E.; Holmes, W.; Zappi, M.E. A review of pretreatment methods to enhance solids reduction during anaerobic digestion of municipal wastewater sludges and the resulting digester performance: Implications to future urban biorefineries. Appl. Sci. 2020, 10, 9141. [Google Scholar] [CrossRef]
- Kang, A.J.; Yuan, Q. Enhanced anaerobic digestion of organic waste. In Solid Waste Management in Rural Areas; IntechOpen: Vienna, Austria, 2017. [Google Scholar] [CrossRef]
- Kamperidou, V.; Terzopoulou, P. Anaerobic digestion of lignocellulosic waste materials. Sustainability 2021, 13, 12810. [Google Scholar] [CrossRef]
- Karthikeyan, O.; Trably, E.; Mehariya, S.; Bernet, N.; Wong, J.W.C.; Carrere, H. Pretreatment of food waste for methane and hydrogen recovery: A view. Bioresour. Technol. 2018, 249, 1025–1039. [Google Scholar] [CrossRef] [PubMed]
- Sills, D.L.; Gossett, J.M. Assessment of commercial hemicellulases for saccharification of alkaline pretreated perennial biomass. Bioresour. Technol. 2011, 102, 1389–1398. [Google Scholar] [CrossRef] [PubMed]
- Ibrahim, M.M.; El-Zawawy, W.K.; Abdel-Fattah, Y.R.; Soliman, N.A.; Agblevor, F.A. Comparison of alkaline pulping with steam explosion for glucose production from rice straw. Carbohydr. Polym. 2011, 83, 720–726. [Google Scholar] [CrossRef]
- Hendriks, A.T.W.M.; Zeeman, G. Pretreatments to enhance the digestibility of lignocellulosic biomass. Bioresour. Technol. 2009, 100, 10–18. [Google Scholar] [CrossRef]
- Teymouri, F.; Laureano-Perez, L.; Alizadeh, H.; Dale, B.E. Optimization of the ammonia fiber explosion (AFEX) treatment parameters for enzymatic hydrolysis of corn stover. Bioresour. Technol. 2005, 96, 2014–2018. [Google Scholar] [CrossRef]
- Cao, X.; Peng, X.; Sun, S.; Zhong, L.; Wang, S.; Lu, F.; Sun, R. Impact of regeneration process on the crystalline structure and enzymatic hydrolysis of cellulose obtained from ionic liquid. Carbohydr. Polym. 2014, 111, 400–403. [Google Scholar] [CrossRef]
- Sun, S.; Cao, X.; Sun, S.; Xu, F.; Song, X.; Sun, R.C.; Jones, G.L. Improving the enzymatic hydrolysis of thermo-mechanical fiber from Eucalyptus urophylla by a combination of hydrothermal pretreatment and alkali fractionation. Biotechnol. Biofuels 2014, 7, 116. [Google Scholar] [CrossRef]
- Obileke, K.; Makaka, G.; Nwokolo, N.; Meyer, E.L.; Mukumba, P. Economic analysis of biogas production via biogas digester made from composite material. ChemEngineering 2022, 6, 67. [Google Scholar] [CrossRef]
- Czubaszek, R.; Wysocka-Czubaszek, A.; Tyborowski, R. Methane Production Potential from Apple Pomace, Cabbage Leaves, Pumpkin Residue and Walnut Husks. Appl. Sci. 2022, 12, 6128. [Google Scholar] [CrossRef]
- Greenberg, A.E.; Clesceri, L.S.; Eaton, A.D. Standard Methods for the Examination of Water and Wastewater, 18th ed.; American Public Health Association (APHA): Washington, DC, USA, 1992. [Google Scholar]
- Bernat, K.; Cydzik-Kwiatkowska, A.; Zielińska, M.; Wojnowska-Baryła, I.; Wersocka, J. Valorisation of the selectively collected organic fractions of municipal solid waste in anaerobic digestion. Biochem. Eng. J. 2019, 148, 87–96. [Google Scholar] [CrossRef]
- Heo, N.H.; Park, S.C.; Kang, H. Effects of mixture ratio and hydraulic retention time on single-stage anaerobic co-digestion of food waste and waste activated sludge. J. Environ. Sci. Health 2004, 39, 1739–1756. [Google Scholar] [CrossRef]
- Suhartini, S.; Lestari, Y.P.; Nurika, I. Estimation of methane and electricity potential from canteen food waste. In IOP Conference Series: Earth and Environmental Science; IOP Publishing: Bristol, UK, 2019; Volume 230, p. 012075. [Google Scholar] [CrossRef]
- Zhang, S.; Guo, H.; Du, L.; Liang, J.; Lu, X.; Li, N.; Zhang, K. Influence of NaOH and thermal pretreatment on dewatered activated sludge solubilisation and subsequent anaerobic digestion: Focused on high-solid state. Bioresour. Technol. 2015, 185, 171–177. [Google Scholar] [CrossRef] [PubMed]
- Guo, H.; Zhang, S.; Du, L.; Liang, J.; Lu, X. Effects of thermal-alkaline pretreatment on solubilisation and high-solid anaerobic digestion of dewatered activated sludge. Bioresources 2016, 11, 1280–1295. [Google Scholar] [CrossRef]
- Bochmann, G.; Herfellner, T.; Susanto, F.; Kreuter, F.; Pesta, G. Application of enzymes in anaerobic digestion. Water Sci. Technol. 2007, 56, 29–35. [Google Scholar] [CrossRef]
- Dubrovskis, V.; Plume, I.; Straume, I. The production of methane from the straw pellets with addition of enzymes. Agron. Res. 2019, 17, 1591–1598. [Google Scholar] [CrossRef]
- Bonilla, S.; Choolaei, Z.; Meyer, T.; Edwards, E.A.; Yakunin, A.F.; Allen, D.G. Evaluating the effect of enzymatic pretreatment on the anaerobic digestibility of pulp and paper biosludge. Biotechnol. Rep. 2018, 17, 77–85. [Google Scholar] [CrossRef]
- Meyer, T.; Edwards, E.A. Anaerobic digestion of pulp and paper mill wastewater and sludge. Water Res. 2014, 65, 321–349. [Google Scholar] [CrossRef]
- Yin, Y.; Liu, Y.J.; Meng, S.J.; Kiran, E.U.; Liu, Y. Enzymatic pretreatment of activated sludge, food waste and their mixture for enhanced bioenergy recovery and waste volume reduction via anaerobic digestion. Appl. Energy 2016, 179, 1131–1137. [Google Scholar] [CrossRef]
- Banks, C.; Chesshire, M.; Heaven, S.; Arnold, R. Anaerobic digestion of source-segregated domestic food waste: Performance assessment by mass and energy balance. Bioresour. Technol. 2011, 102, 612–620. [Google Scholar] [CrossRef]
- Demichelis, F.; Francesco, P.; Silvia, F. Biowaste Management in Italy: Challenges and Perspectives. Sustainability 2019, 11, 4213. [Google Scholar] [CrossRef]
Disclaimer/Publisher’s Note: The statements, opinions and data contained in all publications are solely those of the individual author(s) and contributor(s) and not of MDPI and/or the editor(s). MDPI and/or the editor(s) disclaim responsibility for any injury to people or property resulting from any ideas, methods, instructions or products referred to in the content. |
© 2023 by the authors. Licensee MDPI, Basel, Switzerland. This article is an open access article distributed under the terms and conditions of the Creative Commons Attribution (CC BY) license (https://creativecommons.org/licenses/by/4.0/).