

Review of Natural Hazard Risks for Wind Farms

1
Structures Department, HNTB Corporation, Cherry Hill, NJ 08002, USA
2
Transportation Department, HNTB Corporation, Parsippany, NJ 07054, USA
3
Structures Department, Stanley D. Lindsey Associates, Brentwood, TN 37027, USA
*
Author to whom correspondence should be addressed.
Energies 2023, 16(3), 1207; https://doi.org/10.3390/en16031207
Submission received: 2 December 2022
/
Revised: 28 December 2022
/
Accepted: 10 January 2023
/
Published: 22 January 2023
(This article belongs to the Section A3: Wind, Wave and Tidal Energy)
Abstract
:Technological advancement in recent years has resulted in larger and taller wind turbines (WTs) with enhanced power generation capacities. Application of natural hazard risk quantification for WTs helps stakeholders plan, design, install, and operate wind farms safely and profitably. This study focuses on a review of the risks to WTs from earthquakes, strong wind, hurricanes, tsunamis, and lightning. The structural failure of the blades, towers, and foundations in response to these hazards was investigated. Furthermore, research from the past few decades covering modes of failures, such as foundation overturning, tower tilting, tower buckling, blade buckling, deformations, and delamination of blades, was investigated. It was found that the methodologies used by researchers include analytical, statistical, and data-based models, as well as experimental research. This study shows that, while seismic, wind, and hurricane risks have been explored with analytical, experimental, and statistical models in the past, future research could focus on the latest methods involving data-based models, integration of monitored data, and physics-based models. Tsunami risk assessment focuses on experimental methods, and future research may benefit from data-integrated models and a focus on the transient nature of the risks.
1. Introduction
Wind energy has become a prominent source of clean, renewable energy and an integral part of the energy portfolio worldwide [1]. The global wind power cumulative capacity has reached 837 GW (Figure 1a) [2]. Wind energy accounts for over 20% of total renewable energy (Figure 1b [2]). The global installed wind power capacity in 2020 was 745 GW [2], and in the United States of America, it was 135.843 GW [3]. There has been an exponential increase in offshore wind turbine (OWT) installations. The installed worldwide OWT capacity reached 54.9 GW in 2022 [4]. The global OWT market outlook seems positive, with average annual growth rates of 18.6% until the year 2024 and then 8.2% up to the end of the 2030. Global offshore wind power is expected to add 20 GW in 2025 and then another 30 GW in 2030 [5]. The global offshore wind capacity increased by 50% in the year 2021 compared to the year 2020 [6]. Major European countries are investing in OWTs and envision generating 150 GW of power through OWTs by 2030 [7]. The World Energy Outlook Report 2016 estimated that the contribution of wind power could meet 22% of the worldwide electricity demand, amounting to 9318 TWh, by the year 2050 [8]. Wind energy output is proportional to the square of the wind velocity. With the advancement of technology, wind turbine heights have increased, making it possible to capture higher winds at a higher elevation.
Thus, wind turbines have become larger, taller, and slenderer. In modern-day utility turbines, almost half the weight of the turbine is usually concentrated at the top of the tower in the form of a nacelle. This geometry and mass distribution, along with the inherent fundamental frequencies, make these modern-day wind turbines more prone to multiple natural hazard risks. Wind turbines are more susceptible to short-duration, high-intensity loads, such as earthquake loads, high-velocity wind loads, and wave forces in the sea. Taller structures are also sensitive to lightning risks, both on land and at sea. Many wind turbine farms are installed in seismically active regions. Although wind turbines may not totally collapse due to the large return period of large-scale earthquakes, they are subject to many short-duration, low-intensity earthquakes. These multiple low-intensity earthquakes can induce irreversible stresses in the body of wind turbine towers. These frequent loads affect the complex assemblies in the nacelle and increase the maintenance operations, adversely affecting the constant power generation. Low-scale and low-intensity aftershocks are risks to the stability of wind turbines. The magnitude 6.4 and 7.1 earthquake that occurred near Ridgecrest, CA, further highlights the need to include earthquake loads in the site-specific analysis and design of wind turbine structures [9]. The 1986 North Palm Spring earthquake damaged a wind turbine due to the buckling of the segmented wind turbine tower [9].
There have been instances of wind turbine failures in the past few decades. Wind turbine failure includes total collapse of wind turbine structure itself and the need for major repairs, replacement, or maintenance. Owing to human and mechanical errors, material defects, inherent weak sections, and accidental load induced by typhoons and windstorms, hundreds of structural collapses have been reported for wind turbines in the recent past [10]. The short-duration, high-velocity winds during hurricanes and typhoons are another major natural risk for wind turbines. Wind turbine failure can include total collapse of the wind turbine and failure of the wind turbine blades. Typhoon Maemi [11], which occurred on 11 September 2003, damaged wind turbines on Miyakojima Island in Japan. The average wind speed was 38.4 m/s (85.89 mph) and the maximum gust was 74.1 m/s (165.75 mph). Elsewhere, a maximum wind speed of 60 m/s (134.21 mph) and maximum gust of 90 m/s (201.32 mph) were reported [11]. Two wind turbines collapsed due to the buckling of the towers, one turbine failed due to damage to the foundation, blades were broken, and the nacelle covers of three other turbines were broken. Chou and Tu [12] performed a failure analysis and risk management study of a wind turbine tower that collapsed in September 2008 during Typhoon Jangmi in Taiwan. The wind turbine tower collapsed due to the buckling of the lower two parts as a result of high-velocity wind loads during the typhoon. Typhoon Usagi made landfall at Shawnie city, China, on 22 September 2013, damaging a wind farm [13,14]. At the wind farm site, the highest wind speed recorded was 54 m/s (120.79 mph). Researchers [13] reported that a 3 s gust wind with high velocity and rapid change in directionality over a short time resulted in the collapse of the wind turbines. Li et al. [15] researched the wind turbine tower failure resulting from the landfall of Typhoon Saomai in Zhejiang, China. The typhoon overturned two turbines and a total of 15 blades were structurally damaged. A wind turbine failed due to foundation overturning as a result of the hurricane load at Ellenstedt, Germany, in 2002 [16]. A wind turbine at Hornslet, Denmark, failed due to uncontrolled blade rotation speeds, resulting in a blade hitting the wind turbine tower, in February 2008 [17]. The wind turbine at Searsburg, VT, USA, failed in 2008 due to excessive blade deflection, with the blade hitting the wind turbine tower [18]. Natural weather conditions combined with extreme event loads were found to be the significant reasons behind wind turbine collapse. Cold weather, along with high-velocity wind, resulted in the bending of a wind turbine tower in Wyoming, Arlington, USA, in 2011 [19]. The wind turbine failures at Fenner Wind Farm, Madison County, NY, in 2009 [20] and in Fayette County, PA, in 2014 [21] are two more examples of wind turbine failures.
Wind turbines have also been found to fail due to mechanical and structural failures. Backstrand and Hurtig [22] studied a tower failure in 2015 in Lemnhult, Sweden. The authors reported that the tower failure occurred due to bolt fatigue resulting from an insufficient pre-tensioning force during construction. The wind turbine tower buckled at 15 m above the ground due to a force imbalance induced by the failure of one of the three blades [23]. A rapid change in the wind direction and lack of synchronization between yaw adjustments resulted in increased crosswind load and torsional vibration, which led to wind turbine failure [15]. Erroneous operations lead to misalignment of the yaw mechanism, resulting in a malfunction in the blades’ movement during pitch adjustment. Increased loads resulting from the locking of blades at an unfavorable pitch position for the cut-off wind speed was found to be the reason behind a few wind turbine failures during Typhoon Maemi [11]. Researchers [24] have investigated the design of an adaptive neuro-fuzzy inference system (ANFIS) as a control technique for the blade pitch control signal. A delay in the control signal transmission can cause an increased load demand in response to rapid wind speeds and directionality fluctuations. Another study [24] discussed the effectiveness and the performance of a proposed controller. Mechanical, electrical, and control system failures also pose threats to wind turbines during operating and idling processes.
With the advancement of technology, although the generation of wind energy has increased, instances of turbine failure have also increased. Figure 2 shows the number of wind turbine accidents per year between 1996 and 2017. As per the report by the CWIF [25], the average number of accidents per year was 23 between 1997 and 2001, 70 between 2002 and 2006, 135 between 2007 and 2011, and 164 between 2012 and 2017 [25]. The data indicate that 375 blade failures accounted for 17.9% of the total number of wind turbine failures, 312 fire events accounted for 14.5%, and 194 structural failures accounted for 9.2%. The various reasons for these failures included lightning strikes, concrete damage, storms and typhoons, blades being struck, faulty welding and failure of connections, braking failures, cracking, and fatigue. The failure of a wind turbine due to the overturning of the foundation because of inadequate ground improvement has been recorded (Figure 3a) [26]. The wind turbines on Miyakojima Island were damaged and failed during Typhoon Maemi in 2003 [27]. Figure 3b [28] shows the wind turbine that collapsed during Typhoon Maemi. The wind turbine at Gilfach Goch, near Bridgend, south Wales, UK, collapsed due to a storm in 2022 [29]. The characteristics of earthquake loads, high-velocity wind loads, and wave loads differ from each other. The concentration of heavy mass at the top of towers in conjunction with their slender structure makes them ideal for failure. Thus, it is essential to analyze wind turbine structures in terms of these diverse types of loads and their combinations.
Given the exponential growth in the share of wind energy in total global energy production, it is necessary to make the wind energy system a more efficient and sustainable solution in terms of resources, such as time and financial cost. The cost of wind turbines ranges between USD 1.3 million and 2.2 million per megawatt. The cost of modern-day utility-scale wind turbines, which are usually 2 to 3 MW, ranges between USD 3 and 4 million [30,31]. Wind turbines are subject to numerous hazard risks, such as earthquakes, high-velocity winds during typhoons and hurricanes, fire, lightning, and mechanical and other operational issues during exceptional weather conditions. Any partial or complete failure in or interruption of power generation will result in huge financial losses for the wind energy operators and owners. Therefore, it is necessary to analyze and quantify the risk resulting from natural hazards to design and develop an economical, safe, and resilient wind energy infrastructure. Careful planning, site-specific analysis, design, and development of wind farms are necessary to ensure efficiency and a profitable service life for wind turbines. Seismic, hurricane, and lightning risk research primarily relies on mathematical models. Experimental research has been undertaken for tsunami risk. It can be observed that earthquake and wind risk research incorporate historical data on hazards to capture event frequency and intensity. Structural behavior is primarily replicated through finite element modeling. Owing to the lateral nature of seismic and wind loads, the responses of WTs to both these loads are similar to a certain extent: failure of the tower and failure of the foundation. Blades are usually designed for higher wind forces and failure of the tower can even occur before blade failure.
2. Materials and Methods
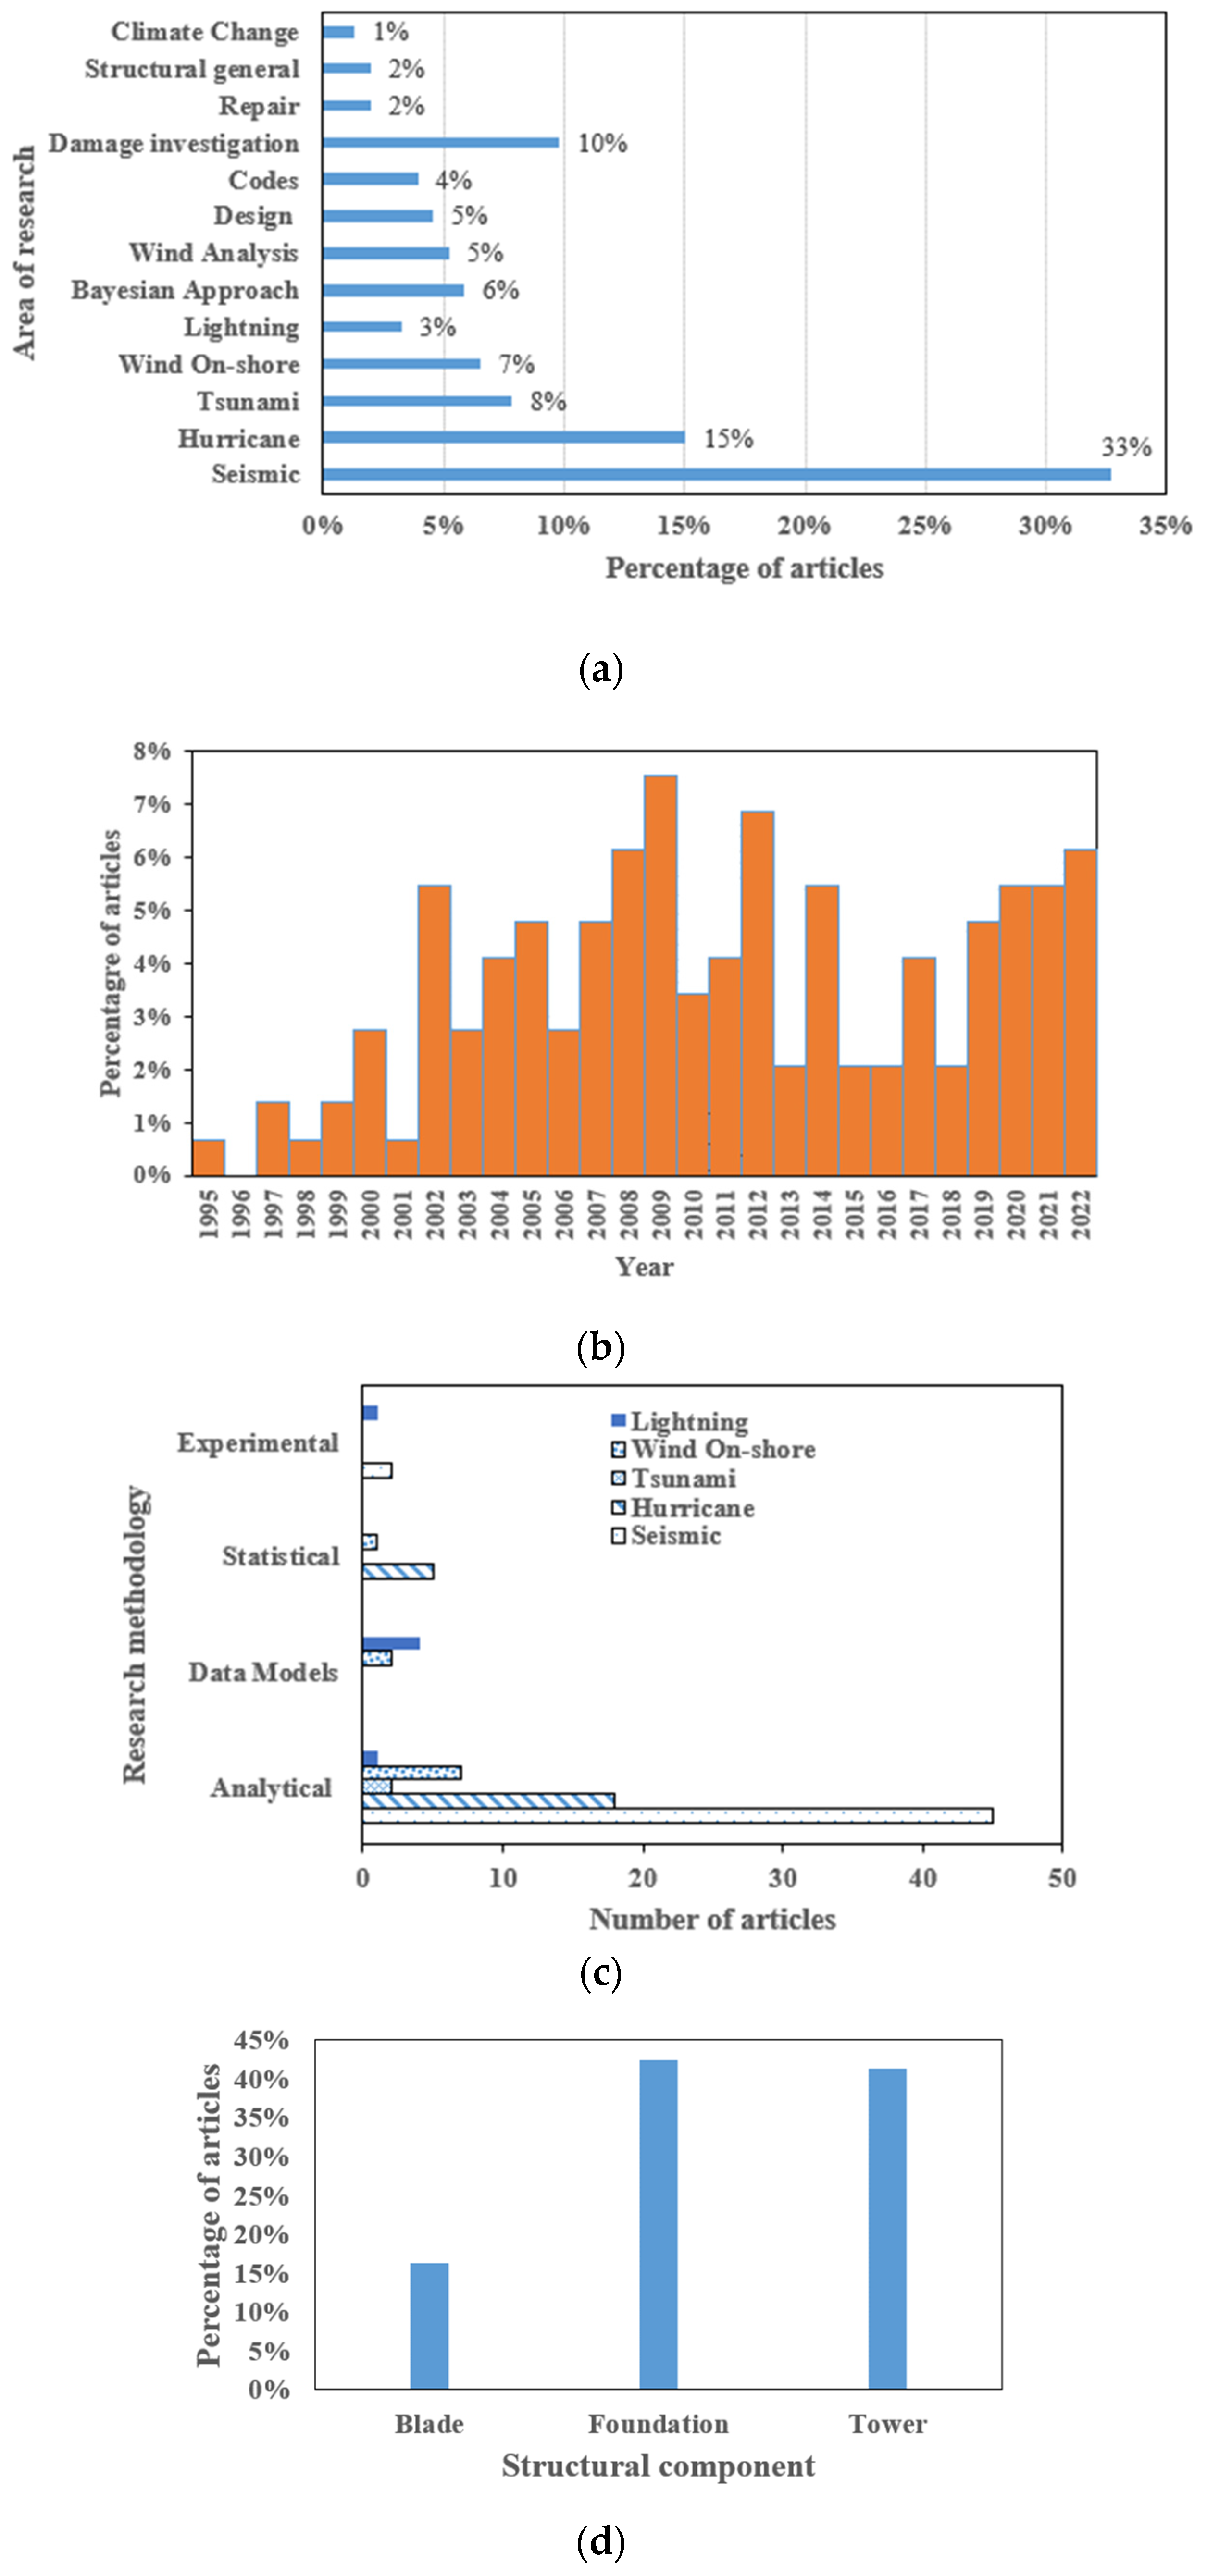
This study reviewed 154 publications that included risk assessments of wind turbine towers subject to natural hazards, structural models (stability under lateral loads and responses of wind turbine towers and large engineering structures), reports from governmental agencies, and mathematical models relevant to hazard risk. Many articles directly related to wind turbines were published between the years 2000 and 2022. The main geographical regions covered in the reviewed articles were North America, Europe, and Asia. While the structures of wind turbines comprise several components, this study focused on wind turbine towers, blades, and foundations they are critical for the structural performance and function of wind turbine towers. Figure 4 provides statistical summaries of the articles that were reviewed in this study. They pertain to the various hazards, the methods used for research, and the approaches employed in these articles, which were published from 1995 to 2022. More than 20% of all the articles reviewed were published between 2019 and 2022.
This study reviewed the risks to wind turbines from major hazards: earthquakes, strong in-land wind, hurricanes, and tsunamis. Hence, these hazards were the main category types in this study. The subcategories used in this study focused on the main vulnerable components: the wind turbine foundations, tower, and blades. Furthermore, the different failure modes of each of these components in response to these hazards were covered.
From a mechanics perspective, in-land earthquake loads affect the stability of foundations and generate large stresses in the tower. Tsunami risks are associated with foundations since the tsunami forces—waves and pulses in the seabed—are directly transferred to the foundations. Hence, a strong correlation can be observed between tsunami research and foundations. Hurricane wind forces and surge waves primarily apply loads to the tower.
In the next section, the results from a detailed examination of each article are presented. These include, for each risk type, which components are affected, the nature of the damage, the prediction methodology utilized, and the findings. This is followed by a conclusion section, where each risk is categorized, and potential future work is identified.
3. Results
3.1. Risks from Earthquakes for Onshore Wind Turbines
While wind farms are becoming more favored, they are challenged by seismic activities, especially when they are in seismic hazard areas. For instance, the 1986 North Palm Springs earthquake and 1992 Northridge earthquake occurred near utility-scale wind turbines [32]. As there is limited research and a lack of specifications for the design of wind turbines, traditional building codes are used, and then seismic analysis is superimposed with the operational turbine load [33]. Wind turbines are costly structures and have considerable subsequent maintenance costs; thus, their performance and failure due to such seismic activities need to be quantified and evaluated. Seismic activities and intensities vary geographically, with some areas exhibiting high-intensity seismic loads; therefore, wind turbines need location-specific designs. The site-specific seismic analysis conducted by Agbayani [34] used seismic loading based on the Uniform Building Code [35]. Typical standards developed by professional organizations and manufacturers focus on overall safety and performance analyses, such as response spectrum analysis and time history analysis [36,37]. Building codes used for the design of wind turbines vary, but they have the objective of minimizing interrupted operations resulting from mechanical components. To ensure normal operations, turbines should satisfy serviceability limit states (SLS) [38], such as for the tilt at the tower top. Another aspect specific to wind turbines is that they have a longer natural period compared to other buildings of the same height. For instance, the mass at the tower top (blades and nacelle) may be larger than the mass of the tower, resulting in a long natural period. Given the differences in the structural characteristics of wind turbine towers and buildings, evaluation of the structural performance of wind turbines is important. The seismic loads can be broadly characterized as near-fault and far-fault loads. The responses of slender structures, such as wind turbine towers, can be expected to differ for near-fault and far-fault seismic activities. The responses of structures to the same loading characteristics have been found to differ based on the characteristics of the structure. Anderson and Bertero [39] studied uncertainties in establishing designs for earthquakes. The authors suggested that the character of a structure has a significant impact on the response characteristics. Near-fault earthquakes, which are characterized by long-duration velocity pulses, result in significantly different responses compared to far-fault earthquakes in the same structure [40]. Hall et al. [41] studied the behavior of buildings in response to simulated high-intensity earthquakes, and Attalla et al. [42] researched the responses of buildings during the 1994 Northridge earthquake to near-fault loads and their directions. The analysis of the response records confirmed that the directionality and high pulse loads resulted in permanent displacements in the buildings. Studies on the drift spectrum have been carried out to measure the demand for earthquake ground motions [43]. Chopra and Chintanapakdee [44] compared the responses of a single-degree-of-freedom system to near-fault and far-fault earthquake motions. Hatzigeorgiou [45] performed research on ductility demand spectra for a single-degree-of-freedom system under near-fault and far-fault seismic loads. Kalkan [46] studied the near-fault forward directivity loading effect on buildings, while Alavi and Krawinkler [47] studied the behavior of moment-resisting frame structures subjected to near-fault earthquake loads. Studies have been performed to quantify the impact of [48] and characterize [49] near-fault ground motions. The relation between the near-fault rupture directivity pulse and earthquake magnitude [50] has been studied and a preliminary model for the acceleration response spectra of near-fault fault-normal ground motion was presented. The research performed by these authors suggests that the critical analysis of loads and their characteristics is essential to evaluate the response and structural performance of structures built in seismic regions. As wind turbines are critical elements of the energy infrastructure, it is necessary to perform an in-depth analysis of the nature and characteristics of seismic activities.
Multiple researchers have proposed and employed various methods to evaluate structures and their performance when subjected to seismic loads. The methods include full-scale model simulation using finite element analysis; experimental methods, such as shake table tests; and mathematical modeling using a probability-based approach. Fragility analysis examines the probability of a system exceeding certain limit states, depending on the constraints on the limit states, under the application of loads such that the system ceases to perform its intended purpose or is deemed to be unfit for the intended purpose. Many computational methods are available to address nonlinear systems, but fragility analysis is more reliable when the load, response, and capacities are uncertain and random. The analytical method [51] and analytical fragility function fitting [52] have been used to evaluate structural performance. Fragility curves have been used to evaluate vulnerability and risk of collapse [53,54]. Damage to moment connections and fragility assessment of building structural system [55,56] has been studied using fragility curves. Various studies evaluating structural performance have used fragility methods. Fragility methods were used to evaluate the response of a light-frame wood construction exposed to strong wind and earthquakes [57]. Nielson and DesRoches [58] used a fragility methodology for highway bridges with a component-level approach. Sousa et al. [59] used fragility methods for loss estimation in relation to earthquakes. Kafali and Grigoriu [60] performed seismic fragility analysis to estimate system fragility as a function of moment magnitude and source-to-site distance, which was referred to as the fragility surface. The fragility functions are usually determined by using the peak ground acceleration (PGA) or spectral acceleration. Nuta et al. [61] used fragility methods to study and evaluate the seismic risk for tubular steel wind turbine towers. Seismic response was studied and evaluated by Prowell et al. by conducting a full-scale shake table test [62]. Bazeos et al. [63] used simplified and finite element models to study and analyze the behavior of wind turbines and performed a comparative assessment of the results obtained for static, seismic, and site-specific loads and operational and survival aerodynamic conditions.
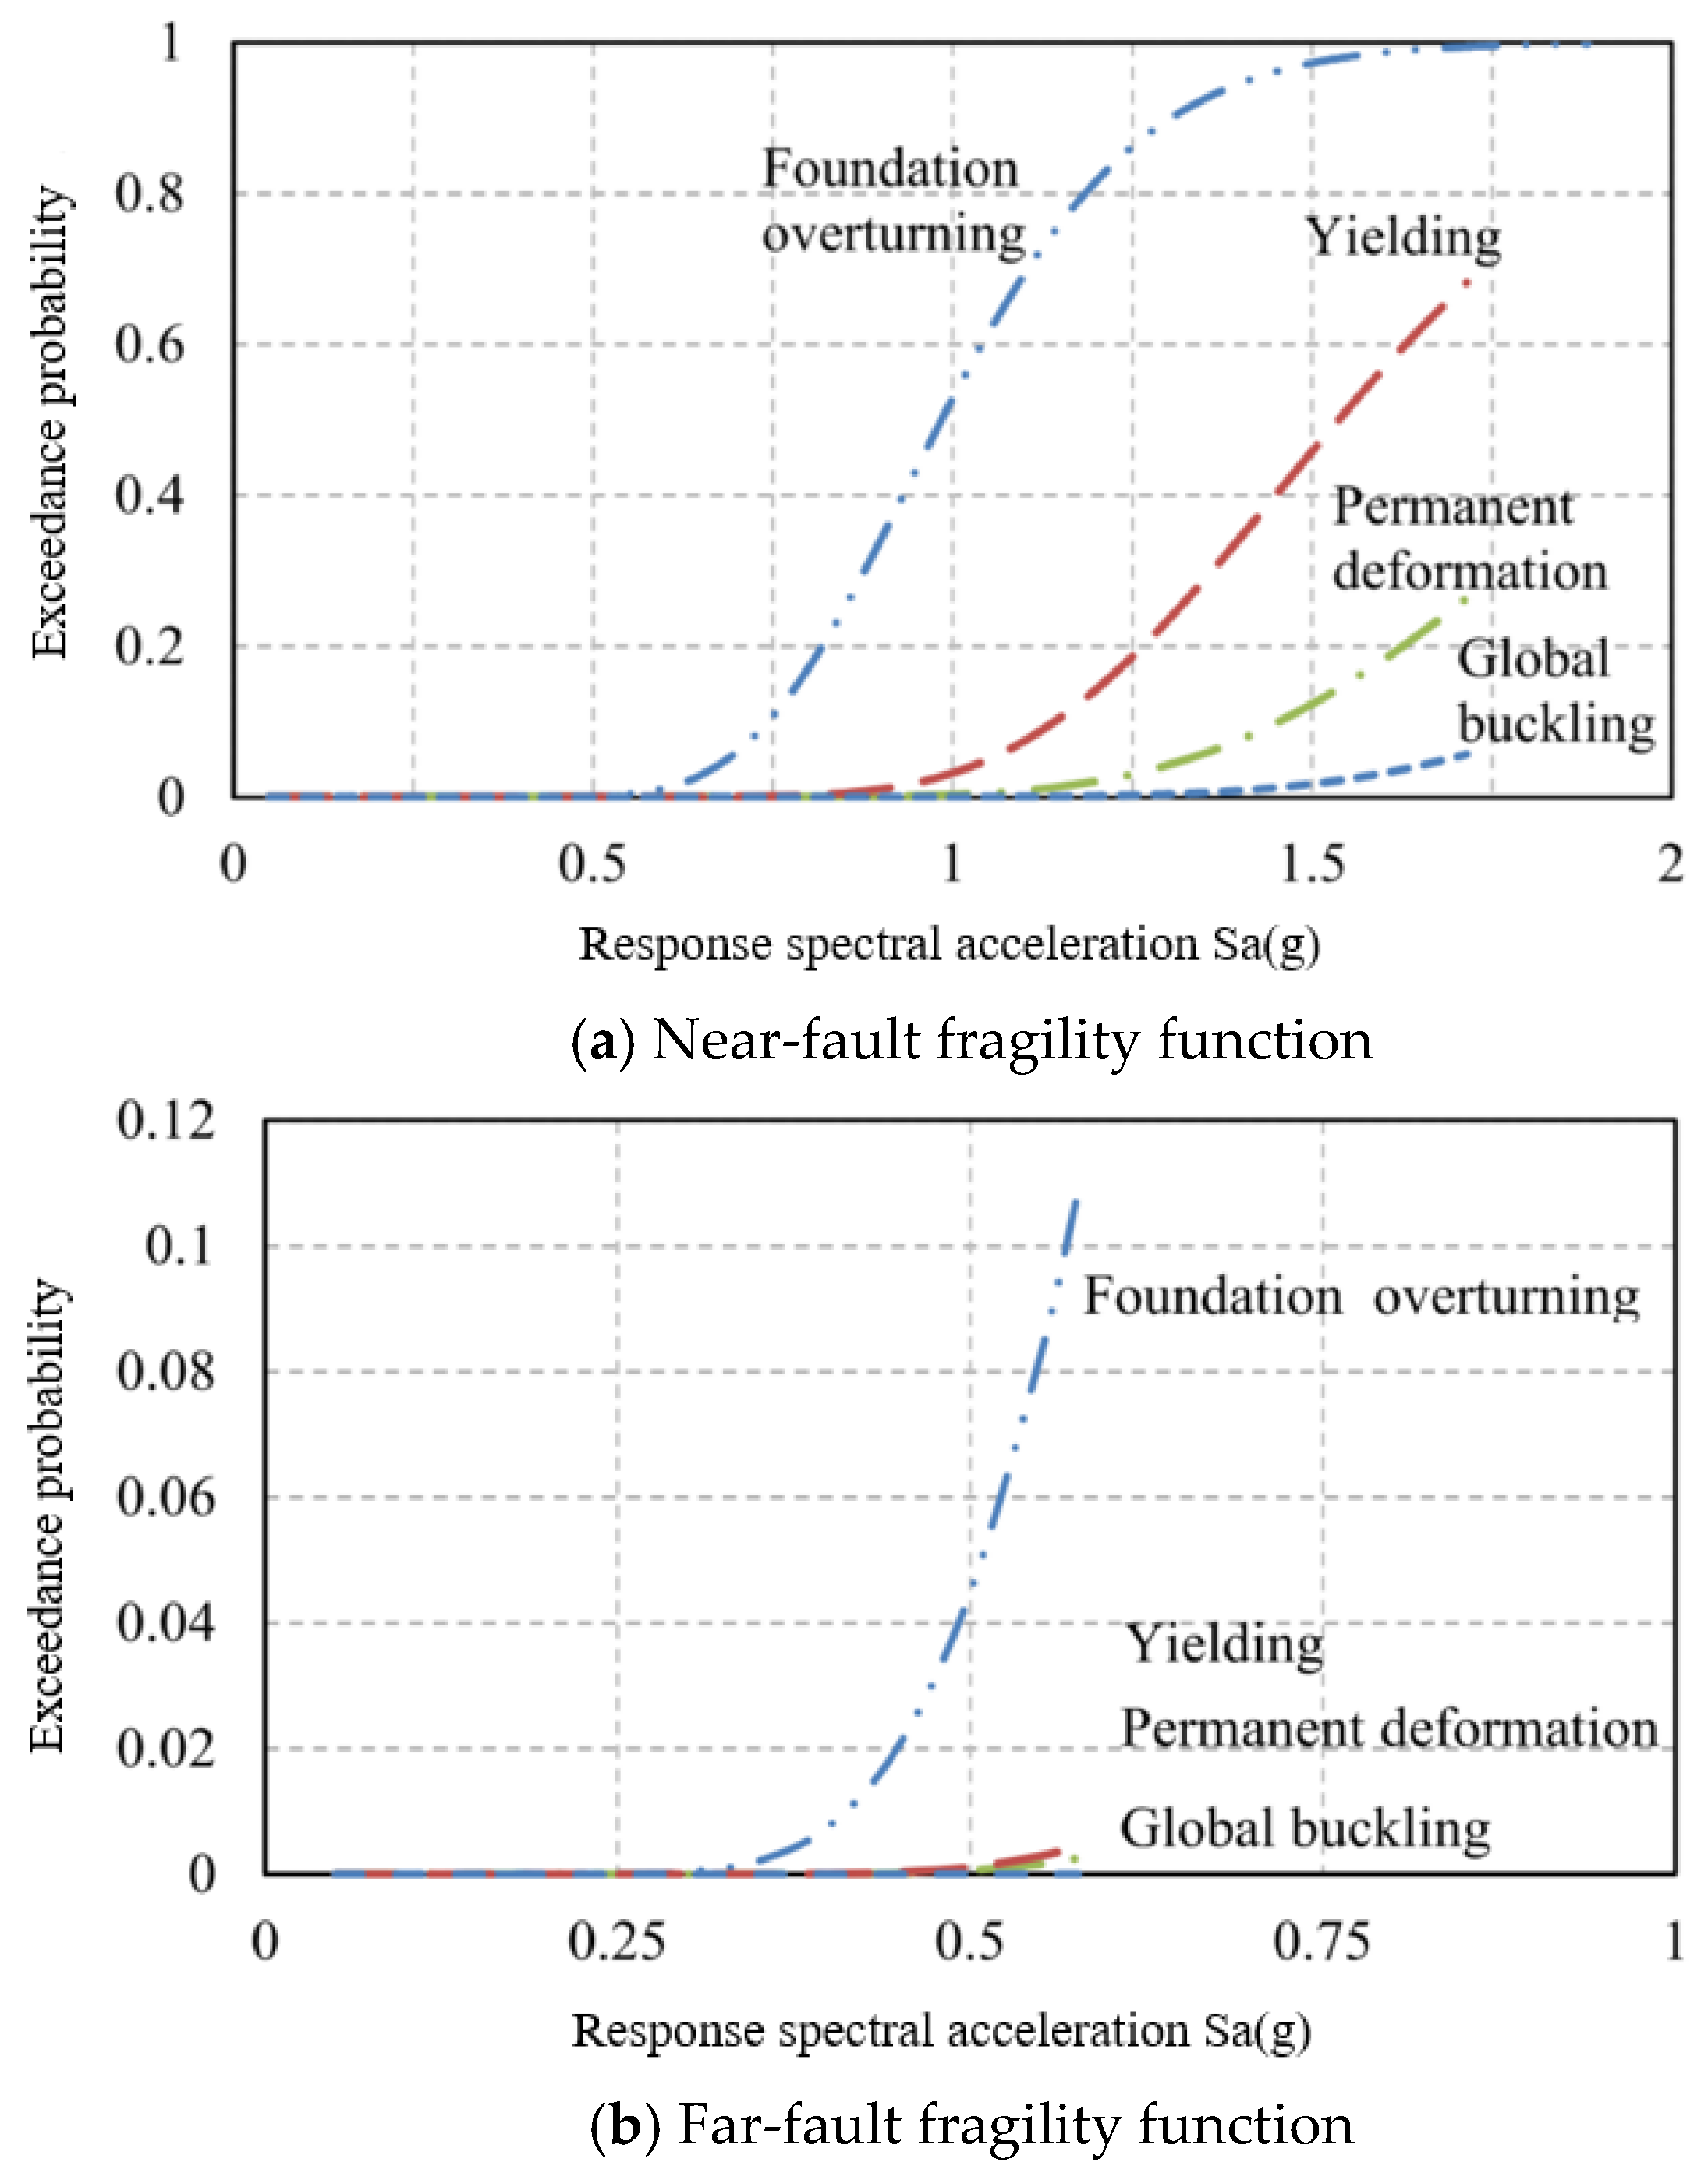
Patil et al. [64] used probability-based fragility methods to evaluate the structural performance of parked wind turbines subjected to seismic loads. The authors considered 15 near faults and 17 far faults with seismic loads scaled 2.5 times to evaluate the structural performance of an 80 m tall wind turbine tower. The highest probability of failure was found for the foundation-overturning mode, followed by yielding, permanent deformation, and buckling (Figure 5) [64]. Prowell et al. [65] analyzed the National Renewable Energy Laboratory (NREL) 5 MW reference wind turbine in terms of the moment demand, considering the mean load, the mean load plus one standard deviation, and the maximum load. The authors of another study [66] found that the mean tower base moment demand was in the range of the ultimate wind loading. Similar results were obtained for the mean plus one standard deviation simulation. For operational cases (Figure 6b, c), the moments at the tower base were found to have a wide range compared to the idling case shown in Figure 6a [65].
Lavassas et al. [66] analyzed wind turbine towers in seismic areas and performed eigenvalue analysis with response spectrum analysis as per the Eurocode 8 specifications. The analysis indicated higher values for the von Misses stress in the region near the door opening at the bottom of the tower. Although higher stresses were recorded due to wind loading, the authors [66] suggested the importance of seismic analysis for structural design. Seismic loads involve a wide range of frequencies, which may induce higher-mode vibrations in wind turbine structures. Ishihara and Sarwar [67], using time-domain analysis and a semi-theoretical approach based on the seismic load acting on buildings, investigated wind turbines in terms of the contributions of higher modes of vibration due to seismic loads. The authors [67] found that a modification response spectrum was required to account for the large response of low-damping structures, such as wind turbines. The authors also proposed a formula to estimate the maximum value of moments. Systematic modeling of the effects of wind turbine dynamics and earthquake loads on wind turbine structures compared to normal operating conditions [68] indicated that the contribution from higher modes in wind turbine response is important in the analysis and design of tower structures. Prowell et al. [69] performed a full-scale shake table test on a 65-kW wind turbine and a computation simulation. The authors suggested the possible participation of higher modes due to high-frequency seismic load. Other research [69] also suggested investigating and checking the conservativeness of bi-directional loading. Zhao and Maisser [70] researched the seismic response analysis of wind turbine tower structures considering soil–structure interactions.
Owing to the large return period and scarcity of high-magnitude seismic events, wind turbine failures are rare; however, they are expected to fail. Even if total collapse of the wind turbine does not occur, partial failure of one turbine can disrupt the normal operation of a whole wind farm for a considerable time. Interrupted power generation and turbine failure result in huge financial losses for wind energy developers, operators, owners, and insurance companies; thus, performance evaluation, vulnerability assessment, and risk evaluation are required for wind turbine structures. Research on and analysis of wind turbines subjected to seismic loads, probability-based analysis, simulation-based testing, design procedures, and continued upgrading of the standards and specifications that could be used in structural performance evaluation play important roles in the advancement of wind energy technology.
3.2. Risk from Strong Wind for Onshore Wind Turbines
Codes and specifications include recommendations for high-wind-speed designs. Different parts of the International Electrochemical Commission (IEC) cover guidelines and standardization of different aspects of wind turbines, such as general design requirements (IEC61400-1:2005 + AMD1:2010) and design requirements for OWTs (IEC61400-3:2009). Despite adherence to these guidelines and certifications, there are many instances of wind turbine failures due to high-velocity wind events, such as hurricanes. A wind turbine tower collapsed after bending near the bottom section due to high-velocity wind [19]. Excessive wind turbine blade deflection due to high-velocity wind resulted in a blade hitting the tower of a wind turbine at Searsburg, VT, in 2008 [18]. High-velocity wind resulted in uncontrolled oscillations in a wind turbine, and the blade sheared the tower and the upper part of the tower collapsed [17]. Wind turbine towers at Fenner Wind Farm in Madison County, NY, in 2009 [20] and in Fayette County, PA, in 2014 [21] collapsed due to high-velocity winds.
In the past few decades, researchers have studied and analyzed wind turbines for their reliability and performance by using probability-based statistical methods. Displacement-based fragility analysis was performed by Quilligan et al. [71] to investigate steel and concrete towers. A method to estimate the force acting on the blades, nacelle, hub, and tower of a wind turbine due to severe storms was proposed by Kawai et al. [72]. A method for numerical estimation and analytical calculation using a finite element approach was employed to establish the buckling load due to high-velocity wind by Lee and Bang [73]. A simulation using finite element modeling and analysis was employed by Chein and Jang [74] and showed that, due to vortex-shedding frequency resonance at low wind speeds, the across-wind response of wind turbine towers is greater than the along-wind speed response. A full-scale test and full dynamics simulation based on the FEM code have been used [27] to estimate natural frequencies and wind loads and analyze the collapse of wind turbines during Typhoon Maemi.
Rose et al. [75] used empirical equations to analyze the thin-walled cylinders that would be best suited for ideal structures. Wind turbines are not ideal structures and have varying degrees of stiffness, geometries, and mass distributions. The door and cable opening at the bottom of a turbine were found to affect the response [61]. Wind direction and intensity are not constant and are ever changing. This transient aspect of load results in transient uncertainty in the response parameters of slender structures, such as wind turbines. Fragility analysis is the most suitable method to address such uncertainties. Fragility analysis has been used to investigate wood constructions [76], the long-term design loads on wind turbines [77], and, in a publication by the Applied Technical Council, bridge fragility [78]. Fragility curves have also been developed using analytical methods by various researchers. The elastic spectra method [79], the nonlinear static method [80,81], the nonlinear dynamic method [82,83], and Hwang and Huo’s hazard curves [51] are the analytical methods that have been developed for fragility curves. Component fragilities were used to estimate system fragility for highway bridges [58]. Empirical methods were used to develop failure curves for structures [84]. To evaluate bridge damage [85] and uncertainties in response, another study analyzed the performance of structures using the fragility approach. The performance of steel moment frames was evaluated based on a nonlinear analysis by Yun et al. [86], who proposed a method to estimate the confidence level for a given hazard. Jeong and Elnashai [87] derived a set of fragility relationships with known reliability based on the fundamental response quantities of stiffness, strength, and ductility and then constructed various fragility limit states without performing further simulations.
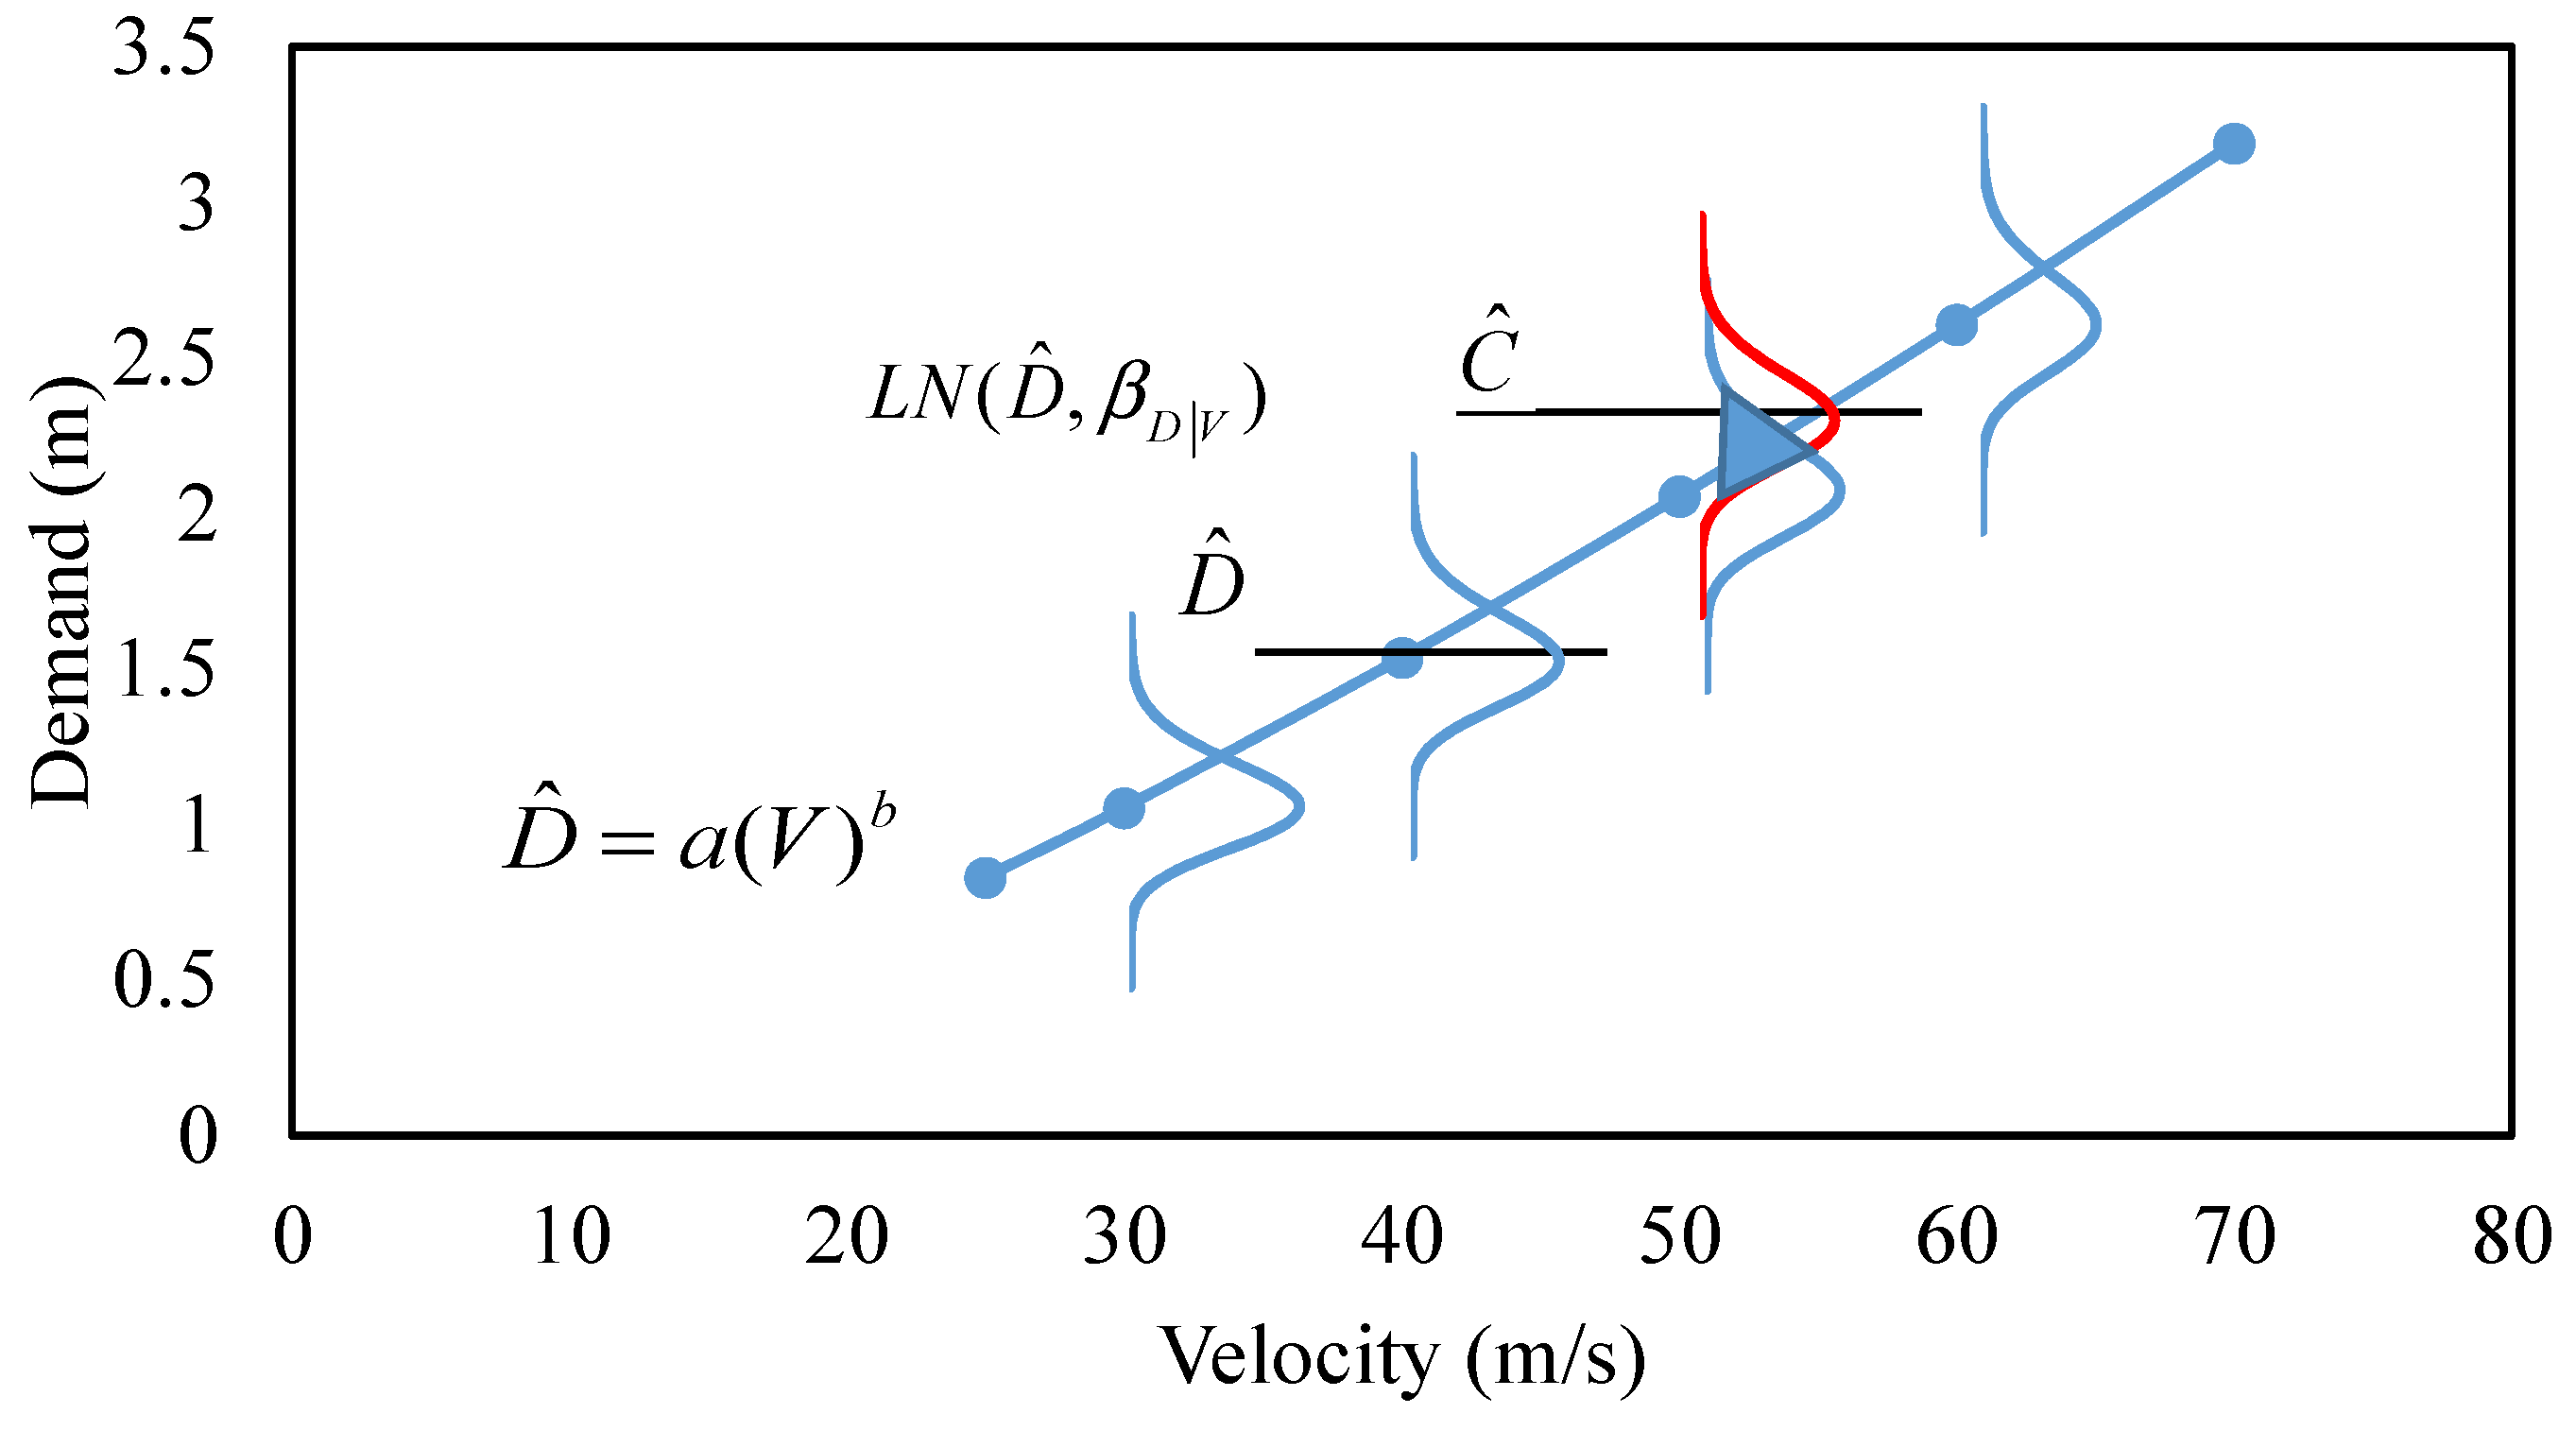
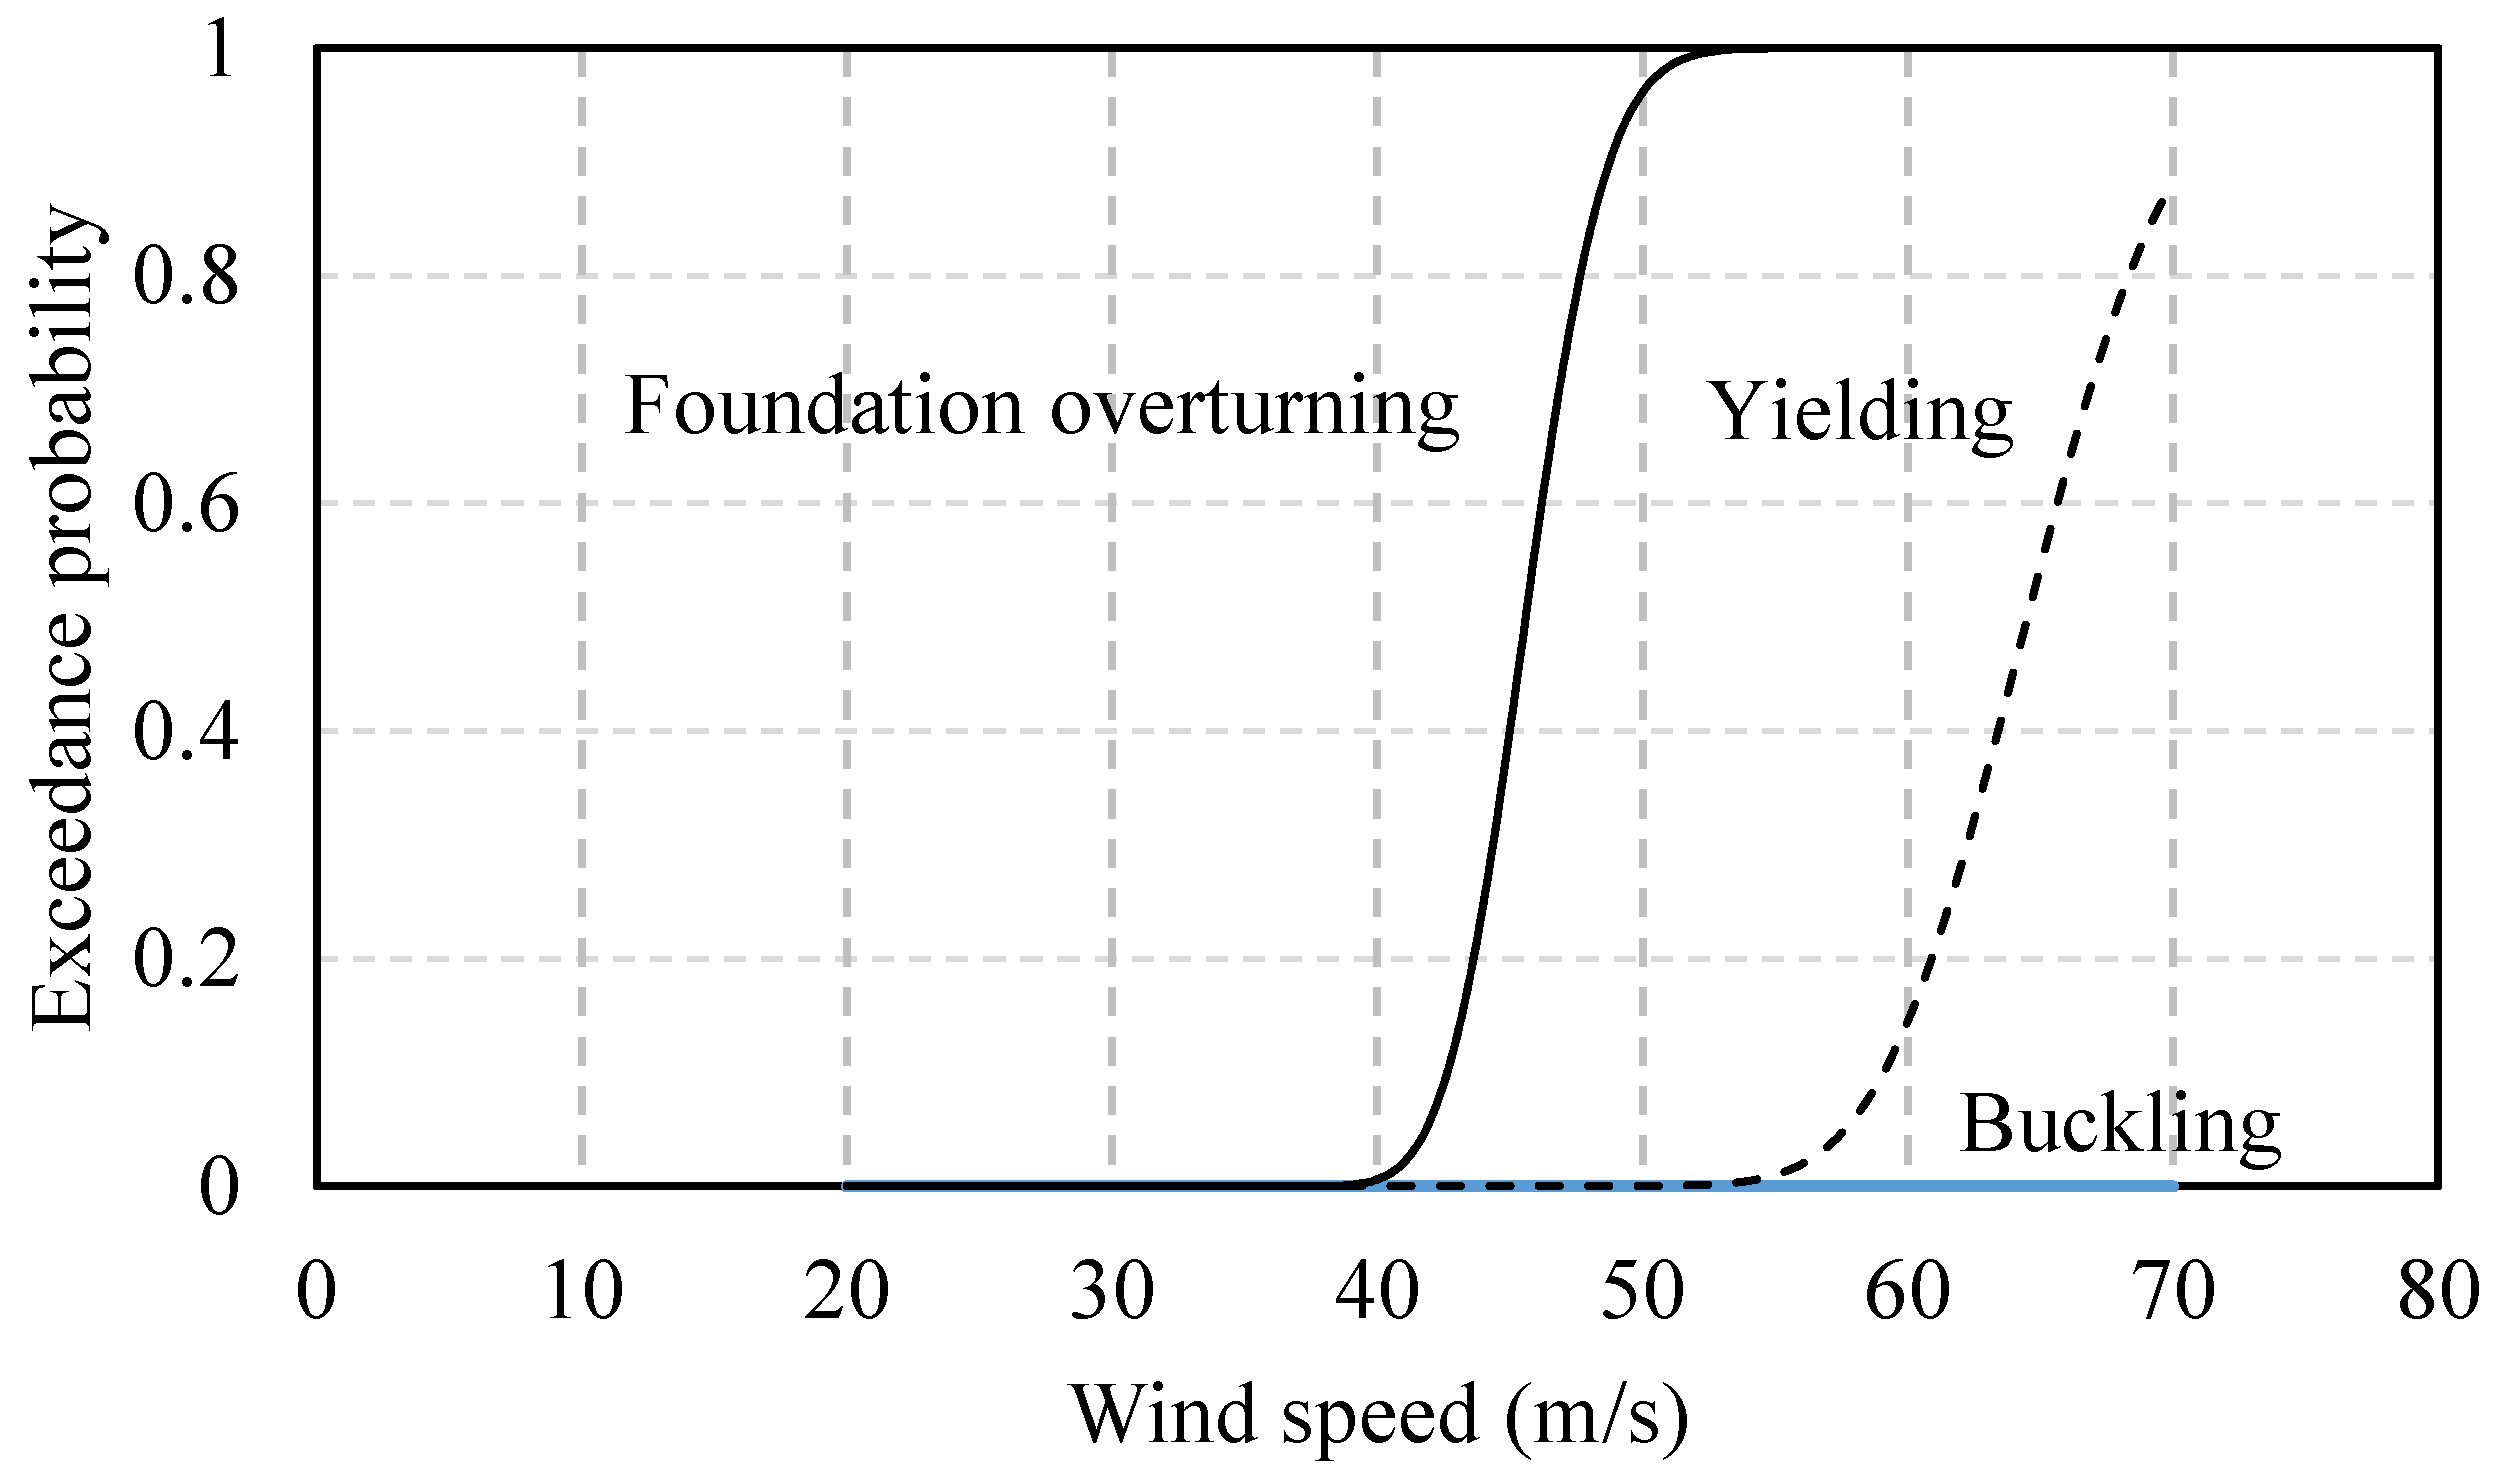
A 1.65 MW 80 m tall wind turbine was analyzed by subjecting it to wind fields with mean wind speeds of 25 m/s, 30 m/s 40 m/s, 50 m/s, 60 m/s, and 70 m/s [64]. Based on seismic fragility analysis, demand can be expressed as a function of spectral acceleration as in Equation (1) [88]. For wind, spectral acceleration can be replaced with mean wind velocity V, and demand can be expressed as in Equation (2) [64]. The parameters a and b being regression parameters, the exceedance probability of the demand D is given by Equation (3) [64] and the capacity is given by Equation (4) [88]. By combining Equations (3) and (4), the probability of failure can be expressed as in Equation (5) [89]. One study [64] modeled a 1.65 MW turbine using the numerical model in the Fatigue, Aerodynamic, Structures, Turbines (FAST) tool [90]. Wind fields have been generated using TURBSIM [91]. The wind loads were applied in two directions, forming angles of 0 degrees and 30 degrees with the rotor axis. The study by Kim and Manuel [92] found that 30-degree wind-direction speed is the most critical, resulting in maximum deformation. The ultimate capacity of a wind turbine has been determined using pushover analysis [93]. The material model used in this study was based on the work by Matic [94] and Voth [95]. The velocity vs. median demand for the 30-degree wind direction obtained in another study is shown in Figure 7 [64]. The fragility analysis in this study used three limit states: global buckling, yielding, and foundation overturning. The highest probability of failure was found for foundation overturning, followed by yielding and buckling (Figure 8) [64]. The case study was performed by considering a 15 m wide foundation. When the foundation width was increased from 15 to 16.56 m, the probability of failure decreased, with significantly enhanced foundation-overturning resistance (Figure 9) [64]. The SAC-FEMA approach, which is extensively used in earthquake analysis, was employed for high-velocity wind fragility analysis to study the nonlinear velocity vs. demand relationship.
where:
- = median demand;
- = median capacity;
- = specific demand;
- = specific demand;
- = regression parameters;
- = spectral acceleration;
- = mean wind velocity;
- = parameter to measure dispersion for demand;
- = parameter to measure dispersion for capacity;
- = specific demand;
- = natural logarithm;
- = standard normal probability integral.
Wind turbine blades are another component susceptible to failure due to high-velocity wind and represent the most common location for failure [96]. Damage to wind turbine blades may be due to various reasons, such as lightning, fatigue loads, and accumulation of ice [97]. Wind turbine blades account for around 15–20% of the total cost and are one of the most expensive components to repair, resulting in considerable downtime for operating wind turbines [98]. Owing to prolonged and continuous use and the cyclic nature of loads, composite-material blades can fail due to delamination [99,100]. Full-scale testing of a wind turbine blade was performed by Jorgensen et al. [101] using a 25 m long blade subjected to flapwise load. The authors studied the mechanism by which wind turbine blades fail when the flapwise load exceeds the capacity; mainly, the failure on the compression side of the blade. Five wind turbines located in Changhua Coastal Industrial Park in Taichung failed during Typhoon Jangmi [102]. A study analyzed the failure of the blades due to sustained high-velocity wind, which resulted in surface delamination and cracking of blades. The authors [102] analyzed the failure mechanism for the blades and investigated the contributing factors leading to blade failure. Chen and Xu [13] studied the structural integrity and failure mechanism of wind turbines damaged by a typhoon in Usagi. The authors showed the effects of high-velocity wind and changes in wind direction on the tower and blade. The structural performance and behavior of the wind turbine tower and blade were quantitatively investigated to identify the root cause of the failure. The Usagi Typhoon recorded a sustained wind speed of 138 mph (61.69 m/s) [14]. According to the Saffir Simpson scale, the Usagi Typhoon was a category four typhoon.
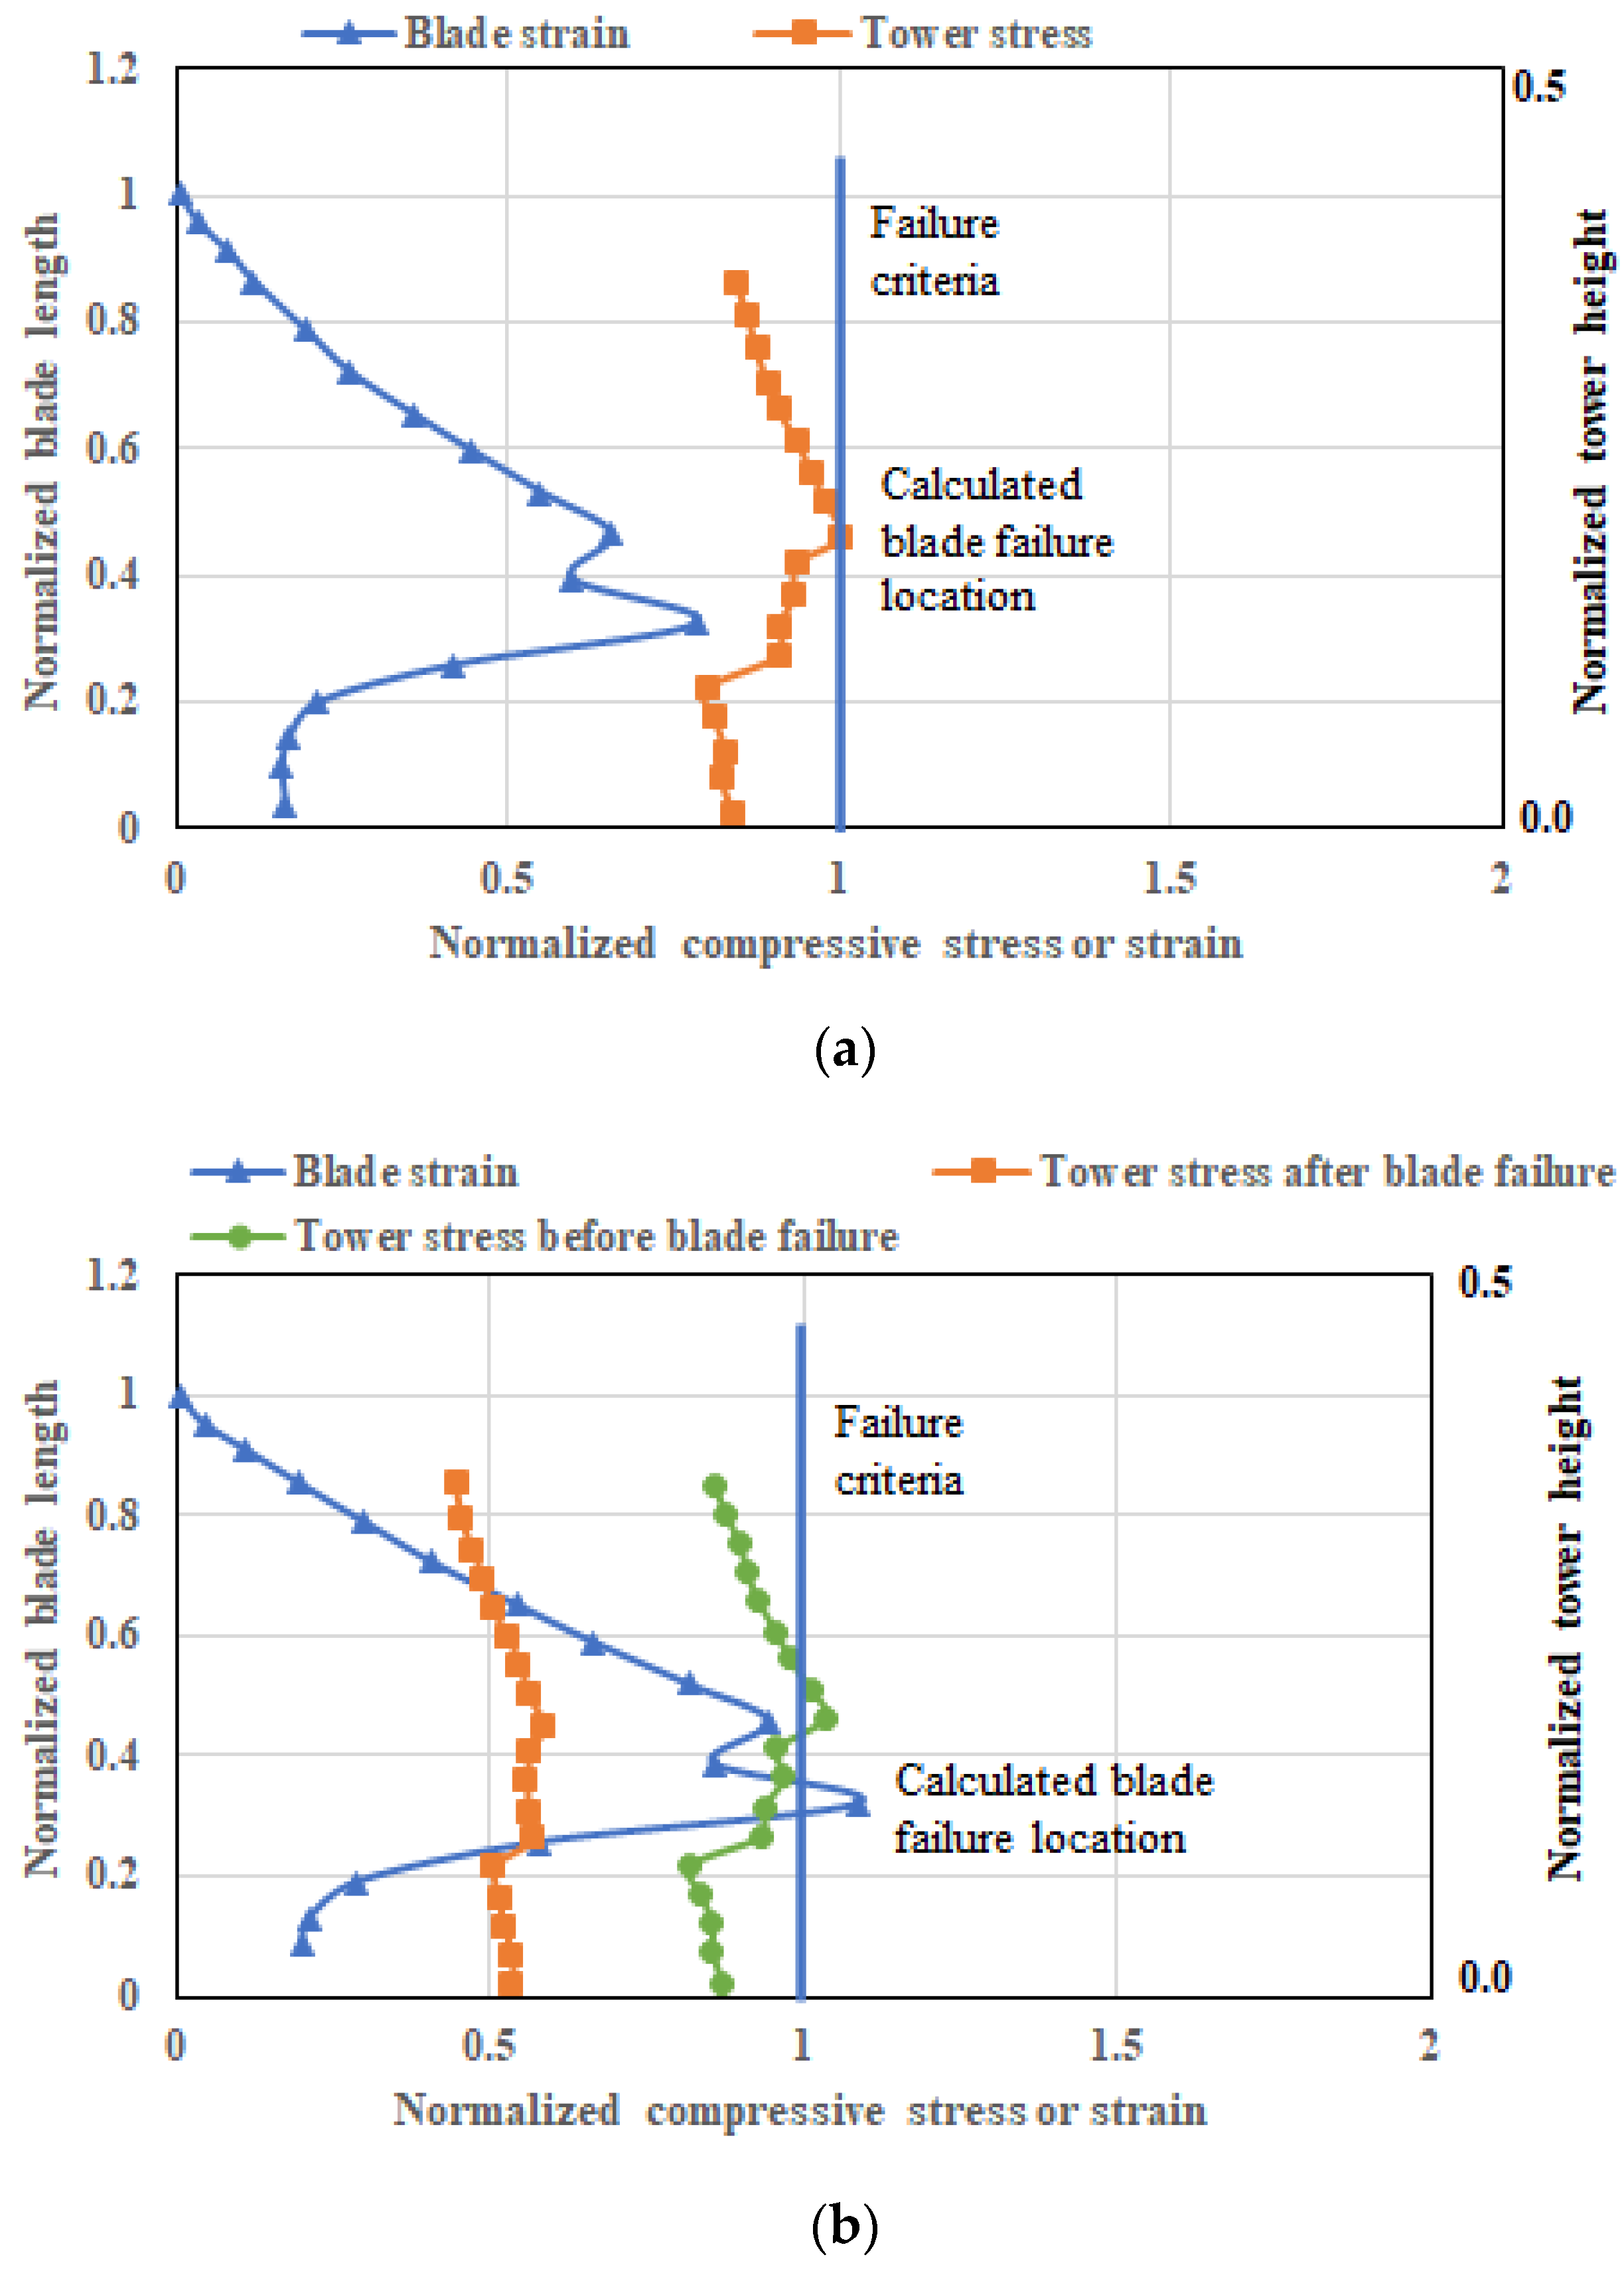
The wind direction has also been found to change to a great extent. Strong wind and large shifts in the direction of the wind caused the failure of wind turbine blades. The authors of one study [13] used the maximum compressive strain as the failure criteria. Two stop positions for the wind turbine were considered. For position 1, the wind from the north-north-east (NNE) had a wind speed of 59.8 m/s, and for position 2, the wind from the southeast had a wind speed of 71.5 m/s. The peak stress and strain levels were found to occur at the normalized length of 0.32. The directionality of the wind was found to have a significant impact on the structural performance of the wind turbine. The wind with a speed of 59.8 m/s approaching from the NNE did not cause the strain in the blade to exceed the threshold limit and the blade survived the wind-induced loads, but the turbine tower collapsed in the SSW direction. For the second stop position, where the wind was approaching from the SE with a speed of 71.5 m/s, the strain level was higher than the failure strain limit, leading to blade failure, but the wind turbine tower survived the wind speed. This study indicates that the stop position needs to be evaluated and verified in the turbine design process. The study also indicates that all the blades need to be feathered to avoid the failure of wind turbine structures. The authors [13] presented the location-wise stress and strain relations for the two stop positions of the wind turbines, as reproduced in Figure 10.
3.3. Risk from Hurricanes for Offshore Wind Farms (OWFs)
Offshore wind farms are exposed to risks from hurricane wind and waves. Researchers have used catastrophic modeling methods, Monte Carlo simulation, the log-logistic function, and the Weibull distribution for extreme windstorms to evaluate the financial risk for insurers and owners of offshore wind farms (OWFs) [75,103]. The risk for a single OWT from hurricane forces was researched by Hallowell et al. in 2018 [103] using structural models and the synthetic database. The researchers also performed a fragility analysis of the tower and monopile and noted failure probabilities between and for the functional yaw control system and and for the non-functional yaw control system [103]. Hallowell et al. (2018) [104] also evaluated the reliability of using multiline anchors in wind farms, in which the distribution of demand was developed using a 500-year storm, resulting in progressive failure of system reliability. Wind accelerations were studied by Duenas-Osorio and Basu [105] to evaluate the impact on wind turbines. The study suggested that, even if wind turbines do not collapse, frequent accelerations due to high winds pose a potential risk for mechanical and electrical components. Flexural bending of wind turbines due to local buckling was found to result in the need for minor repairs, with 26% of failures being related to pitch and 30% being major failures caused by hydraulic system failures [106,107].
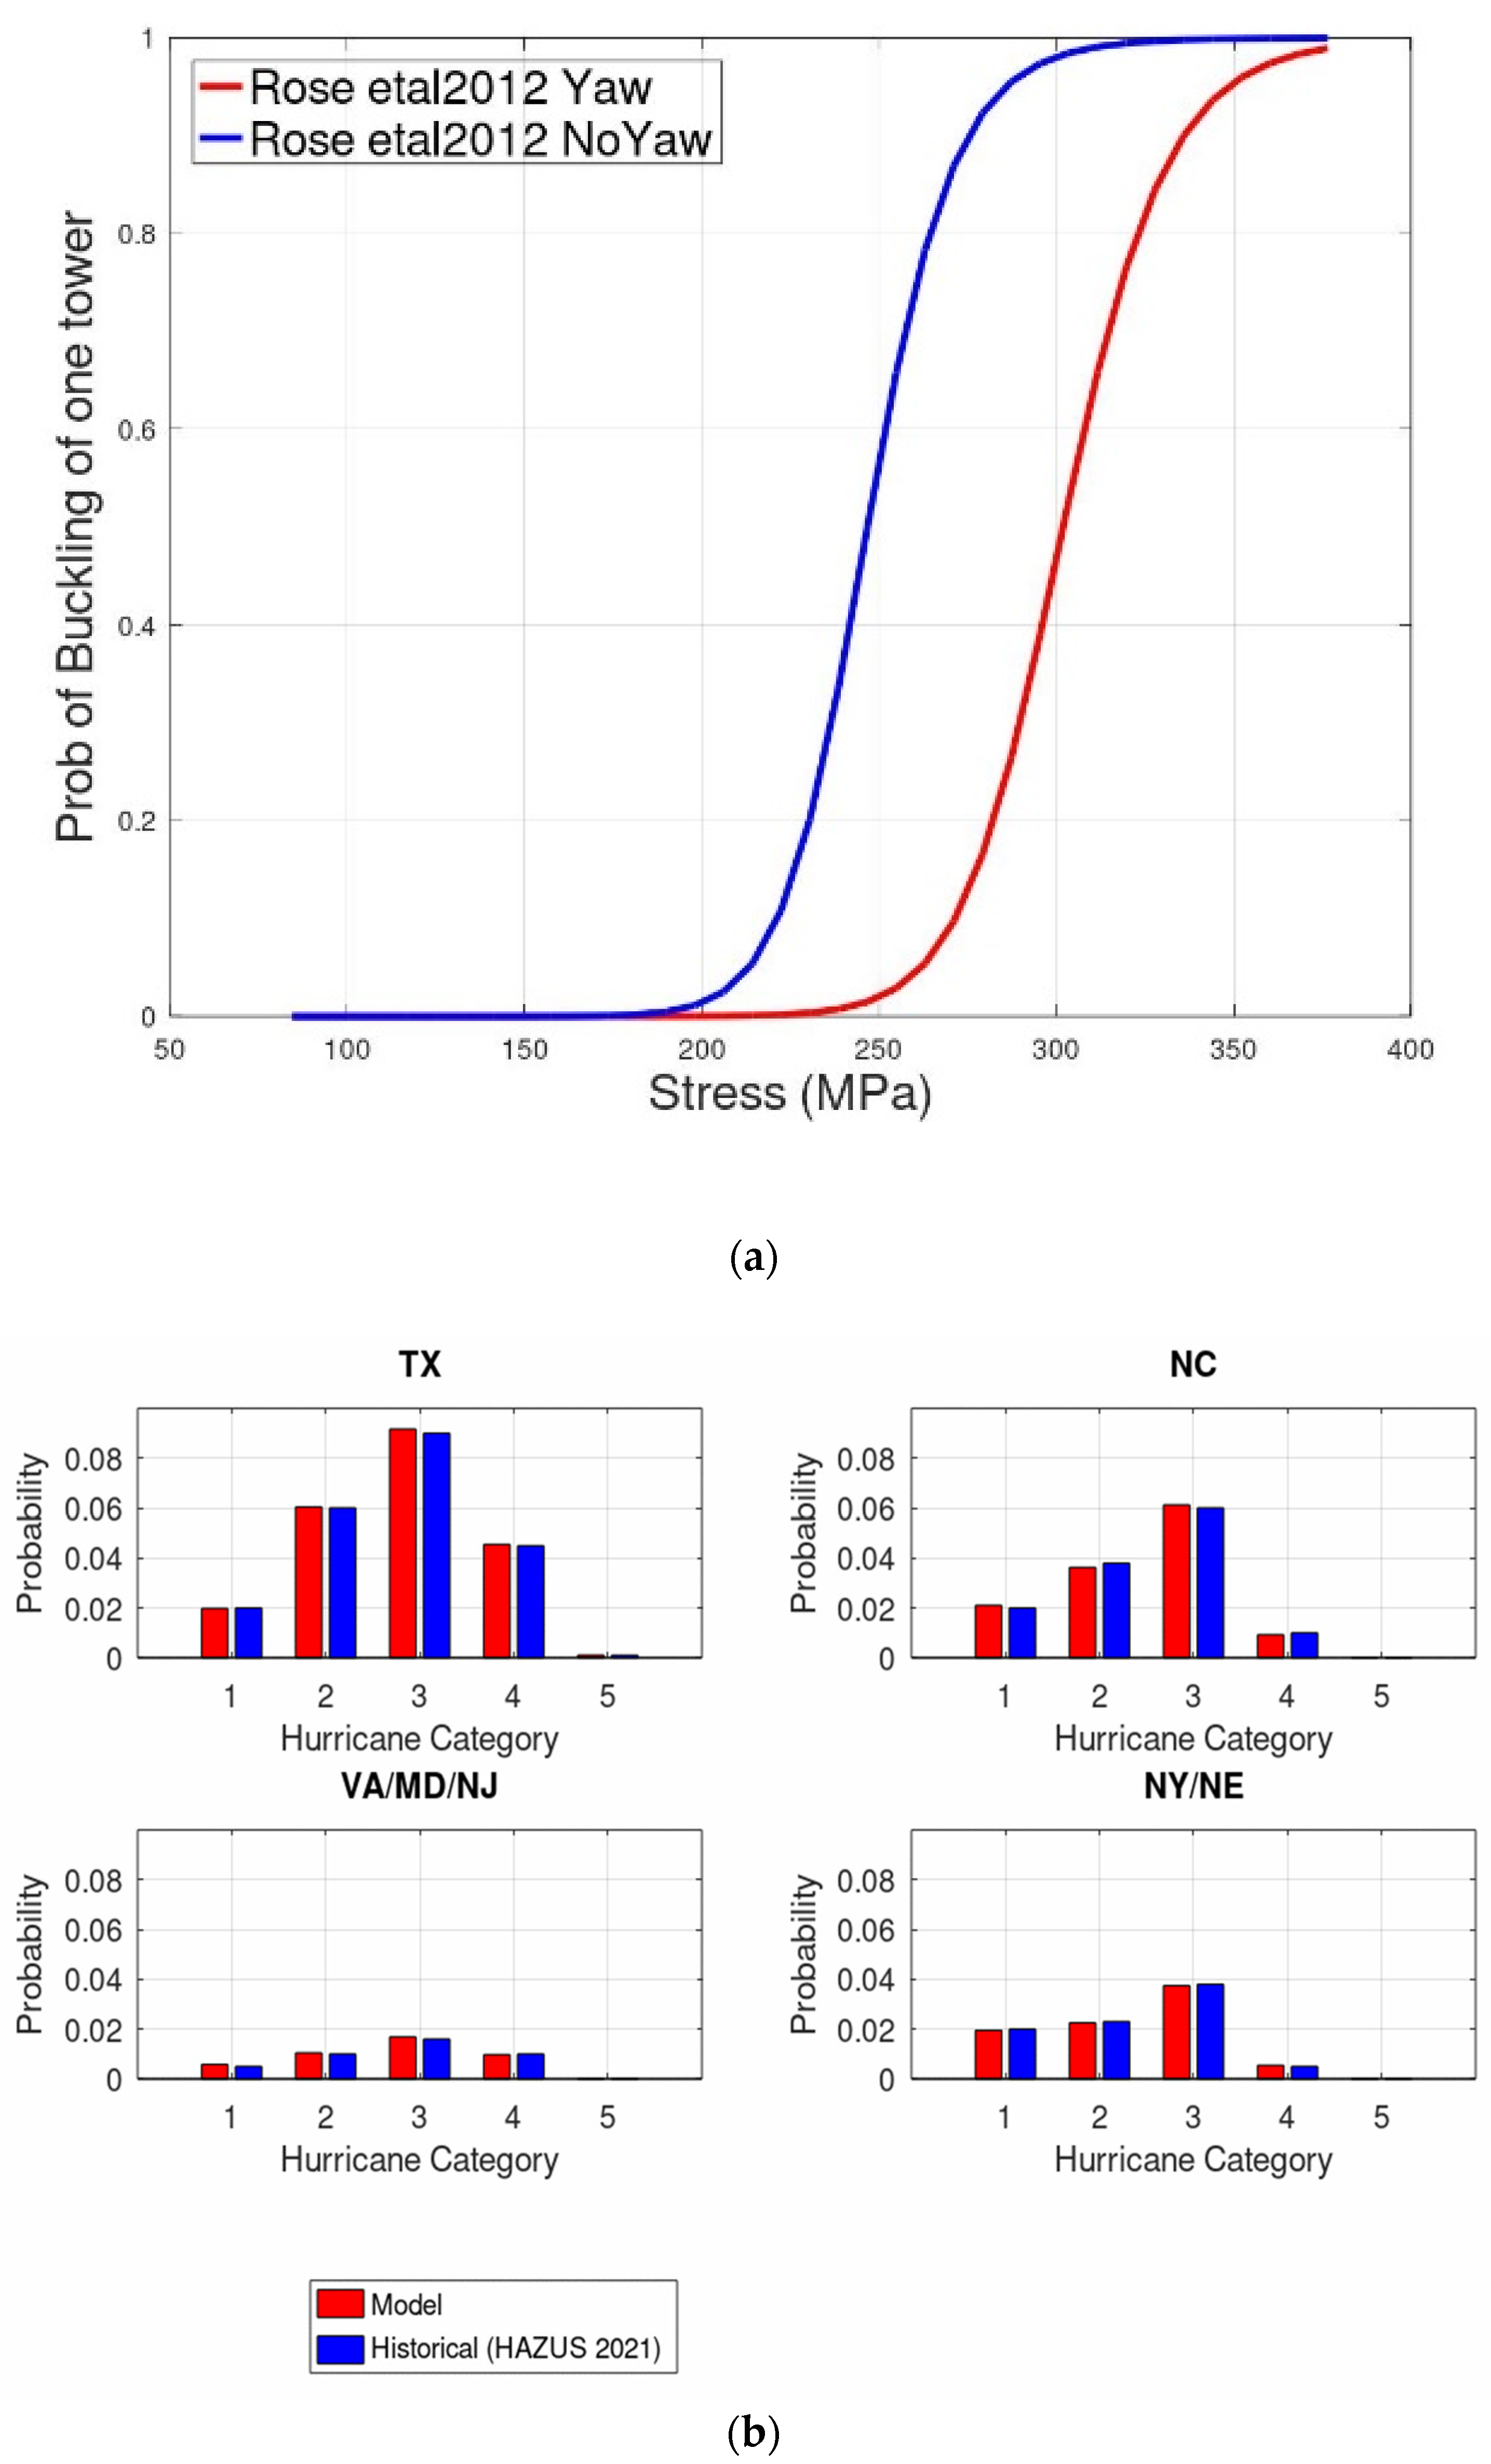
Figure 11a shows fragility curves for the yaw and no-yaw conditions [75] and Figure 11b shows the probability of hurricane occurrence in major US coastal states [108,109]. The fragility of wind turbines under yaw and no-yaw conditions is given by the equation below using a logistic function:
The probability for the wind speed can be modeled using a generalized extreme value (GEV) distribution.
where:
- = failure probability at wind speed w;
- = sustained wind speed at hub height (knots);
- = scale parameter of the log-logistic function;
- = shape parameter of the log-logistic function;
- = scale parameter of the GEV distribution for wind speed;
- = shape parameter of the GEV distribution for wind speed;
- = location parameter of the GEV distribution for wind speed.
Risk evaluation was performed by Rose et al. (2012) [75] to quantify hurricane risk for OWTs in the Atlantic and Gulf coastal waters of the United States. The study reported that the maximum speed during hurricanes is greater than the design limits, resulting in buckling failures. It was noted that over 90% of the wind turbines buckled in response to hurricanes of categories 3, 4, and 5. Rose et al. [75] also highlighted that the uncertainty regarding the wind direction during hurricanes and wind turbines’ inability to yaw to the correct direction result in failures. For the integrated approach to risk analysis for OWTs, Staid and Guikema (2012) [110] underlined the importance of the risks faced by OWTs, including maintenance and operation costs. To estimate the potential damage to an OWT farm, Manuel and Kim (2012) [107] used synthetic hurricane tracks, wind field models, and speed exceedance probabilities. Wilkie and Galasso (2020) [111] also worked with a probabilistic framework; however, they relied on site-specific fragility relationships, a reliability approach, and a coherent treatment of epistemic uncertainties. To determine the optimal placement of wind turbines considering the wake effect, Yin et al. (2017) [112] developed a simulation optimization-based risk management (SORM) model using probability density functions with the help of Monte Carlo simulation. To study subassembly failure in OWTs, Carroll et al. [113,114] investigated various types of repairs, including major replacements, minor repairs, and major repairs. They also investigated costs and work hours for the same, in addition to looking at bathtub failure curves. The reliability data observed for typical electrical components were not seen at the system level for the wind turbine unit, and it is likely that major components do not exhibit bathtub failure curves. To study the influence of weather on the reliability of modern wind turbines—in particular, the effect of wind speed—Tavner et al. [115] investigated how speed affects reliability and which subassemblies in the turbine are affected most. The effect of wind turbine wakes, and the distribution of the interference and vortex were studied by Sorensen and Shen [116] using numerical modeling. Chou [117] investigated the cause of the failures in towers in Taiwan during a typhoon. A potential cause of the failures was identified in the bolt connections, and the study recommended well-planned inspection intervals to mitigate the risk. Agarwal and Manuel [77] modeled the extreme loads on a wind turbine from hurricane winds and waves. The hurricane track, wave, and wind intensity were modeled based on historical data and a physics-based model. Loads on the turbine tower were then used to determine the failure probabilities. Amirinia and Jung [118] studied the buffeting response of OWTs using time-domain formulations. Buffeting is a wind–structure interaction phenomenon and can be used to predict the failure of turbine towers and fatigue damage. Kim and Manuel [92] modeled hurricane-induced loads on a blade by considering the nacelle yaw and blade pitch control. Powell and Cocke [119] discuss the possible wind fields that can be used for accurate risk assessment during hurricanes. Nuta et al. [61] modeled the seismic fragility of wind turbine towers based on the Canadian seismic analysis approach. Prowell and Veers [32] evaluated the seismic risk for wind turbine towers and the tower moment demand. The numerical and experimental seismic responses of the prototype of a wind turbine steel tower were obtained and static, seismic, and stability analyses were carried out [63] to design the wind turbine. Dai et al. [120] studied the collapse mode of a wind turbine tower under a wind field generated using the parameters of the cyclone boundary layer flow. Failure occurred due to the formation of plastic hinges on the towers, which was consistent with field observations. The IEC [121] provide the design requirements for OWTs. Chien et al. [74] studied wind-resistant safety designs for a wind turbine tower (WTT) and evaluated them using the finite element model, recommending gust factor values and natural frequency for a 660-kW tower. Kawai et al. [72] evaluated the design for wind loads on wind turbines based on experimental methods. The authors reported that the maximum overturning moment was induced when wind forces reached peak values instantaneously. Vickery [122] proposed a physics-based approach to determining wind field models in hurricane simulations.
Sun et al. [123] used copula functions to study complex electronic systems and their interference. The influence of wind speed on subassemblies was studied using the causal and BN models by Su and Fu (2014) [124]. Chen et al. [125] investigated fault diagnosis in OWTs using supervisory control and data acquisition (SCADA) data. Similarly, Gabriel et al. (2021) [126] used the BN model to study threat and security assessment for OWFs. Various detailed structural analysis models have been developed to evaluate the performance of individual wind turbine towers, earthquakes, and wave and wind forces; however, limited research has been undertaken incorporating OWF vulnerability studies with operational failures. Another study by Lu and Zhang, 2022 [127] used a physics-based model and Bayesian network model to predict power failures during a hurricane. The reliability and failure behavior of OWTs were studied by Li and Soares [128] using a hybrid Bayesian network model to recommend maintenance intervals. In the study of causal relationships and conditional probabilities, Bayesian network models using the reliability of systems have been employed to address failures and have gained popularity [129]. Figure 11b shows the hurricane frequency replicated using MC simulation, with wind speed and failure evaluated using BN models [108]. Based on the literature review, it is evident that the research on the effects of severe weather on wind turbines uses a catastrophe modeling framework. Such models are computationally expensive and may not conveniently accommodate future climate changes, tower construction material deterioration, and structural repairs [130]. Research on more efficient and promising models that can incorporate monitored data and in which interrelationships can be addressed effectively would help stakeholders assess hurricane vulnerability.
3.4. Risks from Tsunamis for Offshore Wind Farms
Tsunamis are series of waves with long wave lengths and periods generated during geological disturbances involving earthquakes or volcanic eruptions. Significant wave forces and scour resulting from tsunamis are major threats for the foundations of OWTs.
Bhattacharya et al. (2021) [131,132] discuss the technology readiness level of wind turbine towers and the major challenges for their successful installation. A summary of the loads affecting wind turbines—wind, seismic, and wave actions—is presented in this study. The authors also discuss the governing criteria for serviceability limit states. Furthermore, they discuss the verification and validation of models using experimental data for the foundations (monopile, spar-type floating) of OWTs and their mechanisms (only the foundations, the whole system with an actuator, and the whole system with an eccentric mass). The hydrodynamic loads and soil–structure interactions are discussed in the article, including one-way cyclic and two-way cyclic loads.
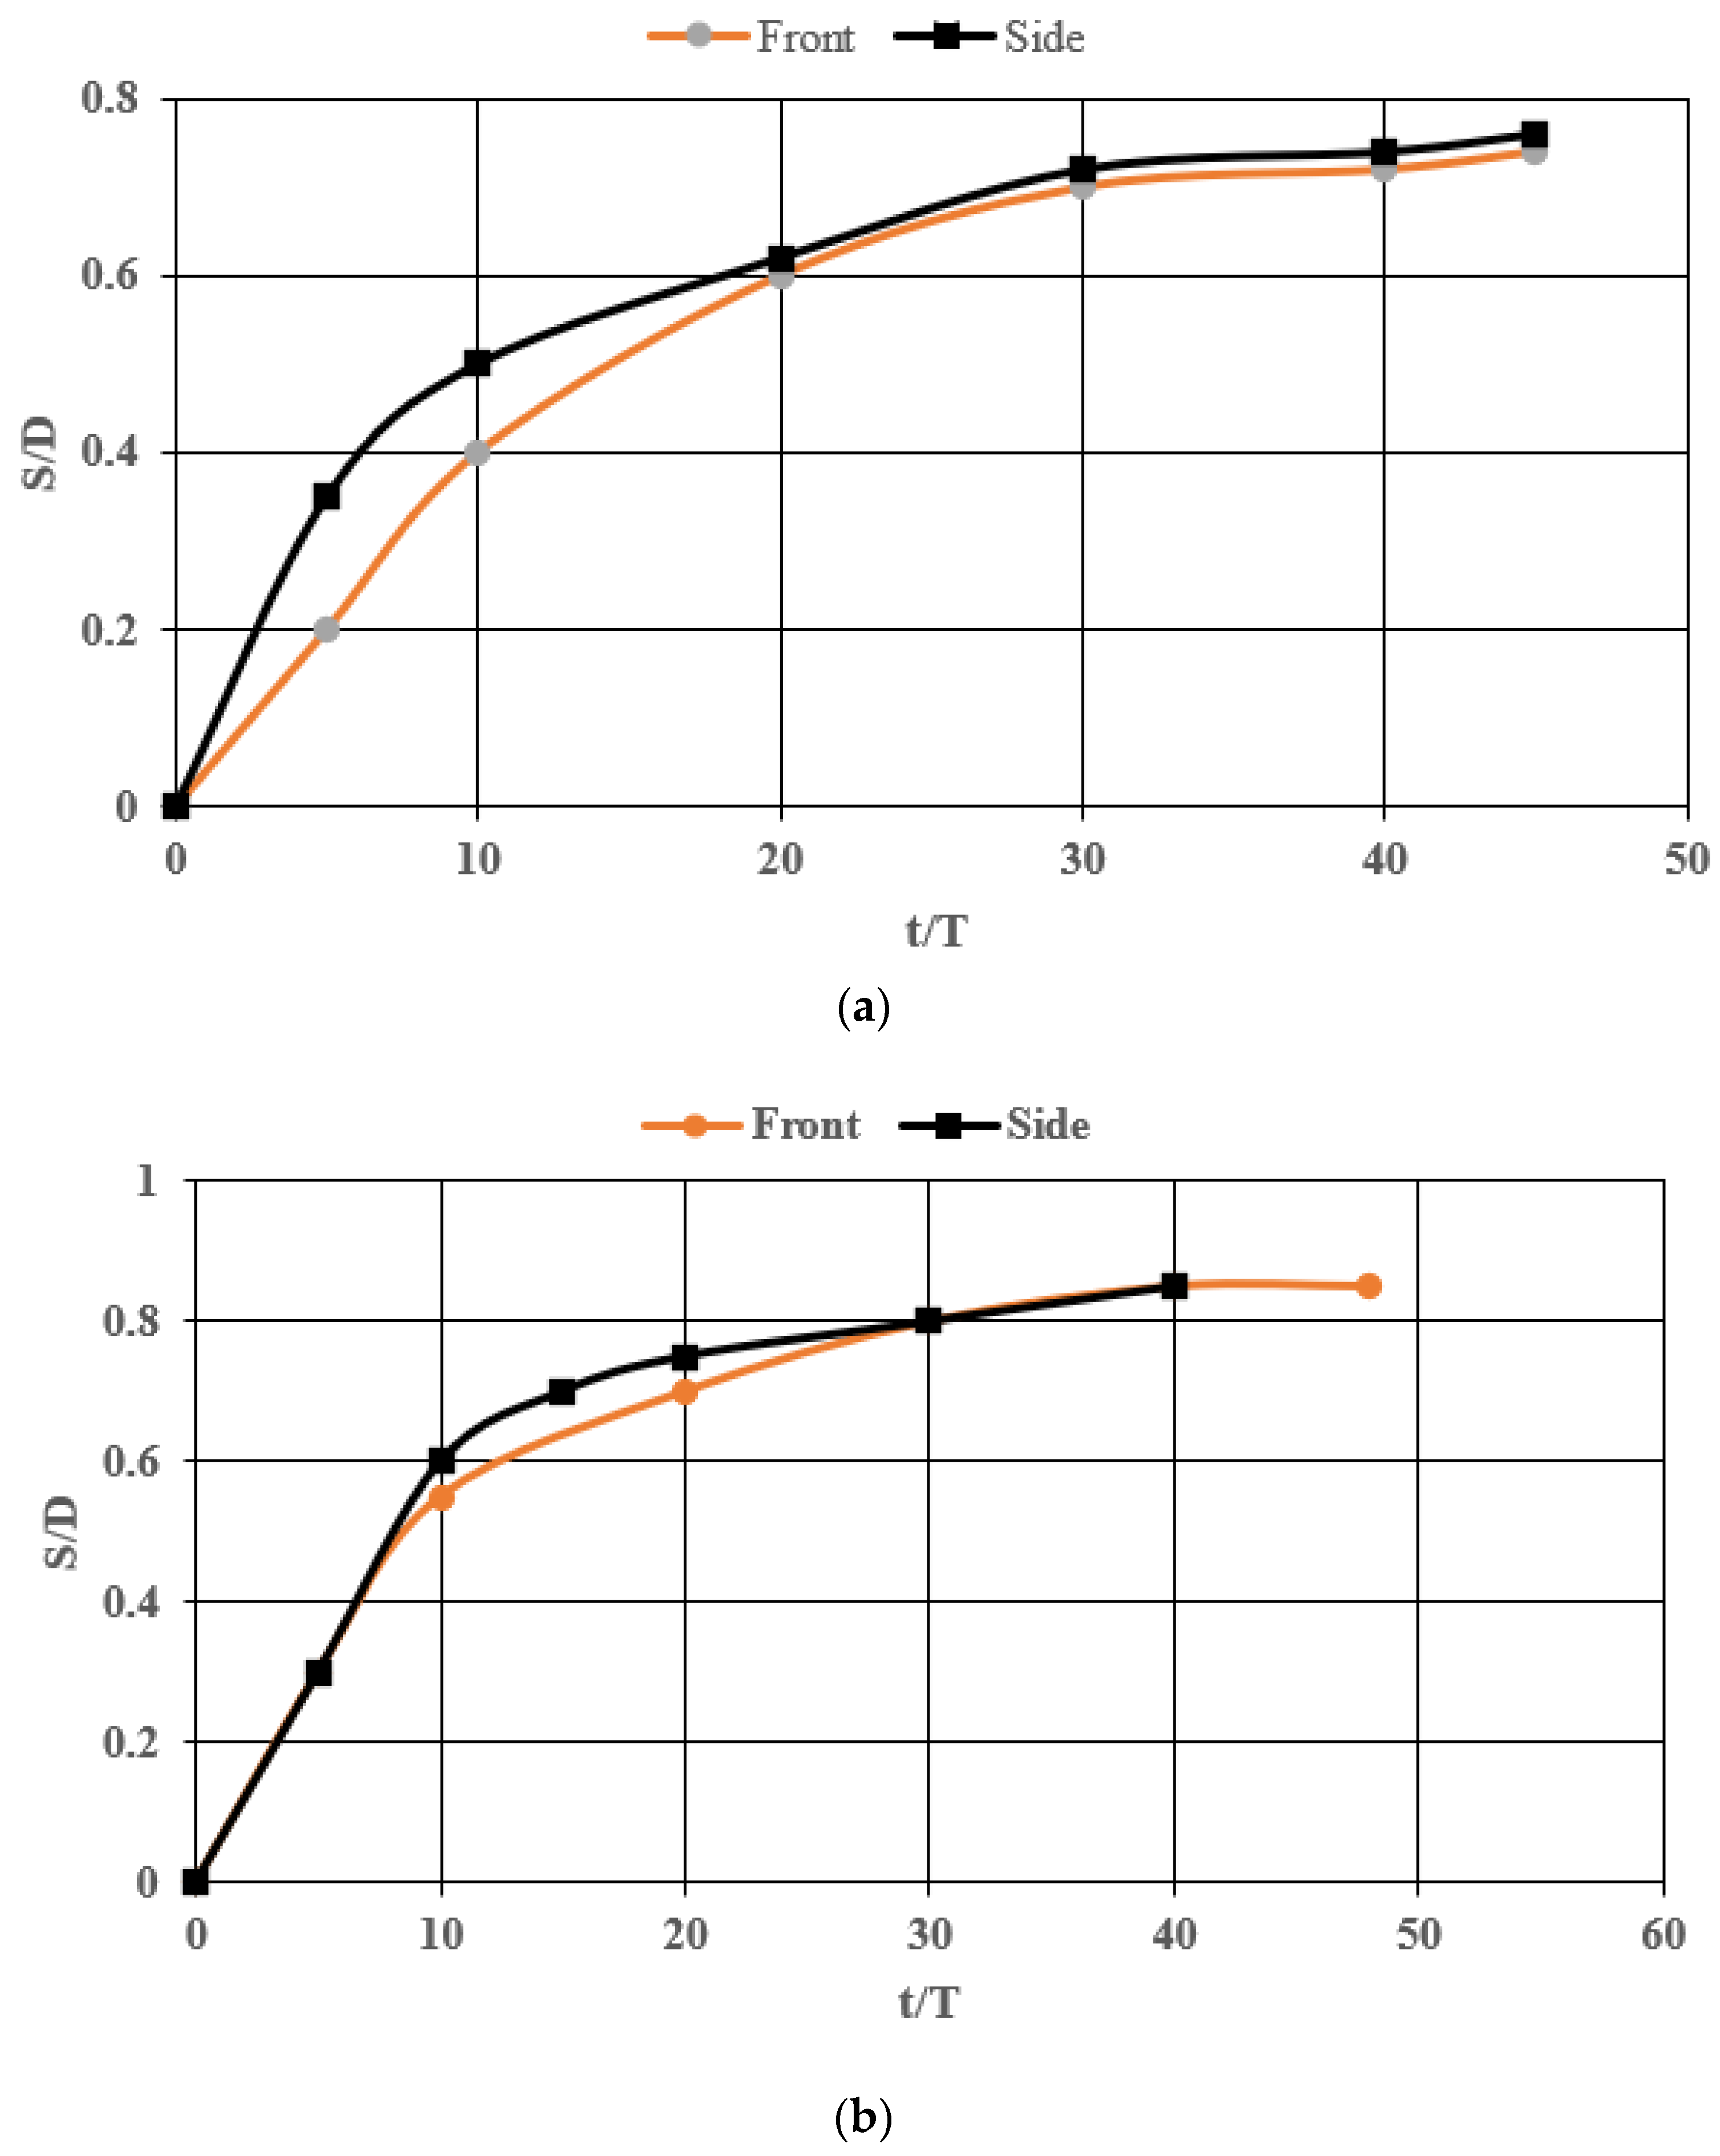
Tsunami propagation (Fuhrman (2009) [133]), scour (Fuhrman et al. (2014) [134]), and sediment transportation have been studied in the past. Larsen et al. (2018) [135] experimentally investigated the tsunami-induced temporal scour development around monopile foundations and compared the results with an earlier model (Larsen et al. (2017) [136]) based on solving the Navier–Stokes equation utilizing the k-ω turbulence closure and suspended load descriptions (Figure 12). The authors found an excellent match with the experimental results for steady-current scour. They also presented similarities between the diameter-based Froude number and the dimensionless wave boundary layer thickness and monopile diameter. This study showed that the scour increased in a stepwise cumulative process and most of the scouring occurred in the first few periods. The scouring on the sides was found to be slightly greater and faster than the scouring on the front. The developed models could predict the scour behavior and equilibrium scour levels, as shown in Figure 13.
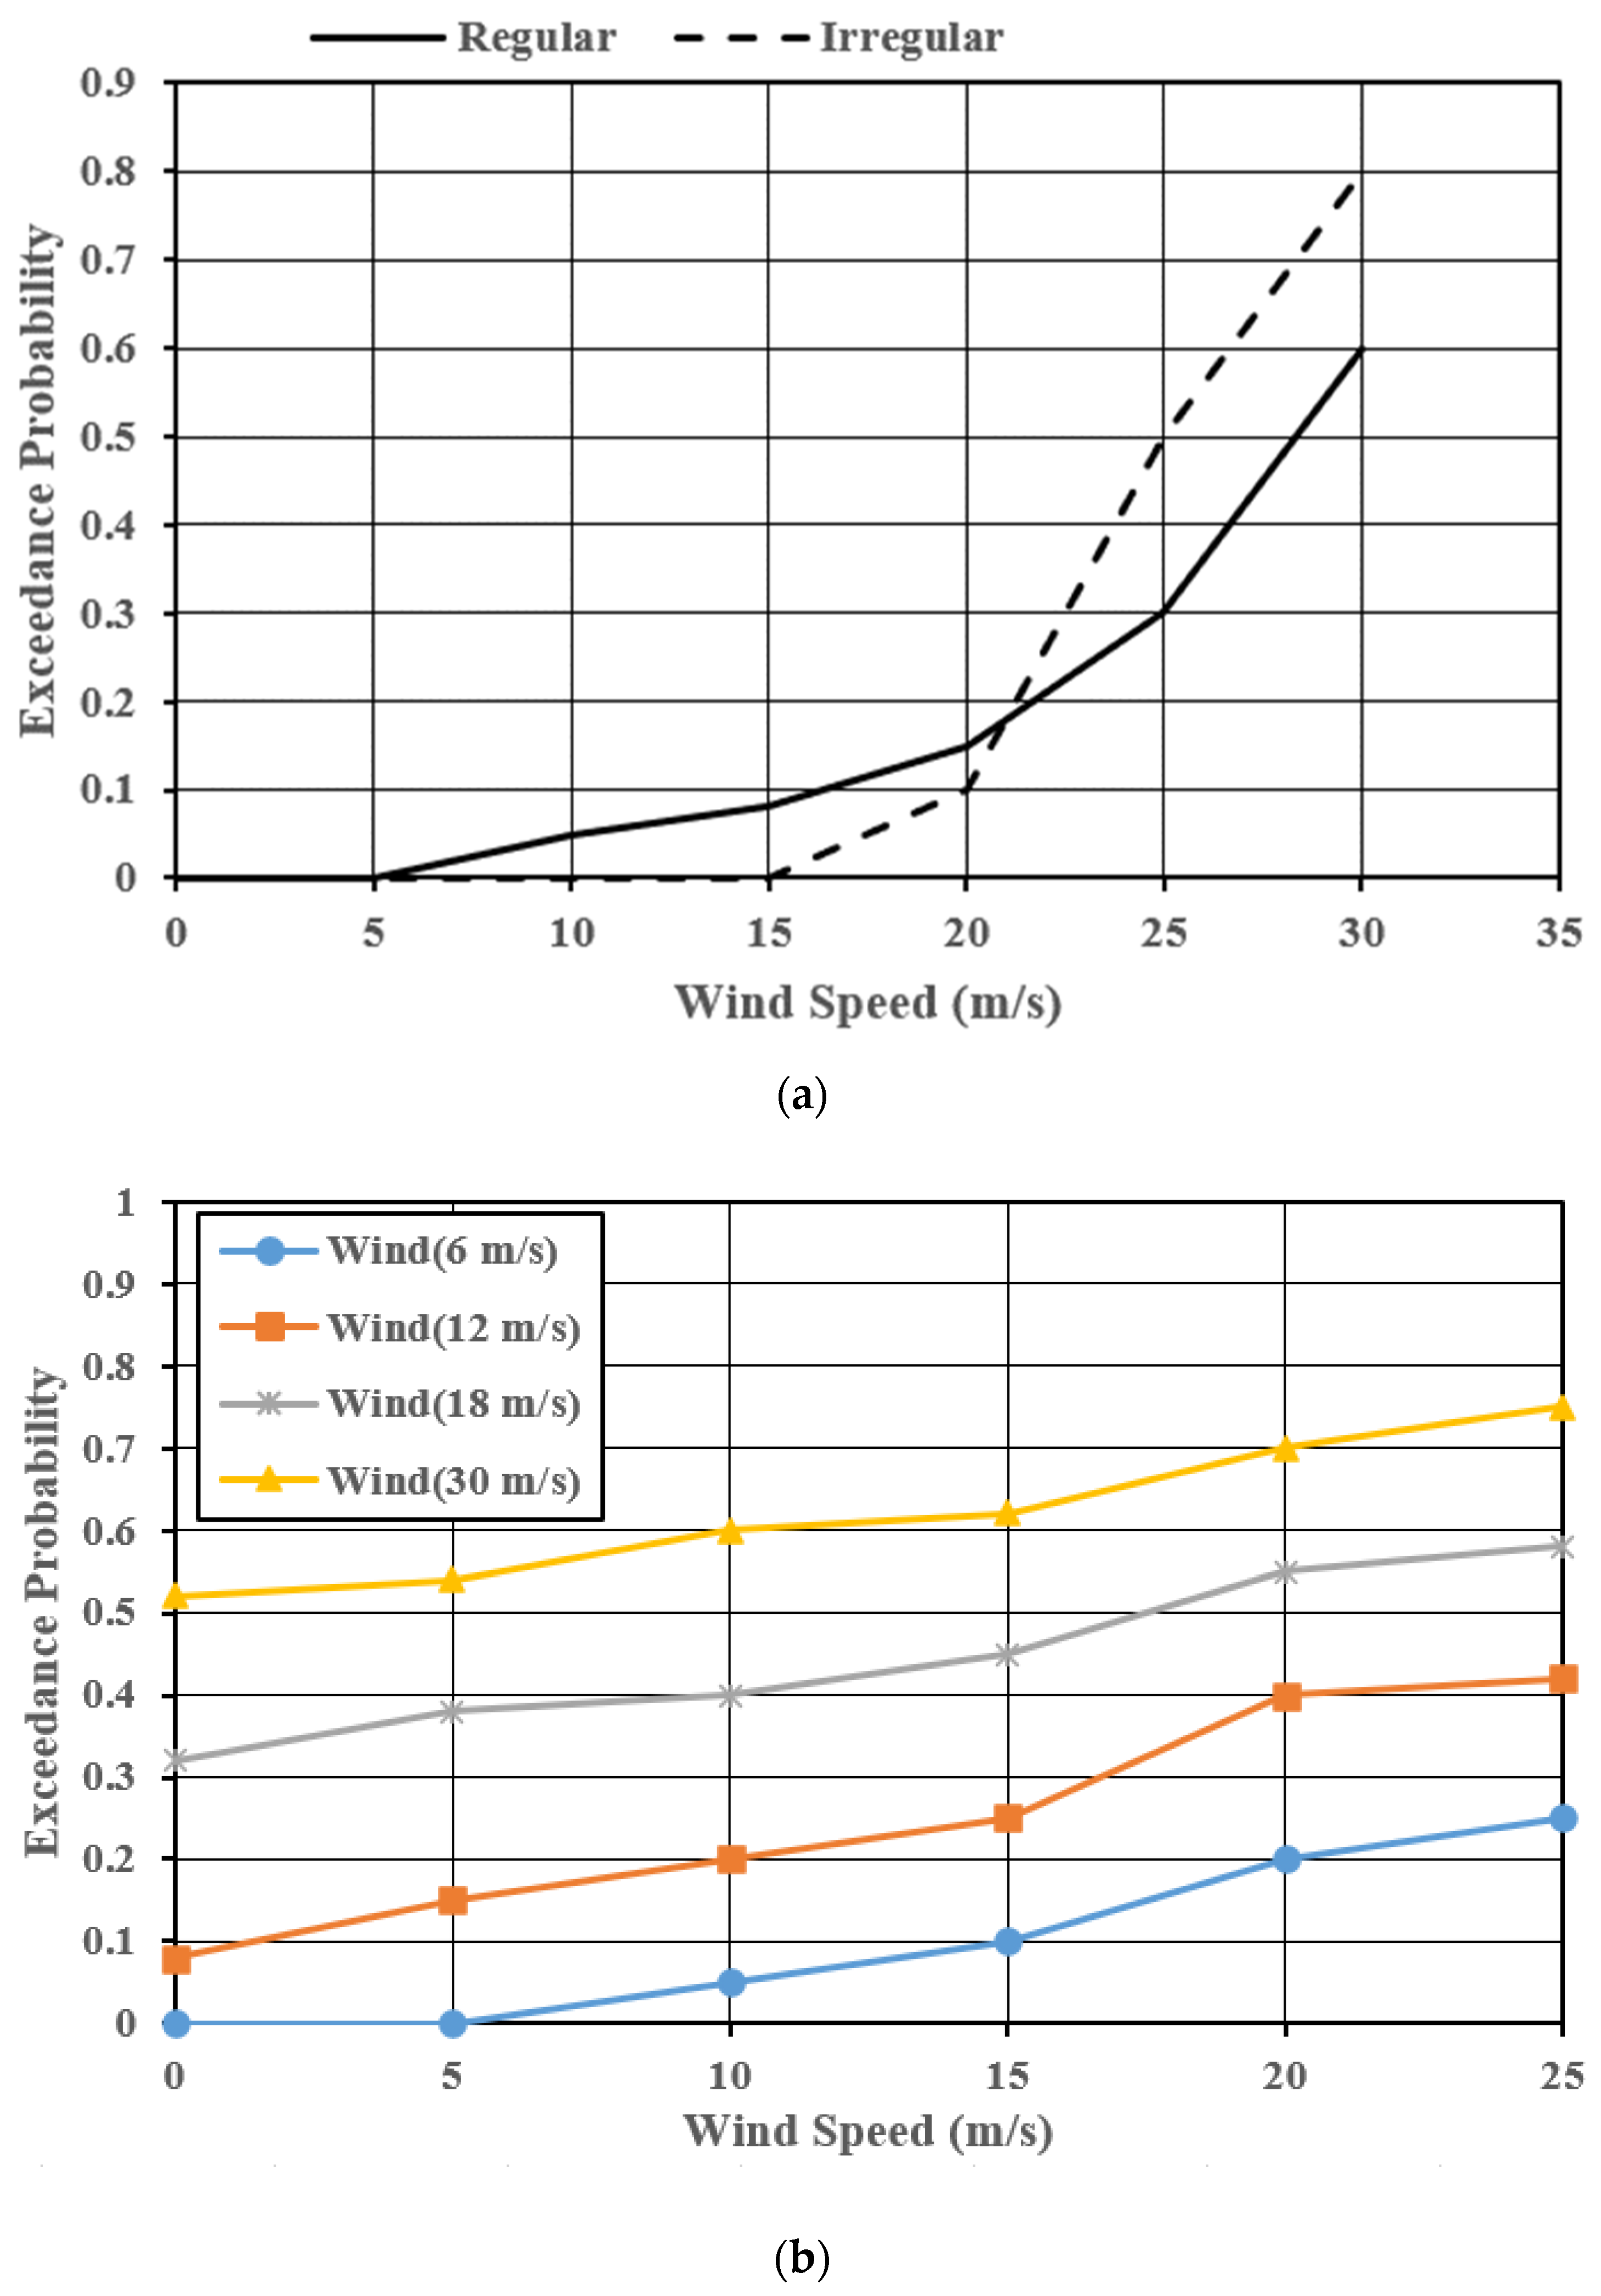
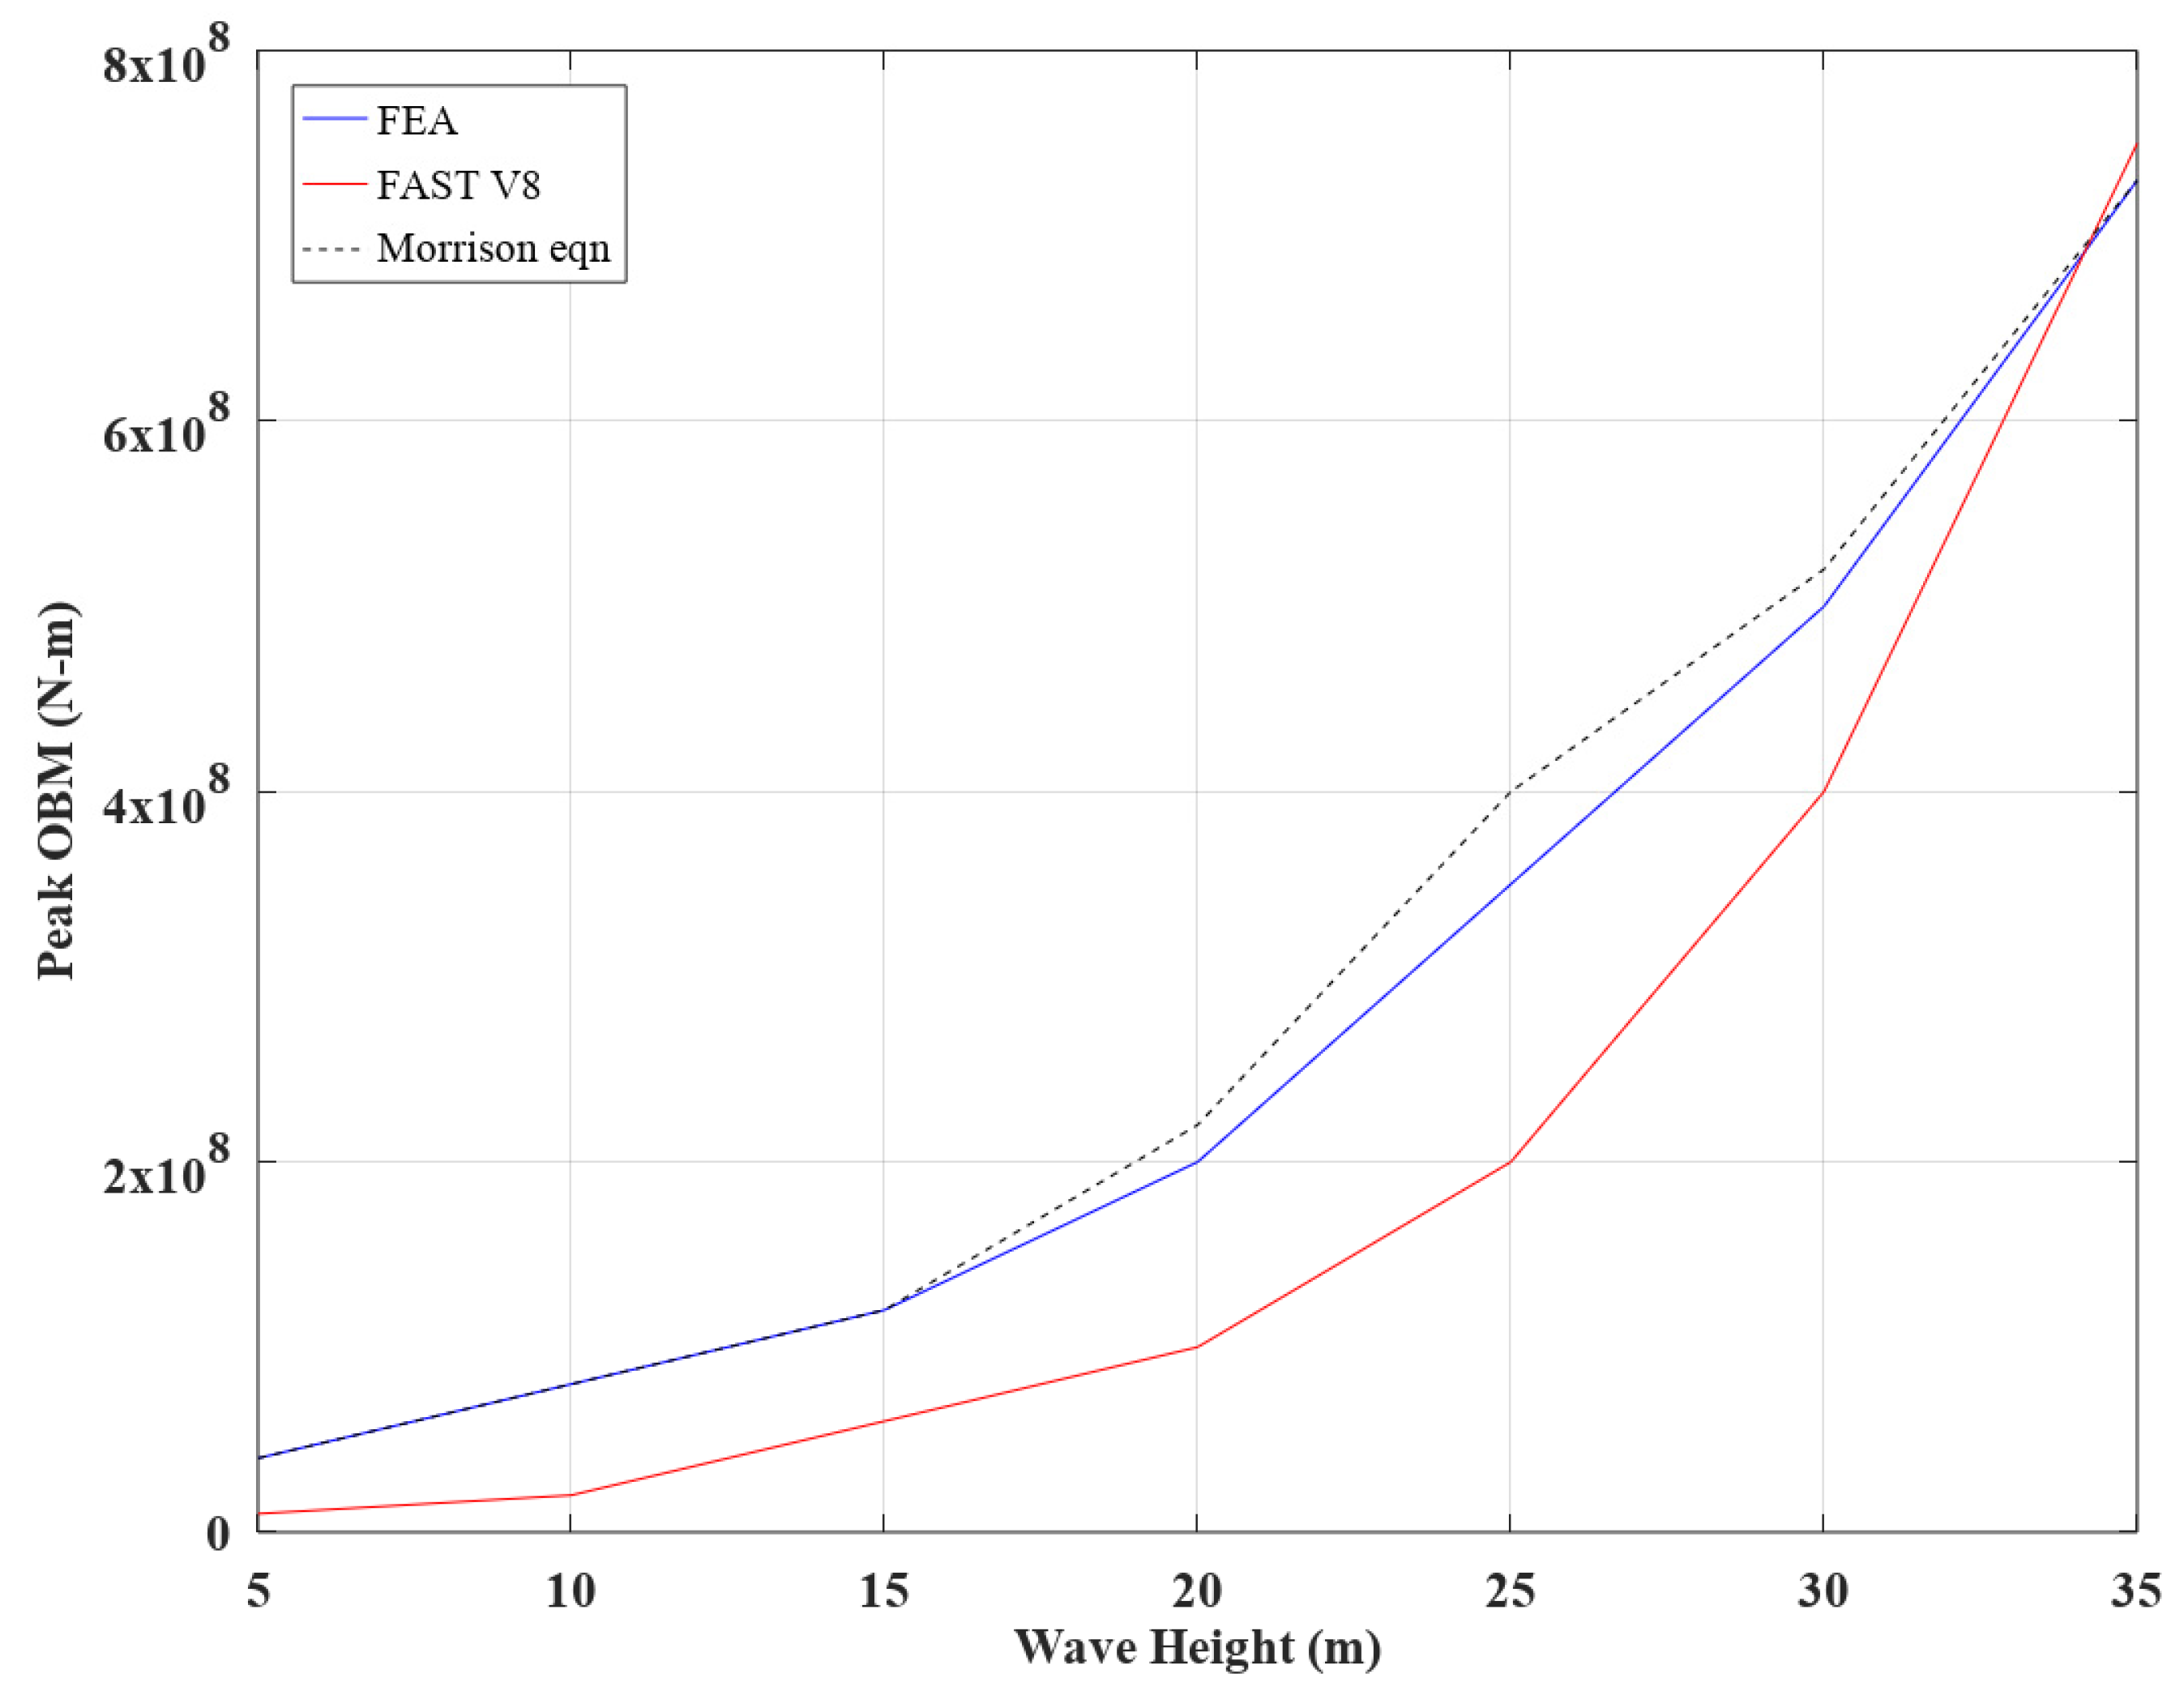
Pokhrel (2019) [137] modeled the reliability of an OWT subjected to hurricane forces; namely, wind and wave forces (Figure 14, Figure 15 and Figure 16). Multiple approaches to reliability analysis—the FEA-based approach, FAST approach, and Morison equation—are presented in this study. The authors compared the increase in the exceedance probability of failure with the increase in wave height for regular waves and irregular waves. The authors also highlighted the importance of fatigue damage studies and nonlinear wave load action for future research.
Sanchez et al. (2019) [138] studied OWF facilities in-use around the globe and the predominant foundation types and discussed the evolution and parameters of the monopiles used in operational wind turbine towers. Further, the article presented a database model of a monopile using the monomials as features to enable a better understanding of the correlation between variables. Foroughi et al. (2009) [139] investigated the characteristics of the waves and the four different types of wave forces (non-breaking wave forces, breaking wave forces, broken wave forces, and uplift forces) that arise during tsunamis. The Morison equation was used to determine the moment and forces generated by the waves affecting the pile foundations. According to this study, the maximum force acted on the pile when the angle of the wave incident was between 0 and 20. Amani et al. (2022) [140] presented a methodology for the analysis and design of seismically liquefiable soils. The authors proposed an additional seven-step methodology to supplement the existing ten-step methodology. These additional steps included assimilation of seismic data, site-response analysis, checking the stability of the structure (ULS check through the concept of the load-utilization ratio), input motion selection, prediction of permanent tilt/rotation, and ground settlement post-liquefaction. The authors validated the method using the observed performance of offshore and nearshore farms in Japan. Bhattacharya et al. (2021) [141] highlighted issues in seismic design, such as liquefaction, which creates problems for monopile-supported foundations. The authors underscored the better performance of floating systems compared to monopile foundation systems in seismic zones due to the minimum inertia loads on floating system foundations. However, large fault ruptures can occur in floating systems. James and Haldar (2022) [142] investigated the influence of multidirectional ground motion using soil–pile–jacket–tower finite element models for large offshore turbines. The authors studied the influence of the jacket base width and embedment length on earthquake resistance. Vertical excitation at higher modes during higher-intensity earthquakes is critical for serviceability design. Hong and Sheng (2022) [143] studied the wind load and wave load requirements for the reliability assessment of wind turbine towers using the FAST package. While studies exist on the effect of tsunami forces on monopile foundation systems, there is limited research on how tsunamis affect floating foundations. Future research may shed more light on risk and design criteria for floating foundations.
3.5. Risk from Lightning
Bouchard et al. [144] estimated the risk of lightning strikes induced by thunderstorms using thresholds and weighting functions, neural networks, and belief functions. Wind energy output improves with the height of towers, but taller towers are increasingly sensitive to lightning damage. Rachidi et al. [145] showed the challenges affecting modern towers, such as upward lightning being neglected in design and construction. The authors also showed that the rotation of blades can influence the number of strikes, as it may trigger lightning. The carbon-reinforced plastics used in towers can worsen the problem. Zhou et al. [146] investigated the lightning attachment characteristic of a 2 MW wind turbine generator using a reduced model. Downward negative lightning strikes occur, and LPSs can intercept front- and side-direction lightning but not back-direction lightning. Furthermore, an increase in the striking distance reduces the capture ratio for the insulation part of the blade. Boopathi et al. [147] surveyed the damage to wind turbines due to multiple causes in India, including lightning. The authors pointed out the seasonal nature of the lightning strikes, which can trigger the need for emergency repairs and blade bolt replacement. Blade damage due to lightning is the most common reason for downtimes, which can last up to 200 days. Geographically, strikes are spread through the Indian regions of Maharashtra, Gujarat, and Tamil Nadu. March [148] described the methodology for and issues in lightning risk assessment for wind turbines. While the IEC provide a methodology for lightning risk assessment, the author pointed out that the method is inadequate. According to the author, the influence of local terrain, the difference in the lightning mechanism with the proximity of turbines, winter lightning, and height above sea level are major factors that influence percentages of upward lightning. The author also discussed the non-convective distribution of monthly variations in lightning at two sites. Matsui et al. [149] investigated improvements in the lightning damage detection model, which can halt wind turbines if damage is detected using ML based on SCADA system data. The authors stated that damage from lightning can expand due to centrifugal force and cause serious secondary damage. They implemented a Gaussian mixture model with SCADA data (rotational speed) for anomaly detection using feature extraction and a learning and assessment method. Becerra et al. [150] examined the incidences of downward lightning, as well as self-initiated upward flashes and upward flashes triggered in other ways, affecting offshore turbines. The authors investigated the risk using the self-consistent leader inception and propagation model. They indicated that only a small fraction of damage can be attributed to downward lightning. Upward lightning can be triggered under low thundercloud fields and a small fraction of active thunderstorms can result in upward lightning being self-initiated. Zalhaf et al. [151] investigated the transient response of WTs when two blades are simultaneously struck by lightning using a time-domain circuit model and verified the results using an experimental model. To better understand the lightning risk and develop protection systems, further research is needed.
4. Conclusions
Owing to technological advancement, larger and taller wind turbines are being developed, thus making them more prone to risks from increasingly frequent natural hazards, such as high-velocity hurricane wind, seismic loads, lightning, and hydrodynamic loads. Given the huge financial investment in wind farms, it is important to make these critical elements of energy infrastructure more resilient and efficient. Each component responds in a unique way to each load type. The risks for wind turbines from the effects of various natural hazards (earthquakes, severe winds, and tsunamis) on wind turbine towers, blades, and foundations were reviewed in this study. This study covered the literature on analysis methods, mathematical simulations, and finite element analysis of wind turbine towers in relation to different natural hazard phenomena. Moreover, component-level testing; full-scale model testing; structural performance evaluations based on probability; and statistical approaches, such as fragility analysis and Bayesian network modeling, were also reviewed. Based on the analysis of the literature, the following conclusions can be summarized.
- For seismic and high-velocity events affecting inland wind turbines, researchers point out that foundation failures are critical. The main areas of study include the effects of higher modes of vibration on design and response, the influences of near-fault and far-fault seismic loads, and the influences of the directionality and characteristics of seismic and wind loads. Integration of data-based and physics-based models is gaining popularity in many fields. More research is needed to utilize monitored data to quantify the seismic risk for wind turbines. While design methodologies have improved over time, accidents and construction errors can trigger failures. Further research should focus on reducing construction errors and improving inspection methodologies.
- Hurricane risk modeling for OWTs relies heavily on hurricane track simulation. This can be computationally challenging, and alternate, simpler methods may be helpful to reduce computation costs. Moreover, frameworks that can accommodate changing risk scenarios in response to climate change (following guidelines from government agencies or agencies such as the Intergovernmental Panel on Climate Change (IPCC)), the latest construction materials, and monitored data from wind turbine farms would be useful for more efficient risk analysis.
- Experimental and analytical methods for studying tsunami risk exist, and there are more research contributions based on experimental methods using scaled-down models. The effects of wave loads, soil–structure interactions, scouring of foundations, and permanent settlement on the design and performance evaluation of wind turbine structures are critical in tsunami risk. There is limited research on tsunami risk for floating foundations. Future research should focus on risk and design criteria for floating foundations in relation to tsunami waves. Moreover, researchers point out the need to include higher modes of vibration in analyses in future research. The transient nature of foundation scour is also potential future research topic.
- Tall wind turbines are sensitive to lightning strikes, which occur with seasonal and geographical variations. Detecting lightning damage is critical, as it can propagate further damage and result in expensive repairs and downtime. While mathematical and experimental methods exist, researchers highlight the need for more research on self-triggered lightning, which results in enhanced risk even under low thundercloud fields. Moreover, further research is needed to explore the extent of structural damage in the towers of WTs from lightning.
Due to the intent to increase the share of renewable energy worldwide, taller wind turbines are expected. However, with changing hazard scenarios, the risks for wind turbines from natural hazards also change. Current research on turbine risk analysis and experimental methods needs further expansion to solve these future challenges.
Author Contributions
Conceptualization, A.P. and B.A.; methodology, A.P.; software, C.P.; validation, A.P., C.P. and B.A.; formal analysis, A.P. and B.A.; investigation, A.P.; resources, A.P. and C.P.; data curation, A.P.; writing—original draft preparation, A.P. and B.A.; writing—review and editing, C.P. and B.A.; visualization, A.P.; supervision, A.P. and B.A.; project administration, A.P. All authors have read and agreed to the published version of the manuscript.
Funding
This research received no external funding.
Data Availability Statement
The articles reviewed in this research were obtained from public resources.
Acknowledgments
The authors would like to acknowledge the reviewers’ efforts and their valuable time and comments.
Conflicts of Interest
The authors declare no conflict of interest.
References
- GWEC. Global Wind Report 2019; Global Wind Energy Council: Brussels, Belgium, 2019. [Google Scholar]
- Share of Electricity Production from Wind, (n.d.) Our World in Data. Available online: https://ourworldindata.org/grapher/share-electricity-wind (accessed on 1 December 2022).
- Wikipedia. Wind Power in the United States. Available online: https://en.wikipedia.org/wiki/Wind_power_in_the_United_States (accessed on 19 December 2022).
- World Forum Offshore Wind (WFO). Global Offshore Wind Report; World Forum Offshore Wind (WFO): Hamburg, Germany, 2022. [Google Scholar]
- Global Wind Energy Council. Offshore Market Outlook to 2030; Global Wind Energy Council: Brussels, Belgium, 2020. [Google Scholar]
- World Forum Offshore Wind. Offshore Wind Worldwide ‘Regulatory Framework in Selected Countries’. Available online: https://www.hoganlovells.com/en/publications/offshore-wind-worldwide_regulatory-framework-in-selected-countries (accessed on 22 November 2022).
- Global Wind Atlas. (n.d.). Globalwindatlas.Info. Available online: https://globalwindatlas.info/en (accessed on 2 December 2022).
- Schmidt, J.; Gruber, K.; Klingler, M.; Klöckl, C.; Camargo, L.R.; Regner, P.; Turkovska, O.; Wehrle, S.; Wetterlund, E. A new perspective on global renewable energy systems: Why trade in energy carriers matters. Energy Environ. Sci. 2019, 12, 2022–2029. [Google Scholar] [CrossRef] [Green Version]
- DNV. Available online: https://www.dnv.com/article/how-do-recent-earthquakes-events-impact-wind-turbines--179350 (accessed on 1 December 2022).
- Ma, Y.; Martinez-Vazquez, P.; Baniotopoulos, C. Wind turbine tower collapse cases: A historical overview. Proc. Inst. Civil Eng. Struct. Build. 2019, 172, 547–555. [Google Scholar] [CrossRef] [Green Version]
- Ishihara, T.; Yamaguchi, A.; Takahara, K.; Mekaru, T.; Matsuura, S. An analysis of damaged wind turbines by typhoon Maemi in 2003. In Proceedings of the Sixth Asia-Pacific Conference on Wind Engineering, Seoul, Korea, 12–14 September 2005; pp. 1413–1428. [Google Scholar]
- Chou, J.-S.; Tu, W.-T. Failure analysis and risk management of a collapsed large wind turbine tower. Eng. Fail. Anal. 2011, 18, 295–313. [Google Scholar] [CrossRef]
- Chen, X.; Xu, J.Z. Structural failure analysis of wind turbines impacted by super typhoon Usagi. Eng. Fail. Anal. 2016, 60, 391–404. [Google Scholar] [CrossRef]
- Science Codex Report. Available online: https://www.sciencecodex.com/nasa_sees_usagi_become_a_typhoon-119661 (accessed on 22 November 2022).
- Li, Z.-Q.; Chen, S.-J.; Ma, H.; Feng, T. Design defect of wind turbine operating in typhoon activity zone. Eng. Fail. Anal. 2013, 27, 165–172. [Google Scholar] [CrossRef]
- Wolfgang, G.; Racansky, V.; Maurer, C.; Freitag, P. Ground Improvement for Wind Turbine Foundations in Europe. Messe Wien (Vienna Austria); European Wind Energy Association (EWEA): Brussels, Belgium, 2013. [Google Scholar]
- Riso DTU. Final Report on Investigation of a Catastrophic Turbine Failures; Technical University of Denmark: Copenhagen, Denmark, 2008. [Google Scholar]
- Porter, L. Strong Wind Destroys Searsburg Wind Turbine, Rutland Herald. Available online: https://www.timesargus.com/news/blade-flies-off-destroying-wind-tower-at-searsburg/article_fc312d10-a65d-51cd-8456-6a50d3eb4dea.html (accessed on 15 October 2022).
- Watts, A. Wind Power Gets Bent out of Shape in Wyoming. Available online: https://wattsupwiththat.com/2011/02/02/wind-power-gets-bent-out-of-shape-in-wyoming/ (accessed on 10 March 2022).
- Potrikus, A. New, Higher Wind Turbine Going up in Place of One That Toppled in the Town of Fenner. Available online: https://www.syracuse.com/news/2012/10/new_higher_wind_turbine_going.html (accessed on 27 December 2022).
- Polacek, K. Wind Turbine Topples in Mill Run, Startles Residents. Available online: https://www.wind-watch.org/news/2014/01/16/wind-turbine-topples-in-mill-run-startles-residents/ (accessed on 27 December 2022).
- Backstrand, J.; Hurtig. Final Report RO 2017:01; Statens Haverikommission: Stockholm, Sweden, 2017.
- PEI. Collapse of Wind Turbine under Investigation; Power Engineering International: Saxony, Germany, 2017. [Google Scholar]
- Elsisi, M.; Tran, M.-Q.; Mahmoud, K.; Lehtonen, M.; Darwish, M.M.F. Robust design of ANFIS-based blade pitch controller for wind energy conversion systems against wind speed fluctuations. IEEE Access 2021, 9, 37894–37904. [Google Scholar] [CrossRef]
- CWIF. Wind Accidents—Caithness Windfarm Information Forum. 2017. Available online: https://slidelegend.com/wind-accidents-caithness-windfarm-information-forum_59e4cd921723dd1b30b8ce69.html (accessed on 9 October 2022).
- Seong, J.; Haigh, S.; Madabhushi, S.; Shrivastava, R.; Veluvolu, R.; Padhy, P. On seismic protection of wind turbine foundations founded on liquefiable soils. Soil Dyn. Earthq. Eng. 2022, 159, 107327. [Google Scholar] [CrossRef]
- Ishihara, T.; Phuc, P.V.; Fujino, Y.; Takahara, K.; Mekaru, T. A filed Test and full dynamic simulation on a stall regulated wind turbine. In Proceedings of the Sixth Asia-Pacific Conference on Wind Engineering (APCWE-VI), Seoul, Korea, 12–14 September 2005. [Google Scholar]
- Wind Action Report. Available online: https://www.windaction.org/posts/43219-typhoon-maemi-downs-wind-turbines-japan (accessed on 16 December 2022).
- The Telegraph. Available online: https://www.telegraph.co.uk/news/2022/02/15/pictured-storms-send-300ft-welsh-wind-turbine-crashing-ground/ (accessed on 19 December 2022).
- Windustry. How Much do Wind Turbines Cost? Available online: https://www.windustry.org/how_much_do_wind_turbines_cost (accessed on 20 December 2022).
- Blewett, D. Weather Guard Lightning Tech. Wind Turbine Cost: Worth the Million-Dollar Price in 2022? Available online: https://weatherguardwind.com/how-much-does-wind-turbine-cost-worth-it/ (accessed on 22 December 2022).
- Prowell, I.; Veers, P. Assessment of Wind Turbine Seismic Risk: Existing Literature and Simple Study of Tower Moment Demand; SANDIA REPORT; Sandia National Laboratories (SNL): Albuquerque, NM, USA; Livermore, CA, USA, 2009.
- Ntambakwa, E.; Rogers, M. Seismic Forces for Wind Turbine Foundations Wind Turbine Structures, Dynamics, Loads and Control; Garrad Hassan America, Inc.: San Diego, CA, USA, 2009. [Google Scholar]
- Agbayani, N.A. Design challenges in international wind power projects: From foreign codes to computer coding in a small office setting. In Proceedings of the 71st Annual Structural Engineers Association of California (SEAOC) Convention, Santa Barbara, CA, USA; 2002; pp. 117–132. [Google Scholar]
- ICBO. Uniform Building Code; International Conference of Building Officials: Washington, DC, USA, 1997; Volume 2. [Google Scholar]
- GL, Rules and Guidelines, Industrial Services. Guidelines for Certification of Offshore Wind Turbines; Germanischer Lloyd: Hamburg, Germany, 2005. [Google Scholar]
- IEC. Wind Turbines—Part 1: Design Requirements; International Electrotechnical Commission: Geneva, Switzerland, 2005. [Google Scholar]
- DNV Risø National Laboratory. Guidelines for Design of Wind Turbines, 2nd ed.; Wind Energy Department, Risø National Laboratory: Risø, Denmark, 2002. [Google Scholar]
- Anderson, C.; Bertero, V. Uncertainties in establishing design earthquakes. J. Struct. Eng. 1987, 113, 1709–1724. [Google Scholar] [CrossRef]
- Bertero, V.V.; Mahin, S.A.; Herrera, R.A. Aseismic design implications of near-fault San Fernando earthquake records. Earthq. Eng. Struct. Dyn. 1978, 6, 31–42. [Google Scholar] [CrossRef]
- Hall, J.F.; Heaton, T.H.; Halling, M.W.; Wald, D. Near-source ground motion and its effects on flexible buildings. Earthq. Spectra 1995, 11, 569–605. [Google Scholar] [CrossRef]
- Attalla, M.; Paret, T.; Freeman, S. Near source behavior of buildings under pulse type earthquakes. In Proceedings of the 6th U.S. National Conference on Earthquake Engineering, Seattle, WA, USA, 31 May–4 June 1998. [Google Scholar]
- Iwan, W.D. Drift spectrum: Measure of demand for earthquake ground motions. Eng. Struct. 1997, 123, 397–404. [Google Scholar] [CrossRef]
- Chopra, A.K.; Chintanapakdee, C. Comparing response of SDF systems to near-fault and far-fault earthquake motions in the context of spectral regions. Earthq. Eng. Struct. Dyn. 2001, 30, 1769–1789. [Google Scholar] [CrossRef]
- Hatzigeorgiou, G.D. Ductility demand spectra for multiple near- and far-fault earthquakes. Soil Dyn. Earthq. Eng. 2010, 30, 170–183. [Google Scholar] [CrossRef]
- Kalkan, E.; Kunnath, S.K. Effects of Fling Step and Forward Directivity on Seismic Response of Buildings. Earthq. Spectra 2006, 22, 367–390. [Google Scholar] [CrossRef]
- Alavi, B.; Krawinkler, H. Behavior of moment-resisting frame structures subjected to near-fault ground motions. Earthq. Eng. Struct. Dyn. 2004, 33, 687–706. [Google Scholar] [CrossRef]
- Baker, J. Quantitative classification of near-fault ground motions using wavelet analysis. Bull. Seism. Soc. Am. 2007, 97, 1486–1501. [Google Scholar] [CrossRef]
- Bray, J.; Rodriguez-Mark, A. Characterization of forward-directivity ground motions in the near-fault region. Soil Dyn. Earthq. Eng. 2004, 24, 815–828. [Google Scholar] [CrossRef]
- Somerville, P.G. Magnitude scaling of the near fault rupture directivity pulse. Phys. Earth Planet. Inter. 2003, 137, 201–212. [Google Scholar] [CrossRef]
- Hwang, H.H.; Huo, J.-R. Generation of hazard-consistent fragility curves. Soil Dyn. Earthq. Eng. 1994, 13, 345–354. [Google Scholar] [CrossRef]
- Baker, J. Efficient Analytical Fragility Function Fitting Using Dynamic Structural Analysis. Earthq. Spectra 2005, 31, 579–599. [Google Scholar] [CrossRef]
- Hwang, H.H.M.; Jaw, J. Probabilistic damage analysis of structures. Eng. Struct. 1990, 116, 1992–2007. [Google Scholar] [CrossRef]
- Eads, L.; Miranda, E.; Krawinkler, H.; Lignos, D. An efficient method for estimating the collapse risk of structures in seismic regions. Earthq. Eng. Struct. Dyn. 2013, 42, 25–41. [Google Scholar] [CrossRef]
- Lignos, D.G.; Kolios, D.; Miranda, E. Fragility assessment of reduced beam section moment connections. Eng. Struct. 2010, 136, 1140–1150. [Google Scholar] [CrossRef]
- Ramirez, C.M.; Lignos, D.; Miranda, E.; Kolios, D. Fragility functions for pre-Northridge welded steel moment-resisting beam-to-column connections. Eng. Struct. 2012, 45, 574–584. [Google Scholar] [CrossRef]
- Ellingwood, B.R.; Celik, O.C.; Kinali, K. Fragility assessment of building structural systems in Mid-America. Earthq. Eng. Struct. Dyn. 2007, 36, 1935–1952. [Google Scholar] [CrossRef]
- Nielson, B.G.; DesRoches, R. Seismic fragility methodology for highway bridges using a component level approach. Earthq. Eng. Struct. Dyn. 2007, 36, 823–839. [Google Scholar] [CrossRef]
- Sousa, L.; Silva, A.; Marques, M.; Crowley, H.; Pinho, R. Including multiple IMTs in the fragility functions for earthquake loss estimation. In Proceedings of the 2nd International Conference on Vulnerability and Risk Analysis and Management, Liverpool, UK, 13–16 July 2014; pp. 1716–1725. [Google Scholar]
- Kafali, C.; Grigoriu, M. Seismic fragility analysis. In Proceedings of the 9th ASCE Specialty Conference on Mechanics and Structural Reliability (PMC), Albuquerque, NM, USA, 26–28 July 2004. [Google Scholar]
- Nuta, E.; Christopoulos, C.; Packer, J.A.P.A. Methodology for seismic risk assessment for tubular steel wind turbine towers: Application to Canadian seismic environment. Can. J. Civ. Eng. 2011, 38, 293–304. [Google Scholar] [CrossRef]
- Prowell, I.; Veletzos, M.; Elgamal, A.; Restrepo, J. Experimental and numerical seismic response of a 65 kW wind turbine. J. Earthq. Eng. 2009, 13, 1172–1190. [Google Scholar] [CrossRef]
- Bazeos, N.; Hatzigeorgiou, G.; Hondros, I.; Karamaneas, H.; Karabalis, D.; Beskos, D. Static, seismic and stability analyses of a prototype wind turbine steel tower. Eng. Struct. 2002, 24, 1015–1025. [Google Scholar] [CrossRef]
- Patil, A. Response of a Wind Turbine Structure to Strong Ground Motions and High Velocity Winds. Ph.D. Dissertation, Florida State University, Tallahassee, FL, USA, 2015. [Google Scholar]
- Prowell, I.; Elgamal, A.; Uang, C.; Jonkman, J. Estimation of Seismic Load Demand for a Wind Turbine in the Time Domain; Conference Paper NREL CP-500-47536; National Renewable Energy Laboratory: Golden, CO, USA, 2010.
- Lavassas, I.; Nikolaidis, G.; Zervas, P.; Baniotopoulos, C. Design of Large Scale Wind Turbine Towers In Seismic Areas; Aristotle University of Thessaloniki: Volos, Greece, 2012. [Google Scholar]
- Ishihara, T.; Sarwar, M.W. Numerical and theoretical study on response of wind turbines. In Proceedings of the European Wind Energy Conference and Exhibition, Tokyo, Japan, 31 March–3 April 2008; pp. 1–5. [Google Scholar]
- Hanler, M.; Ritchel, U.; Warnke, I. Systematic modelling of wind turbine dynamics and earthquake loads on wind turbines. In Proceedings of the European Wind Energy Conference and Exhibition, European Wind Energy Association, Athens, Greece, 27 February–2 March 2006; pp. 1–6. [Google Scholar]
- Prowell, I.; Veletzos, M.; Elgamal, A.; Restrepo, J. Shake table test of A 65 kW wind turbine and computational simulation. In Proceedings of the 14th World Conference on Earthquake Engineering, Beijing, China, 12–17 October 2008. [Google Scholar]
- Zhao, X.; Maisser, P. Seismic response analysis of wind turbine towers including soil- structure interaction. Proc. Inst. Mech. Eng. 2006, 220, 53. [Google Scholar] [CrossRef]
- Quilligan, A.; O’Connor, A.; Pakrashi, V. Fragility analysis of steel and concrete wind turbine towers. Eng. Struct. 2012, 36, 270–282. [Google Scholar] [CrossRef]
- Kawai, H.; Michishita, K.; Deguchi, A. Design wind loads on a wind turbine for strong wind. In Proceedings of the BBAA VI International Colloquium on Bluff Bodies Aerodynamics & Applications, Milano, Italy, 20–24 July 2008. [Google Scholar]
- Lee, K.-S.; Bang, H.-J. A study on the prediction of lateral buckling load for wind turbine tower structures. Int. J. Precis. Eng. Manuf. 2012, 13, 1829–1836. [Google Scholar] [CrossRef]
- Chien, C.-W.; Jang, J.-J. A study of wind-resistant safety design of wind turbines tower system. In Proceedings of the Seventh Asia-Pacific Conference on Wind Engineering, Taipei, Taiwan, 8–12 November 2009. [Google Scholar]
- Rose, S.; Jaramillo, P.; Small, M.; Grossmann, I.; Apt, J. Quantifying the hurricane risk to offshore wind turbines. Proc. Natl. Acad. Sci. USA 2012, 109, 3247–3252. [Google Scholar] [CrossRef] [PubMed] [Green Version]
- Ellingwood, B.R.; Rosowsky, D.V.; Li, Y.; Kim, J.H. Fragility assessment of light-frame wood construction subjected to wind and earthquake hazards. Eng. Struct. 2004, 130, 1921–1930. [Google Scholar] [CrossRef]
- Agarwal, P.; Manuel, L. Simulation of offshore wind turbine response for extreme limit states. In Proceedings of the 26th International Conference on Offshore Mechanics and Arctic Engineering, OMEA, San Diego, CA, USA, 10–15 June 2007. [Google Scholar]
- ATC. Earthquake Damage Evaluation Data for California; Applied Technical Council: Redwood City, CA, USA, 1985. [Google Scholar]
- Jernigan, J.; Hwang, H. Development of bridge fragility curves. In Proceedings of the 7th US National Conference on Earthquake Engineering, EERI, Boston, MA, USA, 21–25 July 2002. [Google Scholar]
- Mander, J.; Basoz, N. Seismic fragility curve theory for highway bridges. In Proceedings of the 5th US Conference on Lifeline Earthquake Engineering, ASCE, Seattle, WA, USA, 9–12 May 1999. [Google Scholar]
- Monti, G.; Nisticò, N. Simple probability-based assessment of bridges under scenario earthquakes. J. Bridg. Eng. 2002, 7, 104–114. [Google Scholar] [CrossRef]
- Karim, K.R.; Yamazaki, F. A simplified method of constructing fragility curves for highway bridges. Earthq. Eng. Struct. Dyn. 2003, 32, 1603–1626. [Google Scholar] [CrossRef]
- Mackie, K.R.; Stojadinović, B. Post-earthquake functionality of highway overpass bridges. Earthq. Eng. Struct. Dyn. 2006, 35, 77–93. [Google Scholar] [CrossRef]
- Basoz, N.; Kiremidjian, A. Development of empirical fragility curves for bridges. In Proceedings of the 5th US Conference on Lifeline Earthquake Engineering, ASCE, Seattle, WA, USA, 9–12 May 1999. [Google Scholar]
- Shinozuka, M.; Feng, M.Q.; Lee, J.; Naganuma, T. Statistical analysis of fragility curves. J. Eng. Mech. 2000, 126, 1224–1231. [Google Scholar] [CrossRef] [Green Version]
- Yun, S.-Y.; Hamburger, R.; Cornell, A.; Foutch, D. Seismic performance evaluation for steel moment frames. J. Struct. Eng. 2002, 128, 534–545. [Google Scholar] [CrossRef]
- Jeong, S.-H.; Elnashai, A. Probabilistic fragility analysis parametrized by fundamental response quantities. Eng. Struct. 2007, 29, 1238–1251. [Google Scholar] [CrossRef]
- Cornell, C.A.; Jalayer, F.; Hamburger, R.O.; Foutch, D.A. Probabilistic basis for 2000 SAC federal emergency management agency steel moment frame guidelines. Eng. Struct. 2002, 128, 526–533. [Google Scholar] [CrossRef] [Green Version]
- Nielson, B. Analytical Fragility Curves for Highway Bridges in Moderate Seismic Zones. Ph.D. Thesis, Georgia Institute of Technology, Altanta, GA, USA, 2005. [Google Scholar]
- Jonkman, J.; Buhl, M. FAST User’s Guide, National Renewable Energy Laboratory Technical Report; NREL/EL, 500-38230. 2005. Available online: https://openfast.readthedocs.io/en/main/_downloads/d8bd014121d6505cb25cf49bee5eaa80/Old_FAST6_UsersGuide.pdf (accessed on 1 December 2022).
- Jonkman, B. TurbSim User’s Guide. Version 1.50, National Renewable Energy Laboratory Technical Report, NREL/TP, 500-46198. 2009. Available online: https://www.nrel.gov/docs/fy09osti/46198.pdf (accessed on 1 December 2022).
- Kim, E.; Manuel, L. Hurricane-induced loads on offshore wind turbines with considerations for nacelle yaw and blade pitch control. Wind. Eng. 2014, 38, 413–423. [Google Scholar] [CrossRef]
- Guo, L.; Uang, C.-M.; Elgamal, A.; Prowell, I.; Zhang, S. Pushover analysis of a 53 m high wind turbine tower. Adv. Sci. Lett. 2011, 4, 1–7. [Google Scholar] [CrossRef]
- Matic, P. Numerically predicting ductile material behavior from tensile specimen response. Theor. Appl. Fract. Mech. 1985, 4, 13–28. [Google Scholar] [CrossRef]
- Voth, A. Branch Plate-to-Circular Hollow Structural Section Connections. Ph.D. Thesis, University of Toronto, Toronto, ON, Canada, 2010. [Google Scholar]
- Ciang, C.C.; Lee, J.-R.; Bang, H.-J. Structural health monitoring for a wind turbine system: A review of damage detection methods. Meas. Sci. Technol. 2008, 19, 122001. [Google Scholar] [CrossRef] [Green Version]
- Katsaprakakis, D.A.; Papadakis, N.; Ntintakis, I. A comprehensive analysis of wind turbine blade damage. Energies 2021, 14, 5974. [Google Scholar] [CrossRef]
- Flemming, M.L.; Troels, S. New lightning qualification test procedure for large wind turbine blades. In Proceedings of the International Conference Lightning and Static Electricity, Blackpool, UK, 16–19 September 2003. [Google Scholar]
- Abdussalam, S.R. Damage and Fracture Mechanics of Composite Materials; University of Manitoba: Winnipeg, MB, Canada, 2000. [Google Scholar]
- Davidson, B.D.; Gharibian, S.J.; Yu, L. Evaluation of energy release rate-based approaches for predicting delamination growth in laminated composites. Int. J. Fract. 2000, 105, 343–365. [Google Scholar] [CrossRef]
- Jorgensen, E.R.; Borum, K.K.; McGugan, M.; Thomsen, C.L.; Jensen, F.M.; Debel, C.P.; Sorensen, B.F. Full Scale Testing of Wind Turbine Blade to Failure-Flapwise Loading, Riso National Laboratory, Riso-R-1392(EN), Roskilde. 2004. Available online: https://www.osti.gov/etdeweb/servlets/purl/20559467 (accessed on 1 December 2022).
- Chou, J.-S.; Chiu, C.-K.; Huang, I.-K.; Chi, K.-N. Failure analysis of wind turbine blade under critical wind loads. Eng. Fail. Anal. 2013, 27, 99–118. [Google Scholar] [CrossRef]
- Hallowell, S.T.; Myers, A.T.; Arwade, S.R.; Pang, W.; Rawal, P.; Hines, E.M.; Hajjar, J.F.; Qiao, C.; Valamanesh, V.; Wei, K.; et al. Hurricane risk assessment of offshore wind turbines. Renew. Energy 2018, 125, 234–249. [Google Scholar] [CrossRef]
- Hallowell, S.T.; Arwade, S.R.; Fontana, C.M.; DeGroot, D.J.; Aubeny, C.P.; Diaz, B.D.; Myers, A.T.; Landon, M.E. System reliability of floating offshore wind farms with multiline anchors. Ocean Eng. 2018, 160, 94–104. [Google Scholar] [CrossRef]
- Dueñas-Osorio, L.; Basu, B. Unavailability of wind turbines due to wind-induced accelerations. Eng. Struct. 2008, 30, 885–893. [Google Scholar] [CrossRef]
- Carroll, J.; McDonald, A.; Martin, O.B.; McMillan, D.; Bakhshi, R. Offshore Wind Turbine Sub-Assembly Failure Rates through Time: EWEA 2015 Annual Event. 2015. Available online: https://strathprints.strath.ac.uk/54985/1/Carroll_etal_EWEA_2015_Offshore_wind_turbine_and_sub_assembly_failure_rates.pdf (accessed on 1 December 2022).
- Kim, E.; Manuel, L. A framework for hurricane risk assessment of offshore wind farms. In Proceedings of the International Conference on Offshore Mechanics and Arctic Engineering; American Society of Mechanical Engineers: Rio de Janeiro, Brazil, 2012; Volume 44946, pp. 617–622. [Google Scholar]
- Alduse, B.; Patil, A. A Bayesian network model for assessing hurricane vulnerability of offshore wind farm. Structures Department, Stanley D. Lindsey Associates, Brentwood, TN, USA. 2023; preprint. [Google Scholar]
- FEMA, HAZUS 5.1; Hazus Hurricane Model Technical Manual, Washington, D.C., July 2022. Available online: https://www.fema.gov/sites/default/files/documents/fema_hazus-hurricane-model-technical-manual-5-1.pdf (accessed on 1 December 2022).
- Staid, A.; Guikema, S.D. Risk analysis for US offshore wind farms: The need for an integrated approach. Risk Anal. 2015, 35, 587–593. [Google Scholar] [CrossRef] [PubMed]
- Wilkie, D.; Galasso, C. A probabilistic framework for offshore wind turbine loss assessment. Renew. Energy 2020, 147, 1772–1783. [Google Scholar] [CrossRef]
- Yin, P.-Y.; Wu, T.-H.; Hsu, P.-Y. Risk management of wind farm micro-siting using an enhanced genetic algorithm with simulation optimization. Renew. Energy 2017, 107, 508–521. [Google Scholar] [CrossRef]
- Carroll, J.; McDonald, A.; McMillan, D. Failure rate, repair time and unscheduled O&M cost analysis of offshore wind turbines. Wind Energy 2016, 19, 1107–1119. [Google Scholar]
- Carroll, J.; McDonald, A.; Dinwoodie, I.; McMillan, D.; Revie, M.; Lazakis, I. Availability, operation and maintenance costs of offshore wind turbines with different drive train configurations. Wind. Energy 2017, 20, 361–378. [Google Scholar] [CrossRef] [Green Version]
- Tavner, P.; Edwards, C.; Brinkman, A.; Spinato, F. Influence of wind speed on wind turbine reliability. Wind. Eng. 2006, 30, 55–72. [Google Scholar] [CrossRef]
- Sørensen, J.N.; Shen, W.Z. Numerical modeling of wind turbine wakes. J. Fluids Eng. 2002, 124, 393–399. [Google Scholar] [CrossRef]
- Chou, J.S.; Tu, W.T. Lessons learned from a collapsed wind turbine tower in Taiwan. In Proceedings of the International Conference on Computing in Civil and Building Engineering, Austin, TX, USA, 24–27 June 2009. [Google Scholar]
- Amirinia, G.; Jung, S. Buffeting response analysis of offshore wind turbines subjected to hurricanes. Ocean Eng. 2017, 141, 1–11. [Google Scholar] [CrossRef]
- Powell, M.D.; Cocke, S. Hurricane wind fields needed to assess risk to offshore wind farms. Proc. Natl. Acad. Sci. USA 2012, 109, E2192–E2194. [Google Scholar] [CrossRef] [Green Version]
- Dai, K.; Sheng, C.; Zhao, Z.; Yi, Z.; Camara, A.; Bitsuamlak, G. Nonlinear response history analysis and collapse mode study of a wind turbine tower subjected to tropical cyclonic winds. Wind. Struct. 2017, 25, 79–100. [Google Scholar]
- IEC 61400-3; Design Requirements for Offshore Wind Turbines. IEC: London, UK, 2009.
- Vickery, P.J.; Skerlj, P.F.; Steckley, A.C.; Twisdale, L.A. Hurricane wind field model for use in hurricane simulations. Eng. Struct. 2000, 126, 1203–1221. [Google Scholar] [CrossRef]
- Sun, B.; Li, Y.; Wang, Z.; Yang, D.; Ren, Y.; Feng, Q. A combined physics of failure and Bayesian network reliability analysis method for complex electronic systems. Process. Saf. Environ. Prot. 2021, 148, 698–710. [Google Scholar] [CrossRef]
- Su, C.; Fu, Y.Q. Reliability assessment for wind turbines considering the influence of wind speed using Bayesian network. Eksploat. Niezawodn. 2014, 16, 1–8. [Google Scholar]
- Chen, B.; Tavner, P.J.; Feng, Y.; Song, W.W.; Qiu, Y.N. Bayesian Network for Wind Turbine Fault Diagnosis. 2012. Available online: https://dro.dur.ac.uk/11029/1/11029.pdf (accessed on 1 December 2022).
- Gabriel, A.; Tecklenburg, B.; Guillouet, Y.; Torres, F.S. Threat analysis of offshore wind farms by Bayesian networks-a new modeling approach. In Proceedings of the ISCRAM 2021 Conference Proceedings-18th International Conference on Information Systems for Crisis Response and Management, Omaha, NE, USA, 28–31 May 2021; pp. 174–185. [Google Scholar]
- Lu, Q.; Zhang, W. Integrating dynamic Bayesian network and physics-based modeling for risk analysis of a time-dependent power distribution system during hurricanes. Reliab. Eng. Syst. Saf. 2022, 220, 108290. [Google Scholar] [CrossRef]
- Li, H.; Soares, C.G.; Huang, H.-Z. Reliability analysis of a floating offshore wind turbine using Bayesian Networks. Ocean Eng. 2020, 217, 107827. [Google Scholar] [CrossRef]
- Adedipe, T.; Shafiee, M.; Zio, E. Bayesian network modelling for the wind energy industry: An overview. Reliab. Eng. Syst. Saf. 2020, 202, 107053. [Google Scholar] [CrossRef]
- Knutson, T.R.; Chung, M.V.; Vecchi, G.; Sun, J.; Hsieh, T.L.; Smith, A.J. Climate change is probably increasing the intensity of tropical cyclones. Sci. Brief Review. 2021, 4570334. [Google Scholar] [CrossRef]
- Bhattacharya, S.; Lombardi, D.; Amani, S.; Aleem, M.; Prakhya, G.; Adhikari, S.; Vimalan, N. Physical mod-elling of offshore wind turbine foundations for TRL (Technology Readiness Level) studies. J. Mar. Sci. Eng. 2021, 9, 589. [Google Scholar] [CrossRef]
- Bhattacharya, S.; De Risi, R.; Lombardi, D.; Ali, A.; Demirci, H.; Haldar, S. On the seismic analysis and design of offshore wind turbines. Soil Dyn. Earthq. Eng. 2021, 145, 106692. [Google Scholar] [CrossRef]
- Fuhrman, D.R.; Madsen, P.A. Tsunami generation, propagation, and run-up with a high-order Boussinesq model. Coast. Eng. 2009, 56, 747–758. [Google Scholar] [CrossRef]
- Fuhrman, D.R.; Baykal, C.; Sumer, B.M.; Jacobsen, N.G.; Fredsøe, J. Numerical simulation of wave-induced scour and backfilling processes beneath submarine pipelines. Coast. Eng. 2014, 94, 10–22. [Google Scholar] [CrossRef]
- Larsen, B.E.; Arbøll, L.K.; Kristoffersen, S.F.; Carstensen, S.; Fuhrman, D.R. Experimental study of tsunami-induced scour around a monopile foundation. Coast. Eng. 2018, 138, 9–21. [Google Scholar] [CrossRef]
- Larsen, B.E.; Fuhrman, D.R.; Baykal, C.; Sumer, B.M. Tsunami-induced scour around monopile foundations. Coast. Eng. 2017, 129, 36–49. [Google Scholar] [CrossRef] [Green Version]
- Pokhrel, J.; Seo, J. Natural hazard vulnerability quantification of offshore wind turbine in shallow water. Eng. Struct. 2019, 192, 254–263. [Google Scholar] [CrossRef]
- Sánchez, S.; López-Gutiérrez, J.-S.; Negro, V.; Esteban, M.D. Foundations in offshore wind farms: Evolution, characteristics and range of use. Analysis of main dimensional parameters in monopile foundations. J. Mar. Sci. Eng. 2019, 7, 441. [Google Scholar] [CrossRef] [Green Version]
- Foroughi, A.R.; Sleeman, W.; Scott, R. Offshore disasters: Wave forces on offshore and coastal structures due to Tsunamis. Disaster Manag. Hum. Health Risk Reducing Risk Improv. Outcomes 2009, 110, 251. [Google Scholar]
- Amani, S.; Prabhakaran, A.; Bhattacharya, S. Design of monopiles for offshore and nearshore wind turbines in seismically liquefiable soils: Methodology and validation. Soil Dyn. Earthq. Eng. 2022, 157, 107252. [Google Scholar] [CrossRef]
- Bhattacharya, S.; Biswal, S.; Aleem, M.; Amani, S.; Prabhakaran, A.; Prakhya, G.; Lombardi, D.; Mistry, H.K. Seismic design of offshore wind turbine: Good, bad and unknowns. Energies 2021, 14, 3496. [Google Scholar] [CrossRef]
- James, M.; Haldar, S. Seismic vulnerability of jacket supported large offshore wind turbine considering multidirectional ground motions. Structures 2022, 43, 407–423. [Google Scholar] [CrossRef]
- Hong, H.; Sheng, C. Reliability-based calibration of site-specific design typhoon wind and wave loads for wind turbine. Eng. Struct. 2022, 270, 114885. [Google Scholar] [CrossRef]
- Bouchard, A.; Buguet, M.; Chan-Hon-Tong, A.; Dezert, J.; Lalande, P. Comparison of different forecasting tools for short-range lightning strike risk assessment. Nat. Hazards 2022, 1–37. [Google Scholar] [CrossRef]
- Rachidi, F.; Rubinstein, M.; Montanya, J.; Bermudez, J.-L.; Sola, R.R.; Sola, G.; Korovkin, N. A review of current issues in lightning protection of new-generation wind-turbine blades. IEEE Trans. Ind. Electron. 2008, 55, 2489–2496. [Google Scholar] [CrossRef]
- Zou, L.; Cheng, H. Research on wind turbine blade surface damage identification based on improved convolution neural network. Appl. Sci. 2022, 12, 9338. [Google Scholar] [CrossRef]
- Boopathi, K.; Mishnaevsky, L., Jr.; Sumantraa, B.; Premkumar, S.A.; Thamodharan, K.; Balaraman, K. Failure mechanisms of wind turbine blades in India: Climatic, regional, and seasonal variability. Wind. Energy 2022, 25, 968–979. [Google Scholar] [CrossRef]
- March, V. Key issues to define a method of lightning risk assessment for wind farms. Electr. Power Syst. Res. 2018, 159, 50–57. [Google Scholar] [CrossRef]
- Matsui, T.; Yamamoto, K.; Ogata, J. Study on improvement of lightning damage detection model for wind turbine blade. Machines 2021, 10, 9. [Google Scholar] [CrossRef]
- Becerra, M.; Long, M.; Schulz, W.; Thottappillil, R. On the estimation of the lightning incidence to offshore wind farms. Electr. Power Syst. Res. 2018, 157, 211–226. [Google Scholar] [CrossRef]
- Zalhaf, A.S.; Mansour, D.-E.A.; Han, Y.; Yang, P.; Darwish, M.M.F. Numerical and experimental analysis of the transient behavior of wind turbines when two blades are simultaneously struck by lightning. IEEE Trans. Instrum. Meas. 2021, 71, 1–12. [Google Scholar] [CrossRef]
Figure 1.
Installed wind power: (a) cumulative capacity, (b) wind power as a percentage of total renewable energy [2].
Figure 1.
Installed wind power: (a) cumulative capacity, (b) wind power as a percentage of total renewable energy [2].
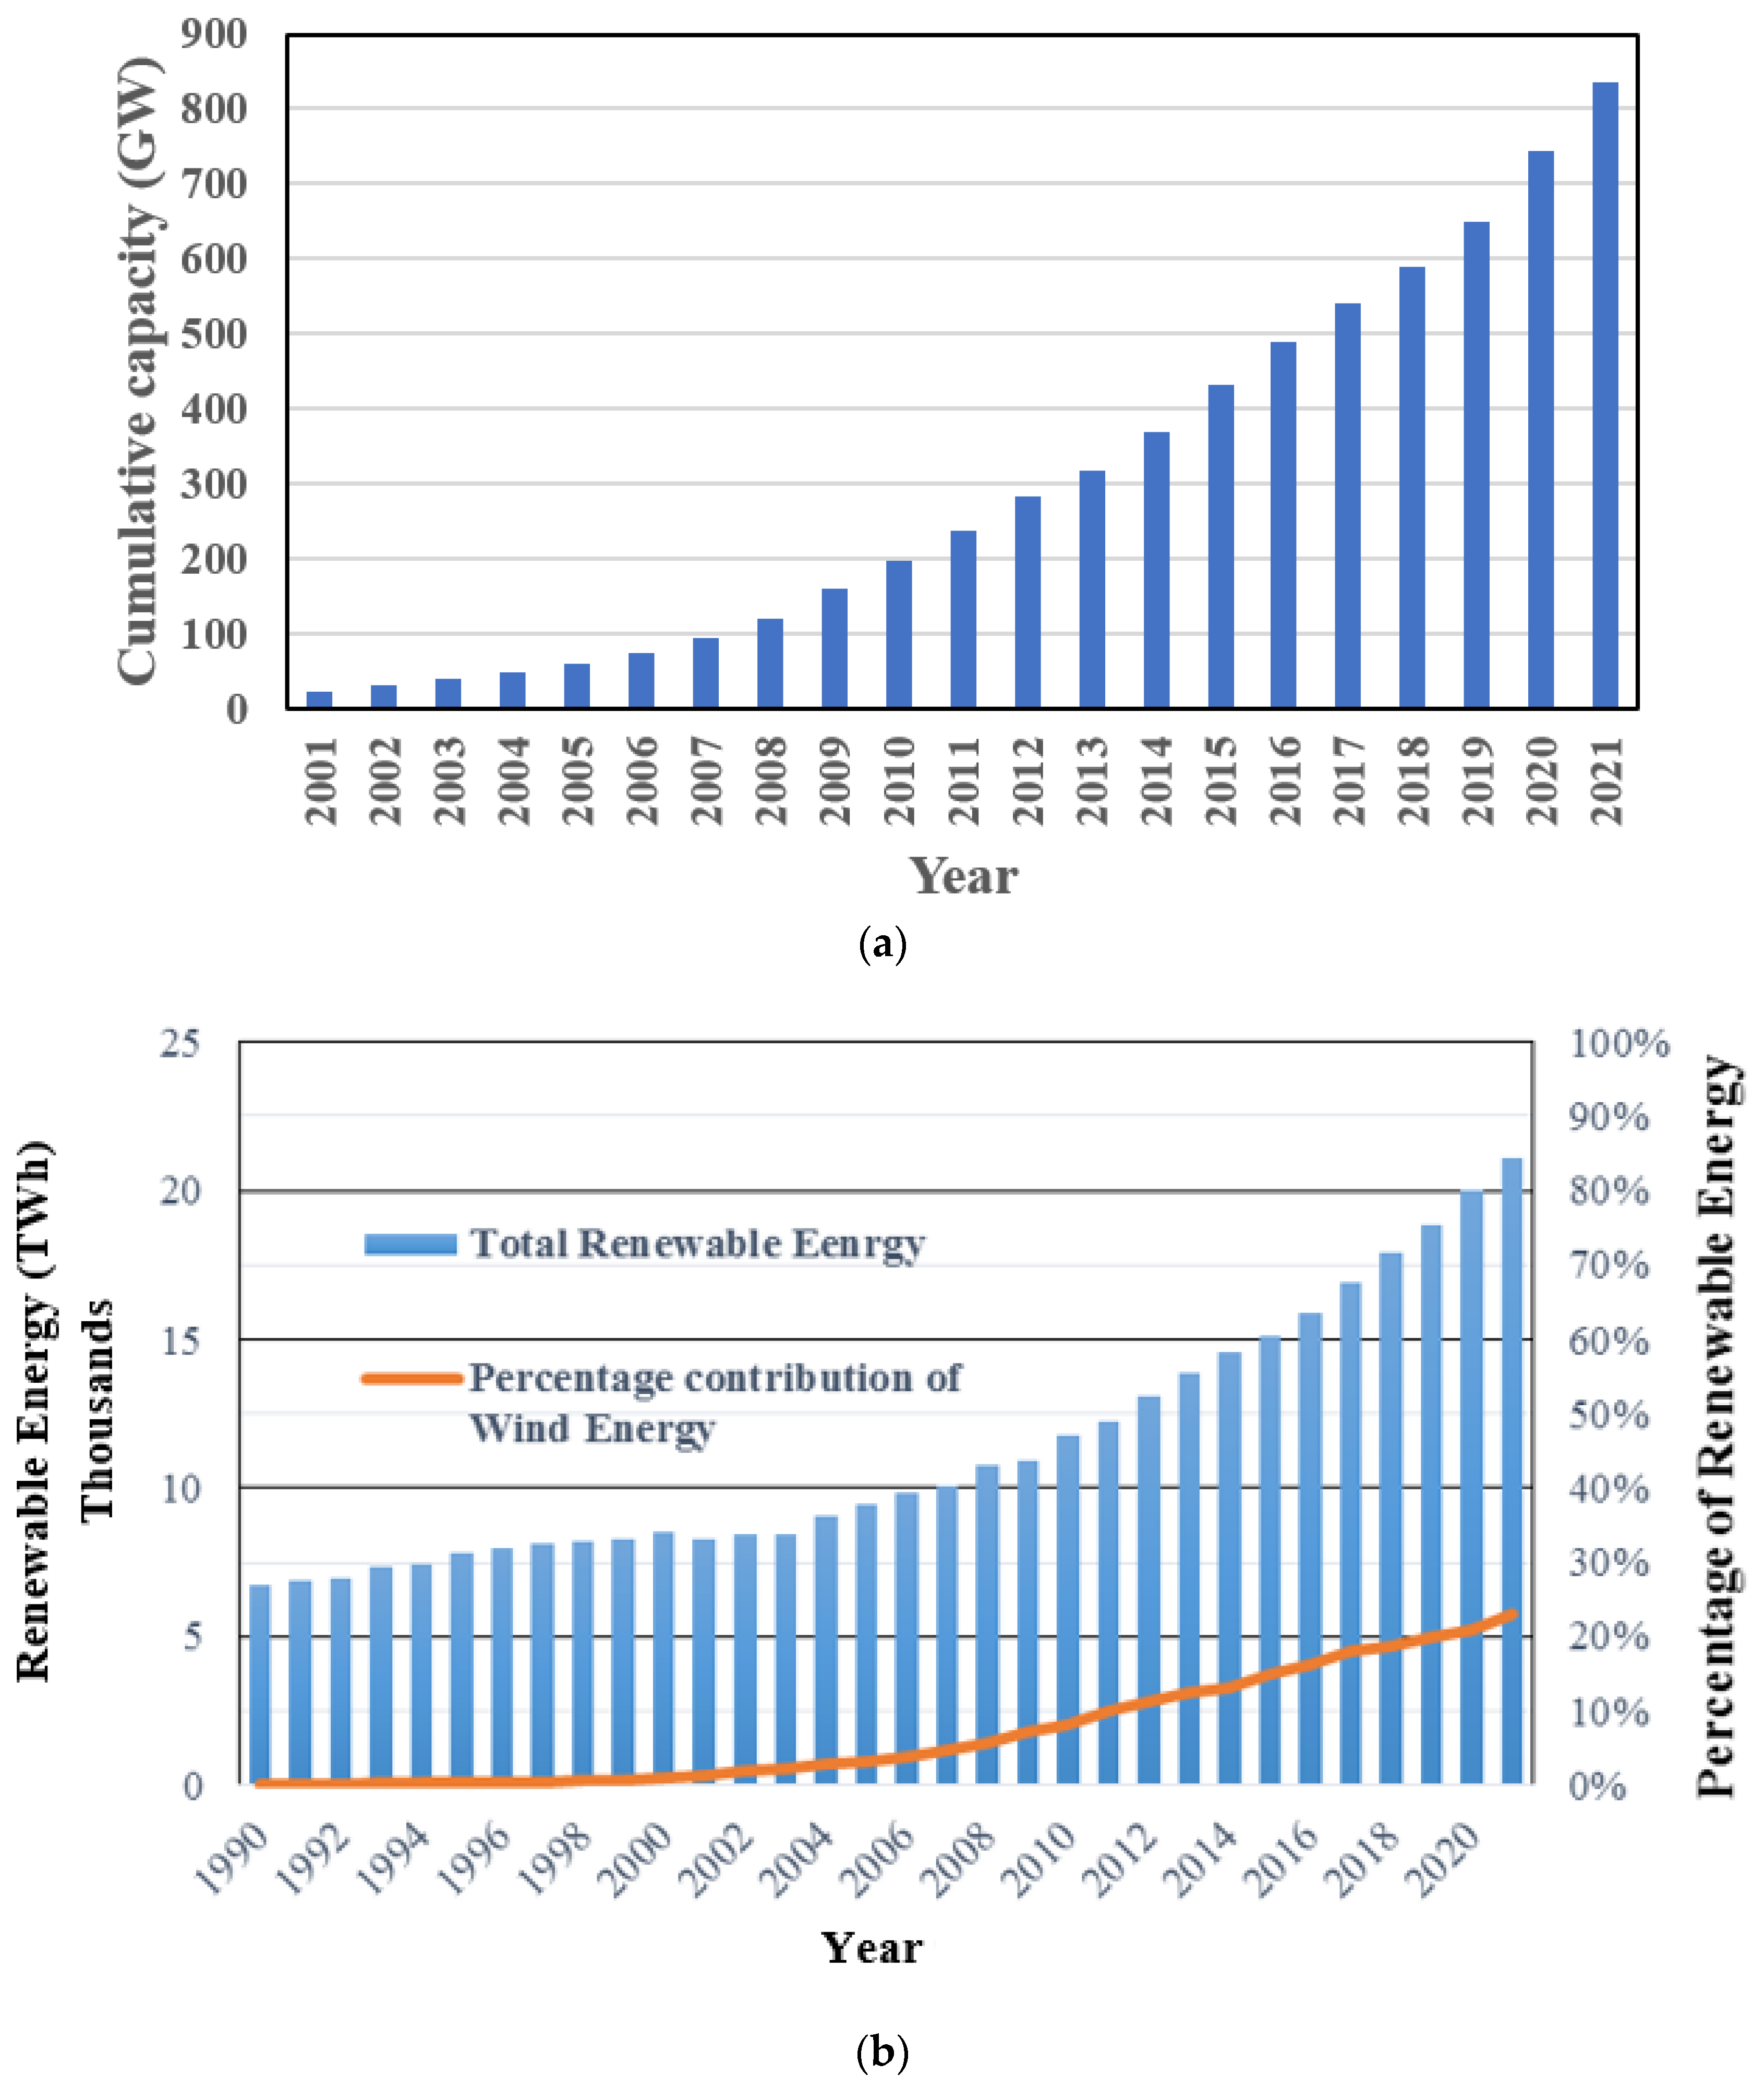
Figure 2.
Wind turbine accidents between 1996 and 2017 [25].
Figure 2.
Wind turbine accidents between 1996 and 2017 [25].
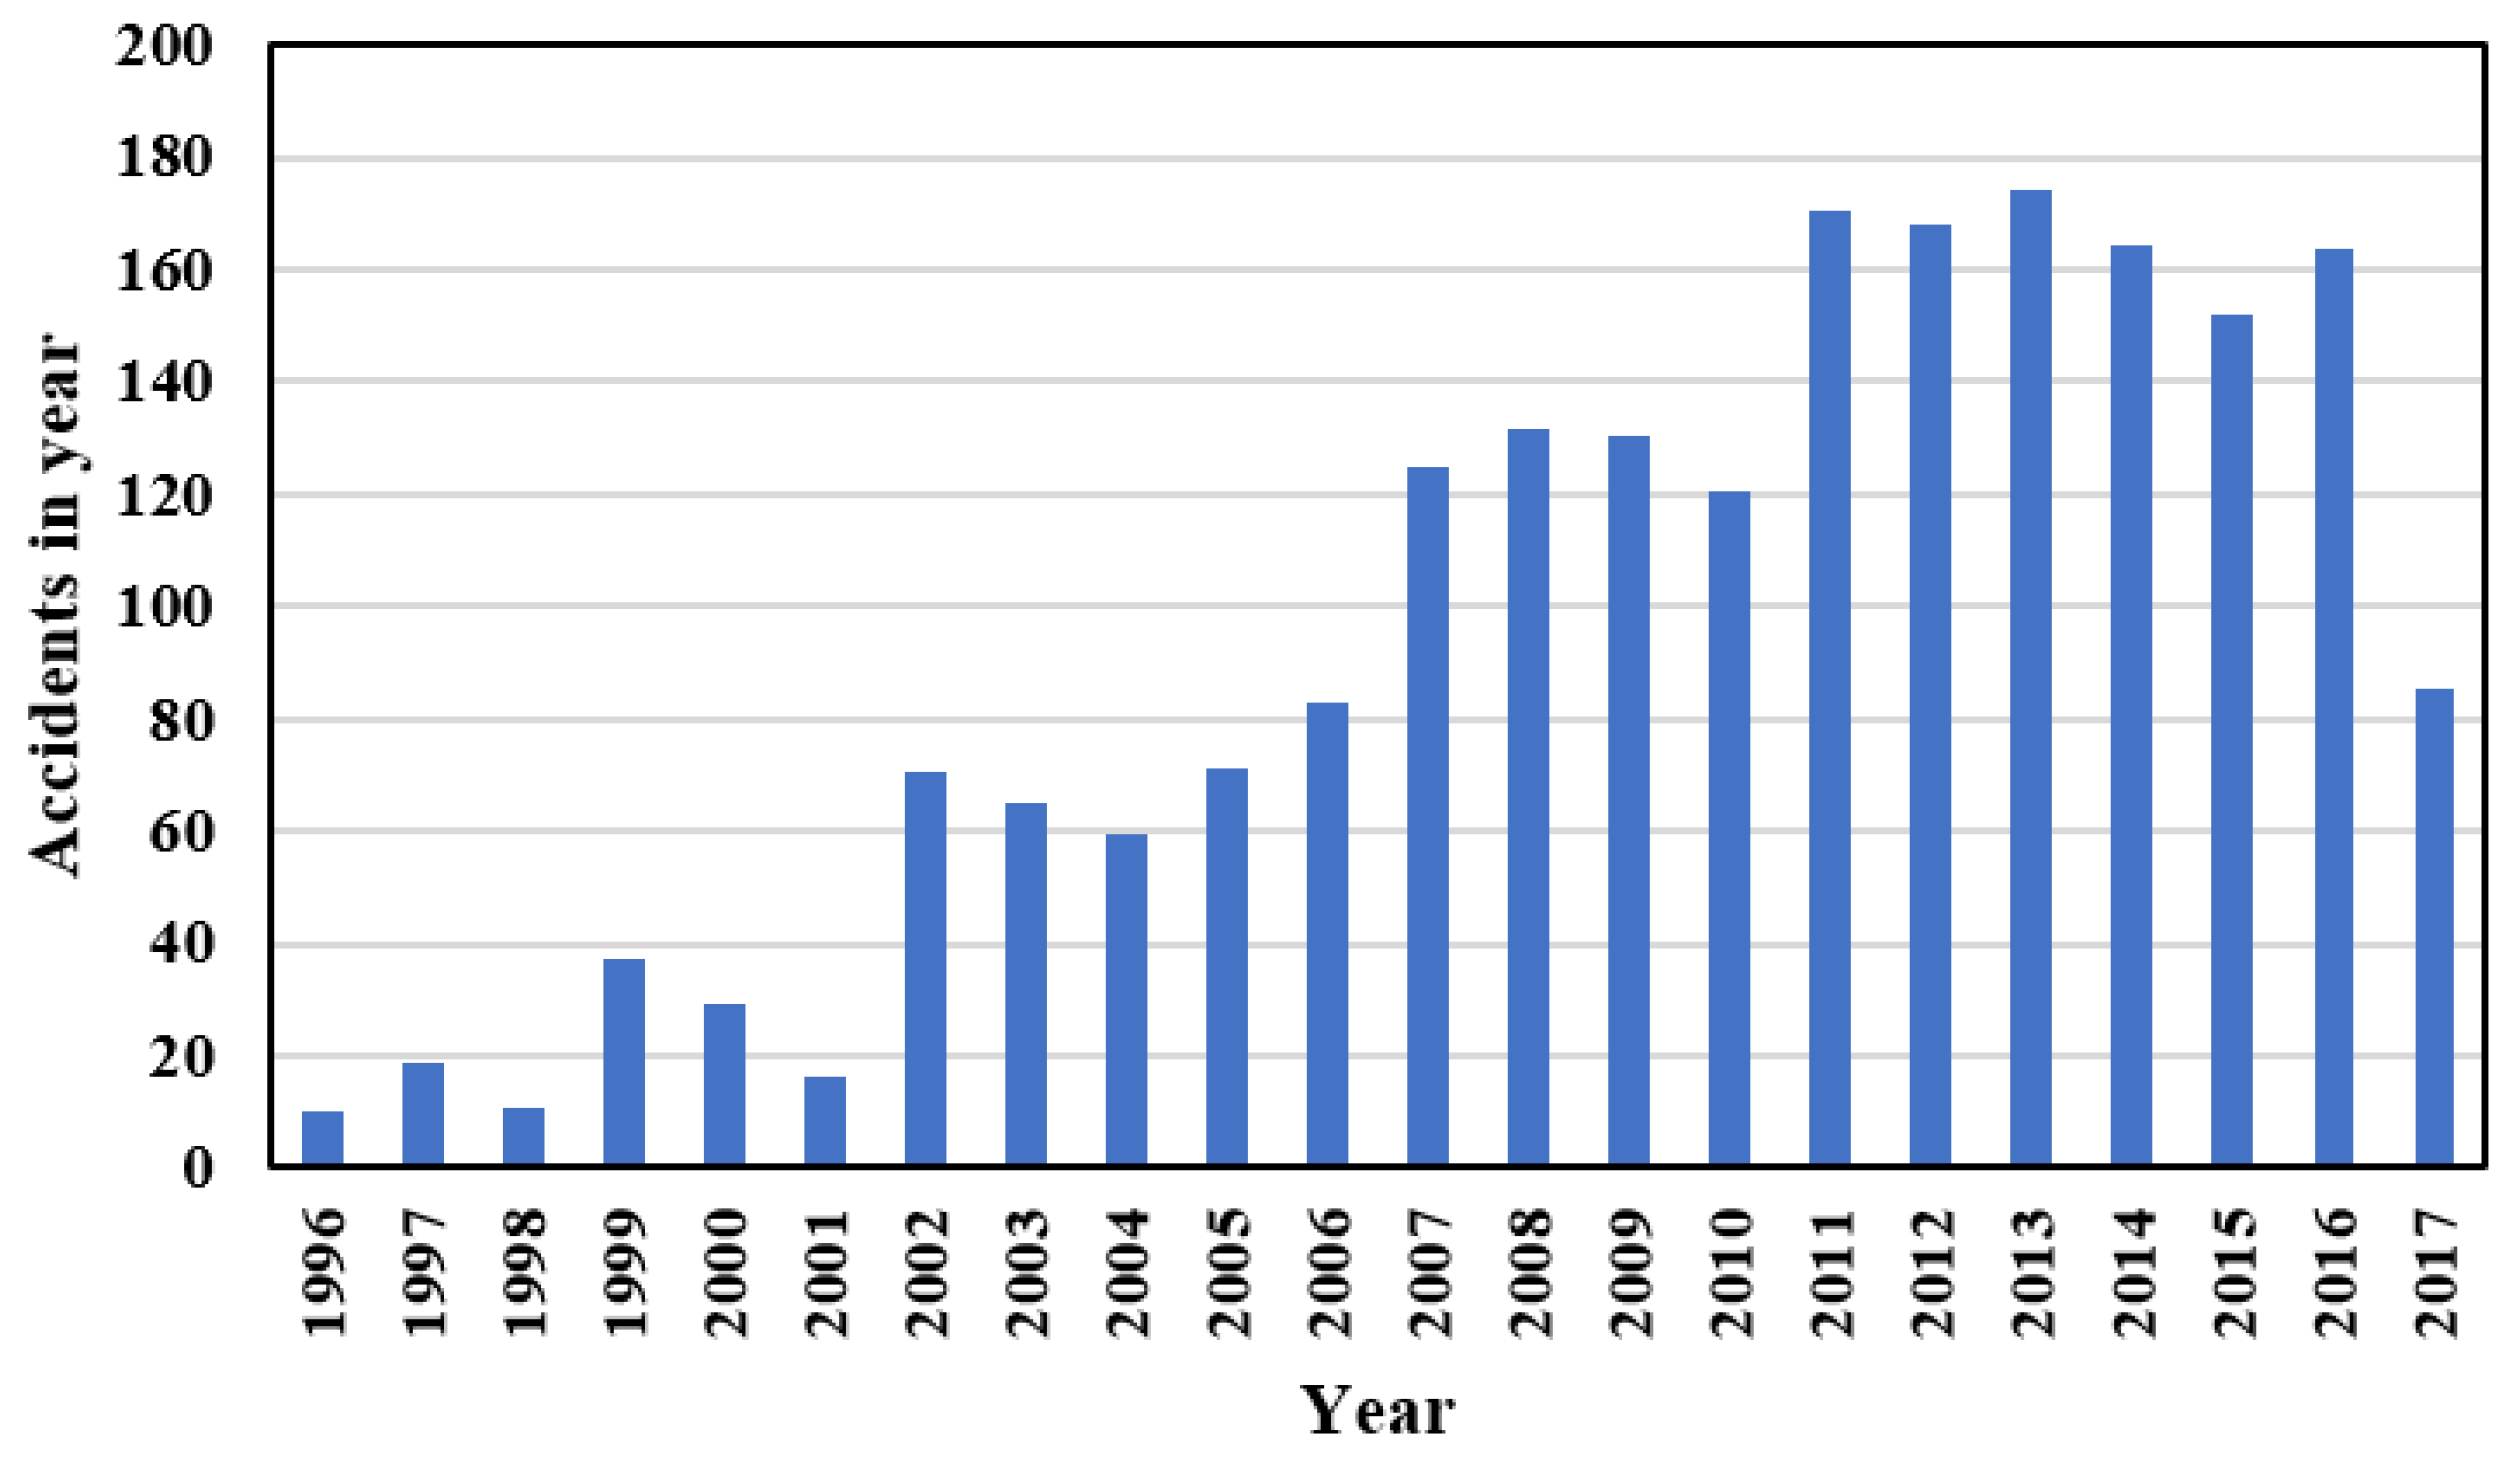
Figure 3.
Wind turbine failures: (a) overturning of foundation of wind turbine tower [26]; (b) damaged wind turbine tower on Miyakojima Island during Typhoon Maemi on 11 September 2003 [28].
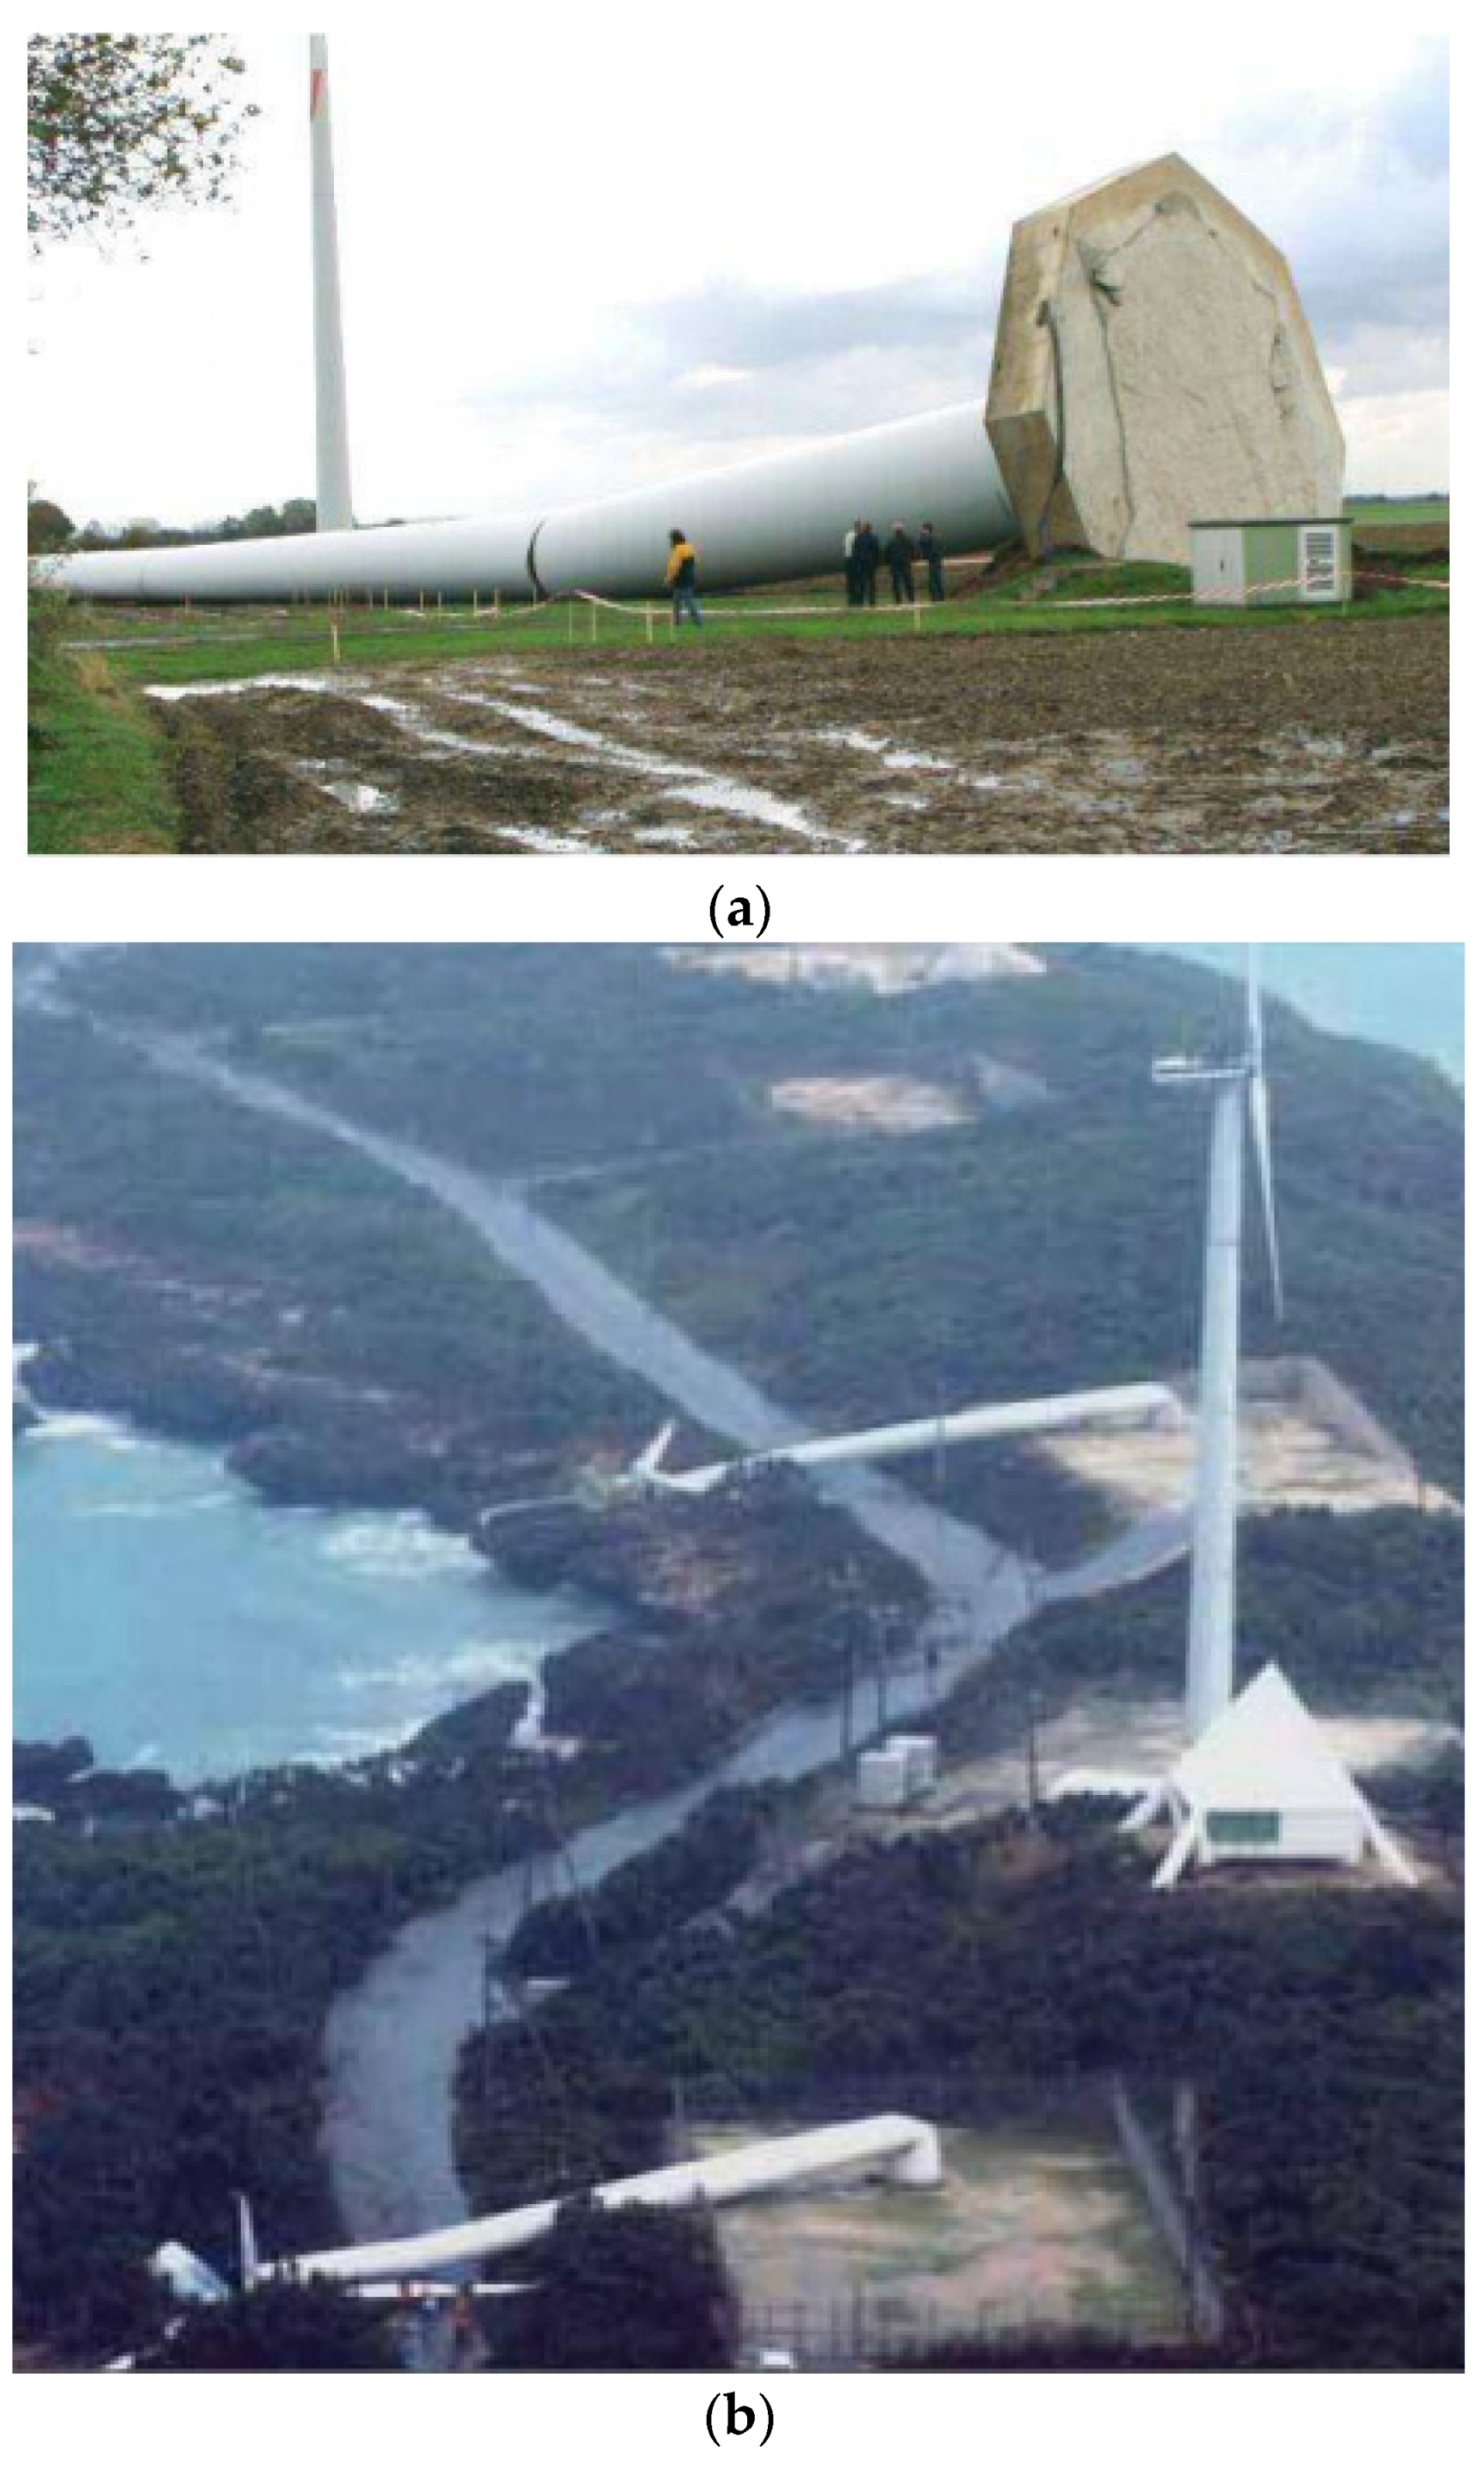
Figure 4.
Wind turbine research statistics: (a) percentage of articles vs. area of research; (b) year vs. percentage of articles; (c) number of articles vs. research methodology; (d) percentages of articles for each component type.
Figure 4.
Wind turbine research statistics: (a) percentage of articles vs. area of research; (b) year vs. percentage of articles; (c) number of articles vs. research methodology; (d) percentages of articles for each component type.

Figure 5.
Fragility functions for 80 m tall wind turbine: (a) near fault; (b) far fault [64].
Figure 5.
Fragility functions for 80 m tall wind turbine: (a) near fault; (b) far fault [64].

Figure 6.
Tower moment demand: (a) idling situation; (b) operating situation; (c) emergency shutdown situation [65].
Figure 6.
Tower moment demand: (a) idling situation; (b) operating situation; (c) emergency shutdown situation [65].
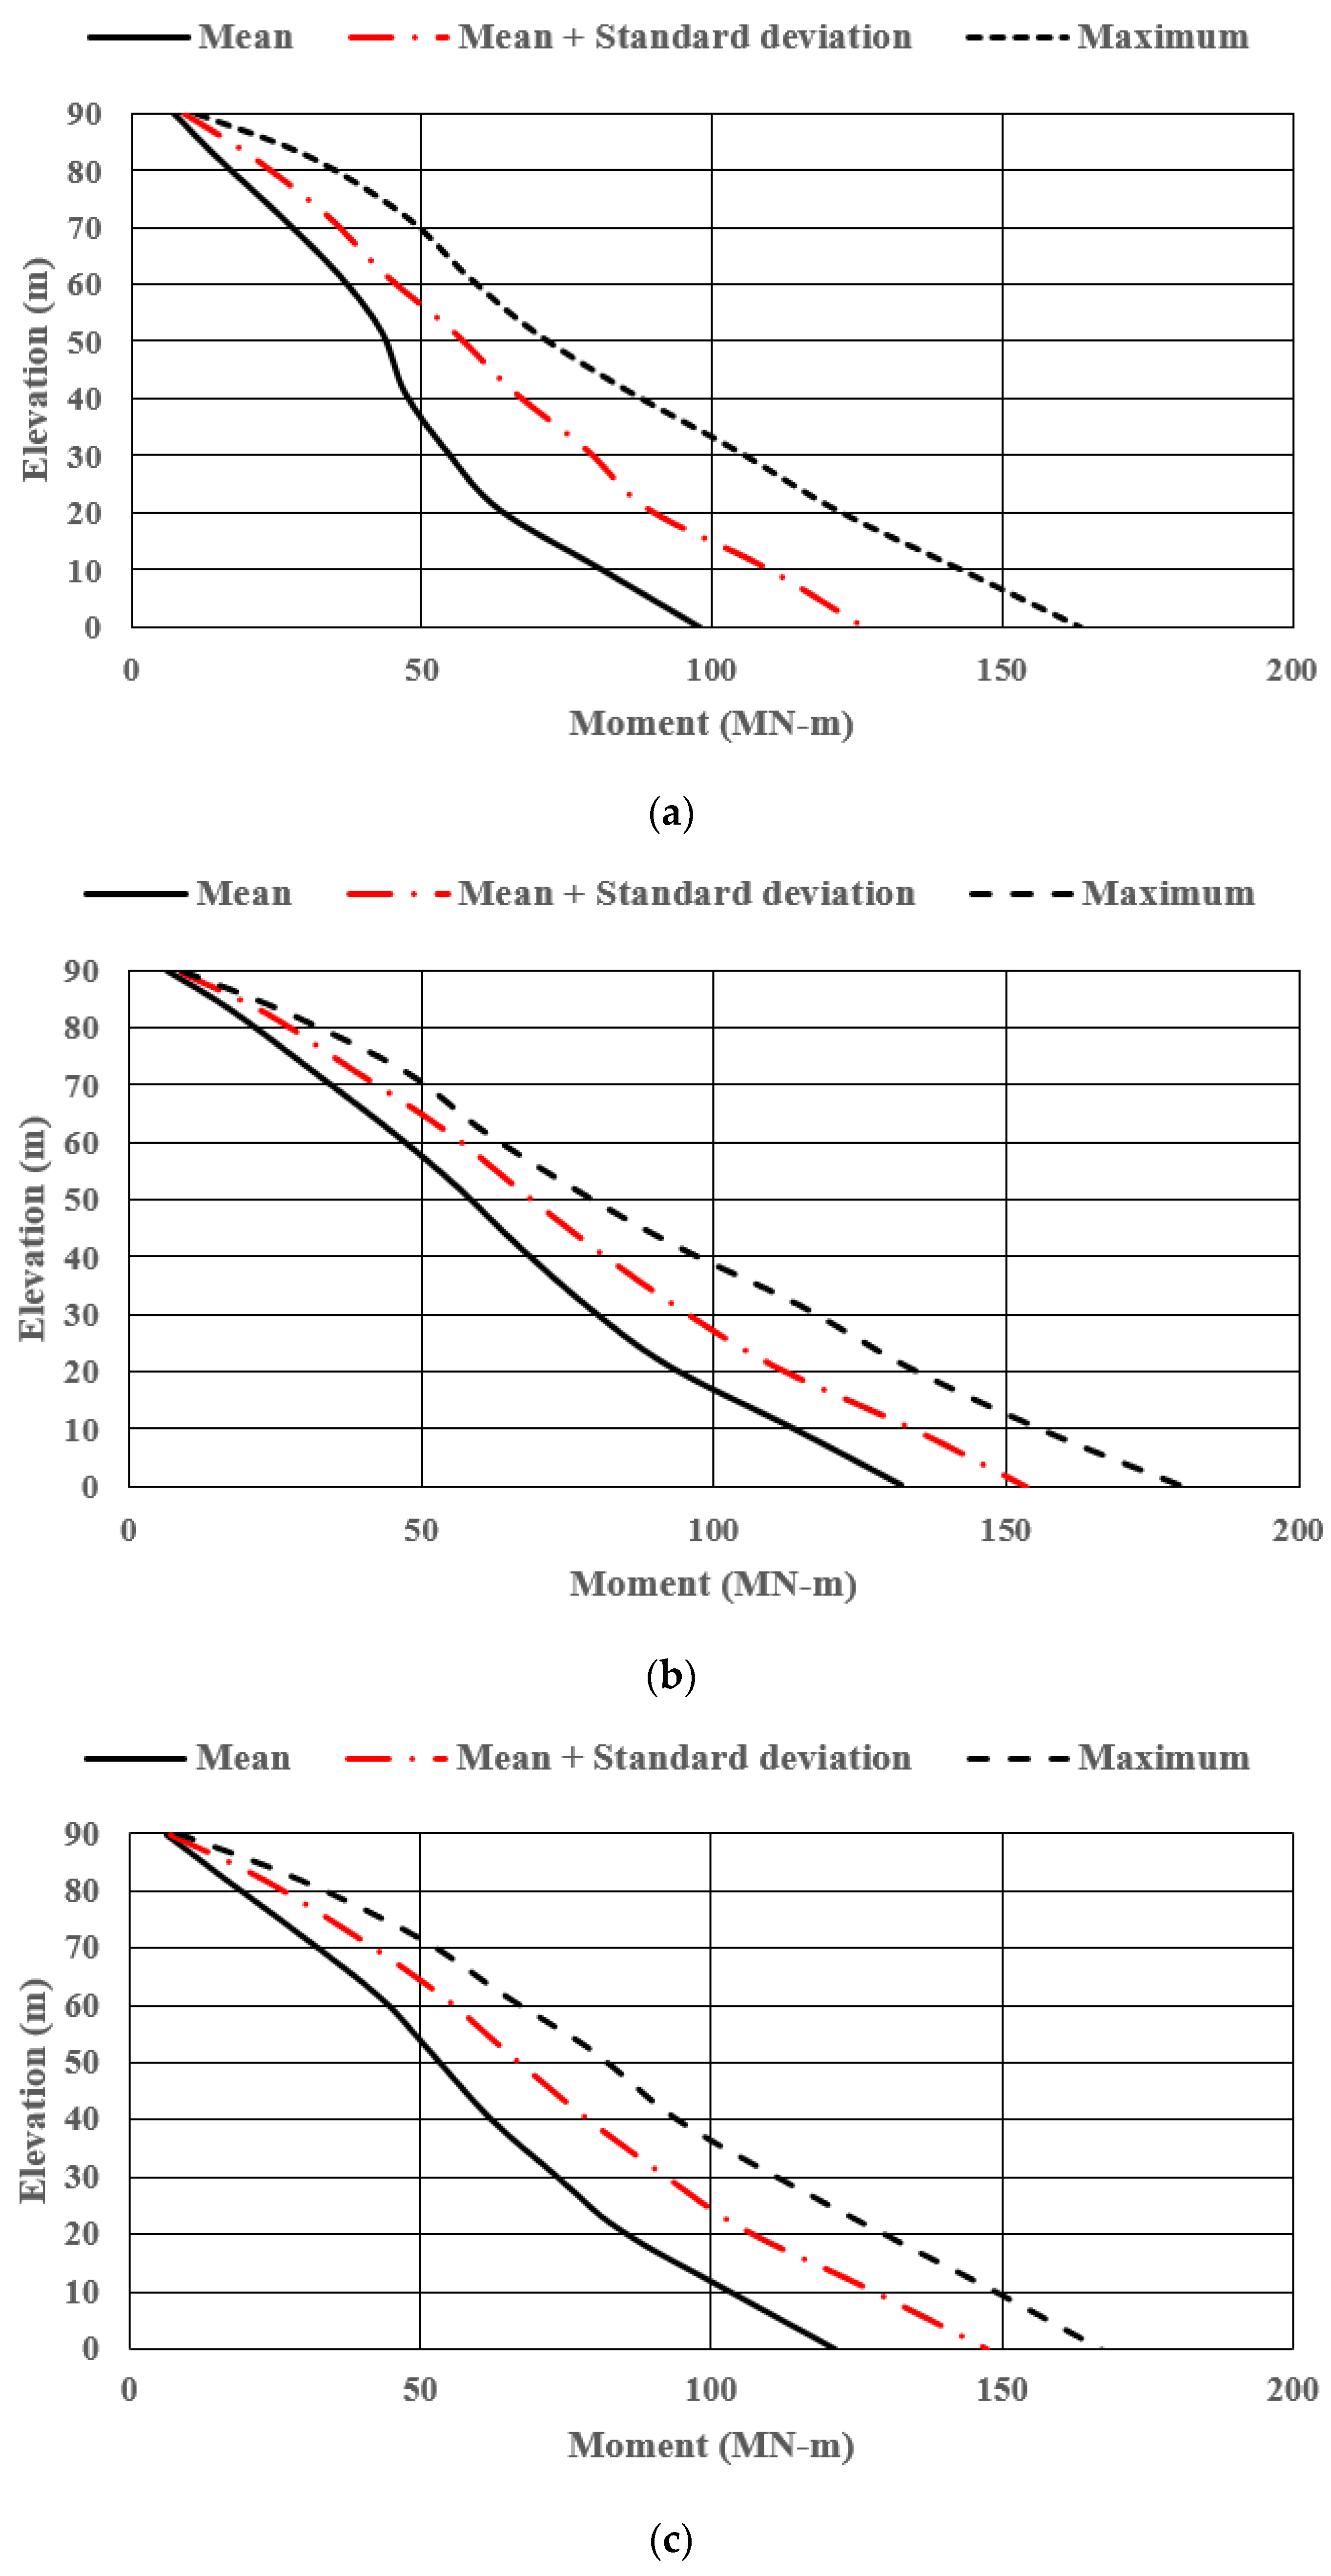
Figure 7.
Velocity vs. median demand (30-degree wind direction) [64].
Figure 7.
Velocity vs. median demand (30-degree wind direction) [64].

Figure 8.
Probability of failure (30-degree wind-direction loading) [64].
Figure 8.
Probability of failure (30-degree wind-direction loading) [64].

Figure 9.
Comparison of exceedance probabilities for original and improved foundations [64].
Figure 9.
Comparison of exceedance probabilities for original and improved foundations [64].
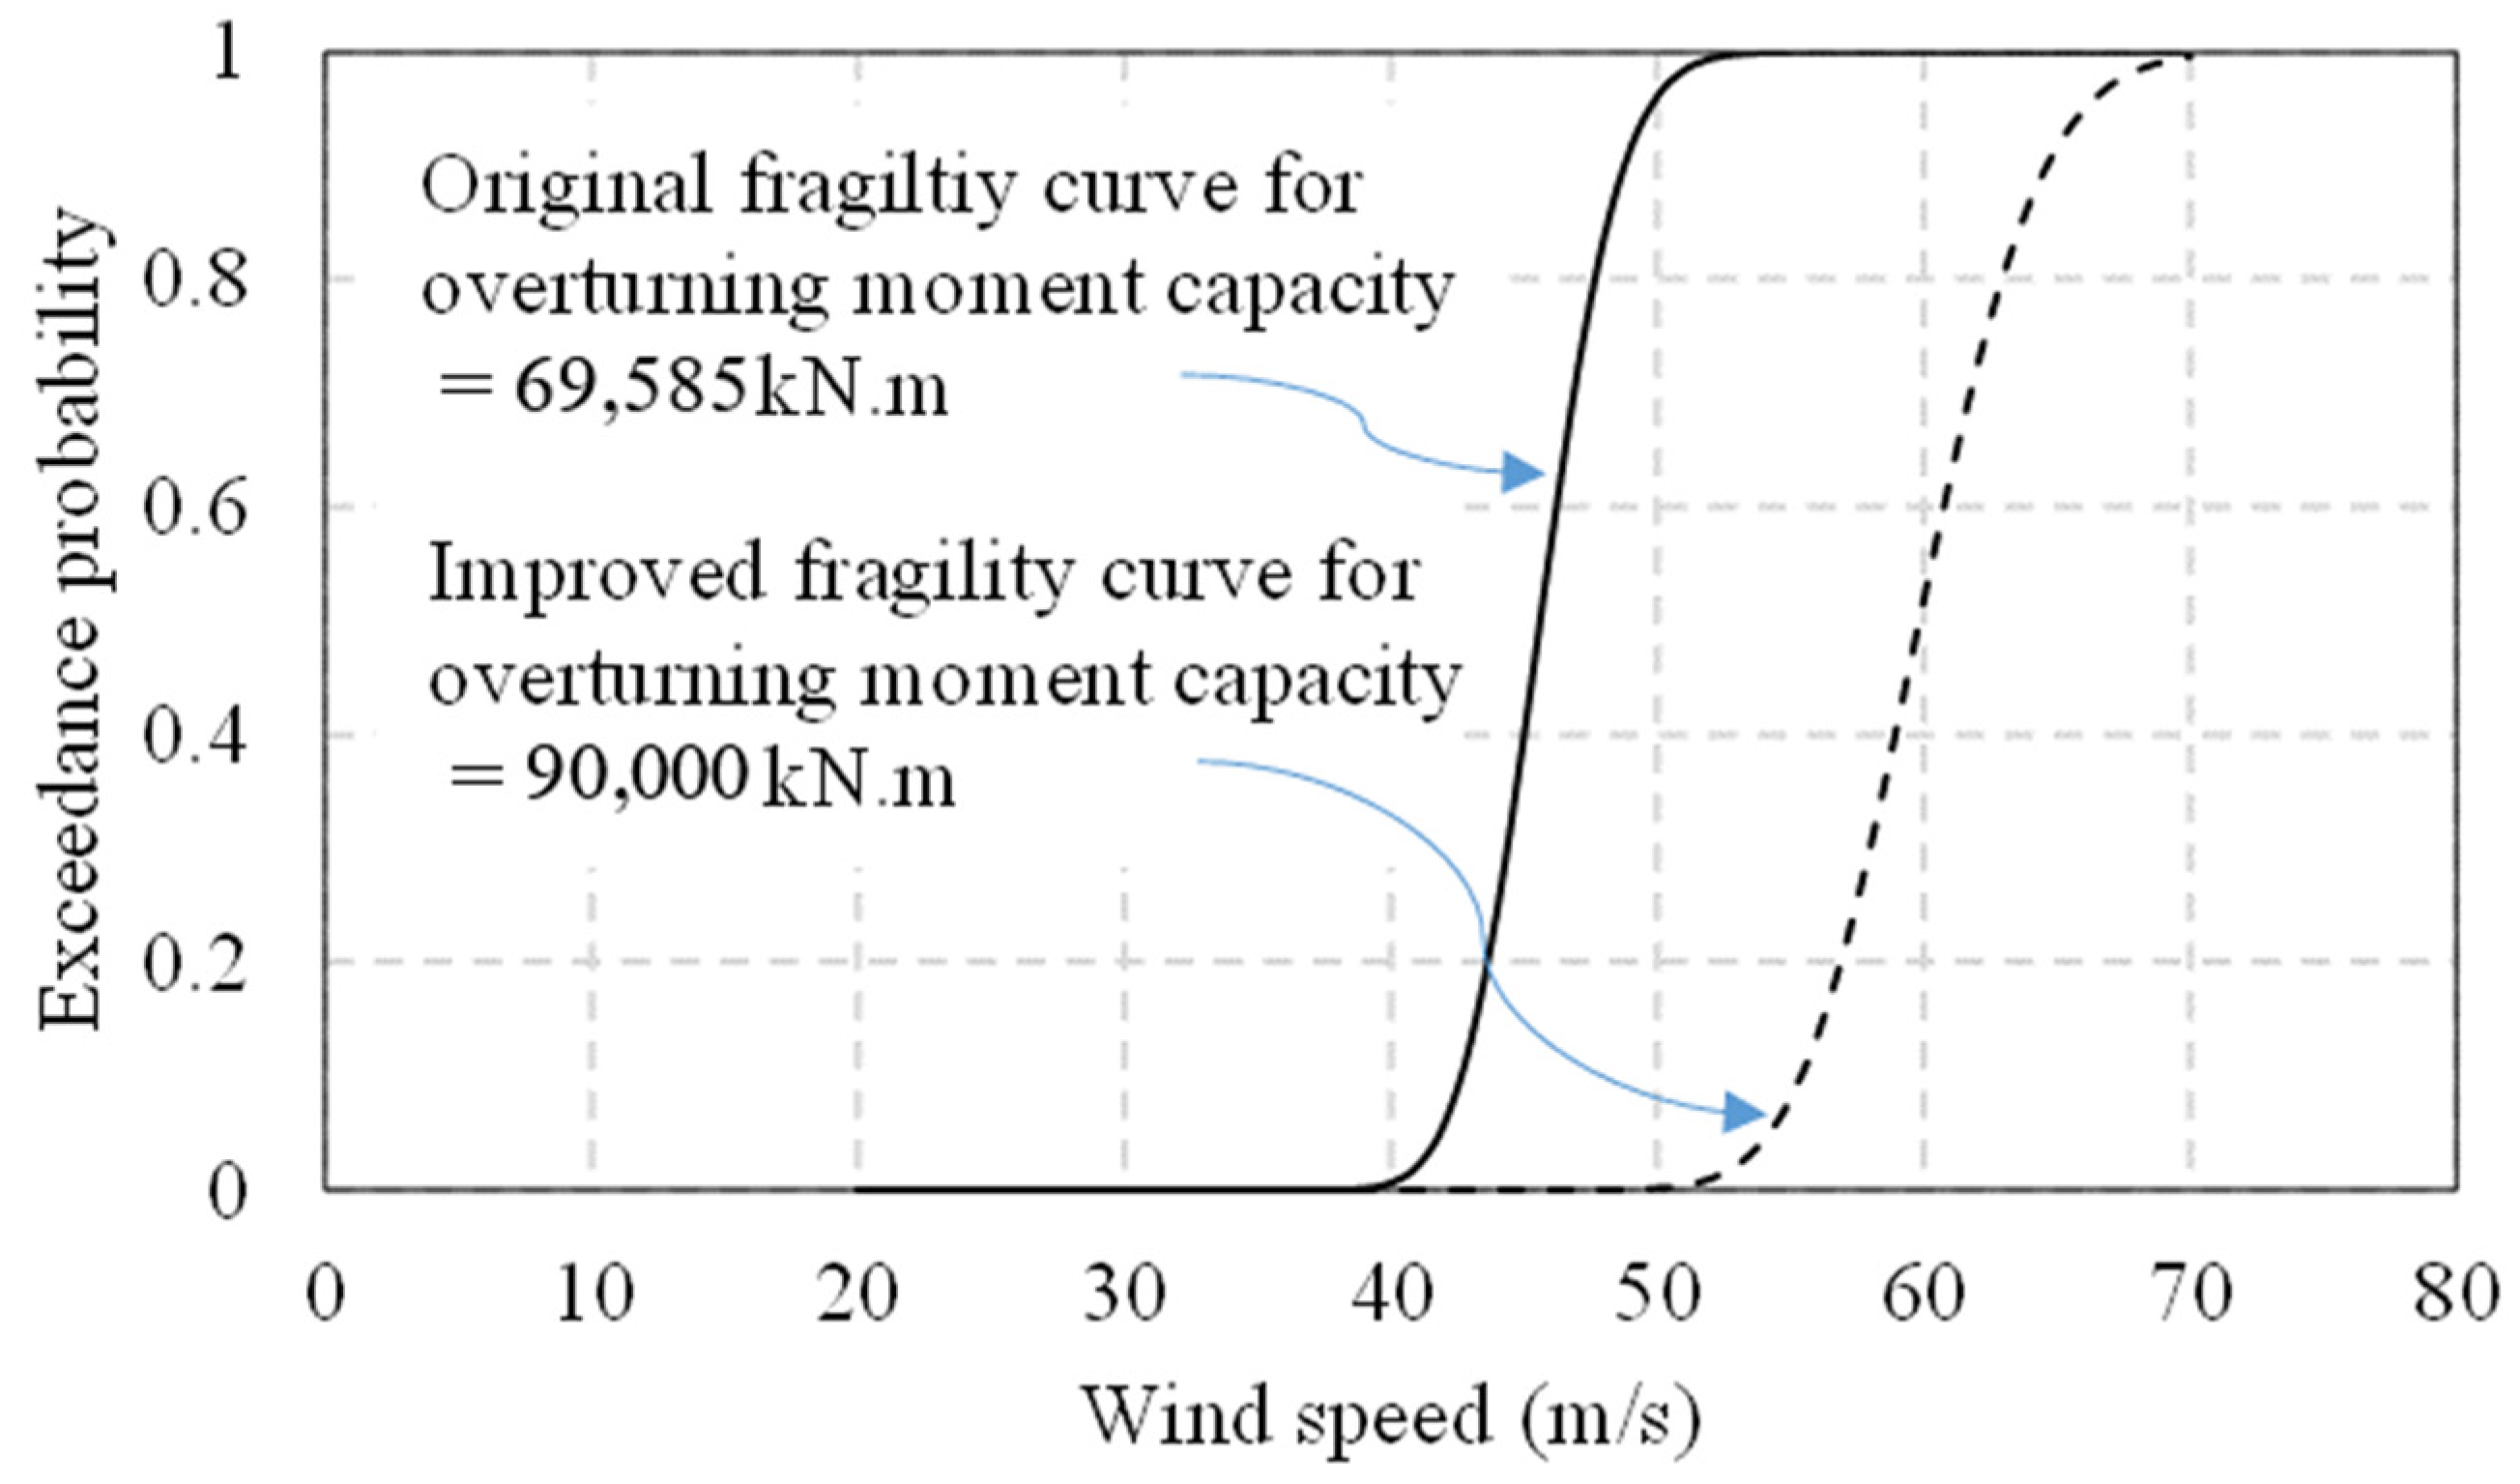
Figure 10.
Lengthwise tower stress and blade strain for (a) wind stop position 1 with wind speed of 59.8 m/s and (b) wind stop position 2 with speed of 71.5 m/s [13].
Figure 10.
Lengthwise tower stress and blade strain for (a) wind stop position 1 with wind speed of 59.8 m/s and (b) wind stop position 2 with speed of 71.5 m/s [13].

Figure 11.
(a) Fragility curves for yaw and no-yaw conditions [75]; (b) probability of hurricane occurrence in major US coastal states—modeled and historical data [108,109].

Figure 12.
Comparison of (a) modeled and (b) experimental scour development. t = actual time in seconds, T = characteristic period of motion, S = temporal evolution of scour, D = monopile diameter [135].
Figure 12.
Comparison of (a) modeled and (b) experimental scour development. t = actual time in seconds, T = characteristic period of motion, S = temporal evolution of scour, D = monopile diameter [135].
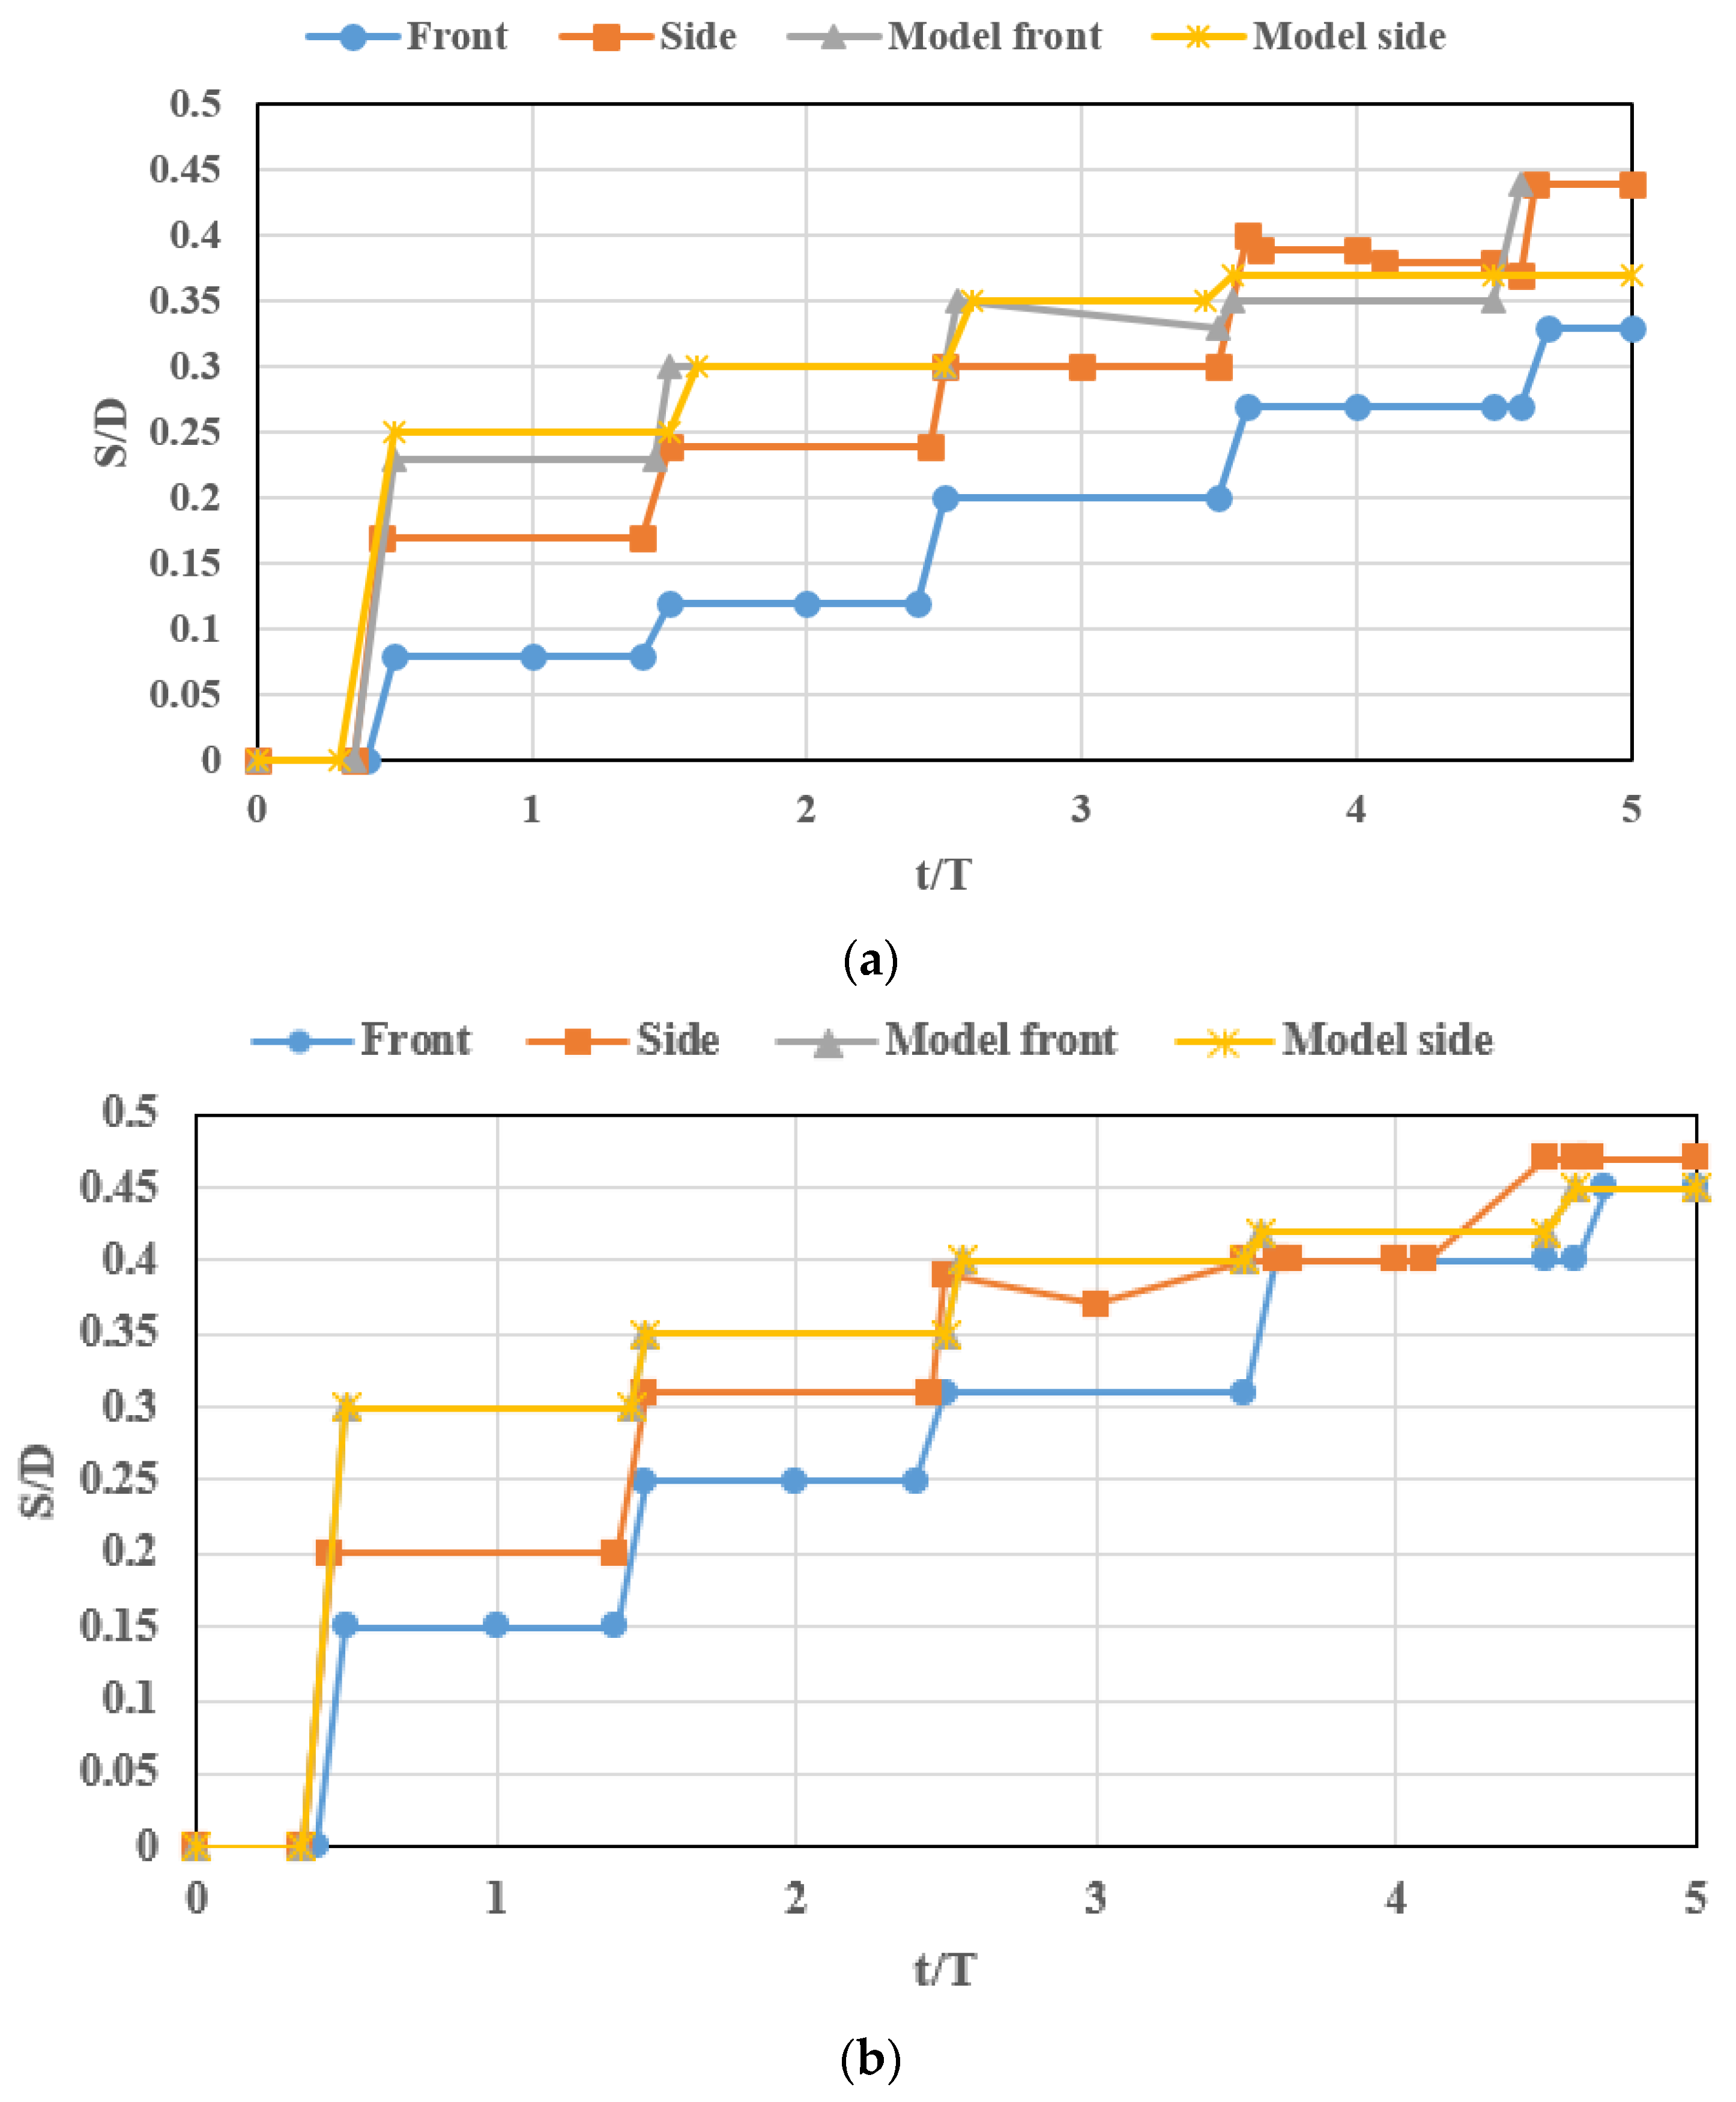
Figure 13.
Temporal scour development from the experiment for different cases. t = actual time in seconds, T = characteristic period of motion corresponding to the duration of time in which the free stream flow exceeds 0.007 times the maximum free stream speed, S = temporal evolution of scour depth (m), D = monopile diameter (m) [136]. (a) Case 4 (with T=72, S/D = 0.83) (b) Case 8 (T = 147, S/D = 0.98).

Figure 14.
Comparison of fragility curves for OWTs with OBM mudline with respect to wave height for (a) different waves and (b) different wind speeds with irregular waves [137].
Figure 14.
Comparison of fragility curves for OWTs with OBM mudline with respect to wave height for (a) different waves and (b) different wind speeds with irregular waves [137].

Figure 15.
Peak OBM levels in the OWT model with the mudline compared to wave height obtained using three approaches [137].
Figure 15.
Peak OBM levels in the OWT model with the mudline compared to wave height obtained using three approaches [137].

Figure 16.
Fragility curve for OBM mudline with varying wave heights [137].
Figure 16.
Fragility curve for OBM mudline with varying wave heights [137].
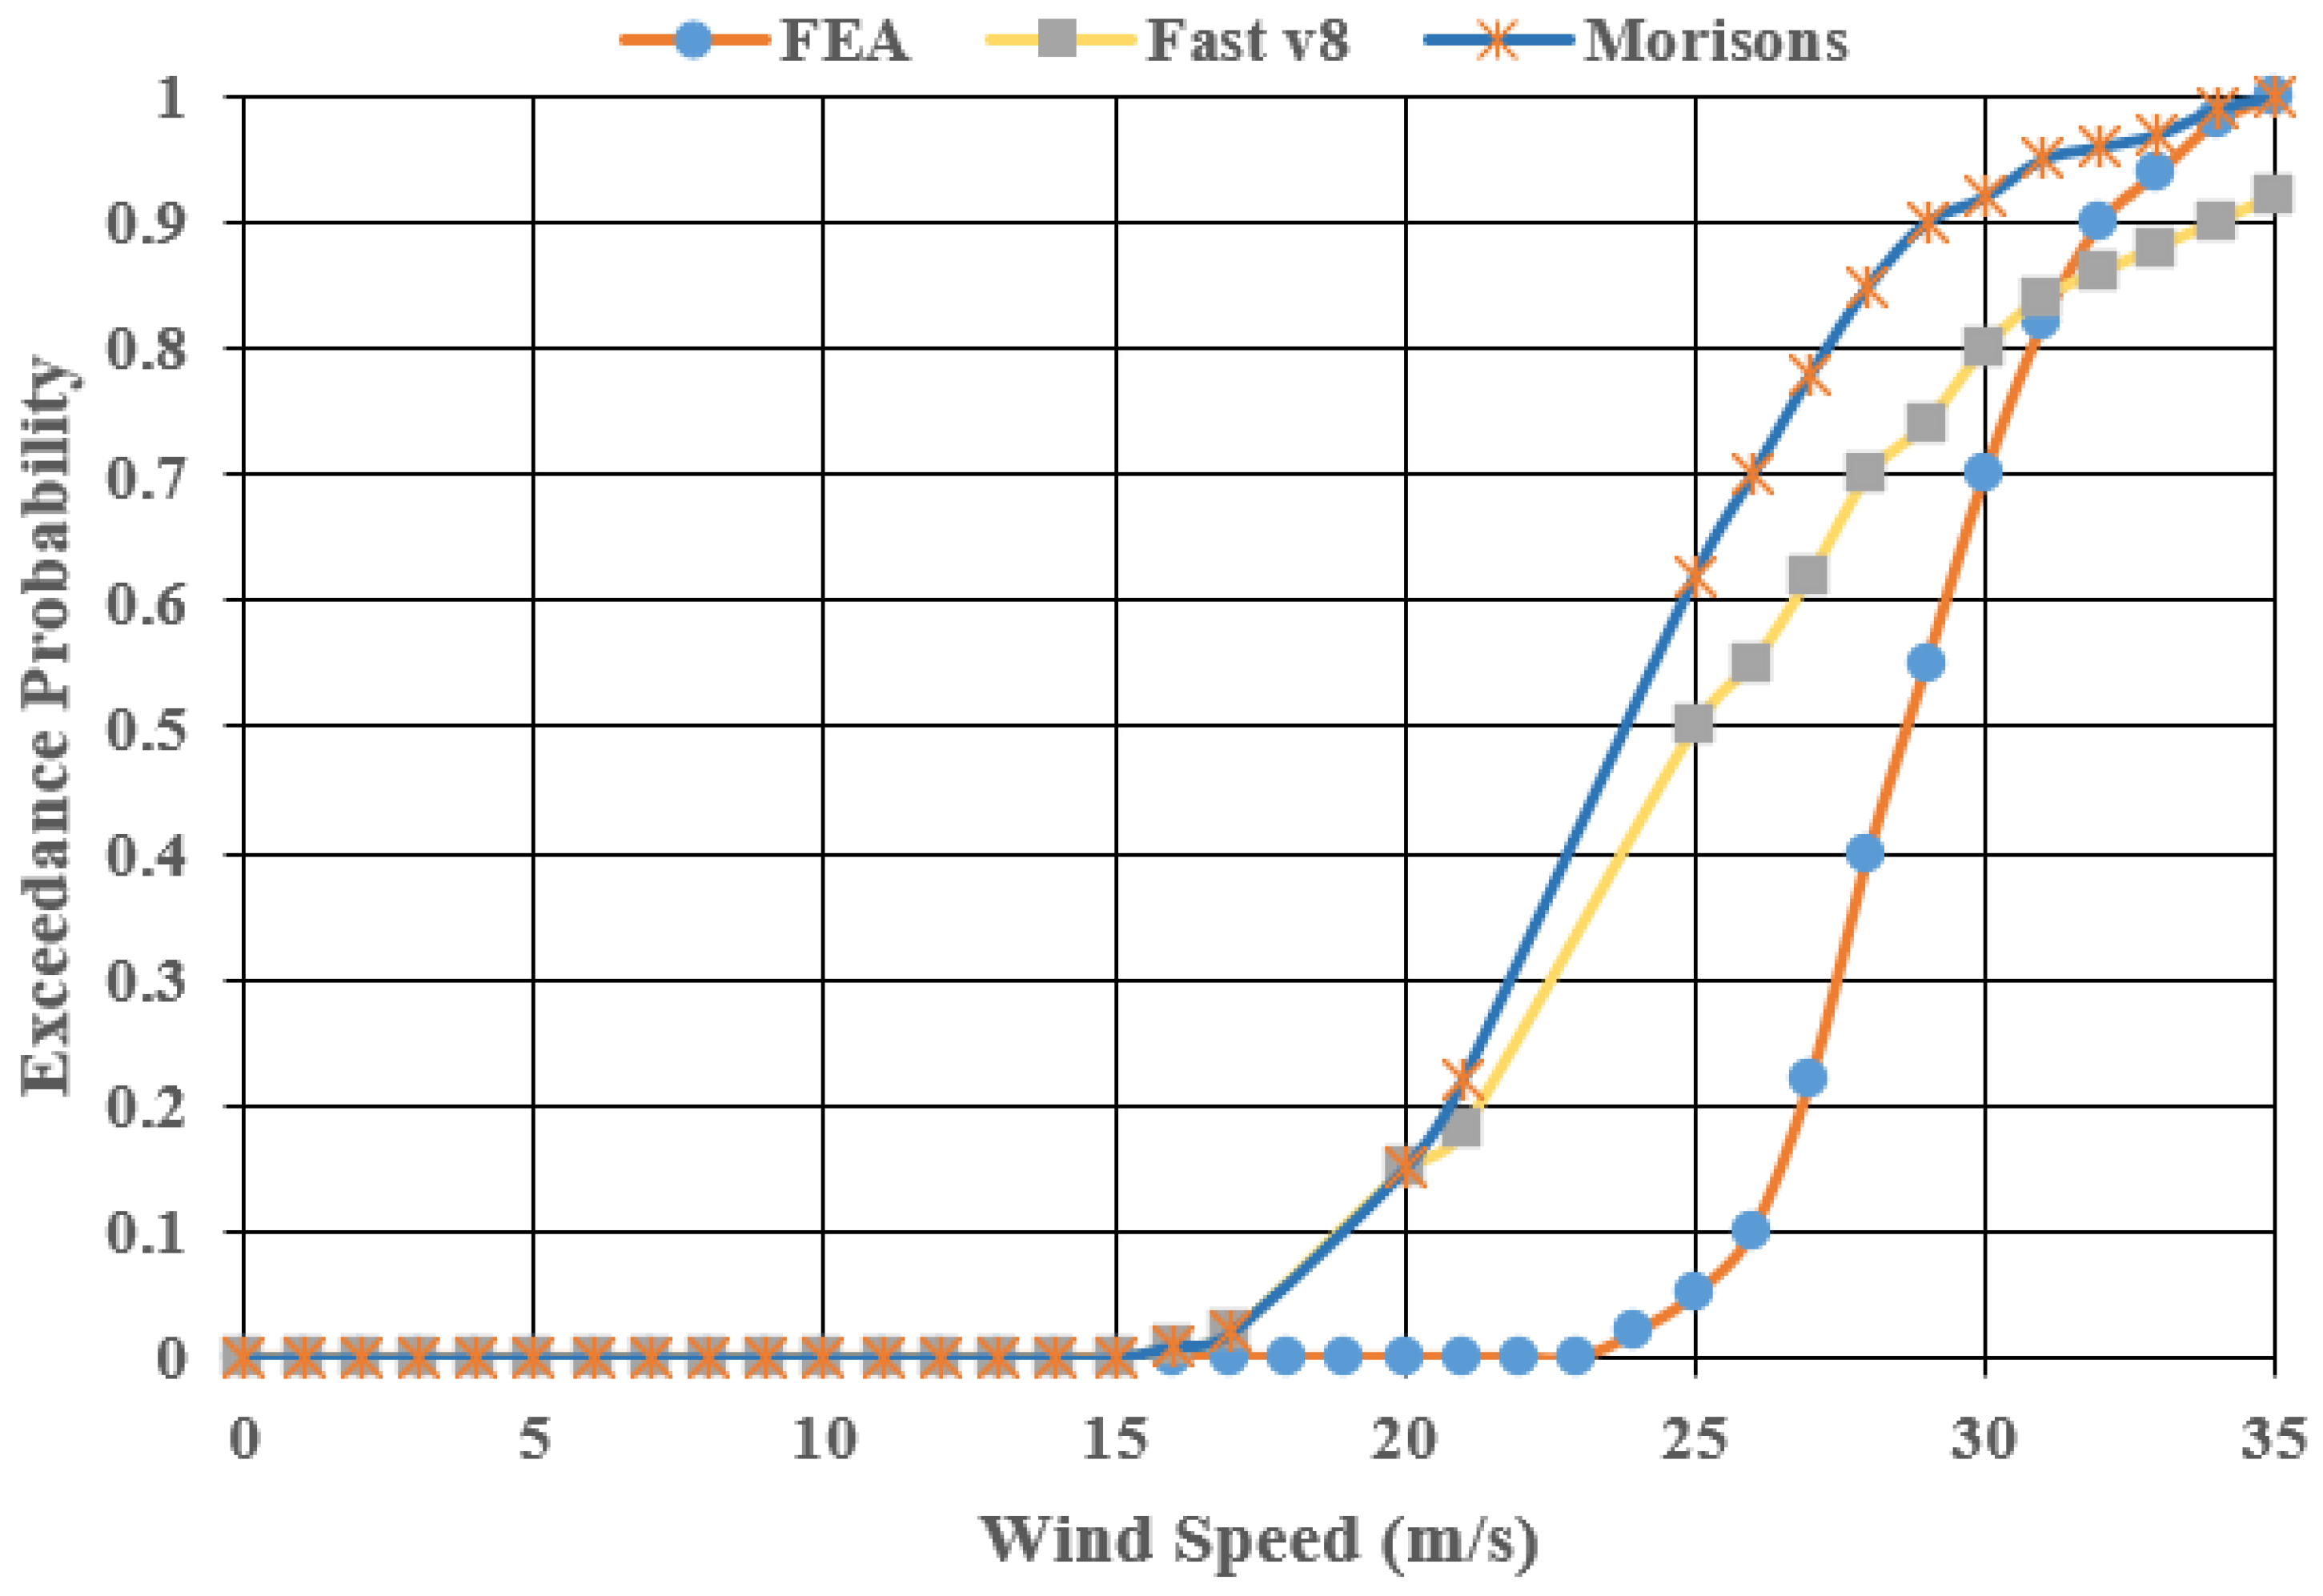
Disclaimer/Publisher’s Note: The statements, opinions and data contained in all publications are solely those of the individual author(s) and contributor(s) and not of MDPI and/or the editor(s). MDPI and/or the editor(s) disclaim responsibility for any injury to people or property resulting from any ideas, methods, instructions or products referred to in the content. |
© 2023 by the authors. Licensee MDPI, Basel, Switzerland. This article is an open access article distributed under the terms and conditions of the Creative Commons Attribution (CC BY) license (https://creativecommons.org/licenses/by/4.0/).
Share and Cite
MDPI and ACS Style
Patil, A.; Pathak, C.; Alduse, B. Review of Natural Hazard Risks for Wind Farms. Energies 2023, 16, 1207. https://doi.org/10.3390/en16031207
AMA Style
Patil A, Pathak C, Alduse B. Review of Natural Hazard Risks for Wind Farms. Energies. 2023; 16(3):1207. https://doi.org/10.3390/en16031207
Chicago/Turabian StylePatil, Atul, Chaitanya Pathak, and Bejoy Alduse. 2023. "Review of Natural Hazard Risks for Wind Farms" Energies 16, no. 3: 1207. https://doi.org/10.3390/en16031207
Note that from the first issue of 2016, this journal uses article numbers instead of page numbers. See further details here.