Abstract
Electricity is used in educational buildings, and there are now numerous attempts to reduce consumption, achieve sustainability, and protect the environment. This paper aims to study energy consumption, identify opportunities to rationalize energy consumption, and propose solutions at Sulaiman Al-Rajhi University in the Kingdom of Saudi Arabia in order for the university campus to become sustainable. The results showed that total annual electrical consumption totaled 13,859 MWh in 2021. The air conditioning system, other devices, and lighting have the percentage of consumption 79, 14, and 7% of the total, respectively. Electricity consumption intensity was approximately 145–155 kWh/m2, and the per capita intensity was approximately 12,987–16,351 kWh, in the period 2017–2021. The price of the electrical energy generated on the university campus ranged between 0.3 and 0.53 SR/kWh in 2021, while the electricity tariff from the grid for educational buildings was 0.18 SR/kWh. This means that the public grid was 50% cheaper than campus-generated electricity. At the price of energy generated by generators, the total simple payback time (SPBT) for the suggested energy conservation measures (ECMs) is 4.13 years, whereas the SPBT is 8.96 in the case of the consumption of the electricity supplied by the national grid. The environmental benefits of the proposed ECMs were also identified.
1. Introduction
Energy consumption is one of the main factors affecting the environment. The world is witnessing great changes in the field of energy, which controls the joints of our daily lives. Global energy demand increased in 2019 by 0.9%, which is equivalent to 120 million tonnes of oil equivalent (Mtoe). The increasing use and reliability of renewable energy (RE) worldwide are becoming manifest, especially in hot and dry climates. In the Kingdom of Saudi Arabia (KSA), electricity relies completely on conventional fuel. Table 1 shows the amounts and levels of energy consumption in terms of application and sources in Saudi Arabia in 2018. As the figures show, consumption totaled 147.9 Mtoe, with the primary source being oil products, a rate of 66%. On the other hand, as data shows, oil and gas were consumed in industry, in transportation, for non-energy purposes, and for other purposes. Furthermore, Table 1 also shows that in terms of use electricity comes first in the ‘other’ field; the figure amounted to 93%, and that is because electric power is used in different sectors—domestic, commercial, agricultural, educational, as well as other service-related fields [1].

Table 1.
KSA’s Domestic Energy Consumption in 2018 in Terms of Application [1].
In 2019, Saudi Arabia’s electricity consumption was around 288.6 TWh, the peak load was in summer (63.3 GW), and the available generation capacity was 65.6 GW [2]. Buildings in the KSA are now a major sector concerning growth in electrical energy requirements, and that is essentially due to high air-conditioning (AC) demands during summer, when the temperature outdoors is so high. The demand for more electrical power is increasing at universities, too, and it is increasing at an accelerating pace: the increasing student intake, the introduction of new courses, the increasing number of research centers and laboratories—all this is leading to a rapid expansion of campus facilities and infrastructures. Accordingly, it is a priority that, in the construction and usage of universities, the use of energy be efficient and sustainable. In KSA, this has been taken into account in the country’s Vision for 2030, where protecting the environment and sustaining vital resources constitute a priority in the plan [3]. In 2019, the government sector consumed approximately 14.1% of the total electrical energy consumption (as shown in Figure 1), and universities had a large share of that consumption [1]. A field study conducted by the Department of Electrical Engineering at King Saud University regarding the rationalization of electricity consumption showed that the cost of electricity waste at the university is more than four million riyals a year, and that air conditioning, lighting, and computer devices are, respectively, at the top of the list concerning energy consumption [4].
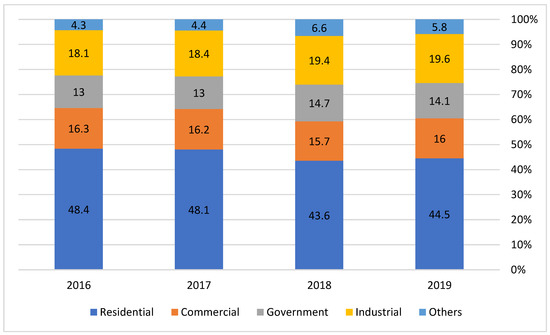
Figure 1.
Electrical Energy Consumption Percentage in the KSA in 2016–2019 in Terms of Sector [2].
It should be noted here that about 28% of the total amount of CO2 emissions in the KSA are from electricity generation, which is produced using 65% and 35% of total fuel, from natural gas and oil, respectively [5]. The continuous supply of electricity is of great importance for universities in the Kingdom, especially during peak hours, between 7 a.m. and 4 p.m. The efficiency of energy at universities depends mainly on occupants’ behavior, building architectural design, and building nature [6]. Technology can reduce CO2 emissions from buildings and, at the same time, improve services and raise the level of comfort. In the faster transition scenario, near-zero energy construction and extensive energy renovations will reduce the sector’s energy needs by nearly 30% by 2050. The KSA is the world’s third-largest country—after the USA and China—in terms of using electricity for cooling purposes. Hence, it is time to improve energy efficiency (EE) and take full advantage of RE.
There are studies on energy consumption and efficient use in university buildings in many countries. However, only a small number of studies examine the energy situation in university buildings in hot regions, such as Saudi Arabia. This study, hence, is aimed at creating a new vision of how to increase EE in university building systems in such regions as Qassim so as to eventually conserve energy, boost performance, and, if possible, reduce energy use in these buildings to a minimum, near-zero levels. This work is intended to fill a gap in the sustainability of university buildings.
The work was arranged after the introduction in the first section, and the extended literature review on the topic came in the second section. The method that was followed in the research and the influencing factors are allocated to the third section, while the fourth section is for the results in terms of determining consumption. In this section, energy consumption indicators and the impact of the fuel price on the cost of a unit of electricity were specified for the case of self-generation of electricity. The fifth section is devoted to energy conservation measures while defining economic indicators and environmental benefits. Finally, the sixth section is devoted to the results.
2. Literature Review
There are studies on energy consumption and efficient use in university buildings in many countries. Only a small number of studies, however, examine the energy situation in university buildings. The literature review was presented by country, starting with American countries, Australia, then Asia, Europe, and Arab countries.
Li and Chen [7] investigated the relationship between the energy-use intensity (EUI) and the floor-area percentages for the main campus of a university in Calgary, Canada. The researchers reported that the total average EUI ranged between 211 and 725 kWh/m2 (for all types of energy used). Ligade et al. [8] studied the EE in cases where heating, ventilation, and AC systems at educational buildings were subjected to retrofits; the study was conducted at Purdue University, in Indianapolis, USA. The study demonstrated that the proposed energy-conservation measures (ECMs) can reduce energy consumption at these buildings by 28%. In addition, in this context, Hu [9] proposed a model for identifying the most energy-efficient and cost-effective strategies at the University of Maryland’s School of Architecture Building, in the USA. The researcher analyzed eight different renovation packages that have an EUI of 148 kWh/m2. The results showed that energy savings per package ranged from 35 to 62%, a reduction in carbon emissions fell by 61 to 86%, and long-term cost savings ranged between 22 and 53%. Batlle et al. [10] used ISO50001 and ISO50006 standards to reduce electrical energy consumption at the Federal University of Itajubá, in Brazil. The authors reported that this can reduce the university’s total electricity consumption by 7.19–9.59%. Almeida et al. [11] examined the patterns of energy consumption in the buildings of the Paricarana Campus of the Federal University of Roraima, in Brazil. The results of the study showed that classrooms and administrative offices consumed 48% of the total energy used; AC, 63.3% (the largest portion); lighting, 18.1%; personal use, 4.7%; and other uses, 3.9%. Khoshbakht et al. [12] analyzed the energy use in terms of building type and took on the task of establishing an energy benchmark system for Griffith University in Australia. They reported that the building-EUI values of the building for academic departments were between 136 and 164 kWh/m2.
Liu and Ren [13] analyzed the energy consumption of libraries, and university accommodations also were looked at. They considered the relationship between system design and EE, which was also examined to see if an energy-saving target of 65% could be attained. Chung and Rhee [14] determined current energy consumption by surveying existing buildings at Soongsil University, in South Korea. The results demonstrated that this was feasible, with consumption reduced by 6–29%. Samira and Nurmammad [15] measured optimal energy savings at Azerbaijan University, in Azerbaijan. A multi-disciplinary approach was implemented for checking data. The study concluded that energy savings ranged between 20 and 56% and that this had significant environmental benefits.
Jradi et al. [16] examined the situation of a highly energy-efficient teaching building, the OU44 Building, at the University of Southern Denmark, in Odense, Denmark. According to the study, the average energy consumption difference between Danish BE10 software and actual data is a significant 55%, which can be reduced to around 11% by using EnergyPlus software. Chihib et al. [17] benchmarked energy use at different types of buildings at the University of Almeria, in Spain. They reported that the average annual EUI for the research-center building, library, sports facilities, and restaurant was 119.5, 82.7, 47.3, and 41.1 kWh/m2, respectively, whereas in classrooms and administration offices it was less than 30.0 kWh/m2. Gaspar et al. [18] evaluated the effect of the COVID-19 lockdown on energy consumption at Universitat Politècnica de Catalunya―Barcelona Tech—buildings in Spain. They found that energy consumption decreased by 57.15–74.2% in comparison with the period before the lockdown and that it decreased by 19.3–53.1% after the pandemic, depending on the use of the buildings. Bourdeau et al. [19] studied total energy (gas and electricity) consumption in three campus buildings in the Parisian region, in France. They found out that the annual EUI was in the range of 52–517 kWh/m2. Bonnet et al. [20] assessed the annual amount of electricity consumption for every activity of the University of Bordeaux campus in France. They reported that electricity consumption ratios per building-surface area ranged between 1 and 10. This parameter did not yield matching values, however, especially concerning the quality of buildings and energy systems, the use, and the size of the building. Mytafides et al. [21] evaluated energy-saving mechanisms at a university building in northeastern Greece. The study concluded that the annual EUI was less than 167 kWh/m2 at the base-case building. However, when new measures were introduced, it was noticed that the annual EUI decreased to 41 kWh/m2 and that the level of air pollution dropped to 9–109%, compared to the base case for each measure. These measures, according to the study, could yield a 2–8-year payback time. Stavropoulos et al. [22] designed an integrated platform for monitoring, managing, and supplying energy at the buildings of the International Hellenic University in Greece. Several smart grids were distributed in each building. The system helped reduce the total daily consumption of a typical university office by about 16%. Droutsa et al. [23] studied energy consumption by non-residential buildings in Greece. They reported that the primary EUI at the university was 321.6 kWh/m2. Emil and Diab [24] documented the effects of using ECMs at the building of the Mechanical Engineering Department at Ain Shams University in Egypt. The researchers used EnergyPlus and reported a reduction of the building’s energy consumption by more than 36%. Improving the EE of heating, ventilation, and air conditioning (HVAC) systems results in energy savings of more than 50%. Results also showed that the building’s annual EUI could be changed from 230 to 106 kWh/m2.
Hamida et al. [25] conducted an energy consumption theoretical techno-economic evaluation of educational buildings in Dammam, in the KSA. They suggested some ECMs, which led to a reduction of the EUI from 217.1 kWh/m2 for the base case to 167.5 kWh/m2 after implementing all ECMs. Sait [26] reported that the efficiency of the HVAC system could be increased by 31%. The researcher also reported that the average annual energy consumption of the building is 80 kWh/m3. Saeed [27] studied the extent to which thermal comfort conditions met requirements for students of the College of Architecture and Planning and the College of Engineering at King Saud University in Riyadh, KSA.
The cooling- and heating-degree days, with a base temperature of 18 °C, based on the last 5-year average (2017–2021 inclusive), were determined by using [28]. Table 2 presents cooling-degree days (CDD), heating-degree days (HDD), and the average EUI at educational buildings in different locations worldwide. As Table 2shows, there is no agreement between the final EUI values displayed in general. This may be due to:
- ❖
- Climate conditions in the location, CDD or HDD;
- ❖
- The type and price of the energy used, used—electric only or as a whole;
- ❖
- Type of university, and nature and use of buildings;
- ❖
- Structure and age of the buildings;
- ❖
- Users’ behavior.
As figures show, in some countries (such as China, Spain, and Greece), the EUI is low. The indicator, however, is only for the consumption of electric energy in mild-climate areas. The analysis of the indicators of energy consumption at universities shows that there is a substantial difference between values in this regard. Electrical EUI values, for example, ranged between 25 kWh/m2 and 427 kWh/m2. The total energy consumption per unit area was observed at 250–800 kWh/m2. In general, indicators show that Japanese universities consume less energy and Americans consume more energy than other universities in other parts of the world [29].
Table 2.
Cooling-Degree Days (CDD), Heating-Degree Days (HDD), and Average Energy Use Intensity (EUI) in Educational Buildings.
Table 2.
Cooling-Degree Days (CDD), Heating-Degree Days (HDD), and Average Energy Use Intensity (EUI) in Educational Buildings.
| Location and Country | CDD (°C) | HDD (°C) | Building Type | EUI (kWh/m2 Year) | Reference and Date of Publishing |
|---|---|---|---|---|---|
| Memorial University, Canada | 199 | 4222 | General | 250 in 2016 | Abdo-Allah et al., 2019 [30] |
| University of Maryland’s Architecture Building, USA | 816 | 2432 | General | 148 | Hu, 2018 [9] |
| Paricarana Campus of Federal University of Roraima, Brazil | 3316 | - | Library | 297 | Almeida et al., 2017 [11] |
| Offices | 162 | ||||
| Administrative | 132 | ||||
| Griffith University, Australia | 615 | 1104 | Research lab | 379 | Khoshbakht et al., 2018 [12] |
| Library | 148 | ||||
| Teaching Rooms | 145 | ||||
| Offices | 121 | ||||
| Australian Universities, Australia | - | - | Teaching Rooms | 131 | Gui et al., 2021 [31] |
| Research Centre | 427 | ||||
| University teaching building in Xi’an, China | Teaching Rooms | 30 | Sun et al., 2021 [32] | ||
| Southwest University of Science and Technology, China | 908 | 1765 | Dormitory | 84 | Deng et al., 2021 [33] |
| Soongsil University, Korea | 871 | 2692 | General | 223 | Chung and Rhee, 2014 [14] |
| Universiti Malaya, Malaysia | 233 | 394 | Research Lab | 54 to 64 | Ali et al., 2020 [34] |
| London South Bank University, United Kingdom | 222 | 2436 | Offices | 119 | Amber et al., 2017 [35] |
| Offices and Teaching Rooms | 115 | ||||
| University of Almeria, Spain | 1112 | 690 | Research Lab | 119.5 | Chihib et al., 2020 [17] |
| Library | 82.7 | ||||
| Teaching Rooms | 29.0 | ||||
| Offices | 28.8 | ||||
| Restaurant | 41.1 | ||||
| Sports Centre | 47.3 | ||||
| University of Bordeaux, France | 534 | 1850 | Library | 25 | Bonnet et al., 2002 [20] |
| Administration | 45 | ||||
| Classrooms | 41 | ||||
| Student Housing | 39 | ||||
| Sports Centre | 37 | ||||
| Research Centre | 117 | ||||
| University building in northeastern Greece | 761 | 2127 | General | 41 to 167 | Mytafides et al., 2017 [21] |
| The University of Sharjah, United Arab Emirates. | 3972 | 76 | Administration | ≈165 | Ghenai and Bettayeb, 2019 [36] |
| Educational buildings, Dammam City, KSA | ≈3800 | ≈80 | General | 167–217 | Hamida et al., 2021 [25] |
Based on the introduction and the literature review, it was found that there is a need to study energy consumption and identify opportunities for rationalization in Saudi universities. To determine whether Saudi universities are sustainable, they must also be evaluated from an environmental standpoint.
3. Methodology
3.1. Meteorological Condition
The Kingdom of Saudi Arabia has a hot and arid climate. According to Saudi Building Energy Conservation Code 602, the Qassim region is in climate zone 1 [37]. Climatic conditions play a vital role in electricity consumption. The data was collected from the climate stations that were installed in collaboration with King Abdullah City for Atomic and Renewable Energy. Figure 2 shows the average monthly temperature increasing to 38 °C in summer. It is also noted that the mean relative humidity in summer is low compared to the winter value. It is recognized that the wind speed is almost constant throughout the year. This data contributes to a better understanding of why electricity consumption is higher in the summer compared to other seasons.
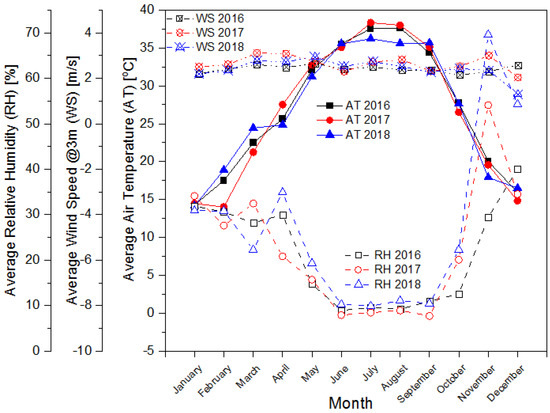
Figure 2.
The average monthly temperature, wind speed, and relative humidity during 2016–2018 for Qassim region [38].
3.2. Data Sources
Sulaiman Al-Rajhi University is a private university comprising three colleges. The campus covers an area of 981,661 m2 and accommodates 5 buildings (Figure 3) and a sports stadium (SD). Table 3 gives general information about university buildings concerning area, usage, and building structure. The structures of the buildings consist of prefabricated concrete molds and double-glazed windows, and they incorporate proper thermal insulation. The facility is usually in use from 7:00 a.m. to 5:00 p.m., Sunday through Thursday.
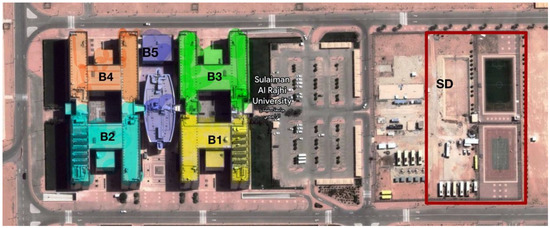
Figure 3.
Campus of Sulaiman Al-Rajhi University (SRU) [39].
Table 3.
Building Profile Data.
Table 4 shows the distribution of areas and buildings at the university in terms of activity. Service rooms have the biggest percentage (31%) of the total area. Classrooms follow, 24%; then come offices, 20%; laboratories and sports facilities, 11% each; and, finally, the auditorium, which takes up 3% of the total area.
Table 4.
Area Distribution of Buildings in Terms of Activity.
The campus was connected to the public electric grid in November 2022, so the required electric power was produced mainly by generators that run on conventional fuel (diesel). Moreover, electric power is used on campus for all purposes. The study, therefore, aims to determine the amount of energy consumed both per month and per year based on the fuel consumption bills to operate the generators. Moreover, electricity consumption was measured at 10 campus locations. In addition, energy consumption calculations were made on the basis of the number of devices, capacity (weighted capacity), and operating time. The unit price of energy was also determined based on the monthly cost of fuel consumption and the cost of renting electric power generators.
3.3. Energy Analysis and Indicators
Electricity consumption at SRU was determined in two ways: one dependent on the metering devices; the other, on the following equation:
where:
E = RP × OT × OL
RP (W), the rated power of each device;
OT (h), the total operation time per day, month, and year;
OL, the ownership level (item/activity).
The study proposes two methods for energy benchmarking at the university: Energy Use Intensity per floor area EUI as:
where:
EUI = E/A
E is the total energy or electricity consumption;
A is the building-floor area.
As for the number of people EUIp, the following equation is used:
where:
EUIp = E/N
N is the total number of people on campus.
The total weighted EUIA of the buildings was also calculated on the basis of the amount of consumption for each activity and the ratio of the area allocated to the purpose. The following equation was used:
where:
EUIA = Σ COAi × ARi
COA stands for the consumption of each activity;
AR, the ratio of the area allocated to the activity;
i, the activities.
3.4. Energy Conservation Measures
Studies conducted in the Gulf region have shown that the set point was used to determine the annual amount of energy that could be saved, such as Alardhi et al. [40], Esmaeil et al. [41], Kharseh et al. [42], and Al-Mumin et al. [43]. These studies report saving 10–14% of the cooling load by increasing the temperature set point by 2 °C. Equation (5) is used to calculate the amount of energy saved:
where:
Eh (kWh), total amount of energy consumption for HVAC per hour;
OT (h), the number of hours of official work a year or the number of no-work hours in a year;
RS (%), the ratio of the saving of energy, which is 0.12 for official work hours, and 0.20% for non-work hours.
3.5. Environmental Analysis
Saving any amount of energy means contributing to the protection of the environment. The use of EE measures reduces CO2 emissions. The annual rate of gas emissions or savings can be calculated as follows:
where:
Saving Emissions = EF × EC
EF is Emissions Factor (kgCO2/kWh or any gas);
EC, consumption or saving of electricity (kWh).
The EF for Saudi Arabia was estimated by Almasri et al. [44] at 761 g CO2/kWh for 2017 and 703 g/kWh for 2020 [5]. Tazay [45] assumed that electricity generation will produce harmful emissions: 1.79 g CO/kWh, 1.60 g/kWh of Nitrogen Oxides, 1.47 g/kWh of Sulfur Dioxide, 0.2 SO2 g/kWh of unburned hydrocarbons, and 0.14 g/kWh of particular matter.
3.6. Economic Analysis
Cost savings and the simple payback time (SPBT) are considered based on the cost of replacement in local markets, the prices of electricity from the national grid, and the average cost of electricity from generators. Cost savings (CS) can be calculated as follows:
where:
CS = ES ⨯ PU
- ES, Energy-saving;
- PU, Price per unit of electricity (0.18 from the national grid or 0.39 SR/kWh from SRU generators).
The SPBT of ECMs is obtained as follows:
4. Results and Analysis
4.1. Energy Consumption
The campus was not connected to the public electric grid until November 2022, so electric power was produced mainly by generators that ran on conventional fuel—diesel. Electricity is used on the campus for all purposes. Readings of meters for the end-use of electricity were taken every hour, every day, throughout the year. Consumption and loss were calculated, and it was found that the efficiency of power generators was 31.6%. The amount of diesel consumed by generators during the year 2021 was 4,224,564 L. As for the total primary energy consumed this year—45,203 MWh—it was assumed that the calorific value of diesel is 10.7 kWh/L [46]. Figure 4 Shows the balance of campus energy during 2021. It will be noticed that the annual total of the generated electrical energy was 14,274 MWh and that the energy consumed was 13,859 MWh, which means that there was a 3% loss in transmission and distribution. This study depends on determining the actual monthly and annual amounts of energy consumption. It was noticed that there was a direct relationship between electricity consumption and average temperatures, as Figure 5 shows. As average temperatures rise, the demand for electricity increases due to the use of air conditioners to cool buildings. The lowest electricity consumption was recorded in February, when it went down to approximately 684 MWh, and the highest in July—approximately 1681 MWh. The total monthly consumption was obtained based on the measurements taken by using the meters and Equation (1).
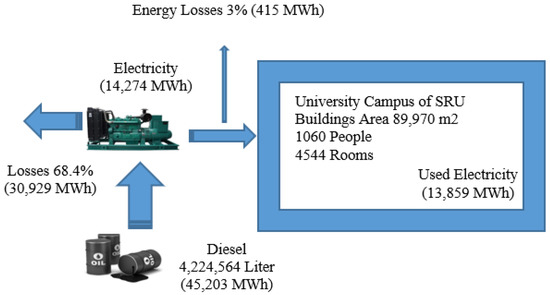
Figure 4.
Flow of Energy, University Campus, 2021.
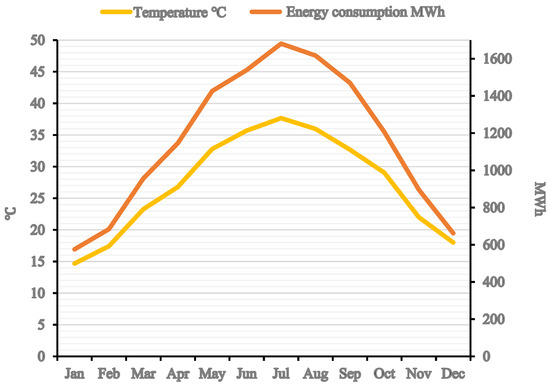
Figure 5.
Monthly Average Temperature and Monthly Electrical Energy Consumption in 2021.
4.2. End-Use of Electricity
Electrical energy consumption on campus was divided into three categories: that of the AC, that of the lighting system, and that of other uses.
- Electricity Consumption by Air-Conditioning
Temperature and relative humidity were measured in all buildings at various times of the year at a height of about one meter above the ground. Table 5 shows the measurements and the values recommended for achieving thermal comfort conditions, according to standard [47], where in summer the lowest temperature was 16 °C and the highest was 23 °C, whereas in winter the lowest temperature was 18 °C and the highest was 23 °C, with humidity dropping to a low of 27% and rising to a high of 35%. The temperature in summer was lower than that recommended for thermal comfort conditions, and that was the case in most places, which means that it is possible to rationalize energy in these places. As for winter, the recorded temperatures were suitable for the conditions sought, and the required level of relative humidity was the minimum value.
Table 5.
Measured and Recommended Temperatures and Humidity Levels in the Buildings [47].
The cooling requirements of the university buildings were met through the use of two chilling systems. Each system consisted of five air-cooled screw chillers of 384 TR capacity and eight pumps (six primary and two secondary). The HVAC system consisted of 46 AHUs, 67 FCUs, and 40 ducted, floor-mounted, or wall-mounted split units. The result of measurement and calculation based on Equation (1) shows that the HVAC system has the biggest consumption of electricity at 10,946 MWh.
- 2.
- Electricity Consumption by Lighting
Table 6 shows data on the interior lighting system and the measured light level, standard level, and electricity consumption. The daily electricity consumption was calculated based on Equation (1). There are five main types of lighting in the facility: 4 × 18 W Fluorescent Tube Lamps (FTL) in offices and classrooms, 2 × 26 W Compact Fluorescent Lamps (CFL), 1 × 36 W Light Emitting Diodes (LEDs) in corridors, 1 × 36 W FTL in the basement parking lot, and 1 × 400 W High-Pressure Sodium (HPS) lights in the studio, while FTLs are predominant. Some lights use a motion sensor, while others use a switch. Lux levels for all spaces of classrooms and offices were measured at an altitude of 75 cm, while the inner corridors and the main lobby measured light at ground level according to the measuring rules specified in EN 12464 (Lighting of Workplaces) and EN 12193 (Lighting of Sports Facilities) standards [48,49]. Light levels in offices, classrooms, some corridors, and basement parking matched recommendations, but not in toilets, the auditorium, studios, or most corridors, as shown in Table 6. In toilets and the auditorium, they were lower than recommended levels. In corridors, in general, and in the studios, they were higher, which means that consumption here can and needs to be rationalized.
Table 6.
Interior Lighting System at the University.
- 3.
- Electricity Consumption in the Case of ‘Others’
Referenced here are various devices on campus, such as computers, printers, low currents, data centers, projectors, laboratory equipment, elevators, fans, cooking equipment, etc. The number of devices used, operation time per day, weighted power, and, eventually, the average daily consumption have all been determined. Table 7 shows the total daily and annual consumption based on the measurements and using Equation (1) for most of the equipment used.
Table 7.
Data of Equipment Used at the SRU.
The HVAC system, “others,” and lighting system consumed 79% (10,946 MWh), 14% (1941 MWh), and 7% (974 MWh) of the total electricity consumption, respectively, as shown in Figure 6.
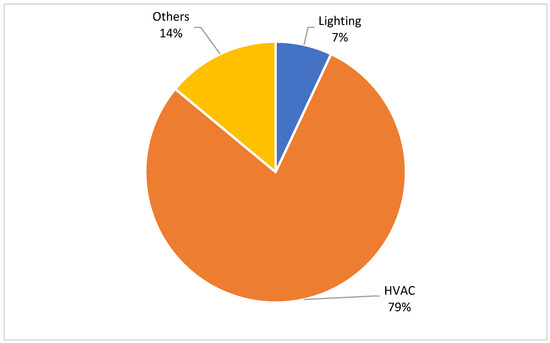
Figure 6.
End-Use of Electricity.
4.3. Electricity Consumption by Activities
Figure 7 shows electricity consumption at the SRU by activity. Service rooms, as the figure shows, have the biggest percentage of the total amount of consumption—35% (4850 MWh). Others follow, in the following order: classrooms, with 26% (3603 MWh); offices, with 20% (2770 MWh); laboratories, with 11% (1520 MWh); sports facilities, with 5% (692 MWh); and, finally, the auditorium, with 3% (0.41 MWh). Service rooms, classrooms, and offices, as will be noticed, consumed about three-quarters of the electrical energy on campus.
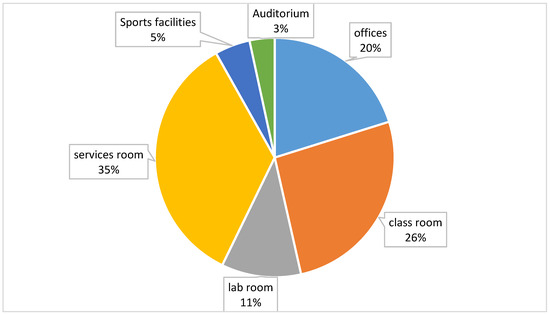
Figure 7.
Electricity Consumption Percentage by Activity.
The percentage of AC electricity consumption in this study is consistent with the results of the studies carried out by Almeida et al. [11] in Brazil, and Ghenai and Bettayeb [36] in the United Arab Emirates, as shown in Table 8, where it will be noted that there is no agreement between the percentages of consumption presented in general and that the AC load is at its highest level in most cases (except for the case of Greece), and that is probably because of the climate, the design of the building, or the difficulty of determining the percentage of consumption according to use (since there is often one source for many uses).
Table 8.
Comparison of the End-Use Energy Consumption at Different Universities in (%).
4.4. Electricity Consumption Indicators
One of the key metrics used to measure energy consumption is EUI, which refers to energy per square meter area per year and is calculated by dividing the total amount of energy consumed by a building in one year by the total gross floor area of the building (using Equation (2)). Generally, a low EUI signifies good energy performance. Figure 8 shows EUI based on campus activity in 2021, where it will be noticed that the annual value of this intensity ranged between 63.5 and 173.9 kWh/m2. The total weighted EUIA of the buildings was calculated based on the amount of consumption for each activity and the ratio of the area allocated to the purpose using Equation (4). The annual total weighted EUIA of all buildings (155 kWh/m2) was obtained in 2021. As for the results of this study in this respect, they are consistent with the results of the studies carried out by Almeida et al. [11] in Brazil, Ghenai and Bettayeb [36] in the United Arab Emirates, and Hamida et al. [25] in Saudi Arabia, as shown in Table 2, and that may be because the values of CDD are close due to convergent climate conditions. When comparing the results of this study with those of other studies concerning classrooms, for example, we notice that in this study, annual consumption in this respect totals 172 kWh/m2, whereas in other studies, figures range between 29 and 145 kWh/m2. Figures concerning offices differ too: in this study, the figure is 154 kWh/m2, whereas in other studies, the same figure ranges between 29 and 162 kWh/m2. In addition, here it should be noted that this value is in agreement with the values found in the studies conducted by Hu [9] and Mytafides et al. [21] and differs from those reported by Abdo-Allah et al. [30] and Chung and Rhee [14], as shown in Table 2. Furthermore, the energy consumption figures concerning laboratories were not compatible, and this is normal as the installed equipment, the operating time, and the EE of the equipment used all differ.
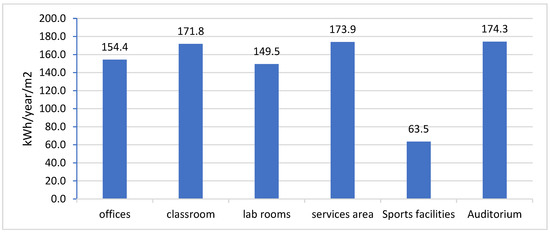
Figure 8.
Electricity Use Intensity for Different Activities.
Table 9 shows the annual consumption of electricity on campus in the period 2017–2021, where it will be noticed that there was a gradual increase in electricity consumption and that this increase ranged between 1 and 2%, which was due to the expansion of academic programs and the increase in the number of students. It will also be noticed that the percentage of electricity consumption decreased by 7% in 2020 compared to previous years, which was a result of COVID-19 conditions. Table 9 shows electricity consumption per square meter (approximately 145–155 kWh/m2) and per capita (approximately 12,987–16,351 kWh). Here it was noticed, as the figures show, that when the number of employees increased, consumption per capita went down. In addition to the energy consumption per capita, Ma et al. [29] conducted a survey of energy indicators at universities in America, Europe, and Asia and reported that annual electrical energy consumption per capita fluctuates between 2000 and 14,000 kWh and that the maximum value was recorded at Carnegie Mellon University. This study also showed that the annual energy consumption per capita at Yale and Cornell universities was approximately 40,000 and 37,000 kWh/capita, respectively, whereas at Kyoto and Osaka universities it was about 20,000 kWh. In contrast, this indicator was 7000 kWh for Keio and Oxford universities. Sait [26] reported that the average annual energy consumption at an educational building per capita is 2400 kWh in the KSA. Here it should be noted that according to the indicators used, the annual average consumption of electrical energy was 14,669 kWh/capita and that the figure of total (primary) energy in this case study was higher than that recorded at Yale and Cornell universities. External climate conditions, a variety of uses, the small size of the building, and the low number of people at the SRU could all be factors.
Table 9.
Annual Electricity Consumption and Electricity Consumption Indicator per Square Meter (EUI) and Capita.
4.5. Costs of Public-Grid and Privately Generated Electricity
Noor Energy supplies SRU with the electricity it needs by employing custom-built diesel generators. The annual or monthly cost of renting generators was divided by the amount of annual or monthly electricity consumption to calculate the cost of renting generators in terms of electricity units. This cost was a variable value due to increased electricity consumption in summer and decreased consumption in winter. Therefore, it will be noticed that in the November–February period, the cost of electricity from rent generators only increased to a maximum of 0.37 SR/kWh, whereas in the April–October period it decreased to a minimum of 0.15 SR/kWh. This means that if electricity consumption increases, the cost of renting generators per kWh will decrease. As for the cost of electricity from diesel-only, it ranged between 0.14 and 0.17 SR/kWh. Under the terms of the contract, the annual cost of the generator rental is fixed at 255,300 SR per month, which means that the annual average cost of the electrical energy produced by the rented generator is about 0.27 SR per kWh. The Specific Energy Generation Ratio (SEGR) for the diesel generator sets is 3.3 kWh/liter. Annual electricity consumption and the cost of the facility were calculated based on diesel consumption and SEGR. The annual total average cost of generated electricity (generator source) was estimated at approximately 0.39 SR/kWh. Hence, the unit price of the electrical energy generated on campus ranged between 0.3 and 0.53 SR/kWh, whereas the Saudi Electricity Company’s (SEC’s) price of electricity for educational buildings was 0.18 SR/kWh. This shows a significant difference in costs. Table 10 gives detailed information on the technical and economic aspects of energy consumption in 2021, including diesel costs and SEC’s prices for university buildings. The total cost of electricity units from the generator was calculated as being the sum of the cost of diesel and the cost of the rented generator.
Table 10.
Costs of Diesel-Source Electrical Energy and SEC’s Prices for University Building in 2021.
Figure 9 shows the relationship between the total consumption and cost of electricity from SRU generators and SEC sources, where it will be noticed that the costs of generated electricity went up in summer due to the growing demand for diesel and fell in winter due to the declining demand for this diesel. It will also be noticed that the cost of generated electricity was much higher than that of the public grid (from SEC), where in 2021 this cost was 5,405,021 SR in comparison with an overall cost of 2,494,625 SR for public grid electricity in the same year. This means that the public grid (from the SEC) is more than 50% cheaper than campus-generated electricity.
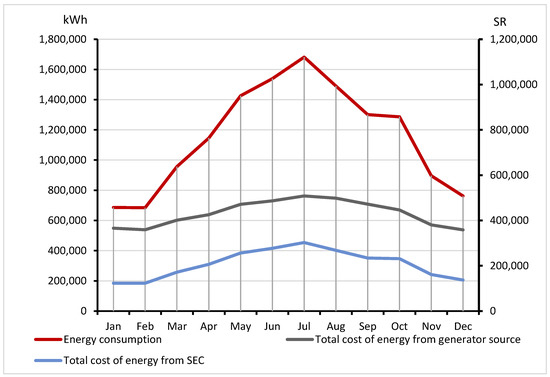
Figure 9.
Total Electricity Consumption and Costs of Campus-Generated and Public Grid Electricity in 2021.
4.6. Effect of Diesel Price on Electrical Energy
The campus under study was not connected to the public electric grid till November 2022, so the electric power needed is produced mainly by generators that run on conventional fuel (diesel). Figure 10 Shows the prices of the SEC, the cost of diesel, and the cost of diesel combined with the cost of renting a generator. The cost of diesel is assumed to increase gradually and reach 3 SR/liter (1 dollar = 3.77 SR). Moreover, the monthly rent for the generators is fixed. Thus, the total cost of a unit of electric power from the generating source (diesel-run rented generators) will rise to 1.21 SR, and the total cost of producing electricity by diesel, regardless of other things, will rise to 0.97 SR, while the cost of electricity from the public grid (SEC) is fixed at 0.18 SR per kWh. Figure 10 Also shows that the costs of privately generated electricity are higher than those of the electricity on the national grid. Thus, as Figure 10 Shows, if the price of a liter is 0.55 SR, the price of a unit of electric power from SEC will be equal to the price of a unit produced by diesel power only, without taking the cost of renting generators into account, as the generators may be owned by the university. These conditions apply not only to educational buildings but can also be applied to any project that needs electricity and is far from the national electrical grid.
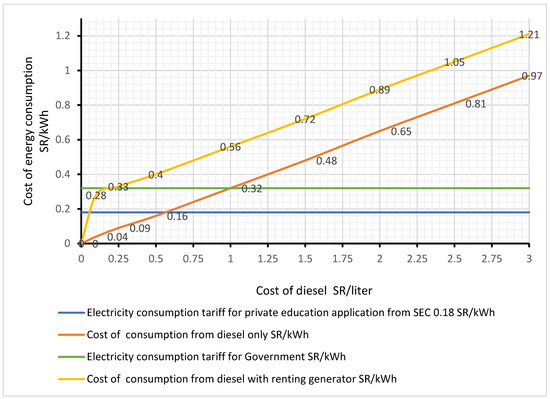
Figure 10.
Total Cost Tariff of Electricity Consumption of SEC, Electricity Produced by Diesel-Run Generators, and Electricity Produced by Diesel-Run Rented Generators.
5. Energy Conservation Measures
After determining the amount of energy consumption on campus during the last five years and determining the source of energy and how this energy has been consumed, it has been found that most of the energy has been consumed in cooling buildings—79% of the total amount of energy consumed on campus, which reflects the need to focus on this use. This section will examine some possible rationalization options for university buildings. Therefore, the following ECMs are suggested (Figure 11). These measures will be discussed in detail in the following sections.
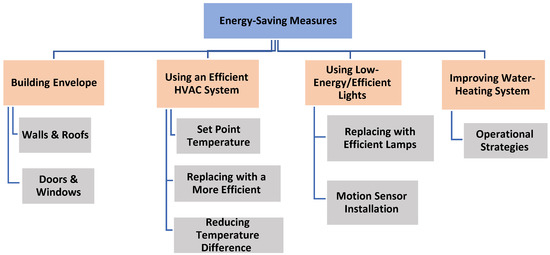
Figure 11.
Suggested Energy Conservation Measures.
5.1. Building Envelope
A building envelope is a structure of many elements that separates the external and internal environments of a building. Thermal insulation is important from technical, economic, and environmental perspectives. It also has several benefits. The envelope of the building at SRU was examined to ensure that it was entirely isolated. Table 11 Shows the layer specifications for the exterior walls and roofs.
Table 11.
The Layer Specifications of the Exterior Walls and Roofs of the Building at SRU.
Based on these specifications, the overall heat transfer coefficient came to be 0.35, with 0.26 W/m2 K for the outer walls and roofs, respectively. The windows used in the buildings were double-glazed (k-lite, 6 mm ss08, with a 12 mm air spacer, with a U-value of 2.42 W/m2 K). Table 12 Shows the overall heat transfer coefficient required for walls and roofs as of August 2021 in all zones in the KSA. SBC 601 is for high-rise residential buildings and non-residential buildings in general, whereas SBC 602 is for residential buildings that do not exceed three floors. Table 13 Displays the maximum compulsory value of the overall heat transfer coefficient for windows in all climatic zones in the KSA.
Table 12.
Overall Heat Transfer Coefficient Required for Walls and Roofs from August 2021 in the KSA (W/m2 K) [51].
Table 13.
Overall Heat Transfer Coefficient Required for Windows in All Climatic Zones in the KSA Beginning in August 2021 (W/m2 K) [51].
Comparing the values required for zone 1 in the SBC 601 for non-residential buildings in Table 12 and Table 13, we find that both walls and roofs meet the required conditions and that there is no need for any energy-saving measures. As for windows, their windows–wall ratio is less than 40%, and the heat transfer coefficient is 2.42 W/m2 K, which is less than the values required in the SBC 601 (2.89 W/m2 K). This means that there is no need to improve the quality of windows in terms of thermal insulation.
The color of the exterior of buildings also plays an important role in the energy consumption of AC. Khan and Asif [52] studied the effect of green-roof adoption on the energy consumption of buildings in Dhahran and Riyadh, KSA. The ECOTECT program was used. They reported that the green roofs in Dhahran and Riyadh could decrease electrical energy intake by 6.7% and 6.8%, respectively. Since the color of the SRU buildings is not dark, the percentage of energy savings as a result of the color will be limited.
5.2. Improving HVAC System
Reducing energy demand and increasing EE is considered an important contribution to countering global climate change. However, the amount of energy consumed depends not only on the criteria set for the indoor environment and the technology used but also on the occupants’ behavior. The energy consumption of the AC has proved to be the highest, reaching 79% of the university’s total energy consumption. Therefore, we propose that the following measures—or all of them—be taken.
5.2.1. Set Point Temperature
The HVAC systems at the SRU operate non-stop (24 h a day, seven days a week), with an annual average electricity consumption of about 10,948 MWh for the AC system. The need for AC is essential during official working hours, five days a week. Apart from that, it is not necessary to turn on the AC except in those places that need it, such as the data center, server room, and others that need AC continuously.
The temperature set point plays a vital role in determining the energy consumption of the AC. Table 5 Shows the measurements and the values recommended for achieving thermal comfort conditions, according to standard [47]. In summer, temperatures were lower than what is recommended for thermal comfort conditions, and that was the case in most places. As for winter, the recorded temperatures were suitable for the conditions sought. Adjusting the temperature set point to be in the range of 23–25 °C instead of 19–22 °C during official working hours (from 7 a.m. to 5 p.m., five days a week) could lead to an average energy savings of around 12% of the total, or the average energy consumption of AC systems with zero SPBT. This is what studies conducted in the Gulf region have shown, studies such as Alardhi et al. [40], Esmaeil et al. [41], Kharseh et al. [42], and Al-Mumin et al. [43]. These studies report saving 10–14% of the cooling load in the Gulf region by increasing the temperature set point by 2 °C. To determine the annual amount of energy that could be saved with the set point in the range of 23–25 °C during official working hours, the results of the research mentioned earlier were relied upon in this field. A 10 h period per work day, which is 52 × 5 × 10 = 2600 h per year, was assumed. To determine the amount of energy consumed per day, annual average energy consumption was divided by the number of days in the year, and it was found that the daily consumption of HVAC was about 29,811 kWh and that energy intake per hour was 1242 kWh. The amount of energy that can be saved using Equation (5) is as follows:
Annual saving = 1242 × 2600 × 0.12 = 387,504 kWh
It should also be noted that the buildings are not used at night, but they are air-conditioned. Therefore, a strategy can be worked out to ease the conditions and change the temperature to 27–29 °C from 5 p.m. to 7 a.m. five days a week and weekends, which means 8760 − 2600 = 6160 h per year. We assume that this measure can reduce energy consumption by approximately 20%, by using Equation (5):
Annual saving = 1242 × 6160 × 0.20 = 1,530,144 kWh
Then, the energy that can be saved by adjusting the temperature setting point is the sum resulting from saving during the year: 387,504 + 1,530,144 = 1,917,648 kWh.
5.2.2. Replacing with a More Efficient System
The current, traditional HVAC systems, which contain screw compressors without a variable frequency drive (VFD), were installed thirteen years ago. That means the motor will run continuously, regardless of the system’s requirements, which leads to energy waste. Table 14 Shows the technical specifications of the chillers used at SRU. We can replace these chillers with more efficient ones and achieve a higher level of energy savings. Utilizing a VFD will increase the overall efficiency of the chiller system. Moreover, operating the compressor at a lower speed reduces maintenance by reducing wear and tear on both the motor and the compressor. Once a VFD is fitted, the energy cost of an average compressor will go down by 20–30%. This calculation is based on the assumption that if it is to be run 24 h a day, the compressor has a running life of 15 years [53]. Furthermore, the use of a variable-speed pump in the system can save up to 80% of pump power [54]. The VFD unit is connected to the motor’s electrical supply unit, and then it manages the load fluctuation. The Council of Australian Governments (COAG) suggested replacing and/or upgrading chillers when they pass the age of 15 years [55].
Table 14.
Design Specifications of the Chillers (Carrier) that Used at SRU.
If the screw compressor used is replaced with a VFD one, this results in significant energy savings over time—presumably, 20% of the energy supplied to compressors can be saved. Therefore, as long as electricity consumption by chillers is 7226 MWh, energy savings will be estimated after replacing the old chillers with new, high-efficiency ones, as follows: 7,226,000 × 0.2 = 1,445,200 kWh.
Measurements of two chillers were made to evaluate the case and determine the actual COP, with the design COP at full load of the chillers being 3.0. It was found that the COP of chiller 1 is acceptable, as shown in Table 15, and that it was close to the design value but needed improvement concerning the benchmark for chillers from ASHRAE (see Figure 12). As for the second chiller, the COP was low, so it was better to replace it with one that has a higher COP to reduce energy consumption—such (water-cooled) chillers are available with a COP of up to 7. These (water-cooled) chillers have a high EE and save more energy than air coolers. COP depends on the technology used. For example, variable-speed chillers and those that use electromagnetic bearings help boost chillers’ efficiency to a great extent [55].
Table 15.
Data for Chillers.
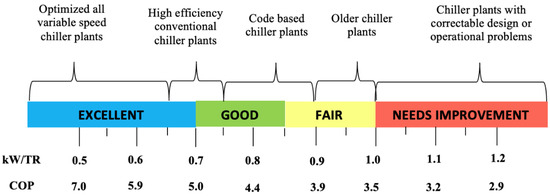
Figure 12.
Benchmark of Chillers from ASHRAE [56].
5.2.3. Reducing Temperature Difference
The temperature difference between indoor and outdoor environments affects the level of energy consumption by the AC system. Since the internal temperature is required to achieve thermal comfort, there remains only the control of the outdoor temperature (reducing the temperature of the environment surrounding the outside part of the refrigeration machine in summer and raising it in winter). Alshehri et al. [57] compared the performance of ground-source heat pumps (GSHP) with systems employing air-source heat pumps (ASHP). TRNSYS software (Madison, WI, USA) was used for a single-story office building. The climatic conditions of the city of Riyadh, in the KSA, were simulated. The researchers reported that the GSHP was feasible, with an 11-year payback period, an 18% savings on total costs, and a 36% lower annual energy consumption. Almasri et al. [58] report that energy consumption decreased by an average of about 28% when a refrigerator condenser was placed in a groundwater tank, compared with another case of a condenser located in the outside air in the Qassim region in KSA. These results were also confirmed by Woolley et al. [59], Harrington and Modera [60], and Kuo and Liao [61].
Here, it might be argued that the hotness of water or the soil could be a cause for worry. In that case, this solution can be used as an alternative to the traditional AC in appropriate cases, and if the water or soil temperature is higher than the average ambient temperature during the summer period, then we could return to the traditional system of heat release through the air condenser.
5.3. Improving Light System
Improving the lighting system is one of the quickest, easiest, and cheapest ways to save energy and money in buildings. We recommend implementing some of the following energy-saving measures.
5.3.1. Replacing with Efficient Lamps
LED lights are much more efficient than other lighting systems. SmarterHouse is a project developed by the American Council for an Energy-Efficient Economy. They reported that LED bulbs are 30% more efficient than CFLs and 75% more efficient than the best halogen incandescent lamps [62]. The amounts of electricity consumed by lights per day, month, and year were determined by using Equation (1). Table 16 shows a comparison of energy consumption by lights in the base case and energy consumption by a LED system. Analysis of the data about lights showed that there was a savings of around 68% of the total energy conventional lights normally consume. Hence, if the lighting system used (3457 pieces) is replaced by LED lights, then an annual saving of electricity of 666,650 kWh can be achieved, which ensures annual savings of about 259,993 SR using Equation (7), with the electricity price being 0.39 SR/kWh. The total cost of the LEDs on the local market is estimated at 103,710 SR. These savings could be achieved with an estimated SPBT of 0.3 years using Equation (8).
Table 16.
Comparison of the Energy Consumption of Base Case and LED Lights.
5.3.2. Motion Sensor Installation
The energy consumption in the base case will be compared to that of motion-sensor systems. Table 17 shows the base-case energy consumption by lights in a case in which motion-sensor systems are installed. If the lighting system is installed with 300 motion sensors, then an annual electricity savings of 457,660 kWh can be achieved, which ensures annual savings of about 178,487 SR at the current electricity price of 0.39 SR/kWh. The total cost of the motion sensor in the local market is estimated at 150,450 SR. Analysis of the data about lights showed that there was a savings of around 47% of the total energy conventional lights normally consume, which can achieve an estimated SPBT of 0.7 years.
Table 17.
Energy Consumption by Lights Used in the Base Case and by Motion Sensor.
5.3.3. Installing a Motion Sensor and Using Efficient Lights
Table 18 shows the combined effect of using LEDs and a motion sensor in buildings. An annual saving of 820,534 kWh of electricity can be achieved, which means that an annual SR of 320,008 could be saved on costs. A potential savings of 84% of the total energy usually consumed by lights could be achieved by installing a motion-sensor system and replacing conventional lights with LEDs. The estimated cost of the motion sensor and the LED lights was 254,160 SR, with a simple payback period of 0.8 years.
Table 18.
Electricity Consumption by Base-Case Lights and by LEDs and the Motion Sensor.
5.4. Improving Water-Heating System (Operational Strategies)
The amount of annual energy consumed by water heaters was estimated at 1130 MWh (Table 7), which accounts for 8.3% of the total annual energy consumed by the SRU. Moreover, this amount exceeds the total amount of energy consumed by lighting. That is why we have suggested adopting operational strategies that would help reduce energy consumption. As this study shows, the operation period of water heaters was 8 months a year, from October to May, 24 h a day. Furthermore, as data about the average temperatures in the region during these months suggests (see Figure 2), the months in which the operation of water heaters can be limited are December, January, and February. If the heaters are turned on from December to February only, 62.5% (or 706,250 kWh) of the total annual amount of energy consumed by heaters can be saved.
5.5. Economic Analysis
Cost-saving and SPBT are considered based on the cost of replacement in local markets, the prices of electricity from the national grid (0.18 SR/kWh), and the average cost of electricity from generators (0.39 SR/kWh). Table 19 shows the total annual savings on costs in the case of feeding from a generator source and the prices of electricity from the national grid. The table also clearly shows the effect of electric energy prices on SPBT, as total SPBT = 4.13 years at the price of a unit of energy generated by generators, whereas SPBT = 8.96 in the case of electricity consumption on the national grid, to which the SRU network was connected in November 2022. The cost savings (CS) are obtained using Equation (7) and the SPBT using Equation (8). Hamida et al. [25] carried out a theoretical techno-economic evaluation in Dammam, in the KSA. They suggested that energy conservation required making some changes to the lighting and HVAC systems, enhancing the glazing type, and preventing air leakages with a SPBT of 2.7 years. Sait [26] looked at electrical energy consumption at an educational building in a hot, humid climate area in Rabigh, in the KSA. He proposed some ECMs for reducing electricity consumption by 35.3%, which would yield an SPBT of about 2.7 years.
Table 19.
Summarizes the Total Annual Energy Savings, Costs, and Payback for ECMs at 0.39 and 0.18 SR/kWh.
5.6. Environmental Benefits
Saving any amount of energy means contributing to the protection of the environment. Therefore, the reduction of gas emissions was calculated based on the energy saved as a result of taking particular energy-saving measures. The calculation is based on Equation (6) and takes into account the indicators of a decrease in the emission of CO2 as shown by the published data for 2020 [5], while other pollutants are based on data reported by Tazay [45]. Table 20 shows the annual reduction in GHG emissions yielded by energy-saving measures.
Table 20.
Annual Reduction in GHG Emissions Yielded by Energy-Saving Measures.
6. Conclusions
Saving any amount of energy means contributing to the protection of the environment. Reducing energy demand and increasing EE is considered an important contribution to countering global climate change. However, the amount of energy consumed depends not only on the criteria set for the indoor environment and the technology used but also on the occupants’ behavior.
The study goal is to measure and evaluate energy consumption in all buildings at SRU and examine energy-efficiency measures. The study, therefore, aims at determining the amount of energy consumed both per month and per year based on the fuel consumption bills to operate the generators. The campus was connected to the public electric grid in November 2022, so the required electric power is produced mainly by generators that run on conventional fuel (diesel). Moreover, electric power is used on the campus for all purposes. As a result of the study, the following was concluded:
- ❖
- The lowest electricity consumption was recorded in February, when it went down to approximately 684 MWh, and the highest in July—approximately 1681 MWh of the total consumed in 2021, 13,859 MWh.
- ❖
- The HVAC system accounts for the biggest percentage—79%—of the total consumption of electricity, followed by “others,” with 14%, and lighting, with 7%, of the total consumption.
- ❖
- In the period 2017–2021, the electricity consumption intensity is approximately 145–155 kWh/m2 and the per capita consumption is approximately 12,987–16,351 kWh.
- ❖
- The percentage of electricity consumption decreased by 7% in 2020 compared to previous years, which was a result of COVID-19 conditions.
- ❖
- The average price of energy generated at the university, 0.39 SR/kWh during 2021, was higher than the energy price drawn from the electrical network of educational institutions, 0.18 SR/kWh, and governmental institutions, 0.32 SR/kWh. This means that the public grid was 50% cheaper than campus-generated electricity.
- ❖
- The energy-saving measures in the air conditioning system are the most important for obtaining a sustainable system, even though the building envelope is insulated.
- ❖
- The walls, roofs, and windows meet the required conditions in terms of thermal insulation in zone 1 in KSA, and there is no need for energy-saving measures.
- ❖
- The total SPBT of the suggested energy-saving measures is 4.13 years at the price of a unit of energy generated by generators, whereas the total SPBT of the national grid is 8.96 years.
- ❖
- Annual reductions in CO2, CO, N2O, and SO2 emissions yielded by suggested energy-saving measures at SRU were 3,438,817, 8756, 7827, and 7191 respectively.
Author Contributions
Conceptualization, R.A.A. and F.A.A.; methodology, R.A.A.; validation, R.A.A., and F.A.A.; formal analysis, F.A.A.; investigation, R.A.A.; resources, F.A.A.; data curation, R.A.A.; writing—original draft preparation, F.A.A.; writing—review and editing, R.A.A.; visualization, F.A.A.; supervision, R.A.A.; project administration, R.A.A.; funding acquisition, R.A.A. All authors have read and agreed to the published version of the manuscript.
Funding
The authors gratefully acknowledge Qassim University, represented by the Deanship of “Scientific Research, on the financial support for this research under the number (QEC-2022-1-1-J-27960) during the academic year 1444 AH/2022 AD”.
Institutional Review Board Statement
Not applicable.
Informed Consent Statement
Not applicable.
Data Availability Statement
Not applicable.
Conflicts of Interest
The authors declare no conflict of interest.
Abbreviations
| A | Building-floor Area |
| AC | Air-Conditioning |
| AHU | Air Handling Units |
| ASHP | Air-Source Heat Pumps |
| ASHRAE | American Society of Heating, Refrigerating, and Air-Conditioning Engineers |
| CDD | Cooling-Degree Days |
| CFL | Compact Fluorescent lamps |
| COP | Coefficient of Performance |
| E | Total Electricity Consumption |
| EC | Consumption or Saving of Electricity |
| ECMs | Energy-Conservation Measures |
| EE | Energy Efficiency |
| EER | Energy Efficiency Ratio |
| EF | Emissions Factor |
| Eh | Energy Consumption per Hour. |
| ES | Energy-Saving |
| EUI | Energy Use Intensity |
| FCU | Fan Coil Unit |
| FTL | Fluorescent Tube Lamps |
| GSHP | Ground-Source Heat Pumps |
| HDD | Heating-Degree Days |
| HPS | High-Pressure Sodium |
| HVAC | Heating, ventilation, and air conditioning |
| KSA | Kingdom of Saudi Arabia |
| LEDs | Light-Emitting Diodes |
| N | Number of People |
| OL | Ownership Level |
| OT | Operation Time |
| PU | Price per Unit of Electricity |
| RE | Renewable Energy |
| RP | Rated Power |
| RS | Ratio of the Saving of Energy |
| SBC | Saudi Building Code |
| SD | Sports Stadium |
| SEC | Saudi Electricity Company |
| SPBT | Simple Payback Time |
| SR | Saudi Riyal |
| SRU | Sulaiman Al-Rajhi University |
| U | Overall Heat Transfer Coefficient |
| VFD | Variable Frequency Drive |
References
- Saudi Arabia Energy Consumption. 2018. Available online: https://www.iea.org/sankey/#?c=Saudi%20Arabia&s=Balance (accessed on 20 June 2021).
- Saudi Electric Company. Annual Statistical Booklet for Electricity and Seawater Desalination Industries. p. 164. Available online: https://www.ecra.gov.sa/en-us/MediaCenter/doclib2/Pages/SubCategoryList.aspx?categoryID=5 (accessed on 20 January 2022).
- Vision 2030 of Kingdom of Saudi Arabia. 2016. Available online: http://vision2030.gov.sa/en/ntp (accessed on 14 December 2020).
- More Than 4 Million Riyals the Rate of Waste of Electricity at the University Annually! Available online: https://rs.ksu.edu.sa/issue-1365/16391 (accessed on 29 June 2021).
- Climate Transparency Report Comparing G20 Climate Action and Responses to the COVID-19 Crisis. 2020. Available online: https://www.climate-transparency.org/wp-content/uploads/2021/10/CT2021SaudiArabia.pdf (accessed on 16 June 2022).
- Yüksel, A.; Arıcı, M.; Krajčík, M.; Civan, M.; Karabay, H. A Review on Thermal Comfort, Indoor Air Quality and Energy Consumption in Temples. J. Build. Eng. 2020, 35, 102013. [Google Scholar] [CrossRef]
- Li, S.; Chen, Y. Internal benchmarking of higher education buildings using the floor-area percentages of different space usages. Energy Build. 2021, 231, 110574. [Google Scholar] [CrossRef]
- Ligade, J.; Razban, A. Investigation of Energy Efficient Retrofit HVAC Systems for a University: Case Study. Sustainability 2019, 11, 5593. [Google Scholar] [CrossRef]
- Husein, M.; Chung, I.-Y. Optimal design and financial feasibility of a university campus microgrid considering renewable energy incentives. Appl. Energy 2018, 225, 273–289. [Google Scholar] [CrossRef]
- Batlle, E.A.O.; Palacio, J.C.E.; Lora, E.E.S.; Reyes, A.M.M.; Moreno, M.M.; Morejon, M.B. A methodology to estimate baseline energy use and quantify savings in electrical energy consumption in higher education institution buildings: Case study, Federal University of Itajubá (UNIFEI). J. Clean. Prod. 2020, 244, 118551. [Google Scholar] [CrossRef]
- Almeida, A.P.; Sousa, V.; Silva, C.M. Methodology for estimating energy and water consumption patterns in university buildings: Case study, Federal University of Roraima (UFRR). Heliyon 2021, 7, e08642. [Google Scholar] [CrossRef]
- Khoshbakht, M.; Gou, Z.; Dupre, K. Energy use characteristics and benchmarking for higher education buildings. Energy Build. 2018, 164, 61–76. [Google Scholar] [CrossRef]
- Liu, Q.; Ren, J. Research on the building energy efficiency design strategy of Chinese universities based on green performance analysis. Energy Build. 2020, 224, 110242. [Google Scholar] [CrossRef]
- Chung, M.H.; Rhee, E.K. Potential opportunities for energy conservation in existing buildings on university campus: A field survey in Korea. Energy Build. 2014, 78, 176–182. [Google Scholar] [CrossRef]
- Samira, A.; Nurmammad, M. Multi-disciplinary Energy Auditing of Educational Buildings in Azerbaijan: Case Study at a University Campus. IFAC-PapersOnLine 2018, 51, 311–315. [Google Scholar] [CrossRef]
- Jradi, M.; Sangogboye, F.C.; Mattera, C.G.; Kjærgaard, M.B.; Veje, C.; Jørgensen, B.N. A World Class Energy Efficient University Building by Danish 2020 Standards. Energy Procedia 2017, 132, 21–26. [Google Scholar] [CrossRef]
- Chihib, M.; Salmerón-Manzano, E.; Manzano-Agugliaro, F. Benchmarking Energy Use at University of Almeria (Spain). Sustainability 2020, 12, 1336. [Google Scholar] [CrossRef]
- Gaspar, K.; Gangolells, M.; Casals, M.; Pujadas, P.; Forcada, N.; Macarulla, M.; Tejedor, B. Assessing the impact of the COVID-19 lockdown on the energy consumption of university buildings. Energy Build. 2022, 257, 111783. [Google Scholar] [CrossRef] [PubMed]
- Bourdeau, M.; Guo, X.; Nefzaoui, E. Buildings energy consumption generation gap: A post-occupancy assessment in a case study of three higher education buildings. Energy Build. 2018, 159, 600–611. [Google Scholar] [CrossRef]
- Bonnet, J.-F.; Devel, C.; Faucher, P.; Roturier, J. Analysis of electricity and water end-uses in university campuses: Case-study of the University of Bordeaux in the framework of the Ecocampus European Collaboration. J. Clean. Prod. 2002, 10, 13–24. [Google Scholar] [CrossRef]
- Mytafides, C.K.; Dimoudi, A.; Zoras, S. Transformation of a university building into a zero energy building in Mediterranean climate. Energy Build. 2017, 155, 98–114. [Google Scholar] [CrossRef]
- Stavropoulos, T.G.; Koutitas, G.; Vrakas, D.; Kontopoulos, E.; Vlahavas, I. A smart university platform for building energy monitoring and savings. J. Ambient Intell. Smart Environ. 2016, 8, 301–323. [Google Scholar] [CrossRef]
- Droutsa, K.G.; Kontoyiannidis, S.; Dascalaki, E.; Balaras, C. Benchmarking Energy Use of Existing Hellenic Non-residential Buildings. Procedia Environ. Sci. 2017, 38, 713–720. [Google Scholar] [CrossRef]
- Emil, F.; Diab, A. Energy rationalization for an educational building in Egypt: Towards a zero energy building. J. Build. Eng. 2021, 44, 103247. [Google Scholar] [CrossRef]
- Hamida, M.B.; Ahmed, W.; Asif, M.; Almaziad, F. Techno-Economic Assessment of Energy Retrofitting Educational Buildings: A Case Study in Saudi Arabia. Sustainability 2021, 13, 179. [Google Scholar] [CrossRef]
- Sait, H.H. Auditing and analysis of energy consumption of an educational building in hot and humid area. Energy Convers. Manag. 2013, 66, 143–152. [Google Scholar] [CrossRef]
- Saeed, S.A.R. Thermal comfort requirements in hot dry regions with special reference to Riyadh, Part 1: For university students. Int. J. Ambient Energy 1993, 14, 147–154. [Google Scholar] [CrossRef]
- Degree Days Calculated Accurately for Locations Worldwide. 2022. Available online: https://www.degreedays.net/ (accessed on 12 March 2022).
- Ma, Y.T.; Lu, M.Y.; Weng, J.T. Energy Consumption Status and Characteristics Analysis of University Campus Buildings. In Proceedings of the 5th International Conference on Civil Engineering and Transportation, Guangzhou, China, 28–29 November 2015. [Google Scholar]
- Abdo-Allah, A.; Iqbal, M.T.; Pope, K. Energy Consumption Analysis of a Large Building at Memorial University. J. Energy 2019, 2019, 5243737. [Google Scholar] [CrossRef]
- Gui, X.; Gou, Z.; Lu, Y. Reducing university energy use beyond energy retrofitting: The academic calendar impacts. Energy Build. 2021, 231, 110647. [Google Scholar] [CrossRef]
- Sun, Y.; Luo, X.; Liu, X. Optimization of a university timetable considering building energy efficiency: An approach based on the building controls virtual test bed platform using a genetic algorithm. J. Build. Eng. 2021, 35, 102095. [Google Scholar] [CrossRef]
- Deng, Y.; Gou, Z.; Gui, X.; Cheng, B. Energy consumption characteristics and influential use behaviors in university dormitory buildings in China’s hot summer-cold winter climate region. J. Build. Eng. 2021, 33, 101870. [Google Scholar] [CrossRef]
- Ali, S.B.M.; Hasanuzzaman, M.; Rahim, N.; Mamun, M.; Obaidellah, U. Analysis of energy consumption and potential energy savings of an institutional building in Malaysia. Alex. Eng. J. 2021, 60, 805–820. [Google Scholar]
- Amber, K.P.; Aslam, M.W.; Mahmood, A.; Kousar, A.; Younis, M.Y.; Akbar, B.; Chaudhary, G.Q.; Hussain, S.K. Energy consumption forecasting for university sector buildings. Energies 2017, 10, 1579. [Google Scholar] [CrossRef]
- Ghenai, C.; Bettayeb, M. Modelling and performance analysis of a stand-alone hybrid solar PV/Fuel Cell/Diesel Generator power system for university building. Energy 2019, 171, 180–189. [Google Scholar] [CrossRef]
- Residential SBC 602; Saudi Building Energy Conservation Code. Saudi Building Code National Committee: Riyadh, Saudi Arabia, 2018; p. 64. Available online: https://www.sbc.gov.sa/En/BuildingCode/Pages/SBC_602E.aspx (accessed on 20 January 2022).
- Almasri, R.A.; Akram, R.; Almarshoud, A.; Omar, H.M.; Alshitawi, M.S.; Esmaeil, K.K. Evaluation of the total exergy and energy consumptions in residential sector in Qassim Region, Saudi Arabia. Alex. Eng. J. 2022, 62, 455–473. [Google Scholar] [CrossRef]
- Google Maps. 2023. Available online: https://www.google.com/maps/place/26%C2%B008’34.5%22N+43%C2%B043’53.3%22E/@26.1418056,43.7309094,463m/data=!3m1!1e3!4m5!3m4!1s0x0:0xeabea1ea0a9d809c!8m2!3d26.1429129!4d43.73146?hl=en-SA (accessed on 20 January 2022).
- Alardhi, A.; Alaboodi, A.S.; Almasri, R. Impact of the new Saudi energy conservation code on Saudi Arabia residential buildings. Aust. J. Mech. Eng. 2022, 20, 1392–1406. [Google Scholar] [CrossRef]
- Esmaeil, K.K.; Alshitawi, M.S.; Almasri, R.A. Analysis of energy consumption pattern in Saudi Arabia’s residential buildings with specific reference to Qassim region. Energy Effic. 2019, 12, 2123–2145. [Google Scholar] [CrossRef]
- Kharseh, M.; Al-Khawaja, M.; Hassani, F. Comparison between different measures to reduce cooling requirements of residential building in cooling-dominated environment. Energy Build. 2015, 88, 409–412. [Google Scholar] [CrossRef]
- Al-Mumin, A.; Khattab, O.; Sridhar, G. Occupants’ behavior and activity patterns influencing the energy consumption in the Kuwaiti residences. Energy Build. 2003, 35, 549–559. [Google Scholar] [CrossRef]
- Almasri, R.A.; Almarshoud, A.F.; Omar, H.M.; Esmaeil, K.K.; Alshitawi, M. Exergy and Economic Analysis of Energy Consumption in the Residential Sector of the Qassim Region in the Kingdom of Saudi Arabia. Sustainability 2020, 12, 2606. [Google Scholar] [CrossRef]
- Tazay, A. Techno-Economic Feasibility Analysis of a Hybrid Renewable Energy Supply Options for University Buildings in Saudi Arabia. Open Eng. 2021, 11, 39–55. [Google Scholar] [CrossRef]
- Leal Filho, W.; Salvia, A.L.; Paço, A.D.; Anholon, R.; Quelhas, O.L.G.; Rampasso, I.S.; Ng, A.; Balogun, A.-L.; Kondev, B.; Brandli, L.L. A comparative study of approaches towards energy efficiency and renewable energy use at higher education institutions. J. Clean. Prod. 2019, 237, 117728. [Google Scholar] [CrossRef]
- Indoor Air Quality and Thermal Comfort in Open-Plan Offices. October 2005. Available online: https://nrc-publications.canada.ca/eng/view/ft/?id=1fd04d81-dad1-4859-aa7a-9cc66a2f8150 (accessed on 16 April 2021).
- Baseer, M.A.; Alqahtani, A.; Rehman, S. Techno-economic design and evaluation of hybrid energy systems for residential communities: Case study of Jubail industrial city. J. Clean. Prod. 2019, 237, 117806. [Google Scholar] [CrossRef]
- Engineering ToolBox. Illuminance—Recommended Light Level. 2004. Available online: https://www.engineeringtoolbox.com/light-level-rooms-d_708.html (accessed on 14 January 2021).
- Chalfoun, N. Greening University Campus Buildings to Reduce Consumption and Emission while Fostering Hands-on Inquiry-based Education. Procedia Environ. Sci. 2014, 20, 288–297. [Google Scholar] [CrossRef]
- Guidelines for Thermal Insulation Systems and Materials According to the Requirements of the Saudi Building Code; Saudi Energy Efficiency Center: Riyadh, Saudi Arabia, 2021; p. 67.
- Khan, H.S.; Asif, M. Impact of Green Roof and Orientation on the Energy Performance of Buildings: A Case Study from Saudi Arabia. Sustainability 2017, 9, 640. [Google Scholar] [CrossRef]
- Khalid, N. Efficient energy management: Is variable frequency drives the solution. Procedia—Soc. Behav. Sci. 2014, 145, 371–376. [Google Scholar] [CrossRef]
- Zhe, J.W.S. Optimization Strategy & Energy Savings of Water-Cooled Chiller Plant System. Bachelor Thesis, Universiti Teknologi PETRONAS, Seri Iskandar, Malaysia, 2015; p. 36. Available online: https://utpedia.utp.edu.my/15699/1/Dissertation%20-%20Optimization%20Strategy%20and%20Energy%20Savings%20of%20Water-cooled%20chiller%20plant%20system.pdf (accessed on 16 March 2022).
- Guide to Best Practice Maintenance & Operation of HVAC Systems for Energy Efficiency. 2012. Available online: https://www.airah.org.au/Content_Files/UsefulDocuments/DCCEE_HVAC_HESS_GuideToBestPractice2012.PDF (accessed on 1 January 2021).
- Chiller Plant Energy Use Spectrum. 2021. Available online: https://optimumenergyco.com/how-to-optimize-an-hvac-system/ (accessed on 5 January 2021).
- Alshehri, F.; Beck, S.; Ingham, D.; Ma, L.; Pourkashanian, M. Technico-economic modelling of ground and air source heat pumps in a hot and dry climate. Proc. Inst. Mech. Eng. Part A J. Power Energy 2020, 235, 1225–1239. [Google Scholar] [CrossRef]
- Almasri, R.A.; Abu-Hamdeh, N.H.; Alajlan, A.; Alresheedi, Y. Utilizing a Domestic Water Tank to Make the Air Conditioning System in Residential Buildings More Sustainable in Hot Regions. Sustainability 2022, 14, 15456. [Google Scholar] [CrossRef]
- Woolley, J.; Harrington, C.; Modera, M. Swimming pools as heat sinks for air conditioners: Model design and experimental validation for natural thermal behavior of the pool. Build. Environ. 2011, 46, 187–195. [Google Scholar] [CrossRef]
- Harrington, C.; Modera, M. Swimming pools as heat sinks for air conditioners: California feasibility analysis. Energy Build. 2013, 59, 252–264. [Google Scholar] [CrossRef]
- Kuo, C.-P.; Liao, H.-J. Challenge of Using Groundwater for Buildings Air Conditioning in Subtropical Areas. Sustainability 2022, 14, 364. [Google Scholar] [CrossRef]
- Other Ways to Improve Lighting Efficiency. Available online: https://smarterhouse.org/lighting/other-ways-improve-lighting-efficiency (accessed on 20 December 2022).
Disclaimer/Publisher’s Note: The statements, opinions and data contained in all publications are solely those of the individual author(s) and contributor(s) and not of MDPI and/or the editor(s). MDPI and/or the editor(s) disclaim responsibility for any injury to people or property resulting from any ideas, methods, instructions or products referred to in the content. |
© 2023 by the authors. Licensee MDPI, Basel, Switzerland. This article is an open access article distributed under the terms and conditions of the Creative Commons Attribution (CC BY) license (https://creativecommons.org/licenses/by/4.0/).