Article

Feasibility and Mechanism of Deep Heavy Oil Recovery by CO2-Energized Fracturing Following N2 Stimulation

1
School of Energy Resources, China University of Geosciences, Beijing 100083, China
2
Research Institute of Petroleum Exploration and Development, PetroChina, Beijing 100083, China
3
Fengcheng Oil Plant, Xinjiang Oilfield Company, PetroChina, Keramay 834000, China
*
Author to whom correspondence should be addressed.
Energies 2023, 16(3), 1161; https://doi.org/10.3390/en16031161
Submission received: 13 December 2022 / Revised: 14 January 2023 / Accepted: 17 January 2023 / Published: 20 January 2023
(This article belongs to the Section H1: Petroleum Engineering)

Abstract

:
There are large, heavy oil reserves in Block X of the Xinjiang oilfields, China. Due to its large burial depth (1300 m) and low permeability (26.0 mD), the traditional steam-injection technology cannot be used to obtain effective development benefits. This paper conducts experimental and simulation research on the feasibility and mechanism of CO 2 -energized fracturing of horizontal wells and N 2 foam huff-n-puff in deep heavy oil reservoirs with low permeability in order to further explore the appropriate production technology. The foaming volume of the foaming agent at different concentrations and the oil displacement effect of N 2 foam at different gas/liquid ratios were compared by the experiments. The results show that a high concentration of foaming agent mixed with crude oil is more conducive to increasing the foaming volume and extending the half-life, and the best foaming agent concentration is 3.0∼4.0%. The 2D micro-scale visualization experiment results show that N 2 foam has a good selective blocking effect, which increases the sweep area. The number of bubbles per unit area increases as the gas/liquid ratio increases, with 3.0∼5.0 being the optimal gas/liquid ratio. Numerical simulation results show that, when CO 2 -energized fracturing technology takes into account the advantages of fracturing and crude oil viscosity reduction by CO 2 dissolution, the phased oil recovery factor in the primary production period can reach approximately 13.7%. A solvent pre-slug with N 2 foam huff-n-puff technology is applied to improve oil recovery factor following primary production for 5∼6 years, and the final oil recovery factor can reach approximately 35.0%. The methodology formulated in this study is particularly significant for the effective development of this oil reservoir with deeply buried depth and low permeability, and would also guide the recovery of similar oil deposits.

1. Introduction

It is commonly believed that reservoirs with low porosity and low permeability can achieve effective economic development only after a certain “volume transformation” is performed through large-scale fracturing. Fracturing is a technology that artificially causes cracks in the formation, improves the flow environment of oil underground, and increases the production of oil wells. Currently, fracturing technology is mainly used in thin oil reservoirs with low porosity and low permeability. Research on the fracturing of heavy oil reservoirs is still in its initial stages.
The application of slick water fracturing technology in low permeability reservoirs has been relatively mature around the world. But slick water, on the other hand, may cause some damage to the formation development of high water sensitivity [1,2]. In recent years, many scholars have proposed supercritical CO 2 fracturing [1,2,3,4,5,6], CO 2 foam fracturing [7,8], CO 2 dry fracturing [9] and CO 2 composite fracturing technologies [10,11,12,13]. CO 2 can reduce fracture initiation pressure and increase fracture complexity under conditions of formation [10,11,12,14,15,16,17] and CO 2 displacement can improve oil recovery [18]. However, there are also a series of disadvantages: high friction in CO 2 fracturing, poor sand carrying capacity, rapid filtration fluid loss, small fracture spacing, and a large number of branch fractures that gradually close due to a lack of proppant, limiting the effectiveness fracturing performance [19,20]. In recent years, some scholars have proposed to add thickeners to liquid CO 2 to increase its viscosity, thereby enhancing its sand-carrying capacity [21,22]. However, the extensive use of thickeners can lead to groundwater pollution, chemical residue and reservoir damage.
Ribeiro et al. [10] proposed a CO 2 hybrid fracturing technology, which injected pure CO 2 fracturing fluid to form multiple hydraulic fractures in the near-wellbore area, and then injected a high-viscosity and water-based fracturing fluid carrying proppant to support the fractures in 2017. This technique increased flow-back rates and reduced formation damage by taking advantage of the low or ultra-low viscosity and high compressibility of CO 2 to create complex fractures. Then, it injected a high viscosity water-based fracturing fluid to increase the proppant content. Since then, CO 2 hybrid fracturing technology has been increasingly used in unconventional reservoir development.
As the reservoir develops after fracturing, the formation energy decreases rapidly with time, which results in a quick production decline and low oil recovery for heavy oil reservoirs. For traditional heavy oil thermal recovery technologies, such as steam injection, hot water injection, SAGD (Steam Assisted Gravity Drainage), and in situ combustion, there are definite requirements on the depth of heavy-oil reservoirs and reservoir thickness due to heat loss and other problems [23,24,25,26]. When the depth of the reservoir is large and the thickness of the reservoir is thin, the traditional thermal recovery technology does not meet the needs of production. In the late stage of development, the oil field enters the ultra-high water cut stag and the water channeling is extremely serious. In the process of further improving the production efficiency, it is necessary to figure out how to hinder the channeling of injected water along the highly permeable zones while flooding oil. In 2014, Salehi et al. [27] compared water-alternating-gas flooding and foam flooding, and found that foam flooding could slow down the viscous fingering of the oil–water front. Foam fluid has been widely used in profile control and other aspects because of its superior characteristics for blocking water preferential channels.
The main mechanisms of foam flooding are blocking large channels, leaving small channels unblocked, increasing the mobility ratio, increasing sweep area, increasing foam resistance effect, stripping the oil film, etc. [28]. The high elasticity of the foam in the formation flow can significantly reduce the mobility of the driving fluid. Through the emulsification and viscosity reduction of surfactant, the interfacial tension between oil and water is greatly reduced while the sweep efficiency is improved, which ultimately increases the oil displacement efficiency [29,30,31,32].
At present, conventional foam flooding methods include air foam flooding [33], CO 2 foam flooding [34,35], natural gas foam flooding and N 2 foam flooding [36,37,38,39]. However, in full production of air foam flooding, the presence of O 2 in the air could cause a variety of risk factors, including pipeline bursts, leakage, and corrosion [40]. The mechanism of CO 2 foam flooding is similar to N 2 foam flooding. The difference is that after the CO 2 foam bursts, the gas phase can make multiple contacts with the crude oil, achieving miscibility under certain conditions, lowering crude oil viscosity, and extracting crude oil with high mobility. However, CO 2 has serious corrosion on pipeline instruments and there are few domestic carbon dioxide gas sources, so it is necessary to comprehensively consider the actual application of CO 2 foam flooding according to field conditions [41,42,43]. Because of the high solubility of natural gas in crude oil, the effect of natural gas foam flooding is better. However, natural gas tends to burn in oxygenated air, or even explode. Natural gas has special properties and requires higher equipment and safety levels, so natural gas foam flooding is less used in laboratory experiments and field applications. Due to the differences in solubility of formation fluids, the screening conditions of foam systems are different, and the influence mechanism of gas types on foam stability is different too. Relatively speaking, the stability of N 2 foam is good, while that of CO 2 foam is poor and hardly affected by the surfactant concentration. The stability of air foam is between the two due to the main reason that the diffusion coefficient of CO 2 and O 2 is higher than N 2 , which leads to a variation in liquid film strength and a faster bubble rupture speed. Compared with other gas phases, N 2 has the characteristics of being inflammable, non-explosive, easy to compress, rapidly expanding, and unable to react with formation rock minerals or fluids, so it is an ideal gas type for the foam gas phase.
In the profile control literature, there are many foam system screening and mechanism analysis experiments of foam flooding, but there are far fewer reported on foam formula and mechanism experiments for huff-n-puff wells [44,45]. Due to the injection cost and other problems in the oilfield, the previous studies on the foaming agent required that the foaming agent meets a concentration of 1.0∼0.5% [46,47]. However, it was found in the actual operation of the oilfield that the use of a high concentration of the foaming agent was more conducive to mobilizing the residual oil in the pore throat. Compared with foam flooding, foam huff-n-puff has the advantages of easy implementation, less consumption, quick effect, less investment, and lower economic risk, which make it suitable for blocks with poor connectivity between Wells or complex fault-block reservoirs with large well spacing.
In conclusion, the effect of high concentration foaming agent on the foaming properties and oil displacement of N 2 foam was investigated by physical model experiment. CO 2 -energized fracturing of horizontal wells and N 2 foam huff-n-puff are designed for large burial depth and low-permeability and high-viscosity heavy-oil reservoirs. The seepage resistance is reduced through horizontal well development, and the conditions for productivity improvement are created. CO 2 -energized fracturing is used to increase the permeability of the reservoir, and the oil viscosity reduction by CO 2 is used to improve the oil recovery rate. In order to increase the reservoir energy and improve the recovery factor, N 2 foam was injected into the reservoir at the late stage of primary production with a high concentration of the foaming agent. Through targeted optimizations combination and process parameter optimization, the methodology of heavy oil recovery technologies formed in this study will provide technical guidance for the effective development of similar deep heavy oil reservoirs.

2. Experiments

The foaming properties of AES (sodium ethoxylated alkyl sulfate) surfactants and the flow characteristics of N 2 foam in microscopic pores were studied by Waring–Blender and 2D micro-scale visualization experiments. An experimental study expanded on the mechanism of N 2 foam enhanced oil recovery under the action of a high concentration foaming agent.

2.1. Experimental Materials and Instruments

  • Formation oil: The formation oil used for the tests was obtained from actual field sampling of the No. X013 Well in Xinjiang oilfields, China. Its viscosity and density were 102.3 mPa·s and 0.883 g/cm 3 , respectively, at a temperature of 50.0 °C and a pressure of 0.1 MPa.
  • Foaming Agent: The foaming agent is AES. Different concentrations of AES solutions (0.5%, 1.0%, 2.0%, 3.0% and 4.0%) were prepared.
  • Air source: In this experiment, high purity nitrogen with an oxygen content less than 3 ppm was used as the gas source.
  • Brine: In the experiments, synthetic brine was prepared according to the composition of the formation water. The pH of the brine was 7.3, and the concentration of total dissolved solids (TDS) was 6596.1 mg/L.
  • Experimental instruments: beaker, measuring cylinder (1000 mL), magnetic mixer, Waring blender (speed 0–20,000 r/min), microscopic visualization model.

2.2. Experimental Procedure

2.2.1. Foaming Performance Experiments in Crude Oil

Procedures are as follows:
  • First, make a solution of AES foaming agent in concentrations of 0.5%, 1.0%, 2.0%, 3.0% and 4.0%.
  • Pour the foaming agent (50 mL) and the crude oil (50 mL) into a beaker and place the beaker over a magnetic stirrer to mix the foaming agent with the crude oil.
  • The mixed solution was poured into a Waring blender and stirred at a speed of 7000 r/min for one minute at a temperature of 25.0 ℃ and 0.1 MPa.
  • Immediately pour it into 1000 mL measuring cylinder, seal it with plastic wrap, and record the foam volume (V) when stirring is stopped and the time (t 1 / 2 ) it takes to separate 50 mL of liquid from the foam.
Foam volume V is used to represent foaming capacity, and t 1 / 2 is used to represent foam stability. The greater the V, the stronger the foaming capacity of the foaming agent. The greater the t 1 / 2 , the stronger of the foam stability.

2.2.2. 2D Microscopic Visualization Experiment

In order to accurately observe the flow displacement of N 2 foam in pores, a physical simulation device for fluid displacement visualization was constructed on the basis of simulating the pore throat characteristics of the formation of a microscopic visualization model. Using this device, one or more fluids needed for research are injected into the glass etching chip, and the image acquisition of different fluids passing through the visual model is realized through microscope observation, so as to study the flow characteristics of different fluids flowing through micro channels. The experimental setup is shown in Figure 1.
Experimental steps are as follows:
  • Model installation and debugging: Install the glass etching chip in the high pressure visible kettle; the confining pressure is controlled by the confining pressure tracking pump to make it higher than the internal pressure of the model (11 MPa). The confining pressure is set to 13 MPa. Put the connected glass etching chip under the microscope, open the installed microscope software on the computer, adjust the microscope’s aggregation position and magnification, and the high-speed camera can collect clear micro-scale channel images.
  • Model vacuumization: After the micro-pore etching model and experimental process pipeline are vacuumed for 2.0 h, the injection and outlet valves are closed to ensure that there is no air in the visual model of micro scale channels.
  • Model saturated oil: Adjust the backpressure unit to the simulated pressure of the formation, and the high-pressure injection pump saturates the oil at a speed no higher than 0.002 mL/min until the model and the pores are filled with oil. When the micro-pores are small, kerosene saturation is usually carried out first and then formation simulation oil saturation is carried out.
  • Simulate the process of N 2 foam flooding: N 2 foam displacement experiments were performed at 36.0 ℃ and 11 MPa. The foaming agent slug is injected at a rate of 0.002 mL/min, and the injection rate of N 2 is adjusted to simulate different injection gas/liquid ratios. During the process of displacement, we should pay attention to the timely acquisition of images, and observe the number, morphology and flow characteristics of bubbles under different gas/liquid ratios with a microscopic camera.

2.3. Results and Discussion

2.3.1. Foaming Performance Experiments in Crude Oil

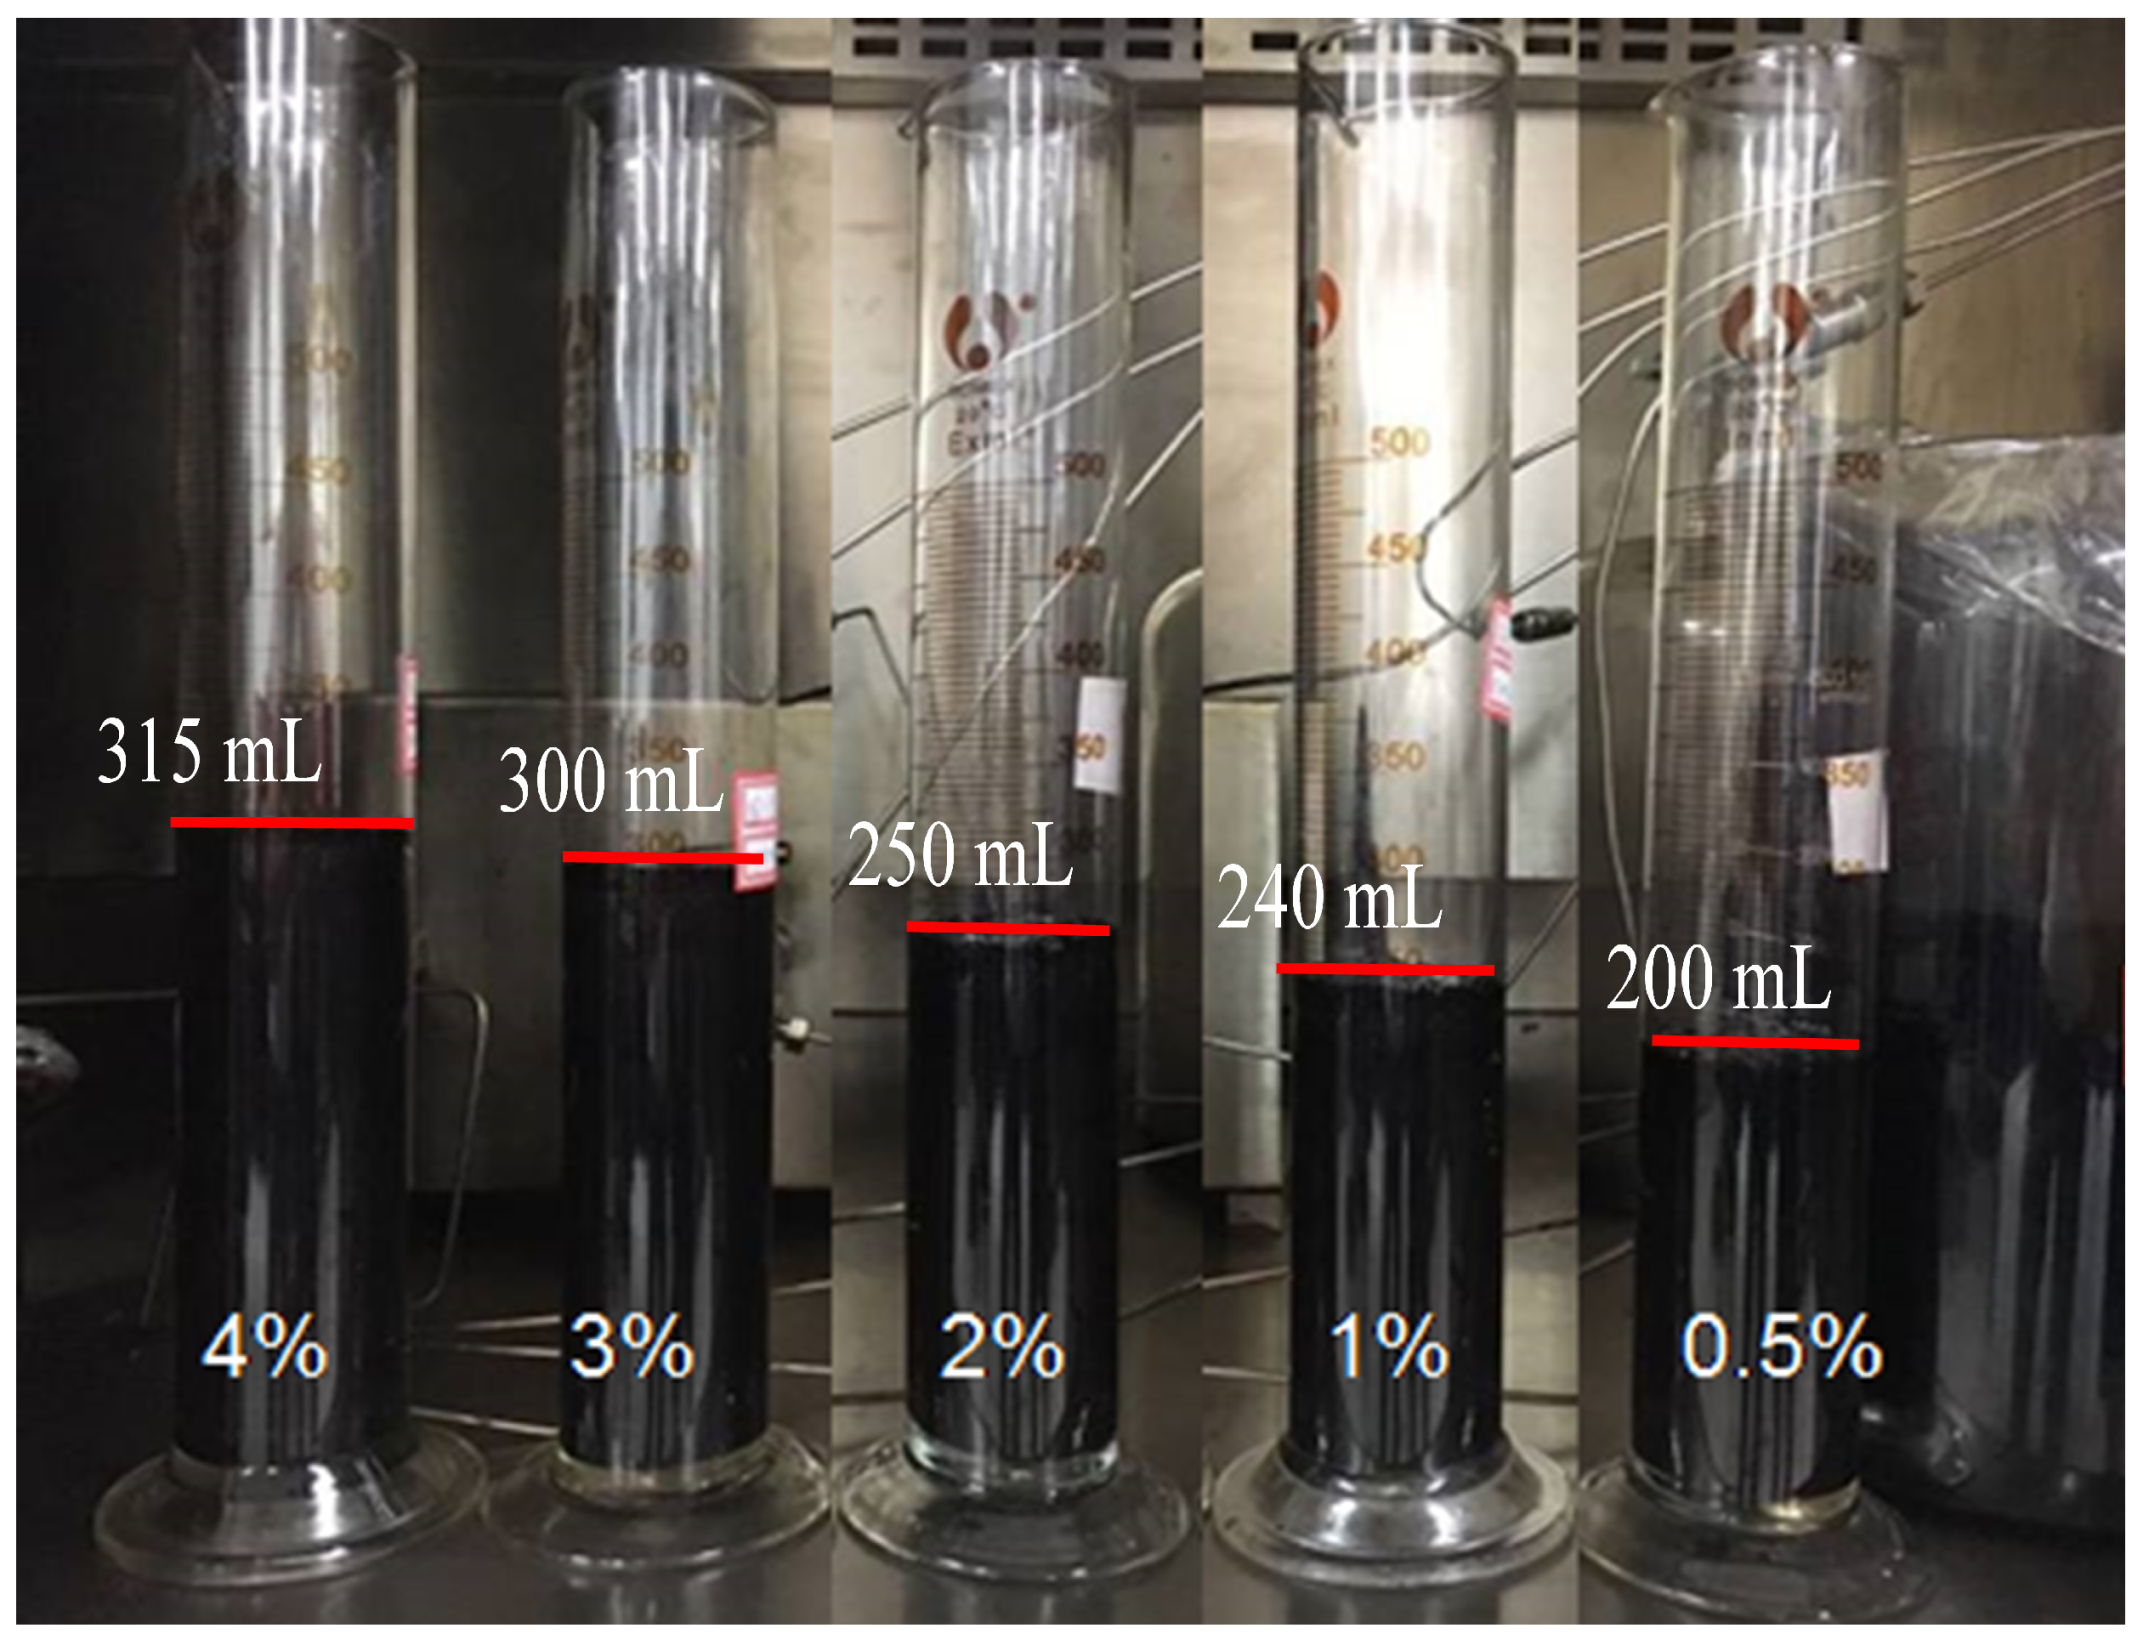
The main role of foam liquid is to make N 2 form foam with liquid, and stop N 2 from quickly de-gassing from crude oil. A small volume of crude oil is added to the foaming agent to test its oil resistance. This experimental method is inconsistent with the volume ratio of oil to foam agent under reservoir conditions. The static properties of the foaming agent were evaluated in this study by mixing the foaming agent with crude oil at concentrations of 0.5%, 1.0%, 2.0%, 3.0%, and 4.0%, using a Waring blender. As can be seen from Figure 2, when the foaming agent concentration exceeds 1.0%, the foam volume growth is still obvious, but the growth rate gradually slows down.
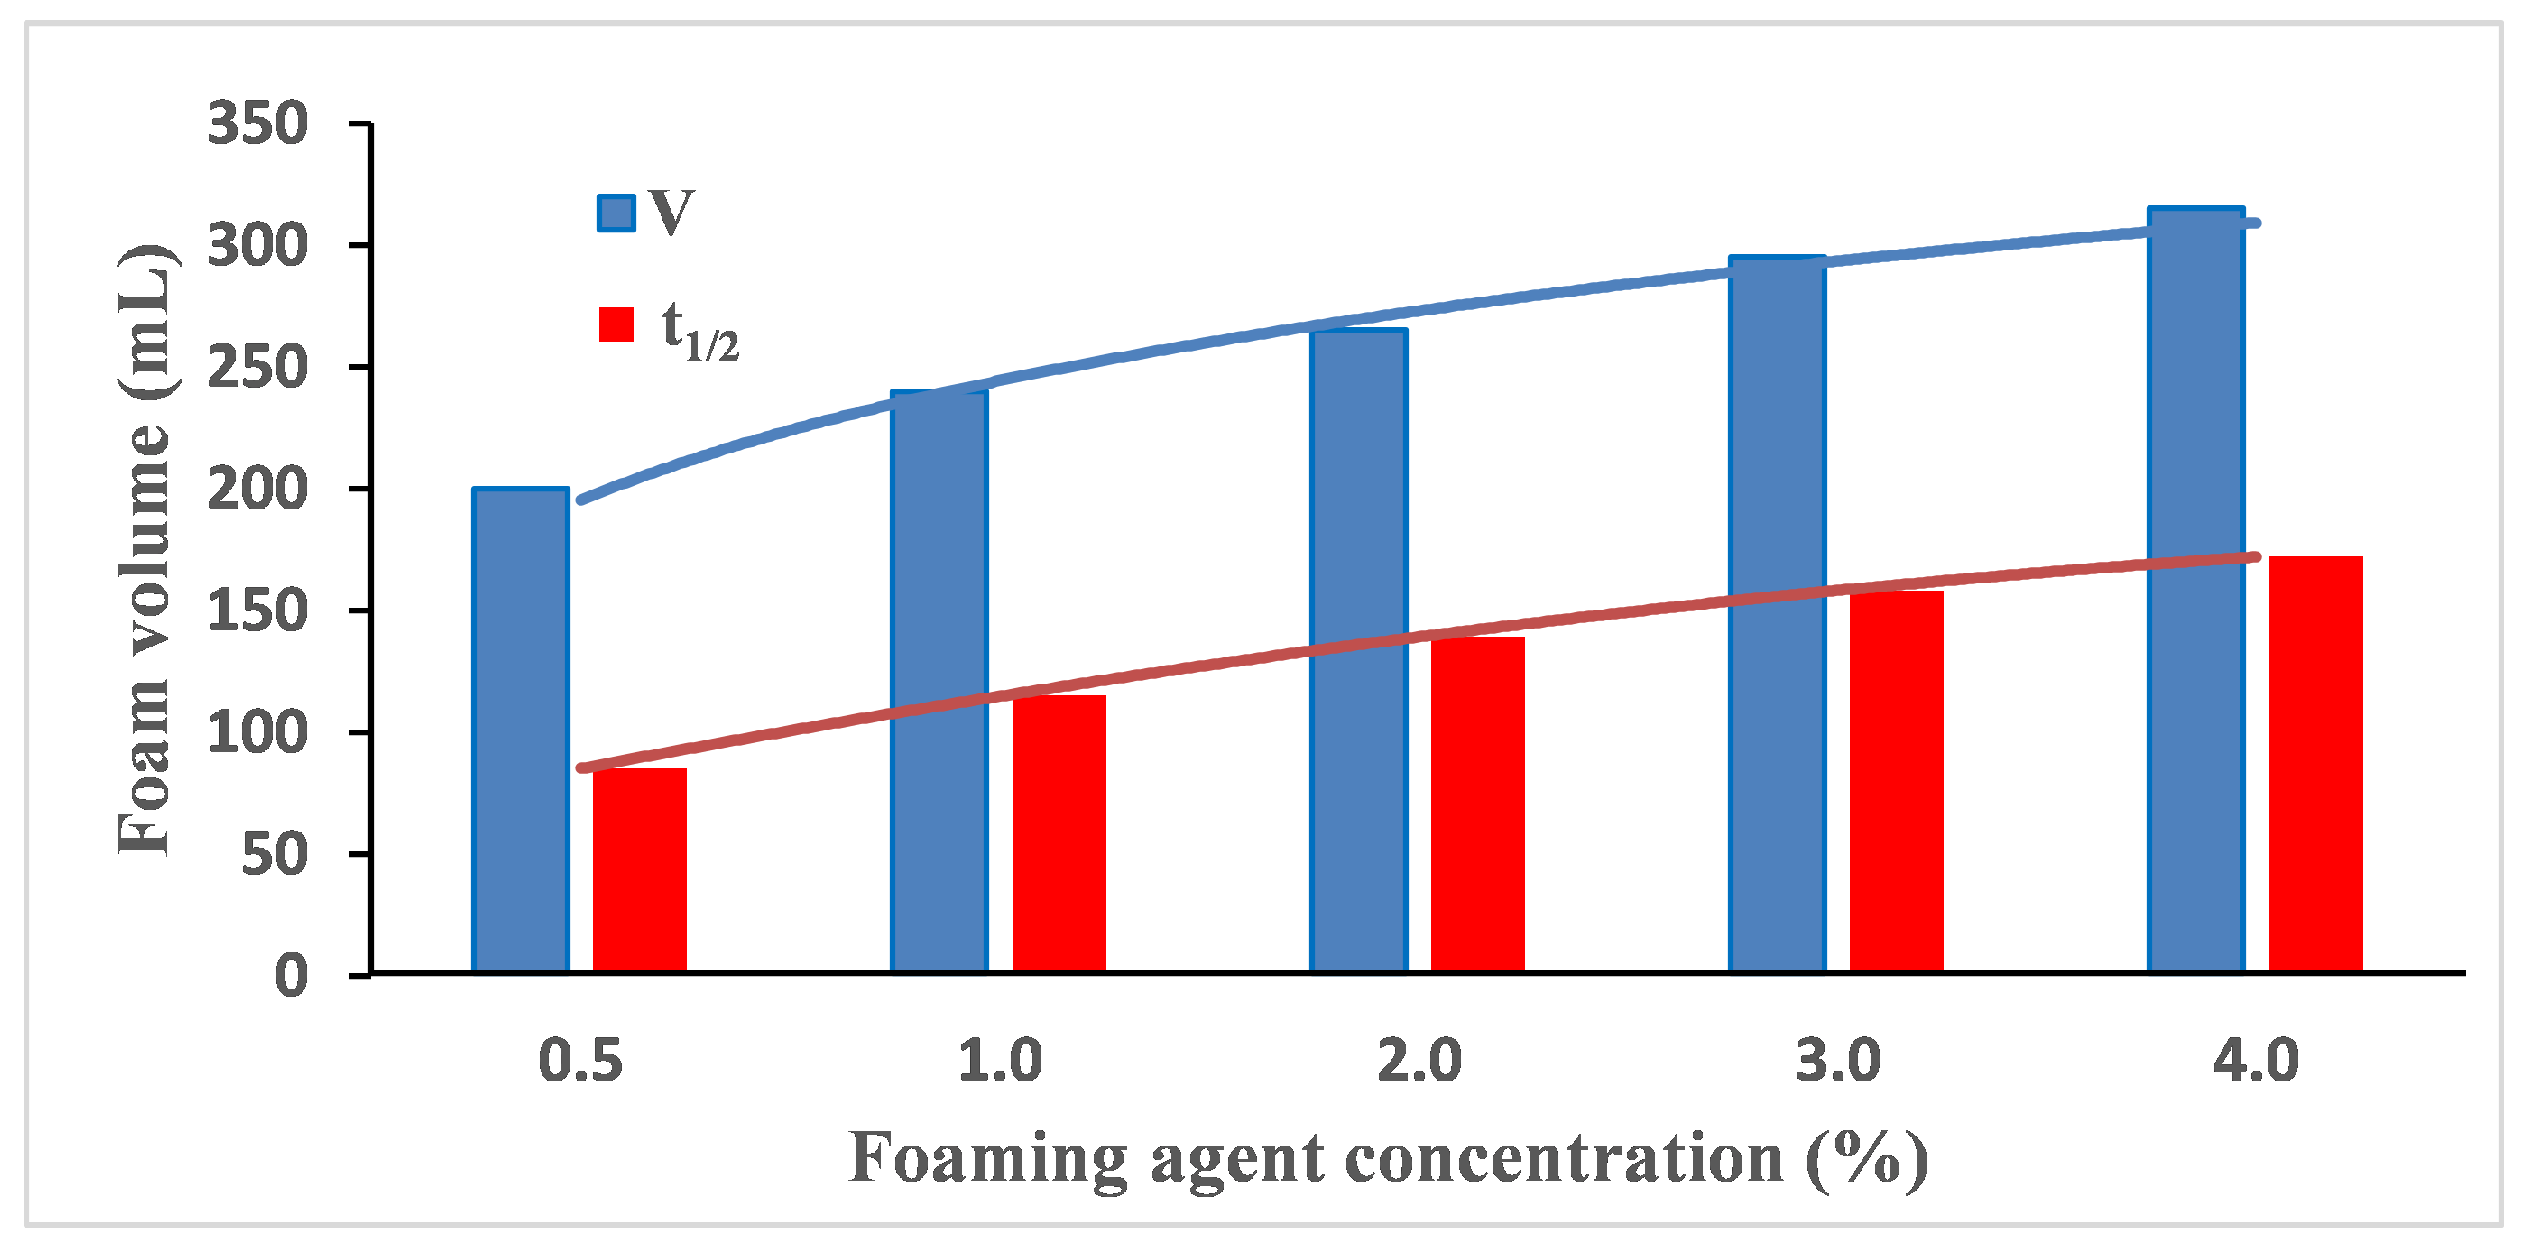
In order to make the experimental results more intuitive, the foaming volume and half-life at different foaming agent concentrations were plotted (Figure 3).
As can be seen, with the increase in the foaming agent concentration, the foaming volume and half-life gradually increase, but the growth rate gradually slows down. The optimal foaming agent concentration should be between 3.0∼4.0%.

2.3.2. 2D Microscopic Visualization Experiment

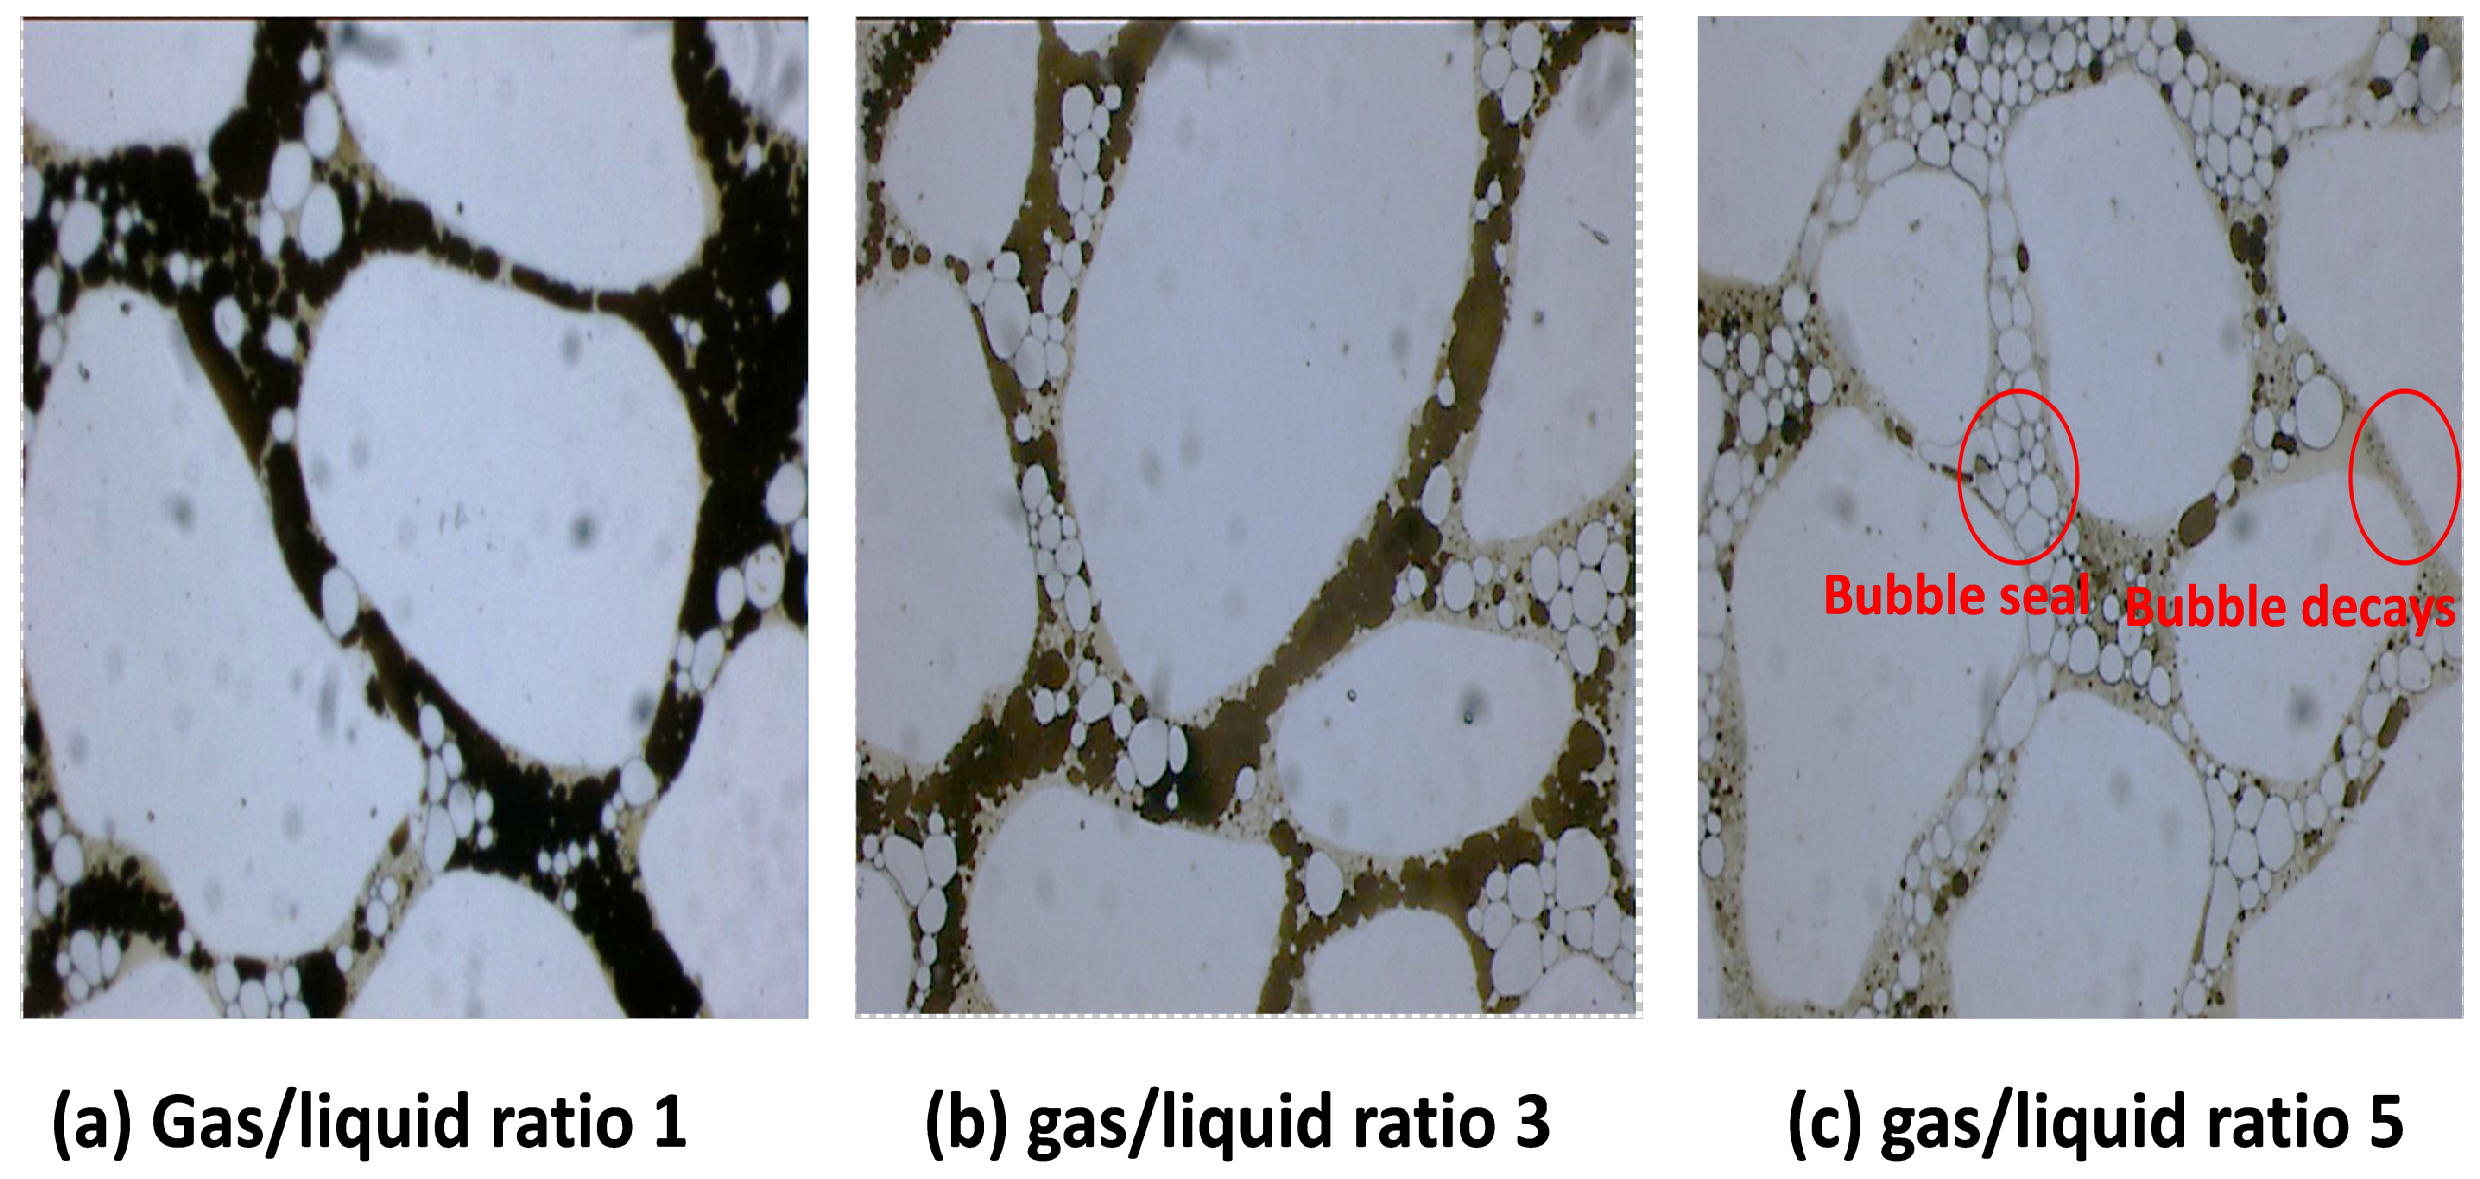
Figure 4 shows foam flow characteristics in porous media with different gas/liquid ratios.
Through a 2D microscopic visualization experiment, it can be seen that with the increase in gas/liquid ratio, the number of bubbles per unit area gradually increases, but the bubbles still exist in the form of tiny bubbles, and there is no obvious coalescence phenomenon. According to Figure 4c, bubbles accumulate in the larger pores and are overstocked and deformed by the pores, resulting in a blocking effect on the larger pores and forcing the subsequent foam to enter the small pores that were not affected earlier. Bubbles constantly contact and rupture with crude oil in small pore channels, and dissolve and reduce the viscosity of residual oil in pores under the emulsification of surfactant, so as to reduce the oil–water interface tension and improve the flow performance of residual oil. The experimental results show, that under the premise of a certain period of gas injection, if the gas/liquid ratio is small, the foaming liquid dosage is large and the cost is high. If the gas/liquid ratio is large, it is difficult to bind enough gas to form foam, and part of the gas comes out as free gas, which makes it difficult to play the role of foamy oil. The optimal gas/liquid ratio should be between 3∼5.

3. Numerical Simulation

3.1. Model

The depth of the Block X area is about 815 m∼1825 m, and the oil viscosity is 41.4 mPa·s∼2453.0 mPa·s at 50.0 ° C. Table 1 lists the X013 well original reservoir parameters.
From Table 1, the average porosity, permeability and saturation are 21.1%, 26.0 mD and 56.9%, respectively. The X013 well is in a low viscous oil reservoir with medium porosity, low permeability, and poor connectivity. The test production results show that there are four oil wells in the X013 Well, and the oil production of a single well is 1.2 t/d to 10.5 t/d, and the oil recovery rate is low.
In this study, the STARS module in CMG is used to establish a typical conceptual geological model. The number of grids in the X, Y and Z directions of the model is 88 × 23 × 13, respectively. The maximum grid size in the X direction is 2.0 m, and the minimum grid size is 0.1 m. Reservoir parameters are set according to the X013 well.

3.2. Compare of Different Fracturing Techniques

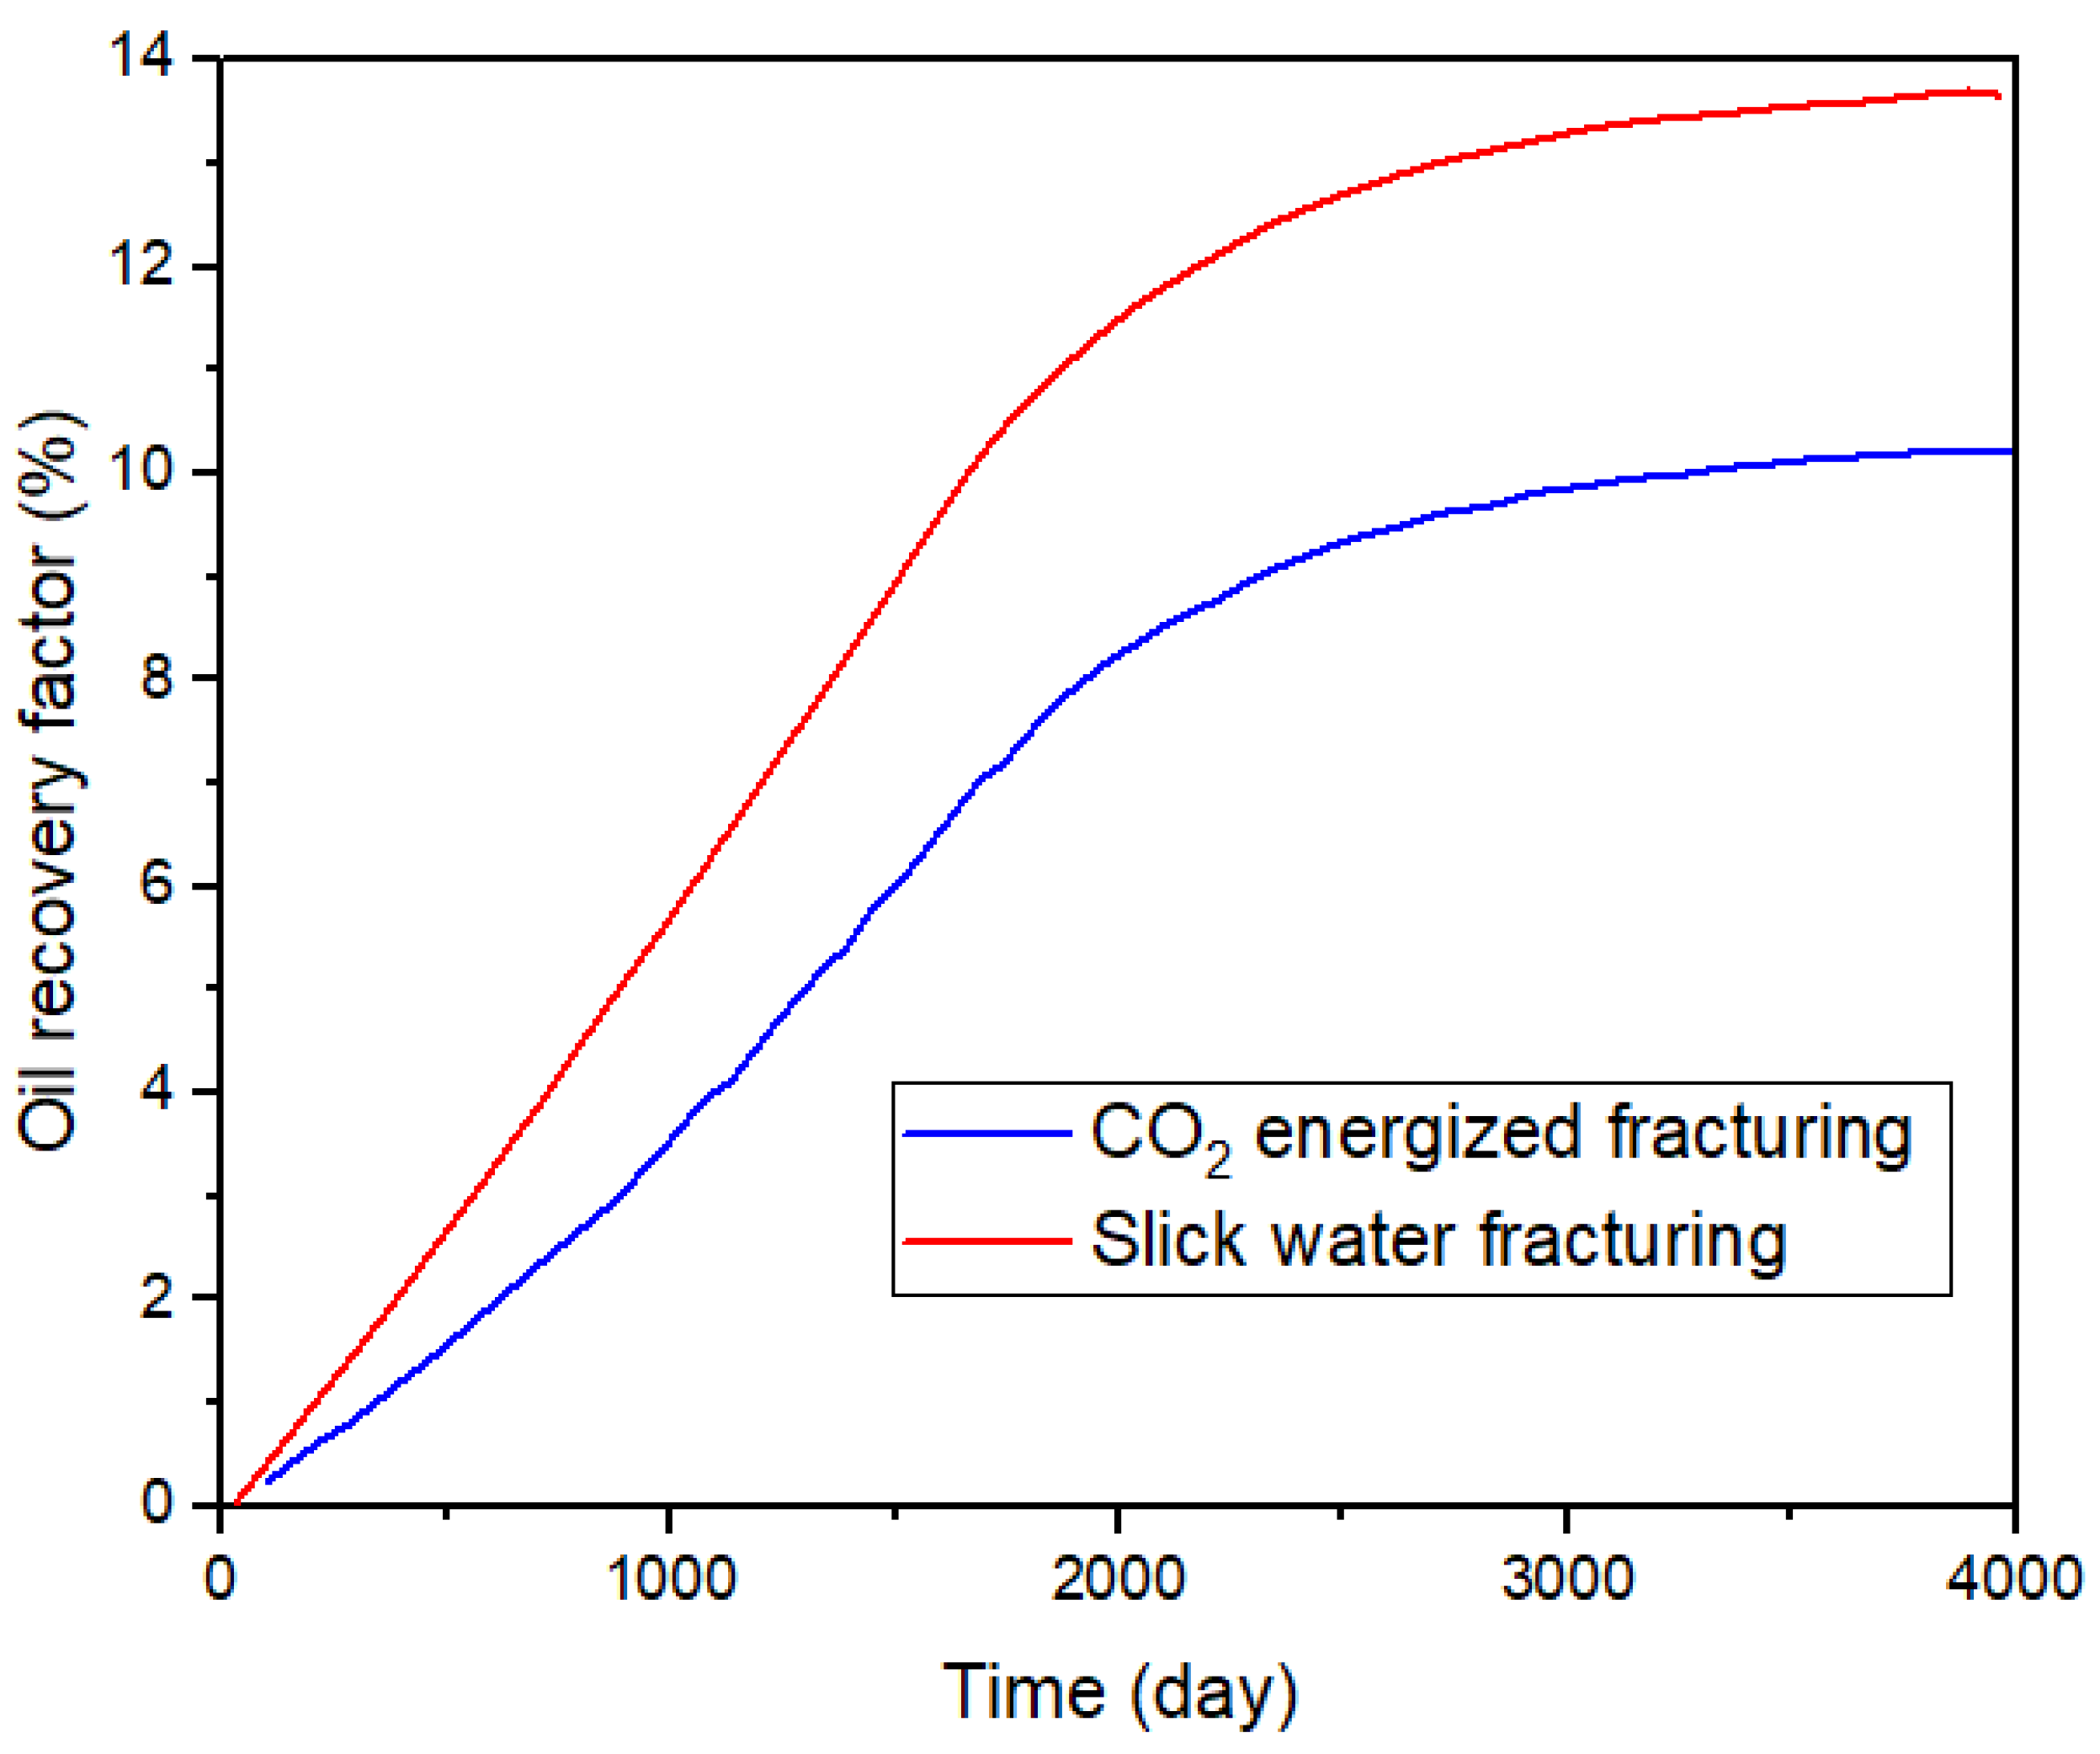
The effects of CO 2 -energied fracturing and slick water fracturing on the recovery factor of the reservoir were studied to explore the effect of different fracturing technologies on the development of deep heavy oil reservoirs. Slick water fracturing is simulated by injecting slick water and displacement fluid in sequence. CO 2 -energied fracturing is simulated by injecting liquid CO 2 and displacement fluid in sequence. Figure 5 shows the comparison of oil recoveries under different fracturing techniques.
CO 2 -energied fracturing injects 1400 m 3 of liquid CO 2 into the reservoir, which can effectively reduce the viscosity of crude oil in the reservoir. As can be seen from Figure 5, CO 2 -energied fracturing can improve the degree of reservoir production, and the oil recoveries after CO 2 -energied fracturing can reach 13.7%, which is 3.7% higher than that of slick water fracturing.

3.3. Parameter Optimization in the Primary Production Stage

3.3.1. Optimization of Fracture Network Parameters

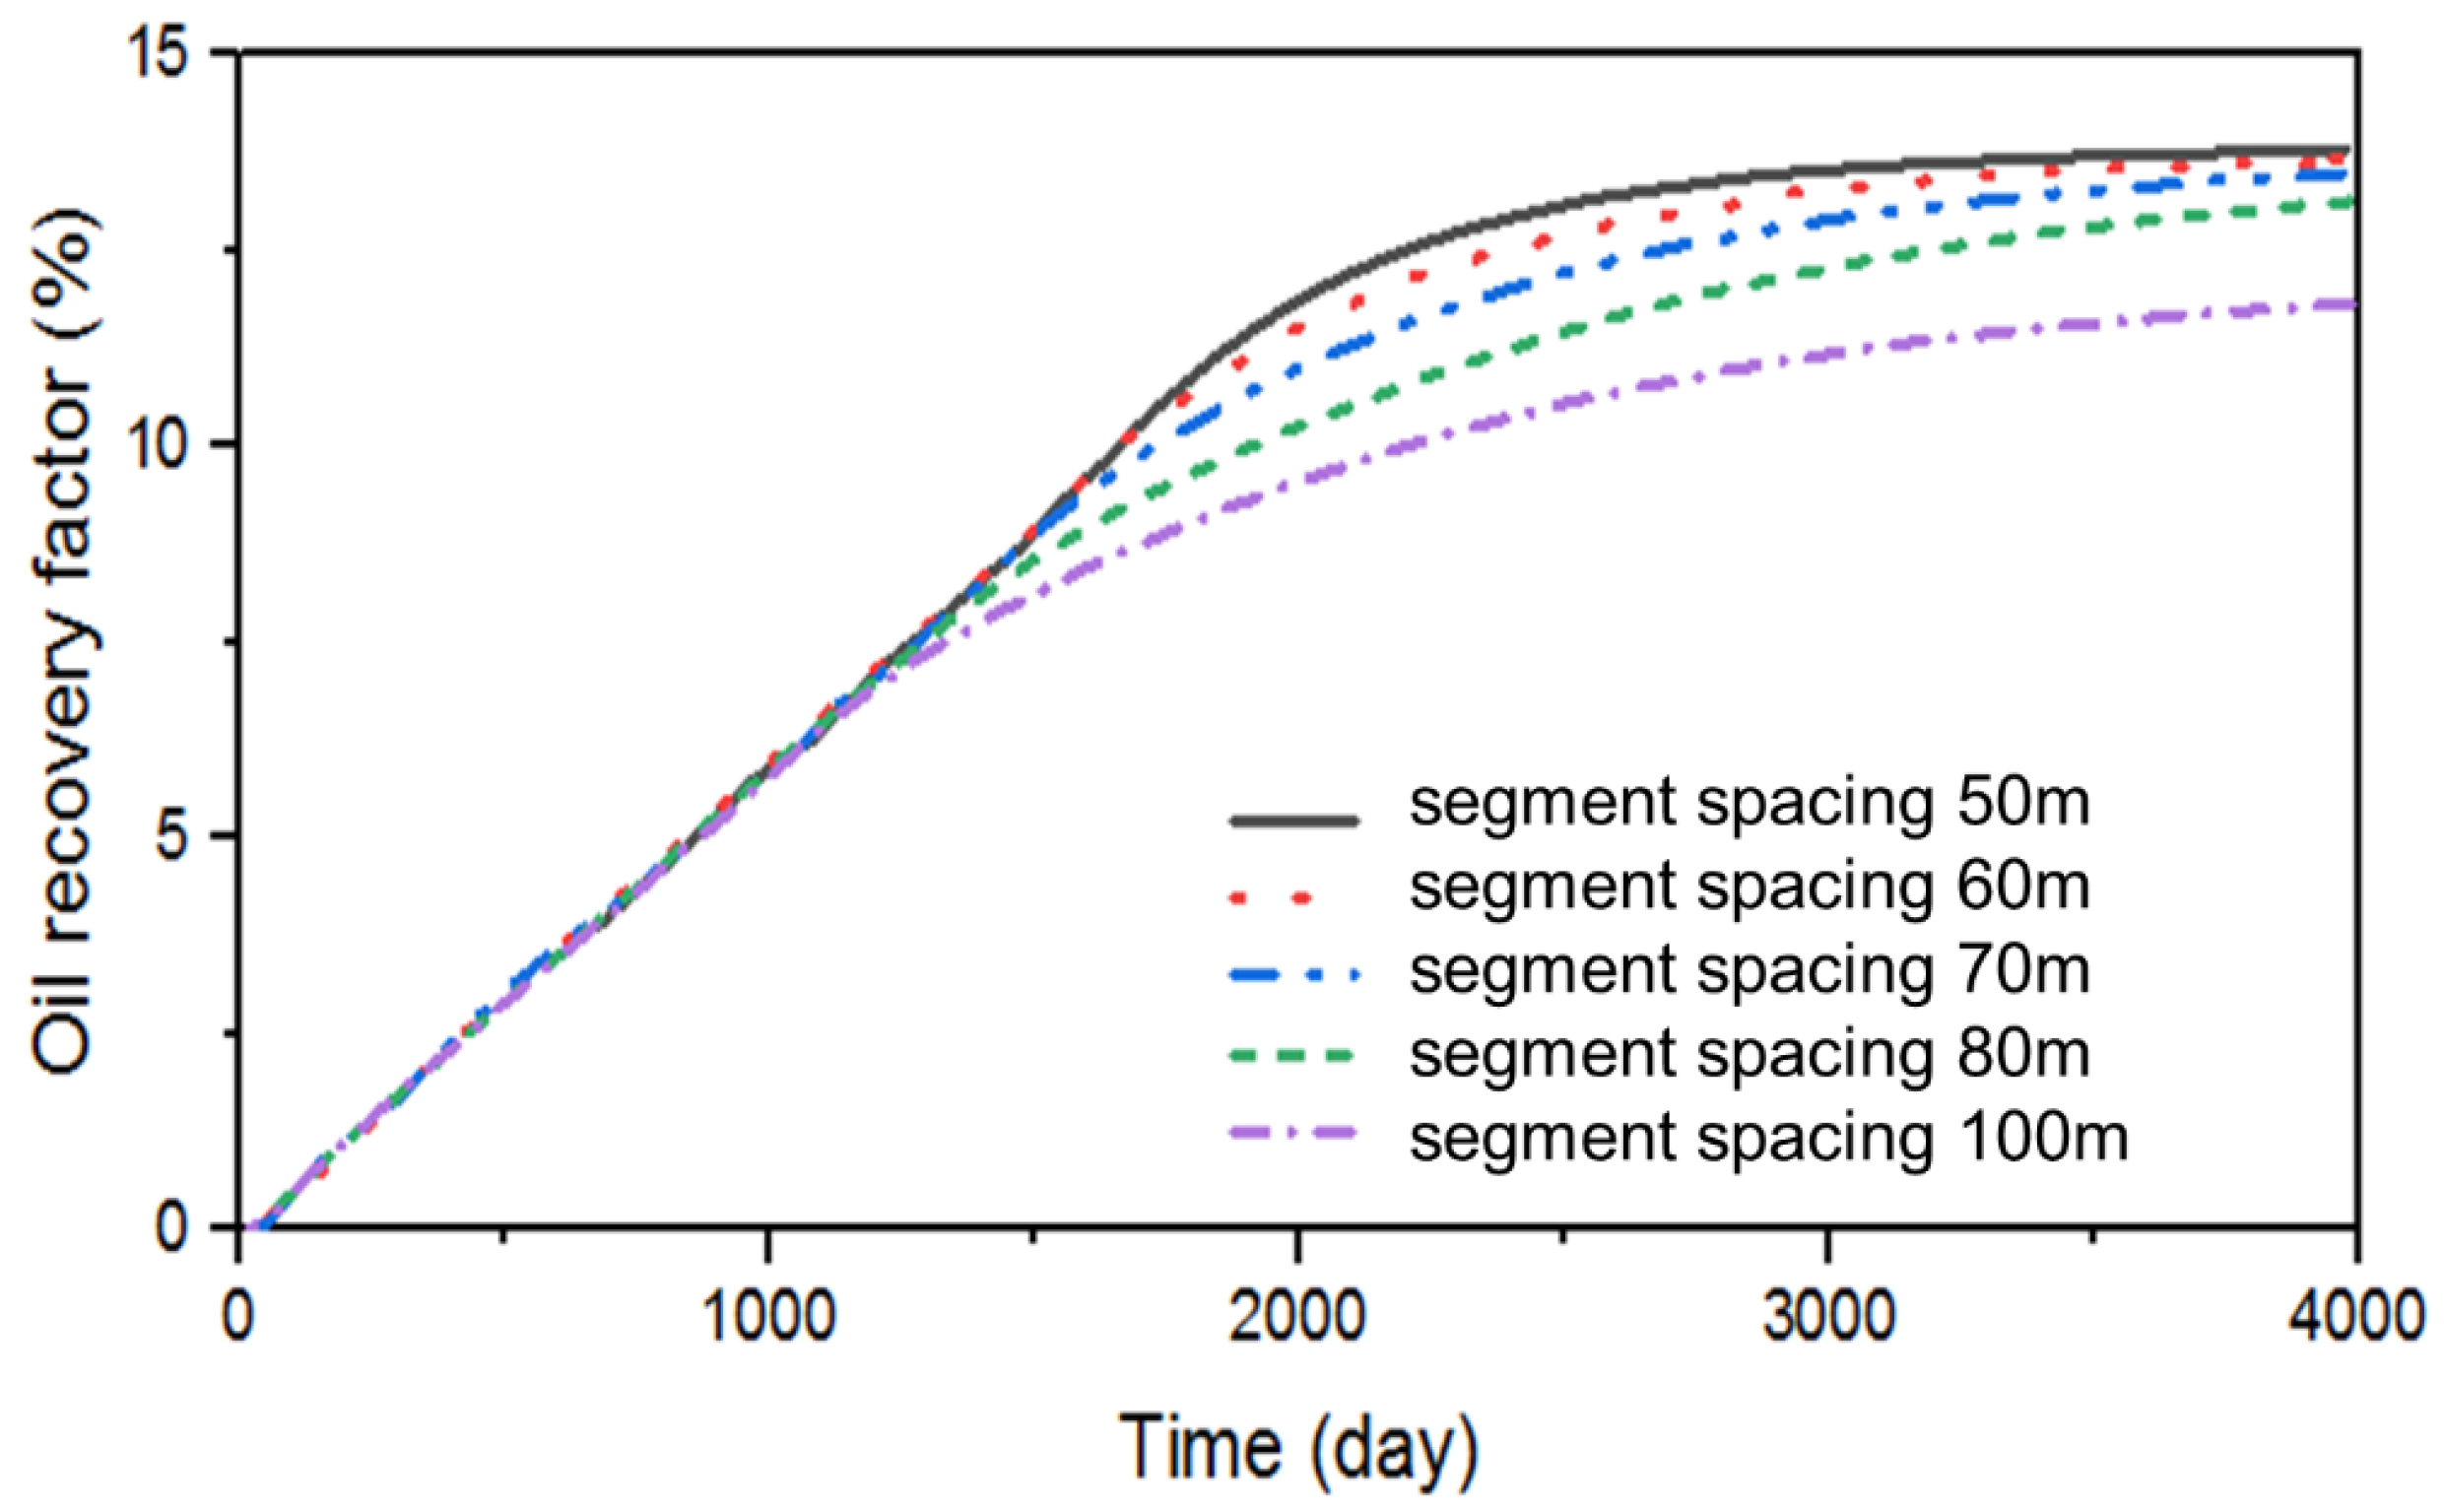
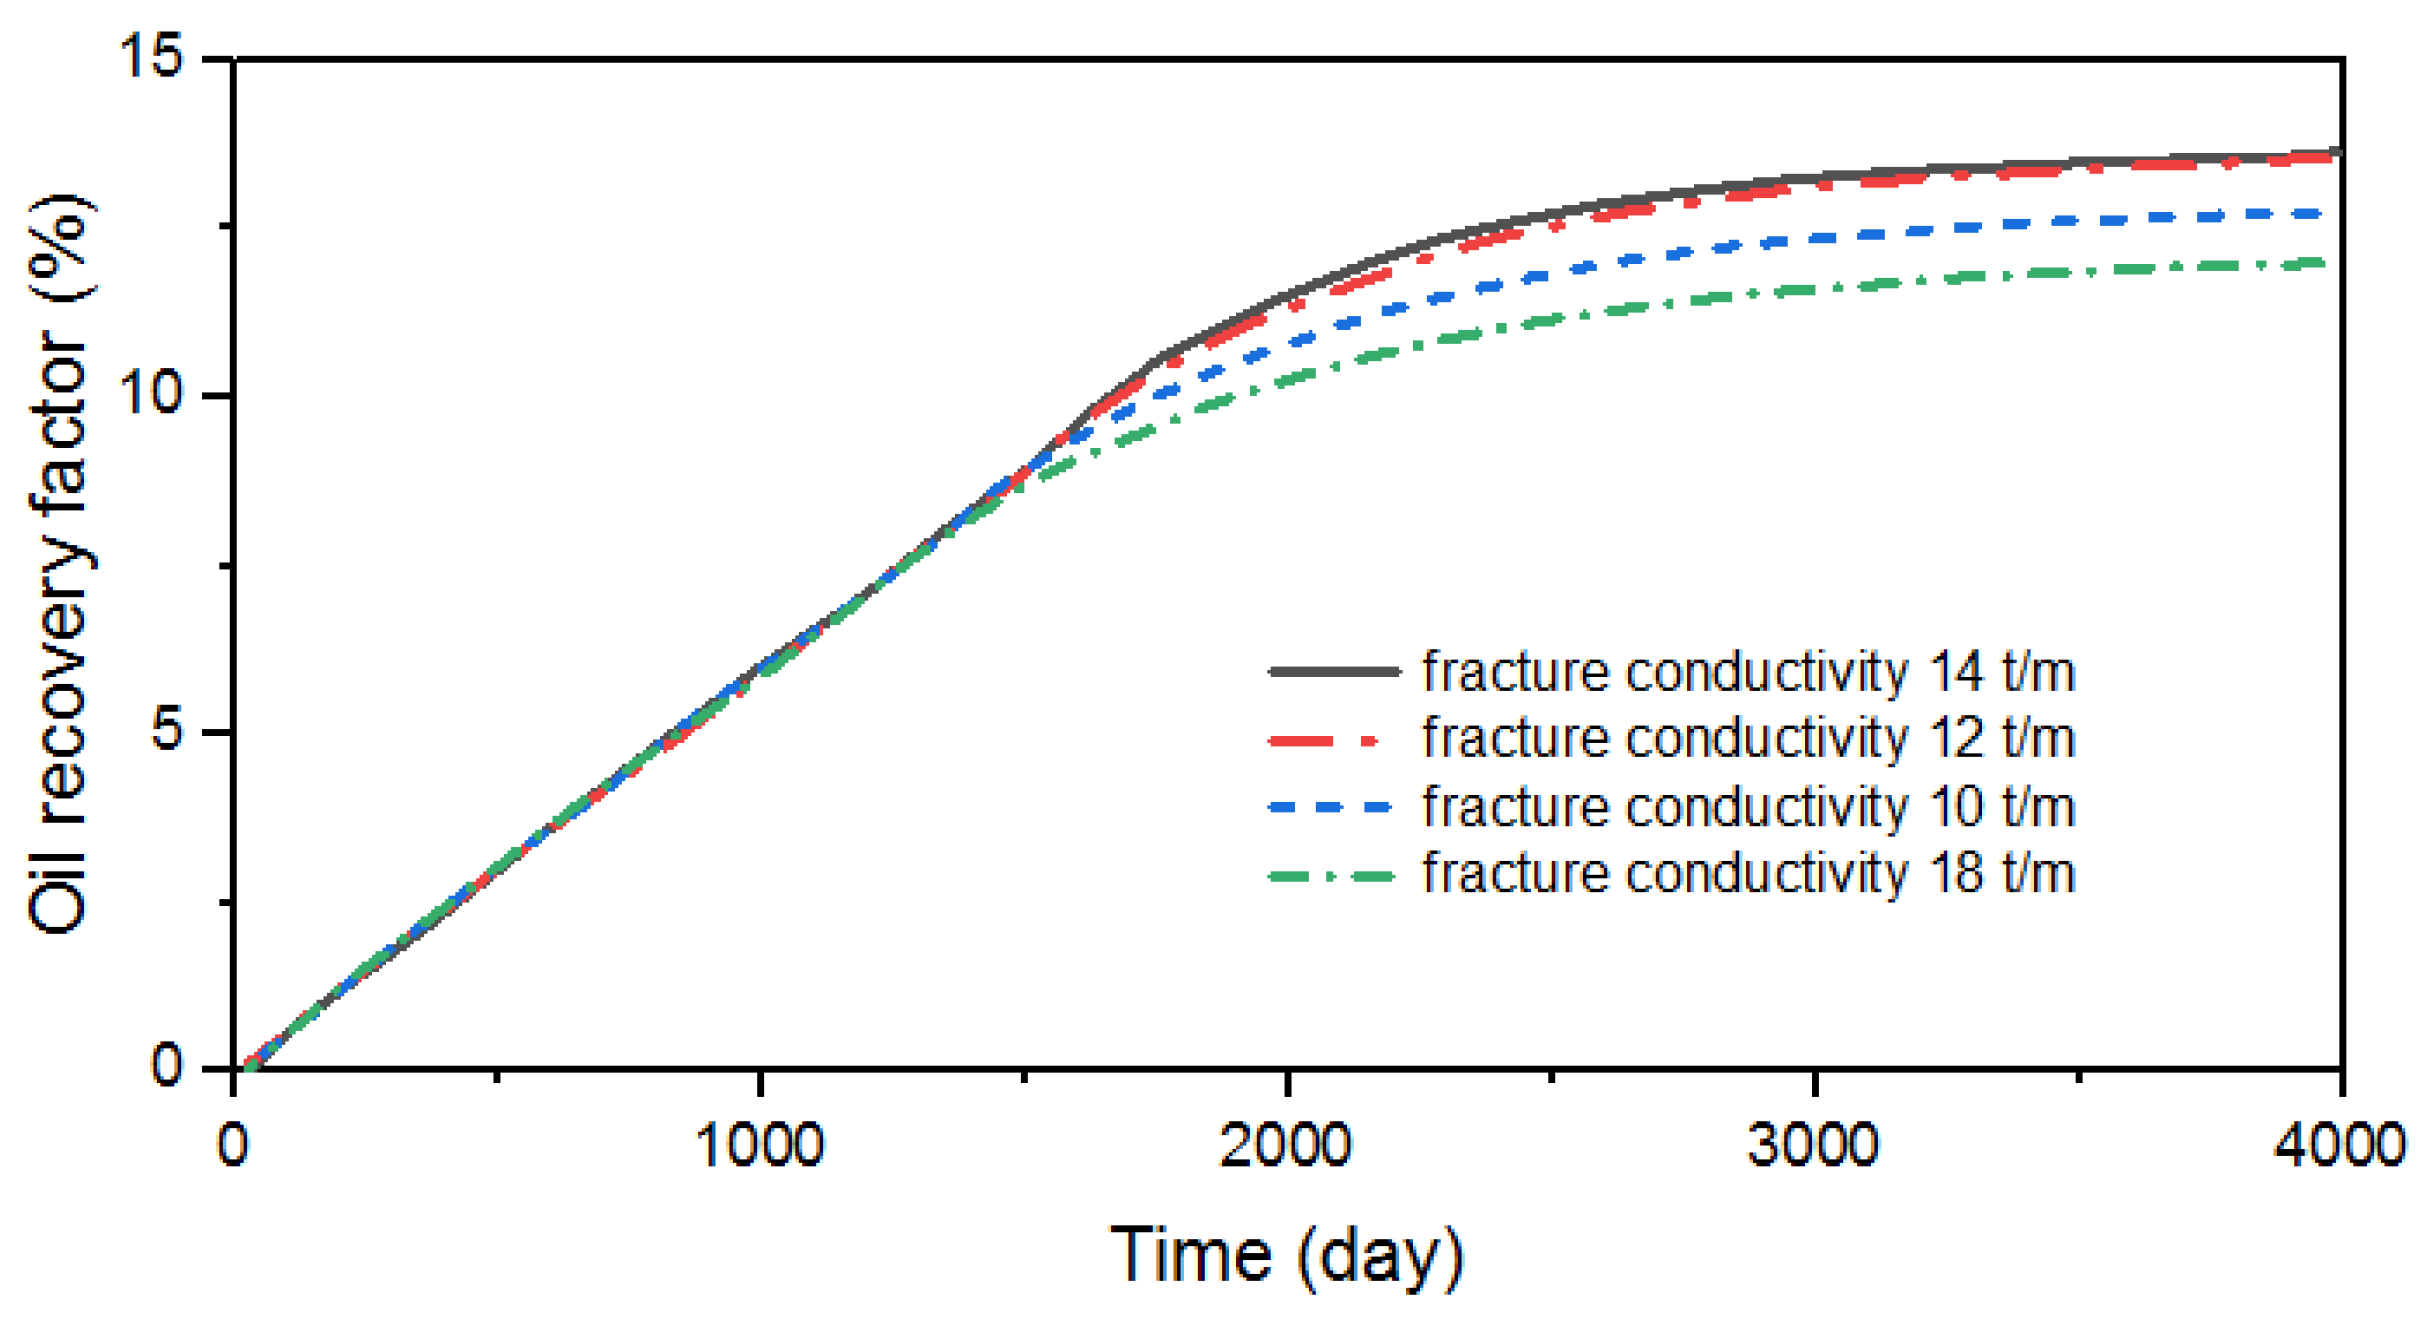
The effects of different segment spacing (50 m, 60 m, 70 m, 80 m and 100 m), fracture half-length (50 m, 90 m and 100 m) and displacement fluid injection rate (8 t/m, 10 t/m, 12 t/m and 14 t/m) on oil recovery were simulated, to explore the pattern of the fracture network in a common deep heavy oil reservoir.
Figure 6 displays a comparison of oil recoveries under different segment spacings. As can be seen from Figure 6, the smaller the segment spacing, the higher the reservoir reconstruction density and the better the stimulating effect. However, segment spacing is related to fracturing technology level and reservoir conditions. The closest segment spacing can reach 60 m at the current volume fracturing level. When the reservoir conditions are good and the permeability is low, subdivisions can be implemented, with 60 m segments and three clusters per segment based on current technology levels.
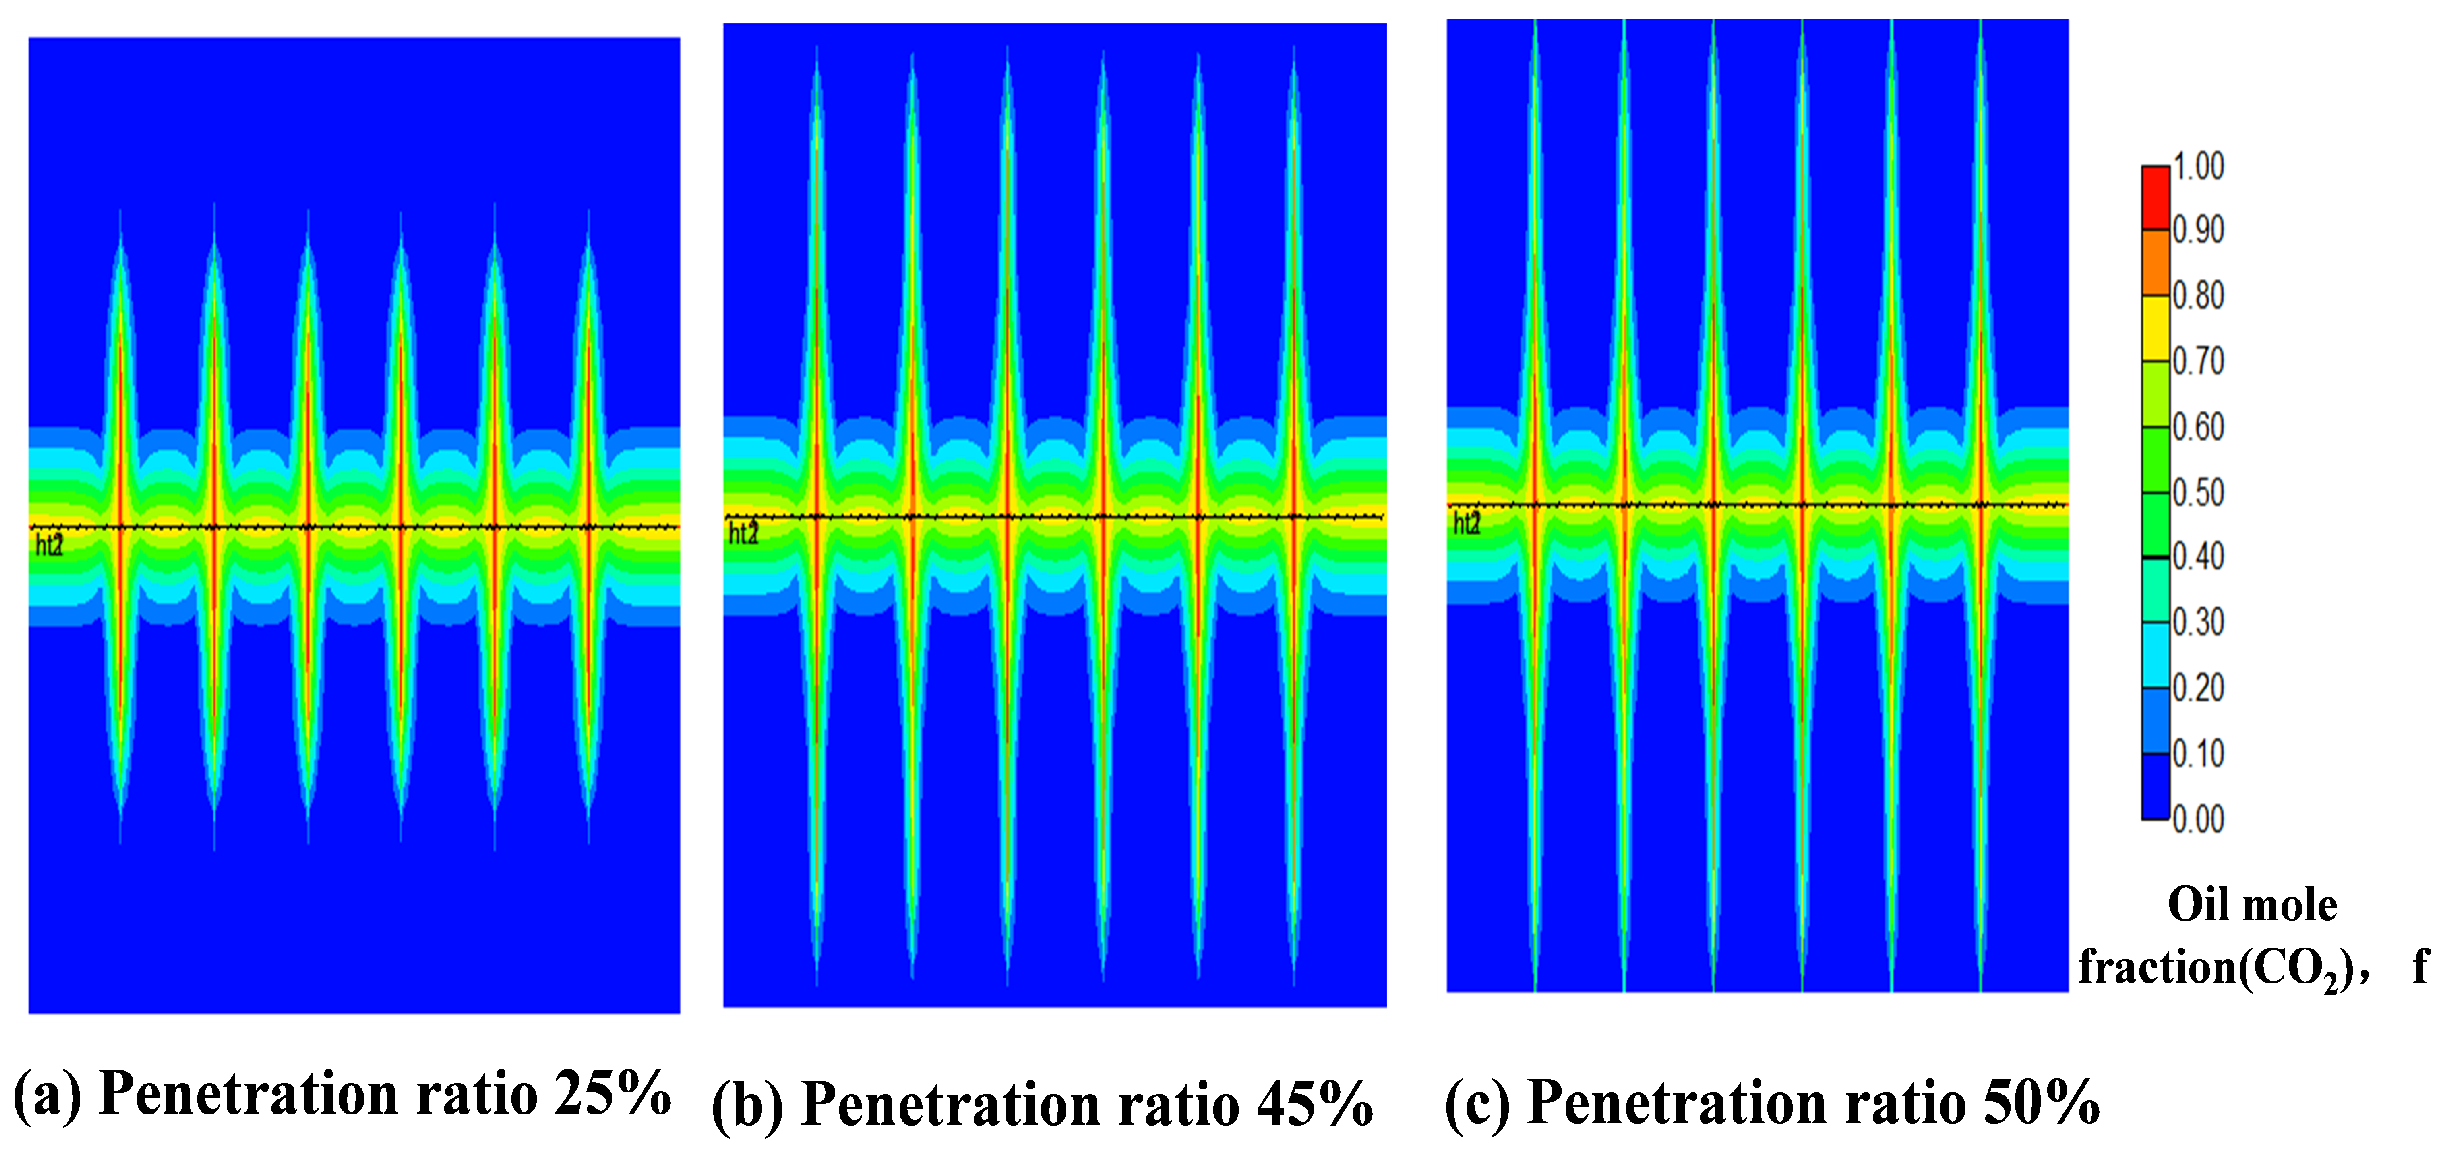
Figure 7 displays the schematic diagram of the crack action ranges with different penetration ratios.
As can be seen from Figure 7, the CO 2 injected in low permeability reservoirs is more obvious to dissolve along the fracture, but fracture channeling should be considered more for the half-length of the main fracture. According to the simulation results, when the adjacent wells are fractured by staggered fracturing, the half-length of the main fracture is about 80 m to 90 m, and the fracture penetration ratio is controlled at 40% to 45%. After fracturing, adjacent wells can basically form a pressure connected fracture network, while avoiding fluid communication.
To achieve better conductivity, higher displacement fluid strength is required. Figure 8 displays the comparison of oil recoveries under different fracture conductivity. According to the simulation results, the higher the displacement fluid strength, the better the fracture conductivity, the wider the fluid supply range, and the higher the production. The recovery factor increases when the displacement fluid strength reaches 12 t/m, but the amplitude of the increase decreases.
Through numerical simulation, the fracture network parameters are as follows: The spacing of fracture segments is 60 m, with three clusters in each segment. The half-length of the main fracture is about 80 m to 90 m, and the fracture penetration rate is controlled at 40% to 45%. The displacement of fluid strength is 12 t/m.

3.3.2. Optimization of CO 2 Fracturing Parameters

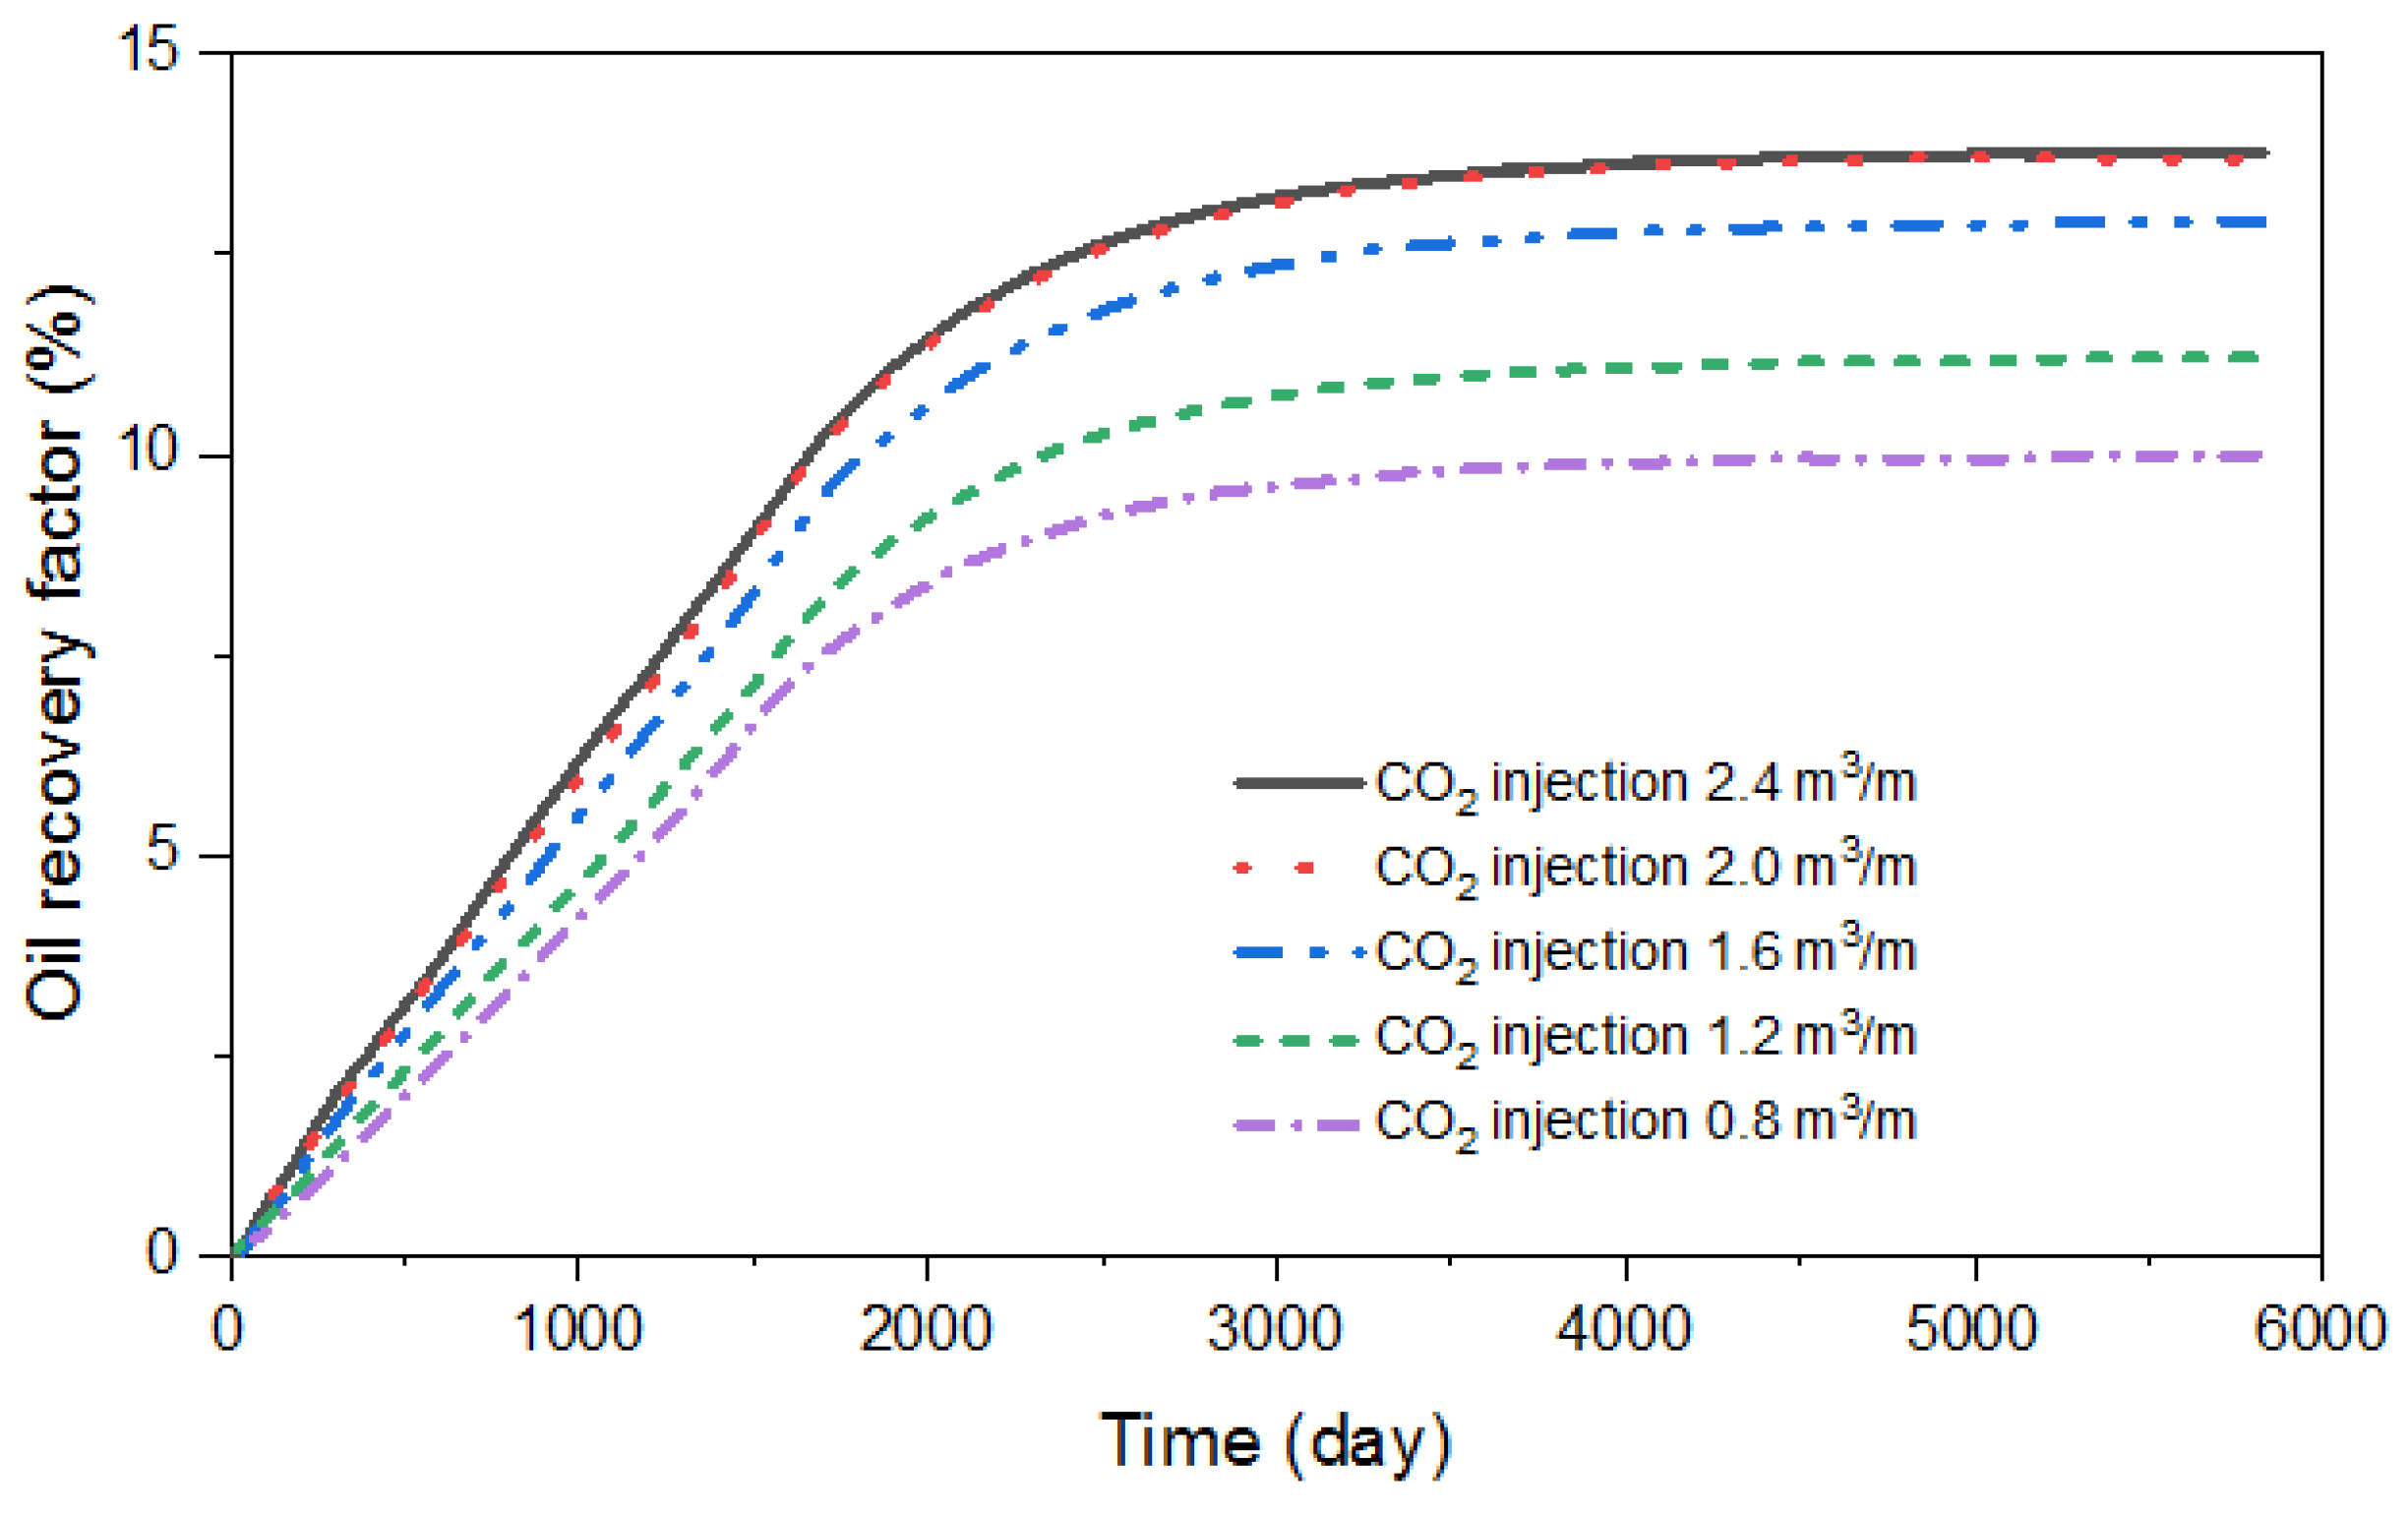
The effects of CO 2 injection volumes (0.8 m 3 /m, 1.2 m 3 /m, 1.6 m 3 /m, 2.0 m 3 /m and 2.4 m 3 /m), CO 2 injection rate (1.0 m 3 /min, 1.4 m 3 /min, 1.8 m 3 /min and 2.0 m 3 /min) and soaking times (5 days, 10 days, 20 days, 30 days and 40 days) on the recovery factor of the reservoir were studied, to explore the effect of CO 2 -energized technology on the development of deep heavy oil reservoirs.
Figure 9 displays a comparison of oil recoveries under different CO 2 injection volumes. As can be seen from Figure 9, the higher the CO 2 injection intensity, the better the production effect. When the CO 2 injection intensity reaches above 2.0 m 3 /m, there is no significant further oil increase. The higher the CO 2 injection rate, the higher the injection pressure, the faster the CO 2 enters the reservoir, and the better the dissolution and viscosity reduction effect.
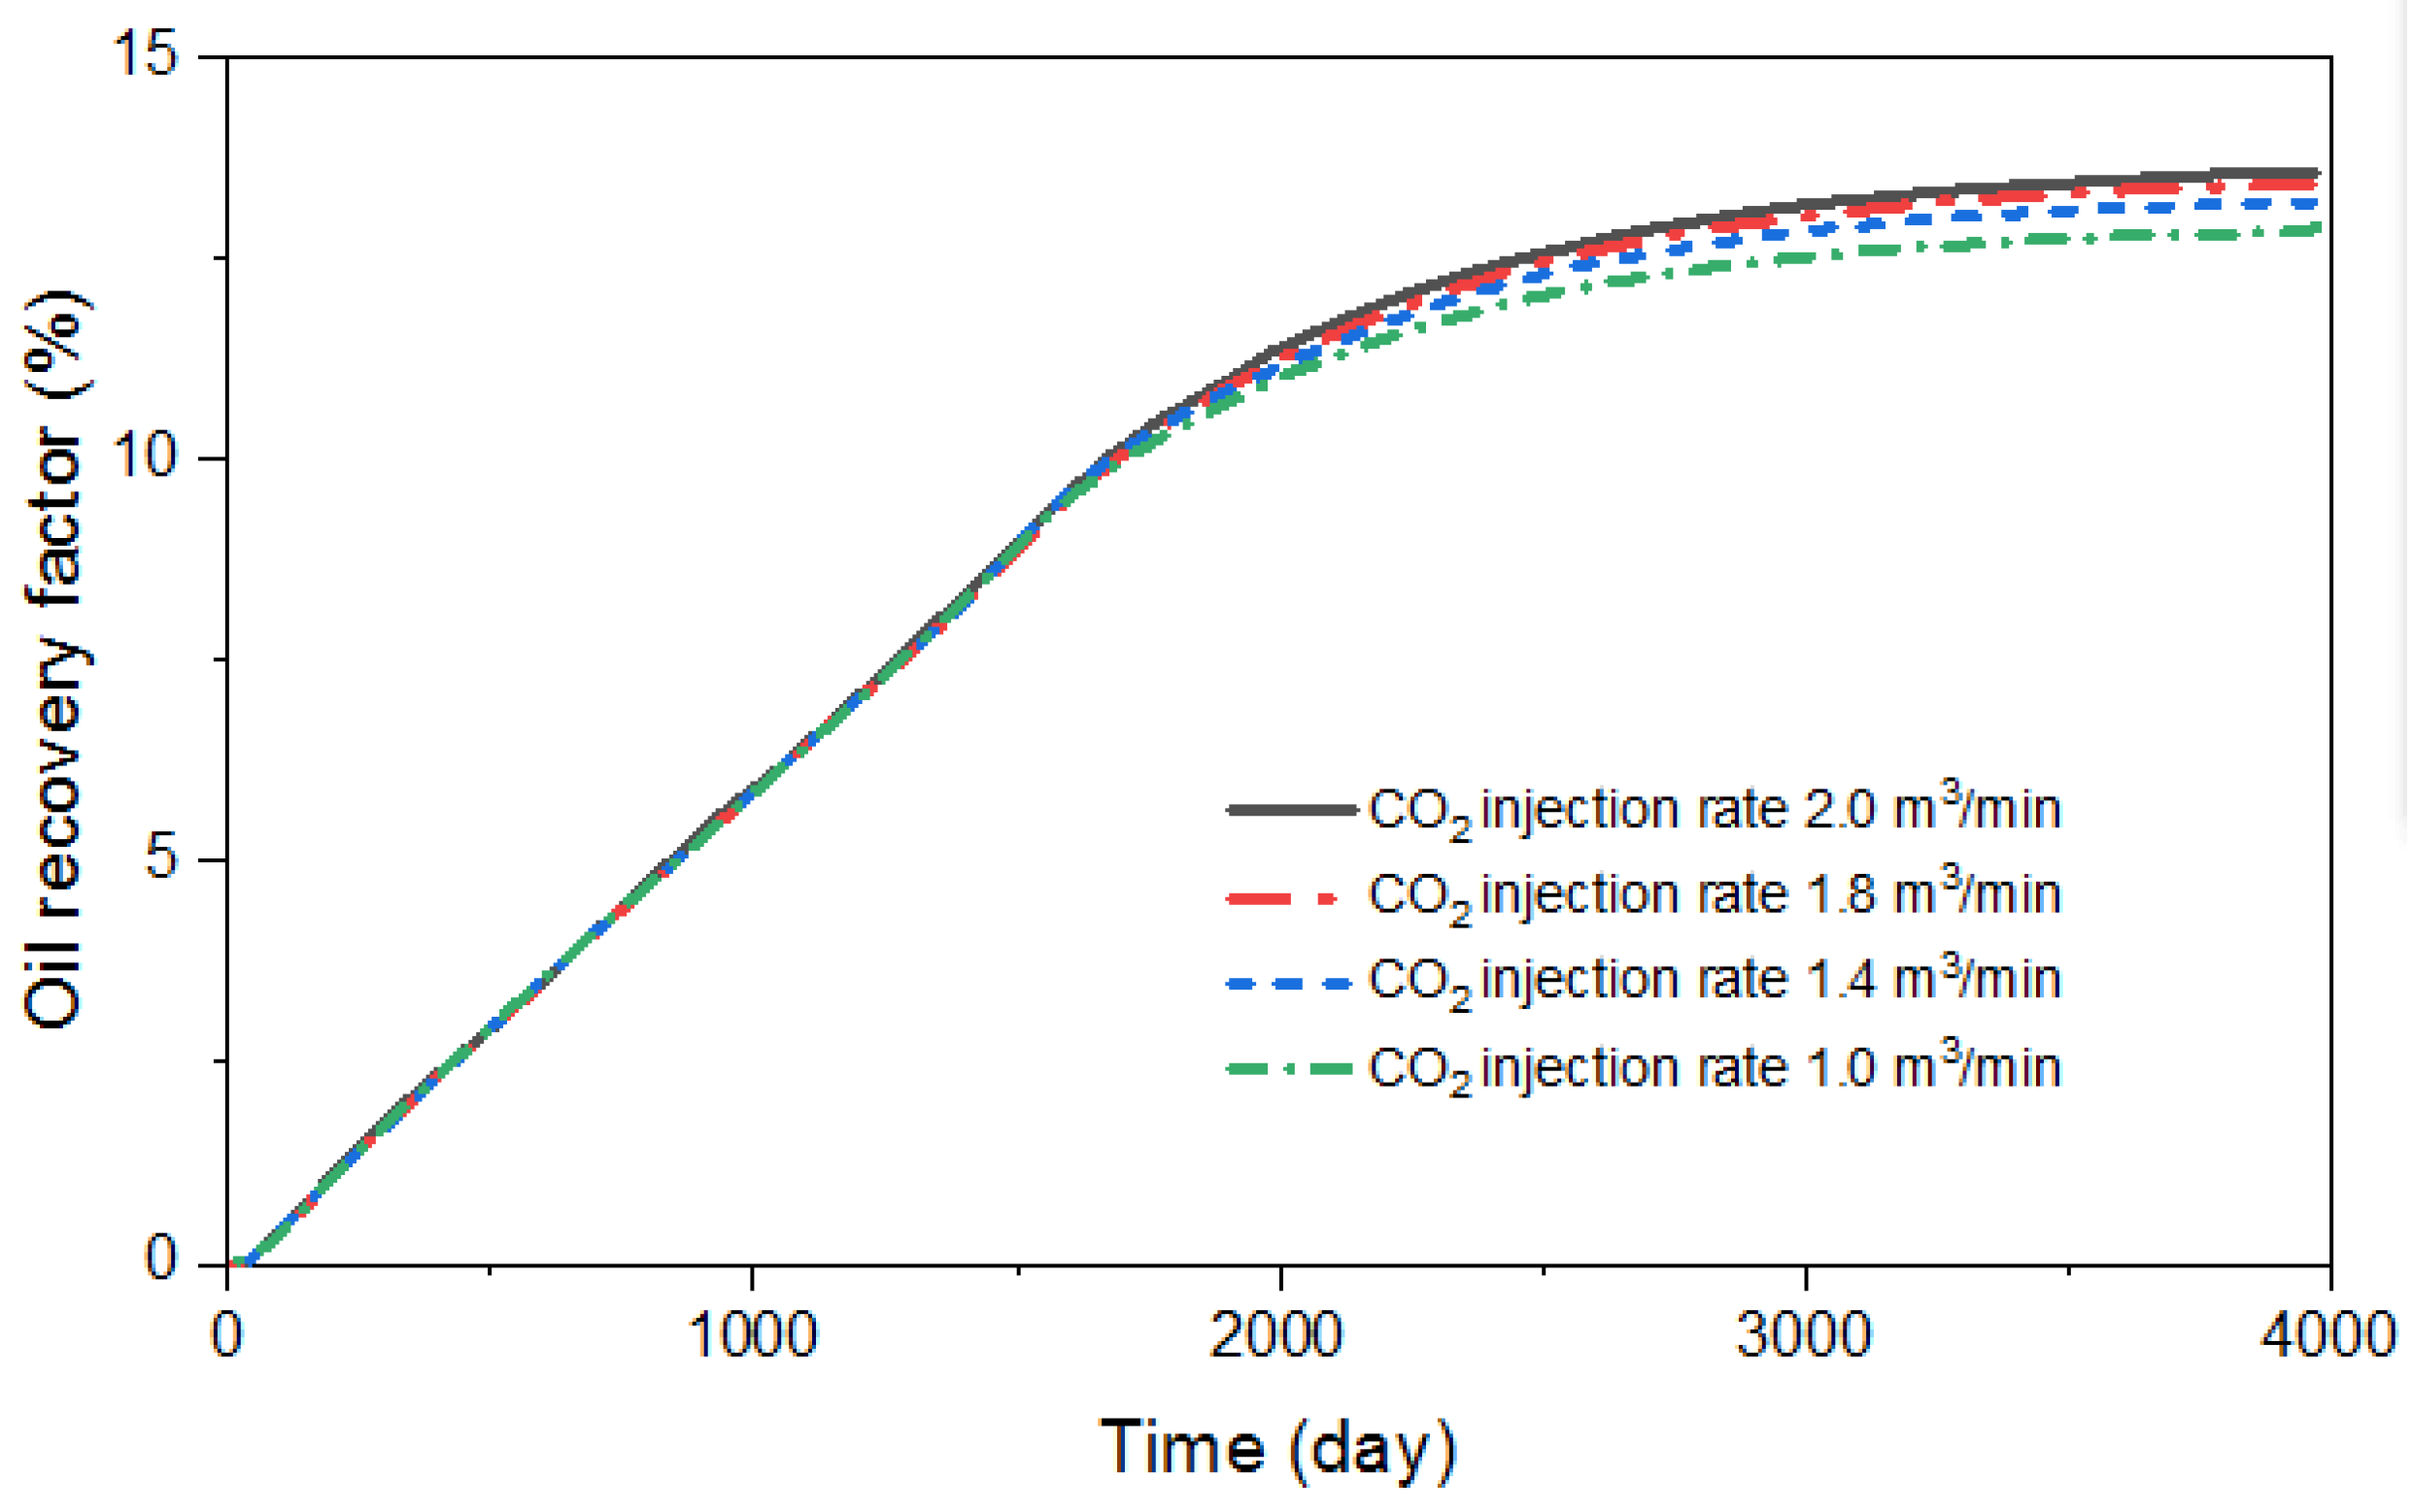
Figure 10 displays a comparison of oil recoveries under different CO 2 injection rates. As can be observed in the figure, with the increase in CO 2 injection rate, the oil recovery rate also increases. When the CO 2 injection rate reaches 1.8 m 3 /min, the increase in oil recovery rate becomes insignificant.
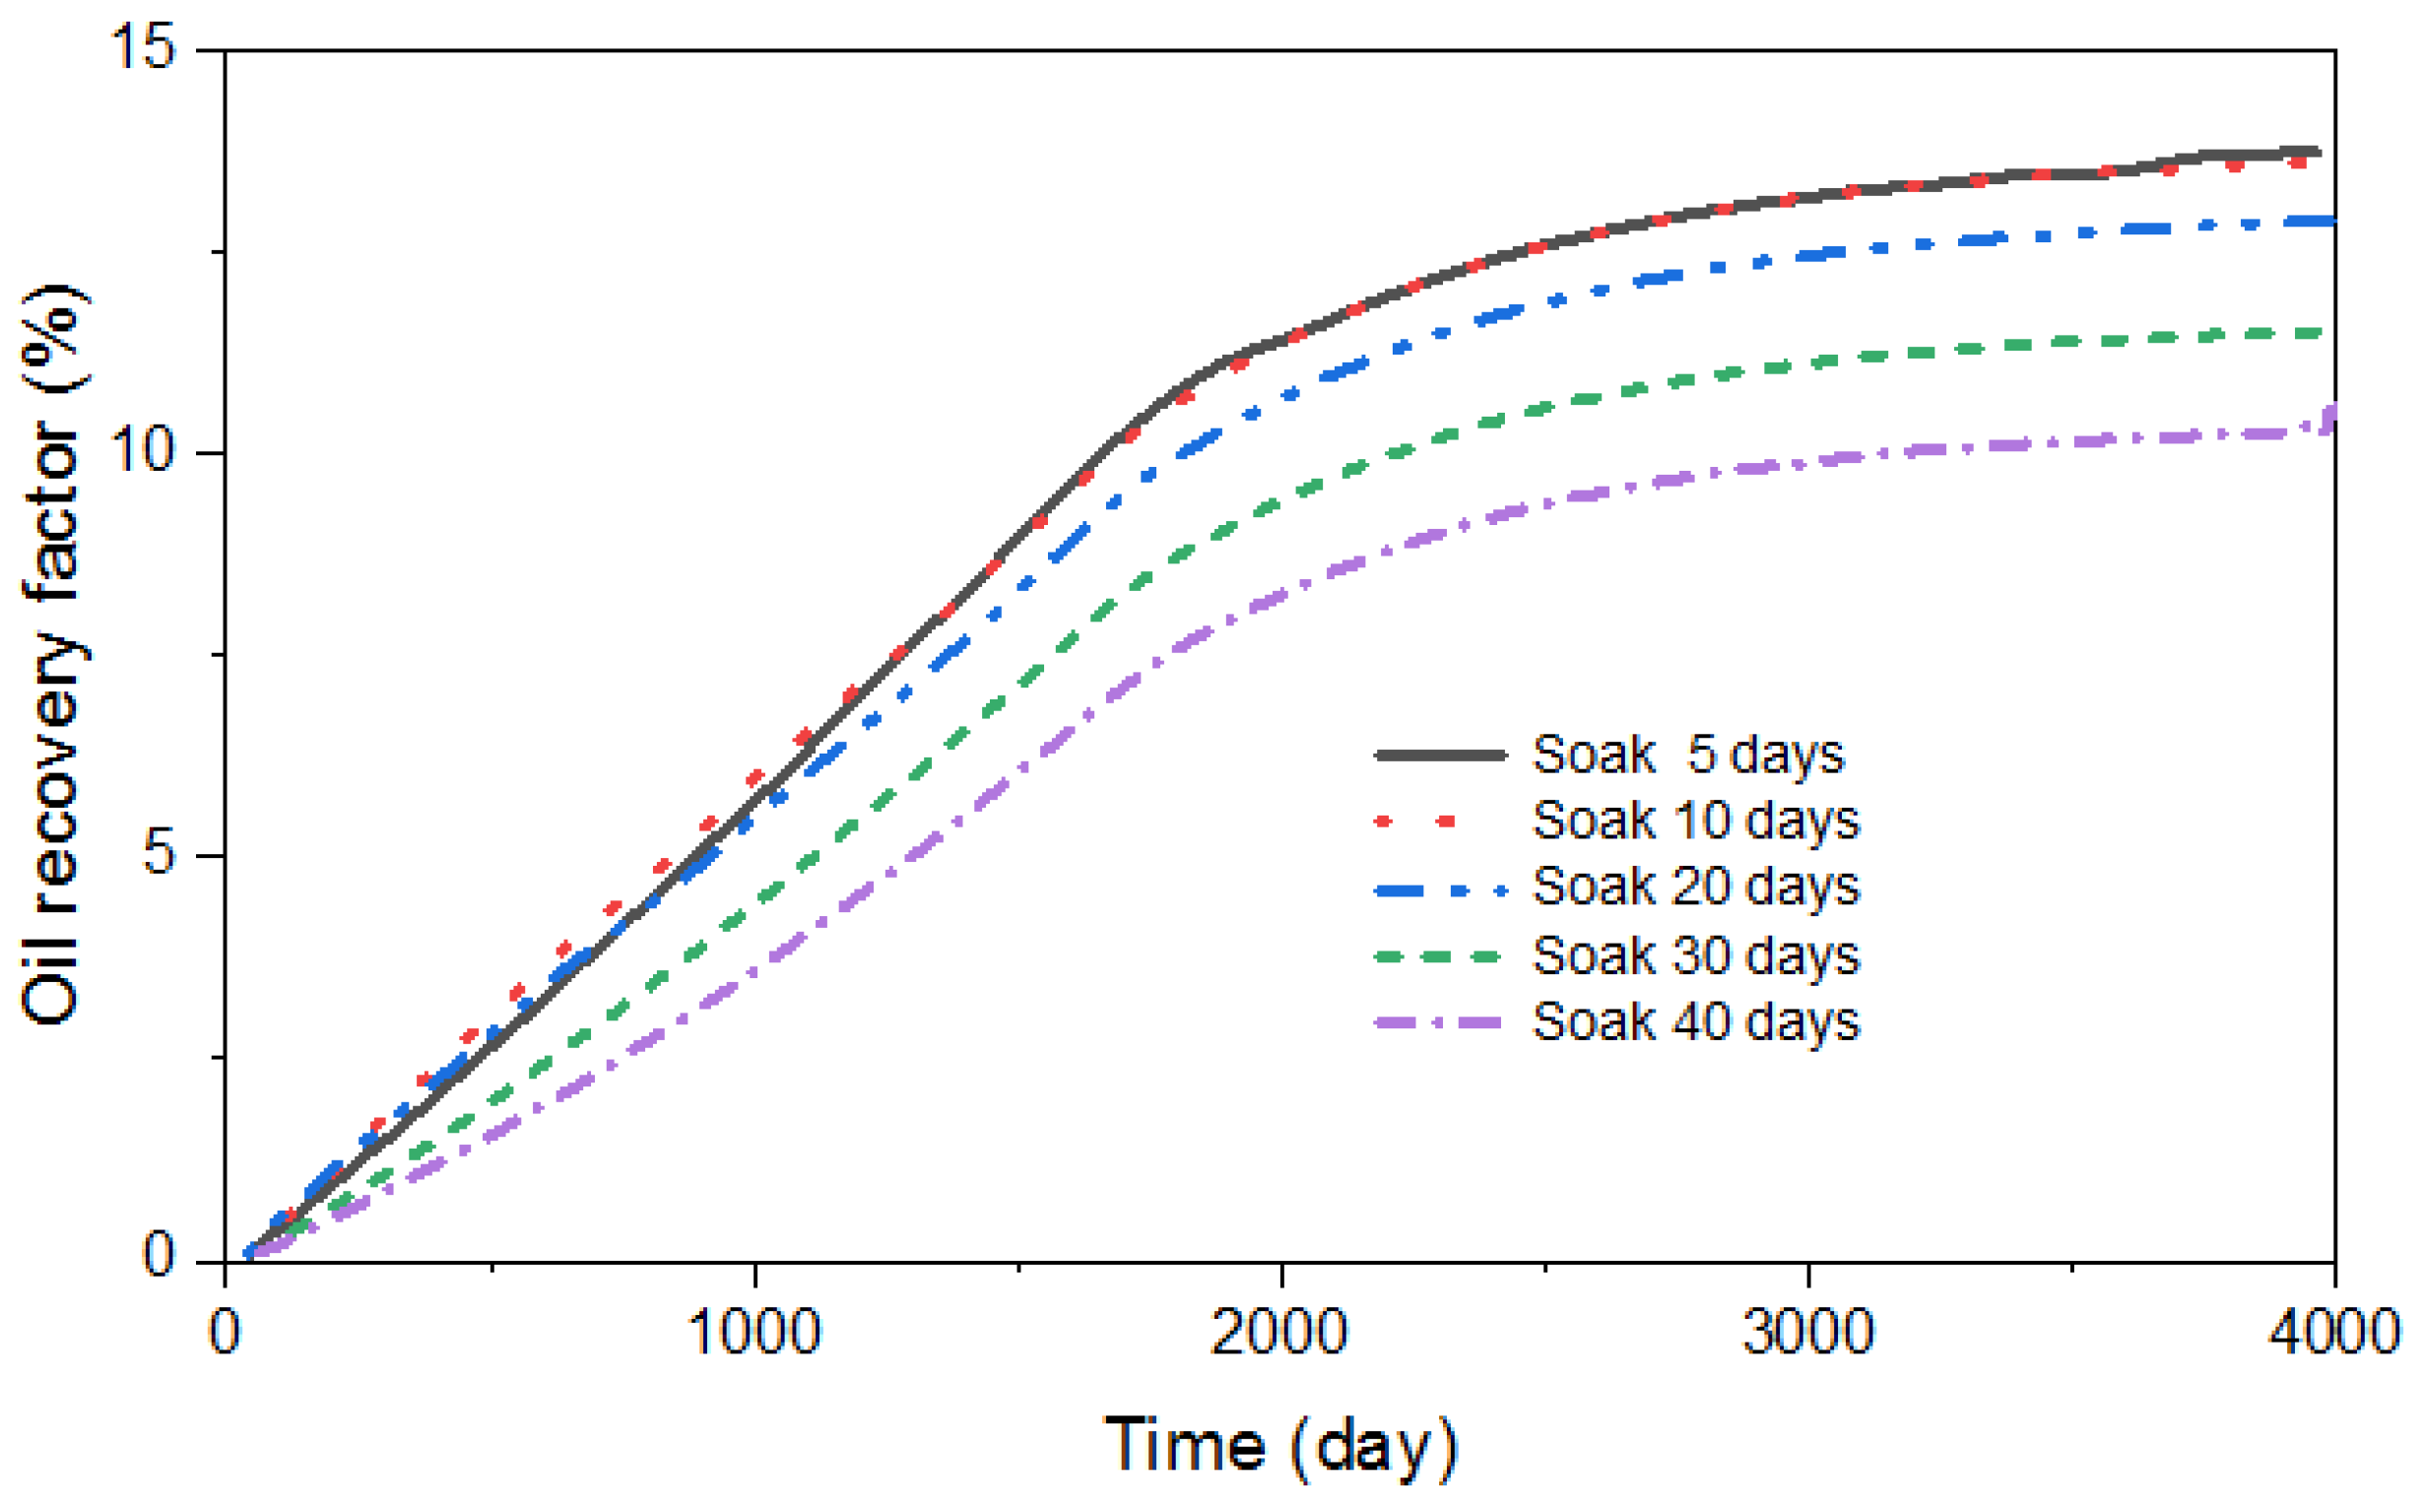
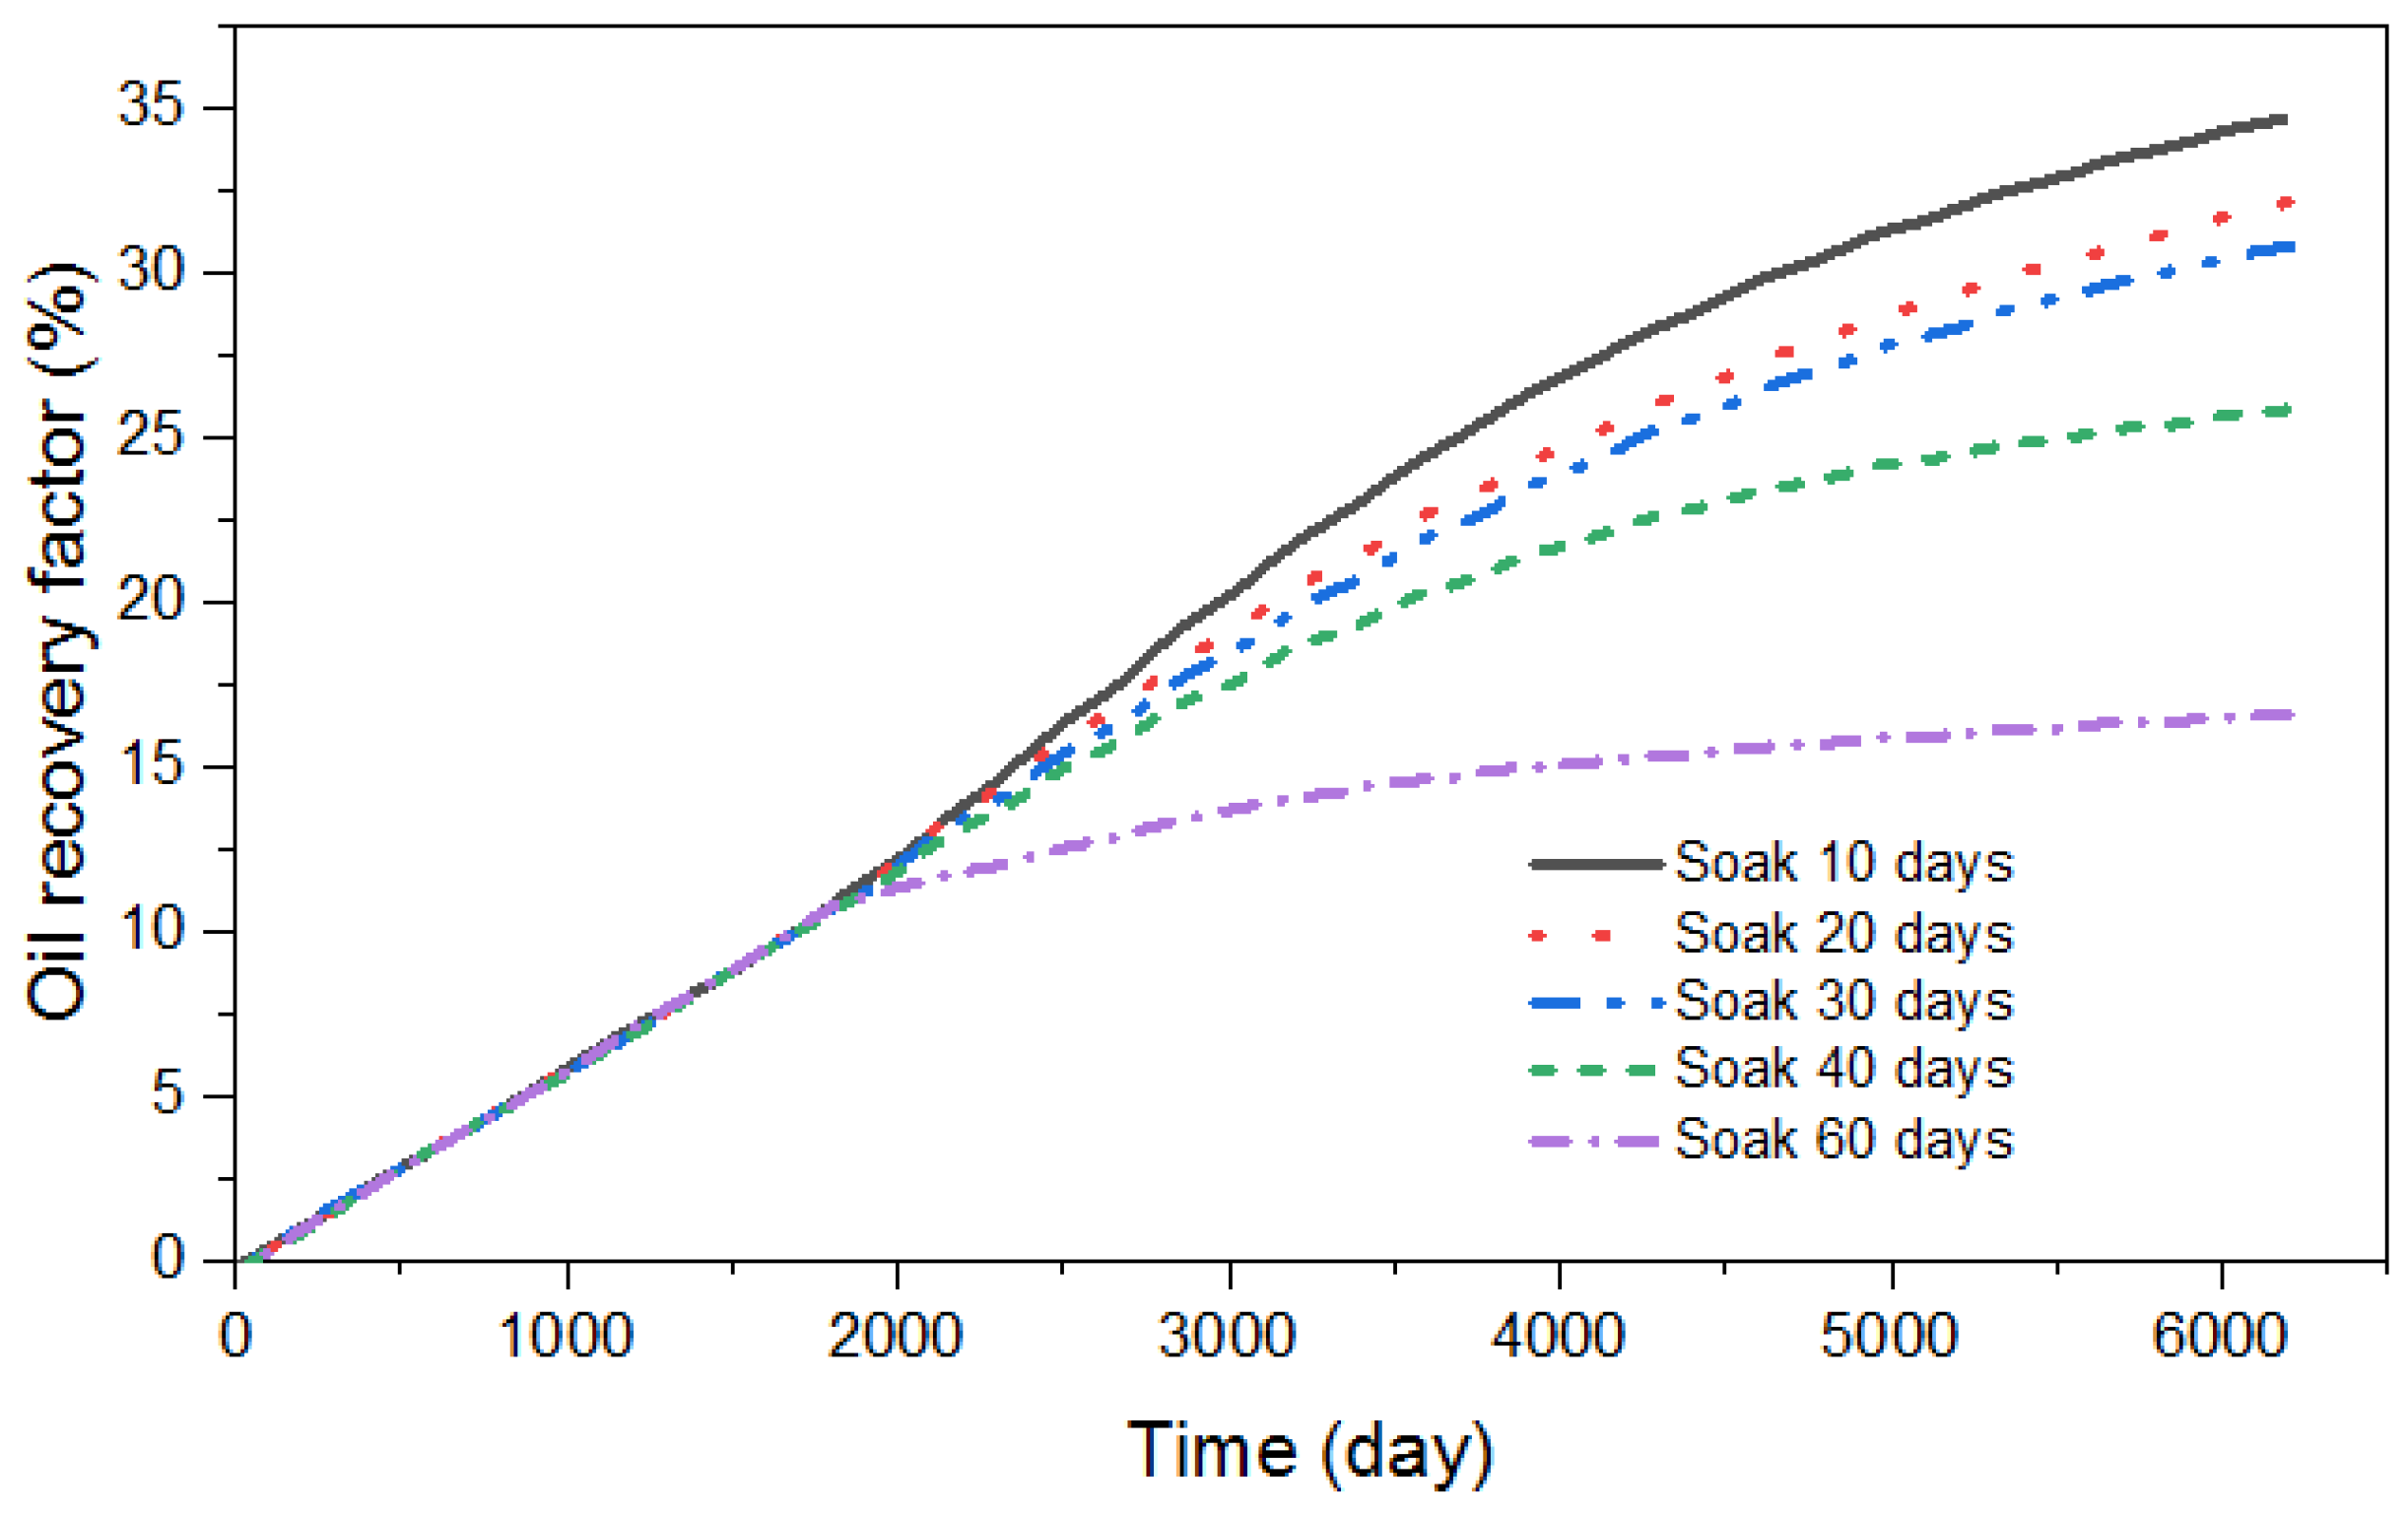
Figure 11 displays a comparison of oil recoveries under different soaking times. The contact time between CO 2 and crude oil is short when the time of soaking is short, which leads to the oil dissolution effect of CO 2 . The worse the oil dissolving effect of CO 2 , the faster the degassing and oil-free drainage speed in the recovery process, and the weaker the energizing effect of CO 2 . The soaking time should be extended to give full play to the role of V foam oil. The simulation results show that when the soaking time reaches 30 days, the oil increase amplitude decreases.
Through numerical simulation, the CO 2 fracturing parameters are as follows: The CO 2 injection intensity is 2.0 m 3 /m. The CO 2 injection rate is 1.8 m 3 /min. The soaking time is 30 days.

3.4. Stage of N 2 Foam Huff-N-Puff

The formation energy decreases rapidly, the production decreases quickly, and the recovery rate is low with primary production. N 2 foam stimulation is applied to the reservoir at the late stage of primary production to increase reservoir energy, improve oil mobility, and thus improve recovery. In this section, the injection parameters of N 2 foam huff-n-puff are optimized by numerical simulation, and the results of the model experiment are verified, so as to explore the applicability of N 2 foam huff-n-puff technology.

3.4.1. Timing of the N 2 Foam Huff-N-Puff Stage

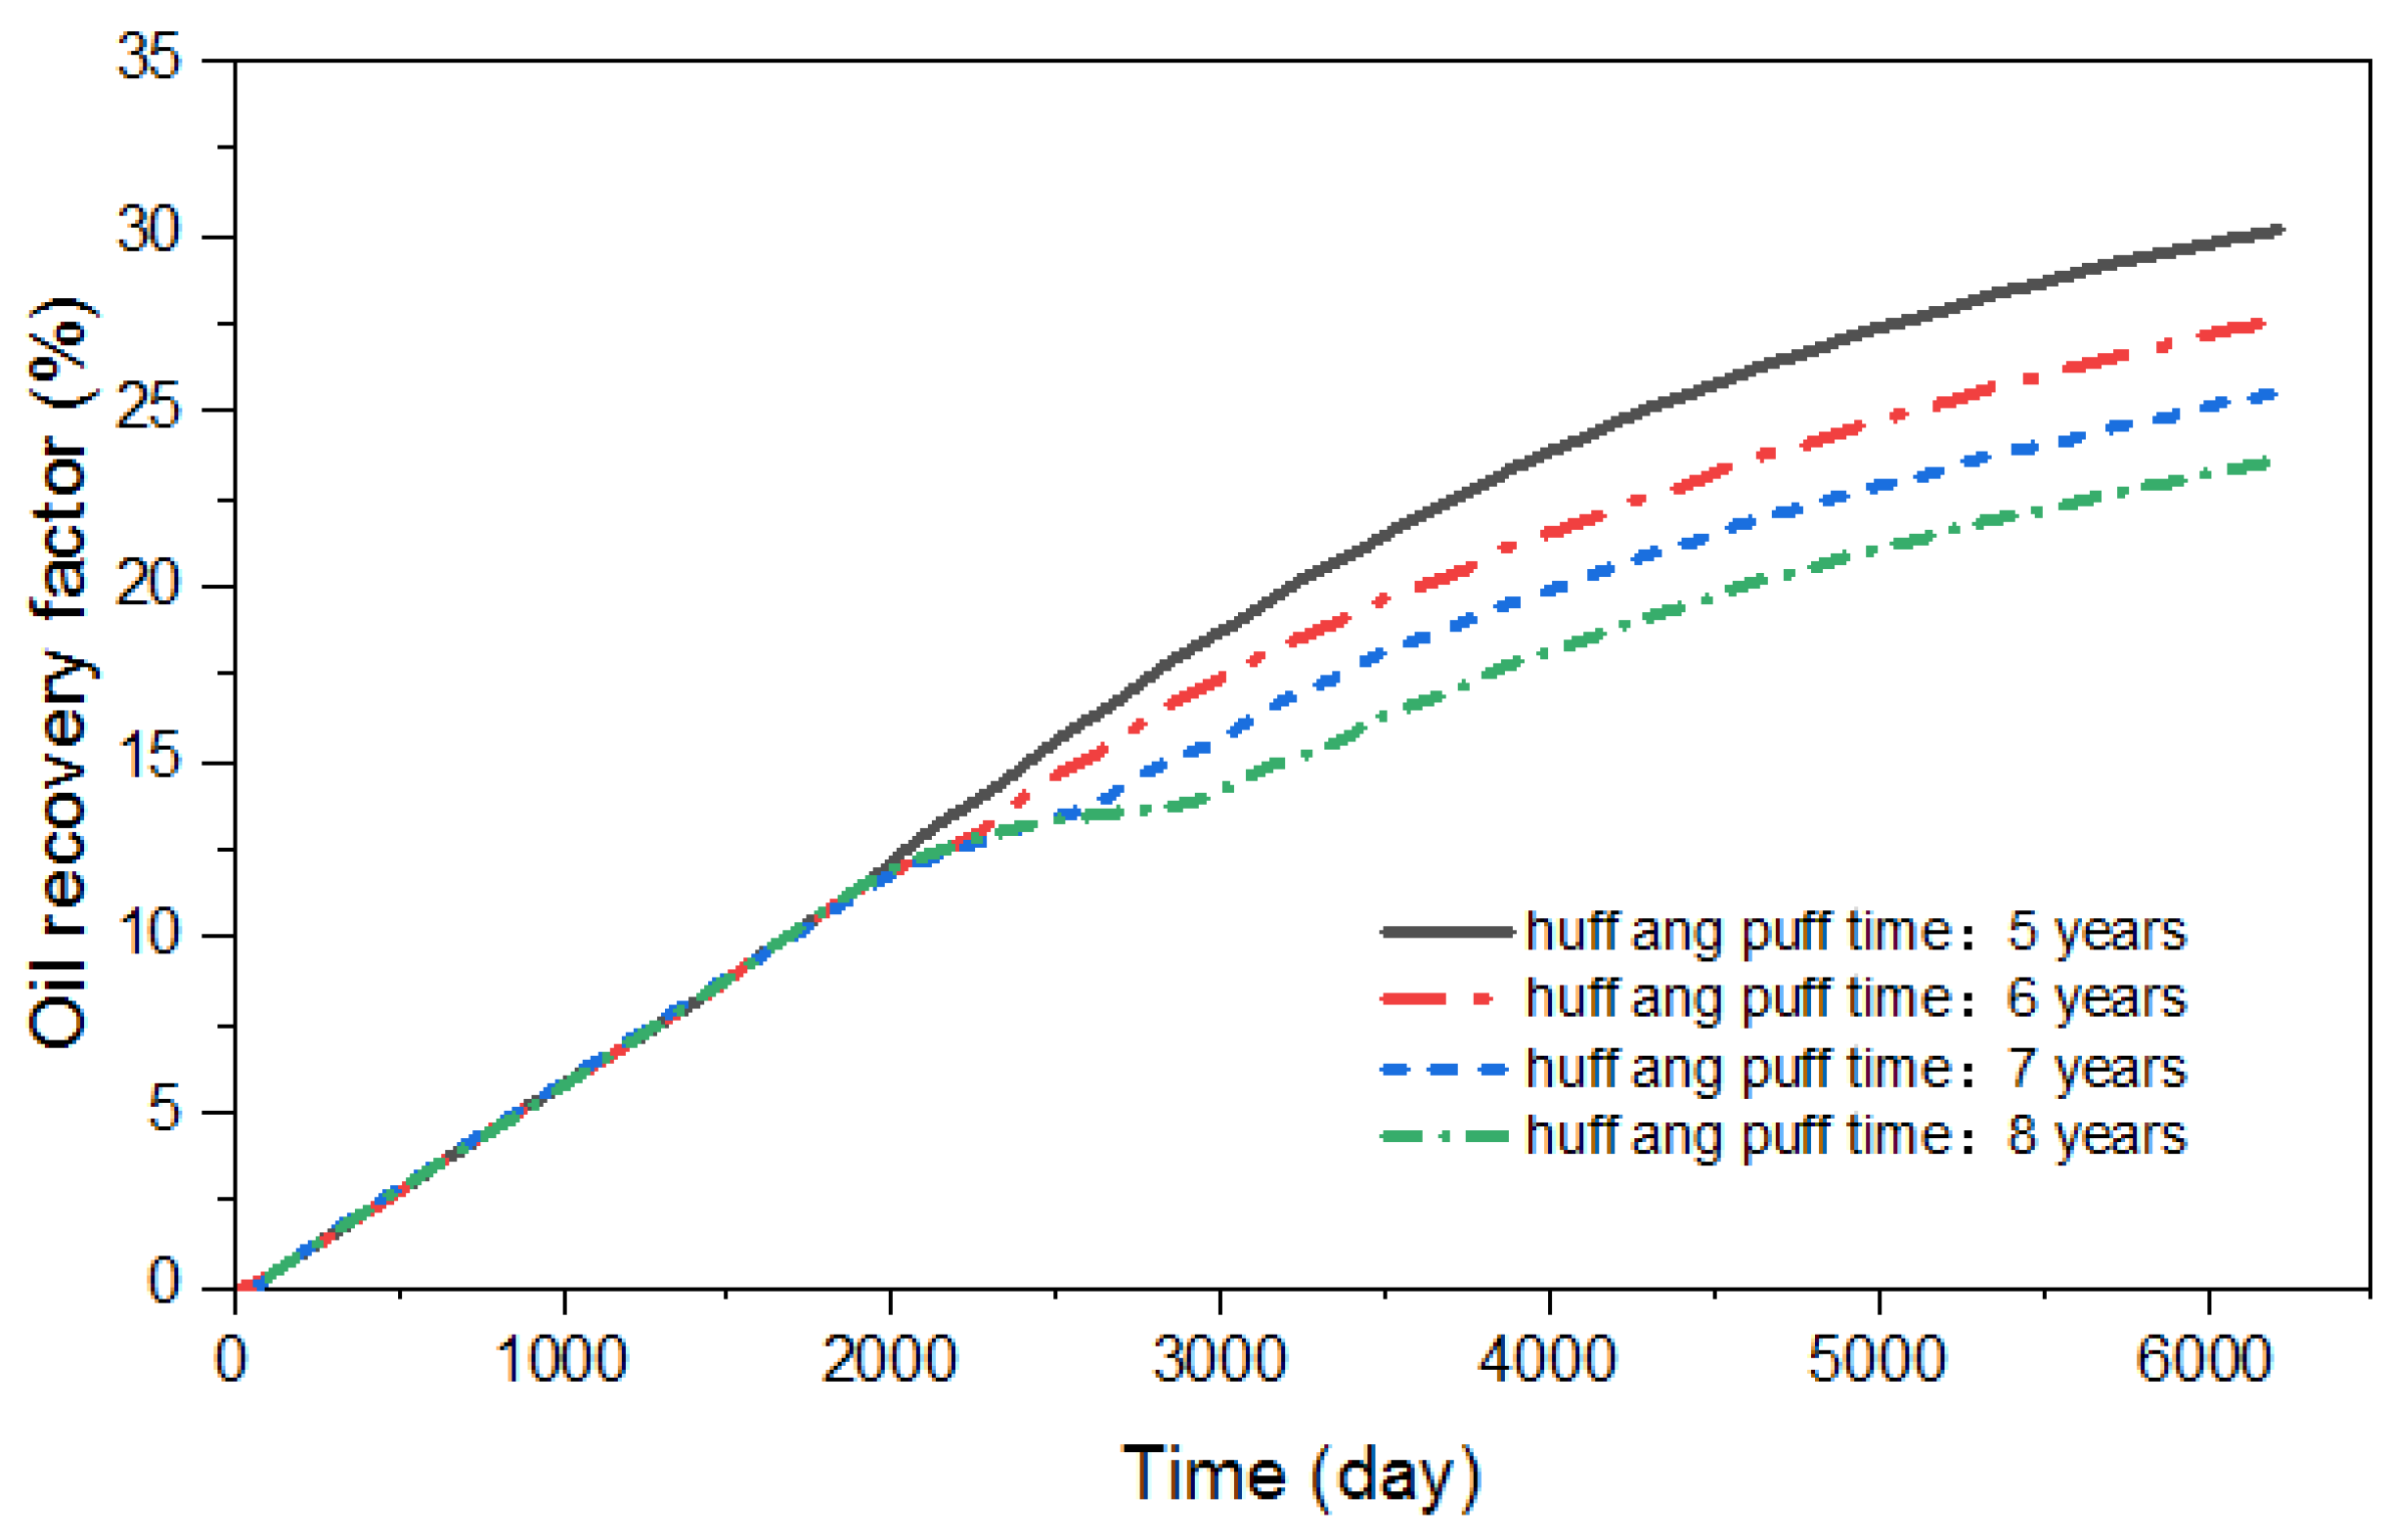
Different from high-viscosity foam oil, low-viscosity oil starts to degas rapidly when the pressure is lower than the bubble point, and the oil viscosity rises sharply. The huff-n-puff effect then drops sharply. Figure 12 shows the variation in oil recoveries under different huff-n-puff timings.
The optimal timing for N 2 foam huff-n-puff should be before the reservoir pressure is below the bubble point pressure, and the production GOR (Gas Oil Ratio) has reached maximum. According to the simulation results, the most recent huff-n-puff should occur within 5 years of natural primary production. Considering the low production in the late stage of primary production, N 2 foam huff-n-puff is recommended to be implemented in 4∼5 years.

3.4.2. Solvent Slug Volume

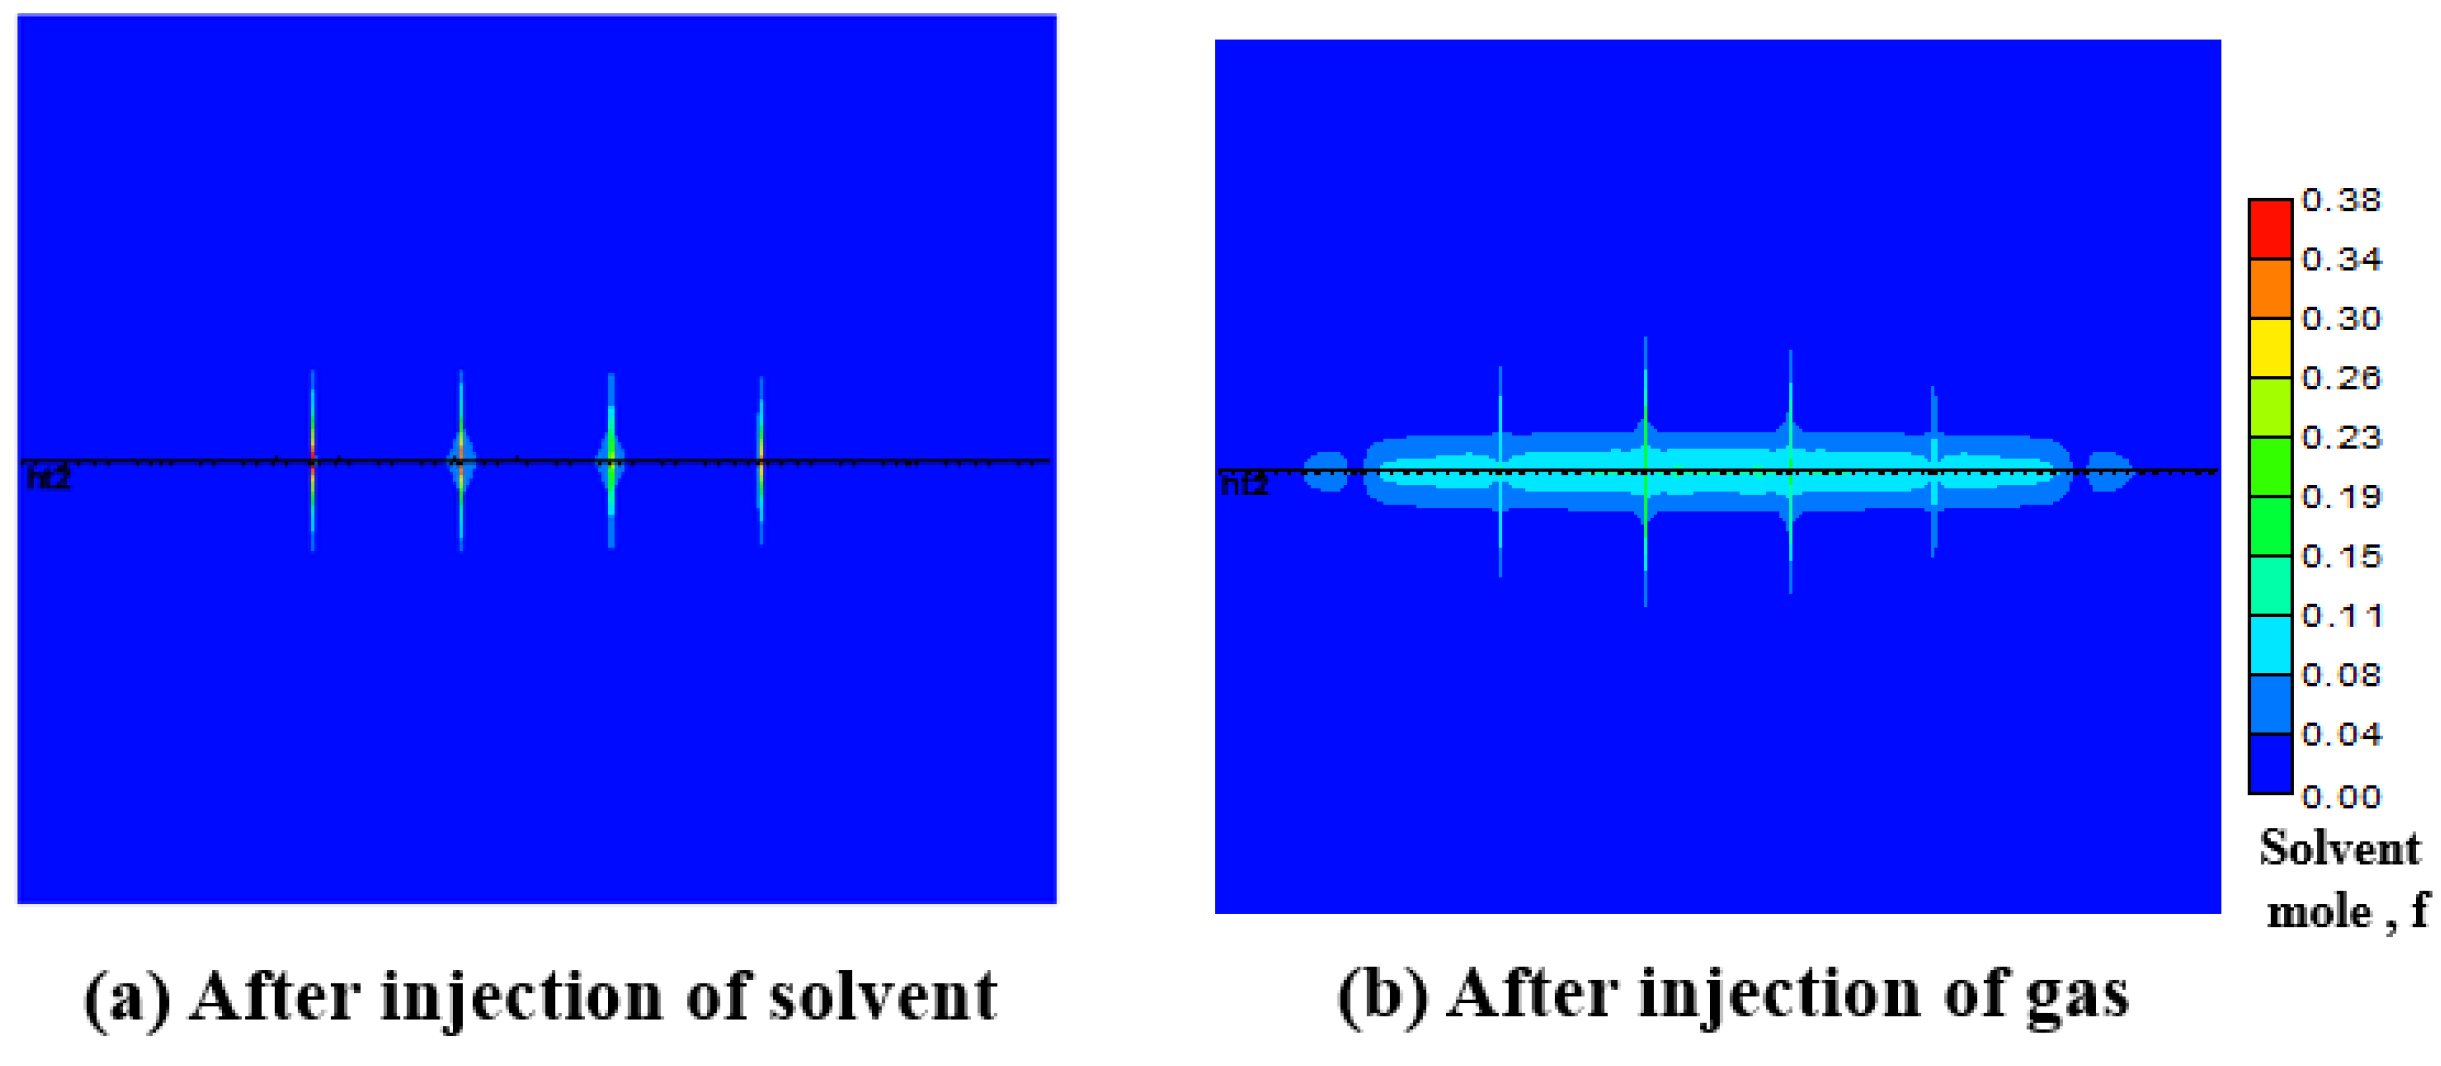
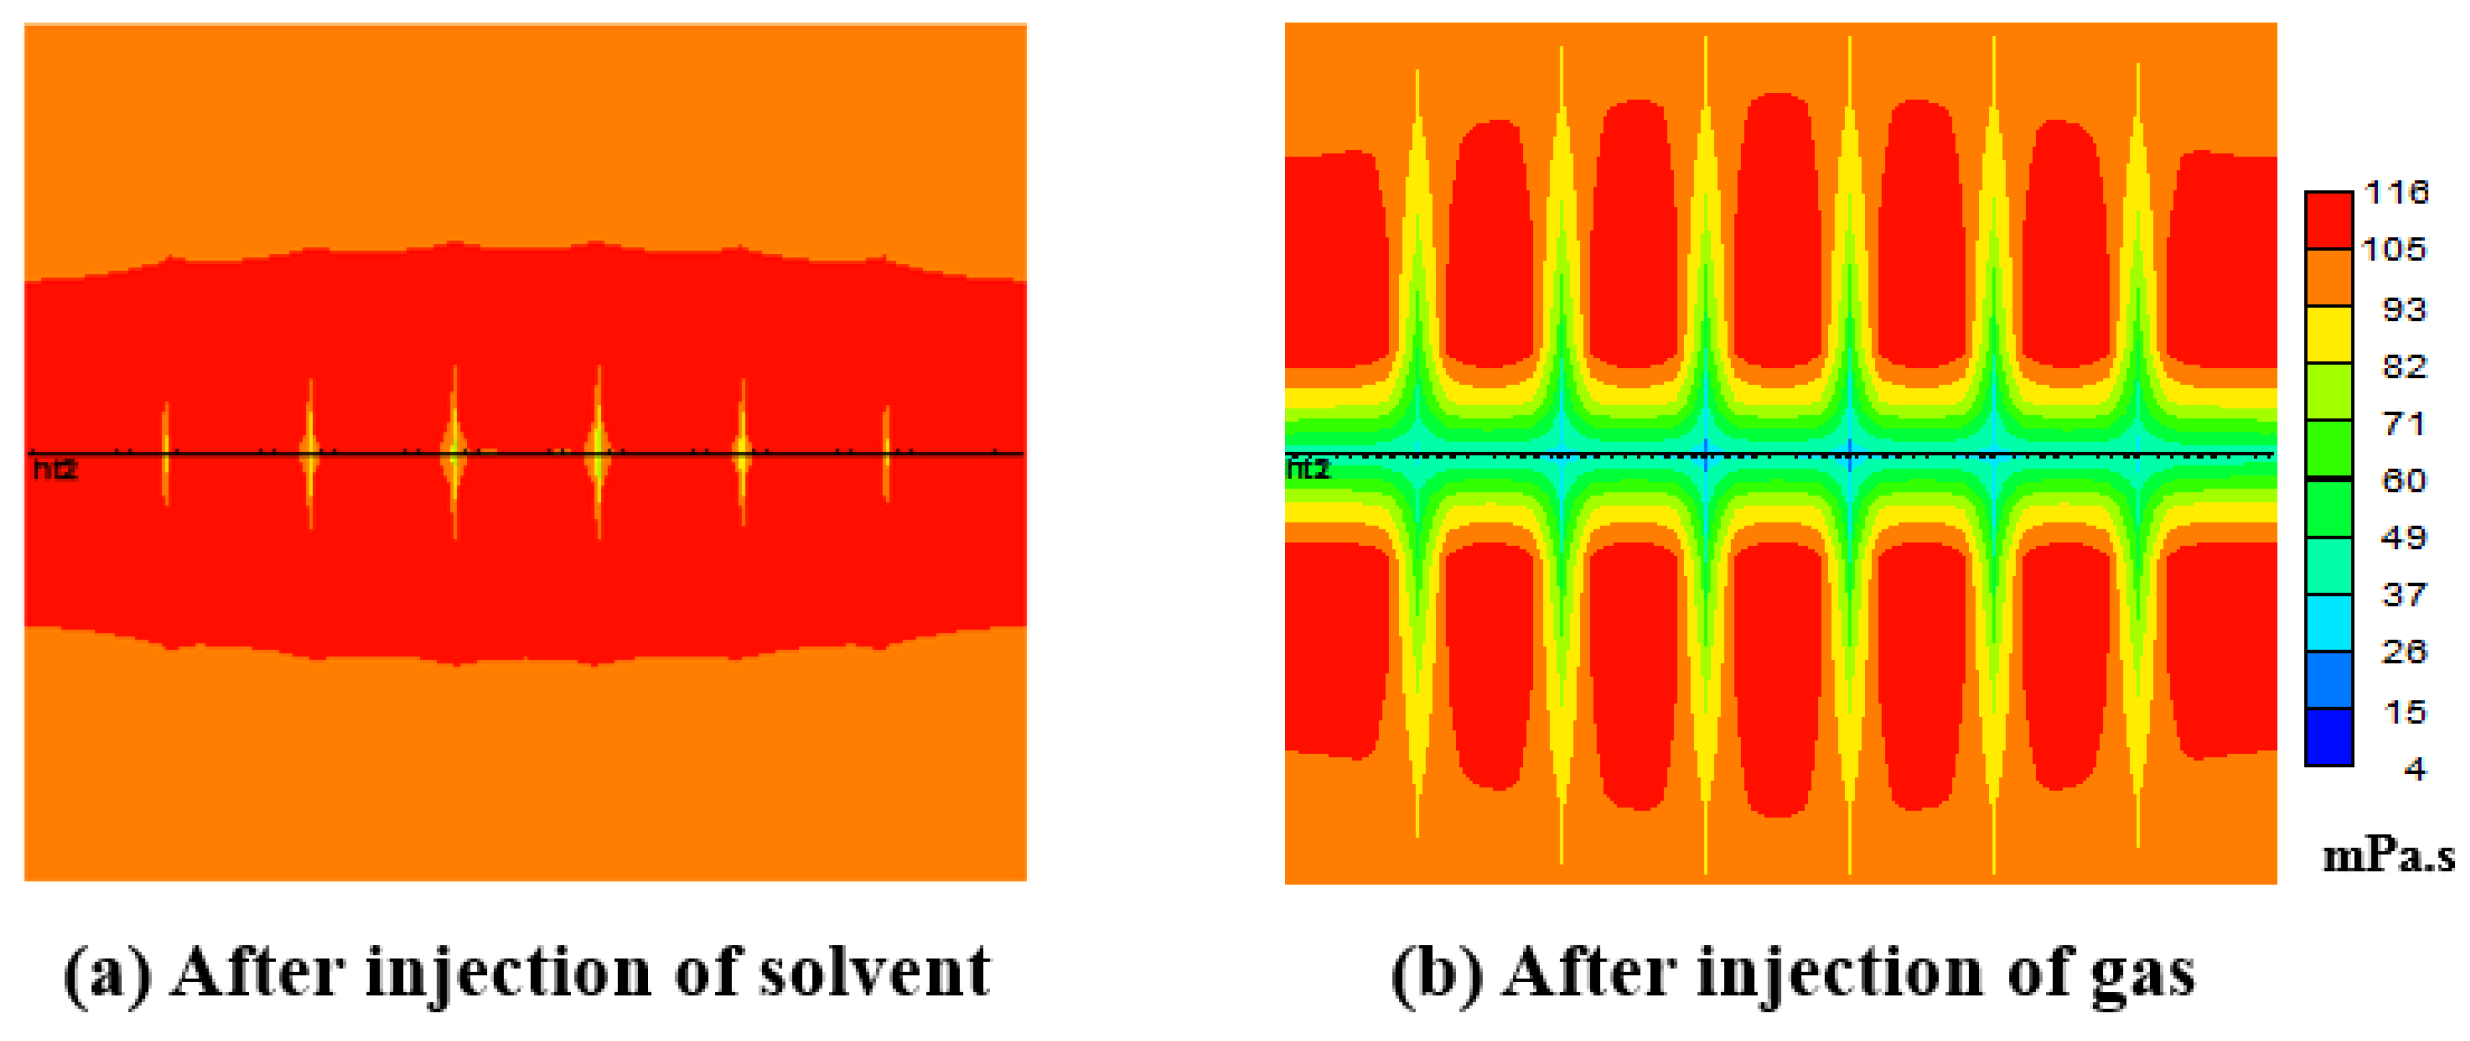
Figure 13 shows the solvent distribution field at different timings (mole fraction). Figure 14 depicts the variations in crude oil viscosity at various times.
As can be seen from Figure 13, the solvent pre-slug first spreads through the fracture and gas is injected to drive the olvent pre-slug further into the reservoir. As can be seen from Figure 14, the solvent pre-slug and gas displacement can exert the rapid viscosity reduction effect of the solvent and reduce the oil viscosity below 50.0 mPa·s. Therefore, injecting the solvent pre-slug before gas injection and displacing it into the reservoir during gas injection can expand the viscosity reduction region.
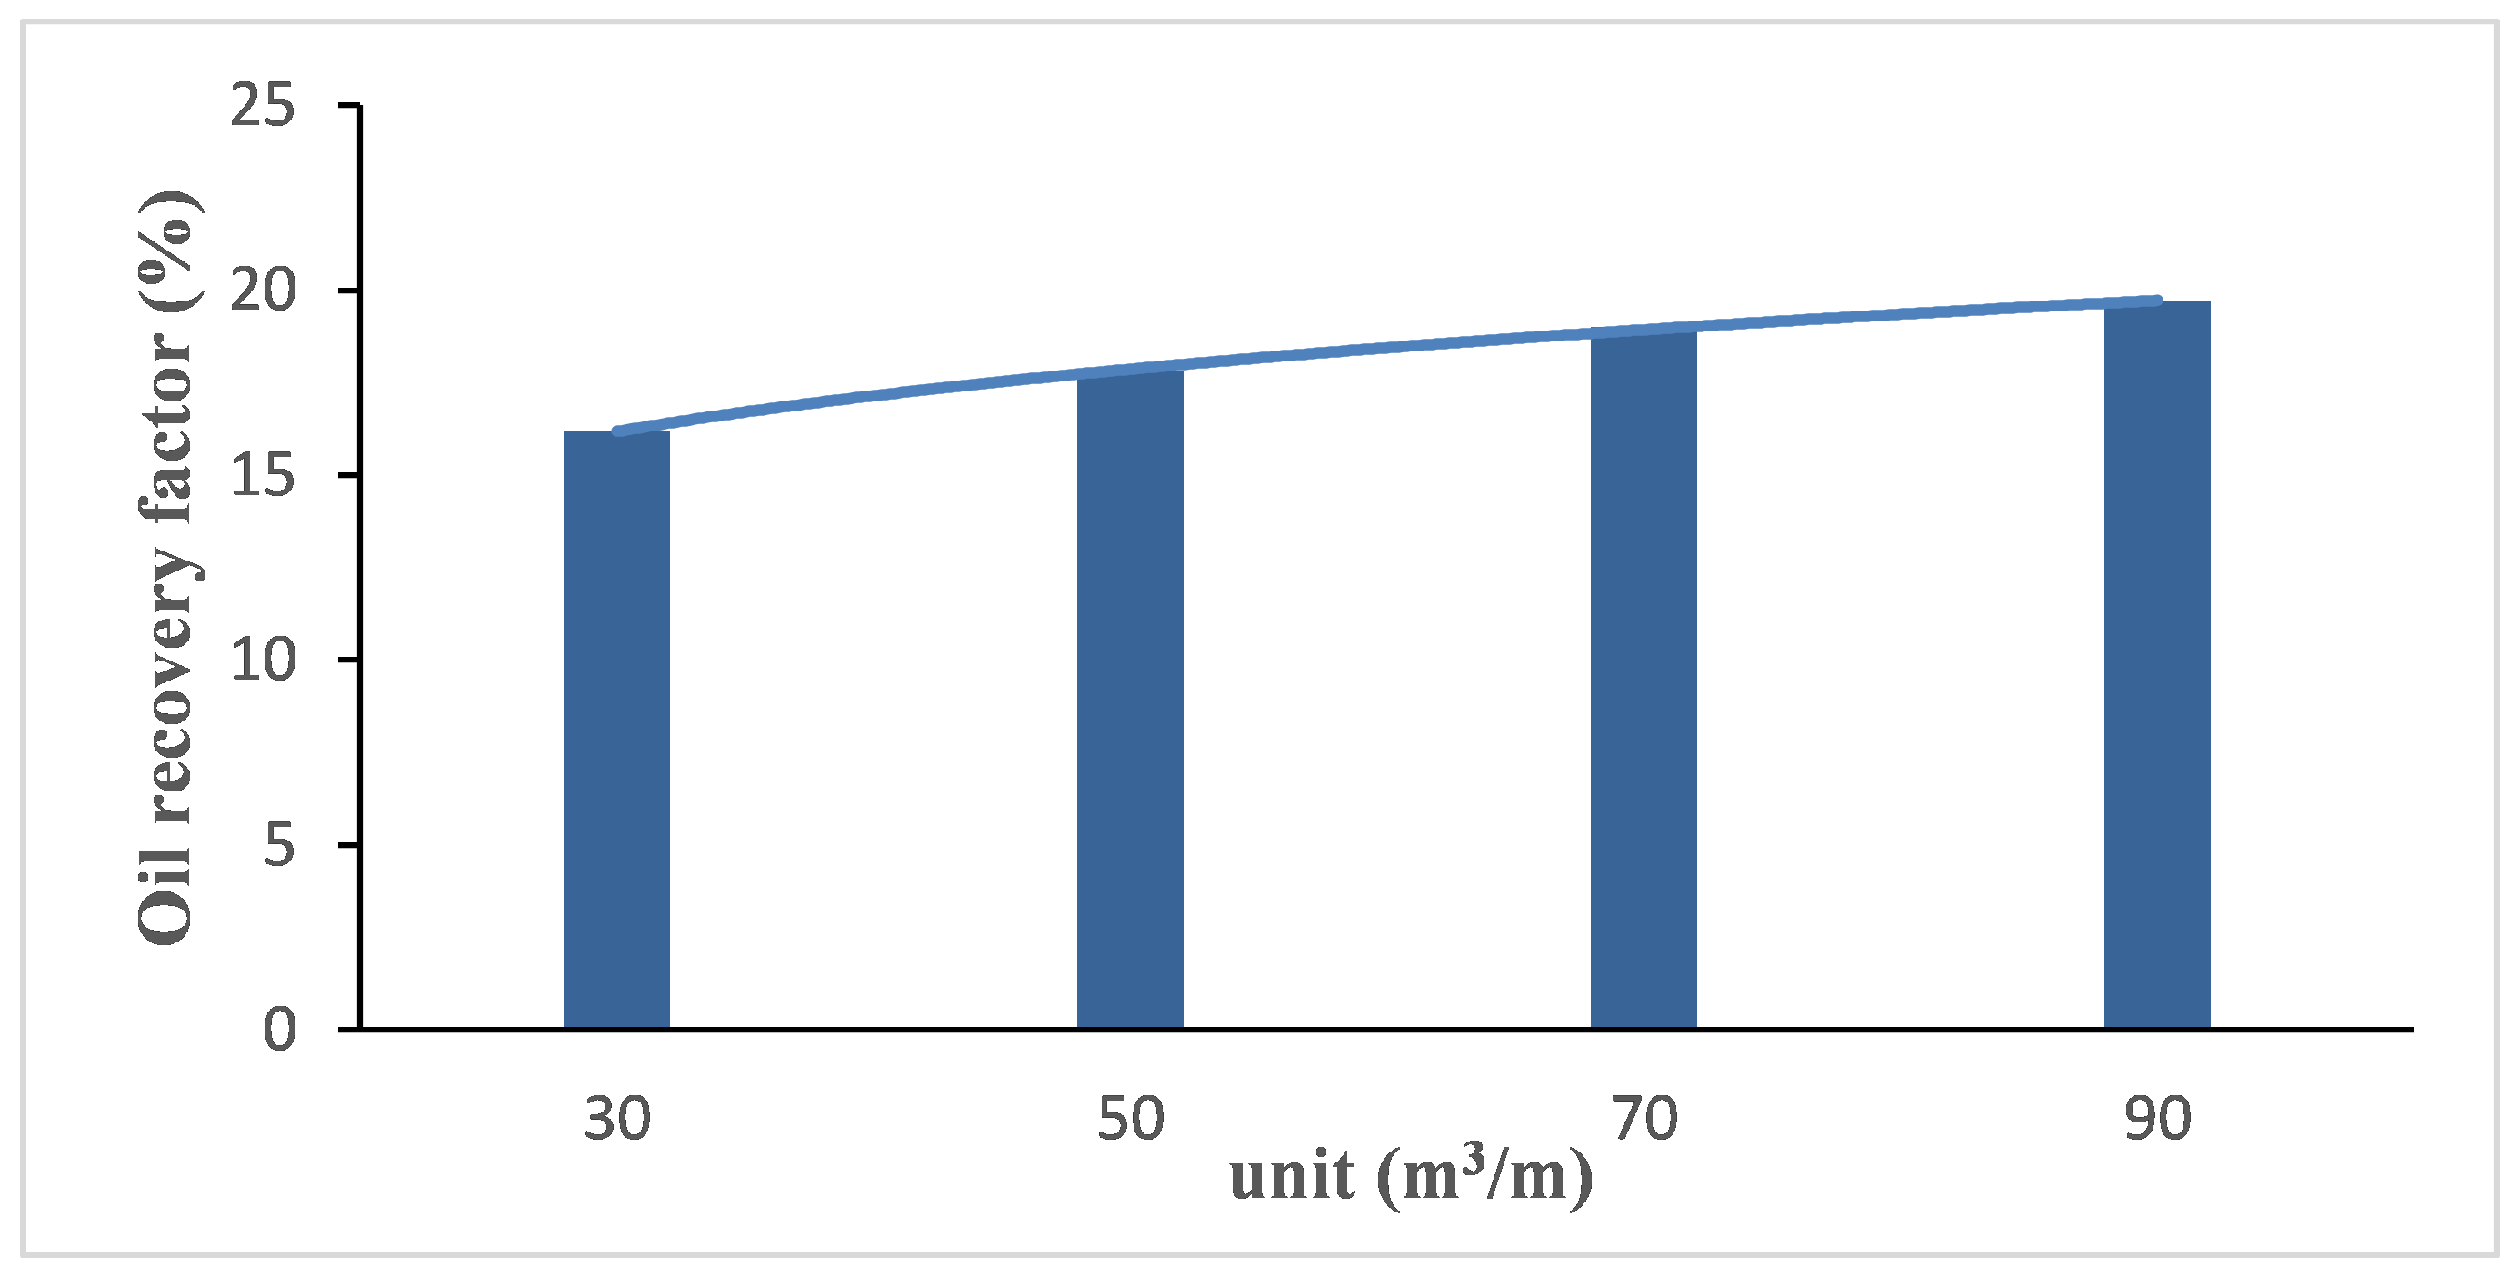
When solvent is used to reduce oil viscosity without heating the reservoir, the consumption of solvent increases. The solvent index doubled the viscosity of crude oil, and the injection concentration of ES-SAGD solvent was 2∼5% of that of steam. Figure 15 displays the huff-n-puff oil recoveries under different solvent slug volumes.
As can be seen from Figure 15, the huff-n-puff effects of the horizontal segment were compared with the solvent volumes of 30 m 3 , 50 m 3 , 70 m 3 and 90 m 3 , respectively. The results show that when the solvent volumes were higher than 70 m 3 , the oil production decreased.

3.4.3. Cyclic N 2 Injection Volume

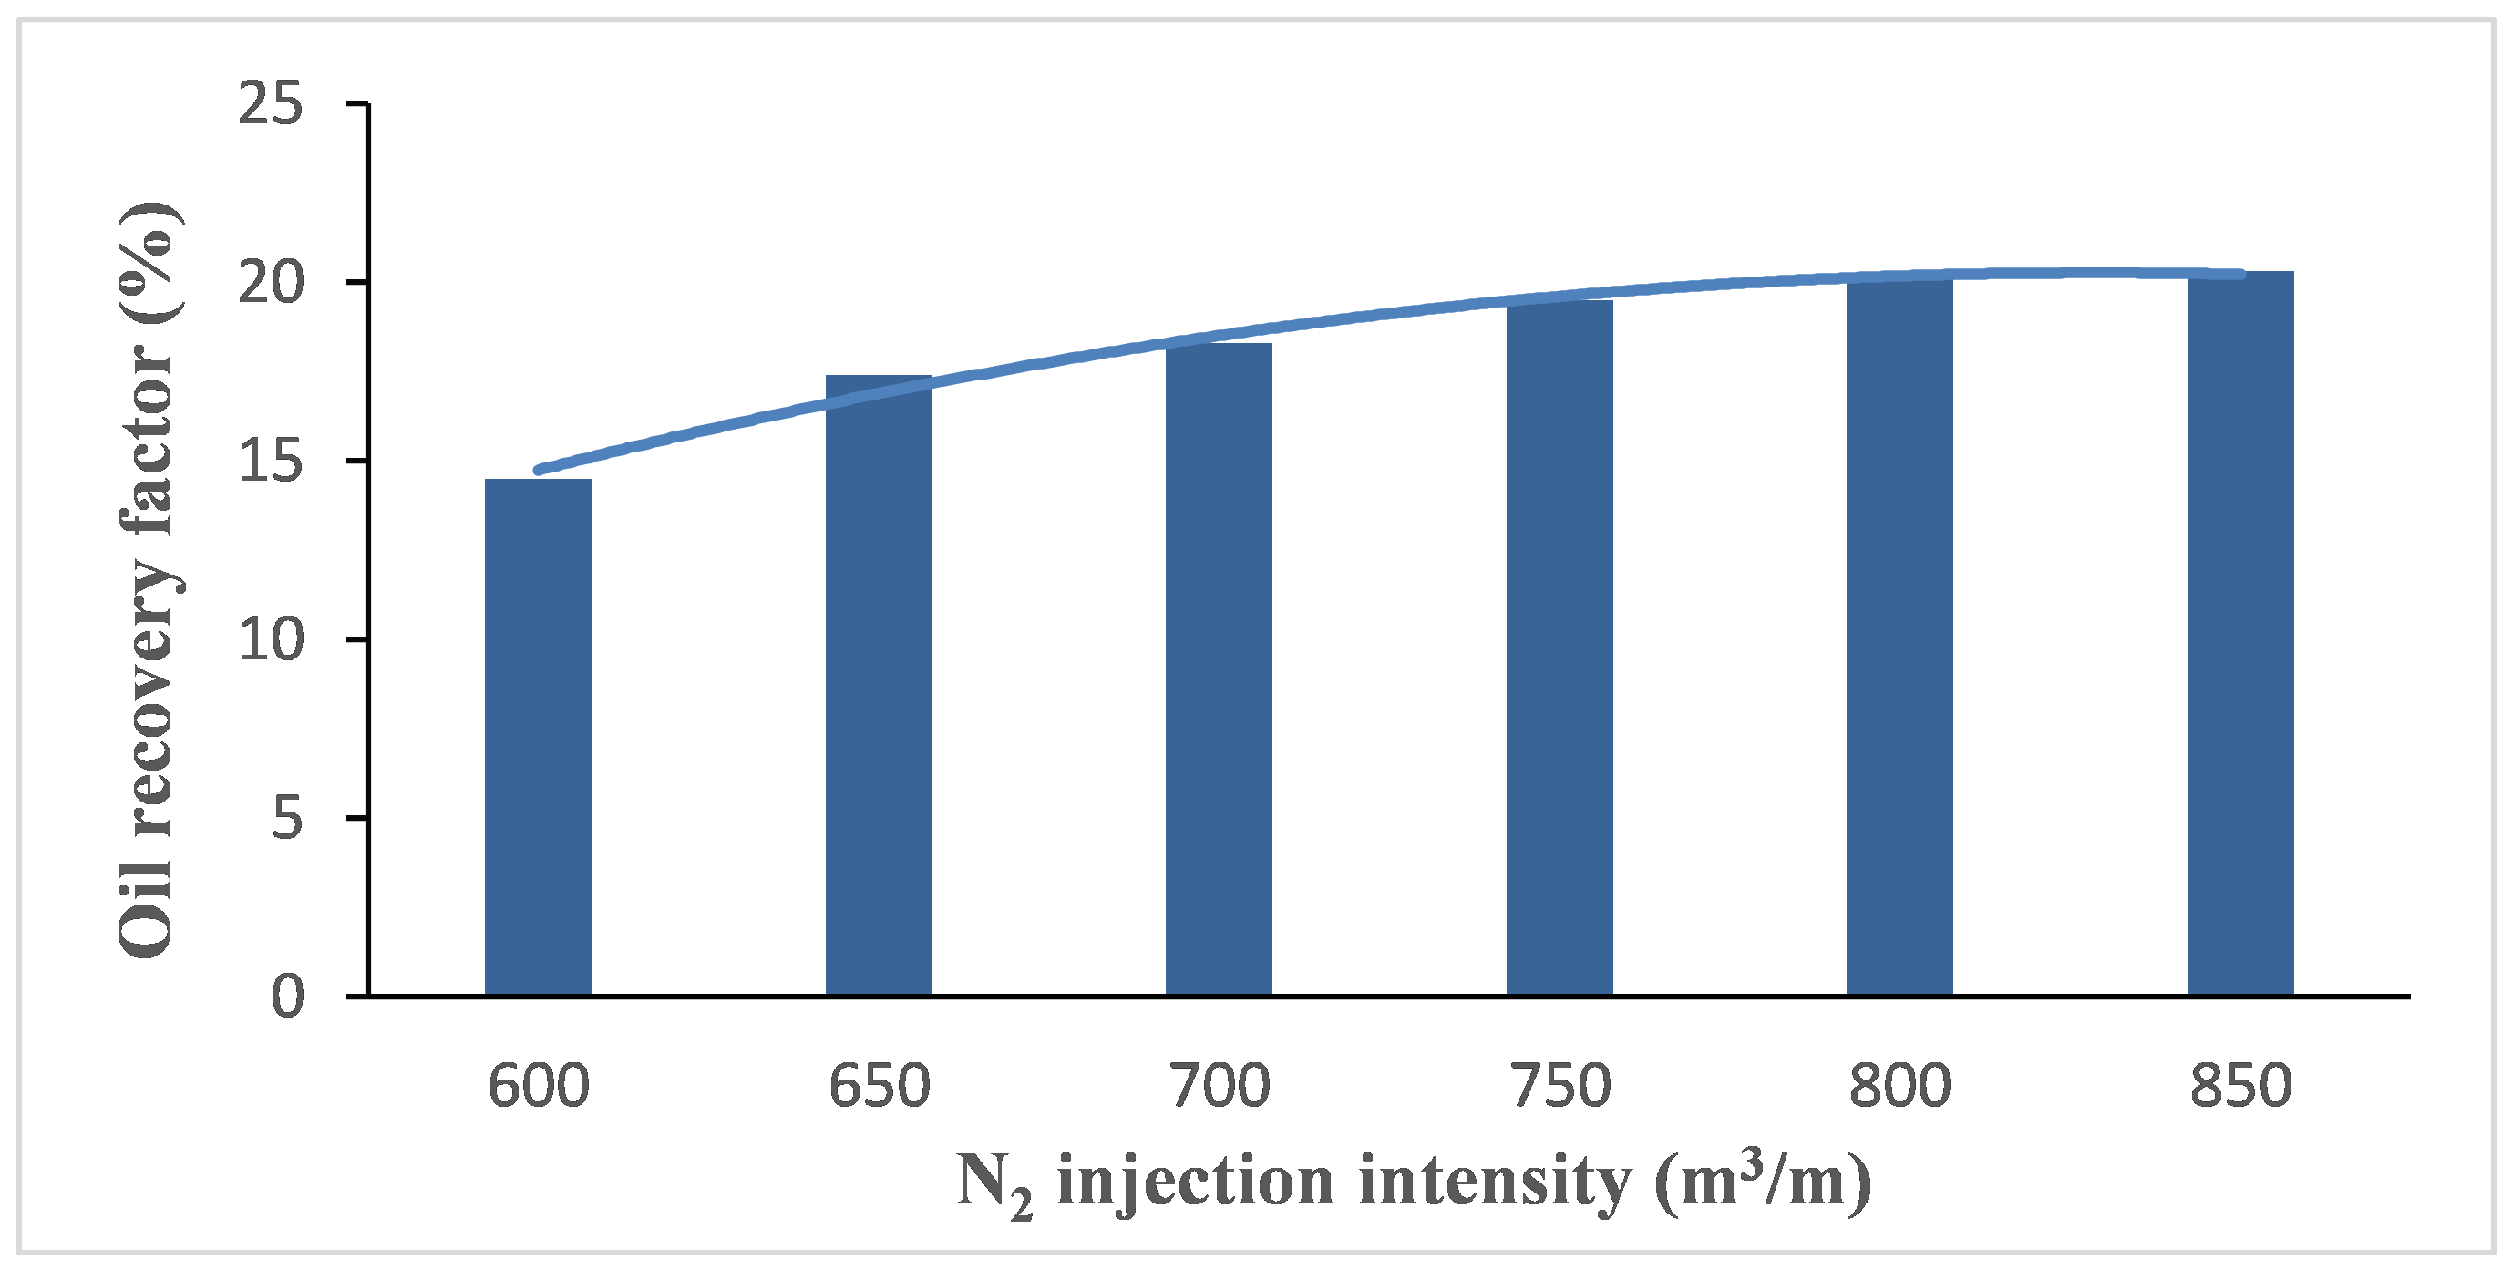
Figure 16 shows the comparison of huff-n-puff under different N 2 intensities. According to simulation and comparison, the larger the N 2 injection volume, the larger the affected area, and the better the production effect. When the injection volume reaches more than 750 m 3 /m, the oil increase decreases significantly.
When the reservoir permeability is low, the injection volume in the first cycle is relatively small, and the N 2 injection volume in the first cycle reaches 750 m 3 /m. Increasing the volume of N 2 injection in subsequent cycles is conducive to expanding the range of action of N 2 , which can enter deep reservoirs for further oil viscosity reduction and crude oil recovery.
Figure 17 displays the comparison of oil recoveries under increasing volumes of N 2 injection. When the increase ratio of 2∼4 cycles is 6.0∼10%, the oil production increase is obvious, and the increase decreases after reaching 10%.
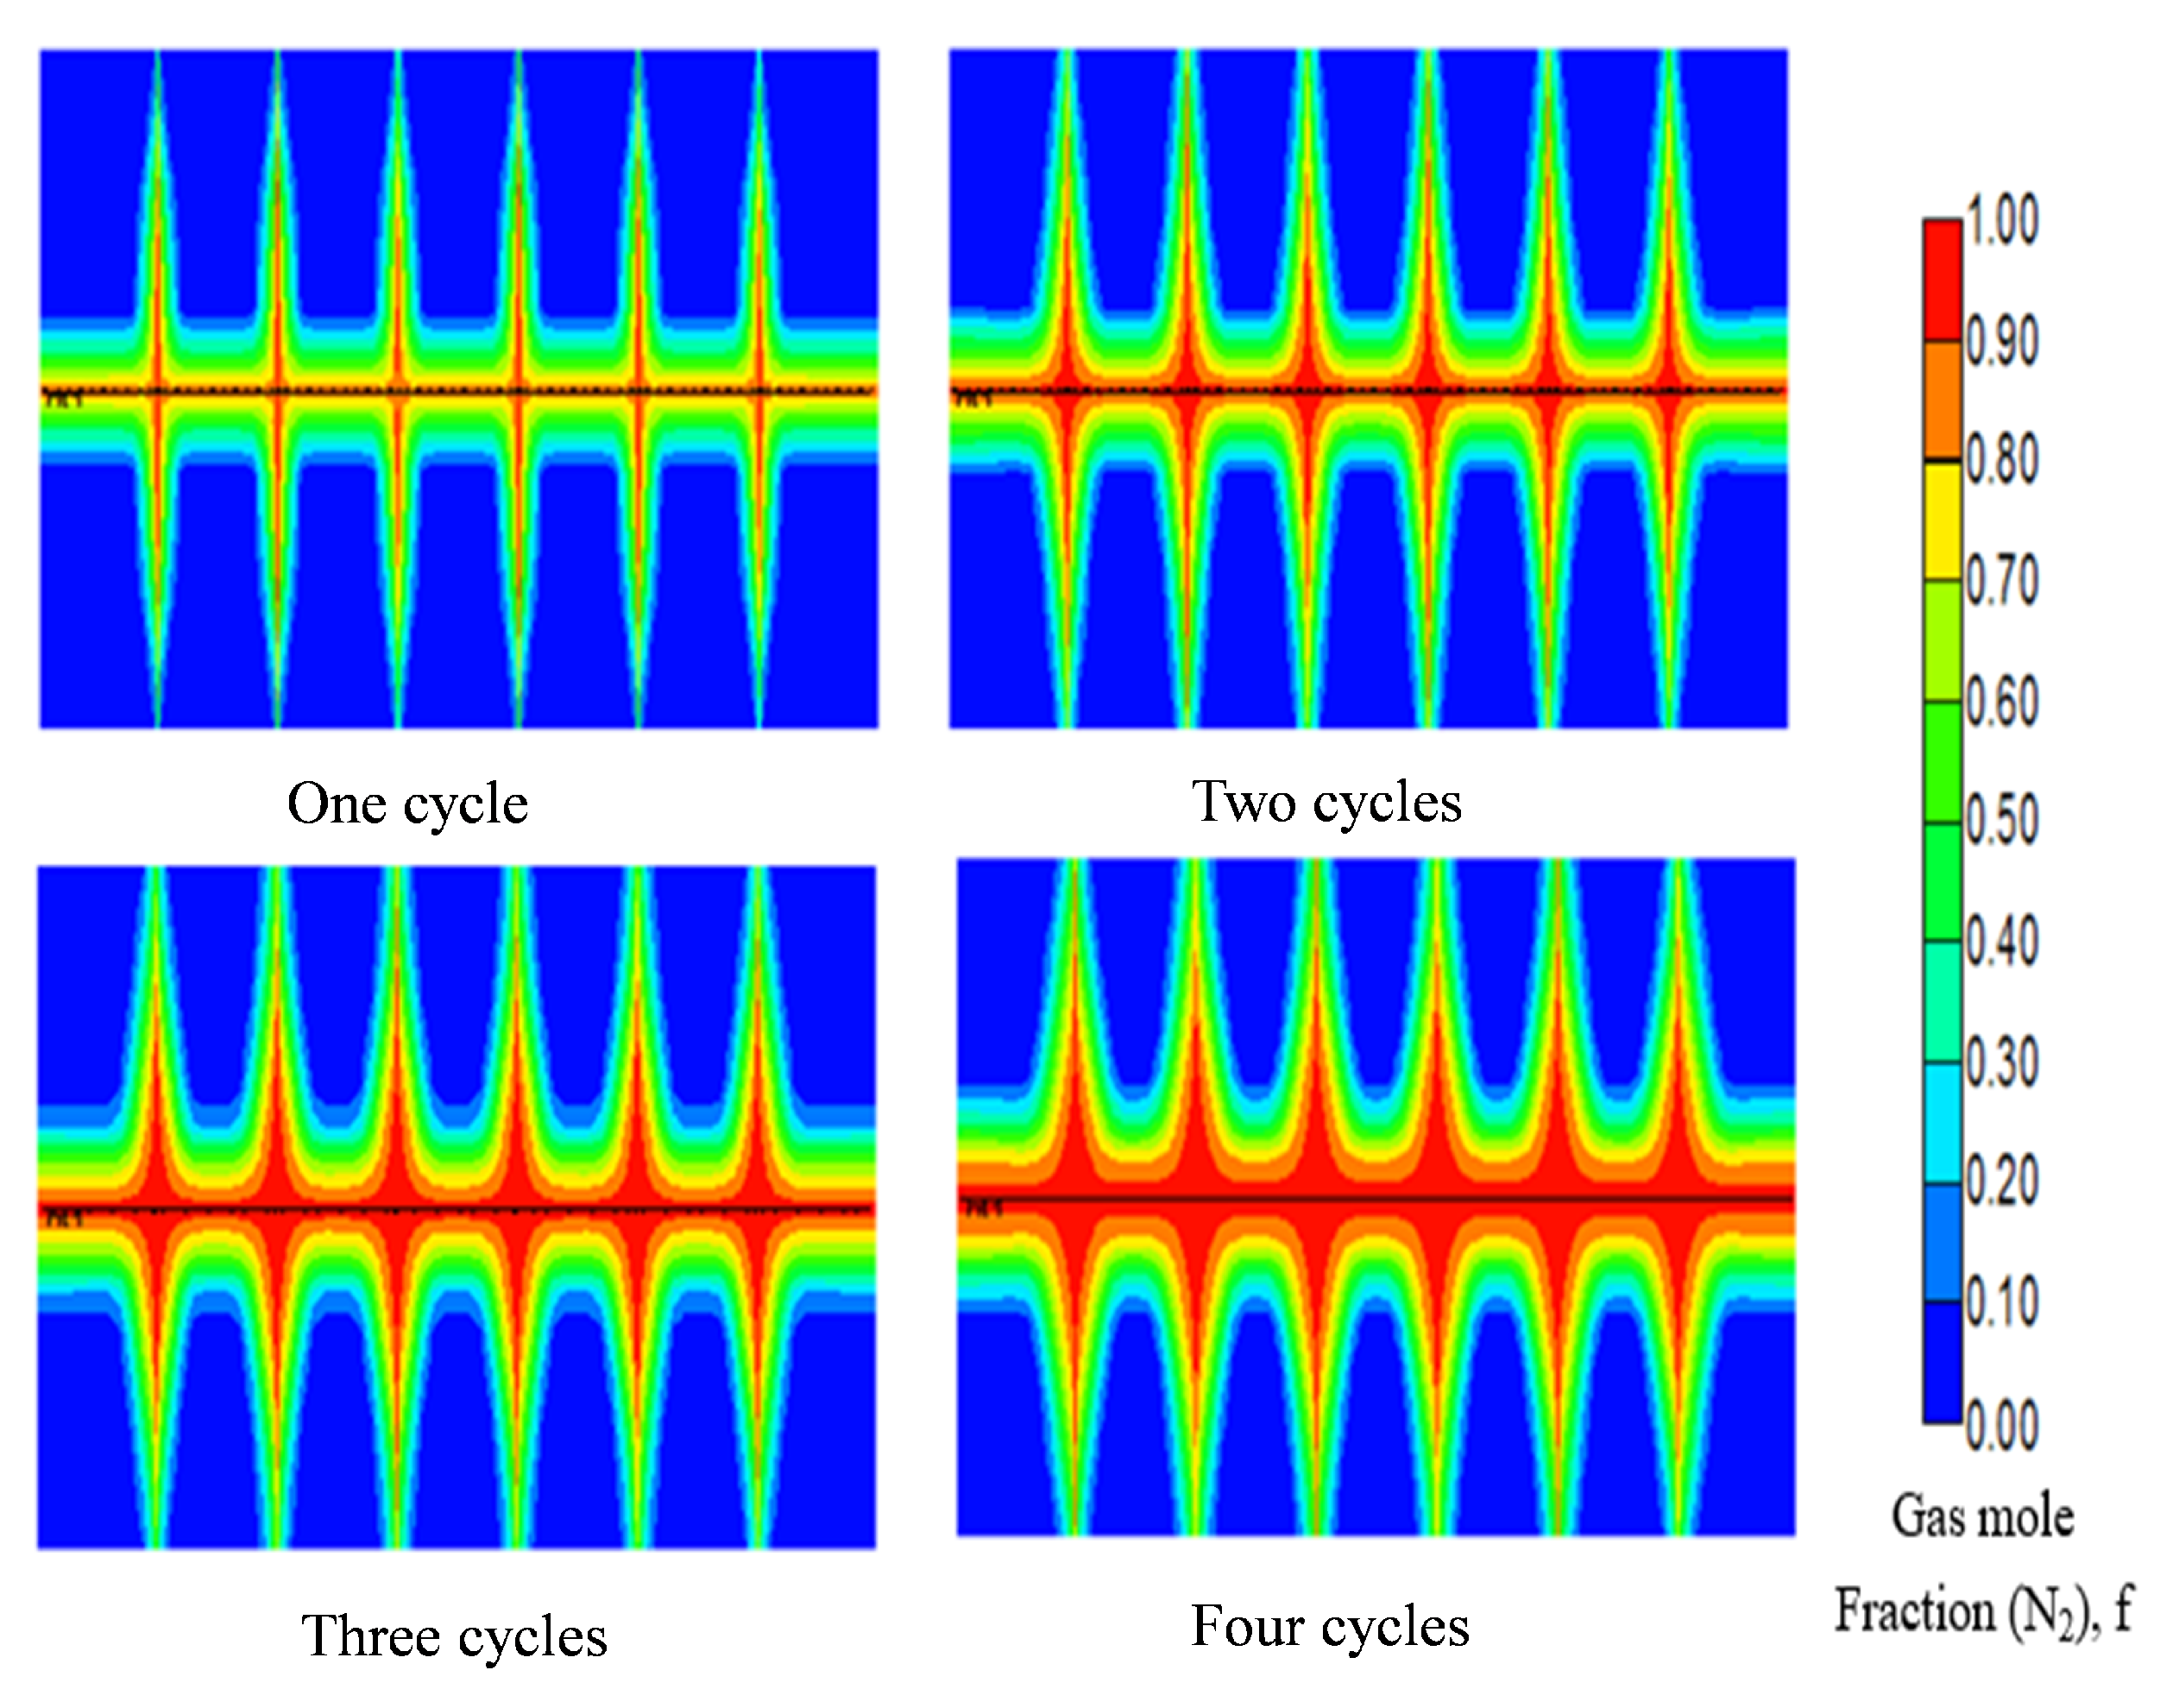
Figure 18 displays the distribution range of N 2 in different periods (mole fraction, increment 10%). The volume of N 2 injected in cycles 2 to 4 increased by 10%, and the volume of N 2 injected in subsequent cycles was maintained.
According to the above increase, the N 2 injection volume per meter in the first cycle was 750 Nm 3 /m, and the N 2 injection volumes in the second through fourth cycles were 825 Nm 3 /m, 908 Nm 3 /m, and 998 Nm 3 /m.

3.4.4. Fluid Concentration of N 2 Foam

Figure 19 shows the comparison of huff-n-puff oil recoveries under different foaming agent concentrations. By comparing the oil recovery rate at different foaming agent concentrations, the higher concentration of foaming agent is more beneficial to the effect of foam flooding.
According to the foaming effect of the model experiment, the foaming volume and half-life can be increased by using a high concentration of foaming agent. The numerical simulation results are the same as the experimental results. Considering the formation adsorption and the cost of the foam system, the foam concentration is 3.0∼4.0% in the early stage of 1∼three cycles, 2.0∼3.0% in the middle stage of 4∼6 cycles, and 1.0∼2.0% in the late stage.

3.4.5. Gas/Liquid Ratio of Huff-N-Puff

Figure 20 shows the comparison of huff-n-puff oil recoveries under different gas/liquid ratios. The numerical simulation results for reservoirs with different gas/liquid ratios show that the production effect decreases when the gas/liquid ratio exceeds 4. In order to achieve a better production effect, the gas/liquid ratio of nitrogen foam should be controlled at about 4.

3.4.6. The Soaking Times of Huff-N-Puff

Figure 21 shows the comparison of huff-n-puff oil recoveries under different soaking times. Extending the soaking time allows the gas to penetrate deeper into the formation and achieve a wider range of sweep and use in the recovery process. However, the simulation results show that the performance of the foam agent deteriorates when the soaking time is long, and the optimal soaking time range is 30∼40 days.

4. Conclusions

In this paper, the mechanism and applicability of CO 2 -energized fracturing technology and N 2 foam huff-n-puff technology in primary production were studied by laboratory experiments and numerical simulation. The research results are as follows:
  • The experimental results show that a high concentration of foaming agent can improve the foaming volume and prolong the half-life in the presence of oil during primary production, and the optimal foaming agent concentration is 3.0∼4.0%.
  • N 2 foam has a selective plugging effect on large pores and can achieve the mobilization of residual oil. However, the change in the injected gas/liquid ratio does not influence the shape of N 2 foam; it only affects the number of bubbles per unit area. The number of bubbles per unit area increases with the increase in gas/liquid ratio, and the optimal gas/liquid ratio is 3.0∼4.0.
  • Numerical simulations show that CO 2 -energized fracturing technology takes into account the advantages of fracturing and oil viscosity reduction, and the recovery factor of post-fracturing primary production can reach approximately 13.7%.
  • N 2 foam huff-n-puff technology is applied to improve the recovery factor in 5∼6 years, and the final recovery factor can reach approximately 35%.
This technology innovates the oil recovery technology of deep heavy oil reservoir, and the research results have important reference significance for the development of similar oil reservoirs. In the following work, we will further study the applicable limits of this technology.

Author Contributions

Conceptualization, P.L. (Pengcheng Liu); methodology, S.S., X.M. and P.L. (Peng Liu); software, X.M. and F.Z.; validation, Y.W. and F.Z.; resources, Y.W.; writing—original draft preparation, S.S.; writing—review and editing, P.L. (Pengcheng Liu) and X.Z.; supervision, P.L. (Peng Liu). All authors have read and agreed to the published version of the manuscript.

Funding

This research was funded by the National Natural Science Foundation of China (51774256).

Institutional Review Board Statement

Not applicable.

Informed Consent Statement

Not applicable.

Data Availability Statement

Not applicable.

Acknowledgments

The authors would like to thank the research team members for their contributions to this work.

Conflicts of Interest

The authors declare no conflict of interest.

References

  1. Yushi, Z.; Shicheng, Z.; Tong, Z.; Xiang, Z.; Tiankui, G. Experimental investigation into hydraulic fracture network propagation in gas shales using ct scanning technology. Rock Mech. Rock Eng. 2016, 49, 33–45. [Google Scholar] [CrossRef]
  2. Yushi, Z.; Xinfang, M.; Shicheng, Z.; Tong, Z.; Han, L. Numerical investigation into the influence of bedding plane on hydraulic fracture network propagation in shale formations. Rock Mech. Rock Eng. 2016, 49, 3597–3614. [Google Scholar] [CrossRef]
  3. Kizaki, A.; Tanaka, H.; Ohashi, K.; Sakaguchi, K.; Matsuki, K. Hydraulic fracturing in inada granite and ogino tuff with super critical carbon dioxide. In Proceedings of the ISRM Regional Symposium-7th, Asian Rock Mechanics Symposium, Seoul, Republic of Korea, 15–19 October 2012. [Google Scholar]
  4. Inui, S.; Ishida, T.; Nagaya, Y.; Nara, Y.; Chen, Q. Ae monitoring of hydraulic fracturing experiments in granite blocks using supercritical CO2, water and viscous oil. In Proceedings of the 48th U.S. Rock Mechanics/Geomechanics Symposium, Minneapolis, MI, USA, 1–4 June 2014. [Google Scholar]
  5. Heng, S.; Yang, C.; Wang, L.; Daemen, J. Experimental study on the hydraulic fracture propagation in shale. Curr. Sci. 2018, 115, 465–475. [Google Scholar] [CrossRef]
  6. Yang, Y.; Liu, H.; Mao, W.; Song, Z.; Wang, H. Study on the impact pressure of swirling-round supercritical CO2 jet flow and its influencing factors. Energies 2020, 14, 106. [Google Scholar] [CrossRef]
  7. Phillips, A.M.; Couchman, D.D.; Wilke, J.G. Successful field application of high-temperature rheology of CO2 foam fracturing fluids. In Proceedings of the SPE/DOE Joint Symposium on Low Permeability Reservoirs, Denver, CO, USA, 18 May 1987. [Google Scholar]
  8. Liu, H.; Feng, W.; Zhang, J.; Meng, S.; Duan, Y. Fracturing with carbon dioxide:application status and development trend. Pet. Explor. Dev. 2014, 41, 466–472. [Google Scholar] [CrossRef]
  9. Greenhorn, R.C.; Li, E. Investigation of high phase volume liquid CO2 fracturing fluids. J. Can. Pet. Technol. 1985, 2, 20. [Google Scholar]
  10. Ribeiro, L.H.; Li, H.; Bryant, J.E. Use of a CO2-hybrid fracturing design to enhance production from unpropped-fracture networks. SPE Prod. Oper. 2017, 1, 28–40. [Google Scholar] [CrossRef]
  11. Li, S.; Zhang, S.; Zou, Y.; Zhang, X.; Liu, C. Experimental study on the feasibility of supercritical CO2-gel fracturing for stimulating shale oil reservoirs. Eng. Fract. Mech. 2020, 238, 107276. [Google Scholar] [CrossRef]
  12. Li, S.; Zhang, S.; Ma, X.; Zou, Y.; Li, N.; Wu, S.; Zhang, Z. Coupled physical–chemical effects of CO2 on rock properties and breakdown during intermittent CO2 -hybrid fracturing. Rock Mech. Rock Eng. 2020, 53, 1665–1683. [Google Scholar] [CrossRef]
  13. Li, S.; Zhang, S.; Zou, Y.; Ma, X.; Kasperczyk, D. Pore structure alteration induced by CO2–brine–rock interaction during CO2 energetic fracturing in tight oil reservoirs. J. Pet. Sci. Eng. 2020, 191, 107147. [Google Scholar] [CrossRef]
  14. Lillies, A.; King, S. Sand fracturing with liquid carbon dioxide. In Proceedings of the SPE Production Technology Symposium, Hobbs, Mexico, 8–9 November 1982. [Google Scholar]
  15. Hawthorne, S.B.; Gorecki, C.D.; Sorensen, J.A.; Miller, D.J.; Harju, J.A.; Melzer, L.S. Hydrocarbon mobilization mechanisms using CO2 in an unconventional oil play. Energy Procedia 2014, 63, 7717–7723. [Google Scholar] [CrossRef]
  16. Li, S.; Zhang, S.; Ma, X.; Zou, Y.; Li, N.; Chen, M.; Cao, T.; Bo, Z. Hydraulic fractures induced by water-/carbon dioxide-based fluids in tight sandstones. Rock Mech. Rock Eng. 2019, 52, 33223–35540. [Google Scholar] [CrossRef]
  17. Ishida, T. Acoustic emission monitoring of hydraulic fracturing laboratory experiment with supercritical and liquid CO2. Geophys. Res. Lett. 2012, 39, 16. [Google Scholar] [CrossRef] [Green Version]
  18. Wang, C.; Liu, P.; Wang, F.; Atadurdyyev, B.; Ovluyagulyyev, M. Experimental study on effects of CO2 and improving oil recovery for CO2 assisted sagd in super-heavy-oil reservoirs. J. Pet. Sci. Eng. 2018, 165, 1073–1080. [Google Scholar] [CrossRef]
  19. Zou, Y.; Li, N.; Ma, X.; Zhang, S.; Li, S. Experimental study on the growth behavior of supercritical CO2 -induced fractures in a layered tight sandstone formation. J. Nat. Gas Sci. Eng. 2018, 49, 145–156. [Google Scholar] [CrossRef]
  20. Liu, B.; Wang, Y.; Liang, L. Preparation and performance of supercritical carbon dioxide thickener. Polymers 2021, 13, 78. [Google Scholar] [CrossRef]
  21. Li, Q.; Wang, F.; Forson, K.; Zhang, J.; Zhang, C.; Chen, J.; Xu, N.; Wang, Y. Affecting analysis of the rheological characteristic and reservoir damage of CO2 fracturing fluid in low permeability shale reservoir. Environ. Sci. Pollut. Res. 2021, 13, 78. [Google Scholar] [CrossRef]
  22. Trickett, K.; Xing, D.; Enick, R.; Eastoe, J.; Hollamby, M.J.; Mutch, K.J.; Rogers, S.E.; Heenan, R.K.; Steytler, D.C. Rod-like micelles thicken CO2. Langmuir ACS J. Surf. Colloids 2010, 1, 83–88. [Google Scholar] [CrossRef]
  23. Chiu, K.; Thakur, S.C. Modeling of wellbore heat losses in directional wells under changing injection conditions. In Proceedings of the SPE Annual Technical Conference and Exhibition, Dallas, TX, USA, 6–9 October 1991. [Google Scholar]
  24. Ramey, H.J. Wellbore heat transmission. J. Pet. Technol. 1962, 14, 427–435. [Google Scholar] [CrossRef]
  25. Griston, S.; Willhite, G.P. Numerical model for evaluating concentric steam injection wells. In Proceedings of the SPE Western Regional Meeting, Ventura, CA, USA, 8–10 April 1987. [Google Scholar]
  26. Hasan, R.A.; Kabir, C.S. Aspects of wellbore heat transfer during two-phase flow. SPE Prod. Facil. 1994, 9, 211–216. [Google Scholar] [CrossRef]
  27. Salehi, M.M.; Safarzadeh, M.A.; Sahraei, E.; Nejad, S. Comparison of oil removal in surfactant alternating gas with water alternating gas, water flooding and gas flooding in secondary oil recovery process. J. Pet. Sci. Eng. 2014, 120, 86–93. [Google Scholar] [CrossRef] [PubMed]
  28. Qu, M.; Liang, T.; Hou, J. Study on Fluid Behaviors of Foam-Assisted Nitrogen Flooding on a Three-Dimensional Visualized Fracture–Vuggy Model. Appl. Sci. 2021, 11, 11082. [Google Scholar] [CrossRef]
  29. Liu, Q.; Liu, S.; Luo, D.; Peng, B. Ultra-low interfacial tension foam system for enhanced oil recovery. Appl. Sci. 2019, 9, 2155. [Google Scholar] [CrossRef] [Green Version]
  30. Wu, W.; Pan, J.; Guo, M. Mechanisms of oil displacement by asp-foam and its influencing factors. Pet. Sci. 2010, 1, 100–105. [Google Scholar] [CrossRef] [Green Version]
  31. Farajzadeh, R.; Andrianov, A.; Zitha, P. Investigation of immiscible and miscible foam for enhancing oil recovery. Pindustrial Eng. Chem. Res. 2010, 49, 1910–1919. [Google Scholar] [CrossRef]
  32. Ashoori, E. Fractional-flow theory of foam displacements with oil. SPE J. 2010, 15, 260–273. [Google Scholar] [CrossRef]
  33. Rossen, W.R.; Zeilinger, S.C.; Shi, J.; Lim, M.T. Mechanistic simulation of foam processes in porous media. In Proceedings of the SPE Annual Technical Conference and Exhibition, New Orleans, LA, USA, 25–28 September 1994. [Google Scholar]
  34. Di, M.; Yu, J.; Ning, L.; Lee, R. The Application of Nanoparticle-Stabilized CO Foam for Oil Recovery. In Proceedings of the SPE International Conference on Oilfield Chemistry, The Woodlands, TX, USA, 8–10 April 2013. [Google Scholar]
  35. Lin, Z.; Li, A.; Kai, C.; Tang, J.; Fu, S. Development and evaluation of foaming agents for high salinity tolerance. J. Daqing Pet. Inst. 2012, 81, 18–23. [Google Scholar]
  36. Lin, Y.; Yang, G. A successful pilot application for N2 foam flooding in liaohe oilfield. In Proceedings of the SPE Asia Pacific Oil & Gas Conference and Exhibition, Adelaide, Australia, 13 September 2006. [Google Scholar]
  37. Liu, R.; Liu, H.; Li, X.; Fan, Z. The reservoir suitability studies of nitrogen foam flooding in shengli oilfield. In Proceedings of the SPE Asia Pacific Oil and Gas Conference and Exhibition, Perth, Australia, 20–22 October 2008. [Google Scholar]
  38. Ma, K.; Jia, X.; Yang, J.; Liu, Y.; Liu, Z. Nitrogen Foam Flooding Pilot Test for Controlling Water Cut and Enhance Oil Recovery in Conventional Heavy Oil Reservoirs of China Offshore Oilfield. In Proceedings of the SPE Asia Pacific Oil and Gas Conference and Exhibition, Jakarta, Indonesia, 22–24 October 2013. [Google Scholar]
  39. Zhang, Y.; Xu, G.; Bo, H.; Li, X. Foam flooding technology used for enhanced oil recovery in offshore oilfields of china’s bohai bay. In Proceedings of the Twenty-fourth International Ocean and Polar Engineering Conference, Busan, Republic of Korea, 15–20 June 2014. [Google Scholar]
  40. Zanganeh, M.N.; Kam, S.I.; Laforce, T.C.; Rossen, W.R. The method of characteristics applied to oil displacement by foam. SPE J. 2011, 16, 8–23. [Google Scholar] [CrossRef]
  41. Kermani, M.B.; Morshed, A. Carbon dioxide corrosion in oil and gas productiona compendium. Corrosion 2003, 59, 659–683. [Google Scholar] [CrossRef]
  42. Nesic, S.; Pots, B.; Postlethwaite, J.; Thevenot, N. Superposition of diffusion and chemical reaction limiting currents—application to CO2 corrosion. J. Corros. Sci. Eng. 1996, 1, 3. [Google Scholar]
  43. Lopez, D.; Schreiner, W.; Sanchez, S.D.; Simison, S. The influence of inhibitors molecular structure and steel microstructure on corrosion layers in CO2 corrosion: An xps and sem characterization. Appl. Surf. Sci. 2004, 236, 77–97. [Google Scholar] [CrossRef]
  44. Bertin, H.J.; Apaydin, O.G.; Castanier, L.M.; Kovscek, A.R. Foam flow in heterogeneous porous media: Effect of crossflow. SPE J. 1999, 4, 75–82. [Google Scholar] [CrossRef]
  45. Minssieux, L. Oil displacement by foams in relation to their physical properties in porous media. J. Pet. Technol. 1974, 26, 100–108. [Google Scholar] [CrossRef]
  46. Islam, M.R.; Ali, S. Numerical simulation of foam flow in porous media. J. Can. Pet. Technol. 1990, 29, 47–51. [Google Scholar] [CrossRef]
  47. Liu, P.; Shi, L.; Liu, P.; Li, L.; Hua, D. Experimental study of high-temperature CO2 foam flooding after hot-water injection in developing heavy oil reservoirs. J. Pet. Sci. Eng. 2019, 185, 106597. [Google Scholar] [CrossRef]
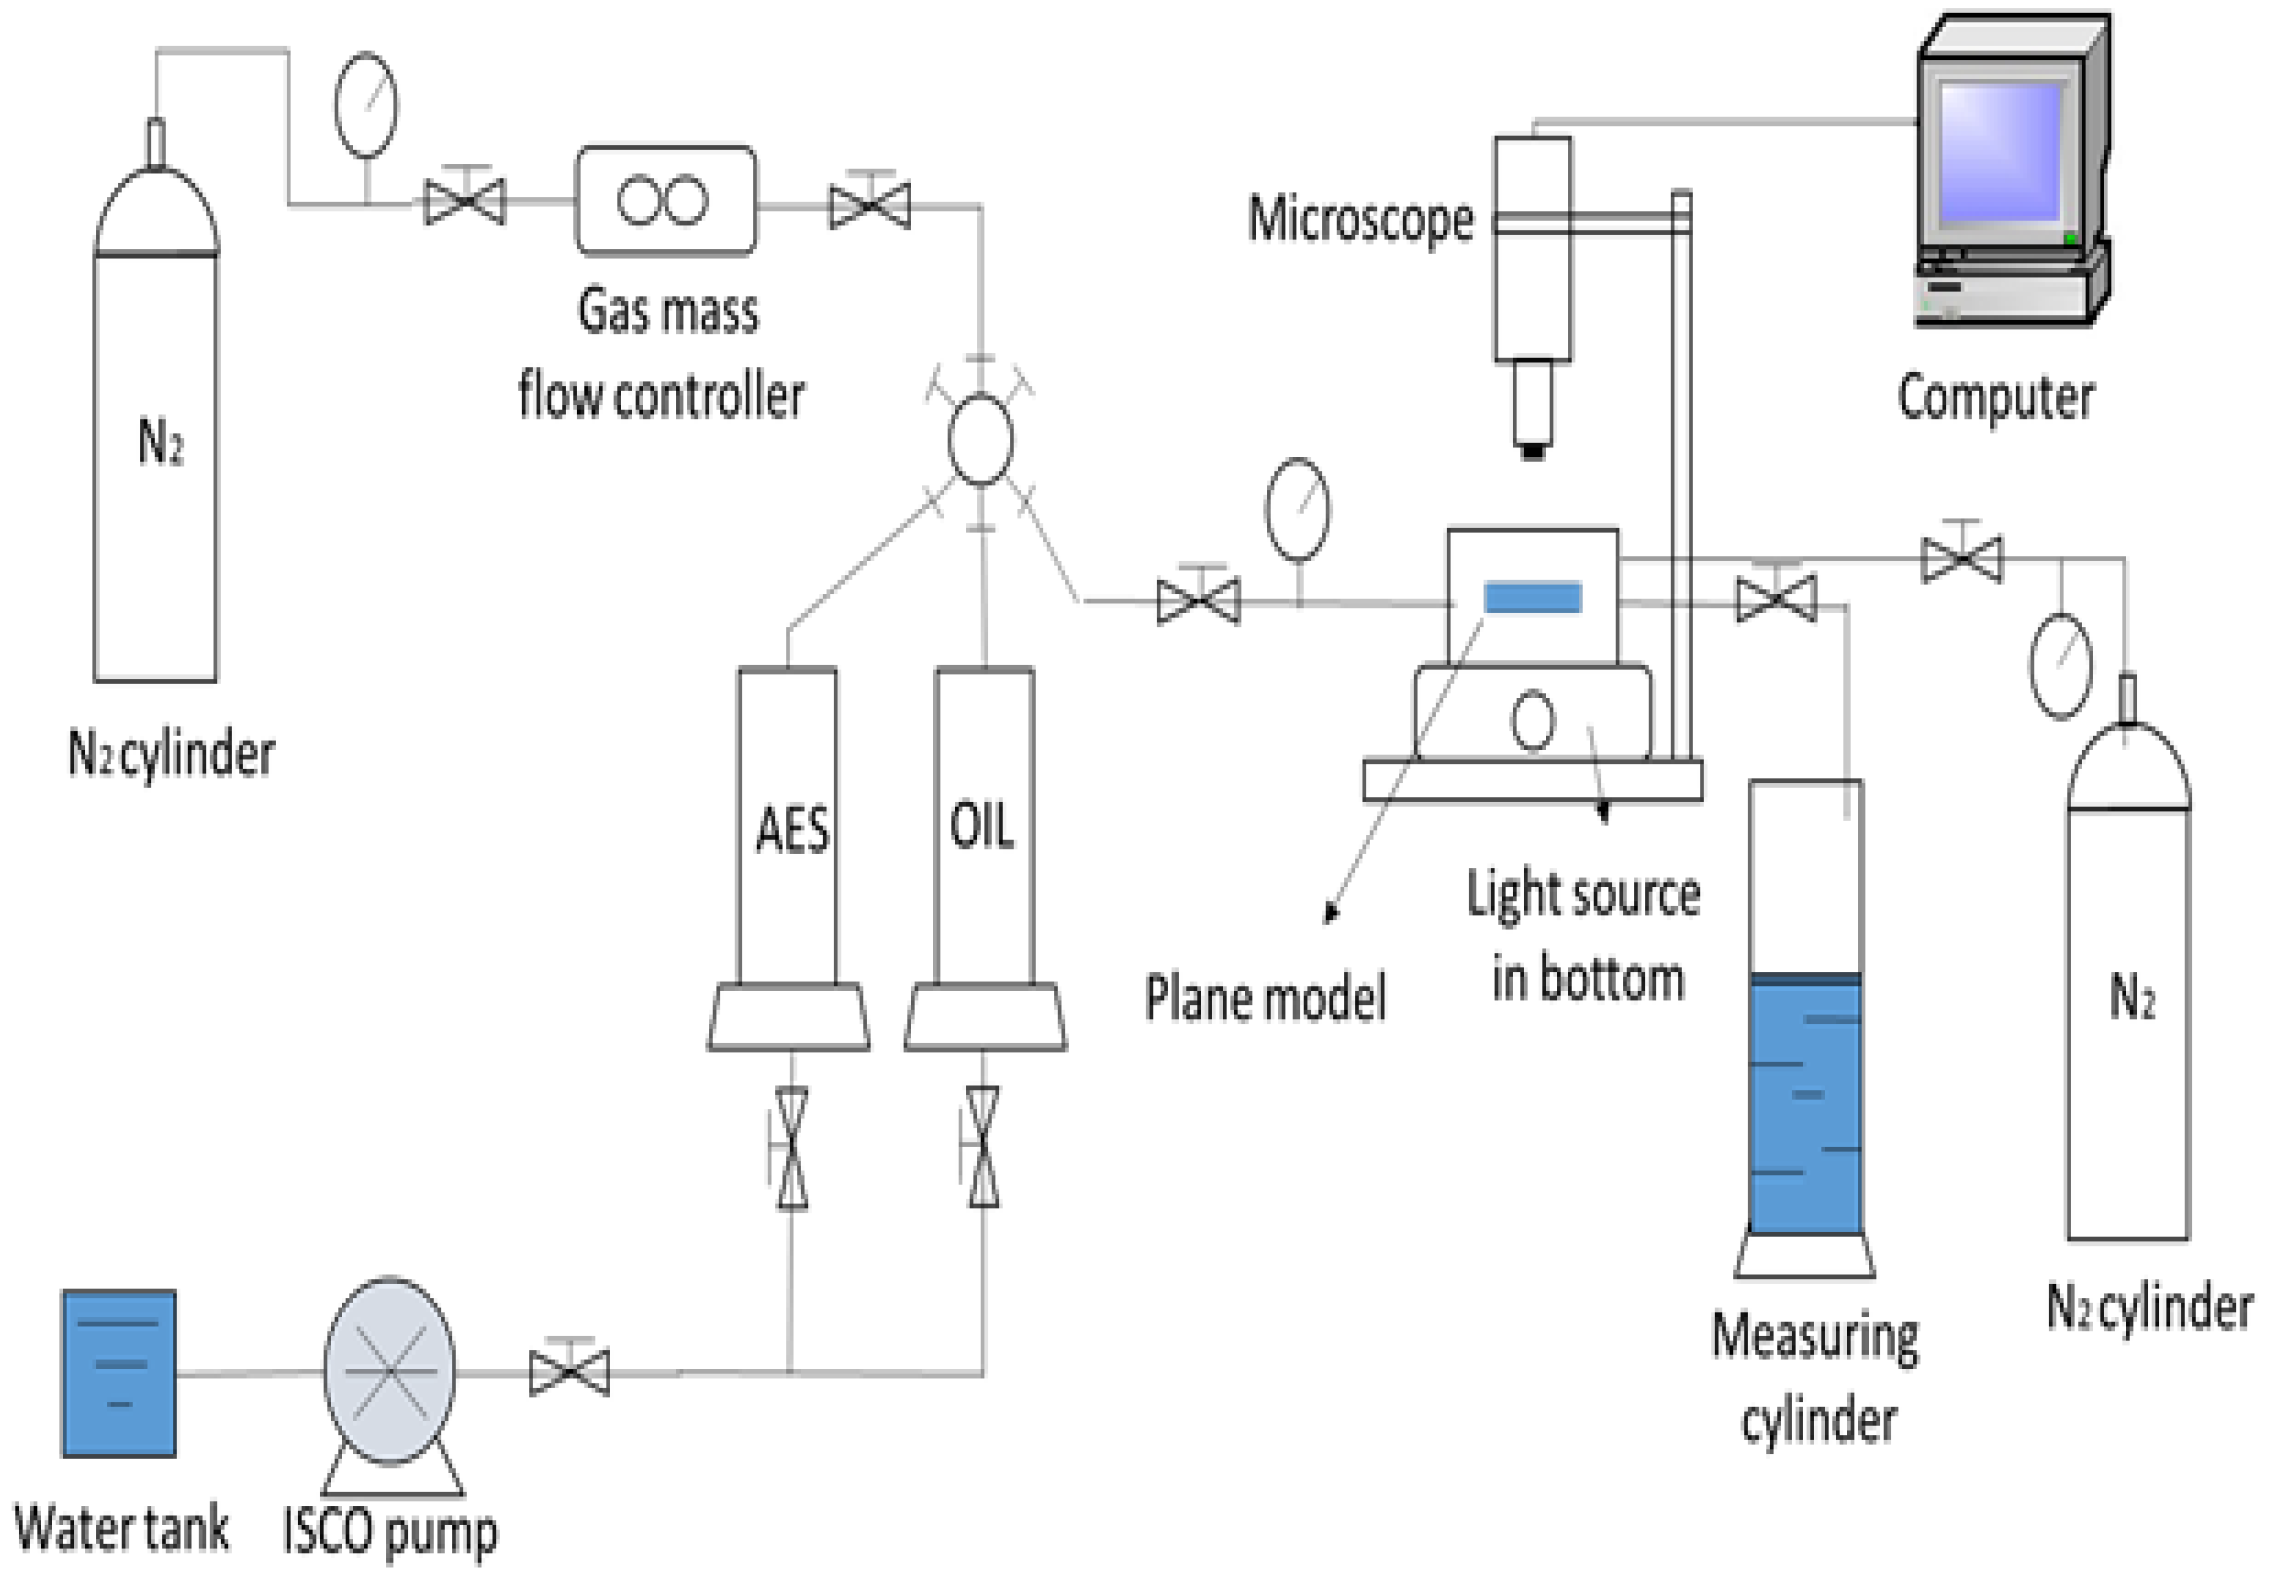
Figure 1. Flow chart of 2D microscopic visualization experiment.
Energies 16 01161 g001
Figure 2. Comparison of foaming height under different foaming agent concentrations (foaming agent and crude oil at a 1:1 ratio).
Energies 16 01161 g002
Figure 3. Foaming volume and half-life of different concentrations of foaming agent.
Energies 16 01161 g003
Figure 4. Foam flow characteristics in porous media with different gas/liquid ratios.
Energies 16 01161 g004
Figure 5. The comparison of oil recoveries under different fracturing techniques.
Energies 16 01161 g005
Figure 6. The comparison of oil recoveries under different segment spacings.
Energies 16 01161 g006
Figure 7. Schematic diagram of the crack action range with different penetration ratios, (a) The penetration ratio is 25% (b) The penetration ratio is 45% (c) The penetration ratio is 50%.
Energies 16 01161 g007
Figure 8. The comparison of oil recoveries under different fracture conductivity.
Energies 16 01161 g008
Figure 9. The comparison of oil recoveries under different CO 2 injection volumes.
Energies 16 01161 g009
Figure 10. The comparison of oil recoveries under different CO 2 injection rates.
Energies 16 01161 g010
Figure 11. The comparison of oil recoveries under different soaking times.
Energies 16 01161 g011
Figure 12. Variation of oil recoveries under different huff-n-puff timings.
Energies 16 01161 g012
Figure 13. Solvent distribution field at different timings (mole fraction).
Energies 16 01161 g013
Figure 14. Variation in characteristics of crude oil viscosity at different timing.
Energies 16 01161 g014
Figure 15. The huff-n-puff oil recoveries under different solvent slug volumes.
Energies 16 01161 g015
Figure 16. The comparison of huff-n-puff under different N 2 intensities.
Energies 16 01161 g016
Figure 17. The comparison of oil recoveries under increasing volumes of N 2 injection.
Energies 16 01161 g017
Figure 18. Distribution range of N 2 in different periods (mole fraction, increment 10%).
Energies 16 01161 g018
Figure 19. The comparison of huff-n-puff oil recoveries under different foaming agent concentrations.
Energies 16 01161 g019
Figure 20. The comparison of huff-n-puff oil recoveries under different gas/liquid ratios.
Energies 16 01161 g020
Figure 21. The comparison of huff-n-puff oil recoveries under different soaking time.
Energies 16 01161 g021
Table 1. Original reservoir parameters.
ItemValueItemValue
Reservoir buried depth (m)1257.0Formation dip angle (°)16.5
Thickness (m)12.9Porosity (%)21.1
Formation temperature (°C)35.4Oil saturation (%)56.9
Oil viscosity (mPa·s)102.3Permeability (mD)20.6
Oil density (g/cm 3 )0.833Rock compressibility (1/MPa)2.2
Disclaimer/Publisher’s Note: The statements, opinions and data contained in all publications are solely those of the individual author(s) and contributor(s) and not of MDPI and/or the editor(s). MDPI and/or the editor(s) disclaim responsibility for any injury to people or property resulting from any ideas, methods, instructions or products referred to in the content.