Article

Towards GreenPLM—Key Sustainable Indicators Selection and Assessment Method Development

1
Department of Laser Technologies, Automation and Production Management, Wroclaw University of Science and Technology, 50-370 Wrocław, Poland
2
Transition Technologies PSC S.A., 90-361 Łódź, Poland
*
Author to whom correspondence should be addressed.
Energies 2023, 16(3), 1137; https://doi.org/10.3390/en16031137
Submission received: 8 December 2022 / Revised: 9 January 2023 / Accepted: 17 January 2023 / Published: 19 January 2023
(This article belongs to the Special Issue Sustainable Development: Policies, Challenges, and Further)

Abstract

:
Regulations, depletion of natural resources and changing customer demands are putting pressure on manufacturing companies to consider environmental issues in the development of new products. Companies are using PLM systems to manage the product lifecycle, but the current generation of these systems is not adequately adapted to product sustainability issues. The research results presented in this article are intended to support two target groups: academia and industry. The main scientific objective is to provide a systematic method for selecting and evaluating sustainability indicators related to the various phases of automotive lifecycle management. The main application goal is to support the industry in its pursuit of greener development by identifying which sustainability indicators are relevant to each phase of the product lifecycle. As a result, the key green indicators related to the automotive industry in line with the GreenPLM concept are identified together with their assignment to the elements of the car’s beginning-of-life stages, as well as their potential data sources. This paper introduces the concept of GreenPLM and its future application possibilities.

1. Introduction

1.1. Sustainability Background

The interest in sustainability has grown significantly among academics and professionals over the last 20 years. The term was used by the World United Nations Commission on Environment and Development, which defined sustainable development as “meeting the needs of the present without compromising the ability of future generations to meet their own needs” [1]. In 1997, Elkington defined “sustainability” as “the attempt by firms to balance social, economic, and environmental goals” [2].
In 2016, Upward and Jones defined a sustainable firm as “an organization that creates positive environmental, social, and economic value throughout its value network, thereby sustaining the possibility that human and other life can flourish on this planet forever. Such a firm would not only do no harm, it would also create social benefit while regenerating the environment to be financially viable” [3]. The term “sustainability” clearly covers three interconnected “pillars”, encompassing economic, social, and environmental (or ecological) factors or “goals” [4,5].
The environmental dimension includes “the set of objectives, plans and mechanisms that promote greater environmental responsibility and encourage the development and diffusion of environmentally friendly technologies” [5].
The social dimension “refers both to individuals and organizational levels. While concrete material circumstances lie at the basis of the social dimension, the social phenomena themselves are immaterial and therefore difficult to analyze […]; is emerging as the key challenge in sustainable supply chains, due to the fact that companies have to involve a wide range of stakeholders with different goals, demands, and opinions that may interpret the same situation differently” [5].
The basis of the economic dimension is the long-term success and competitiveness of a company. This dimension is “principally quantitative in nature and is focused toward the efficient use of resources and achieving a return on investment” [5].

1.2. Sustainable Industrial Development

Sustainable industrial development has been one of the main issues of interest for all countries since the mid-20th century [6]. Sustainable development has gained popularity and extensively evolved to integrate the supply chain management field. It is sometimes comprehended as “a framework for companies and their management to transform their responsibility for environmental, economical and social behavior into business practices within the legitimacy of our society” [7].
According to Vaz et al., sustainable measures, including corresponding indicators, require certain investments in research and development, as well as a certain time frame until they can be adopted as a new paradigm of production [8]. Javaid et al. underline that “worldwide, manufacturers are pressurized to reduce their environmental effects. It involves learning the incoming requests, identifying and applying environmentally-friendly activities that are most appropriate, and tailoring them to meet the industry needs” [9].
According to Javaid et al., the implementation of new advanced manufacturing technologies that enable the production of parts that can replace complex components saves the use of material and, thus, translates into less use of raw materials (not only for production but also during the use of products, e.g., fuel) [9]. In consequence, manufacturers can become more sustainable by finding ways to use fewer resources [10].
One of the most important elements of the development of any industrial enterprise and maintaining its competitiveness is the introduction of new innovative products to the market. The constantly increasing complexity and the level of technological advancement of modern products—especially in industries such as automotive, aviation, or electronics—significantly increases the requirements for the effectiveness of teams developing and implementing products, processes carried out as part of activities related to their development, and IT systems supporting these processes. In this context, of particular importance is not only the effective, comprehensive management of data but also activities and processes related to product lifecycle management (PLM). The implementation of the PLM paradigm is possible thanks to the appropriate use of a set of technologies supporting the collaborative creation, use, and dissemination of intellectual resources and data related to the product from the moment the idea for the product is created, throughout its existence [11,12].
Sustainable production aims to incorporate the core values of sustainable development into the industrial sector, which will contribute to increasing environmental, social, and economic performances. A key issue in terms of product lifecycle management is related to the measurement of environmental sustainability and ways to improve it.
According to Vila et al., the main aim of sustainable product lifecycle management is to provide products that meet customer needs based on innovation, quality, and a sustainable production system of the company, taking into account all effects of the lifecycle [6]. Therefore, it is crucial to measure, gather, and analyse data and corresponding indicators, which can be a trigger for companies in their shift towards green production. This shows the need of undertaking research on key sustainable indicator selection and assessment method development.

1.3. Companies’ Shift towards Sustainability-Related Issues

Pressure and legal regulations have significantly contributed to the spread of the application of environmental sustainability as a recent management mantra [13,14]. Not only to fulfil new requirements but also to ensure the success of the company, currently organisations are facing challenges regarding establishing effective governance and internal control of sustainability-related operations [15].
Since environmental issues began to play a significant role, not only for researchers but also for industry, many leading companies have included these aspects in their strategic development plans for the upcoming years and have started to move towards sustainable business models. From that moment, the concept of innovation began to be identified with environmental friendliness. Among many factors and possible improvements in the area of transformation towards a more sustainable operation of enterprises, the decisive factor is adapting products and their lifecycles to new standards in line with the principles of sustainability and the circular economy.
An example of practical actions taken to become an environmentally friendly manufacturer is HP, which developed and implemented the “2030 Sustainability Impact Vision” plan. HP’s new sustainable strategy focuses on product circularity and reusability, which is in line with the concept of sustainable product lifecycle management. Among the most important goals of this strategy are issues related to reducing the use of materials, keeping materials in use longer, and reducing deforestation [16]. In order to track the progress towards its assumed goals, HP collects information related to its products, services, and data from the supply chain area related to the use of raw materials for production, product use (consumption of energy, paper, and waste), repairs, etc. [16]. This shows the importance of indicators and metrics connected with sustainability.
Another example is the sustainable strategy of the Schaeffler group—a manufacturer in the automotive industry. In light of global changes related to digital transformation and ongoing climate change, Schaeffler strives to provide its customers with innovative and environmentally friendly products. Schaeffler’s activities are varied and include both the continuation of work on increasing the efficiency of traditional engines powered by fossil fuels and, above all, the intensification of work focused on the development of electromobility [17]. The implementation of this strategy requires many significant improvements in areas related to the PLM systems, especially in terms of sustainability management and reporting the environmental impact KPIs [17]. This example emphasizes the significance of sustainability-related indicators and metrics.
Sustainability measurements, especially those regarding the environmental pillar, became a significant topic in the automotive industry. The automotive industry is considered one of the main contributors to the global environmental crisis. Moreover, current practices in the automotive sector are shown to have a negative impact on the social and environmental dimensions. On the other hand, the automotive industry is critical to any country’s economic development. Therefore, the industry requires a radical shift in the way they perform usual business practices [18].

1.4. Significance and Aim

Although there is a variety of literature describing the various dimensions of sustainability and its metrics (more than 300,000 articles), to the best of the authors’ knowledge based on their in-depth research, there is no systematic method for identifying the indicators of sustainable production that are relevant to product lifecycle management in the automotive industry. The main groups of articles tackle the issues of sustainability aspects indicators [19,20,21,22], automotive industry aspects indicators [8,9,10,23,24,25,26], and product lifecycle management aspects indicators [6,10,23,27,28,29,30], but there is a lack of papers connecting all of those issues. Additionally, the majority of the literature on sustainability indicators discusses industries related to energy, construction, and agriculture [31,32,33,34,35]. There are almost no papers that discuss the various aspects of PLM sustainability indicators in the automotive industry.
The significance of research related to product lifecycle management green indicators results directly from the needs of the industry. Companies use PLM systems for product lifecycle management, but the current generation of PLM systems is not well suited to product sustainability issues. They mainly support the design phase of the product life, while the subsequent phases are not well supported. The necessity of transformation towards a more sustainable operation of enterprises will require an increasing adaptation of products and their lifecycles to new standards in line with the principles of sustainable development and the circular economy. Those aspects are in line with the concept of GreenPLM—an innovative solution that should allow for managing the product lifecycle in a sustainable way, taking into account environmental issues of product lifecycle management in particular. One of the goals of the cooperation between Wrocław University of Science and the Technology and Transition Technologies PSC (global premium IT solution provider) on the GreenPLM concept is to enable the analysis of environmental indicators and assessment of the product’s environmental impact, which will support manufacturing companies in producing environmentally friendly products. The automotive sector was chosen to conduct the initial research towards GreenPLM.
The research results presented in this article are intended to support two target groups: academia and industry. The main scientific objective was to provide a systematic method for selecting and evaluating sustainability indicators related to the various phases of automotive lifecycle management. The main application goal was to support the industry in its pursuit of greener development by identifying which sustainability indicators are relevant to each phase of the product lifecycle. As a result, the key green indicators related to the automotive industry in line with the GreenPLM concept are identified together with their assignment to the elements of the car’s beginning-of-life stages, as well as their potential data sources. The paper introduces the concept of GreenPLM and its future application possibilities.

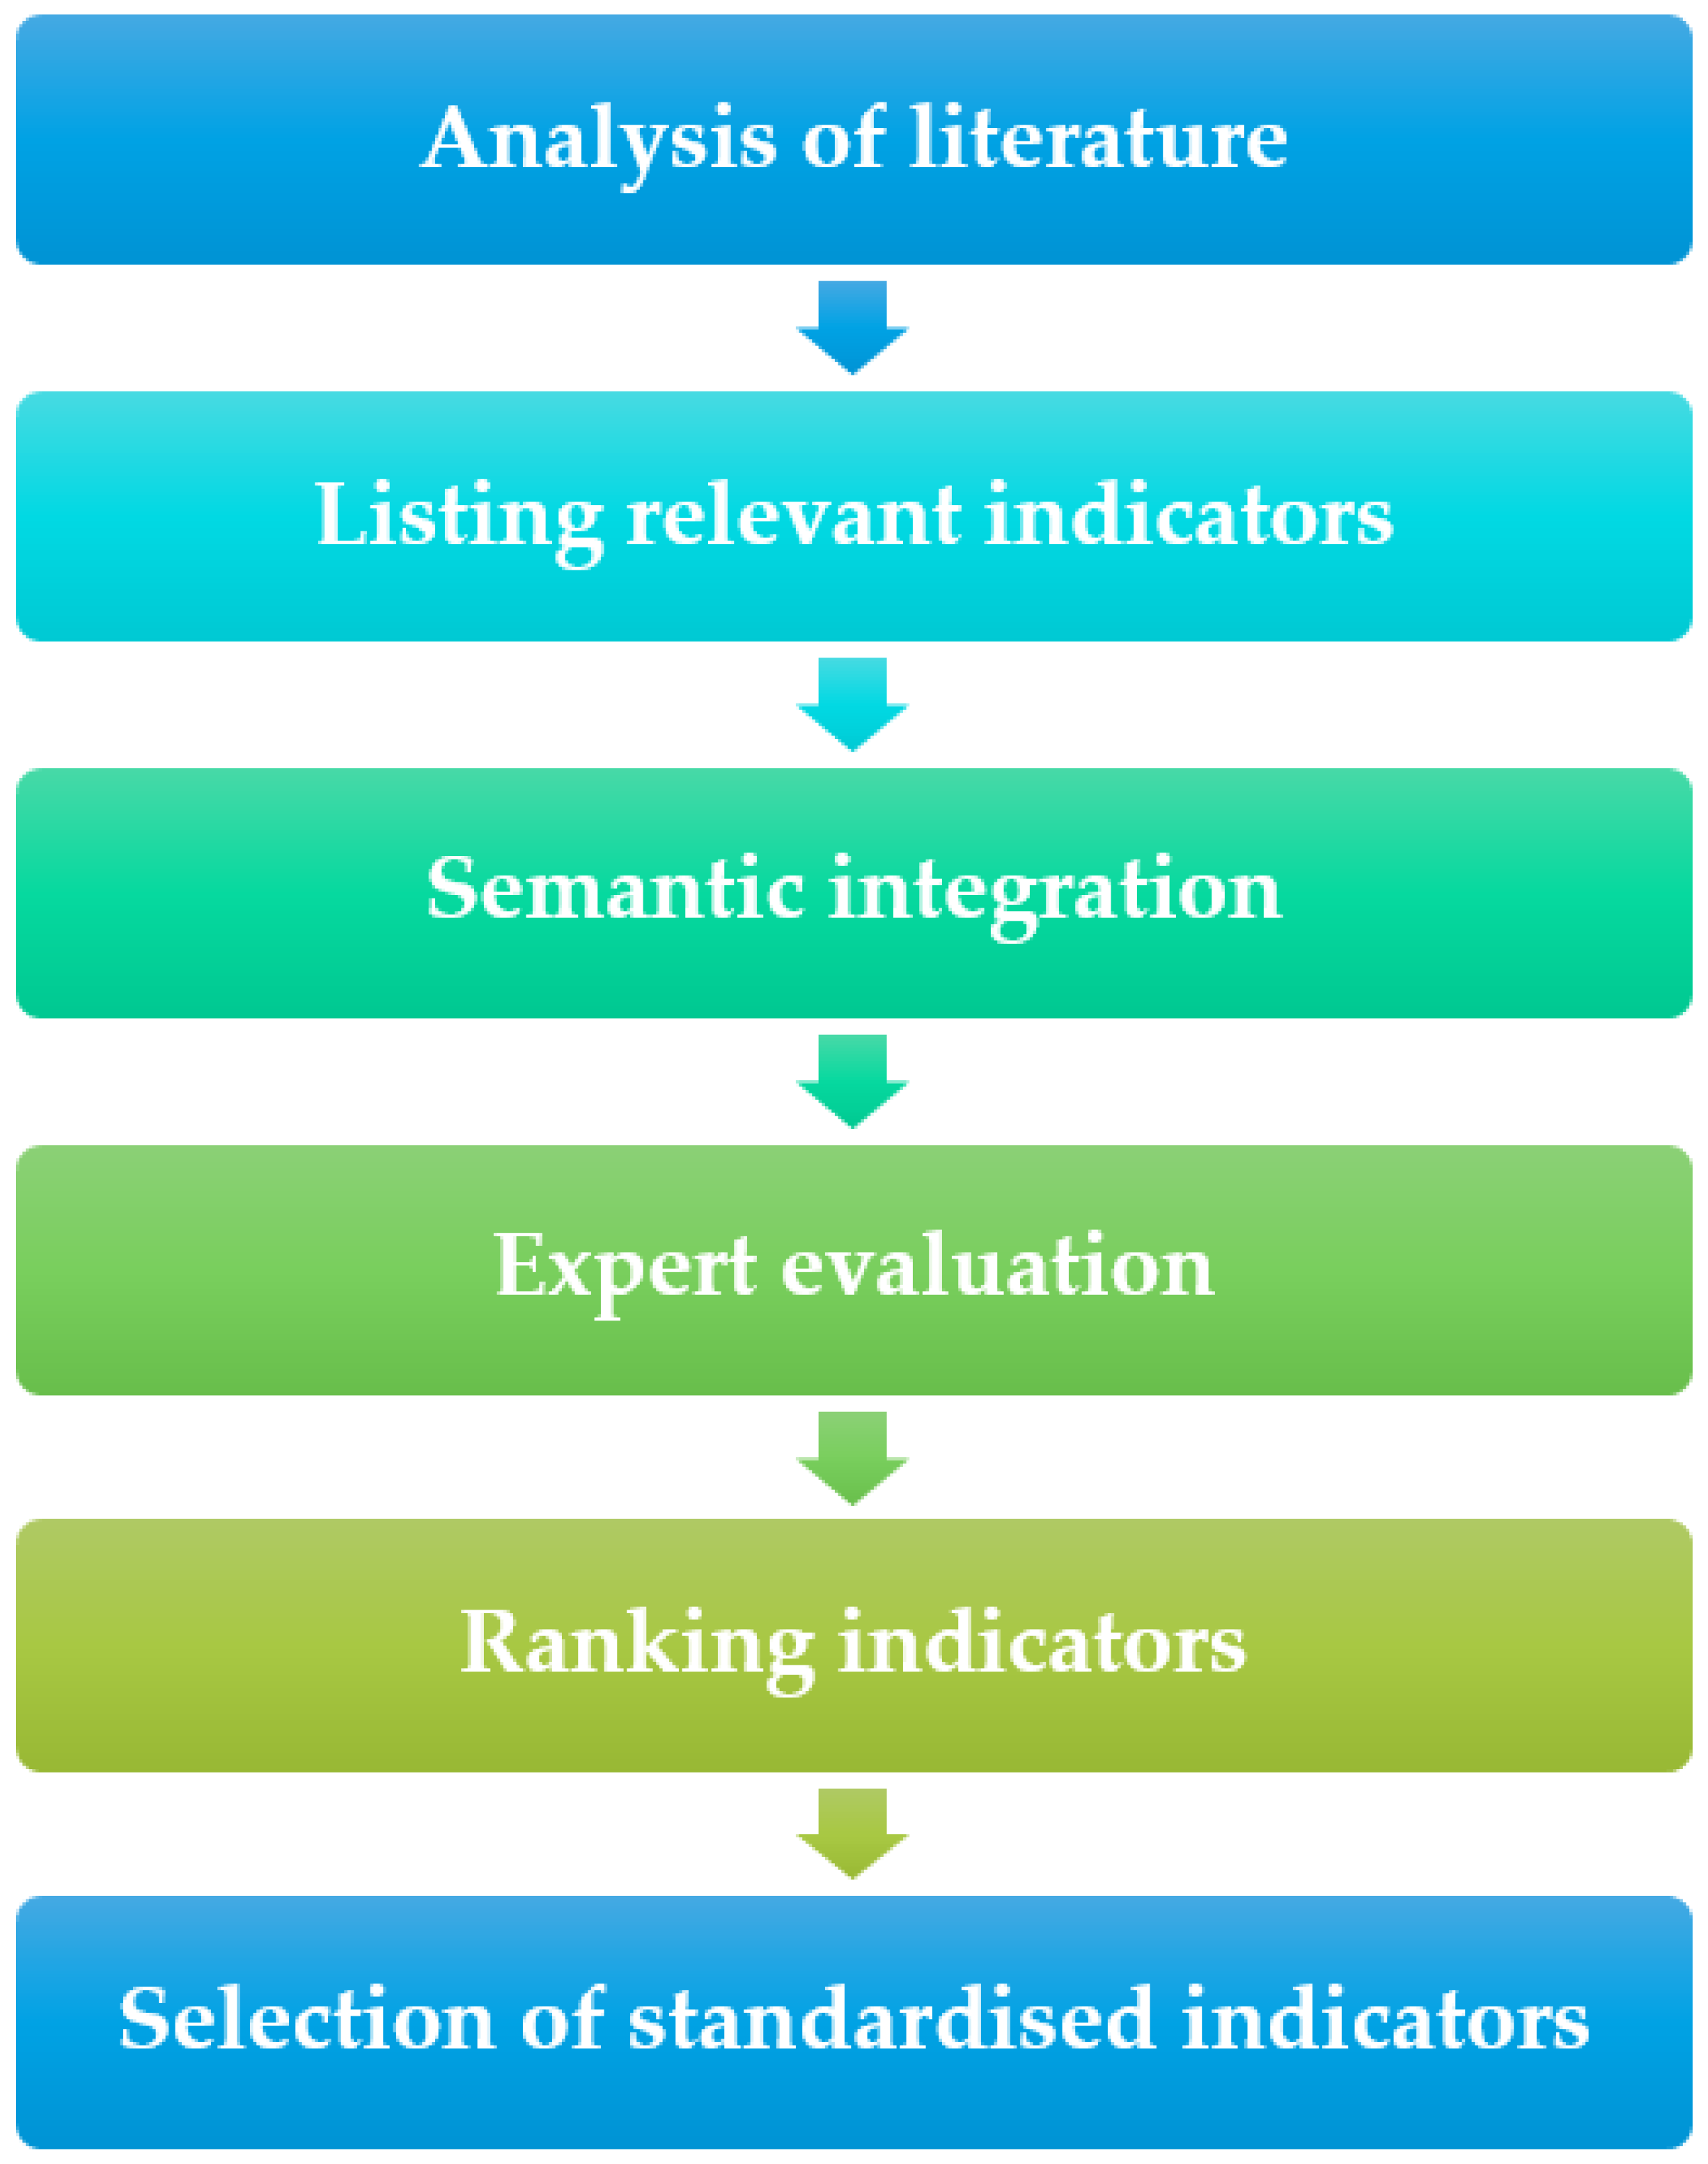
2. Materials and Methods

From a sustainable product lifecycle management point of view, there is an urgent need to define corresponding indicators that will be able to measure, track, monitor, and assess the paradigm shift towards sustainable industrial development to appropriately follow guidelines of sustainable manufacturing. This is why the methodology of the selection and assessment of key green indicators related to the automotive industry in line with the GreenPLM concept was developed. It consists of six steps, as presented in Figure 1.
  • Analysis of the literature
    The first step of the methodology involved an extended analysis of the literature in terms of indicators describing sustainability aspects in green product lifecycle management in the automotive industry. It was decided to search within major publishers: Elsevier (Science Direct), Springer Link, Multidisciplinary Digital Publishing Institute, Taylor and Francis Online, and Wiley Online Library, as well as Google Scholar. As the literature on general sustainability issues is rich, the search was limited by keywords filters such as “sustainability indicators” or “green indicators” and “product lifecycle management” or “PLM”, as well as “automotive industry” or “automotive sector”; however, they were used in a combination of Boolean operations, for example, “sustainability indicators” AND “PLM” AND “automotive industry”. Next, to create a portfolio of articles to be analysed, the alignment of the title and abstract of the article was performed. Many papers were subject to elimination, since their titles or following abstracts were not in line with the subject in question. Based on this, a portfolio of research papers and book chapters, as well as conference papers, was created.
  • Listing of the relevant indicators
    Based on the literature search, the identified indicators should be collected into one dataset. It should include not only a list of all indicators but also assign individual authors. If the authors have proposed certain categories grouping more indicators, they should also be identified. This part of the research was carried out in the form of a predefined matrix in which all of the results were collected in the form of a dataset of indicators proposed by the individual authors and grouped into the original categories proposed by these authors.
  • Semantic integration
    Since most authors define the same concepts, indicators, and terms differently, the next step of the methodology should be devoted to semantic integration in order to systematize the terminology. For this purpose, a detailed analysis of the matrix built in the previous step was carried out. Various forms of notation of the indicator names corresponding to the same term were assigned to the appropriate ontologies. The most widely understood concept was chosen as a representative name for a given ontology to limit the complexity and organize the data for further research.
  • Expert evaluation
    Once the terminology is standardized, the relevance of the indicators can be assessed in terms of their usefulness within the sustainable production aspects of product lifecycle management. The assessment was made on the basis of Likert-scale questionnaires, which allow for expressing the extent to which the evaluator agrees or disagrees with a given statement. Independent experts in the field of product lifecycle management and sustainability were asked to assess the suitability of each indicator for use in the GreenPLM concept.
  • Ranking indicators
    Next, based on the expert assessment, the indicators should be ranked in the order of their importance for green product lifecycle management for the automotive industry. For this purpose, the average value of the ratings awarded for each indicator was calculated, and then the list was ranked starting with the indicators that achieved the highest value.
  • Selection of the standardised indicators
    The last step of the methodology is the selection of 20 standardised indicators with redefined nomenclature resulting from the semantic integration and the expert assessment evaluation. As a result, the most suitable indicators that are connected with sustainable production aspects of product lifecycle management in the automotive industry will be selected.

3. Results

Within this section, the results of the implementation of the proposed methodology of selection and assessment of key green indicators related to the automotive industry in line with the GreenPLM concept are presented.

3.1. Analysis of Literature

Within the literature research, an extended analysis of sources describing indicators and measures of sustainable development that can be used in product lifecycle management in the automotive industry was carried out following the defined methodology. The main findings are split into three sections:
  • sustainability aspects indicators;
  • automotive industry aspects indicators;
  • product lifecycle management aspects indicators.

3.1.1. Sustainability Aspects Indicators

The literature research shows that in many studies, the indicators and concepts for sustainable development have been explored and defined based on five dimensions: economics, ecology, society, technology, and performance management. Many organisations are making some efforts in this regard. The result of the work carried out by the United Nations Environment Program (UNEP) and the US NGO is the Global Reporting Initiative (GRI), which defined more than 100 indicators and focused on the first three dimensions. Another effort of the National Institute of Standards and Technology (NIST) is the Repository of Sustainable Production Indicators (SMIR), which defined widely available sets of indicators and focused on five dimensions.
In addition, academia and research centres have carried out and are carrying out a lot of research on this subject. Based on the analysis of the results of the above-mentioned activities, it is possible to define an initial general division of indicators that determine the sustainability of the product [19]. The economy dimension includes investment, economic performance, product presence in the market, green process design and green manufacturing. Within the ecology dimension, indicators such as energy emissions, carbon footprint, waste reduction, water usage, and compliance are identified. The social dimension is focused on labour practices, human rights, social influence, product and eco-design responsibility, as well as innovative new materials care. Finally, the Technology dimension covers Lifecycle Assessment, design for environment tools ad zero emissions and waste indicators.
Regarding ecology, in 2018, the European Commission proposed a multi-standard indicator, named the product environmental footprint (PEF), to measure the environmental performance of a product throughout its lifecycle [20]. The PEF assessment system contains 14 impact types: climate change, ozone depletion, ecotoxicity—freshwater, human toxicity—cancer effects, human toxicity—noncancer effects, inhalable inorganics, ionising radiation, photochemical ozone synthesis, acidification, eutrophication—land, eutrophication—water body, water consumption, and minerals and fossils consumption, as well as land transfer. The product environmental footprint (PEF) has a profound impact on environmental sustainability; however, most of the existing PEF models fail in the product lifecycle [21]. In 2018, the European Commission launched a Single Market for Green Products Initiative and, in 2021, proposed the product environmental footprint (PEF) and organisation environmental footprint (OEF) methods as common ways of measuring environmental performance [36]. The PEF method is used for modelling the environmental impacts of the flows of material/energy and resulting emissions and waste streams associated with a product from a supply chain perspective (from the extraction of raw materials, through use, to final waste management) [36]. OEF is calculated using aggregate data representing the flows of resources and wastes that cross the defined organisational boundary [22]. The final product environmental footprint category rules and organisation environmental footprint sector rules can be used to calculate the environmental footprint profile for products and organisations in scope.

3.1.2. Automotive Industry Indicators

Nowadays, without a doubt, sustainable development is beginning to play a critical role in the automotive industry. Some researchers and R&D managers have described the product lifecycle in the automotive industry.
Marcon et al. indicated that among products having sustainable attributes—apart from food, clothing, and housing—automobiles have been investigated most often [23]. An analysis of different sectors showed that the automotive industry is crucial from an environmental point of view—according to a publication by the United Nations Environment Programme (UNEP) referring to the “Resource Efficiency and Climate Change: Material Efficiency Strategies for a Low-Carbon Future” report, “producing and using materials more efficiently to build passenger cars and residential homes could cut CO2 equivalent emissions between 2016 and 2060 by up to 25 gigatons across the Group of Seven (G7) member states” [37]. According to Hertwich et al., road transport contributes heavily to the overall environmental impact, as it causes approximately 20% of greenhouse gas (GHG) emissions [24]. The European Commission in the “sustainable and smart” mobility strategy is expecting to have at least 30 million zero-emission cars on European roads by 2030 [25]. Hannon et al. noticed that although powertrains electrify to meet these expectations, in fact, the largest contributor of automotive carbon emissions will come from vehicles’ material production—at least 30% by 2030 [25].
The analysis focused on the automotive industry showed that the implementation of changes related to material efficiency may positively affect reductions in greenhouse gas emissions in light-duty vehicles—according to research presented in [26], emissions from the production of materials for the manufacture of cars could be reduced by 30% to 70% in 2050. Thus, it is crucial for the automotive industry and the original equipment manufacturers (OEMs) in particular to radically redesign their products and processes. Car producers facing strong regulatory pressure for sustainability will have to reduce resource consumption in production, improve the recyclability of materials, and reduce tailpipe emissions during operation [24]. Therefore, what is expected in the first place is transparency: “manufacturers must create transparency on the emissions embedded in their upstream activities” [25]. Moreover, automotive companies will have to shift towards sustainable design, investment in clean technologies, and value creation for local and global communities [24]. Hirz and Brunner point out that ecodesign in the automotive industry requires a comprehensive consideration of numerous influencing factors [10].
One of the key aspects in terms of energy consumption reduction in the automotive industry is reducing the weight of a car [10]. Apart from lightweight, the most common approaches implemented by OMEs in terms of designing are [24]:
  • Manufacturing processes/technologies optimisation;
  • Vehicle assemblies/components redesign;
  • More efficient materials usage.
The results of a study performed by Vaz et al. showed that the automotive industry, in order to reduce the environmental impact associated with production, has to focus on [8]:
  • Outsourcing renewable and recycled materials;
  • Implementing clean technology and environmental management systems in individual manufacturing sites and throughout the supply chain;
  • Reducing material inputs;
  • Changing manufacturing processes to reuse byproducts and, where possible, alternative, less toxic materials;
  • Seeking technological alternatives to the internal combustion engine (ICE).
Similarly, the analyses presented in the abovementioned report on “Resource Efficiency and Climate Change: Material Efficiency Strategies for a Low-Carbon Future” showed that the following material cycle improvements should be implemented in the automotive industry to reduce negative environmental impacts [26]:
  • Increased fabrication yields and fabrication scrap diversion;
  • Light-weighting of vehicles through a shift from steel to aluminium;
  • Lifetime extension and increasing the reuse of parts and recycling of materials from end-of-life vehicles.
According to Ciceri et al., the above assumptions can be met by the implementation of the sustainable engineering concept, which is understood as “as a layer of engineering-oriented approaches, methods and tools crossing the four pillars of Society, Economy, Environment and Technology for achieving sustainability-oriented results.” In practice, it means applying scientific knowledge to the design and implementation of products, materials, technologies, and processes, taking into account the specifics of each of the four pillars of sustainable development in order to create solutions for design, operational and organisational activities related to products, processes, services, and culture in the manufacturing sector [38].

3.1.3. Product Lifecycle Management Aspects

The product lifecycle stages in the literature are defined in numerous ways. Depending on the context, a different number of stages and definitions can be found. For instance, Eby defined nine phases of the product lifecycle, namely [39]:
  • Concept—beginning of life;
  • Development—beginning of life;
  • Prototype—beginning of life;
  • Launch—beginning of life;
  • Manufacture—beginning of life;
  • Distribution—middle of life;
  • Use—middle of life;
  • Service—middle of life;
  • Recycle—end of life.
The European Commission defined that product environmental footprint lifecycle stages assessment should cover (as a minimum) the stages:
  • Raw material acquisition and preprocessing (including production of parts and components);
  • Manufacturing (production of the main product);
  • Distribution (product distribution and storage);
  • Use;
  • End of life (including product recovery or recycling).
Apart from merely an economic point of view, ecological and societal aspects are also taken into account by customers and regulations and, thus, have to be deeply considered by car producers [10]. Ecology-related factors focus on the consumption of energy, the consumption of resources, and the effects of produced substances and influences on the environment; society-related factors take into account the involvement of staff, as well as the influences on the general society. The abovementioned need to be considered during the entire lifecycle of an automobile [10]:
  • Conception phase;
  • Development phase;
  • Production engineering phase;
  • Manufacturing phase;
  • In-use phase;
  • Recycling and disposal phase.
According to Främling et al., sustainable product lifecycle management should be understood as a type of closed loop lifecycle management [27]. It can be designed for the purpose of improving environmental sustainability during all phases of the lifecycle. Its main aim is to constantly improve the design, manufacturing, use, and end-of-life handling of products in order to obtain “improved quality, less breakdowns, reduced need for spare parts and ensuring an operation that is continuously maintained at the most energy- and resource-efficient level” [27].
Vila et al. argue that the green product lifecycle framework should be composed of three main phases [1]:
  • Design-development phase focused on ecodesign and green development, composed of strategic planning, conceptual design, embodiment design, detail design, and manufacturing plan;
  • Manufacturing phase focused on green manufacturing and sustainable production, composed of storage package, assembly, production, production control, and resource management;
  • Service phase focused on sustainable logistics, product special response, and responsible use and maintenance, composed of logistics, sales, delivery, client service, and, finally, reduce/reuse/retire/recycle.
Marcon et al. proposed another framework for a green product. They divided green product attributes’ groups into three main product lifecycle phases, namely—production, use, and end-of-life [23]. Within the production group, the attributes that were identified are: sustainable manufacturing, eco-oriented R&D, ecolabelling, transport efficiency in production, waste management and reduction, water efficiency, hazardous materials, material efficiency, and use of sustainable materials. Within the use group, the attributes that were identified are transport efficiency in use, energy-related attributes, fuel-related attributes, pollution reduction, and design for sustainability-oriented behaviour. Within the end-of-life group, the attributes that were identified are extended lifetime, transport efficiency in-use, biodegradability, recyclability, and product disposal attributes, as well as sustainability of packaging.
According to Hirz and Brunner, four main groups of influencing factors on a car’s lifecycle performance can be distinguished [10]. The technical specifications include vehicle type, size and weight, propulsion technology, vehicle technology, and materials. The supply of resources and energy includes the type and amount of energy for production and use and high/low impact materials, as well as raw materials. The production and recycling technology group includes efficient production, supplier, and logistics processes; design for recycling; and recycling technologies. Last but not the least group, the in-use phase includes transportation demands, user profiles, driving behaviour, fuel and energy consumption, and maintenance and service efforts [10].
Khan et al. proposed a lifecycle indexing system, LInX, which facilitates the lifecycle assessment application in process and product evaluation and decision making [28]. It covers four main groups of indicators: environment, health and safety (EHS), cost, technical feasibility, and sociopolitical factors. Each of the groups was divided into more specific attributes: environment, health, and safety includes such indicators as resource depletion; greenhouse effect; ozone depletion; acidification potential; oxidation potential; mass of air pollutants released; mass of water pollutant released; mass of solid waste disposed; human health risk; ecological risk; and safety risk. Technology tackles aspects of technical feasibility; process conditions; energy efficiency; and human–machine interaction. The cost house refers to fixed cost; operation and maintenance cost; and health, safety, and environmental costs. Finally, the sociopolitical house corresponds to sociopolitical acceptance; vulnerability of area; and social impacts.
Zhao et al. focused on sustainability-related indicators based on Global Reporting Initiative Sustainability Indicators (provided by the United Nations Environment Programme) and sustainability indicators provided by The Institution of Chemical Engineers [29]. According to Zhao et al., the elements of sustainable development for sustainable PLM are divided into environmental, economic, and social indicators. In the environmental group, indicators such as materials used, energy, emissions/pollutions, biodiversity, and compliance were specified. The economic group includes investment, economic performance, market presence, and indirect economic effect. The social group includes labour practices, human rights, social influence, and product responsibility.
Staniszewska et al. proposed measures for ecodesign divided into areas based on PLM phases, together with the definition of the current state and potential improvement of the factors, as well as their impact on the environment (low, medium, and high). The phases (and their corresponding measures) are divided into design (weight of the product and its parts, consumption of fuel, and number of parts), raw materials (resources used, hazardous materials, and use of materials from recycling), manufacturing and distribution (use of media (energy, water), amount of waste, use of hazardous materials, pollution, type of packaging, mode of transport, size and weight, documentation, stock, and intensity), and, finally, end of life (reuse of parts and hazardous waste).

3.2. Listing Relevant Indicators

In accordance with the developed methodology of the selection and assessment of key green indicators related to the automotive industry in line with the GreenPLM concept, a matrix with all previously identified indicators was prepared on the basis of the literature research. The matrix contains a dataset of indicators proposed by individual authors, which are grouped into original categories proposed by these authors. More than 130 indicators were identified within this research. The results are shown in Table 1.

3.3. Semantic Integration

The first conclusion that comes to mind after analysing the results of the literature analysis concerns nomenclature. Most authors use different wording when describing individual terms. Therefore, to better understand the relationships between different indicators, semantic integration was carried out not only for indicators but also for indicators groups and lifecycle stages. Various forms of notation for indicator names were assigned to corresponding ontologies, and a representative name for a given ontology was chosen based on a widespread understanding in order to make further research easier.
For example, indicators such as “absence (or reduced quantity) of hazardous substances (includes the absence of toxic substances, and safe products)”, “avoidance of the use of hazardous materials and chemicals in production processes”, “hazardous materials”, “use of hazardous materials”, “free from toxic chemicals”, “hazardous waste”, and “nonpoisonous material” were grouped into one category that was named “use of hazardous materials”.
The results of the nomenclature unification are presented in the Table 2, Table 3 and Table 4 below. The appearance of the original wording in the literature analysis is indicated. As a result, 64 distinct indicators describing sustainability aspects in green product lifecycle management were identified.
In the second step, semantic integration of the indicators was performed. Their appearance in the literature analysis is indicated.

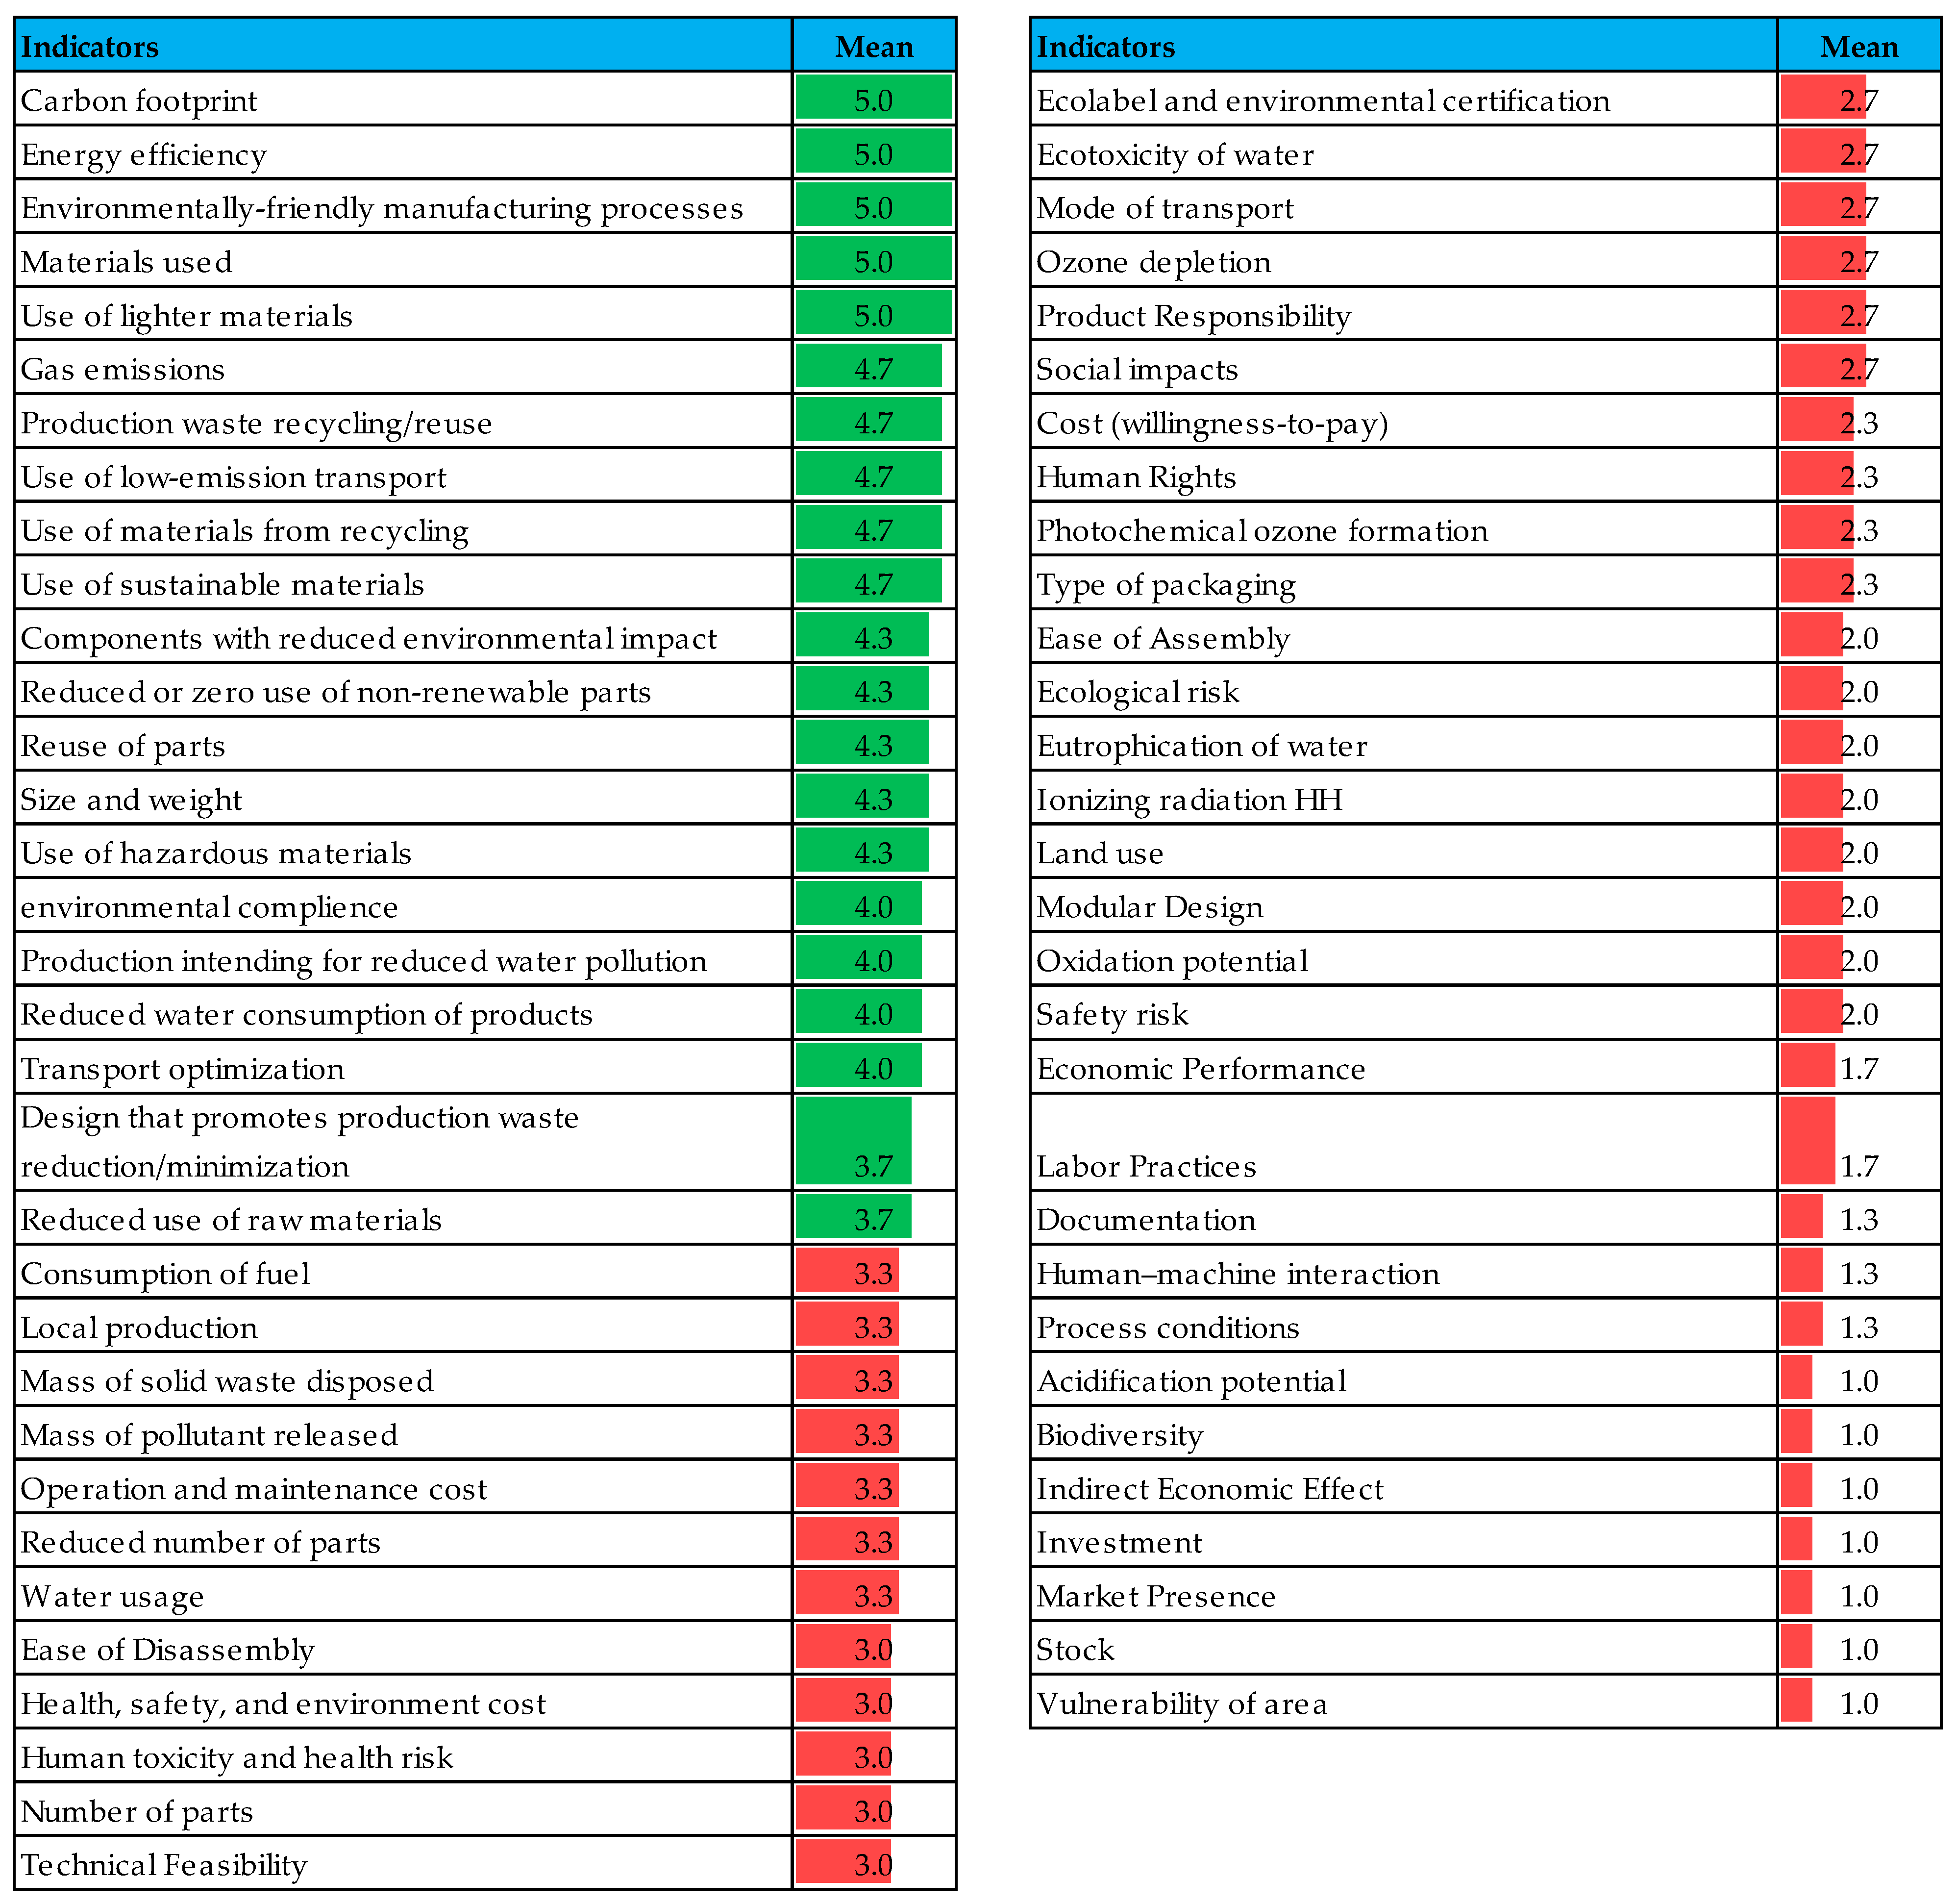
3.4. Expert Evaluation

Based on the semantic integration results, it is possible to evaluate the relevance of the indicators by assessing their usefulness within the sustainable production aspects of product lifecycle management. As the research on GreenPLM concept is in the initial phase and can be treated as an introduction, to perform the evaluation three experts in the field of product lifecycle management and sustainability (with more than 10 years of experience in R&D) were invited.
The assessment was based on a five-point Likert scale, which was used to allow the individual to express how much they agree or disagree with a particular statement. The experts were asked to evaluate the usefulness of each of the indicators in green product lifecycle management, giving ranks from 1 to 5 (where 1—not useful; 5—very useful). Each of the experts evaluated each indicator separately based on their knowledge and experience. During the evaluation, the experts worked individually and did not contact each other so as not to suggest the evaluations of others and not to influence each other’s scores. The results obtained for all 64 indicators did not differ significantly from each other, so there was no need for finetuning. From the obtained results, the mean average was calculated. The results are presented in Figure 2.

3.5. Ranking and Selection of Indicators for Further Analysis

The evaluation results were used as a basis for ranking the most suitable indicators that are connected with sustainable production aspects of product lifecycle management in the automotive industry. The list of 64 indicators was ranked according to their mean value calculated based on the expert assessment scores starting with the indicators that achieved the highest value. To select a group of the 20 most relevant indicators for GreenPLM, the cut-off line was set to a mean value greater than 3.7, leaving a total of 21 indicators for further analysis. The results of the selection are marked in the table with a different colour in Figure 2 (green for the selected ones).

4. Discussion

Although the extended analysis showed that there are many different types of indicators and measures of sustainable development in the automotive industry, each of the authors defined them in a different way, sometimes without their explanation or even indicating the units in which they should be measured.
This is why the authors of this paper, following the proposed methodology of the selection and assessment of key green indicators related to the automotive industry in line with the GreenPLM concept, identified 20 key green indicators. For each of the indicators, the standardized explanation and metrics are proposed in Table 5.
Some researchers and R&D managers have described the product lifecycle in the automotive industry. Guyon presented vehicles’ “cradle-to-grave” lifecycle that covers not only raw material extraction, production, distribution, use, and recycling but also aspects such as fuel consumption, maintenance, and energy recovery in end-of-life processing [42]. Mildenberger and Khare state that the lifecycle of an automobile begins with the concept and design and concludes with retirement (i.e., end-of-life scrapping), including processing and utilisation [43]. Messagie et al. except the manufacturing, use and end-of-life stages include the well-to-tank stage (production of the fuel or electricity) [44]. Folęga et al. broaden these stages to the production phase—components of production and vehicle assembly, well-to-tank; use phase—maintenance, tank-to-wheel; end of life phase—reduce, reuse, remanufacture, and recycle [45]. Balzer stated that the vehicle LCA encompasses all phases of the product cycle, from raw material extraction to end-of-life recycling and disposal. However, as Balzer states, lifecycle assessment in the automotive industry can be a challenge due to the fact that vehicles are products of very complex construction, composed of many parts, systems, and sub-system, that are coming from dispersed supply chains [46].
According to Grimshaw, six lifecycle stages should be examined in terms of creating an environmentally friendly product. For each stage, several things regarding the product’s sustainability should be considered [8]. They are as follows:
  • Design—Are the features and functionality of the product as sustainable as they possibly can be? Are the raw materials and packaging options designed in the most environmentally friendly way possible?
  • Extraction of raw materials—Are the resources sourced responsibly? Is there a way to use biproducts or recycled materials instead? Is the company using resources that harm endangered species?
  • Manufacturing—Does the production process anticipate energy saving, conserving, or recycling of raw materials? What are the measures to prevent environmental pollution?
  • Distribution and packaging—Is the product designed to simplify packaging and efficient distribution? Is it possible to use low-impact delivery vehicles?
  • Product use—Can the product consume less power or resources when in use? Is the product able to be maintained with minimal water and/or chemicals?
  • Disposal or recycling—Is the product designed to be easily recycled, reused, or composted? Can it be made with lower amounts of environmentally harmful substances to minimize pollution run-off?
Based on these questions, it can be concluded that the sustainability of a product depends on the initial stages of its life—especially the product design phase and the planning of the production process.
Due to the fact that the results of the literature analysis on the PLM stages in the vehicle sector confirmed the correctness of the previous results obtained within the key green indicators assessment, further work was carried out on the assignment of individual indicators to the beginning-of-life stages of the car. For a better fit, the product design phase was divided into three subcategories: material, product (understood as a part or assembly), and final product design. The results are presented in Table 6.
Further, critical in the context of sustainable development and circular economy is to consider the product lifecycle in a much broader scope than just development and implementation into production (which is often the case of many commercial PLM systems currently available on the market). Due to the fact of some significant deficiencies resulting from the imperfections of the current class of systems, as well as deficiencies in the level of the integration of corporate systems used in companies with PLM systems (e.g., ERP, SCM, and MES), it is necessary to manually acquire information crucial for determining environmental data from distributed systems.
Often, information enabling the assessment of the product’s sustainability is created and stored in various IT systems, external databases, MS Excel sheets, or in dedicated systems developed independently by a given company. For example, the geometry and material requirements are created in the CAD system; information about suppliers, e.g., distances, is contained in ERP systems; information on how to use and service the product is stored In PDM; and requirements management systems. Sustainability-related data, such as CO2 emissions or the water footprint for the extraction and production of input materials, are stored in external databases or in SCM supplier databases.
Given the great importance of selecting the appropriate databases and datasets, the authors of this study conducted an analysis of the sources of obtaining the values of the identified indicators or parameter values for their calculation.
Based on that, the final result of the research—key green indicators related to the automotive industry in line with the GreenPLM concept—are presented in Table 6 with their assignment to the elements of the car’s beginning-of-life stages, as well as their potential data sources.

5. Conclusions

Regulations, depletion of natural resources, and changing customer demands are putting pressure on manufacturing companies to consider environmental issues in the development of the products they offer. The importance of the presented research on product lifecycle management green indicators is directly related to the demands of the industry. Companies are using PLM systems to manage the product lifecycle, but the current generation of these systems is not adequately adapted to product sustainability issues. Existing solutions do not provide the ability to manage the entire product lifecycle from a single integrated platform and monitor environmental indicators from a single view.
Currently, in order to meet the requirements of sustainable development, it is necessary to use many integrated advanced IT solutions that are a reliable source of up-to-date data. The number and type of individual IT solutions largely depend on the industry, as well as the type and complexity of products manufactured. Yet, it is critical to ensure the coverage of the product lifecycle in its entirety and to enable uninterrupted communication and smooth data flow between all its stages and stakeholders participating in activities in any of its stages.
In order to effectively implement the adopted strategies and business models that take into account environmental aspects, manufacturing companies need better and more integrated IT systems. Data that are normally scattered across enterprise systems need to be integrated, processed, and made available in a way that provides insights into current company practices, process quality, progress, and level of transformation towards achieving green goals.
The answer to these challenges may be the innovative GreenPLM solution, which is foreseen to take into account the paradigm of sustainable product lifecycle management and circular economy. The key functionalities of such a comprehensive and seamlessly integrated GreenPLM system should include:
  • The ability to formally manage requirements, taking into account specific metrics related to the sustainable goals and ensuring their traceability throughout the product lifecycle in order to ensure—through specific verification and validation processes—that the defined requirements are met;
  • The ability to build advanced simulation analytical models that allow not only understanding and optimising the impact of new materials but also changes in manufacturing processes and how products are used and serviced;
  • The ability to provide seamless connection of data streams to ensure interoperability of various classes of systems; this would allow building an integrated, holistic insight into resource data obtained from physical and virtual systems throughout their entire lifecycle and taking into account normally siloed functional perspectives;
  • A support system to improve product design and development processes with environmental considerations based on indicator analysis and an assessment of the environmental impact of the product.

Limitations and Further Research

The authors would like to acknowledge that this analysis has several limitations. The first limitation—nonextensively analysed potential data sources of sustainable indicators—results from the narrowed possibilities of investigation within databases and datasets. This is caused by the fact that access to a large number of databases is restricted due to the fact of their commercial nature and the need to pay high-access licenses.
The second limitation is due to the nature of the maturity of the research on the GreenPLM concept. Currently, it is in the initial phase and can be treated as an introduction to more extended research on sustainable indicators for PLM in the automotive industry. According to the planned works within the development of the GreenPLM concept, the 20 key green indicators presented in this paper will be analysed in-depth under several aspects. The first one is related to the evaluation of their feasibility to different subsectors of the automotive industry. Secondly, the analysis focused on the identification of business models corresponding to sustainability, as well as sustainable business, goals will be performed. The key green indicators are planned to be matched—where relevant—to particular sustainable business goals and corresponding sustainable business models. Thirdly, the sustainable indicators will be evaluated in terms of environmental, economic, and social impacts. After finalising those stages of research, the final list of the key indicators of sustainable aspects in the automotive industry will be selected.

Author Contributions

Conceptualisation, J.H., M.R. and M.C.; methodology, J.H. and M.R.; validation, J.H., M.R., M.C., M.M. and S.O.; formal analysis, J.H. and M.R.; investigation, J.H., M.R. and M.C.; resources, J.H. and M.R.; data curation, J.H.; writing—original draft preparation, J.H.; writing—review and editing, J.H., M.M. and S.O.; visualisation, J.H.; supervision, S.O. All authors have read and agreed to the published version of the manuscript.

Funding

This research received no external funding.

Data Availability Statement

The data are unavailable due to privacy restrictions.

Conflicts of Interest

The authors declare no conflict of interest.

References

  1. Salvado, M.; Azevedo, S.; Matias, J.; Ferreira, L. Proposal of a Sustainability Index for the Automotive Industry. Sustainability 2015, 7, 2113–2144. [Google Scholar] [CrossRef] [Green Version]
  2. Meuer, J.; Koelbel, J.; Hoffmann, V.H. On the Nature of Corporate Sustainability. Organ. Environ. 2020, 33, 319–341. [Google Scholar] [CrossRef]
  3. Upward, A.; Jones, P. An Ontology for Strongly Sustainable Business Models: Defining an Enterprise Framework Compatible With Natural and Social Science. Organ. Environ. 2016, 29, 97–123. [Google Scholar] [CrossRef] [Green Version]
  4. Purvis, B.; Mao, Y.; Robinson, D. Three Pillars of Sustainability: In Search of Conceptual Origins. Sustain. Sci. 2019, 14, 681–695. [Google Scholar] [CrossRef] [Green Version]
  5. Winter, M.; Knemeyer, A.M. Exploring the Integration of Sustainability and Supply Chain Management: Current State and Opportunities for Future Inquiry. Int. J. Phys. Distrib. Logist. Manag. 2013, 43, 18–38. [Google Scholar] [CrossRef]
  6. Vila, C.; Abellán-Nebot, J.V.; Albiñana, J.C.; Hernández, G. An Approach to Sustainable Product Lifecycle Management (Green PLM). Procedia Eng. 2015, 132, 585–592. [Google Scholar] [CrossRef] [Green Version]
  7. Koplin, J.; Seuring, S.; Mesterharm, M. Incorporating Sustainability into Supply Management in the Automotive Industry—The Case of the Volkswagen AG. J. Clean. Prod. 2007, 15, 1053–1062. [Google Scholar] [CrossRef]
  8. Vaz, C.R.; Rauen, T.R.S.; Lezana, Á.G.R. Sustainability and Innovation in the Automotive Sector: A Structured Content Analysis. Sustainability 2017, 9, 880. [Google Scholar] [CrossRef] [Green Version]
  9. Javaid, M.; Haleem, A.; Singh, R.P.; Suman, R.; Gonzalez, E.S. Understanding the Adoption of Industry 4.0 Technologies in Improving Environmental Sustainability. Sustain. Oper. Comput. 2022, 3, 203–217. [Google Scholar] [CrossRef]
  10. Hirz, M.; Brunner, H. ECO-Design in the Automotive Industry—Potentials and Challenges. In Proceedings of the International Conference Management of Technology—Step to Sustainable Production, Brela, Croatia, 10–12 Jun 2015. [Google Scholar]
  11. Stark, J. Product Lifecycle Management (Volume 1); Scribd: San Francisco, CA, USA, 2022. [Google Scholar]
  12. CIMdata, Inc. The Sustainability Imperative; A Value Chain Response to a Systemic Issue; CIMdata, Inc.: Ann Arbor, MI, USA, 2022. [Google Scholar]
  13. Jasiński, D.; Meredith, J.; Kirwan, K. Sustainable Development Model for Measuring and Managing Sustainability in the Automotive Sector. Sustain. Dev. 2021, 29, 1123–1137. [Google Scholar] [CrossRef]
  14. Sharma, M. The Role of Employees’ Engagement in the Adoption of Green Supply Chain Practices as Moderated by Environment Attitude: An Empirical Study of the Indian Automobile Industry. Glob. Bus. Rev. 2014, 15, 25S–38S. [Google Scholar] [CrossRef]
  15. Toth Arpad; Suta Alex Global Sustainability Reporting in the Automotive Industry via the EXtensible Business Reporting Language. Chem. Eng. Trans. 2021, 88, 1087–1092. [CrossRef]
  16. CIMdata, Inc. The Sustainability Imperative: PLM for Green Engineering; CIMdata, Inc.: Ann Arbor, MI, USA, 2022. [Google Scholar]
  17. Schaeffler Sustainability Report. 2017. Available online: https://www.schaeffler-sustainability-report.com/2017/index.html (accessed on 2 December 2022).
  18. Hernandez, M.D.A.; Bakthavatchaalam, V. Circular Economy as a Strategy in European Automotive Industries to Achieve Sustainable Development: A Qualitative Study; United Nations Department of Economic and Social Affairs: New York, NY, USA, 2022.
  19. Zhang, H.; Ouzrout, Y.; Bouras, A.; Savino, M.M. Sustainability Consideration within Product Lifecycle Management through Maturity Models Analysis. IJSOM 2014, 19, 151. [Google Scholar] [CrossRef]
  20. Lehmann, A.; Bach, V.; Finkbeiner, M. EU Product Environmental Footprint—Mid-Term Review of the Pilot Phase. Sustainability 2016, 8, 92. [Google Scholar] [CrossRef] [Green Version]
  21. European Commision Recommendation on the Use of Environmental Footprint Methods. Available online: https://environment.ec.europa.eu/publications/recommendation-use-environmental-footprint-methods_en (accessed on 26 August 2022).
  22. Organisation Environmental Footprint Guide. Available online: https://ec.europa.eu/environment/eussd/pdf/footprint/OEF%20Guide_final_July%202012_clean%20version.pdf (accessed on 6 November 2022).
  23. Marcon, A.; Ribeiro, J.L.D.; Dangelico, R.M.; de Medeiros, J.F.; Marcon, É. Exploring Green Product Attributes and Their Effect on Consumer Behaviour: A Systematic Review. Sustain. Prod. Consum. 2022, 32, 76–91. [Google Scholar] [CrossRef]
  24. Antonacci, A.; Del Pero, F.; Baldanzini, N.; Delogu, M. Holistic Eco-Design Tool within Automotive Field. IOP Conf. Ser.: Mater. Sci. Eng. 2022, 1214, 012045. [Google Scholar] [CrossRef]
  25. McKinsey & Company. This Surprising Change Can Help the Auto Industry Tackle Emissions Goals. Available online: https://www.mckinsey.com/business-functions/sustainability/our-insights/sustainability-blog/this-surprising-change-can-help-the-auto-industry-tackle-emissions-goals (accessed on 10 August 2022).
  26. Hertwich, E.; Lifset, R.; Pauliuk, S.; Heeren, N.; Ali, S.; Tu, Q.; Ardente, F.; Berrill, P.; Fishman, T.; Kanaoka, K.; et al. Resource Efficiency and Climate Change: Material Efficiency Strategies for a Low-Carbon Future; Zenodo: Geneva, Switzerland, 2019. [Google Scholar]
  27. Främling, K.; Holmström, J.; Loukkola, J.; Nyman, J.; Kaustell, A. Sustainable PLM through Intelligent Products. Eng. Appl. Artif. Intell. 2013, 26, 789–799. [Google Scholar] [CrossRef]
  28. Khan, F.I.; Sadiq, R.; Veitch, B. Life Cycle INdeX (LInX): A New Indexing Procedure for Process and Product Design and Decision-Making. J. Clean. Prod. 2004, 12, 59–76. [Google Scholar] [CrossRef]
  29. Zhao, W.-B.; Park, Y.H.; Lee, H.Y.; Jun, C.M.; Do Noh, S. Design and Implementation of a PLM System for Sustainable Manufacturing. In Proceedings of the Product Lifecycle Management: Towards Knowledge-Rich Enterprises, Montreal, QC, Canada, 9–11 July 2012; Rivest, L., Bouras, A., Louhichi, B., Eds.; Springer: Berlin, Heidelberg, 2012; pp. 202–212. [Google Scholar]
  30. Staniszewska, E.; Klimecka-Tatar, D.; Obrecht, M. Eco-Design Processes in the Automotive Industry. Prod. Eng. Arch. 2020, 26, 131–137. [Google Scholar] [CrossRef]
  31. Campos-Guzmán, V.; García-Cáscales, M.S.; Espinosa, N.; Urbina, A. Life Cycle Analysis with Multi-Criteria Decision Making: A Review of Approaches for the Sustainability Evaluation of Renewable Energy Technologies. Renew. Sustain. Energy Rev. 2019, 104, 343–366. [Google Scholar] [CrossRef]
  32. De Luca, A.I.; Iofrida, N.; Leskinen, P.; Stillitano, T.; Falcone, G.; Strano, A.; Gulisano, G. Life Cycle Tools Combined with Multi-Criteria and Participatory Methods for Agricultural Sustainability: Insights from a Systematic and Critical Review. Sci. Total Environ. 2017, 595, 352–370. [Google Scholar] [CrossRef] [PubMed]
  33. Stillitano, T.; Falcone, G.; Iofrida, N.; Spada, E.; Gulisano, G.; De Luca, A.I. A Customized Multi-Cycle Model for Measuring the Sustainability of Circular Pathways in Agri-Food Supply Chains. Sci. Total Environ. 2022, 844, 157229. [Google Scholar] [CrossRef] [PubMed]
  34. Stamford, L.; Azapagic, A. Life Cycle Sustainability Assessment of UK Electricity Scenarios to 2070. Energy Sustain. Dev. 2014, 23, 194–211. [Google Scholar] [CrossRef]
  35. Olawumi, T.O.; Chan, D.W.M. A Scientometric Review of Global Research on Sustainability and Sustainable Development. J. Clean. Prod. 2018, 183, 231–250. [Google Scholar] [CrossRef]
  36. Product Environmental Footprint Guide. Available online: https://ec.europa.eu/environment/eussd/pdf/footprint/PEF%20methodology%20final%20draft.pdf (accessed on 6 November 2022).
  37. Materials Used to Build Cars and Homes Key to Tackling Global Warming. Available online: http://www.unep.org/news-and-stories/press-release/materials-used-build-cars-and-homes-key-tackling-global-warming (accessed on 9 August 2022).
  38. Ciceri, N.D.; Garetti, M.; Terzi, S. Product Lifecycle Management Approach for Sustainability. In Proceedings of the 19th CIRP Design Conference–Competitive Design, Cranfield University, Silsoe, UK, 30–31 March 2009. [Google Scholar]
  39. Smartsheet. Ultimate Product Life Cycle Management Guide. Available online: https://www.smartsheet.com/product-life-cycle-management (accessed on 30 September 2022).
  40. Herbes, C.; Beuthner, C.; Ramme, I. Consumer Attitudes towards Biobased Packaging—A Cross-Cultural Comparative Study. J. Clean. Prod. 2018, 194, 203–218. [Google Scholar] [CrossRef]
  41. Zhao, W.-B.; Park, Y.H.; Lee, H.Y.; Jun, C.M.; Noh, S.D. A Study on Concept Design of a PLM System for Sustainable Engineering; International Federation for Information Processing: Laxenburg, Austria, 2012. [Google Scholar]
  42. Guyon, O. Methodology for the Life Cycle Assessment of a Car-Sharing Service; 2017. Available online: https://www.diva-portal.org/smash/get/diva2:1183366/FULLTEXT01.pdf (accessed on 30 September 2022).
  43. Mildenberger, U.; Khare, A. Planning for an Environment-Friendly Car. Technovation 2000, 20, 205–214. [Google Scholar] [CrossRef]
  44. Messagie, M.; Boureima, F.-S.; Coosemans, T.; Macharis, C.; Mierlo, J.V. A Range-Based Vehicle Life Cycle Assessment Incorporating Variability in the Environmental Assessment of Different Vehicle Technologies and Fuels. Energies 2014, 7, 1467–1482. [Google Scholar] [CrossRef]
  45. Folęga, P.; Burchart-Korol, D. Environmental Assessment of Road Transport in a Passenger Car Using the Life Cycle Approach. Transp. Probl. 2017, 12, 147–153. [Google Scholar] [CrossRef]
  46. Hickey, K. Five Things To Look for in an Automotive LCA. Available online: https://ahssinsights.org/blog/five-things-to-look-for-in-auto-lca/ (accessed on 30 September 2022).
Figure 1. Methodology of the selection and assessment of key green indicators related to the automotive industry in line with GreenPLM concept (own elaboration).
Energies 16 01137 g001
Figure 2. Initial assessment of key green indicators for the automotive industry (own elaboration).
Energies 16 01137 g002
Table 1. List of relevant indicators; own elaboration.
Indicator GroupIndicators
Zhang et al. [19]
EnvironmentMaterials usedEnergy
Gas emissions/PollutionsBiodiversity
Compliance
EconomyInvestmentEconomic Performance
Market PresenceEconomic Effect
SocietyLabor PracticesHuman Rights
Social InfluenceProduct Responsibility
Marcon et al. [23]
Eco-oriented R&DModular DesignEase of Assembly
Ease of Disassembly Reduced number of parts
Reduced weight of components
Sustainable manufacturingUse of remanufactured goods (incl. energy-efficient processes and renewable energy)Use of production waste as fuel
Eco labellingCommunication about raw material origin (incl. origin label, fair trade & country of origin)
Ecolabel and environmental certificationLocal production
Transport efficiency in productionTransport optimisationProduction waste recycling/reuse
Proper elimination of production wasteDesign that promotes production waste reduction/minimisation
Eliminate/reduce effluentTotal reuse of cutting leftovers
Use of low-emission transport (incl. transport with reduced environmental impact)
Water efficiencyProduction intending for recycling/reuse of waterReduced water consumption of products
Production intending for reduced water pollution
Hazardous materialsAbsence (or reduced quantity) of hazardous substances (incl. the absence of toxic substances)Avoidance of the use of hazardous materials and chemicals in production processes
Material efficiencyReduced or zero use of nonrenewable partsReduced use of raw materials (dematerialisation)
Use of sustainable materialsUse of organic products or partsComponents with reduced environmental impact (incl. nonpolluting materials)
Use of lighter metalsUse of natural material
Use of reclaimed/recycled materialsRecycled product and materials
Use of renewable materials for product or packagingUse of wood from reforestation
Khan et al. [28]
Environment, health, and safetyResource depletionGreenhouse effect
Ozone depletionAcidification potential
Oxidation potentialMass of air pollutant released
Mass of water pollutant releasedMass of solid waste disposed
Human health riskEcological risk
Safety risk
Technology Technical FeasibilityProcess conditions
Energy efficiencyHuman–machine interaction
Cost houseFixed costOperation and maintenance cost
Health, safety, and environment cost
Sociopolitical houseSocio-political acceptanceVulnerability of area
Social impacts
Zhao et al. [29]
EnvironmentalMaterials usedEnergy
Emissions/PollutionsBiodiversity
Complience
EconomicInvestmentEconomic Performance
Market PresenceIndirect Economic Effect
SocialLabor PracticesHuman Rights
Social InfluenceProduct Responsibility
Herbes et al. [40]
GeneralNot harmful to the environment Comes with environmental certifications
eco/sustainability/carbon labelsGreen brands
Phase I: Resource extraction <break/>(beginning of life)Remanufactured goodsOrganic material, e.g., organic cotton
Regional biomassEnvironmentally-friendly material
VeganNatural material
Free from toxic chemicalsLegal origin (wood)
Phase I: Use of recycled or renewable resourcesRecycled material Renewable material
Phase II: Production process and supply chain managementLocally made Low carbon footprint/climate-neutral
Environmentally-friendly manufacturing processes
Phase III: During useNonpoisonous -material Electricity and water consumption of the product (appliances)
Long services lifeCost (willingness-to-pay)
Phase IV: Post-use (end of life)Can be recycled/retailer has recycling centre
European Commission [21]
Climate changeOzone depletionHuman toxicity—cancer effects
Human toxicity—noncancer effects
Particulate matterIonising radiation Photochemical ozone formation
AcidificationEutrophication—terrestrialEutrophication—marine
Eutrophication—freshwaterEcotoxicity—freshwater
Land useWater scarcity
Resource use, mineral
Resource use, energy carriersResource use, energy carriers
Staniszewska et al. [30]
DesignWeight of the product and its partsConsumption of fuel
Number of parts
Raw materialsResources usedHazardous materials
Use of materials from recycling
Manufacturing and distributionUse of media (energy and water)Mode of transport
Amount of wasteSize and weight
Use of hazardous materialsDocumentation
PollutionStock
Type of packagingIntensity
End of lifeReuse of partsHazardous waste
Table 2. Semantic integration of indicators groups (own elaboration).
Group of IndicatorsSource
Economic[10,19,28,41]
Environment[10,19,21,23,28,41]
Health and safety—hazardous materials[23,28,41]
Sociopolitical aspects[10,19,28,41]
Technology[19,23,28],
Use of sustainable materials[21,23,30,40]
Waste management and reduction[23]
Table 3. Semantic integration of lifecycle stages (own elaboration).
Lifecycle StagesSource
Resource extraction/material[10,21,39,40]
Design[6,10,30,39]
Manufacturing and distribution[6,10,21,30,39,40]
Use[6,10,21,39]
Post-use [10,21,30,39,40]
Table 4. A list of semantically integrated indicators (own elaboration).
IndicatorSource IndicatorSource
Acidification potential[28] Materials used[8,9,10,19,21,28,29,30]
Biodiversity[29] Mode of transport[30]
Carbon footprint[19,40] Modular design[23]
Components with reduced environmental impact[10,23,40] Number of parts[30]
Consumption of fuel[30] Operation and maintenance cost[28]
Cost (willingness to pay)[40] Oxidation potential[28]
Design that promotes production waste reduction/minimisation[19,23] Ozone depletion[21,28]
Documentation[30] Photochemical ozone formation[21]
Ease of assembly[23] Process conditions[28]
Ease of disassembly[23] Product Responsibility[19,29]
Ecolabel and environmental certification[23,40] Production intending for reduced water pollution[8,23]
Ecological risk[28] Production waste recycling/reuse[23,26,40]
Economic performance[19,29] Reduced number of parts[23,26]
Ecotoxicity of water[21,23] Reduced or zero use of nonrenewable parts[23]
Energy efficiency[10,28,29] Reduced use of raw materials (dematerialisation)[8,23]
Environmental compliance[19,29] Reduced water consumption of products[23,40]
Environmentally friendly manufacturing processes[8,9,10,19,23,24,30,40] Reuse of parts[26]
Eutrophication of water[21] Safety risk[28]
Gas emissions[19,25,26,27,28] Size and weight[30]
Health, safety, and environmental cost[28] Social impacts[10,19,28,29]
Human rights[19,29] Stock[30]
Human toxicity and health risk[21,28] Technical feasibility[28]
Human–machine interaction[28] Transport optimisation[23]
Indirect economic effect[29] Type of packaging[30]
Investment[19,29] Use of hazardous materials[21,23,30,40],
Ionising radiation[21] Use of lighter materials[9,10,23,26,30]
Labour practices[19,29] Use of low-emission transport [23]
Land use[21] Use of materials from recycling[8,30,40]
Local production[23,40] Use of sustainable materials [8,23,40]
Market presence[19,29] Vulnerability of area[28]
Mass of solid waste disposed[28,30] Water usage[19,21]
Mass of pollutants released[28,29,30]
Table 5. Standardised key green indicators with redefined nomenclature (own elaboration).
No.IndicatorExplanationUnit
1Nonpolluting material A logical indicator representing the type of material. If the material is nonpolluting, the value is “yes”; if the material is polluting, the value is “no”.
Types of pollution to be considered: air pollution, light pollution, land pollution, noise pollution, plastic pollution, soil contamination, radioactive contamination, thermal pollution, visual pollution, and water pollution.
n/a (logical value of the indicator—yes/no)
2Hazardous materialA logical indicator indicating if the material is hazardous or not. If the material is hazardous, the value is “yes”; if the material is nonhazardous, the value is “no”.
Hazardous refers to substances or chemicals that pose a health or physical hazard or harm to the environment: explosives/gases/flammable liquid, combustible liquid/flammable solid, spontaneously combustible, and dangerous when wet/oxidizer, organic peroxide/poison (toxic), and poison inhalation hazard/radioactive.
n/a (logical value of the indicator—yes/no
3Lightweight materialA logical indicator indicating if the material is considered lightweight or not. If the material is lightweight, the value is “yes”; if the material is not lightweight, the value is “no”.
To a lightweight material the following materials can be assigned: aluminium, magnesium, beryllium, titanium, titanium aluminides, engineering plastics, structural ceramics, and composites with polymer, metal, and ceramic matrices).
n/a (logical value of the indicator—yes/no)
4Sustainable materialA text (string) indicator representing the type of sustainable material. The value does not necessarily have to be a single choice, it could also be multiple choice (e.g., bio-based and renewable). For material to be sustainable, it must be possible to produce and/or consume it in a way that does not result in harm or destruction.
Examples of sustainable materials: bamboo; wood; hemp; wool; linen; straw; clay, stone, sand; beeswax; coconut; organic cotton; organic linen; and recycled: fabrics, glass, steel, copper, and aluminium.
n/a
5Material carbon footprintA numerical indicator presenting how many greenhouse gases are released throughout the supply chain, and it is often measured from cradle to gate (factory) or cradle to site (of use). Embodied carbon may also be measured with the boundaries of cradle to grave, which is the most complete boundary condition. This includes the extraction of materials from the ground, transport, refining, processing, assembly, in-use (of the product), and, finally, its end-of-life profile. The embodied carbon footprint is, therefore, the amount of carbon (CO2 or CO2e emissions) to produce a material.t CO2
6Material water footprintA numerical indicator presenting the amount of water that is consumed and polluted in all processing stages of its production. A product’s water footprint expresses how much pressure that product has put on freshwater resources. l/kg
7Number of renewable partsA numerical indicator presenting how many renewable parts, meaning parts/components that can be used again in the future—with or without repair/upgrade—are used in the product. The value of the indicator can be further aggregated (e.g., product A (assembly A) is composed of 3 renewable parts, product B (assembly B) is composed of 4 renewable parts, so product C (assembly C = assembly of A + B) is composed of 7 renewable parts in total). pcs. (or units) per product
8Number of reused parts assembledA numerical indicator presenting how many reused parts are assembled in the product. These parts are coming from recycling. Could be with or without repair/upgrade. The value of the indicator can be further aggregated (e.g., product A (assembly A) is composed of 4 reused parts, product B (assembly B) is composed of 2 reused parts, so product C (assembly C = assembly of A + B) is composed of 6 renewable parts in total).pcs. (or units) per product
9Reduced water consumption of a productA numerical indicator presenting that it is valid only when comparing 2 products (e.g., “old” and “new” design). The indicator presents how much water (m3 or l) is used by the product.m3 (l) per product
10Product sizeA numerical indicator presenting the dimensions of a product—length × width × height.m (or m3 when applicable)
11Product weightA numerical indicator presenting the weight of a final product.kg
12Consumption of fuelA numerical indicator presenting the amount of fuel used by a car per 100 km.l/km
13Final product carbon footprintA numerical indicator presenting total greenhouse gas emissions related to the production process.t CO2
14Energy usageA numerical indicator presenting energy used in the production process to manufacture 1 product.kWh/unit
15Water usageA numerical indicator presenting water used in the production process to manufacture 1 product.m3/unit
16Amount of wasteA numerical indicator presenting the amount of material not used in the process (e.g., rest of the metal sheet and turnings) per 1 final product.kg/unit
17Waste recycled/reusedA numerical indicator presenting the amount of waste from a previous product used to create a new product.kg
18Water polluted A numerical indicator presenting the number of pollutants that are either dissolved or suspended in water during the production process.mg/m3
19Use of low-emission transport A numerical indicator presenting the proportion of the use of internal transport based on low emissions to regular emissions. Includes transportation with a reduced environmental impact.%
20Amount of scrapA numerical indicator presenting the number of produced products that have defects per the whole production batch.%
Table 6. Assignment of key green indicators to PLM stages and datasources; own elaboration.
Related toIndicatorData AccessPotential Data SourceValueUnitExample
1MaterialNonpolluting materialexternalEuropean Chemicals Agency Databaseyes/non/amaterial type: steel
value: yes
2Hazardous materialexternalEuropean Chemicals Agency Databaseyes/non/amaterial type: sulphuric acid
value: yes
3Lightweight materialinternalfrom project assumptionsyes/non/amaterial type: aluminium 0% Rec.<break/>value: no
4Sustainable materialinternal <break/>/externalfrom supplier, ecoinvent/GaBi LCA databases, or defined by procurement personnel based on a selection listrecycled, renewable, natural, organicn/amaterial: recycling ferro metals
value: recycled
5Material carbon footprintexternalfrom supplier or ecoinvent/GaBi LCA databasesnumerict CO2material: aluminium *<break/>value: approx. 7 tonnes of CO2e per tonne of aluminium produced
6Material water footprintexternalfrom supplier or ecoinvent/GaBi LCA databasesnumericl/kgmaterial: unalloyed steel
value: 11.83 l/kg
7ProductNumber of renewable partsinternalcalculated based on previously defined material featuresnumericpcs. (or units) per product7 pcs. per product
8Number of reused parts assembledinternalcalculated based on the designer’s definitions for a single partnumericpcs. (or units) per product6 pcs. per product
9Reduced water consumption of productinternalfrom project assumptions and calculationsnumericm3 (l) per product2 m3 per product
10Product sizeinternalfrom CADnumericm (or m3 when applicable)part: 1.2 × 0.9 × 0.5 m
final product (Renault Clio): 4.3 × 1.77 × 1.51 m
11Product weightinternalfrom CADnumerickgpart (engine): 150 kg
final product (Audi A6): 1865 kg
12Final productConsumption of fuelinternalfrom project assumptions and calculationsnumericl/km8.0
13Carbon footprintexternalcarbon footprint calculatorsnumerict CO23.7094
14Production processEnergy usageinternalcalculated based on process plan and maintenance costsnumerickWh/unit15,800
15Water usageinternalcalculated based on process plan and maintenance costsnumericm3/unit4
16Amount of wasteinternalcalculated based on the process plannumerickg/unit73
17Waste recycled/reusedinternalcalculated based on CAD design and process plannumerickg10
18Water pollutedinternalcalculated based on the process plannumericmg/m30.05
19TransportUse of low-emission transportinternalfrom logistic departmentnumeric%80
20ManufacturingAmount of scrapinternalideally: calculated based on MRP, inventory, BOM and process plans
reality: scrap registered for reuse
numeric%3.16%
Disclaimer/Publisher’s Note: The statements, opinions and data contained in all publications are solely those of the individual author(s) and contributor(s) and not of MDPI and/or the editor(s). MDPI and/or the editor(s) disclaim responsibility for any injury to people or property resulting from any ideas, methods, instructions or products referred to in the content.

