Article

Topology Identification of Low-Voltage Power Lines Based on IEC 61850 and the Clustering Method

College of Electrical and Electronic Engineering, Shandong University of Technology, Zibo 255000, China
*
Author to whom correspondence should be addressed.
Energies 2023, 16(3), 1126; https://doi.org/10.3390/en16031126
Submission received: 15 November 2022 / Revised: 9 January 2023 / Accepted: 17 January 2023 / Published: 19 January 2023
(This article belongs to the Special Issue Data-Driven Large-Scale Power System Operations)

Abstract

:
The large-scale access of distributed power puts forward higher requirements for the monitoring of the distribution networks, and the topology identification of low-voltage power lines can effectively promote the integration of monitoring data and the distribution network information, effectively realizing the rapid identification of faults and ensuring the safety of users. In this paper, the method of graph theory was used to simplify the analysis of low-voltage lines, and the full topology identification strategy was proposed. Based on IEC 61850 SCL topology configuration information, line topology identification within the region was realized, and the correlation between regions was determined by the injection method. According to the configuration information, regional association information, and user’s collection information, the low-voltage station area line topology was divided into known regional topology and unknown regional topology. Aiming for the identification of line topology in the unknown region, according to the similarity of voltage fluctuations over short electrical distances, clustering analysis of user’s voltage data in the unknown region was carried out based on the k-means clustering algorithm. The test results showed that this scheme can realize the identification of topology in the region.

1. Introduction

With the development of a new power system, a distributed energy resource (DER) is connected to the distribution network on a large scale, and part of it is connected to the low-voltage distribution network. It is important to prevent the misoperation of the DER, which can lead to a large proportion of the network being off the grid, triggering large-scale blackout events (such as the UK 8 9 blackout accident). For this reason, the IEEE 1547 standard stipulates that the DER should have a certain anti-disturbance capability. In addition, due to the anti-islanding protection action, time becomes longer and power safety accidents occur more easily, highlighting the need for the effective monitoring of low-voltage distribution networks. Low-voltage line topology identification, as an important support for low-voltage distribution network monitoring, can achieve rapid location for fault arc detection, fault ranging and other faults, to improve the safety of users of electricity [1,2,3]. However, when there are more alterations and expansions of the distribution networks, this information is often not unified and updated in a timely manner, etc., resulting in the unclear line topology of low-voltage distribution networks. The complex topology of low-voltage distribution lines and frequent topology changes make it difficult to identify the low-voltage line topology and impact the electrical safety of users, so the rapid and accurate identification of line topology has important practical significance.
To solve the interconnection and interoperation of the MV distribution network, IEC 61,850 standard is widely used in MV distribution networks for monitoring and control, and the identification of MV distribution network line topology can be realized based on IEC 61850. The authors in [4] proposed a distribution network line topology model based on the process and line elements of the substation configuration description language (SCL) extension of IEC 61,850 for implementing distributed applications. The authors in [5] described the feeder topology based on IEC 61,850 with new topology logical nodes and topology slices, and realized the real-time topology identification of feeders using search algorithms to meet the requirements of the distributed feeder automation monitoring applications. The authors in [6] proposed two-line topology identification methods based on a ring area and domain topology, using search algorithms to obtain connected paths and using inter-terminal communication to achieve the autonomous identification of the line topology. The configuration information of topology is the basis for advanced applications to realize information exchange. The convergence and utilization of low- and medium-voltage data could be better realized if the IEC 61,850 standard was adopted for low-voltage distribution networks. However, the same line topology identification method cannot be directly adopted because the structure of low-voltage and MV lines are different.
The current research on topology identification for low-voltage distribution networks mainly contains three aspects. The first involves realizing the topology identification of the station areas, transformer–line–user, by comparing the information obtained from outage users through the orderly outage of the station areas, which cannot identify the hierarchical structure of branches [7,8]. The second involves using the injection method, by injecting small current signals, pulses or carrier signals. The authors in [9] identified whether the switch sub-nodes associated with the low terminal unit (LTU) contained the injected reactive power compensation characteristic signals. The connection relationship of the switch levels was also obtained using edge calculation. The authors in [10] used a top-down approach with a high-frequency signal (5 MHz) injection for the identification of connected users on low-voltage lines. The signal injection method has a good topology identification capability due to its clear principle [11]. However, it can only identify the connection relationship between regions, but not the topology within the region; at the same time, it cannot identify the line topology of the region without LTU monitoring. The third involves using data correlation algorithm (e.g., Pearson correlation coefficient method and Tanimoto similarity) methods to conduct similarity analyses, based on the electricity consumption information of users (e.g., voltage, power) [12,13]. In [14], the identification of the transformer–user relationship was achieved by calculating the T-type gray correlation degrees of the voltages between the users and the station area to which it belongs, and then judging the station area using the k-nearest neighbor algorithm for users below the threshold value. The authors in [15] extract data coarse-grained spatial features based on the α-clippage and α-skewness of user voltage fluctuation curves, and use a density-peak clustering algorithm to identify the household variation relationships of all users. The authors in [16] used a combination of principal component analysis (PCA) and convex optimization to reduce the dimensionality of the power dataset and improve the accuracy of the topology identification. It does not need to add additional equipment; however, the large volume of electricity consumption data and complex algorithms find it difficult to realize low-voltage intelligent terminals. The k-means clustering method is widely used in distribution networks to achieve transformer–user topology identification because of its simplicity, fast convergence, and high efficiency. The work of the authors in [17] is based on voltage-dependent k-means clustering, which determined whether the line topology had changed by comparing the voltage clustering results of adjacent sliding windows. The authors in [18] used piecewise aggregate approximation (PAA) to extract the main features of the transformer-side and user’s voltage curves, then analyze the local variation trend by first-order derivatives with dynamic time warping (DTW), and finally perform k-means clustering based on the similarity measure of voltage morphological features to achieve topology identification. Therefore, the above identification methods alone do not effectively solve the problem of identification of low-voltage lines topology. At the same time, the existing research mostly focuses on the identification of line topology in the whole area of the station area, but there may be some line topologies known in the station area, so the identification of line topology in the whole area of the station area is likely to cause a waste of resources.
In order to realize the effective monitoring of low-voltage distribution networks and ensure the safe electricity consumption of the end users, in this paper, a full topology identification strategy has been proposed. For the regions that satisfy the injection method, the configuration of the regional lines topology was realized based on the IEC 61,850 substation configuration description language (SCL), and the identification of the correlation between regions was realized using the injection method. The station area line topology was divided into two categories: known regions and unknown regions, by comparing the configuration information with the data of the metering automation system. The k-means clustering algorithm based on voltage similarity was used to cluster and analyze the voltage data of users in the unknown area only, to achieve the identification of line topology in the unknown regions, and the feasibility of the scheme was tested using the actual customer voltage data.

2. The Representation of Low-Voltage Line Topology

The topology identification of low-voltage distribution lines is the basis of monitoring and managing the distribution network and ensuring the safety of users. At the same time, it is not only the basis of the plug and play applications of APP, but it also plays an important role in fault location and processing. The analysis of the topology structure of a low-voltage distribution network is the basis for identifying the topological changes caused by the new network wiring structure [19].

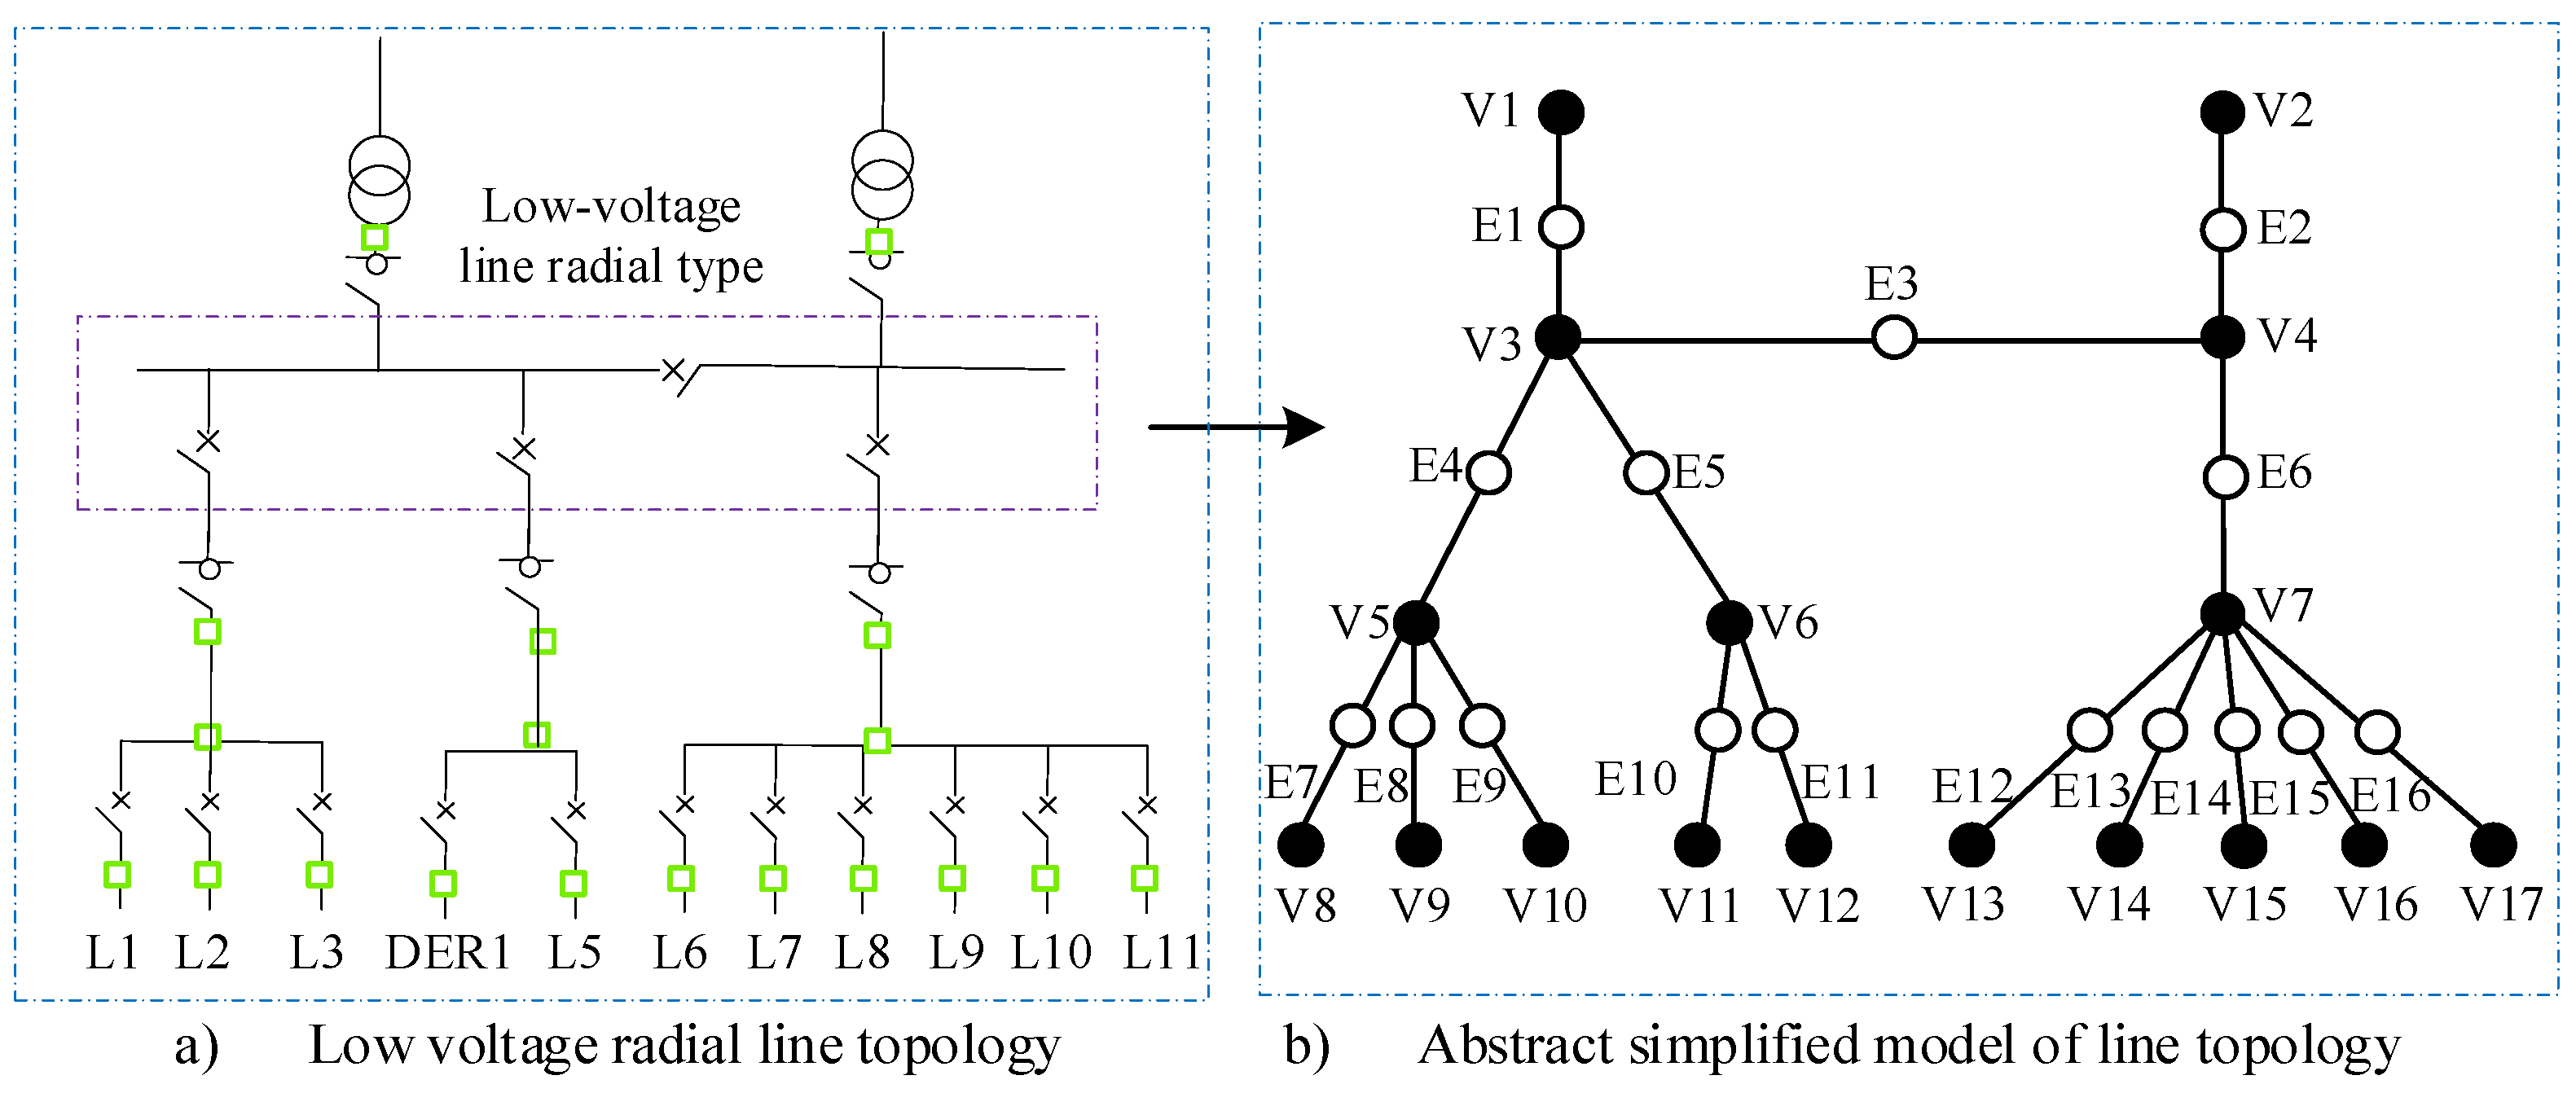
2.1. Mathematical Description Based on Graph Theory

The line structure of a low-voltage distribution network is an overall structure formed by the connection of electrical components. When performing topology analysis, the characteristics of the components are ignored because only the topological connections are of interest. The low-voltage distribution network lines are abstracted as a set of edges and nodes for the low-voltage distribution network. The connection relationships between nodes and edges and between nodes and nodes in the diagram reflect the association relationships between topological blocks.
The network structure graph G = ( V , E ) consists of the vertex set V and the edge set E. The low-voltage distribution network line topology is modeled as a triplet G = ( V , E , S ) , and let G contain n vertices, m edges and k switches. The set of nodes in the low-voltage distribution network is expressed as V ( G ) = { V 1 , V 2 , V 3 , , V n } , which mainly includes the transformer node, load node, the connection node of different lines etc. The set of low-voltage line edges is represented by E ( G ) = { e 1 , e 2 , e 3 , , e m } , that is, the set of lines connected to the nodes of the low-voltage distribution network. For convenience of simplification, all switches on one side (load switch on the edge, circuit breaker, etc.) are represented as S k , S k [ 0 , 1 ] . If the value is 0, the switch is off. If the value is 1, the switch is on. If there are multiple switches on one side, as long as one switch is off, the value is 0.
The association between nodes and edges can be divided into the following forms: (1) When the switch is closed, if the node is the end point of an edge, the node is associated with the edge; if two nodes are the end points of the same edge, the two nodes are adjacent; if two nodes are associated with the same edge, the two edges are adjacent. (2) When the switch is off, the association between the node and the edge needs to be judged again. The number of edges associated with a node can be expressed in degrees as deg G V x , 0 deg G V x n ( n 1 ) / 2 .

2.2. The Mathematical Model of Line Topology Identification

Line topology identification of low-voltage distribution networks mainly includes two aspects. The first is the static topology, which represents the connection between electrical components. The second is the dynamic topology, which includes the state change in the switch on the basis of the static topology. By transforming the physical model of the node, edge and switch state and phase line change into the mathematical model of the transformer, edge and switch description, the analysis of low-voltage topology is realized. The transformer/load/DER is represented as a node of the graph. The node is static, because it does not change due to the state change in the switch. Edges are dynamic, depending on the state of the switch. For topology analysis, the actual low-voltage distribution network needs to be mapped into a graph. There is a correspondence between the line topology and the diagram, and each low-voltage topology line can be represented using the graph. The mapping relationship between the topology line and the graph can be expressed as E t o t a l G t o t a l , where E t o t a l is the set of all topological lines, G t o t a l is the set of all graphs and e E t o t a l , g G t o t a l , m a p ( e ) = g indicates that any low-voltage topology can be represented as a graph. In Figure 1a, a simple radial-type line graph of a low-voltage distribution network is shown. The connections corresponding to Figure 1b are shown in Table 1.

3. Line Topology Analysis

With the development of low-voltage distribution, the Internet of Things, the large-scale development of low-voltage distribution terminals, intelligent collection devices and smart meters, etc., massive voltage, provide current and other operational data for the development of distribution network informatization. The effective analysis of low-voltage distribution line topology is beneficial to achieve the identification of low-voltage line topology using data mining and other techniques.

3.1. Structure of Low-Voltage Line Topology

The low-voltage distribution network is generally made up of independent or two standby station area transformers after voltage reduction, through radial-type, trunk-type or ring-type wiring, or a combination of various ways to access the end user [20]. This can be seen in Figure 2. The urban distribution network mainly adopts radial-type wiring [14], while industrial plants and road lighting mainly adopt trunk-type wiring.
Due to the various wiring modes, it is difficult to identify the whole topology of the low-voltage distribution network with a single identification method. The main reasons for this are as follows:
Transformer. Low-voltage distribution networks are generally composed of independent or two standby transformers. When one side of the transformer fails, the transformer on the other side will supply power by closing the switch, causing a change in the relationship between the users and the transformer.
Monitoring equipment. As the low-voltage topology is connected to the user side, monitoring devices are easily affected. In addition, due to the impact of terrain and cost, some lines have missing monitoring, so it is easy for the incomplete identification of lines to occur.
Phase line identification. This is due to the different load users and the number of users connected by different phase lines in the same station area. Residential users have more single-phase wiring, while large factories, large shopping malls, etc., have more three-phase wiring. When carrying out load transfer and fault location, it is necessary to know exactly which phase line the load is located on in order to facilitate the development of a plan; however, the line is complex and the wiring is not standardized, etc., causing difficulties in identifying the phase line.
Unclear property rights and records. Some cells have unclear asset allocation, and there are no records of line structures, such as for rural power lines, resulting in unclear low-voltage line topology.

3.2. Voltage Data Analysis for Low-Voltage Station Area

The MV busbar of the distribution network depresses through the step-down transformer in the station area to form the low-voltage busbar of the distribution network. The low-voltage busbar transmits electrical energy to end users through distribution equipment. It forms different power supply areas, while the single station area of the low-voltage distribution network is the smallest unit of the low-voltage distribution network, as shown in Figure 3. Due to the low reactive load in the station area and the reactive power compensation device, the influence of the reactive power component during the voltage drop is ignored when conducting the theoretical derivation analysis.
The voltage relationship of the nodes of the radial-type low-voltage line can be expressed as Formula (1) [11]. Without considering the access of the DER, the voltage data of the station area should meet Formula (2).
V 0 = V n + j = 1 n R j P j + X j Q j V j 1
0 V n V n 1 V i V 0
Without considering the access of the DER, it can be seen from Formula (1) that the node voltage of the radial line in the low-voltage distribution network gradually decreases along the low-voltage line. The size of the voltage data should meet Formula (2). The upstream and downstream relationship of the low-voltage topology line can be distinguished through the voltage data at the same time.
In the same station area, the voltage data of nodes with a similar electrical distance is affected by the outgoing voltage, impedance value and the active and reactive power of the line in the station area. As the low-voltage distribution line contains a reactive power compensation device, the influence of the reactive power is ignored. When the electrical distance is closer, the outgoing voltage, impedance value and active power value of the line in the station area are more similar, and the voltage variation trend in the nodes is more similar. Figure 4 shows the voltage data curves of seven nodes in three non-adjacent station areas of a university on the same day. It can be seen from Figure 4 that although the voltage data in the same station area are not the same numerically, they are similar in the variation curves of the same day. The trend in voltage variation between different station areas is not similar.
The nodal voltage of the low-voltage distribution network line is generally affected by the following aspects: (1) The voltage value of the transformer busbar in different station areas; (2) The sum of the upstream transmission power of the low-voltage distribution line of the phase line; (3) The upstream line loss of the low-voltage distribution line of the phase line. Therefore, when the electrical distance between the two voltage nodes is relatively close (the distance between the two voltage nodes is relatively close, and the sum of the upstream transmitted power and the line loss are not significantly different), the voltage changes in the two nodes are similar [21], and the line voltage changes in the same phase in the same station area are more similar [20]. Affected by the three-phase unbalance in the station area, there is a voltage difference between the low-voltage busbar of the distribution transformer at the same time between two similar points, so the voltage of two points with a close electrical distance or different phase lines of the same point may also be different, as is shown in Figure 5. The three-phase voltage change curve of the 1#A line is shown in Figure 4. Therefore, the identification of phase line plays an important supporting role in the identification of low-voltage distribution network topology.

4. Full Topology Identification Strategy

The topology of low-voltage distribution IoT is complex, and because it is connected to the user side, it is easy to change the topology. As was shown by the authors in [22], medium-sized cities across the country contain tens of thousands of distribution transformers, and line topology identification using the currently common signal injection or big data similarity approaches is highly likely to cause network blockages. Therefore, according to the SCL configuration information based on IEC 61850, this paper divided the distribution network topologies into known region topologies and unknown region topologies. The correlation relationship of known area topology was realized by the injection method, while the configuration information of the line topology was combined to realize the judgment of the unknown area. By identifying the topology of the line in the unknown area, the whole topology of the whole station area can be recognized.

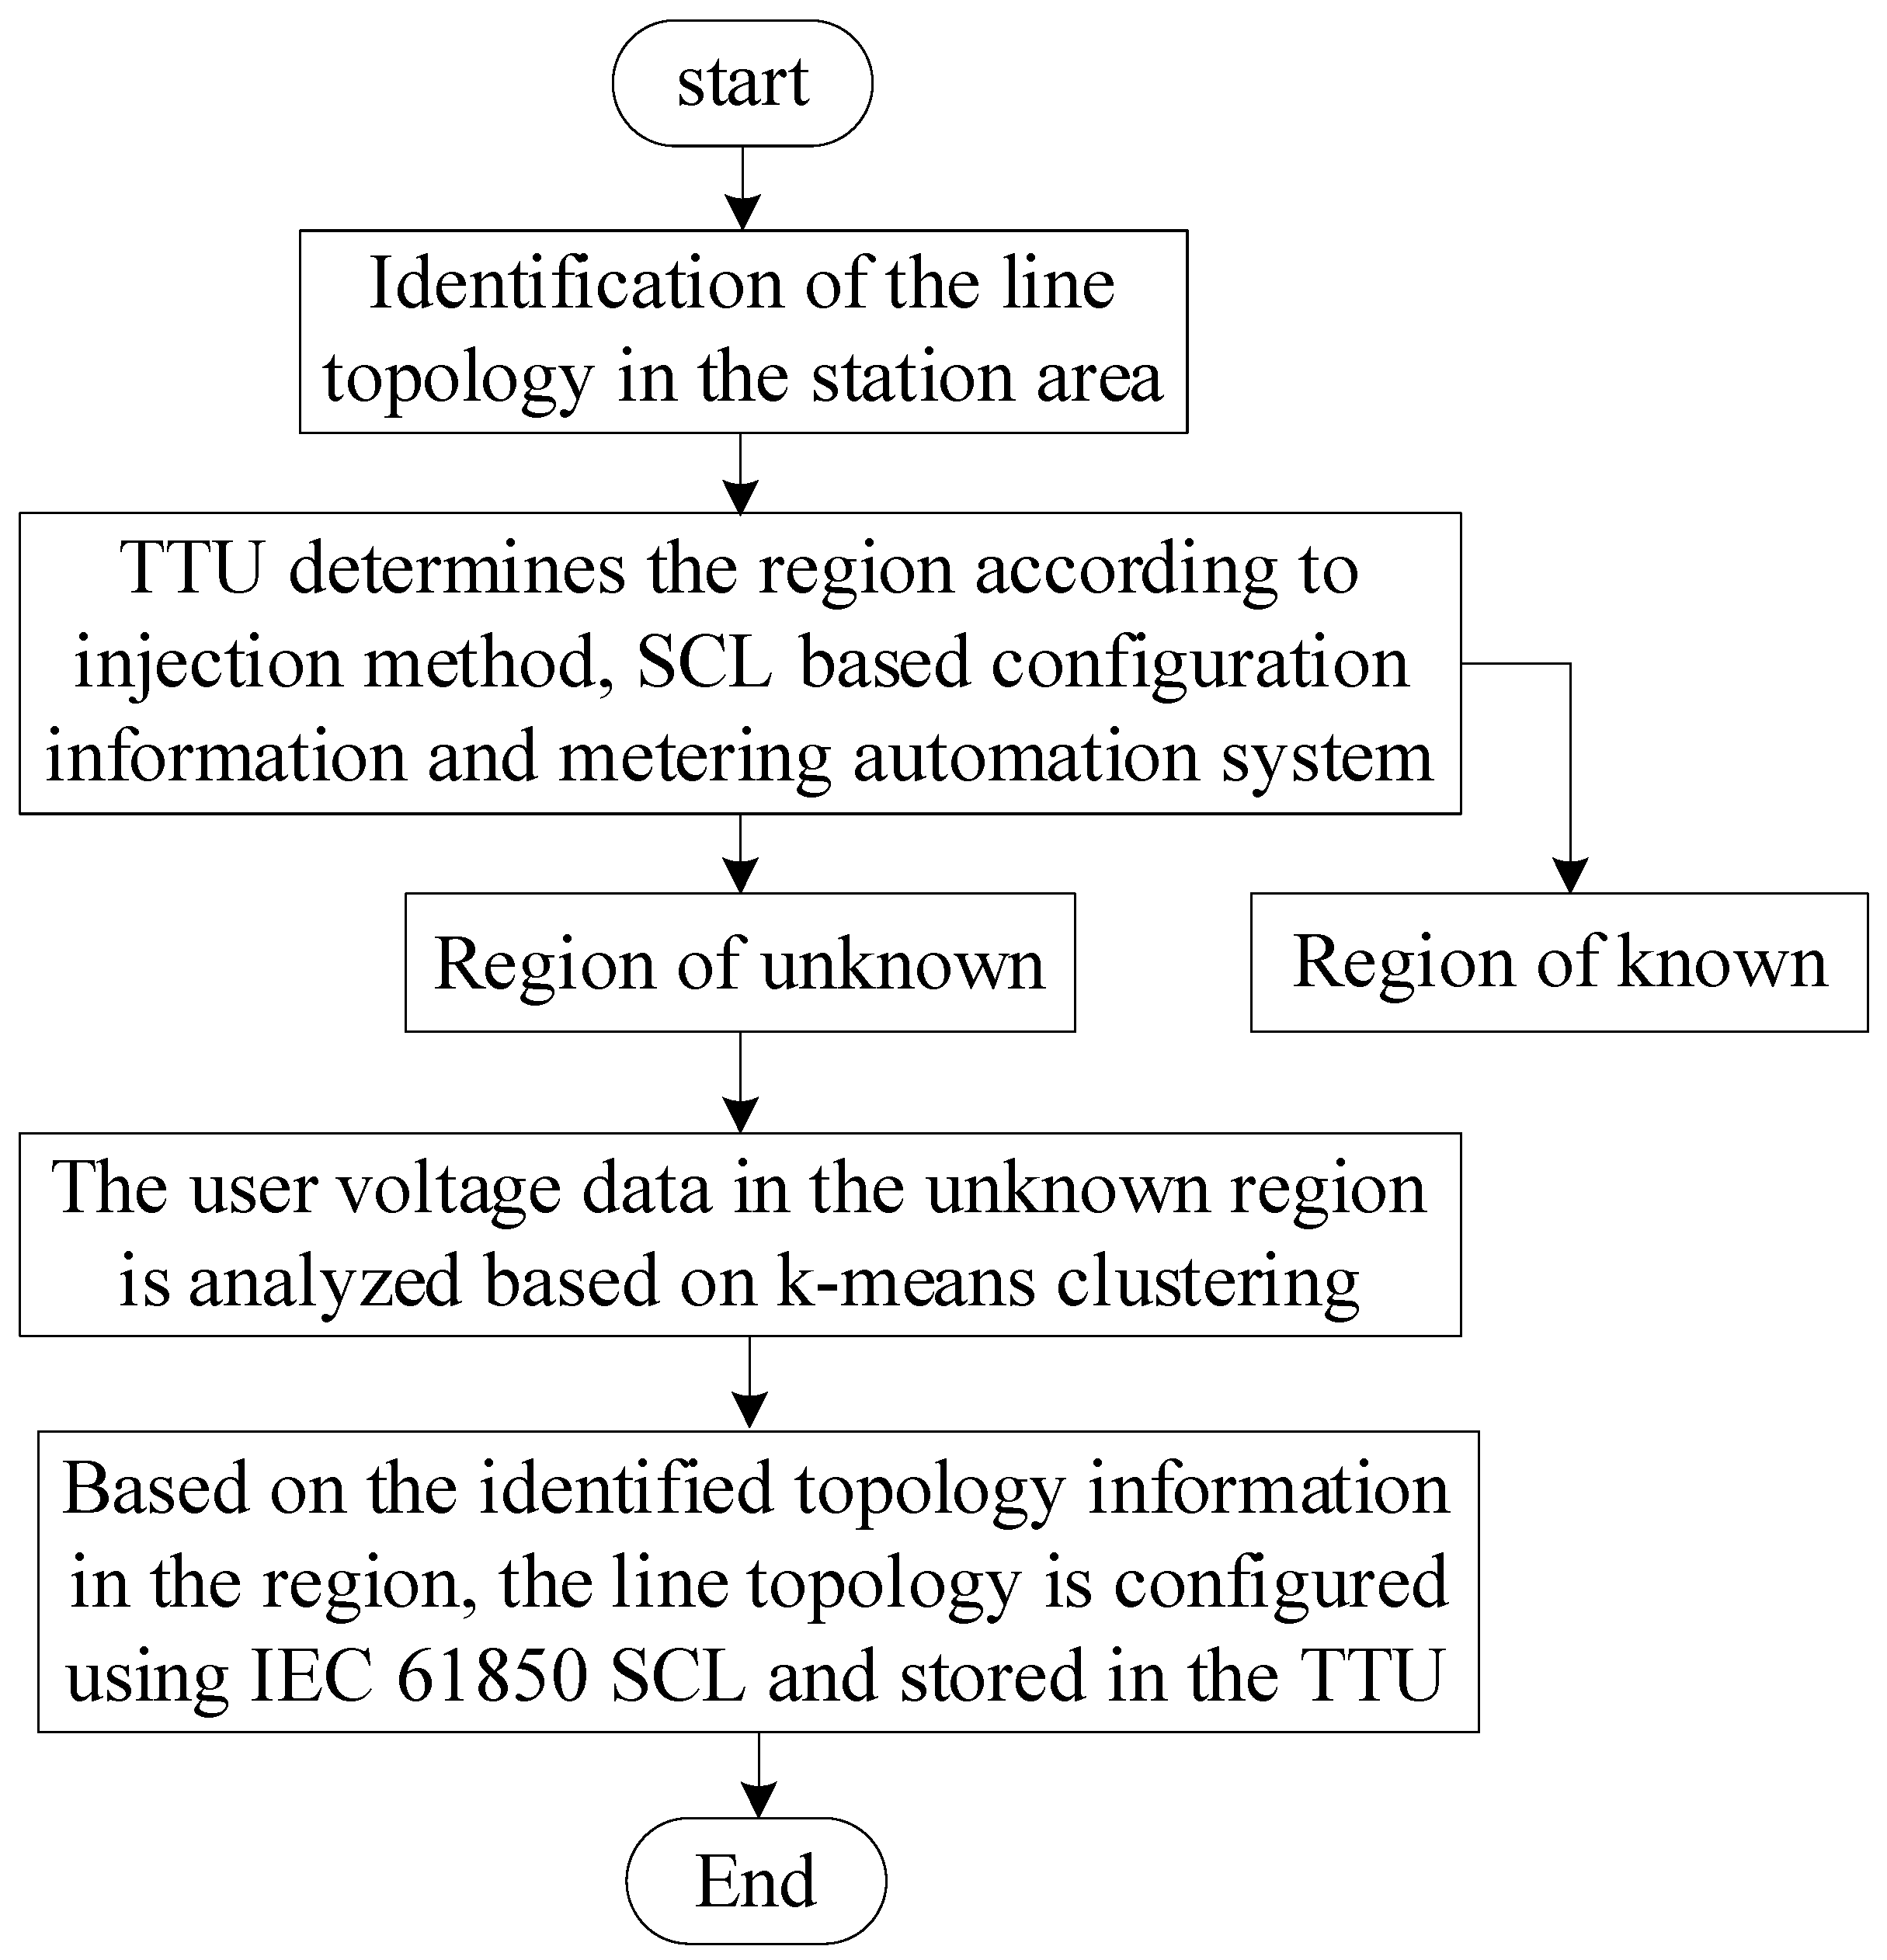
4.1. The Division Method of the Region

The low-voltage line topology was modeled as an undirected graph G, according to Section 1. The transformer node was taken as the root node (e.g., V1 and V2), the end load or the DER was taken as the leaf node (e.g., V8 and V11), and the nodes where lines intersect were taken as branch nodes (e.g., V3 and V4). Assuming that this area is monitored by n LTUs, the low-voltage line is divided into n small areas, according to the monitoring range of LTUs, and an undirected graphG is divided into n subgraphs, as is shown in Figure 6.
When the identification station area is equipped with LTUs, the area can be divided using the field segmentation, as is shown in Figure 5 (as is shown in the black area). Due to the limitations of equipment cost, later operation, maintenance cost and human resources, the LTU coverage rate of most low-voltage distribution networks is not 100%, and there are cases where LTUs are damaged or not installed (as is shown in the blue area), which cannot be divided according to the detection range of LTUs, so its area division is mainly divided into the following cases:
(1)
Missing line segment from station area transformer (the area where Figure LTU2 is located). It is known that the meter layer of this station’s shutdown area contains two meters of information, and the identified line topology information contains only one station area transformer, so it was judged that the topology information of this area was missing.
(2)
The branch node region was missing (the region where LTU3 is located in Figure 5). When using the injection method for inter-region line topology identification, if S3 is disconnected, LTU1, LTU5 and LTU6 can all be identified to receive signals. Based on the IEC 61,850 SCL configuration information, the line topology within the region can be obtained and, combined with the signal awareness information, it can be seen that there is no line connection between the line topologies of LTU1, LTU5 and LTU6, so the branch node region was judged to be missing.
(3)
The leaf node area was missing (the area where LTU6 is located). Missing or not, the installed LTU can cause the leaf node area to be missing. Based on the SCL configuration information of IEC 61850, it is known that the branch node area contains outgoing line information, but no leaf node area contains incoming line information; therefore, it was judged that the leaf node area downstream of this branch node area was missing.
(4)
Multiple regions were missing. This includes the root node region and branch node region disappearing at the same time, or the root node region and leaf node region disappearing at the same time, or the branch node region and leaf node region disappearing at the same time. If LTU3 and LTU6 are missing at the same time, it is known from the configuration information of LTU1 that it contains two outgoing lines; however, there is no branch node region containing the same incoming line information, so it was judged that the branch node region and the leaf node region were all missing.
(5)
The full domain was missing. If the full domain does not contain an LTU, the distribution transformer supervisory terminal unit (TTU) does not store the line topology configuration information related to the station area. However, according to the electricity collection system, the area contains a large number of electricity users, so it was judged that all of this area was missing.
According to the different areas, topology identification can be performed by identifying only the line topology information of the unknown area without identifying the full domain line topology, thus reducing the waste of resources for topology processing data. According to Section 2, it is clear that in the topology of the low-voltage distribution network, the voltages between neighboring nodes have similarity, for example, nodes V5 and V6 [16]. For the identification of the unknown area line topology, data mining can be performed on the voltage data of transformer outgoing lines, branch box incoming and outgoing lines and customer meters, and the voltage monitoring data can be obtained for clustering analysis. Using the characteristics that the upstream and downstream nodes between adjacent nodes and in the same area are similar to the parallel structure in terms of the electrical–physical relationship, and they have consistency or similarity in terms of voltage, the topology of the same area was judged. The identified topology could also be verified based on historical fault information, planned outage information and restoration of power-up information, as well as outage status and charged status.

4.2. Topology Identification Combination Strategy

The injection signal method is widely used because it has a good topology identification rate and enables automatic topology updates. However, most of the current research for the injection signal method has been to detect whether the LTU recognizes the characteristic current (small current), and thus determines whether the transformer–line–user is on the same line. However, this method does not identify the topological information for the domain where the LTU is missing or does not meet the installation of the LTU. With the development of the IoT in power distribution networks, smart collection devices and smart meters provide massive data for topology identification. Furthermore, the data were analyzed through deep mining to obtain the full-domain topology of the line, which does not require additional equipment costs and can be widely used for re-clustering calculations after the topology changes. However, the number of low-voltage users is large, and data analysis and processing of massive data can easily cause network blockage and waste of resources. It is difficult to effectively identify the full-domain topology of low-voltage distribution networks using a single identification method. Therefore, this paper adopted the IEC 61,850 SCL configuration information combined with the injection method to determine the correlation between regions and to achieve the identification of known regional line topology. For the identification of the line topology in unknown regions within station areas that do not have injection method conditions, the k-means based clustering analysis method was used.
If the low-voltage distribution network station area meets the conditions of the injection method, the whole area line topology identification can use the injection feature current method to obtain the association relationship of the area. The regional topology information can be obtained by combining the configuration based on the IEC 61,850 SCL, and the topological connection relationship between regions can be obtained using the search algorithm, so as to obtain the full-domain line topology information. If the station area cannot meet the conditions of the injection method in some areas, the unknown area can be determined based on the configuration information of the IEC 61,850 SCL combined with the user information of the metering automation system, and the line topology identification of the unknown area can be realized based on the k-means clustering. After the unknown area line topology information is identified, the line topology information can be configured based on the IEC 61,850 SCL and stored in the TTU for advanced application recall. The specific process is shown in Figure 7.

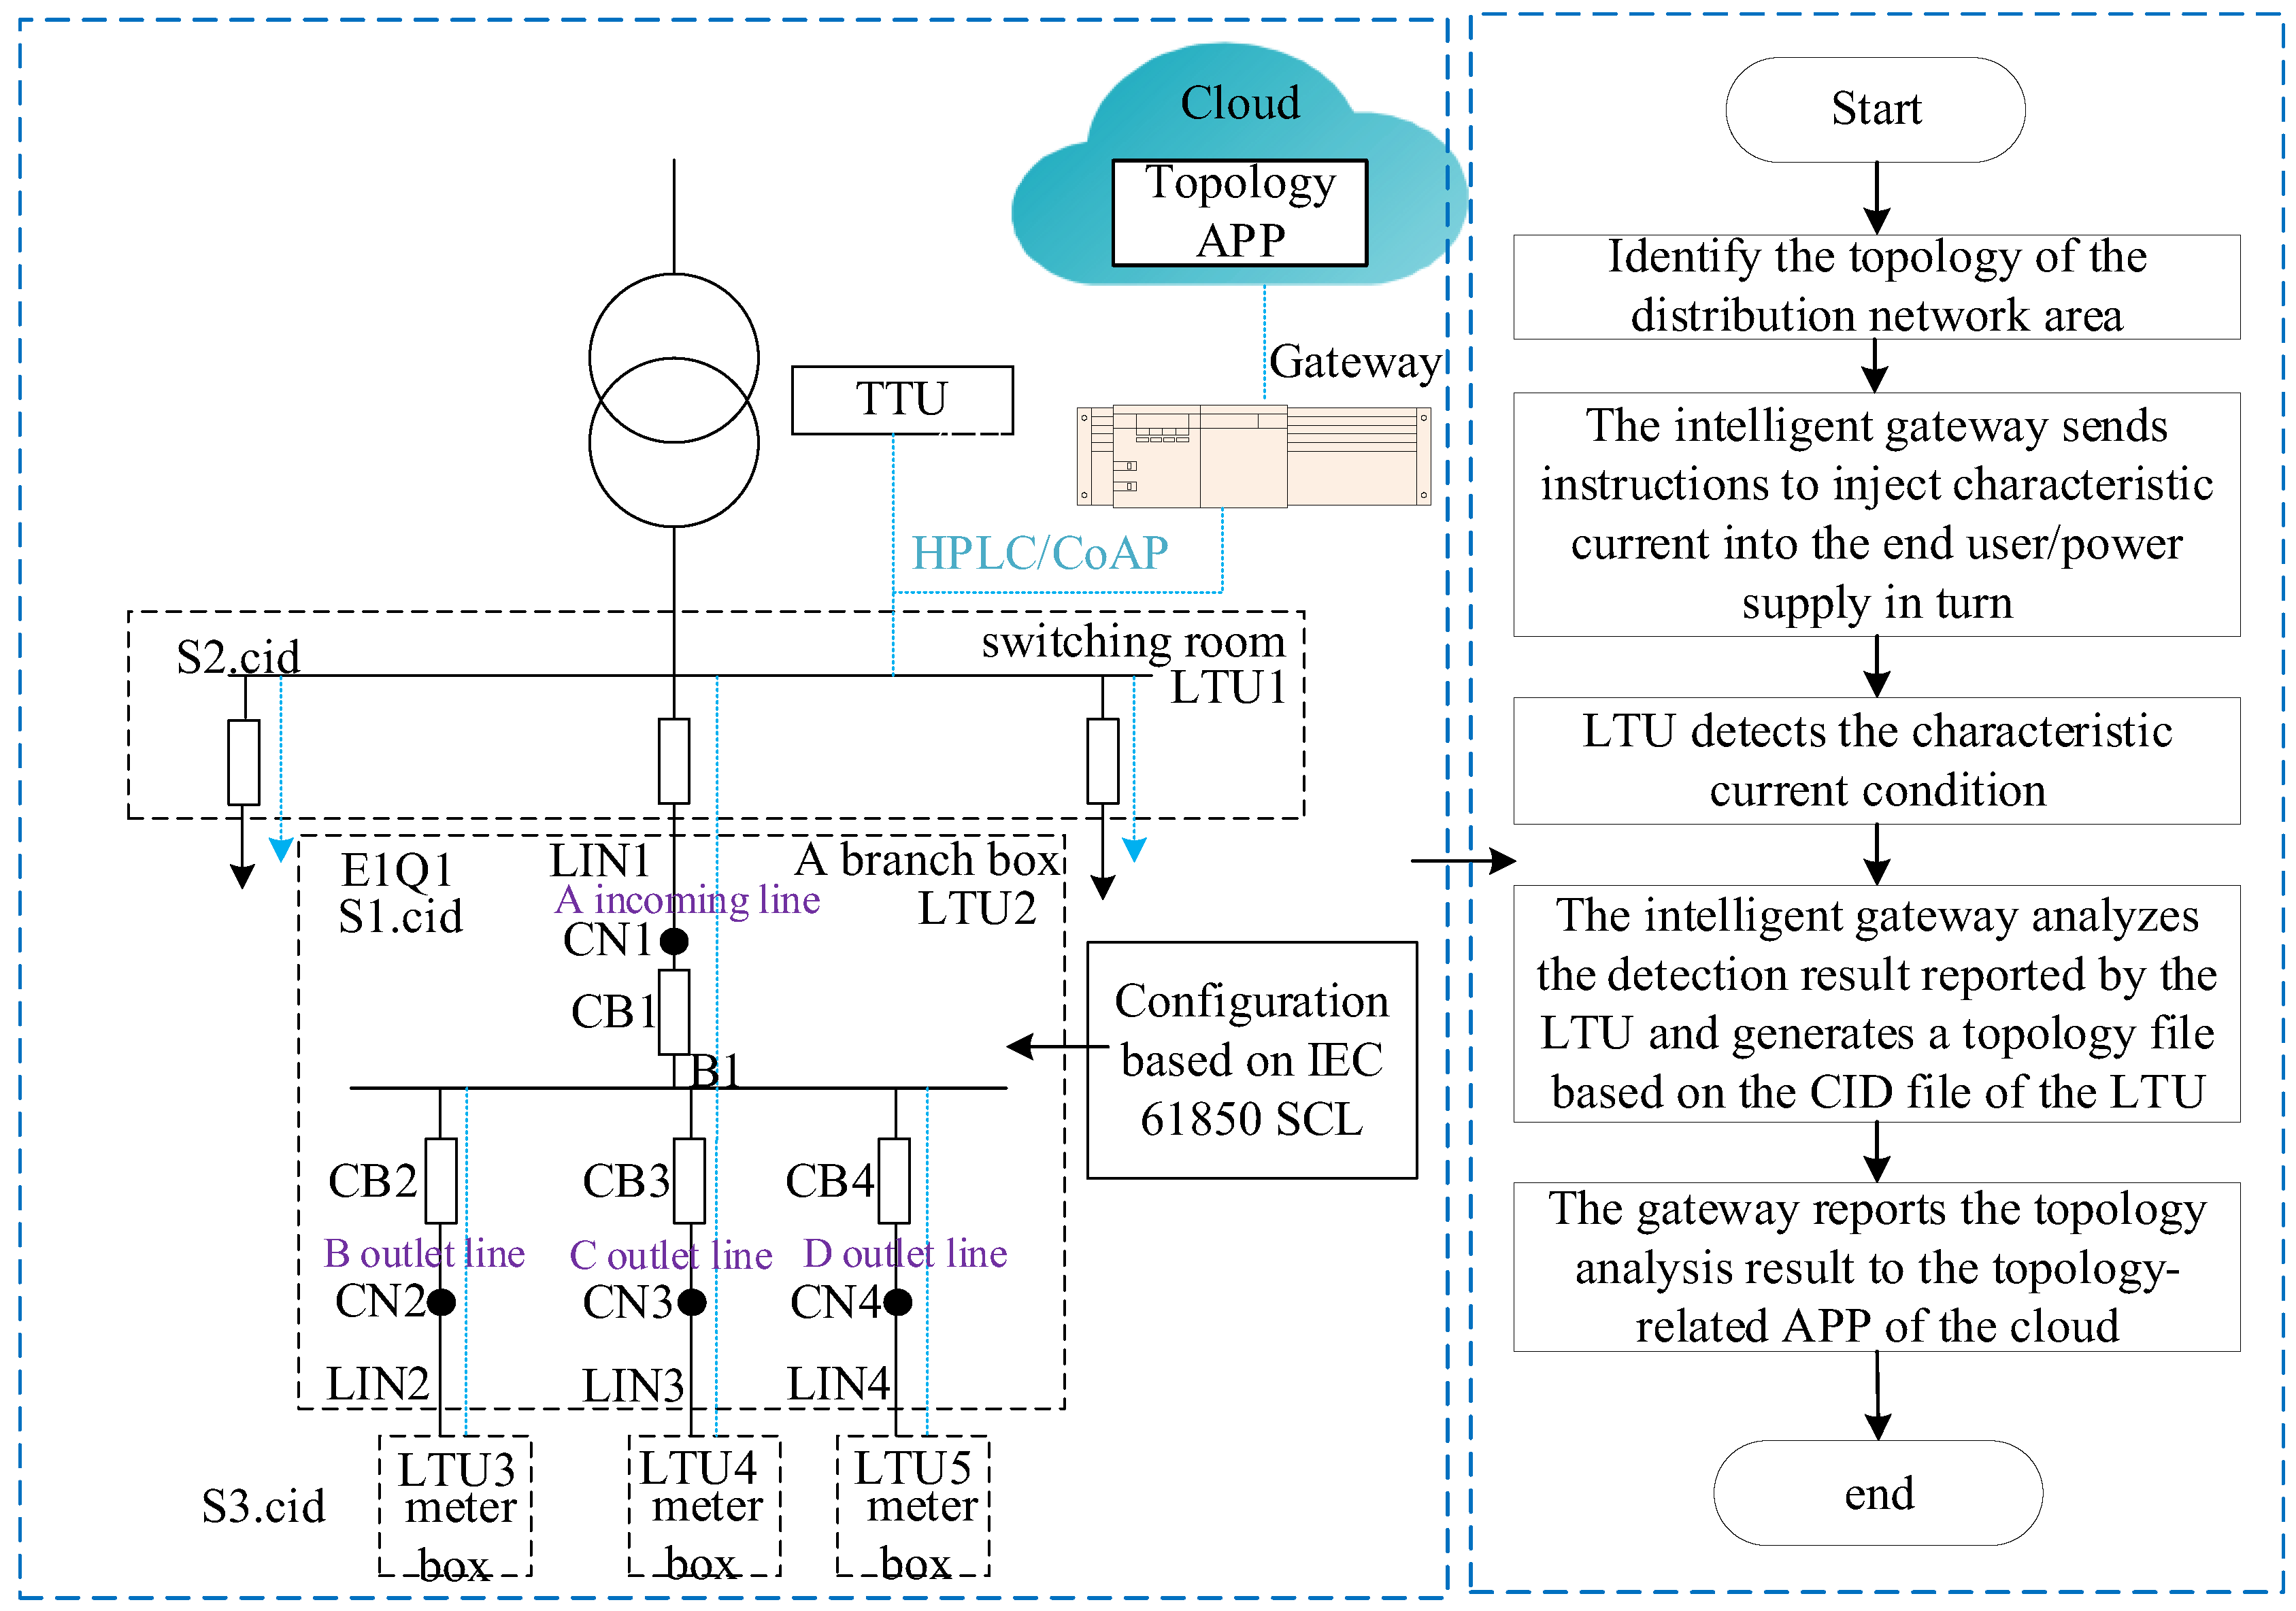
5. Region Topology Identification Method Based on IEC 61,850 SCL

During the topology identification of a low-voltage station area, if the station area is equipped with an LTU for monitoring, the region can be divided according to the monitoring range of the LTU. The correlation between regions can be identified by injecting the characteristic current. The injection method has been implemented by the same research group [10]. Its high-frequency signal is injected at the power point and in series with an inductor to prevent the high-frequency signal from propagating upward, and the path of the downstream line is judged by detecting the high-frequency signal. At the same time, a disturbance signal is injected at the load, and the load topology relationship is judged by determining the magnitude of the disturbance current. Based on this, it is only possible to determine which regions are on the same line, relying on the search algorithm to determine the upstream and downstream connections between different regions within the station area, while the topology information within the region is not identified. Therefore, this paper adopted the SCL configuration acquisition based on IEC 61,850 to determine the full-domain topology of the low-voltage station area. As the breadth first search (BFS) and depth first search (DFS) are mainly used in the search algorithms, DFS emphasizes the repeated search, which is slow in speed and occupies a large amount of memory. In considering the LTU’s memory and CPU, BFS was chosen. Due to the complex environment of the low-voltage distribution network line deployment, it is difficult to achieve full signal coverage with a single communication method. High broadband carrier waves (HPLC) rely on the power line network, which does not require construction wiring, has a fast communication speed and is widely combined with wireless communication to enhance communication performance. Considering the limited resources of the LTU, the constrained application protocol (CoAP), which is designed for resource-constrained equipment, was selected to combine with HPLC to achieve the relevant communication. The topology flow of the injection method based on SCL is shown in Figure 8.
The overall identification process was as follows:
(1)
Initiate topology identification in the station area. The smart gateway sends topology identification commands to the associated LTU via communication., by injecting characteristic currents at the end user/power source.
(2)
The associated LTU detects whether the characteristic current flows. If the end user injects characteristic current at the LTU3 of the meter box, the characteristic current can be detected at LTU3, LTU2 and LTU1.
(3)
LTU uploads the detection results and configured IED description (CID) file to the smart gateway. For example, LTU3–LTU2–LTU1 are located on the same line. Similarly, LTU4–LTU2–LTU1 are located on the same line. According to the BFS algorithm, the upstream and downstream connection relationship of the platform area is LTU1–LTU2–LTU3–LTU4–LTU5.
(4)
The smart gateway analyzes the CID file sent by the LTU, which can be known based on the IEC 61,850 SCL regional topology, and generates the topology file of the station in combination with the upstream and downstream connections of the station area.
For the configuration of the region topology in the CID file, a scheme based on the IEC 61,850 SCL for region configuration was used. The monitoring area of the entire LTU was modeled as a substation, and the substation’s name should be unique during modeling. A region was treated as a bay and its corresponding description (line, substation, etc.) was described by a description field. Modeling in accordance with the substation–voltage –bay–conducting equipment hierarchy was necessary in order to configure it. As the region was modeled as a bay, the switches, lines and connection nodes in the region should be unique in the region. Taking the A branch box in Figure 7 as an example, the configuration based on the IEC 61,850 SCL generated a S1.cid file to facilitate the identification of the topology in a region. The specific configuration is shown in Appendix A.
When the root node region/branch node region/leaf node region is missing, the topology information of this part of the region will not be recognized by the traditional injection method. As this part of the region will not detect the characteristic current flow, it will not be judged to be located in the same line. In the configuration based on the IEC 61,850 SCL, the gateway/edge device performed topology analysis based on the CID file sent to each region. According to the inbound and outbound configurations in the CID file, the connection relationships can be determined between regions. LTU2 was missing in Figure 7, and LTU1 and LTU3 sent S2.cid and S3.cid files. According to the analysis, the outgoing line of LTU1 was LIN1, while the incoming line of LTU3 was LIN2, so the branch region was missing.
Using the configuration file based on the IEC 61,850 SCL, not only the missing regions, but also the missing lines can be identified according to the information of incoming and outgoing lines. As is shown in Figure 6, when the LTU3 region was missing, according to the CID files of LTU1 and LTU5, the outgoing line of LTU1 was E4 and the incoming line of LTU5 was E4, so V3 and V5 were connected through E4. The CID file can increase the line information of distribution network topology identification and reduce the workload of the unknown region topology identification. At the same time, when the topology of the unknown region is identified, the configuration can be stored in the TTU based on the IEC 61,850 SCL, so as to facilitate the use of line topology in advanced applications.

6. Topology Identification of Unknown Region Based on K-Means Clustering

Because of the complex and diverse topology of the distribution network, the load situations of end users at different moments present differences, while the voltage of adjacent nodes and upstream and downstream nodes have similarities; therefore, the voltage data of the station area is clustered and analyzed by using the similarity of voltage fluctuations, so as to effectively identify the regional topology information. Considering the large number of low-voltage users, the communication is prone to network congestion and the algorithm is complicated and difficult to implement when data mining processing for massive data, which is prone to causing the waste of resources. Therefore, a region-based topology identification strategy was proposed, based on the method in Section 3, which can identify only the judged unknown region topology. The smart gateway compares the topology file generated in Section 4 with the user data in the metering automation system to determine the users in the unknown area. When performing the clustering analysis, the electricity consumption data of users in the unknown area was retrieved through the metering automation system only. Compared with the traditional clustering identification scheme, the amount of data to be identified was greatly reduced, which reduces the pressure of data processing and reduces the waste of resources. Meanwhile, only the voltage information of the unknown region was clustered, which greatly improves the accuracy of clustering.

6.1. Region Topology Identification Based on K-Means Clustering Algorithm

Line nodes of low-voltage distribution networks have a similar voltage when the electrical distance is close, but the user voltage of nodes in close proximity but in different phases may have variability. The k-means clustering algorithm, based on the determination of phase lines, can reflect the similarity relationship between data more accurately, in order to improve the accuracy of clustering. For the k-means clustering algorithm, it is simple to implement, has a better clustering effect and is easy to use in resource-constrained terminal devices. However, there are two main aspects that affect the results of clustering: the number of clusters and the selection of the initial prime centers. When performing an unknown region topology identification, the number of unknown topological regions was judged according to the description in Section 3. Setting the number of clusters to the number of unidentified regions can reduce the number of iterations to determine the centroids compared with traditional k-means clustering, and solve the problem of uncertainty in the selection of k-values. The node voltage of the upstream region of the missing region was used as the initial center of mass, which is closer to the electrical distance of the missing region and has a higher similarity of voltage data than the traditional clustering analysis using voltage data from only transformer. Moreover, it does not need to identify the voltage data of the known topology, which greatly reduces the amount of data and results in a higher accuracy of clustering. As is shown in Figure 6, the LTU of the blue area is judged to be lacking in regional topology; therefore, the number of clustering was set to three. By identifying the correlation coefficient between the voltage data and the initial centroid, it can determine whether the data were in this region. The specific clustering process is as follows:
(1)
Set the number of clustering. Assuming that the sum of the unrecognized regions is s, the clusters that need to be clustered are:
C = [ C 1 C 2 C s ]
(2)
Select initial clustering centers. The voltage data of each node upstream of the missing region is taken as the initial clustering centers. Let U x be the set of voltage sequences in the missing region and U c 0 be the set of voltage sequences in initial clustering centers.
U x = [ U 1 U 2 U n ]
U n = [ V i , n 1 V i , n 2 V i , n t ]
U c 0 = [ U c 1 U c 2 U c s ]
In order to improve the accuracy of topology identification, when the topological clustering of nodes is carried out, a cluster analysis is carried out on the voltage data of end-user meters with different phase lines and the voltage data of upstream nodes with corresponding phase lines. Therefore, V i , t represents the value of the voltage data, i represents the phase line of the voltage, i = { 1 , 2 , 3 } represents the phase line A, B and C, respectively, and t represents time.
U c s = [ V 1 , 1 s V 1 , 2 s V 1 , t s V 2 , 1 s V 2 , 2 s V 3 , t s V 3 , 1 s V 3 , 2 s V 3 , t s ]
(3)
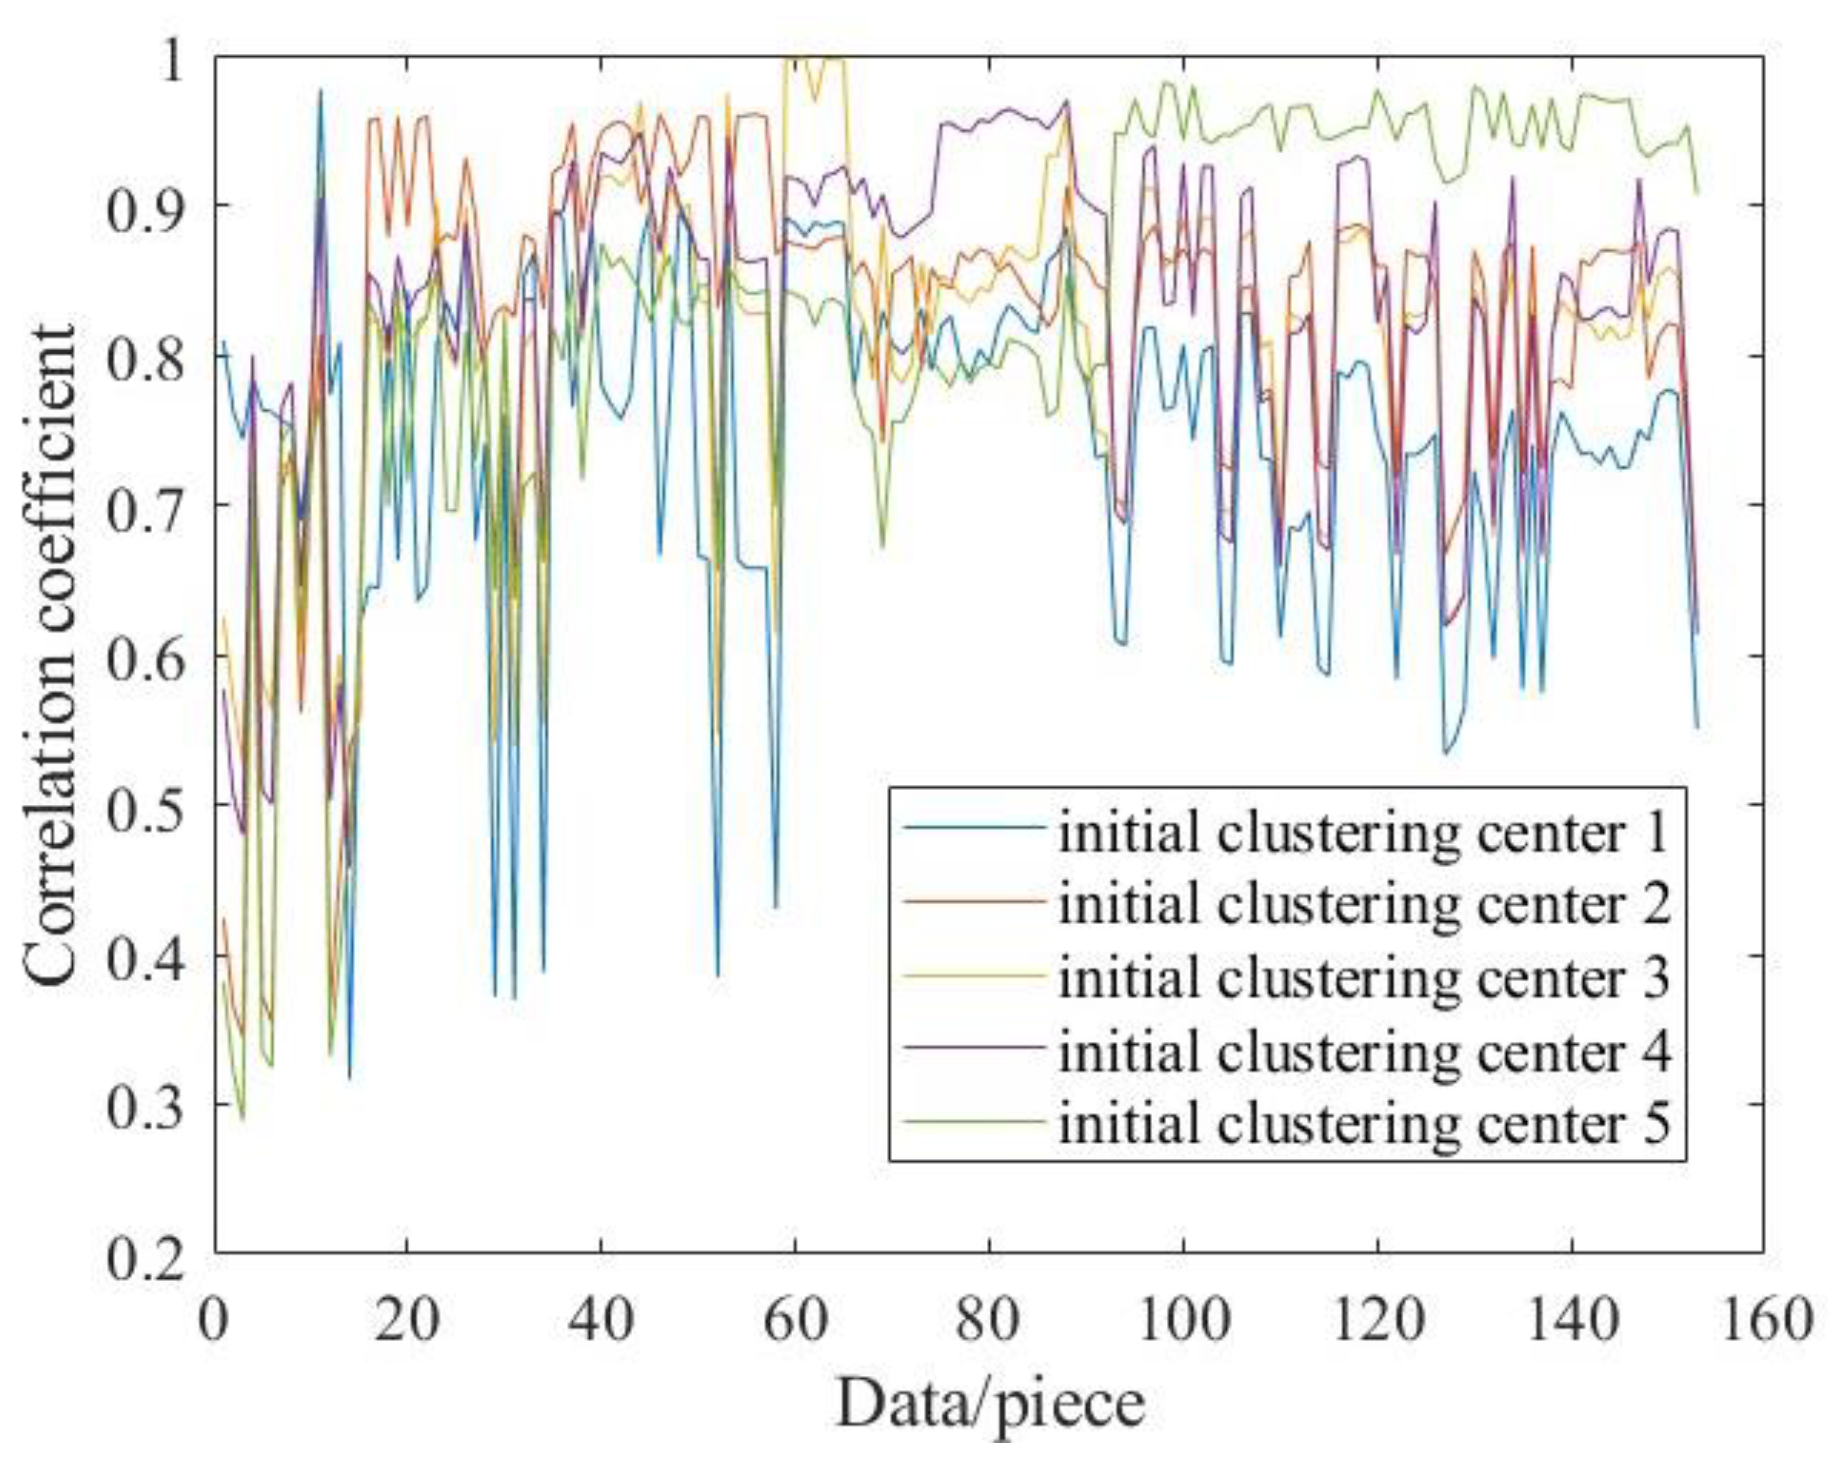
Data correlation analysis. By introducing the correlation coefficient C o r x y , which describes the consistency of the voltage data in the region to be identified with the fluctuation of the voltage data in the initial clustering centers, the expression is shown below, where, z is the data dimension of the sample, which can be obtained by the product of sampling frequency and sampling time. F x ¯ = 1 z ( r = 1 z F x r ) * i z , F y ¯ = 1 z ( r = 1 z F y r ) * i z , i n is the unit vector, F x and F y are data sets of dimension n, respectively, and F x r and F y r are data of dimension r, respectively. The transpose of F y F y ¯ is ( F y F y ¯ ) .
C or x y = ( F x F x ¯ ) ( F y F y ¯ ) ( F x F x ¯ ) ( F x F x ¯ ) ( F y F y ¯ ) ( F y F y ¯ )
(4)
Center of clustering reset. The class is divided according to the correlation coefficient, and the mean centroid is calculated as the new centroid. The correlation coefficients are shown in Table 2 below.
(5)
Threshold judgment. Determine whether the correlation coefficient between the centroid and sample voltage data were greater than the threshold value (0.8 was selected in this paper). If not, repeat (3) and (4); if not, end the algorithm.
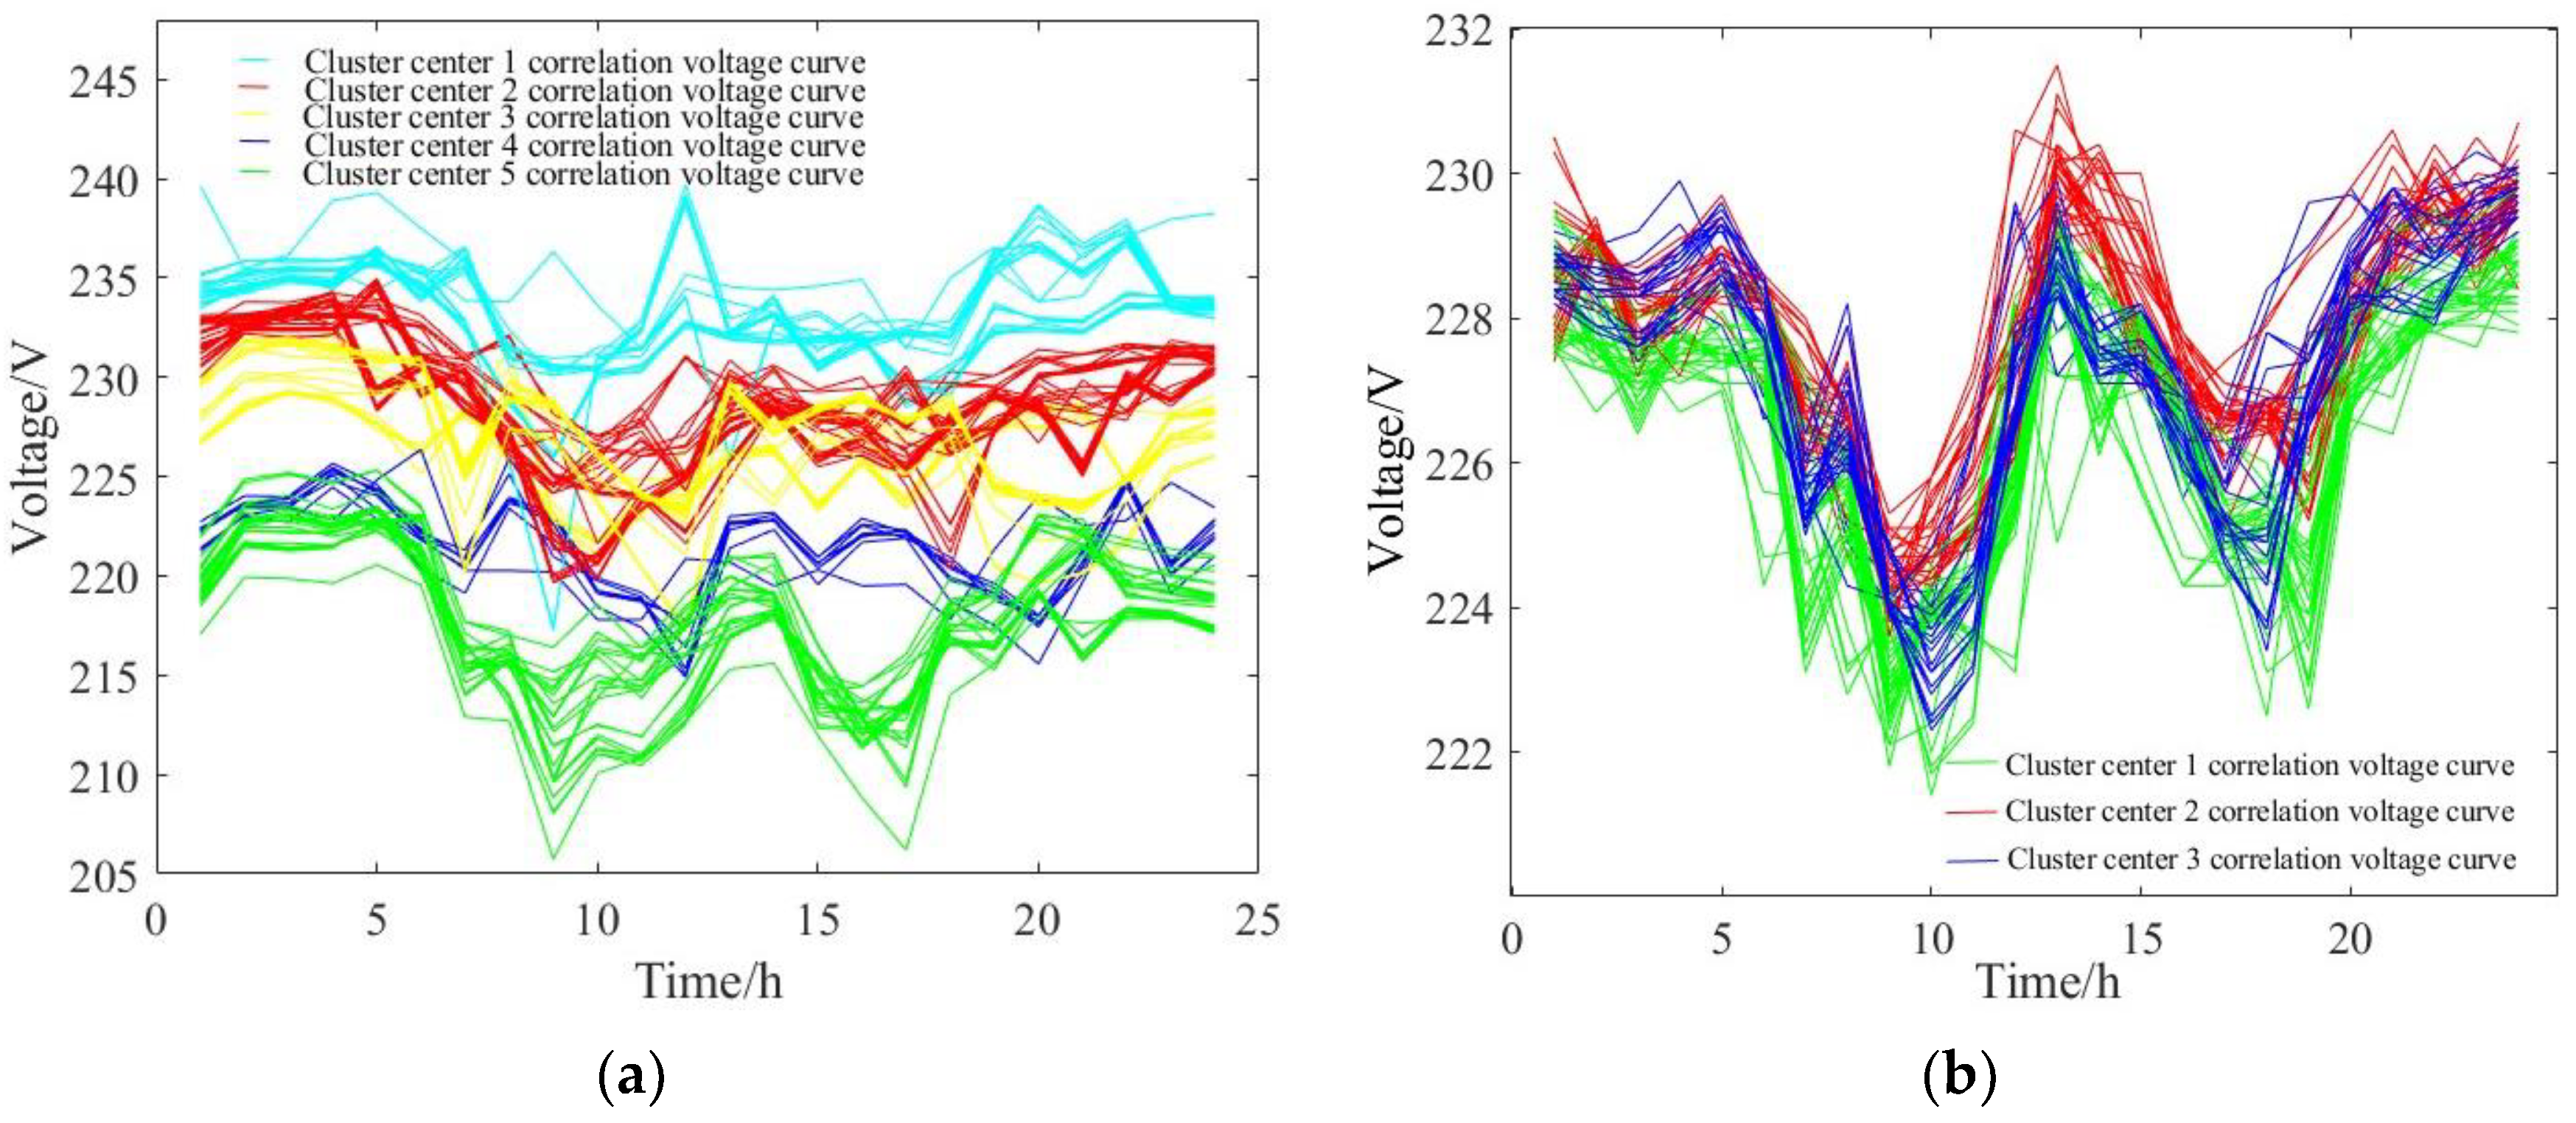
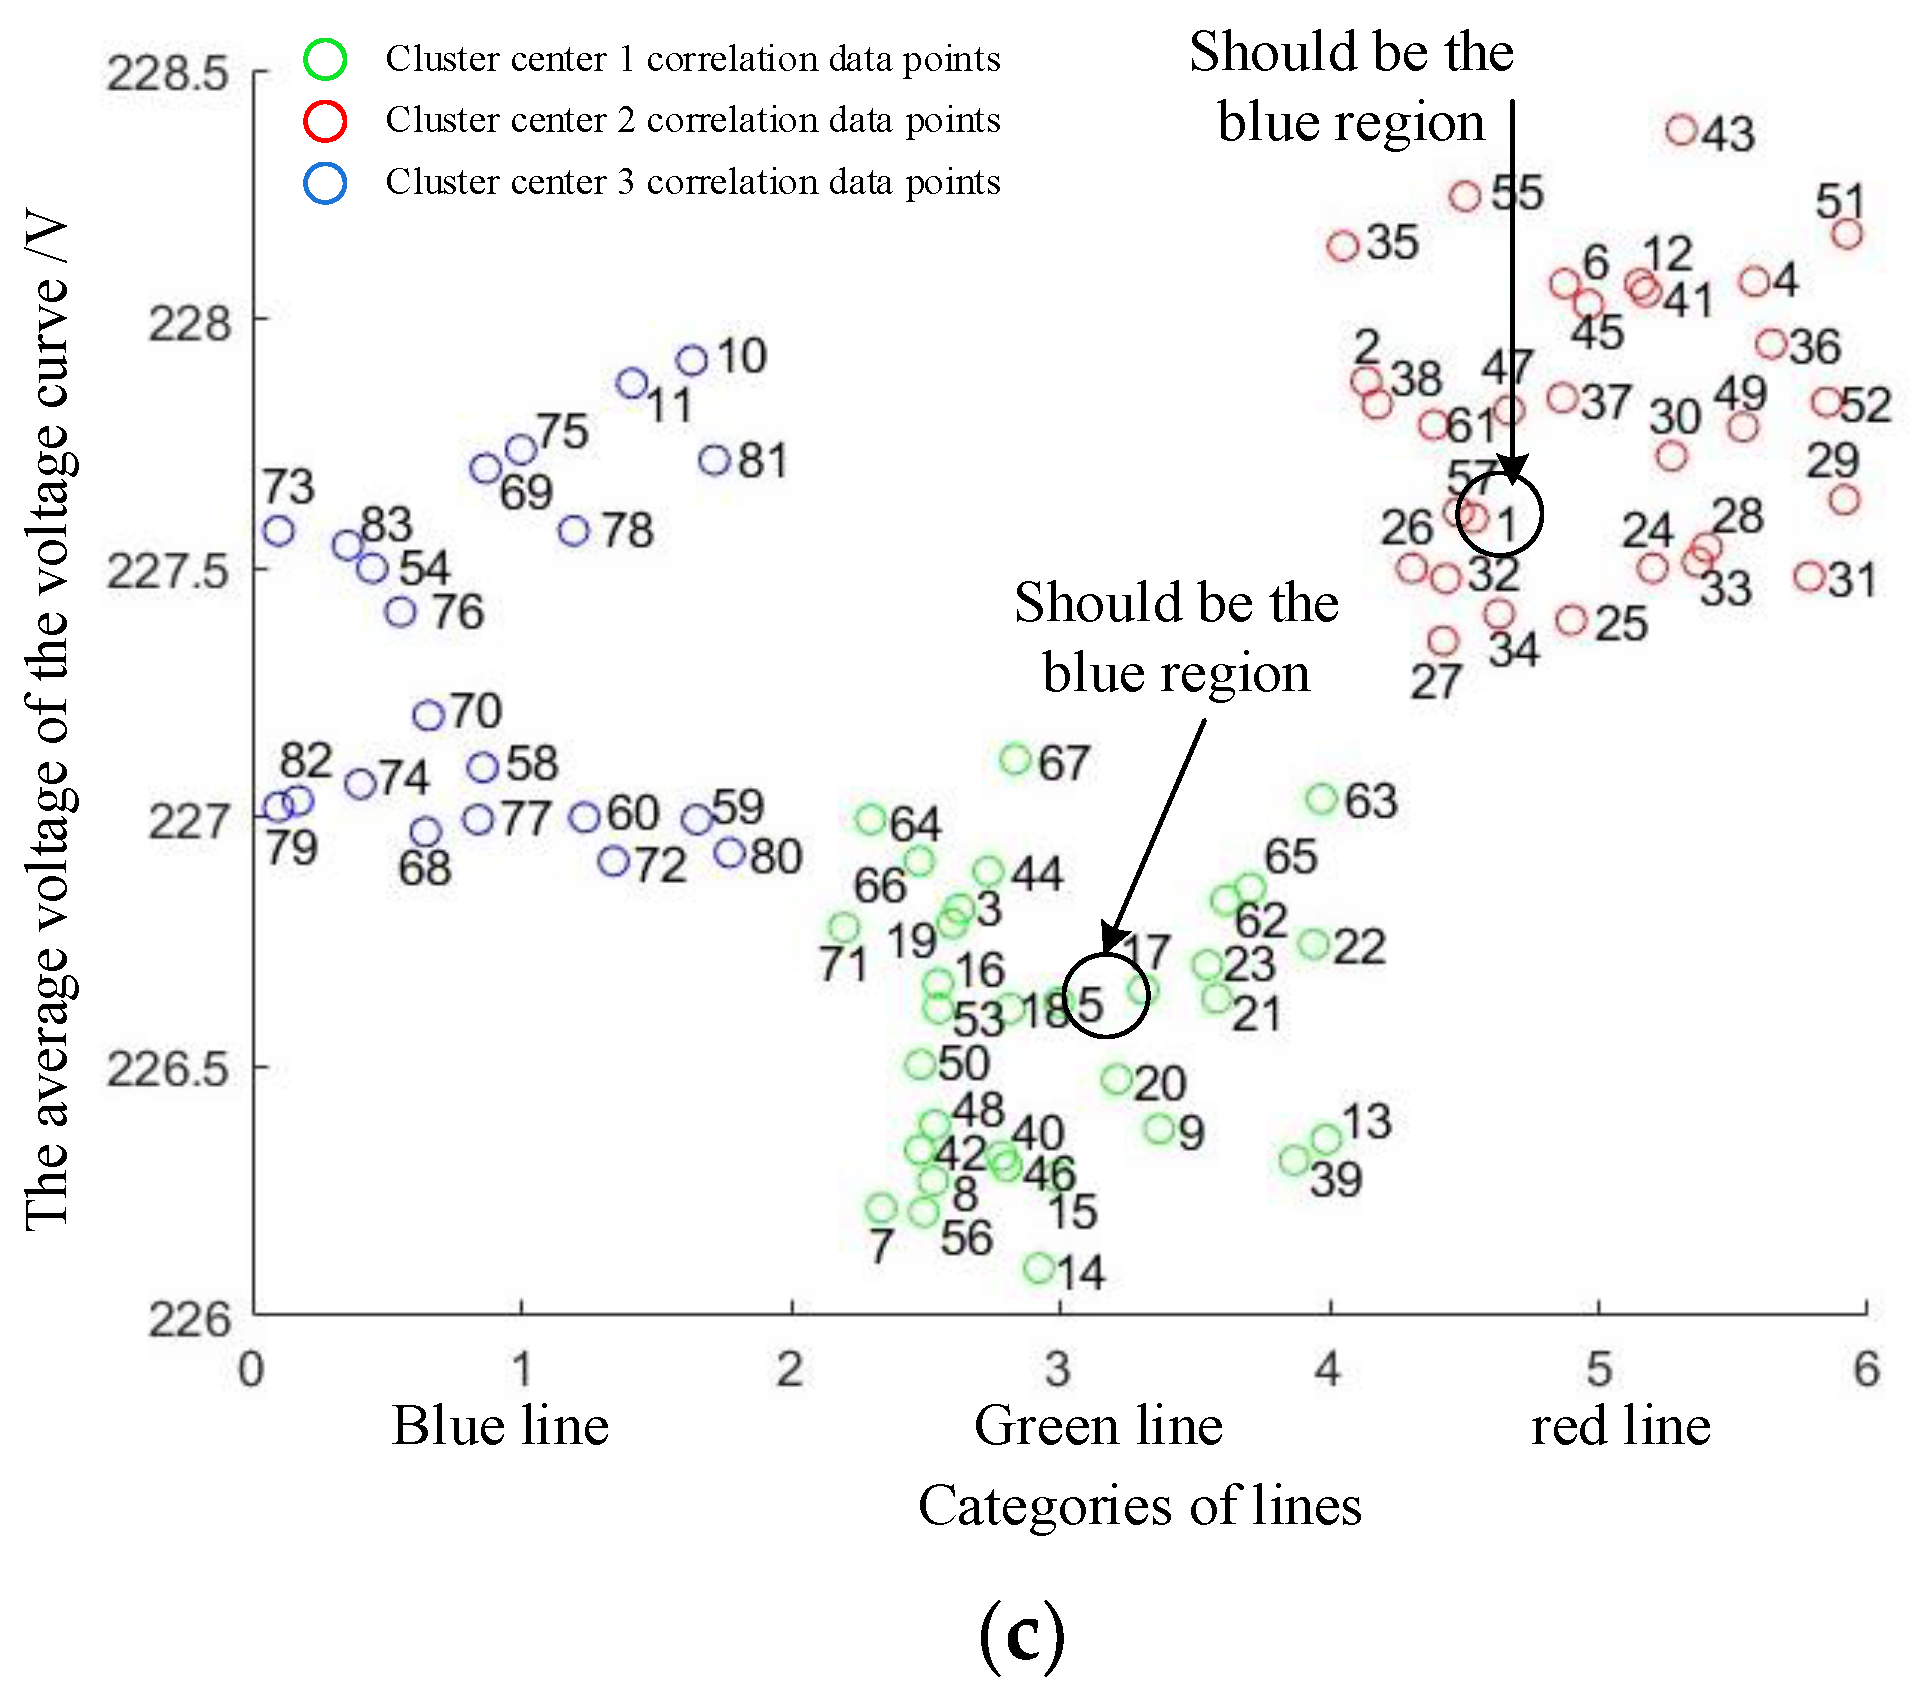
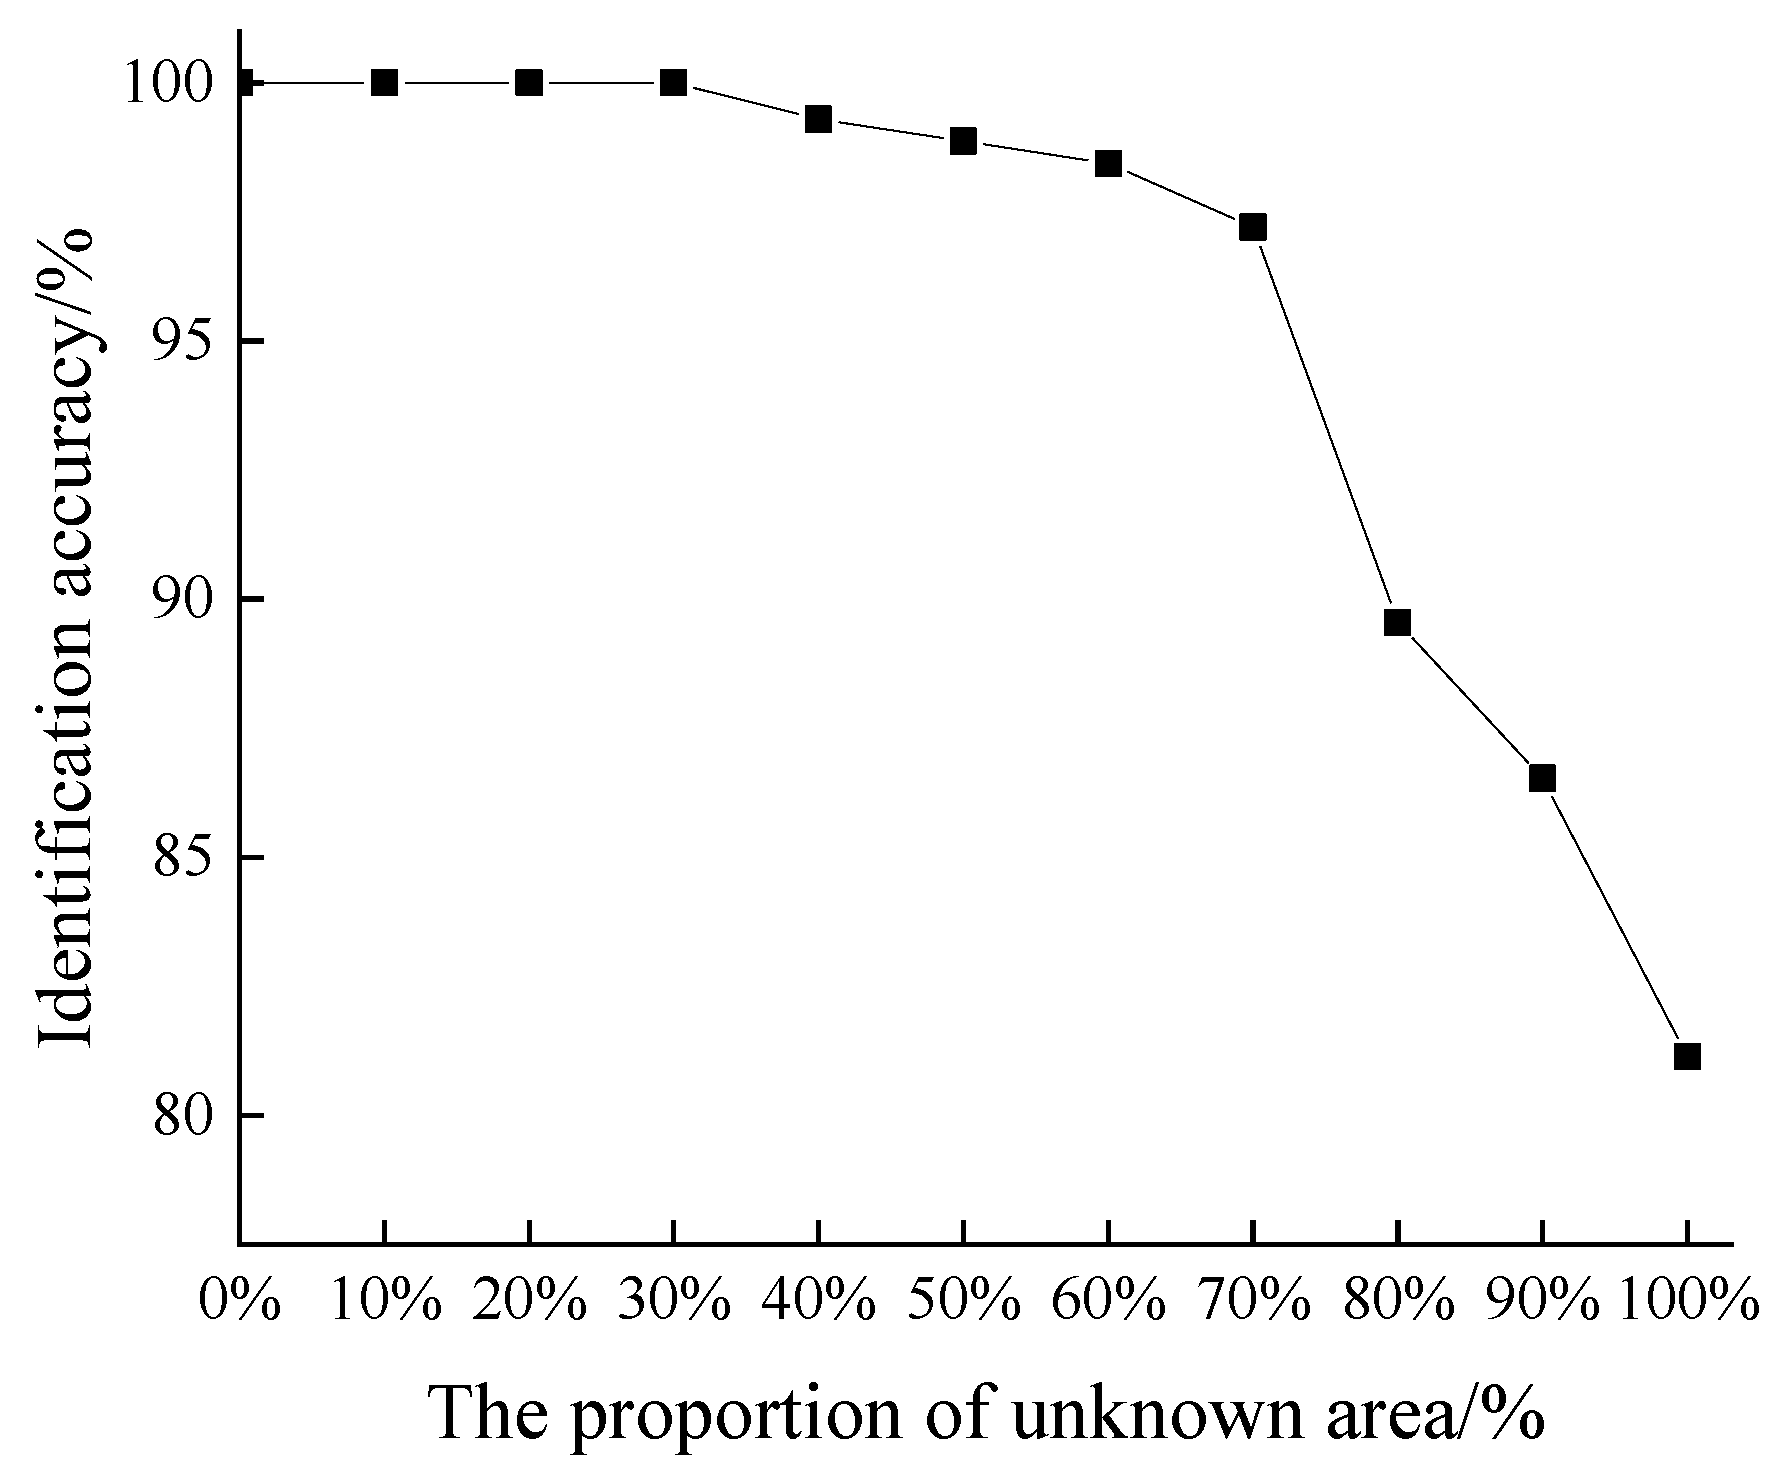
If the region to be identified is the whole station area and does not contain the identified region, when performing topology identification, according to the feature that the node voltage of the radial-type line of the low-voltage distribution network gradually decreases along the low-voltage line. The voltage of the region to be identified at the same moment is compared, and the voltage data of the first k branch box layers of the ranking are used as the initial branch node voltage and the initial clustering centers (root node voltage) for similarity analysis. The process is similar to combining the root node and the leaf node into a region for regional topology identification. The similarity is higher because the station area exit is closer to the branch nodes. The m branch nodes obtained according to the analysis are used as new initial clustering centers, respectively, and then the regional topology is identified in the steps as in the clustering method steps of regional topology.

6.2. Case Analysis

User voltage data from station area A containing 496 users, and station area B containing 203 users, were selected for experimental analysis in a location in Shandong. The voltage data of users were sent to the metering automation system at a sampling interval of 1 h, and the TTU retrieved the voltage data of users to be clustered from the metering automation system. When there was a failure of the individual sampling points of users, the value of the t-1 moment was used to make up the voltage complementary data. By analyzing a large number of voltage data samples, the correlation was judged by the voltage data of a certain day only, and the accuracy was low. Voltage data over a period of time needs to be counted for k-means clustering analysis to determine the topological relationship.
It is known that there are 153 B-phase users in station area A, mainly located in five regions; some of them are sporadically distributed with trunk wiring. The voltage data of the branch node areas of the five regions were used as the initial clustering centers, and the similarity curves of the voltage data with the users are shown in Figure 9. As can be seen from Figure 9, the data correlation between the voltage data of users located in the same region and the initial clustering center was basically greater than 0.8, and the data correlation of similar regions was between 0.6 and 0.8. Some of the scattered user points had a lower correlation because of their electrical distance from the branch nodes. Relying on the correlation coefficients, k-means clustering was performed on the voltage data of users to achieve the identification of the regional topology.
In this paper, we took the B-phase clustering of station area A as an example, selecting 100 users in five regions as the unknown region end users, and using the k-means algorithm to cluster the voltage sequences of users in the five missing regions. Eighty-three A-phase users in station area B, located in three regions, were selected for the clustering analysis. As is shown in Figure 10, the curves with the same variation were clustered into the same class, and the data results of the curves clustered into the same class are shown in Figure 10c.
The affiliation of the voltage data of each station area was judged by taking the maximum value of the correlation coefficient between the voltage data and the clustering center to determine which cluster each voltage data belonged to. The algorithm ended when the k-means algorithm iterated continuously until the correlation was stable at higher than 0.8, and the voltage clustering curve was obtained, as is shown in Figure 10. To facilitate the observation of the data and verify the accuracy of the data clustering, the voltage data numbers of the clusters were divided by the clusters shown in Figure 10c. By comparison with the user numbers of the original lines, the clustering accuracy of station area A was found to be 95.42% and that of the station area B was 97.67%, which was much more accurate compared with the traditional k-means clustering. The more missing areas in the station, the more data need to be clustered. In order to verify the influence of the missing data of station area on clustering, phases A, B and C of station areas A and B were tested, and the test results were averaged, as is shown in Figure 11. From Figure 11, it can be seen that the accuracy of identification could reach 100% when the data of the missing area was less than 30% of the total data. After exceeding 30%, the accuracy rate gradually decreased. After it exceeded 70%, the accuracy decreased more obviously because of the larger range of the unknown area and the initial clustering center was relatively far away from the electrical distance of the end users.
To verify the effectiveness and accuracy of the proposed method, other k-means clustering identification methods were used to test the data of the same station area, and the accuracy was the average of 20 results; the results are shown in Table 3. The lowest accuracy was achieved by the k-means clustering only, influenced by the initial clustering center and the number of clusters. The accuracy of identification was improved using PCA/t-SNE dimensionality reduction to obtain more representative data compared with clustering by k-means only. In this paper, we first determined the known area through the configuration, associated data and other information, and only identified the users in the unknown area through the k-means clustering algorithm, which required much less data to be processed than other methods. Furthermore, the algorithm was simpler, and at the same time, because the initial clustering center and the number of clusters had been determined, the accuracy was higher compared with other methods.
Based on the scheme proposed in this paper, the identification accuracy could reach more than 90% where the unknown region represents less than 70%. Compared with other k-means clustering algorithms, the accuracy was improved. The method used in this paper had less iterations and did not use complex intelligent algorithms, which is more suitable for application in resource-constrained low-voltage smart terminals.

7. Discussion

In order to realize the effective monitoring of low-voltage lines, ensure the safety of users and solve the problem of the identification of the full-domain topology of low-voltage station areas, in this paper, a full topology identification strategy was proposed. The known topology structure in the station area was judged by the existing conditions. Then, the line topology in the unknown area was identified to complete the identification of the full-domain topology of the station area, which had the following characteristics:
(1)
This paper drew on the configuration scheme of a medium-voltage distribution network based on the IEC 61,850 standard, and configured the line topology of a low-voltage distribution network based on the IEC 61,850 SCL, which is conducive to the information integration and sharing of MV and low-voltage distribution networks, and more conducive to the realization of the monitoring of low-voltage distribution networks.
(2)
The clustering analysis only targets unknown regions, which greatly reduces the amount of data and avoids wasted resources, making it more suitable for application in intelligent terminals of low-voltage distribution networks with limited resources. The accuracy of similarity judgment was improved by using the branch node with a closer electrical distance as the center of the clustering, subphase line clustering, etc.
(3)
The full topology identification strategy proposed in this paper improves the accuracy of line topology identification by targeting different line topology identification strategies to the specific situation of line topology in the station area. After experimental analysis, the accuracy of identification was higher for the method in this paper compared with the topology identification of the whole station area using only clustering algorithm. It facilitates the use of other advanced applications in the distribution network, and is of great significance to improve the monitoring of low-voltage distribution networks and ensure the safe electricity consumption of end users.
(4)
The impact of the DER is mainly the uncertainty and randomness of the power output, which will cause the voltage of the same line to fluctuate together. The article method can be identified in this scenario, but due to the unsynchronized sampling data at each point, it will affect the identification results, and this problem will continue to be studied later.

Author Contributions

Writing—original draft preparation, L.S.; writing—review and editing, L.S., Y.C., Q.D., R.D., Z.L. and Q.C. All authors have read and agreed to the published version of the manuscript.

Funding

This research was funded by National Key R&D Program of China (No. 2016YFB0900600).

Data Availability Statement

The data used to support the findings of this study are available from the corresponding author upon request.

Conflicts of Interest

The authors declare no conflict of interest.

Appendix A

<Substation name=“S1” desc=“A branch box”>
  <VoltageLevel name=“E1”>
   <Voltage multiplier=“k” unit=“V”>10</Voltage>
   <Bay name=“Q1” desc=“A branch box “>
     <ConductingEquipment name=“LIN1” type=“LIN” desc=“Aincoming line”>
       <Terminal connectivityNode=“S1/E1/Q1/CN1” substationName=“S1” voltageLevelName=“E1” bayName=“Q1” cNodeName=“CN1”/>
     </ConductingEquipment>
     <ConductingEquipment name=“CB1” type=“CBR”>
        <Terminal connectivityNode=“S1/E1/Q1/CN1” substationName=“S1” voltageLevelName=“E1” bayName=“Q1” cNodeName=“CN1”/>
        <Terminal connectivityNode=“S1/E1/Q1/B1” substationName=“S1” voltageLevelName=“E1” bayName=“Q1” cNodeName=“B1”/>
     </ConductingEquipment>
     <ConnectivityNode name=“CN1” pathName=“S1/E1/Q1/CN1”/>
     <ConnectivityNode name=“B1” pathName=“S1/E1/Q1/B1”/>
     <ConductingEquipment name=“CB2” type=“CBR”>
        <Terminal connectivityNode=“S1/E1/Q1/B1” substationName=“S1” voltageLevelName=“E1” bayName=“Q1” cNodeName=“B1”/>
        <Terminal connectivityNode=“S1/E1/Q1/CN2” substationName=“S1” voltageLevelName=“E1” bayName=“Q1” cNodeName=“CN2”/>
     </ConductingEquipment>
     <ConductingEquipment name=“LIN2” type=“LIN” desc=“Boutlet line”>
        <Terminal connectivityNode=“S1/E1/Q1/CN2” substationName=“S1” voltageLevelName=“E1” bayName=“Q1” cNodeName=“CN2”/>
     </ConductingEquipment>
     <ConnectivityNode name=“CN2” pathName=“S1/E1/Q1/CN2”/>
     <ConductingEquipment name=“CB3” type=“CBR”>
        <Terminal connectivityNode=“S1/E1/Q1/B1” substationName=“S1” voltageLevelName=“E1” bayName=“Q1” cNodeName=“B1”/>
        <Terminal connectivityNode=“S1/E1/Q1/CN3” substationName=“S1” voltageLevelName=“E1” bayName=“Q1” cNodeName=“CN3”/>
     </ConductingEquipment>
     <ConductingEquipment name=“LIN1” type=“LIN” desc=“C outlet line”>
        <Terminal connectivityNode=“S1/E1/Q1/CN3” substationName=“S1” voltageLevelName=“E1” bayName=“Q1” cNodeName=“CN3”/>
     </ConductingEquipment>
     <ConnectivityNode name=“CN3” pathName=“S1/E1/Q1/CN3”/>
     <ConductingEquipment name=“CB4” type=“CBR”>
        <Terminal connectivityNode=“S1/E1/Q1/B1” substationName=“S1” voltageLevelName=“E1” bayName=“Q1” cNodeName=“B1”/>
       <Terminal connectivityNode=“S1/E1/Q1/CN4” substationName=“S1” voltageLevelName=“E1” bayName=“Q1” cNodeName=“CN4”/>
     </ConductingEquipment>
     <ConductingEquipment name=“LIN4” type=“LIN” desc=“D outlet line”>
        <Terminal connectivityNode=“S1/E1/Q1/CN4” substationName=“S1” voltageLevelName=“E1” bayName=“Q1” cNodeName=“CN4”/>
     </ConductingEquipment>
     <ConnectivityNode name=“CN4” pathName=“S1/E1/Q1/CN4”/>
   </Bay>
  </VoltageLevel>
 </Substation>

References

  1. Pappu, S.J.; Bhatt, N.; Pasumarthy, R.; Rajeswaran, A. Identifying Topology of Low Voltage Distribution Networks Based on Smart Meter Data. IEEE Trans. Smart Grid 2017, 9, 5113–5122. [Google Scholar] [CrossRef]
  2. Hosseini, Z.S.; Khodaei, A.; Paaso, A. Machine Learning-Enabled Distribution Network Phase Identification. IEEE Trans. Power Syst. 2020, 36, 842–850. [Google Scholar] [CrossRef]
  3. Soltani, Z.; Khorsand, M. Real-Time Topology Detection and State Estimation in Distribution Systems Using Micro-PMU and Smart Meter Data. IEEE Syst. J. 2022, 16, 3554–3565. [Google Scholar] [CrossRef]
  4. Zhu, Z.Y.; Xu, B.Y.; Brunner, C.; Yip, T.; Chen, Y. IEC 61850 Configuration Solution to Distributed Intelligence in Distribution Grid Automation. Energies 2017, 10, 528. [Google Scholar] [CrossRef]
  5. Chen, Y.; Sun, L.; Wang, Z.; Wang, J. Distribution Network Topology Identification Based on IEC 61850 Logical Nodes. Sci. Program. 2021, 1, 1–8. [Google Scholar] [CrossRef]
  6. Zhu, Z.; Xu, B.; Brunner, C.; Guise, L.; Han, G. Distributed topology processing solution for distributed controls in distribution automation systems. IET Gener. Transm. Distrib. 2017, 11, 776–784. [Google Scholar] [CrossRef]
  7. Zhong, J.Y.; Xiong, X.F.; He, Y.C.; Shan, R.R.; Jiang, H.L.; Li, S.Q. Plug-Play and Topology Identification Method for Intelligent Terminal in Distribution Station Area. Autom. Electr. Power Syst. 2021, 45, 166–173. [Google Scholar]
  8. Ma, B.Y. Overview of Topology Identification Methods for Low Voltage Stations. Mod. Inf. Technol. 2021, 5, 71–77. [Google Scholar]
  9. Wang, R.N.; Wu, Y.; Wei, H.M.; Wang, C.W. Topology identification method for a distribution network area based on the characteristic signal of a smart terminal unit. Power Syst. Prot. Control 2021, 49, 83–89. [Google Scholar] [CrossRef]
  10. Ge, H.T.; Xu, B.Y.; Zhang, X.H. Low-Voltage Overhead Lines Topology Identification Method Based on High-Frequency Signal Injection. Arch. Electr. Eng. 2021, 770, 791–800. [Google Scholar]
  11. Zhang, R.X.; Ma, Z.B.; Qian, C.W.; Hou, Z.F. Model and Algorithm of Automatic Identification of Substation Area Topology Based on Metering Data. Distrib. Util. 2021, 38, 73–79. [Google Scholar]
  12. Li, C.C.; Fan, X.Z.; Wang, Q.; Du, Y.; Zhu, H.X.; Yu, C. Station area recognition of distribution network based on electricity information acquisition system. Electr. Meas. Instrum. 2019, 56, 109–114. [Google Scholar]
  13. Hu, X.Z.; Cong, W.; Gu, Q.S.; Hu, C.H.; Wang, K.C. Topology identification method for low-voltage power supply network based on meter measurement data. Electr. Power Autom. Equip. 2022, 1–17. [Google Scholar] [CrossRef]
  14. Chen, Z.A.; Huang, C.; Zhang, Z.D.; Jiang, Y.Q. Topology identification method of a low voltage distribution network based on T-type grey correlation degree and KNN algorithm. Power Syst. Prot. Control 2021, 49, 163–169. [Google Scholar]
  15. Guo, S.H.; Wang, G. Topology identification and monitoring of low-voltage distribution network based on multi-granularity clustering and multivariate characteristic statistics. Electr. Power Autom. Equip. 2022, 1–13. [Google Scholar] [CrossRef]
  16. Feng, R.H.; Zhao, Z.; Xie, S.; Huang, J.L.; Wang, W. Topology Identification for Low Voltage Network Based on Principal Component Analysis and Convex Optimization. J. Tianjin Univ. (Sci. Technol.) 2021, 54, 746–753. [Google Scholar] [CrossRef]
  17. Cai, Y.Z.; Tang, J.; Wei, F.S.; Li, J.; Guo, W.C.; Yang, Y.; Liu, S.L. Phase Sequence Recognition Method of Station Area Based on Random Forest Algorithm. Mech. Electr. Eng. Technol. 2021, 50, 227–230. [Google Scholar]
  18. Liao, Z.W.; Xie, X.K.; Zheng, G.Y.; Wang, B.W.; Liu, Y. Phase Identification of Low-voltage Distribution Area Based on Morphological Characteristic Clustering of Voltage Curves. Autom. Electr. Power Syst. 2022, 1–11. Available online: http://kns.cnki.net/kcms/detail/32.1180.TP.20221101.1658.004.html (accessed on 5 November 2022).
  19. Song, Y.Z. Research on Fast Topology Identification Based on Graph Theory; North China Electric Power University: Baoding, China, 2010. [Google Scholar]
  20. Yang, H.C.; Wang, X.D.; Shi, Z.P.; Wang, J.M.; Chen, K.; Wu, H. Research on Household Variation Relation and Phase Recognition Technology of Low Voltage Distribution Network Based on Voltage Similarity Assessment. Electr. Meas. Instrum. 2022, 1–6. Available online: http://kns.cnki.net/kcms/detail/23.1202.TH.20210727.1302.002.html (accessed on 3 June 2022).
  21. Tang, J.; Cai, Y.Z.; Li, Q.L.; Liu, S.L.; Zhang, Y.J.; Yi, Y.Q.; Huang, X.M. Phase Sequence Identification Method for Users in Low-voltage Distribution-station Area Based on Feature Constraint Clustering of Three-phase Meter. Autom. Electr. Power Syst. 2022, 46, 60–67. [Google Scholar]
  22. Yang, Z.C.; Shen, Y.; Yang, F.; Le, J.; Su, L.; Lei, Y. Topology identification method of low voltage distribution network based on data association analysis. Electr. Meas. Instrum. 2020, 57, 5–11. [Google Scholar]
Figure 1. Simplified topology model of a low-voltage distribution network.
Energies 16 01126 g001
Figure 2. Low-voltage distribution network topology.
Energies 16 01126 g002
Figure 3. Topology equivalent circuit of substation area.
Energies 16 01126 g003
Figure 4. Multi-station-area voltage distribution curves.
Energies 16 01126 g004
Figure 5. Voltage distribution circuit of different phase lines at the same point in station area.
Energies 16 01126 g005
Figure 6. Topological region partitioning sub-model diagram.
Energies 16 01126 g006
Figure 7. General flow chart of topology identification strategy.
Energies 16 01126 g007
Figure 8. Topology identification flow chart based on IEC 61,850 SCL.
Energies 16 01126 g008
Figure 9. B-phase user voltage correlation coefficient curve.
Energies 16 01126 g009
Figure 10. Analysis chart of voltage data in the missing region of the station area: (a) Voltage variation curve of users in the missing area after clustering in station A; (b) Voltage change curve of users in the missing region after clustering; (c) User distribution map of missing region after clustering.
Energies 16 01126 g010aEnergies 16 01126 g010b
Figure 11. The proportion of unknown area voltage data in the station area in relation to the accuracy rate.
Energies 16 01126 g011
Table 1. Connection table of Figure 1.
VertexVertex of ConnectionEdge of ConnectionMapped Line
V1V3E1Transformer
V2V4E2Transformer
V3V1, V4, V5, V6E1, E3, E4, E5Line crossing point
V4V2, V3, V7E2, E3, E6Line crossing point
V5V3, V8, V9, V10E4, E7, E8, E9Line crossing point
V6V3, V11, V12E5, E10, E11Line crossing point
V7V4, V13, V14, V15, V16, V17E6, E12, E13, E14, E15, E16Line crossing point
V8V5E7L1
V9V5E8L2
V10V5E9L3
V11V6E10DER1
V12V6E11L4
V13V7E12L5
V14V7E13L6
V15V7E14L7
V16V7E15L8
V17V7E16L9
Table 2. Similarity evaluation criteria.
Coefficient of AssociationSize of Correlation
0.8–1.0Highly correlated
0.6–0.8Strongly correlated
0.4–0.6Medium degree of correlation
0.2–0.4Weakly correlated
0.0–0.2Absence of correlation
Table 3. Identification result statistics.
MethodAccuracy Rate %
k-means71.6
PCA+ k-means81.5
t-SNE+ k-means85.8
Disclaimer/Publisher’s Note: The statements, opinions and data contained in all publications are solely those of the individual author(s) and contributor(s) and not of MDPI and/or the editor(s). MDPI and/or the editor(s) disclaim responsibility for any injury to people or property resulting from any ideas, methods, instructions or products referred to in the content.

