3.1. Rotational Speeds and Power of Closely Spaced VAWTs in Tandem Layouts
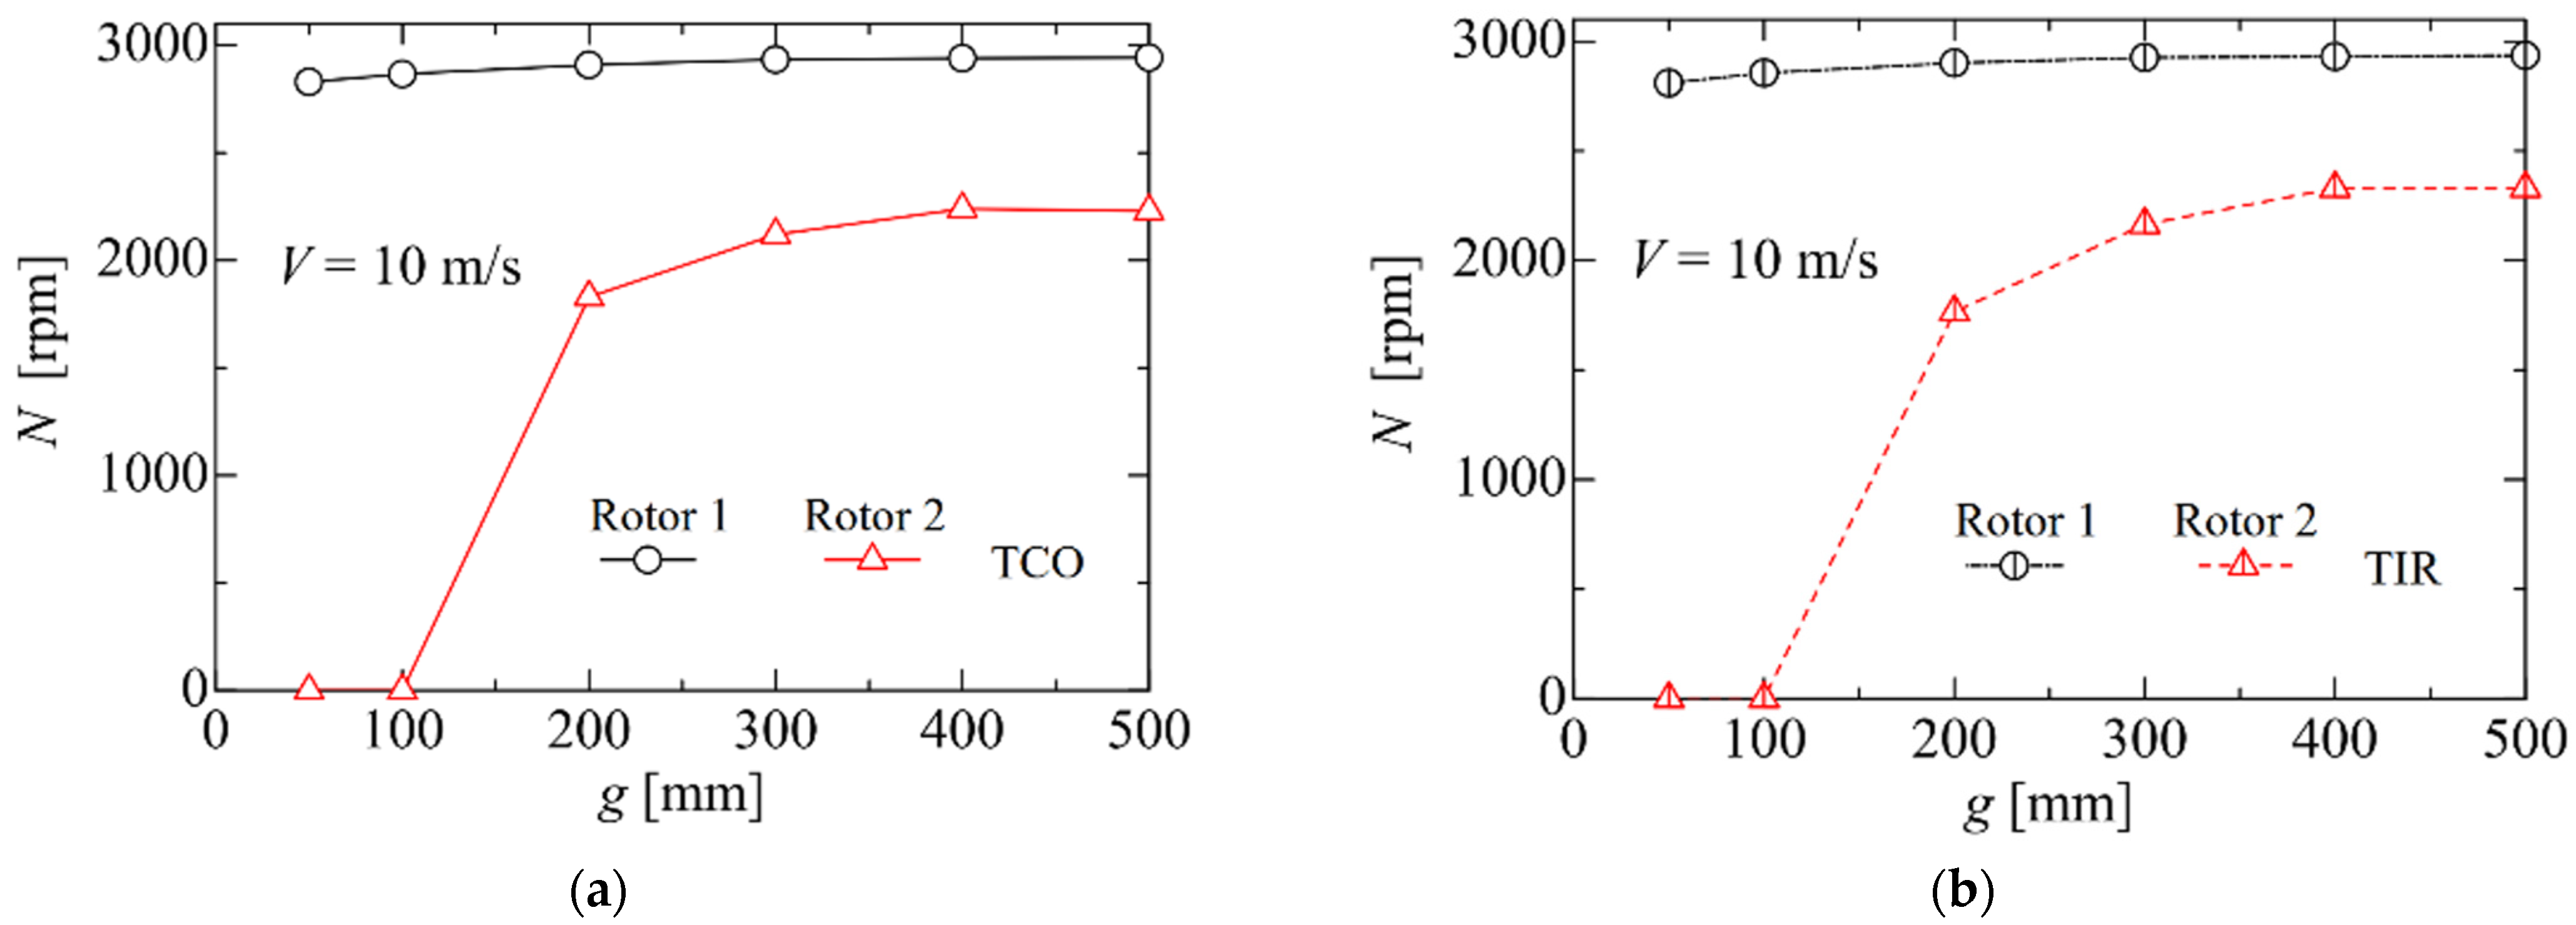
Figure 10 shows the variations in the rotational speed
N [rpm] with the gap
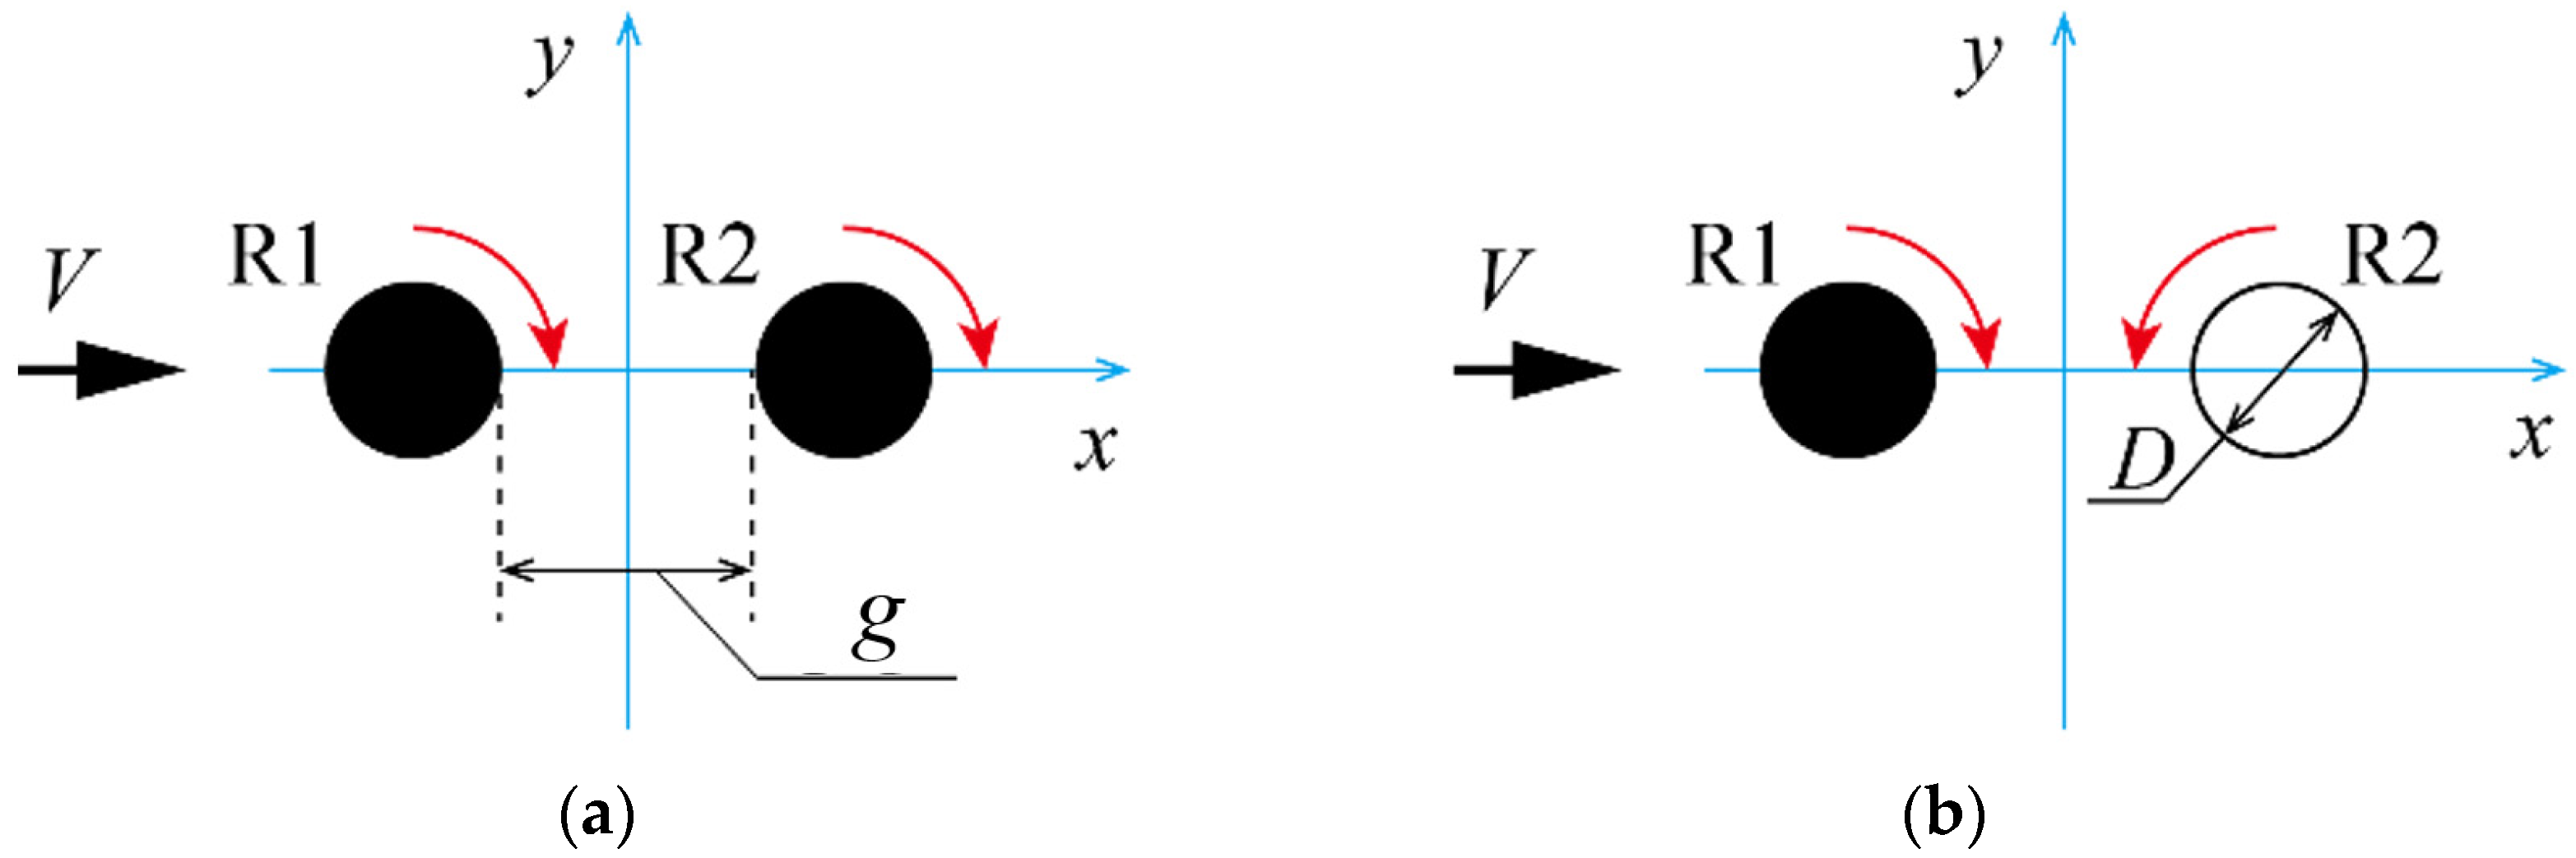
g between the two rotors. The results for the TCO layout (
Figure 2a) and for the TIR layout (
Figure 2b) are shown in
Figure 10a and
Figure 10b, respectively. The rotational speed of the single turbine obtained in the experiment was 2900 rpm at
V = 10 m/s.
In the TCO layout in
Figure 10a, the rotational speeds
N of Rotor 1 in the upwind location and Rotor 2 in the downwind location decreased as the gap decreased because of the interaction between the rotors. Similarly, in the TIR layout (
Figure 10b), the rotational speeds of Rotor 1 and Rotor 2 decreased as the gap decreased. In particular, the decreasing tendency in the case of Rotor 2 for smaller gaps is remarkable. As seen in
Figure 10, the gap dependence of the rotational speed is almost the same for the TCO and TIR layouts: (1) at the smallest gap of
g = 50 mm (
g/
D = 1), the value of the rotational speed of Rotor 1 is 97% of that of an isolated rotor; (2) even at
g = 500 mm (
g/
D = 10), the value of the rotational speed of Rotor 2 is 75–80% of that of an isolated rotor. Note that for smaller gaps of
g = 50 and 100 mm (
g/
D = 1 and 2), downwind Rotor 2 cannot continue to rotate due to the decelerated wake flow behind the upwind Rotor 1 at
V = 10 m/s. Zanforlin and Nishino [
6] presented the reduction of the power of the upstream turbine under the assumption that only this turbine is working in the case of the TIR layout at
g/
D = 0.5, 1, 1.5, and 2, using 2D CFD. However, their results showing the same power coefficient as that of an isolated turbine seem to be unexpected (see 90° in their Figures 15, 17, and 18). De Tavernier et al. [
12] showed a power reduction of both turbines in the case of the TIR layout at
g/
D = 0.2, based on a 2D simulation with a panel/vortex model. According to their
Figure 9, the power values of Rotor 1 and Rotor 2 are approximately 80% and 30% of that of an isolated rotor, respectively.
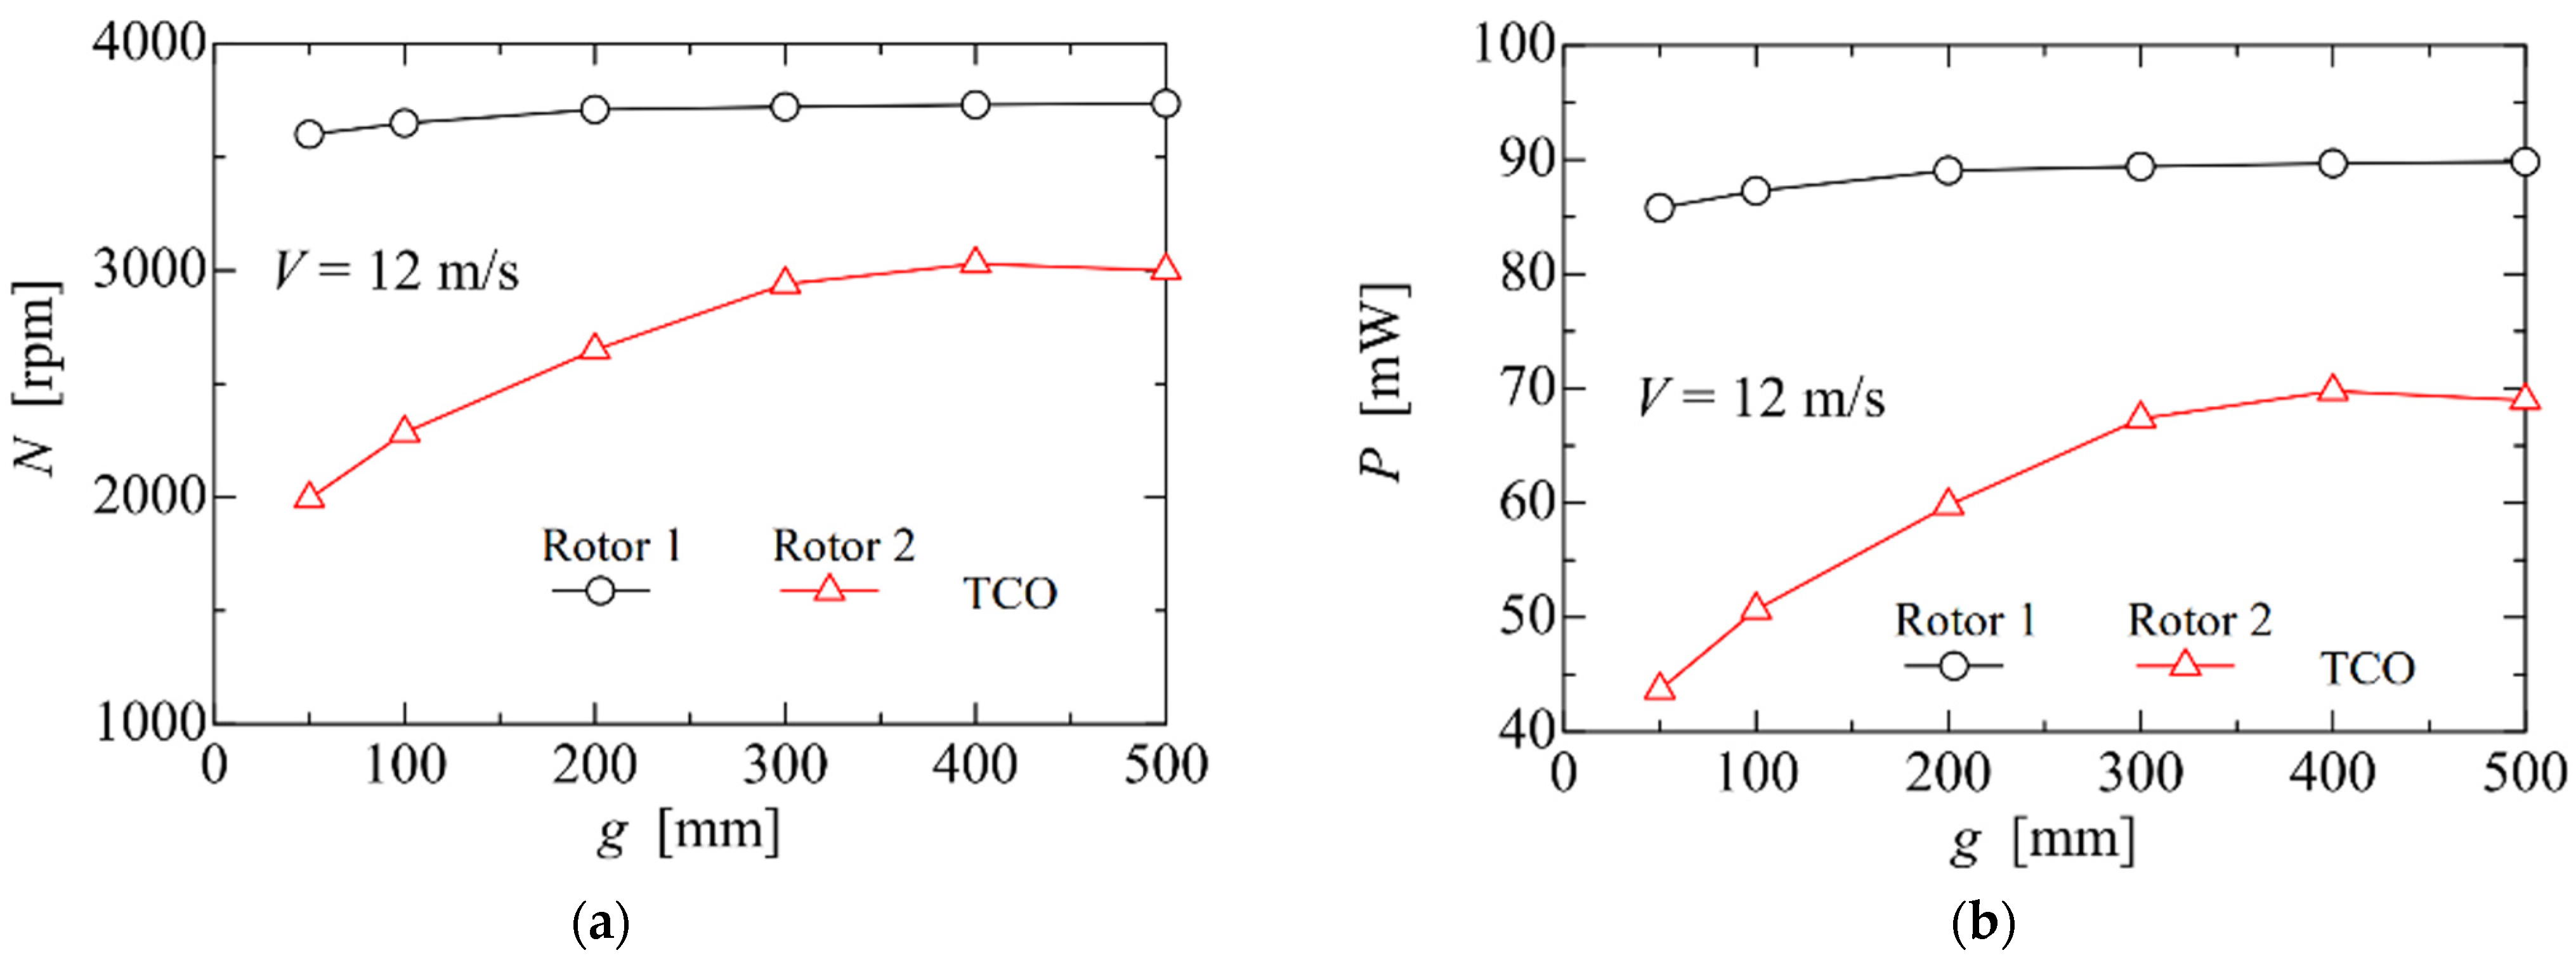
To investigate the decreasing tendency in smaller gaps, we also experimented with the TCO layout at a higher wind speed, as shown in
Figure 11a. At the smallest gap of
g = 50 mm, the value of
N of Rotor 1 is 97% of that of an isolated rotor (3700 rpm for
V = 12 m/s) and at
g = 500 mm, the value of
N of Rotor 2 is approximately 80% of that of an isolated rotor, as in the case of
V = 10 m/s. At this higher uniform wind speed, the downwind Rotor 2 continued to rotate at 54% and 62% of rotational speed of an isolated rotor, even at smaller gaps of
g = 50 and 100 mm, respectively.
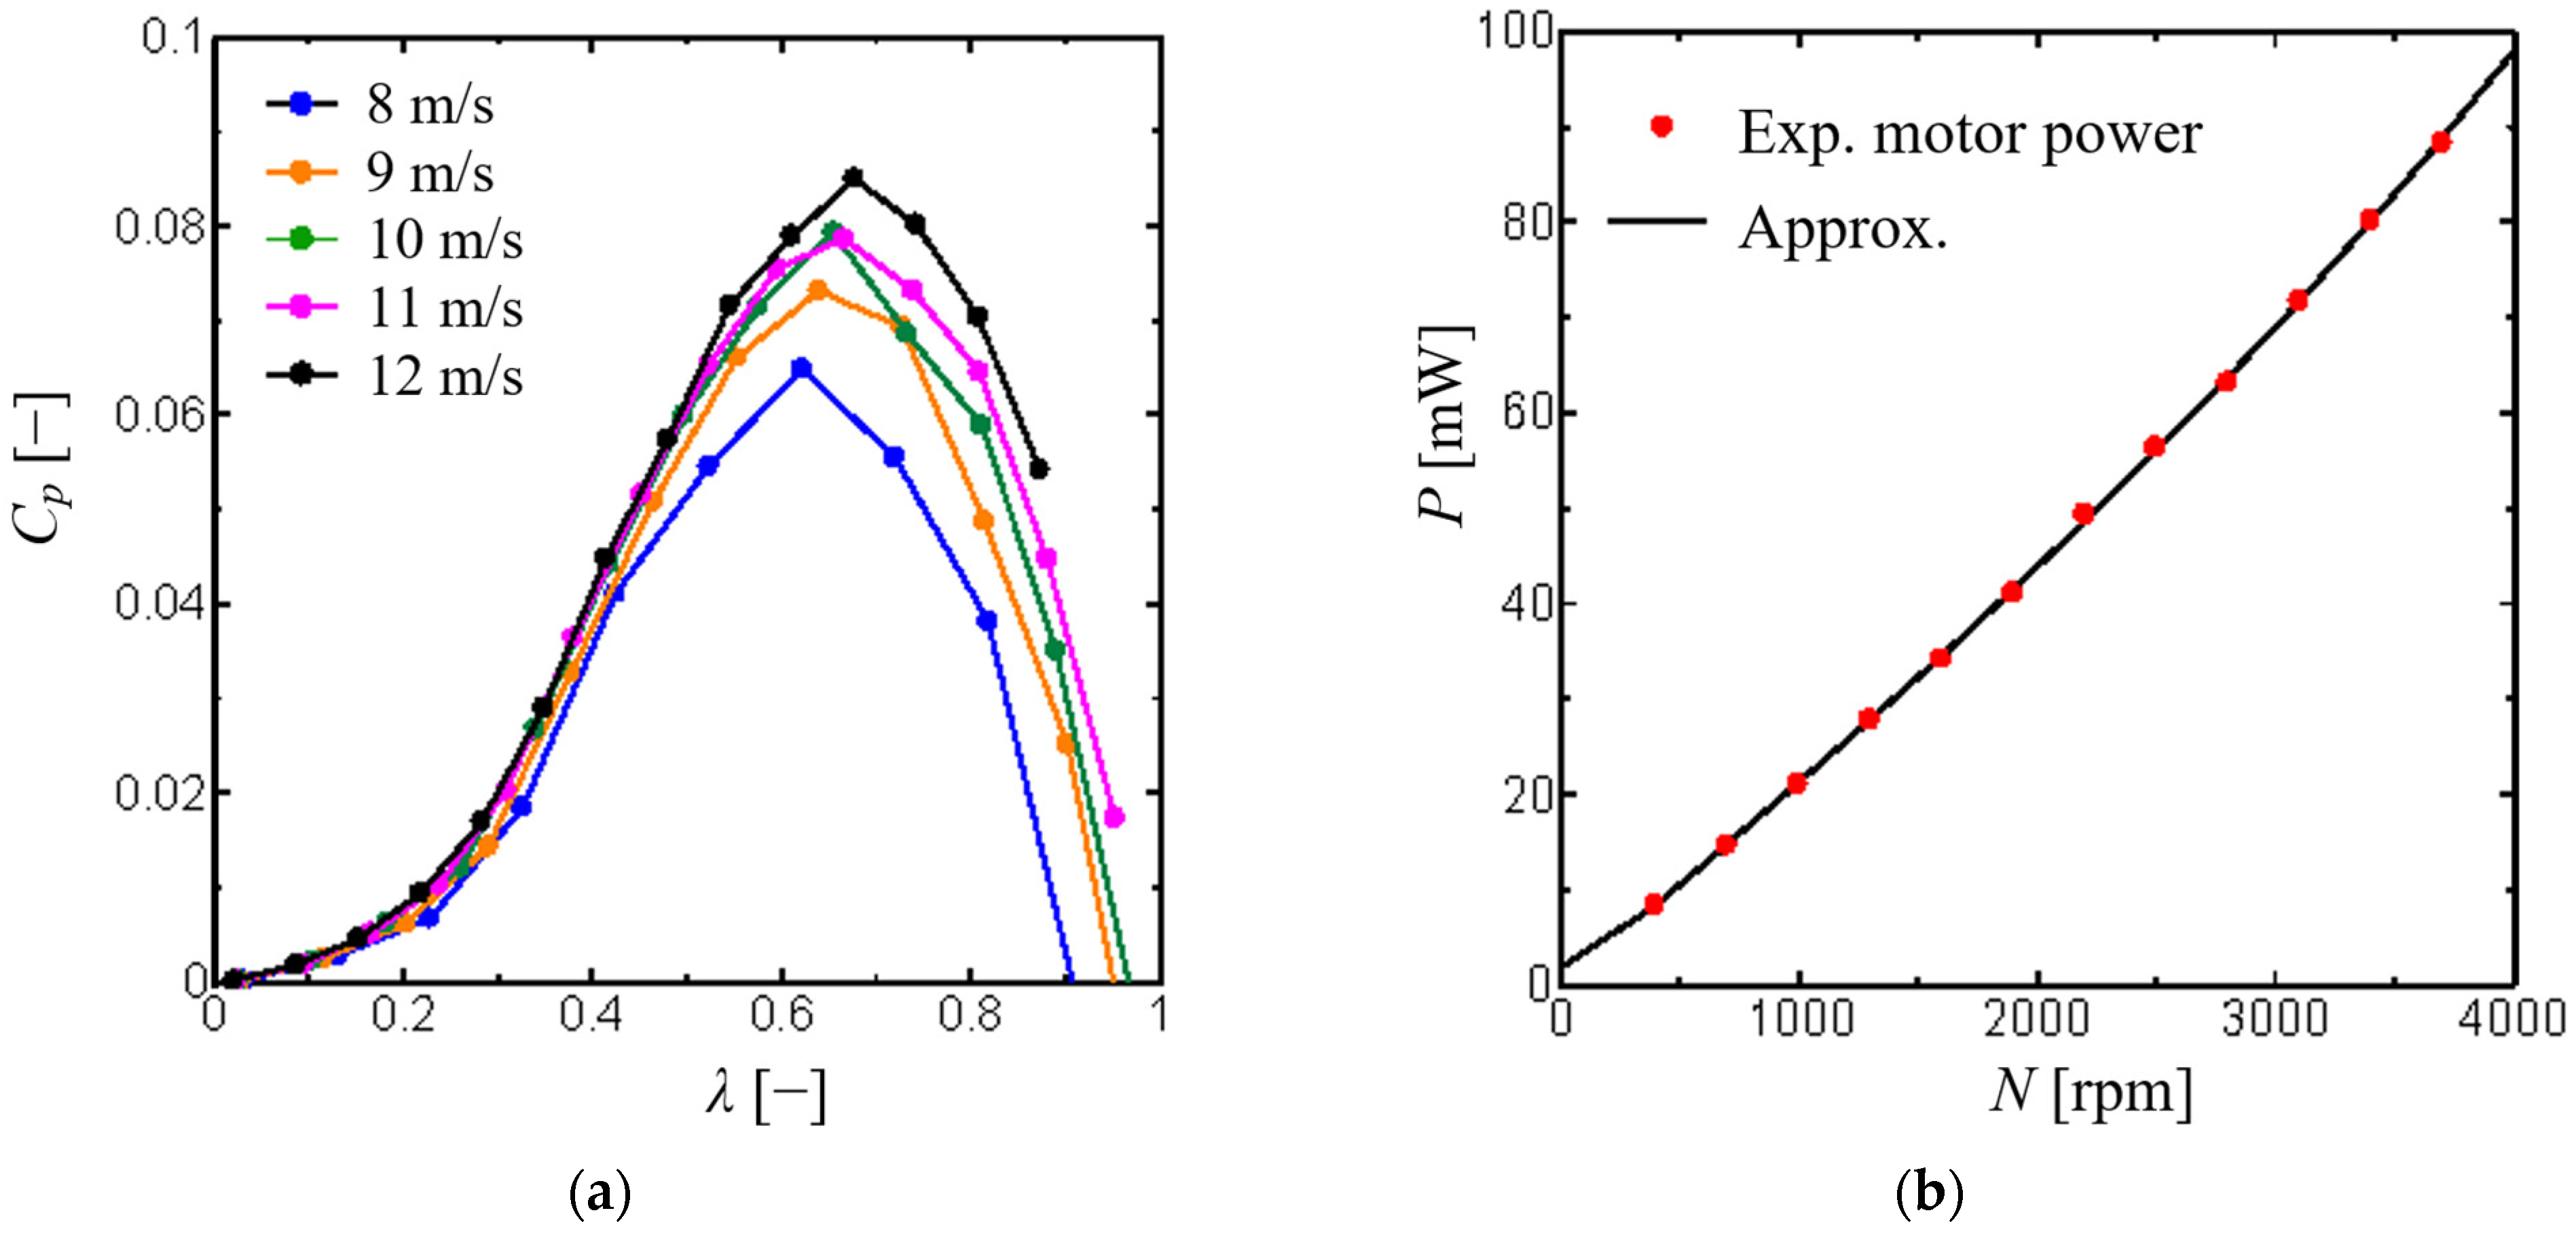
Figure 11b shows the gap dependence of the power
P obtained using Equation (1) explained in
Section 2.5. The main results are as follows: (1) At
g = 50 mm (
g/
D = 1), the power values of Rotor 1 and Rotor 2 are 97% and 49% of that of an isolated rotor (88.7 mW for
V = 12 m/s); (2) at
g = 500 mm (
g/
D = 10), the power of Rotor 2 is 78% of an isolated rotor. At the largest gap ratio, the power of Rotor 1 recovers to the value of a single rotor. According to
Figure 6b,c in Sahebzadeh et al. [
21], in the TCO layout for
V = 9.3 m/s, the power values of Rotor 1 and Rotor 2 are 92% and 44%, respectively, of that of an isolated rotor at
g/
D = 0.5; these values changed to 95% and 40%, respectively, at
g/
D = 1.25. These values are qualitatively consistent with our experimental values for
g/
D = 1. Since the gap dependence of
N is similar to that of
P, as shown in
Figure 11, hereafter, we will only use
N for the discussion on the gap/wind-direction dependence for all configurations.
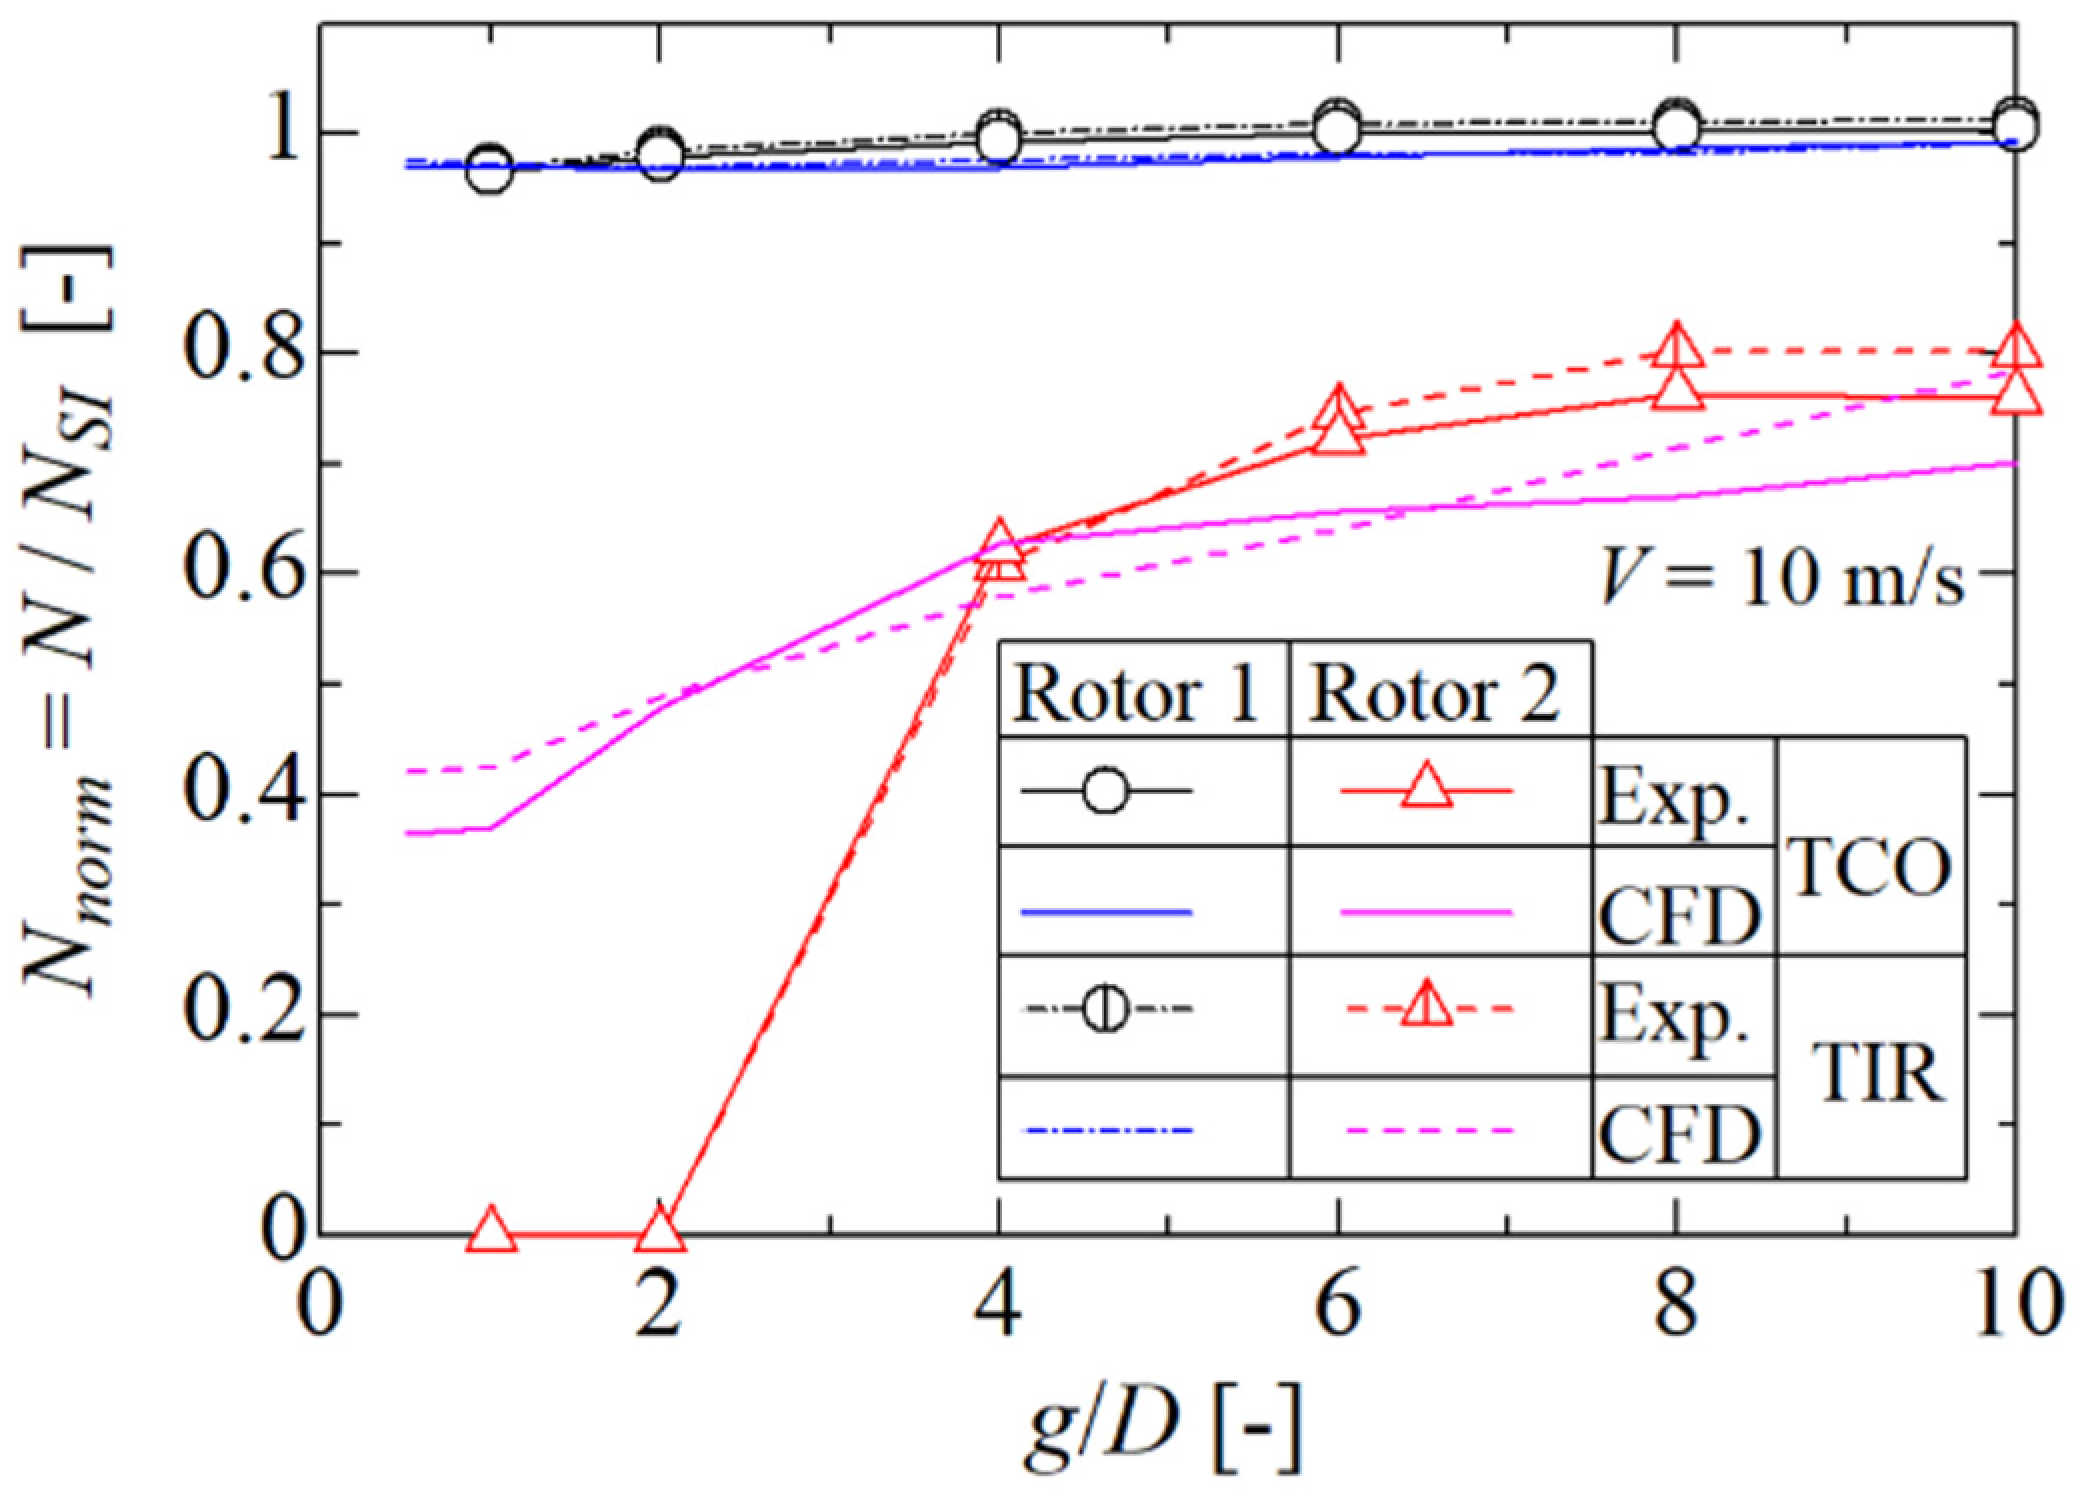
Next, we examine the normalized rotational speed
Nnorm, defined in Equation (2).
Figure 12 compares the results of
Nnorm obtained from the wind-tunnel experiment (
Figure 10) with those obtained by Hara et al. [
13] via 2D CFD analysis using the dynamic fluid body interaction (DFBI) method. The gap between the two rotors (
g on the abscissa) is also nondimensionalized using the diameter of each rotor
D. Regardless of the layout type (TCO and TIR), the normalized rotational speed decreased as the gap decreased in the experimental and CFD results.
Dessoky et al. [
7] have reported the importance of the rotor spacing on the pair performance. This is based on the CFD code developed at their institute for wind turbine applications using 2 m diameter Darrieus turbine rotors of the two-bladed NACA 0021 airfoil. Sahebzadeh et al. [
11] showed that the turbine wake is broken at a downstream distance of approximately 8
D for the TCO layout based on the unsteady Reynolds-averaged Navier–Stokes (URANS) simulations with one-bladed turbines of an NACA 0018 airfoil. Their results also show a decreasing tendency of power for both rotors with decreasing
g/
D. They stated that the drop was caused by the upstream induction of the downstream turbine. However, their downstream rotor starts generating higher power at 0.25 ≤
g/
D ≤ 1.25 in an unexpected manner; the minimum power is obtained at
g/
D = 2 and 4 in their simulation (see their Figure 6a). The parameter
g in our work corresponds to their
R-
d (
R is the center-to-center distance of two rotors and
d is the diameter of the rotor in Sahebzadeh et al. [
11]). Recently, Kuang et al. [
8] reported that “
the gap ratio of g/D = 5 can appropriately balance the power and space cost” only in the case of the TCO layout. Our experimental result (
Figure 12), showing a slight change in the
Nnorm with the gap at
g/
D > 5, substantiates their appropriate gap ratio.
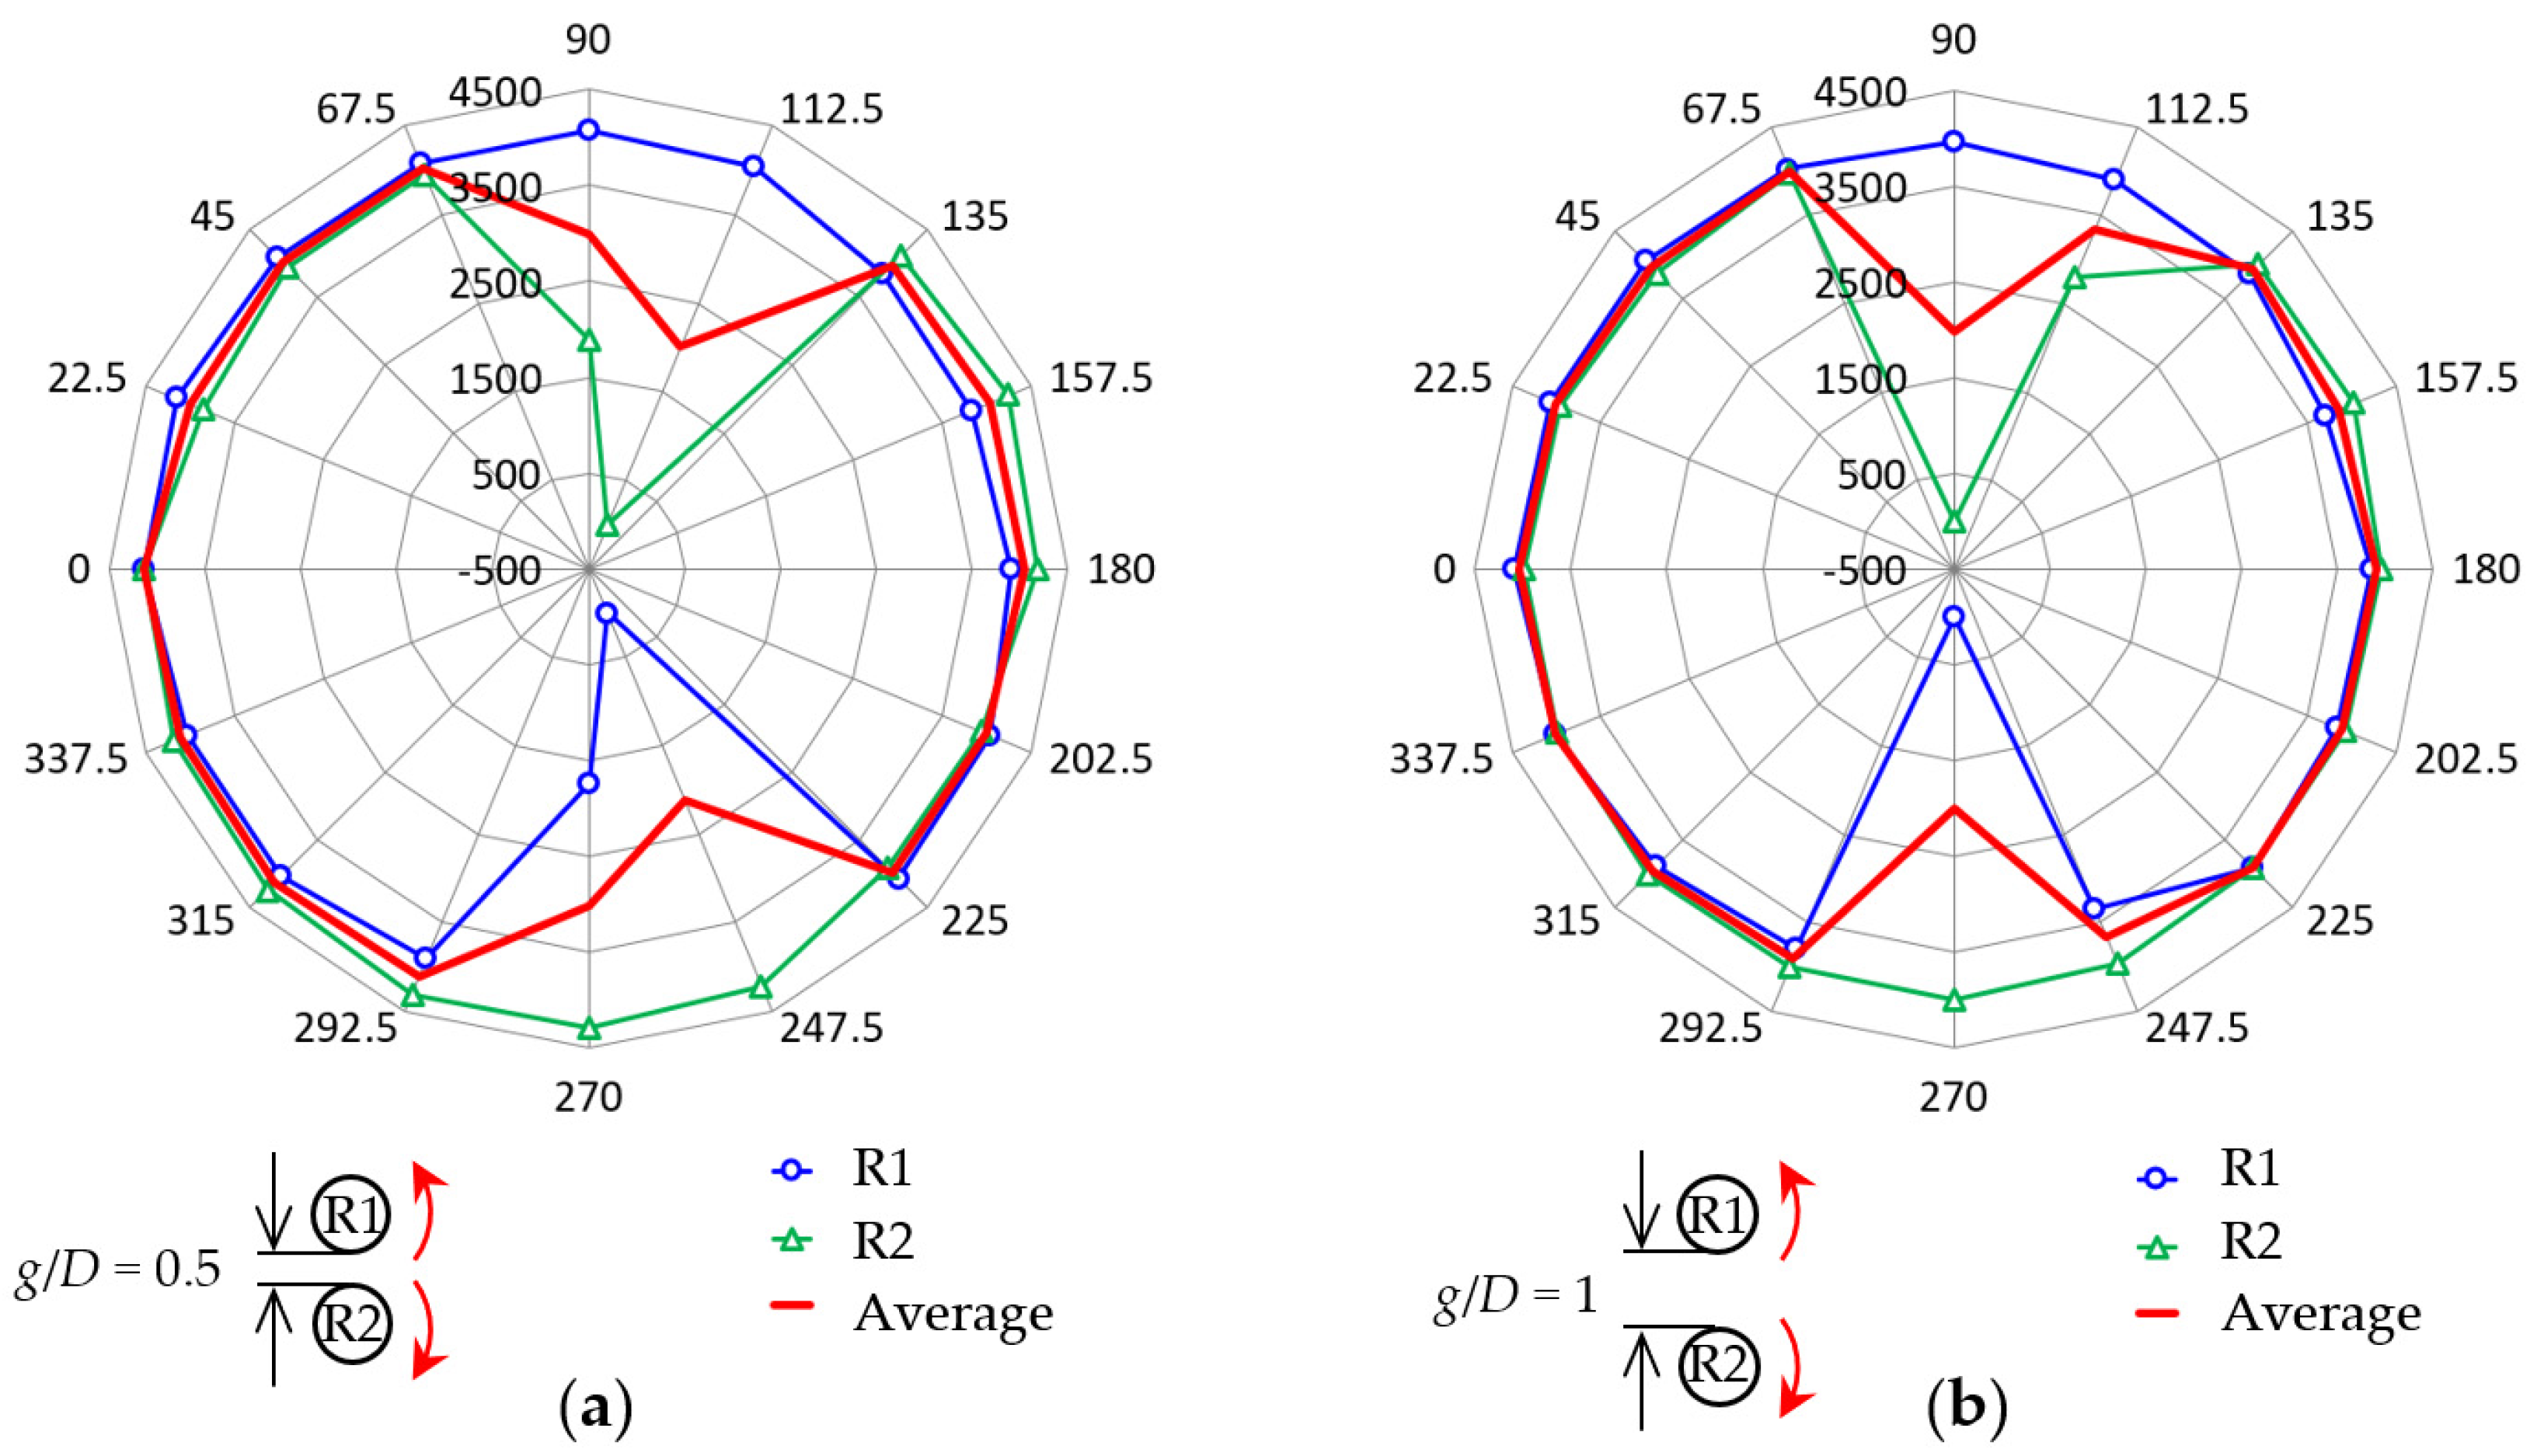
3.2. Wind-Direction Dependence of a Pair of VAWTs (16 Wind Directions)
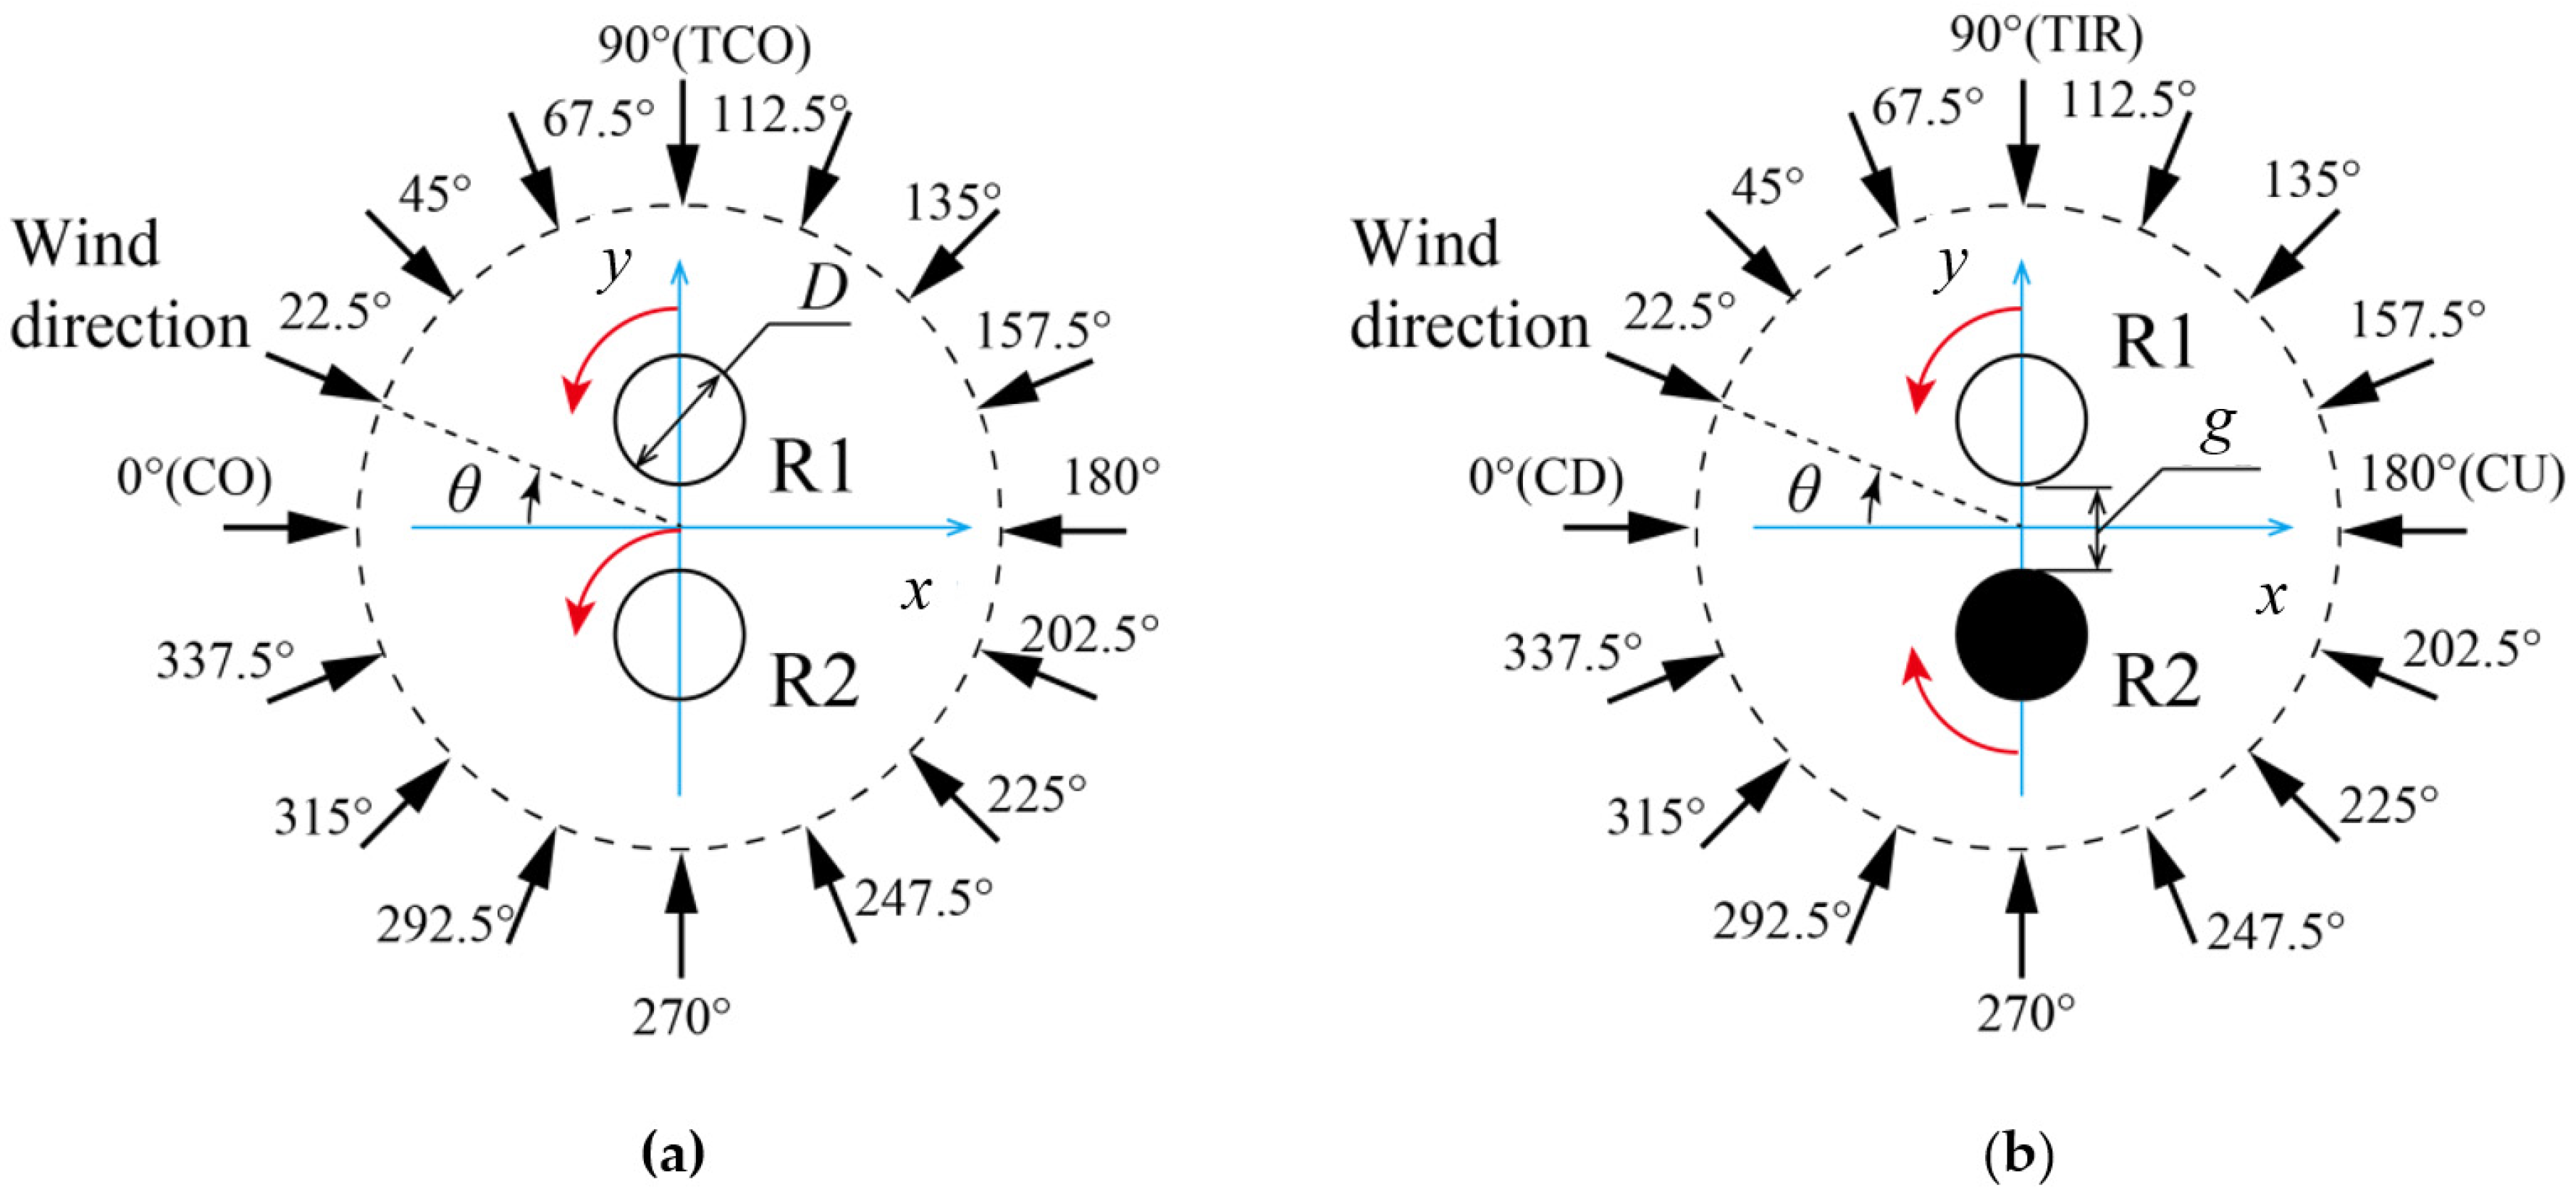
Figure 13 shows the 16-wind-direction dependence of the rotational speed in the CO configuration. The surrounding numbers indicate the wind direction
θ (°). At wind direction
θ = 90°, called the tandem co-rotating (TCO) layout, the rotational speed of the downwind rotor R2 decreases considerably (
Figure 13b) or R2 stops (
Figure 13a). This happens because of the wake of upstream rotor R1, as in the cases in
Figure 11a (
V = 12 m/s) and
Figure 10a (
V = 10 m/s). Interestingly, R2 also stops at
θ = 112.5°. This can be explained by the existence of a deflected wake flow of R1 toward R2 by the Magnus effect [
25]. Huang et al. [
26] reported “
wake shape deformation and deflection” of a VAWT using advanced robotic PIV. Strom et al. [
1] have shown coherent structures in the wake of a vertical-axis turbine in a water channel experiment, in addition to the wake deflection (see their Figure 5). Furthermore, they have explained the mechanisms for the wake asymmetry using forces acting on the blade (see their Figure 6).
Sogo et al. [
24] have reported this deflected wake in the cases of TCO and TIR layouts by visualizing the streak lines with a smoke-wire method in their
Figure 4 and
Figure 5. In
Figure 13, the same phenomena (decrease in rotational speed of R1 or stoppage of R1) can be confirmed at
θ = 270° and 292.5°, which are in origin symmetry for
θ = 90° and 112.5°, respectively. Therefore, these phenomena ensure the repeatability of the experiment explained in
Section 2.3. Sahebzadeh et al. [
21] have defined the wind direction near the TCO layout (
θ = 90–120° or
θ = 270–300° and
g/
D < 4 in our coordinate) as the “
wake-interaction regime” with low total performance in the TCO layout. This concurs well with our findings showing an origin-symmetrical distribution in the CO configuration.
Figure 14 shows the 16-wind-direction dependence of the rotational speed in the IR configuration. At wind direction
θ = 90°, called the tandem inverse-rotating (TIR) layout, the rotational speed of the downwind rotor R2 decreases considerably (
Figure 14a) or R2 stops (
Figure 14b). This is the result of a wake interference, caused by the upwind rotor R1, with downwind rotor R2, as in the case in
Figure 10b (
V = 10 m/s). At
θ = 112.5°, although R2 stops in the case of
g/
D = 0.5, it continues to rotate in the case of
g/
D = 1. In
Figure 14, a slowdown in rotational speed or stopping of R1 can also be confirmed at
θ = 270° and 247.5°, which are in line symmetry for
θ = 90° and 112.5°, respectively.
This line symmetry is seen with respect to the line connecting the wind direction of
θ = 0° and 180°. Consequently, the size of the left half area surrounded by red lines (indicating the average rotor speed of R1 and R2) and the line connecting the wind direction of
θ = 90° and 270° is larger than the size of the corresponding right half area. This imbalance is emphasized with the decrease in
g/
D, as predicted by the numerical simulation by Hara et al. [
13] (see their Figure 13b,d,f). In contrast, unnatural increases in power in the case of tandem layout are reported by Dabiri [
3], based on field measurements (see their Figure 4), and Zanforlin and Nishino [
6] (see their Figure 15), conducted by 2D numerical simulation. The former is seen in a wind direction of approximately
θ = 110° and 290° (approximately 20° and 200° in their coordinates). The latter is seen in a wind direction of approximately
θ = 90° (approximately γ = 90° in their coordinate). The line-symmetrical distribution of the wind-direction dependence in the IR configuration was also seen in the results of De Tavernier et al. [
12], obtained using the 2D panel/vortex method (see their Figure 9), though they do not mention it. However, increases seen in their results for approximately
θ = 45°, 135°, 225°, or 315° are unexplained.
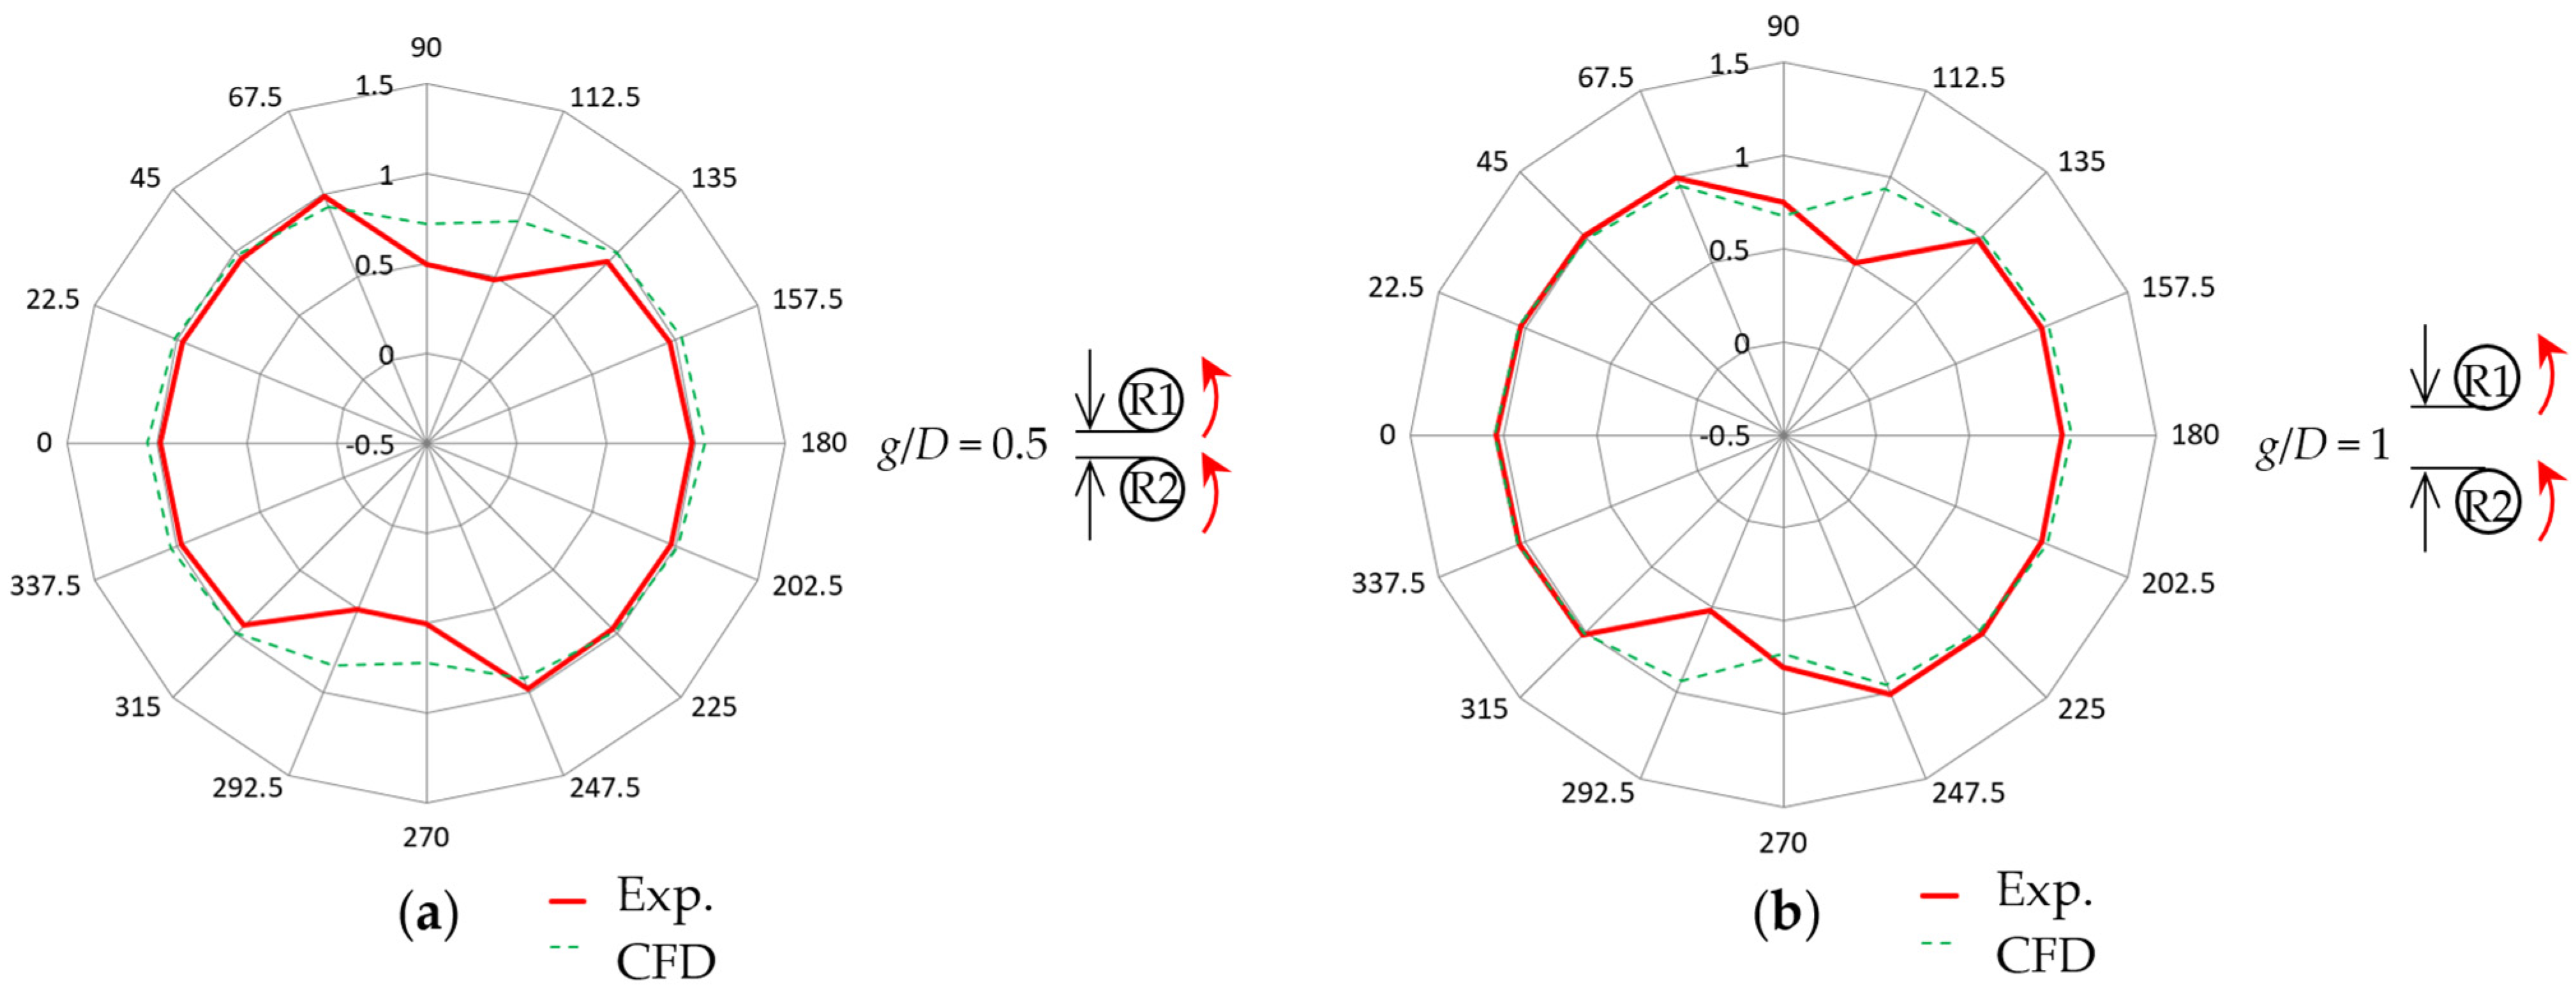
Next, we compare the experimental results with those obtained by 2D CFD [
13] conducted by our group.
Figure 15 depicts the comparison between the experimental and CFD results on 16-wind-direction dependence of the average normalized rotational speed in the CO configuration. In each figure, the red line represents the experimental results and the green dotted line shows the CFD results. Decreases in the average rotational speed on the TCO layout (
θ = 90° and 270°) and near the tandem layout (
θ = 112.5° and 292.5°) are seen in both the experimental and CFD results. This origin-symmetrical distribution on 16-wind-direction dependence in the CO configuration can be confirmed for
g/
D = 0.5 and 1. At
θ = 112.5° and 292.5°, the decrease in rotational speed occurs more explicitly in the experimental results compared to the CFD results. This implies that the wake deflection, accompanied by the stopping of a downwind rotor, in the 3D experiment is stronger than that of the 2D CFD.
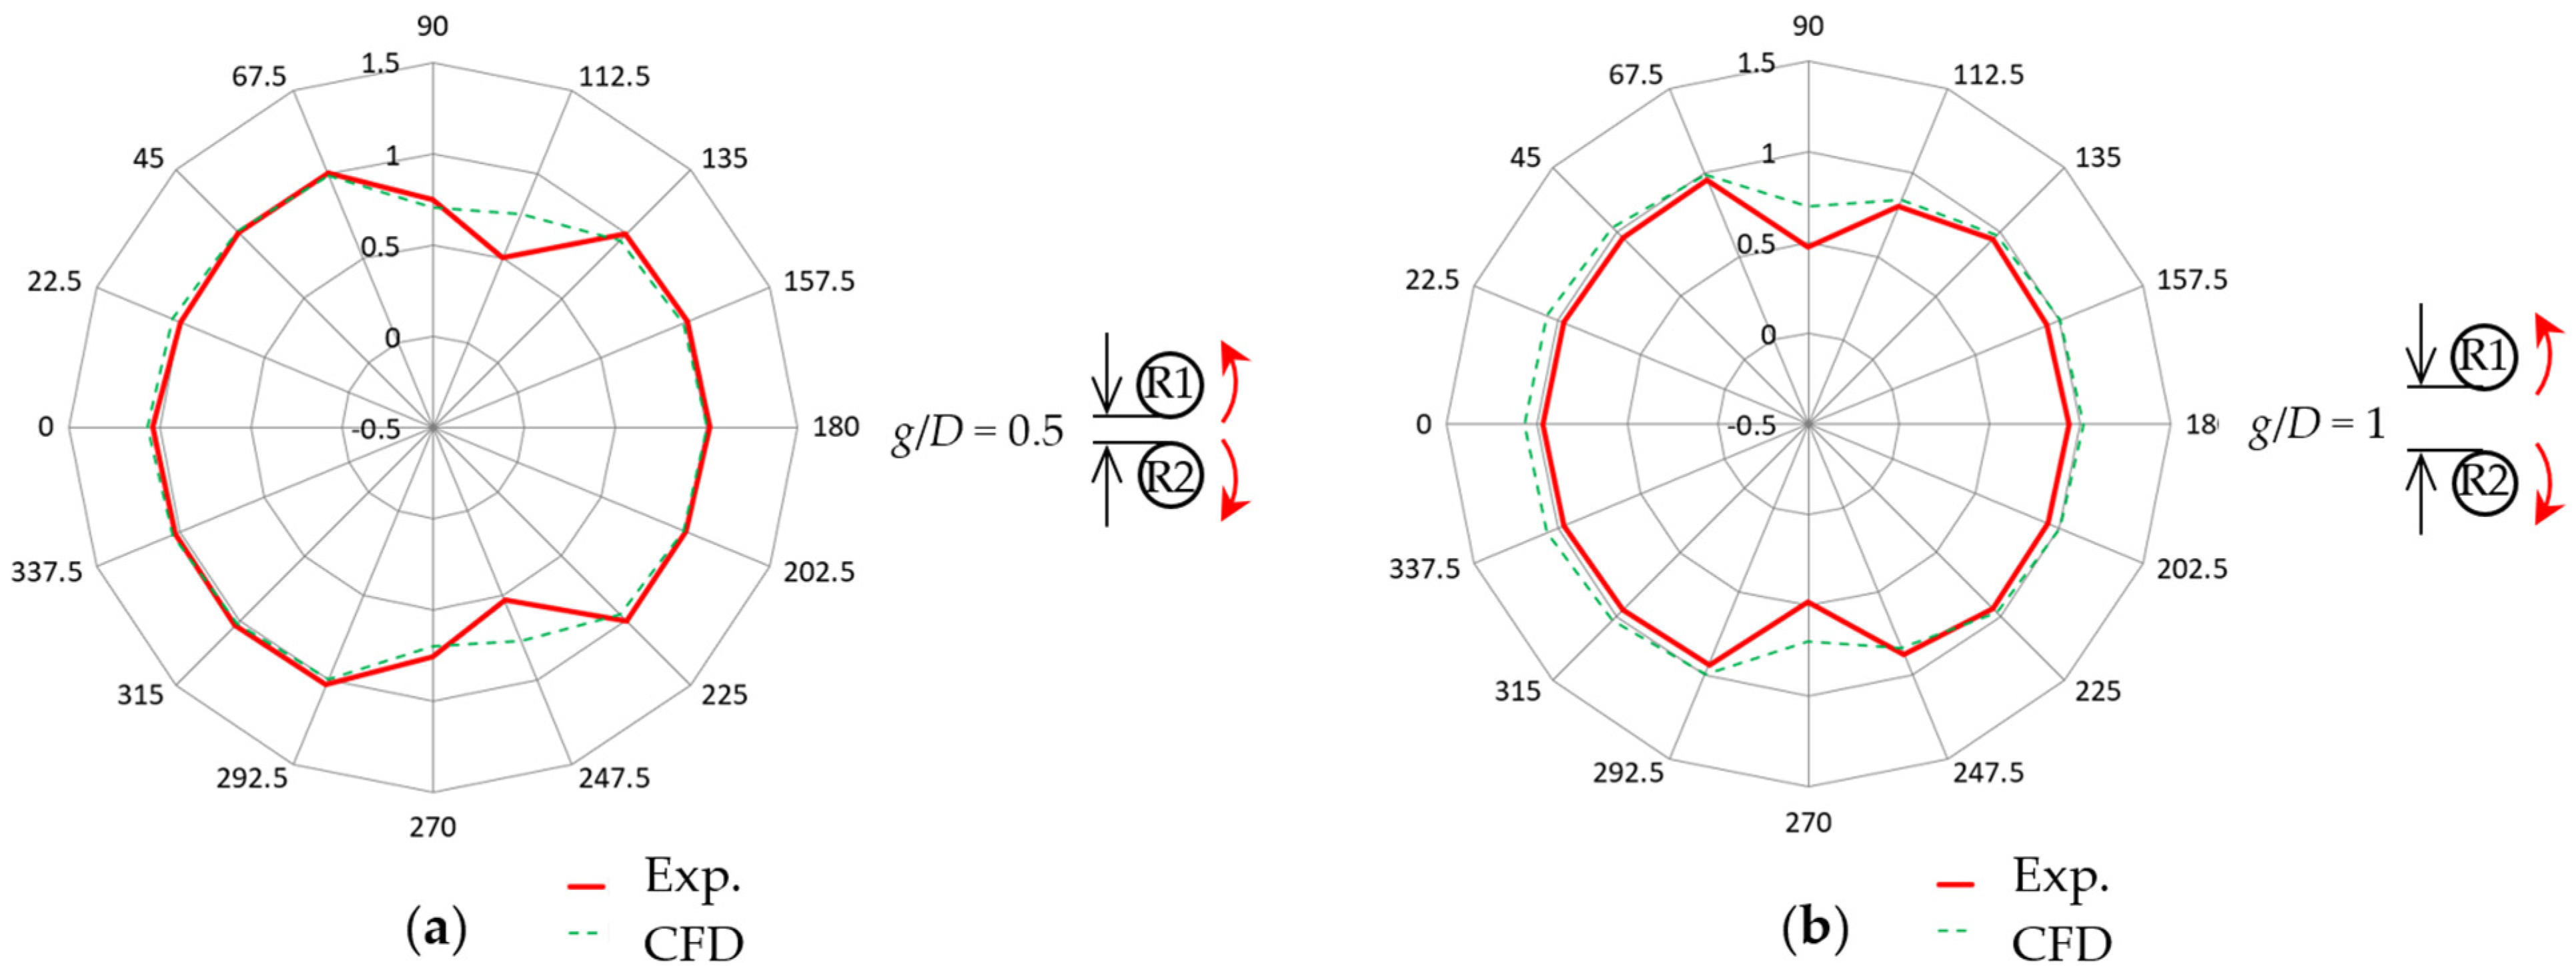
Figure 16 presents a comparison between the experimental and CFD results on the 16-wind-direction dependence of the average normalized rotational speed in the IR configuration. The CFD results also show an obvious slowdown in the average rotational speed in the TIR layout (
θ = 90° and 270°) and near the tandem layout (
θ = 112.5° and 247.5°). This supports the experimental results showing the line-symmetrical distribution on 16-wind-direction dependence in the IR configuration.
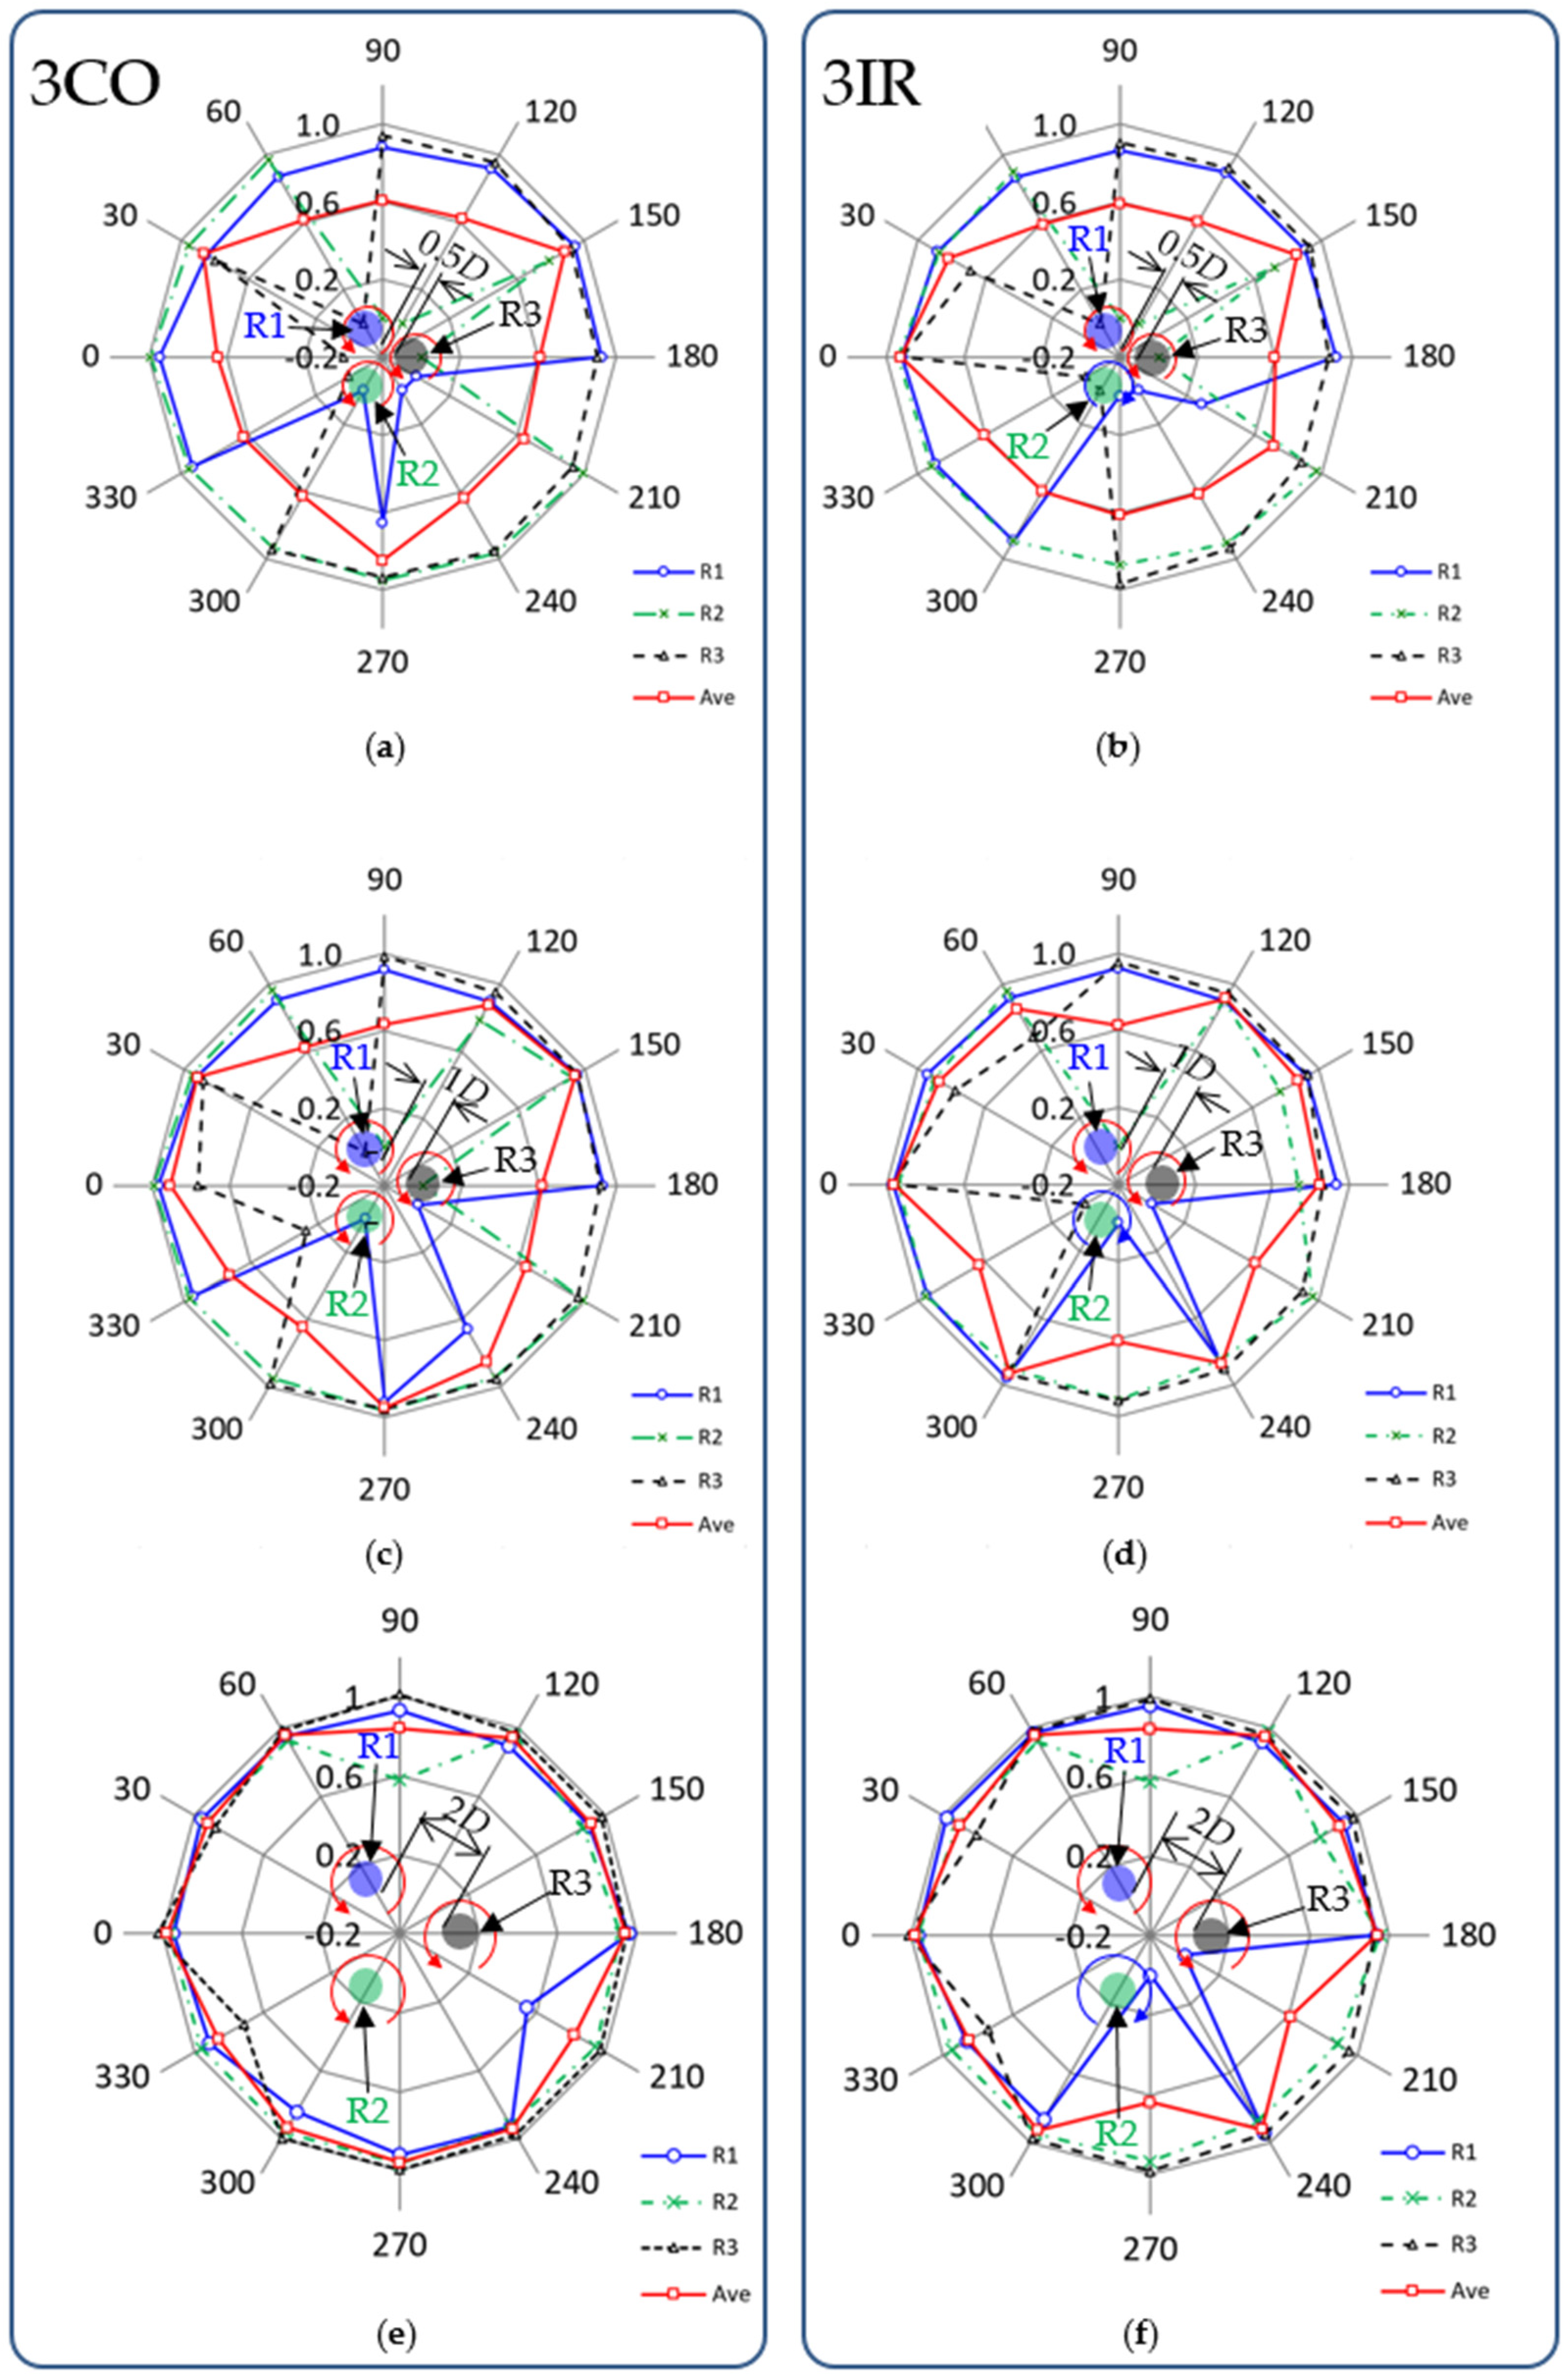
3.3. Wind-Direction Dependence of a Trio of VAWTs (12 Wind Directions)
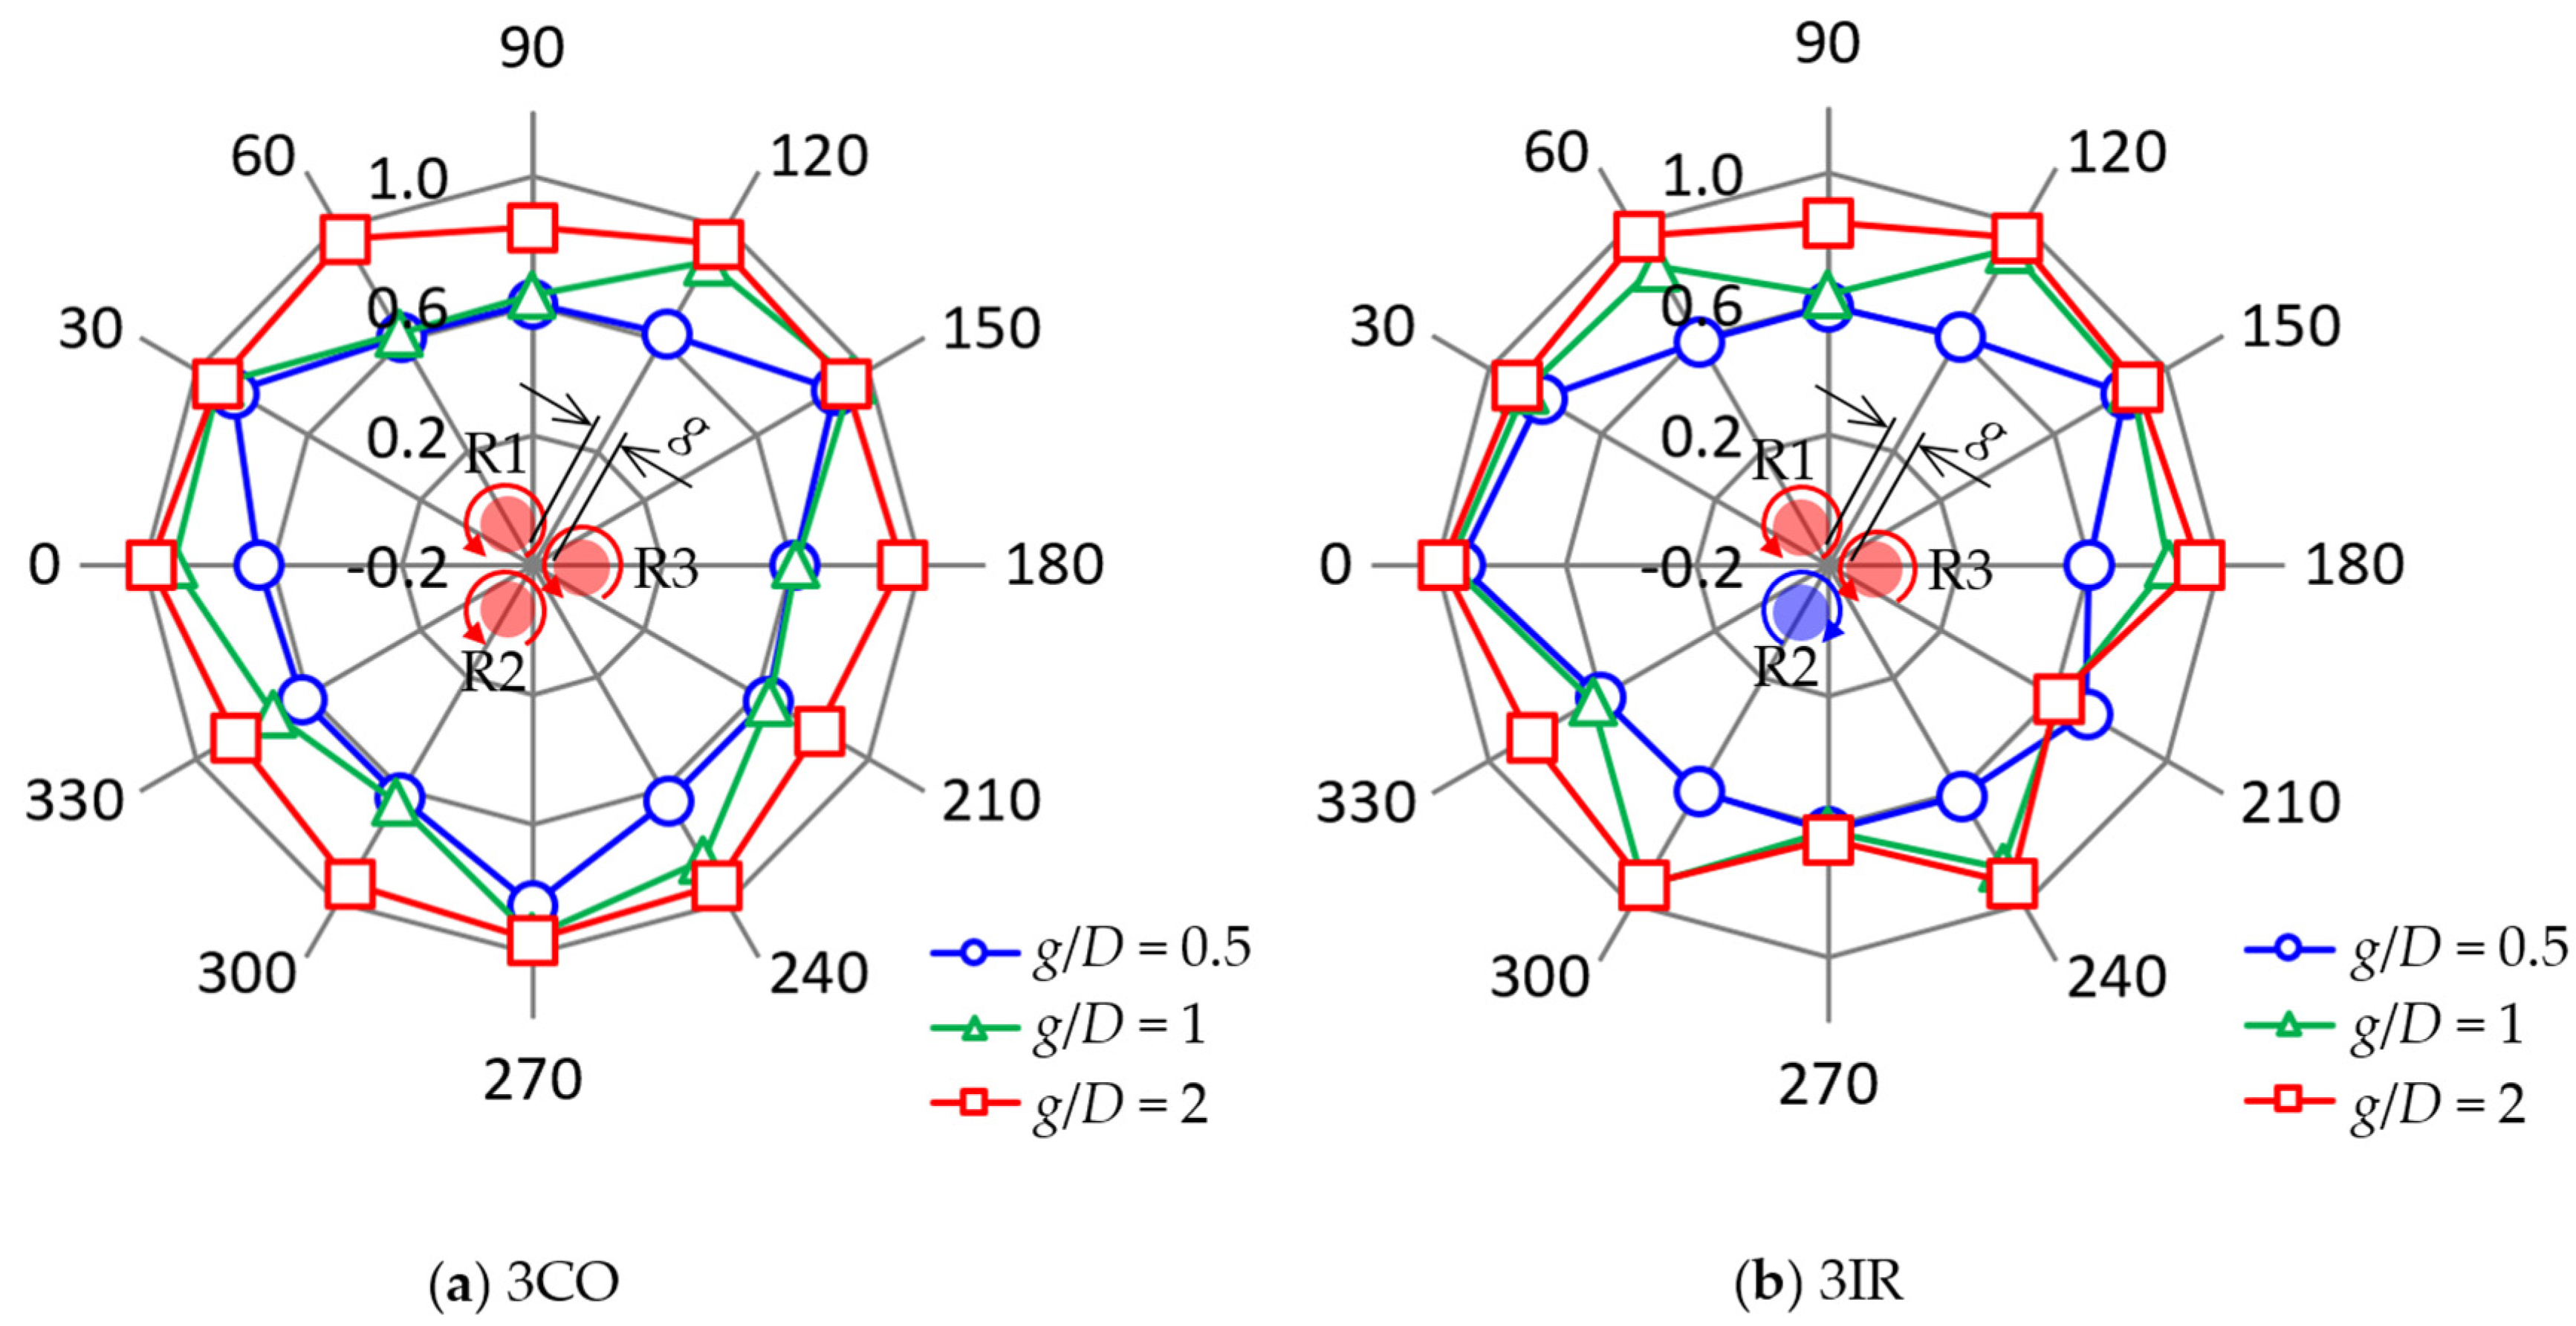
Figure 17 shows the 12-wind-direction dependence of the normalized rotational speed
Nnorm in the 3CO and 3IR configurations. In each figure, the blue circles indicate the rotational speed
N of Rotor 1 (R1), the green crosses plot the
N of Rotor 2 (R2), and the black triangles show the
N of Rotor 3 (R3). The red squares represent the average rotor speed of R1, R2, and R3, defined as
Nnorm, ave.
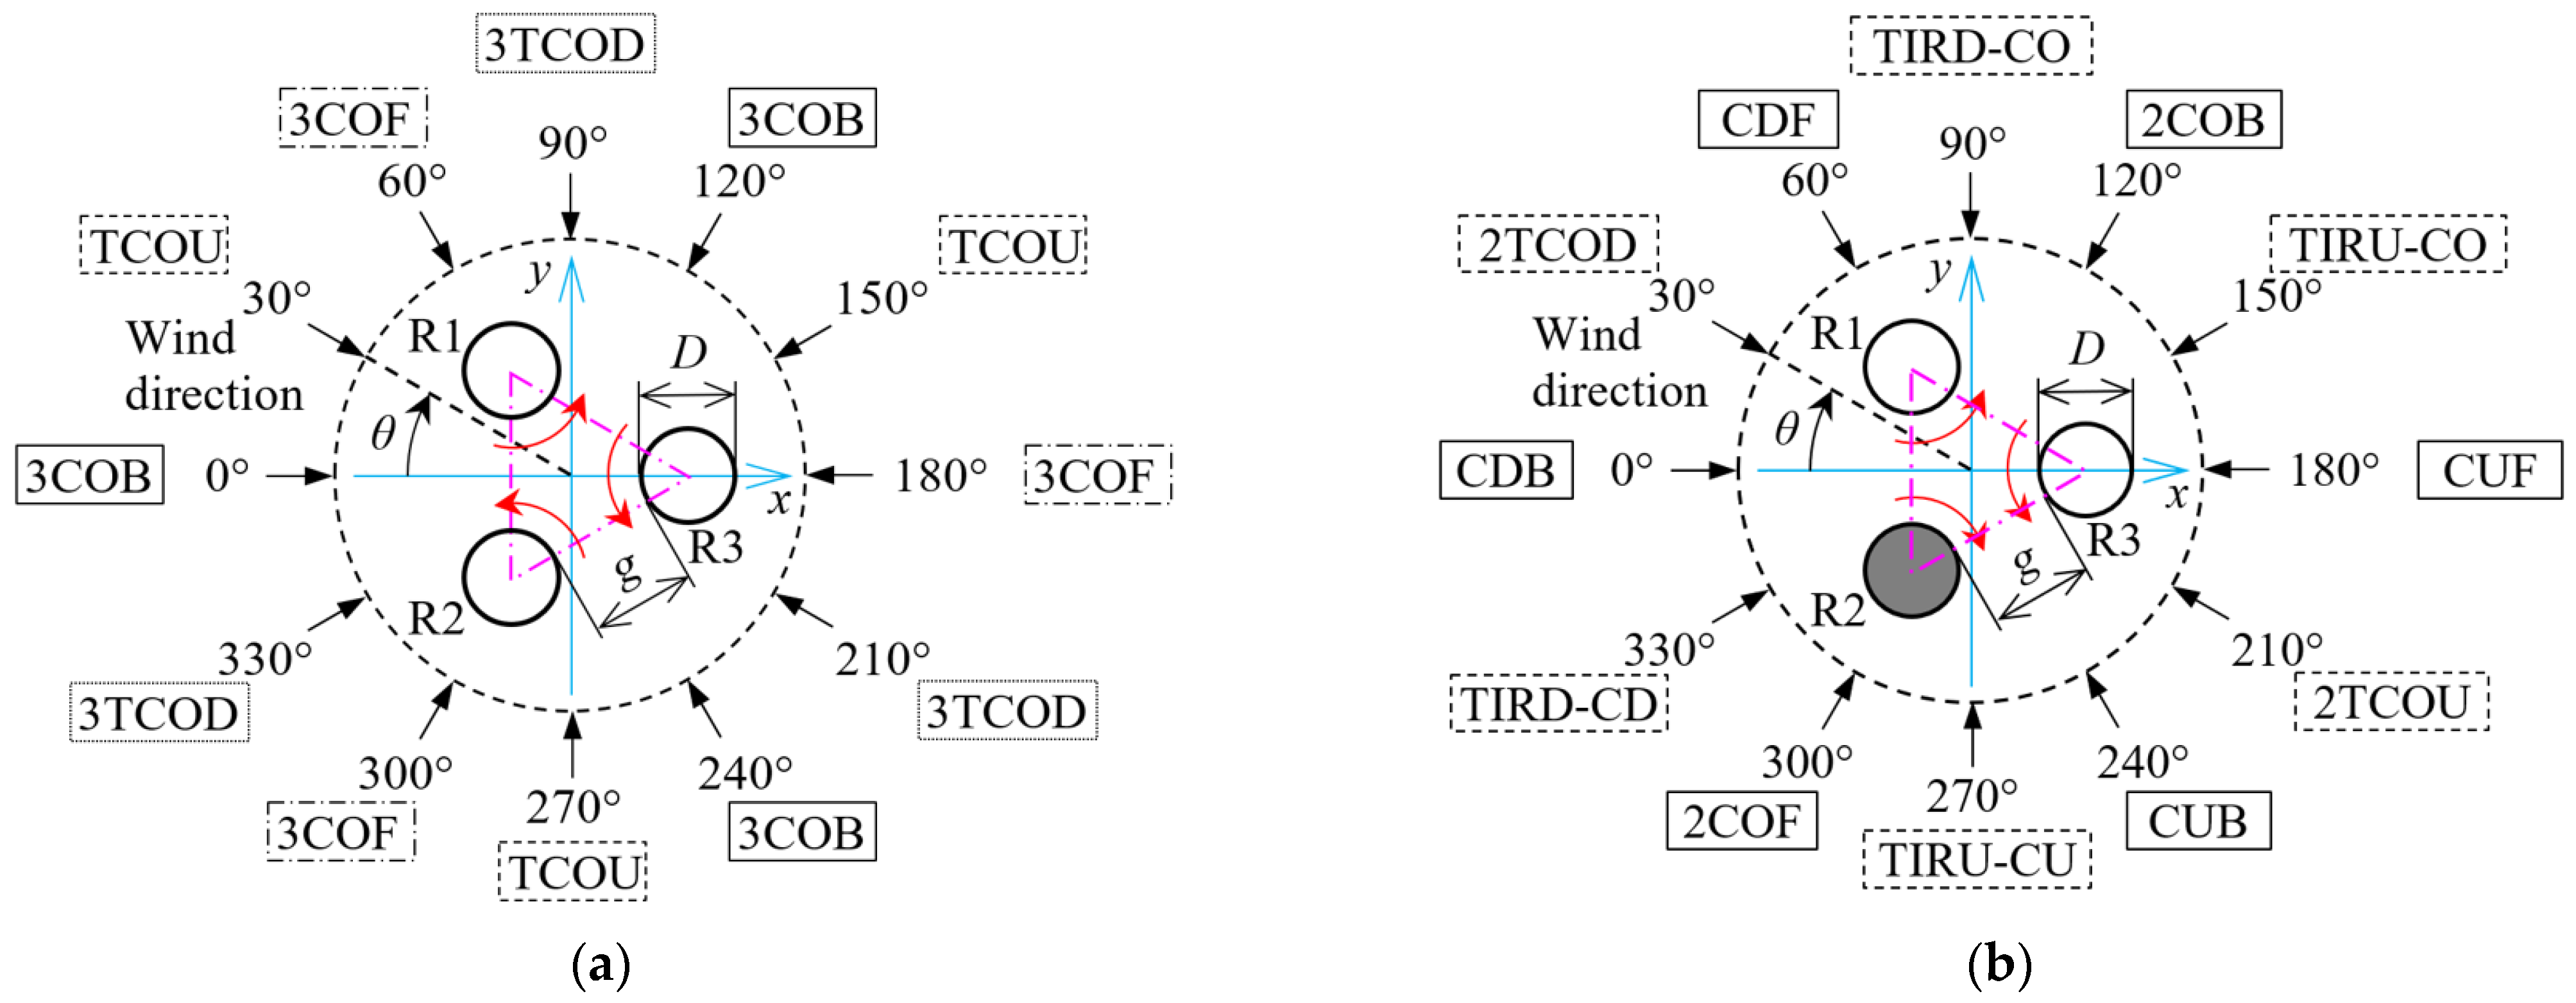
First, we investigate the 3CO configuration in
Figure 17a,c,e. At wind direction
θ = 0°, called 3COB (see
Figure 4a), the downwind rotor R3 stops at the smallest gap of
g/
D = 0.5 (
Figure 17a) but R3 rotates faster with increasing the gap (
Figure 17c,e). At wind direction
θ = 30°, called TCOU, all rotors rotate at a relatively high speed, with the average rotational speed of the three rotors (
Nnorm,ave) reaching a maximum value at
g/
D = 0.5 and 1 (
Figure 17a,c). At
θ = 60°, called 3COF, one of the downwind rotors, R3, stops rotating at
g/
D = 0.5 and 1 (
Figure 17a,c). Similarly, at
θ = 90°, called 3TCOD, the downwind rotor R2 stops at
g/
D = 0.5 and 1 (
Figure 17a,c). In this layout, a significant decrease in the rotational speed of R2 occurs, even in the largest gap of
g/
D = 2 (
Figure 17e). As a result, the average rotational speed
Nnorm,ave is remarkably low in the 3TCOD. As explained in
Section 2.4, the same layout occurs in every 120° in the 3CO configuration. In fact, the experimental results (
Figure 17a,c,e) show the excellent
rotational symmetry for the average normalized rotational speed
Nnorm,ave.
Second, we examine the 3IR configuration in
Figure 17b,d,f. At wind direction
θ = 0° (CDB; see
Figure 4b), the downwind rotor R3, in addition to the upwind rotors (R1 and R2), continues to rotate even at the smallest gap of
g/
D = 0.5 (
Figure 17b). This completely differs from the result in 3COB (
θ = 0° in the 3CO layout). The average rotational speed of the three rotors,
Nnorm,ave, in the 3IR configuration reaches its maximum value at
θ = 0° (i.e., CDB) at
g/
D = 0.5, 1, and 2 (
Figure 17b,d,f). Hence,
Nnorm,ave in other layouts tends to have a much smaller value than it does in CDB, especially in the cases with a smaller gap distance. Although we do not explain all the layouts in detail here, the experimental results shown in
Figure 17b,d,f prove that there is no rotationally symmetric distribution in
Nnorm,ave, as expected by the 12 independent layouts in the 3IR configuration explained in
Section 2.4.
Hezaveh et al. [
4] termed the mean value of three turbines as “
cluster-averaged power.” For
θ = 60°, they suggested the best gap ratios of 2, 3, and 4 with the highest cluster-averaged power value (see their Figure 8). These values support our results that the best gap ratio is
g/
D = 2 with maximum
Nnorm,ave value (
Figure 17).
Here, we define the footprint radius
Rfoot and the footprint area
Afoot of a trio of rotors, as in Equations (3) and (4).
Rfoot is the radius of the circular region that connotes the three rotors with a gap distance of
g. The second term of the right hand of Equation (3) represents a distance from the center of the rotor trio to the corner of an equilateral triangle (lavender dash-dotted line in
Figure 4). Since the diameter of each rotor
D is 50 mm, the values of
Rfoot at
g = 25, 50, and 100 mm are 68.30, 82.74, and 111.60 mm, respectively. The
Afoot values at
g = 25, 50, and 100 mm are then 0.01466, 0.02150, and 0.03913 m
2, respectively. We define the simple average of the
Nnorm,ave of the 12 wind directions as the
Nnorm, 12-wind.
Table 3 lists the values of
Nnorm, 12-wind based on the wind-tunnel experiments and those multiplied by 3 (i.e., the number of rotors) divided by the corresponding
Afoot.
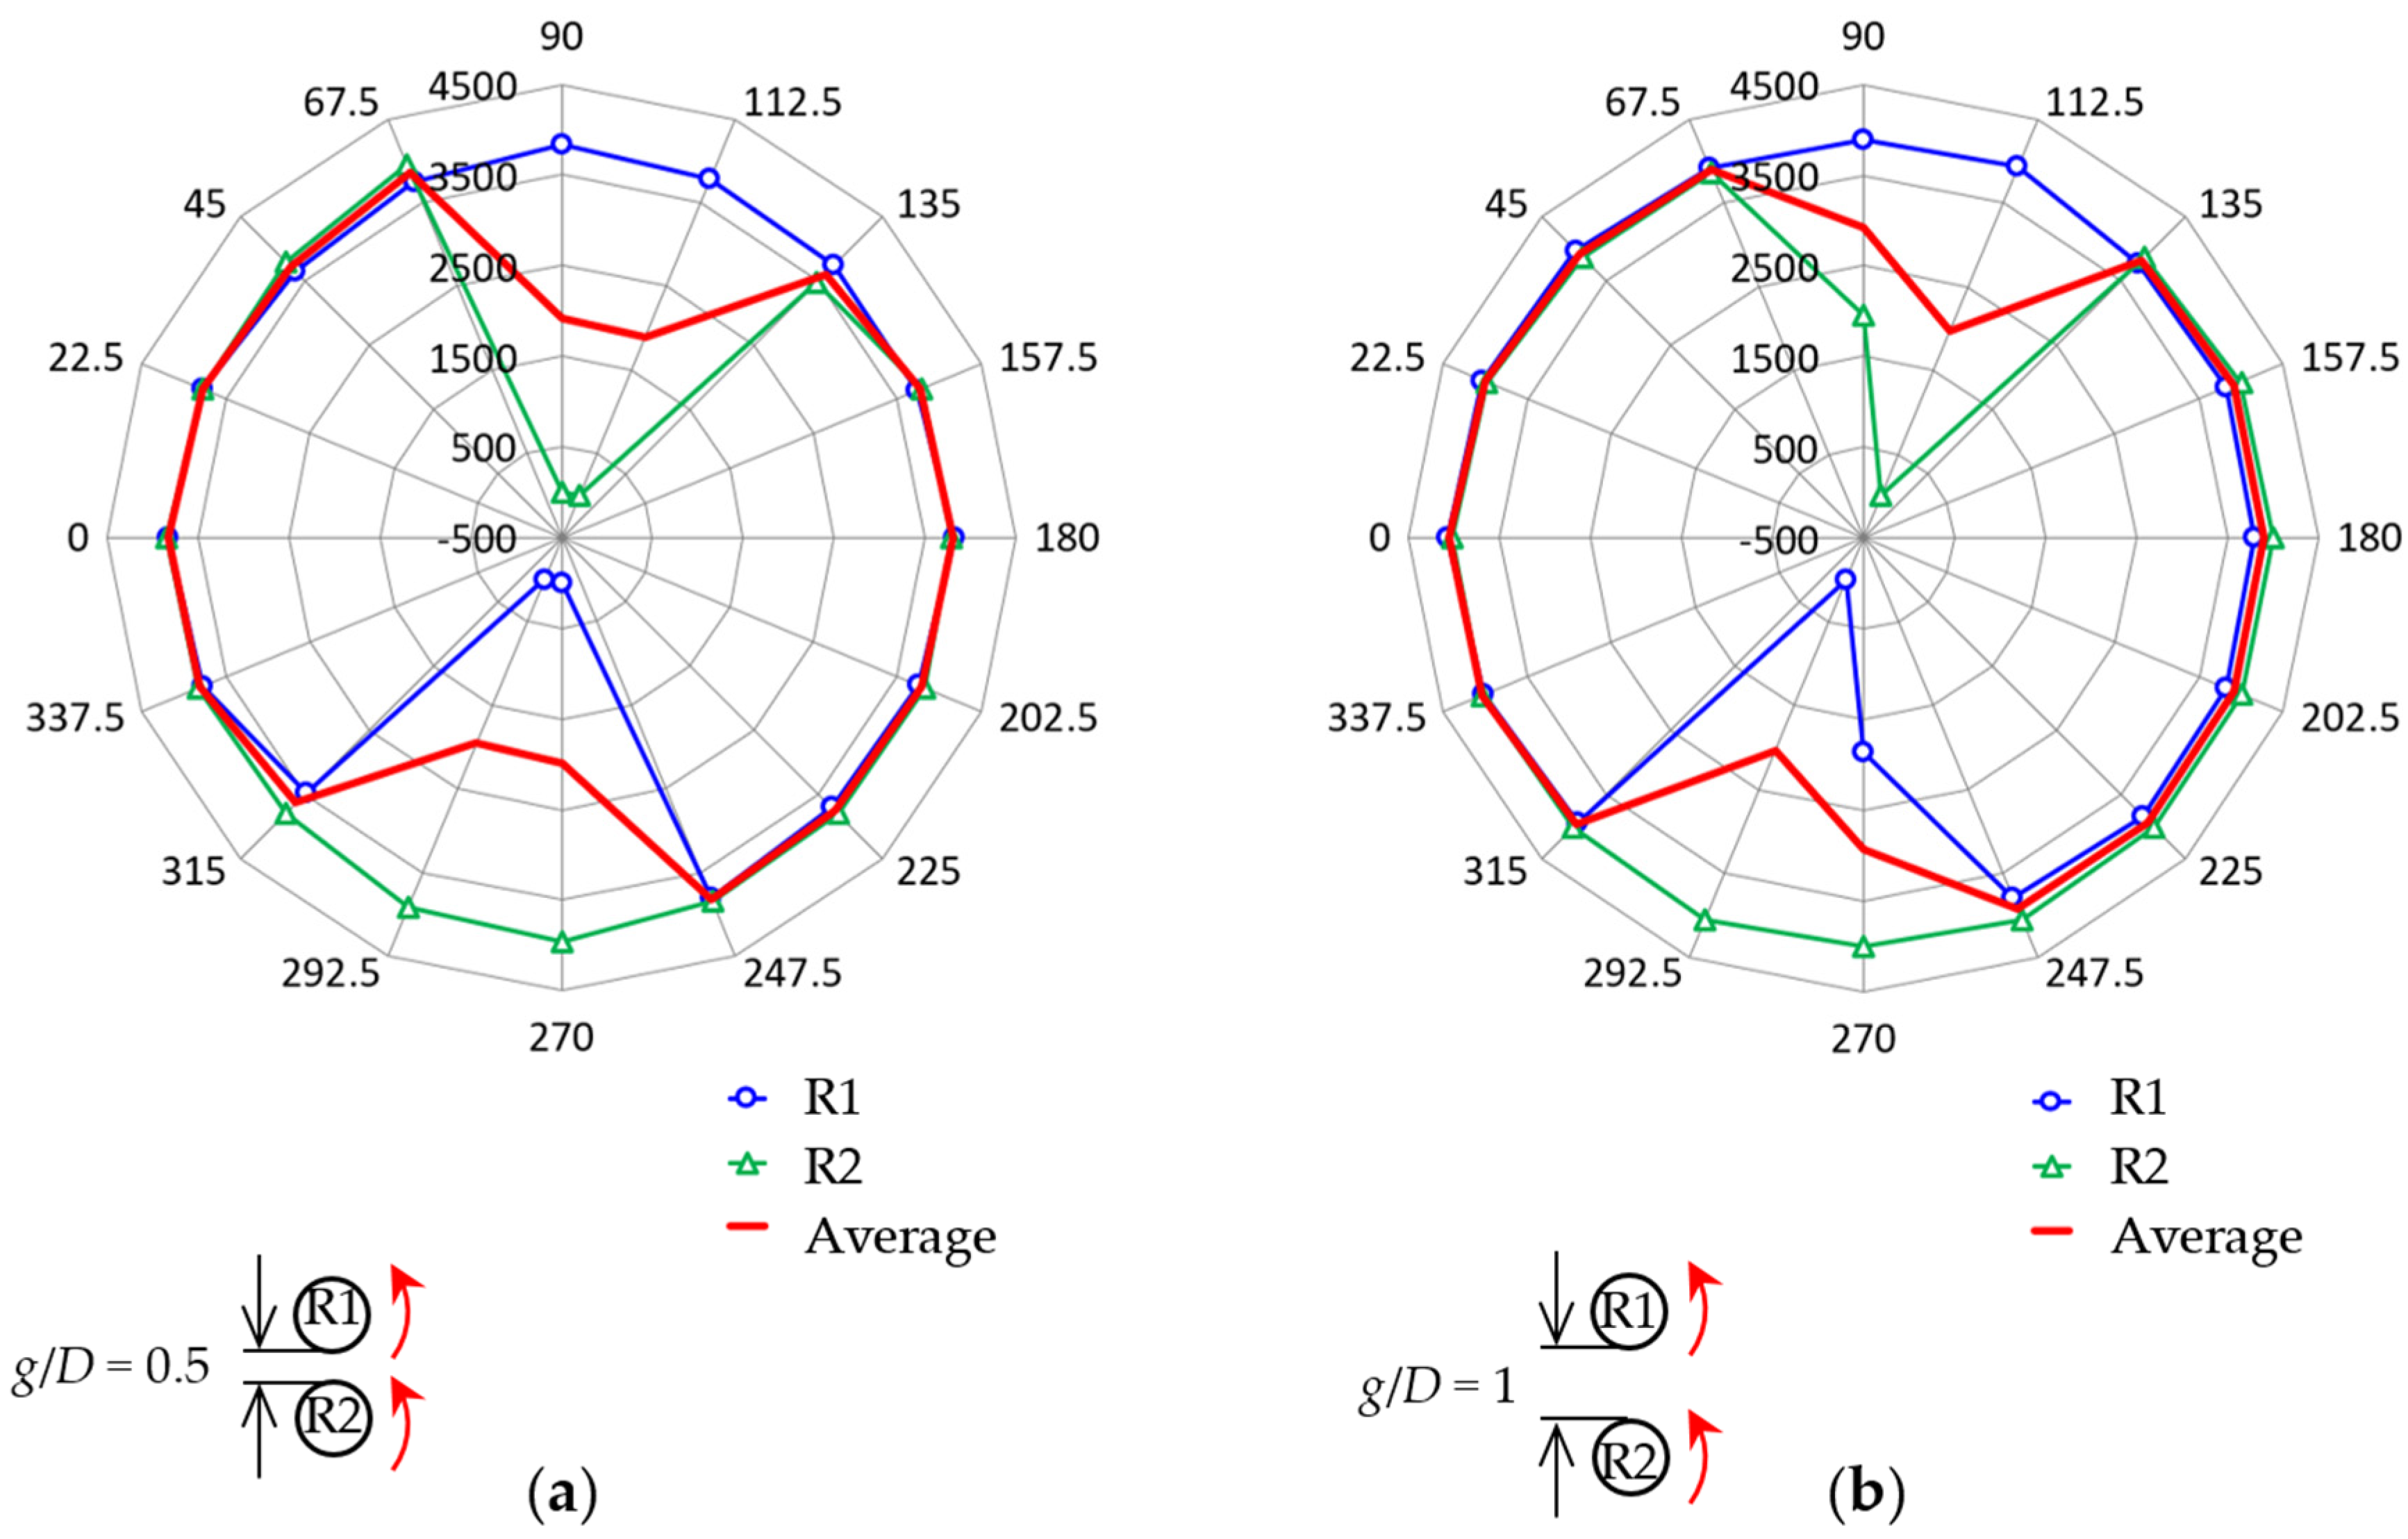
By referring to
Table 3, the value of
Nnorm, 12-wind increases with an increase in
g/
D. This gap dependence is emphasized by the plots in
Figure 18, in which
Nnorm,ave of the different rotor spacings are presented in one radar chart for 3CO and 3IR, respectively. In each figure, the blue circles indicate the average normalized rotational speed
Nnorm,ave at
g/
D = 0.5, the green triangles plot the
Nnorm,ave at
g/
D = 1, and the red squares show the
Nnorm,ave at
g/
D = 2.
In contrast, the performance indicated by 3
Nnorm, 12-wind/
Afoot in a unit footprint area shows the opposite tendency, i.e., the advantage of a smaller rotor spacing (see
Table 3). However, it is crucial to contemplate not only the performance (wind-direction dependence in
Nnorm, 12-wind or 3
Nnorm, 12-wind/
Afoot) of a trio of turbines, but also the velocity deficit of the wake flow.
This interference between a trio and the other trios is essential for future research on the design of an optimal layout of the three-turbine array or multi rotor systems with very many rotors (e.g., [
27]).
Now, we define another normalized rotational speed, Nnorm,bi-wind, in Equation (5). Here, Nnorm,ave, 0° and Nnorm,ave, 180° are average normalized rotational speeds of parallel-like layouts at θ = 0° and θ = 180°, respectively. Therefore, Nnorm,bi-wind indicates the performance of a trio of turbines in an isotropic bidirectional wind speed. An example of the bi-wind in nature is a daytime sea breeze or a nighttime land breeze.
Table 4 shows the values of
Nnorm,bi-wind for different gap ratios.
Table 4 also contains the values of 3
Nnorm,bi-wind/
Afoot, which indicates the advantage of a smaller rotor spacing. As shown in
Table 4, the 3IR configuration yielded a higher average rotational speed than the 3CO arrangement at any rotor spacing in the ideal bidirectional wind conditions. It is interesting that the change in wind from 12-wind-direction (
Table 3) to 2-wind-direction (
Table 4) acts negatively in the 3CO configuration but positively in the 3IR configuration, on VAWT performance.
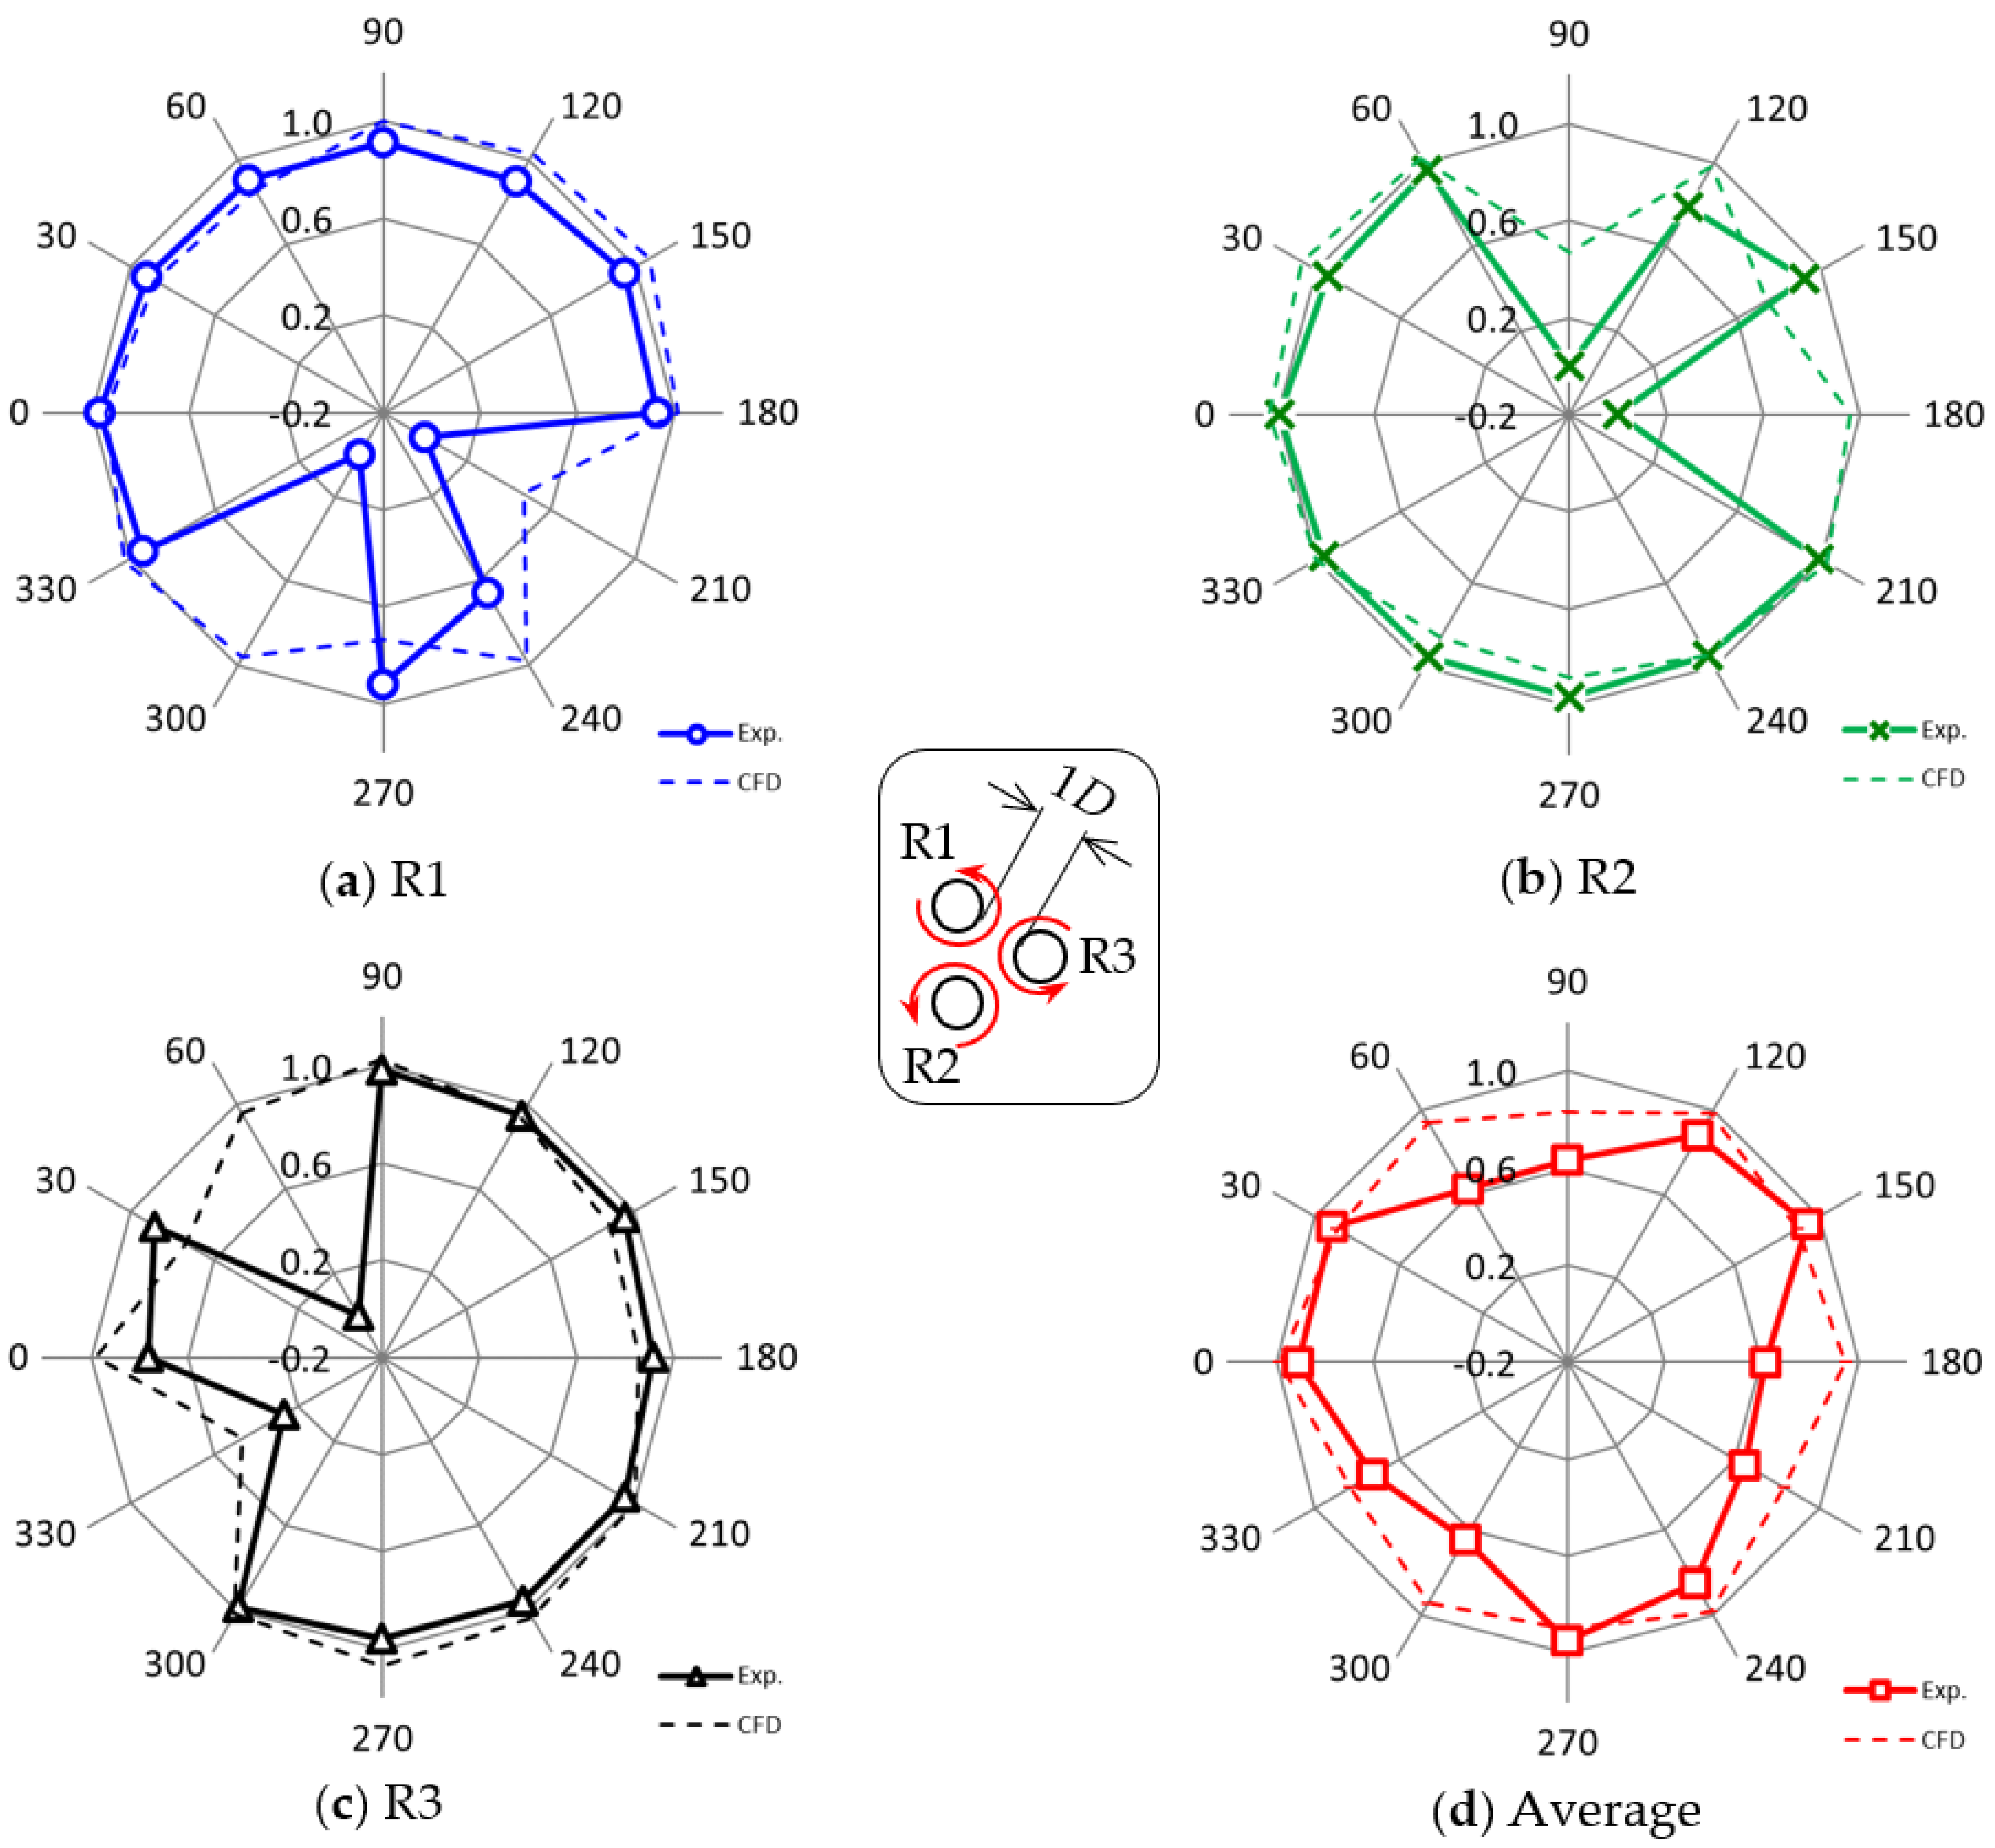
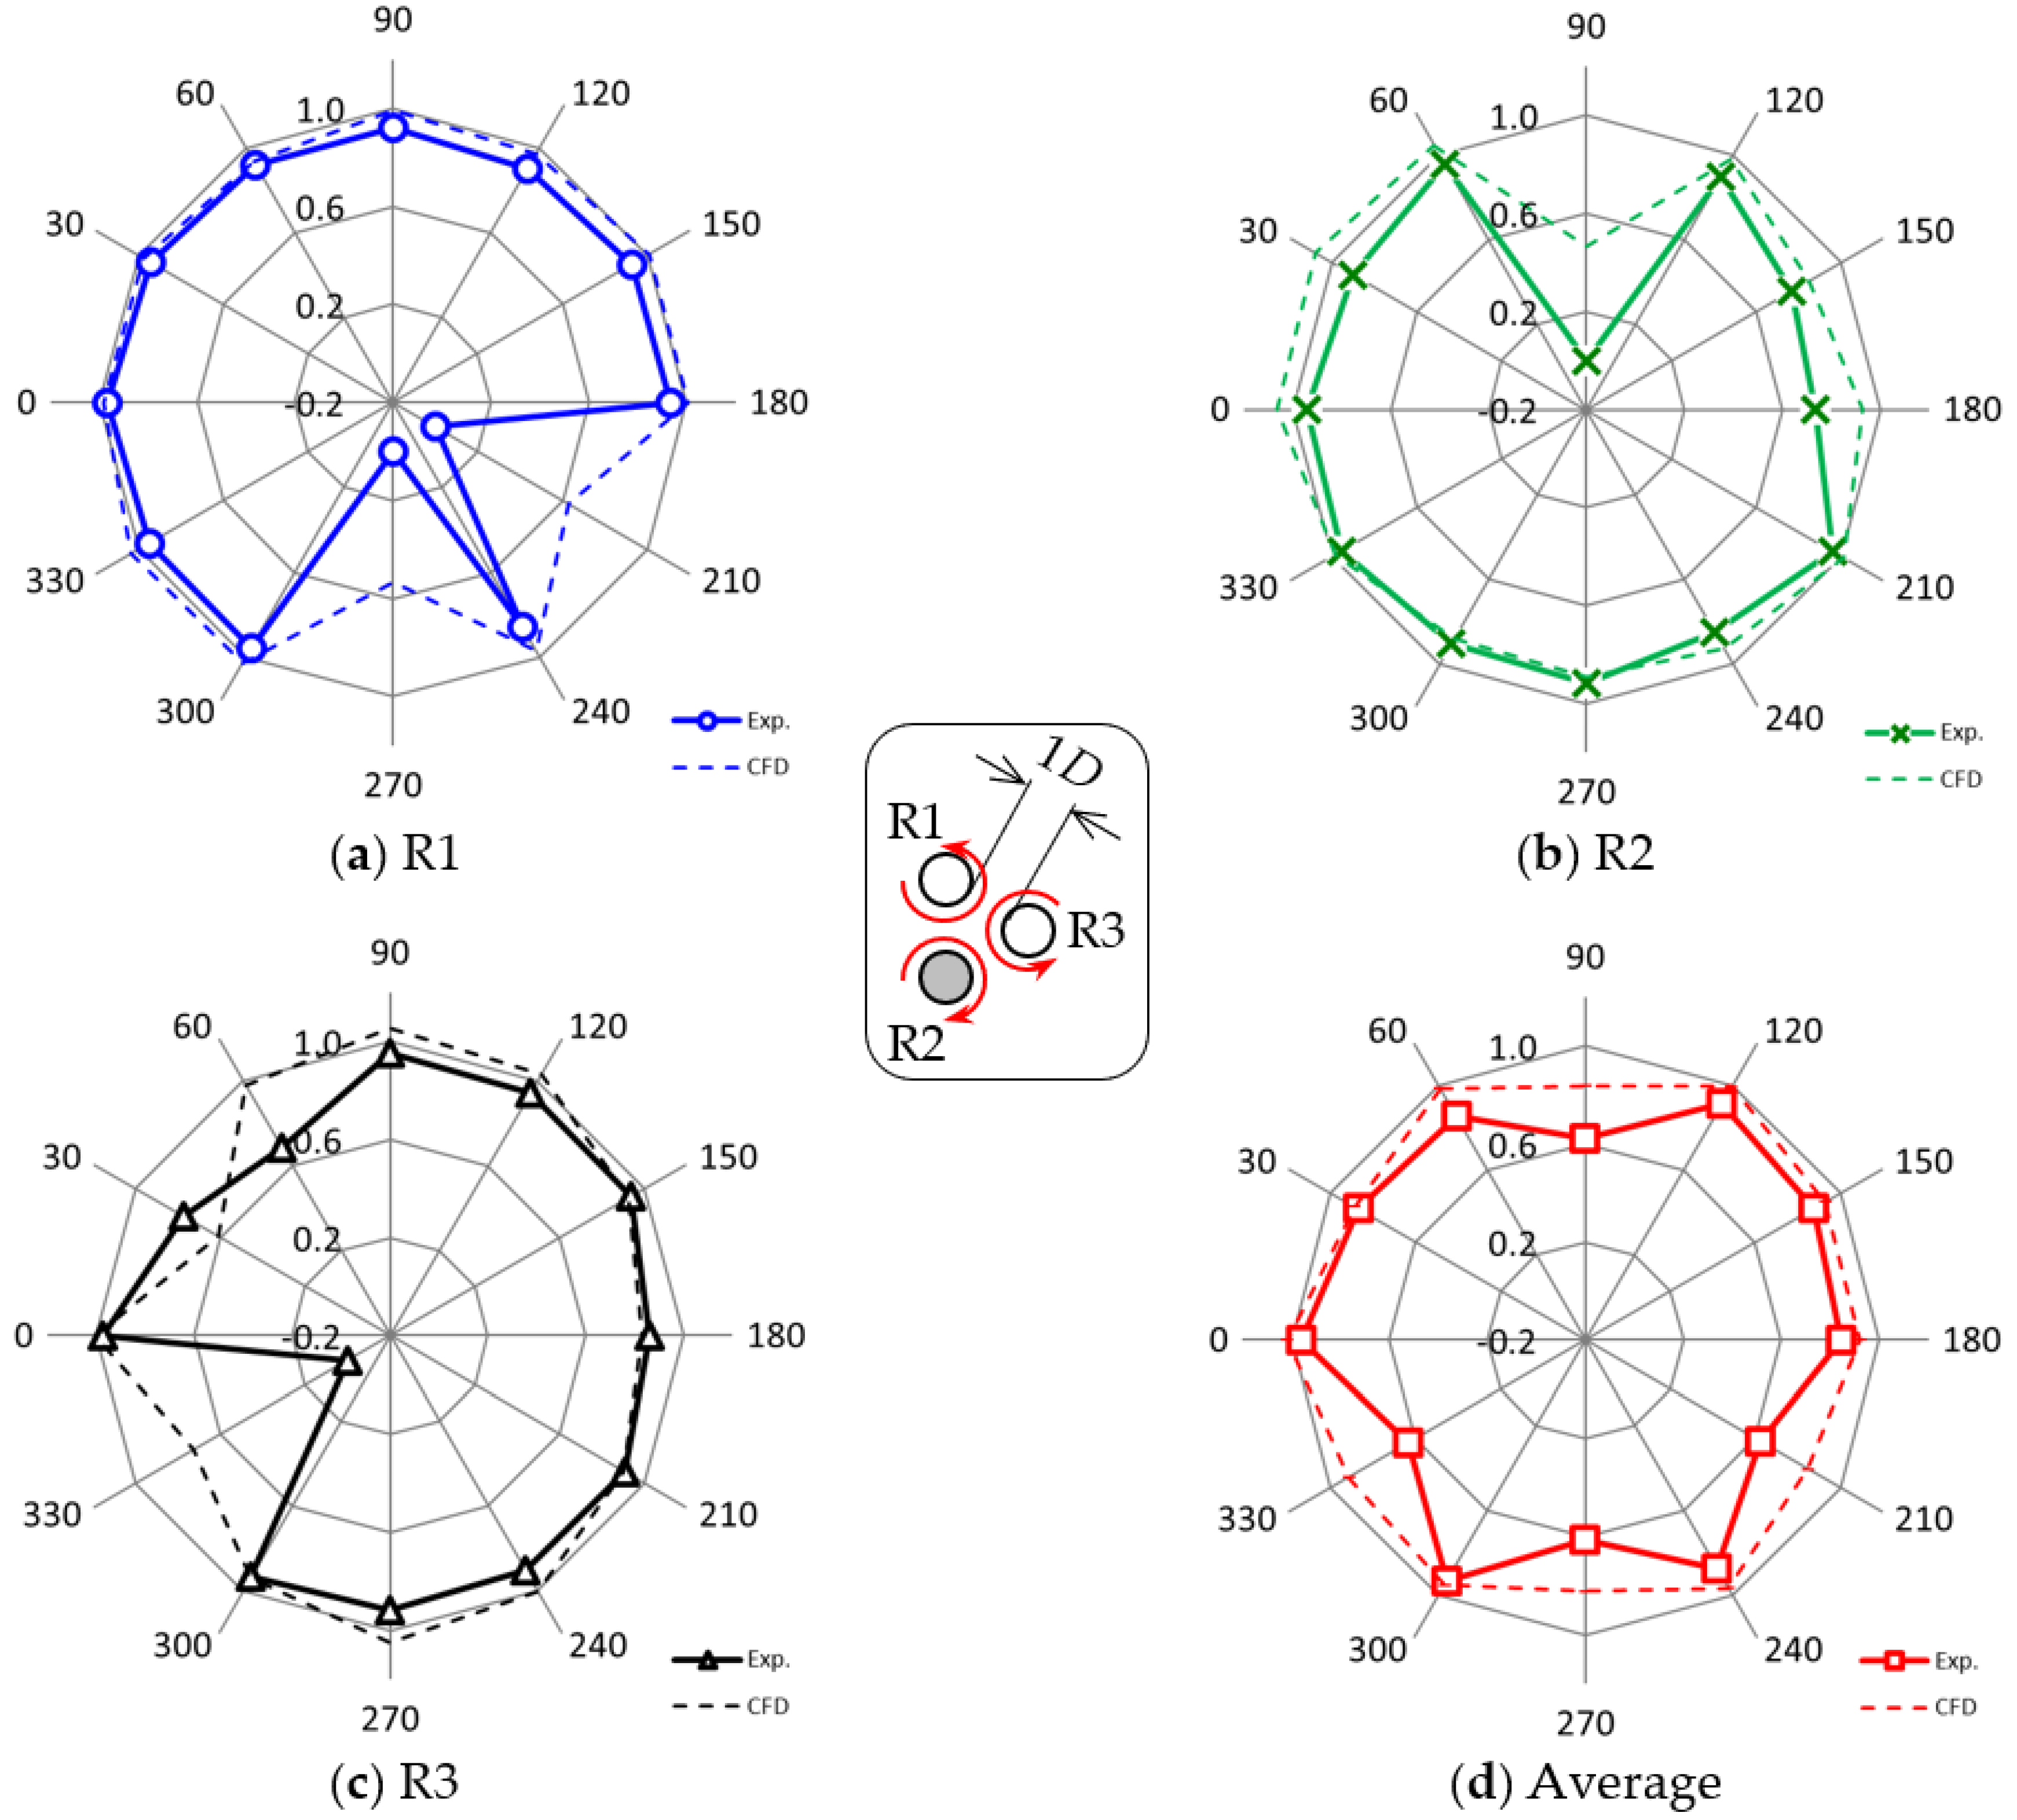
Figure 19 and
Figure 20 compare the experimental results with corresponding 2D CFD results with the DFBI method [
16] for the 3CO configuration and the 3IR configuration, respectively. As for the rotational direction and the gap length (
g/
D = 1), refer to the inset in
Figure 19 and
Figure 20. Broadly speaking, the speed-down tendencies of the downwind rotor are confirmed in both the experimental and the CFD results.
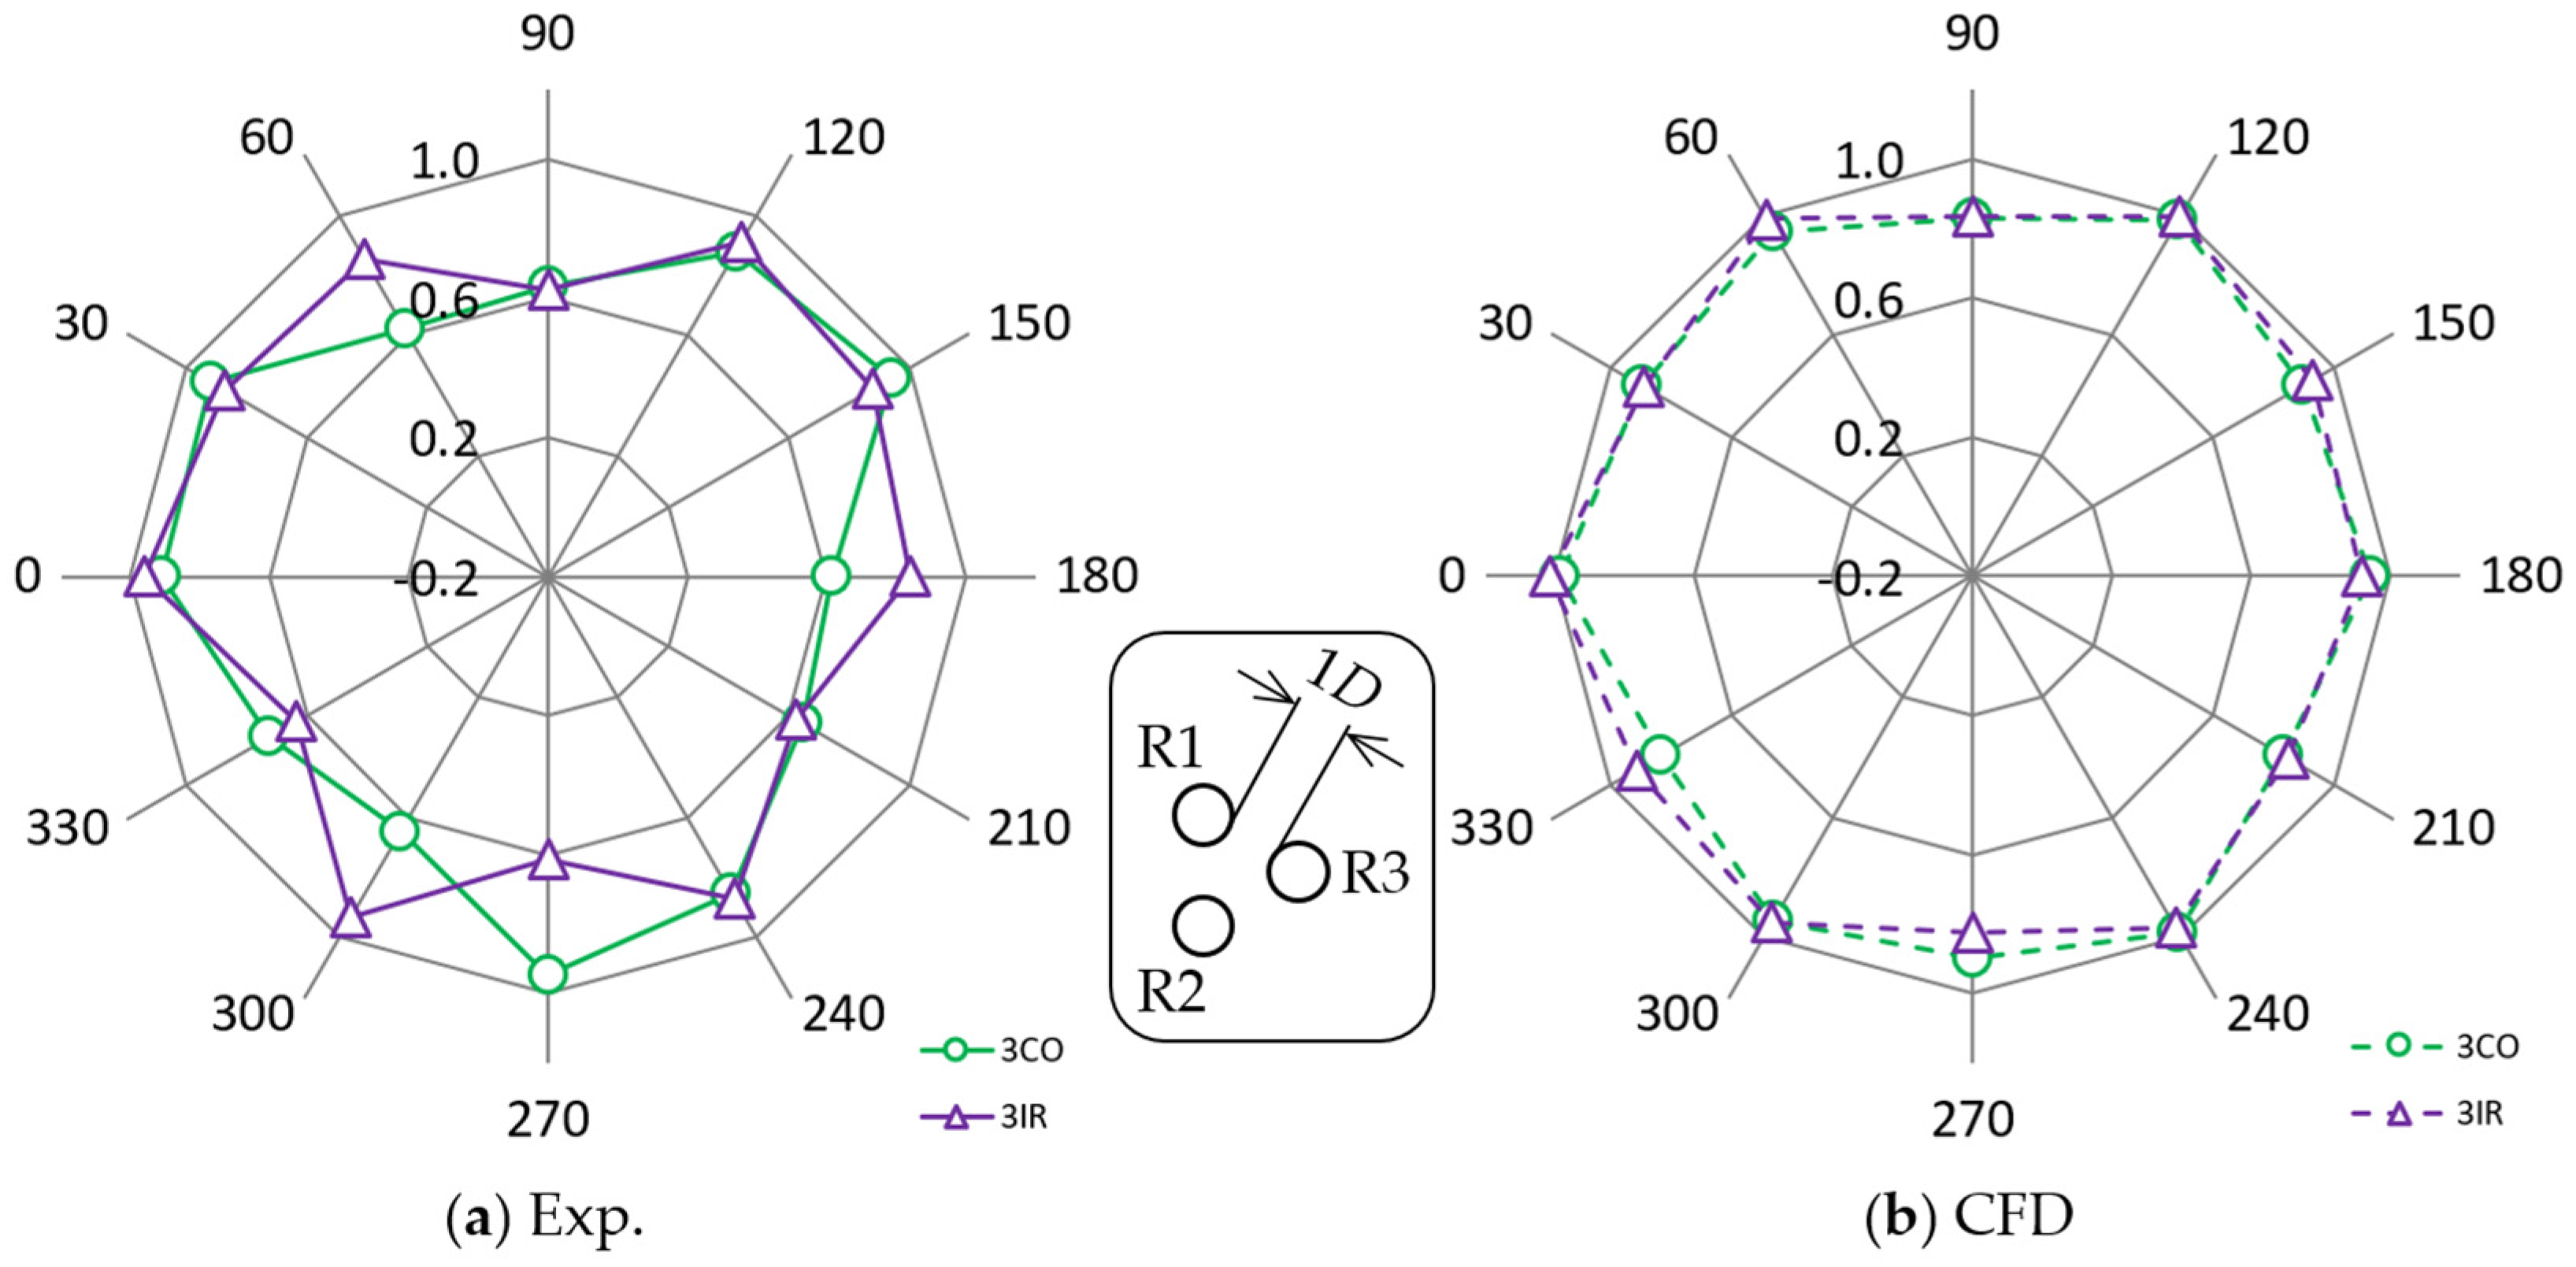
Next, we examine the difference between the 3CO and 3IR configurations.
Figure 21 plots average normalized rotational speed in a trio of VAWT models at
g/
D = 1. The green circle and the purple triangle indicate the 3CO and 3IR, respectively.
Figure 21a shows the experimental results with solid lines, while
Figure 21b presents the CFD results with broken lines. It is worth noting that
θ = 60° in 3IR (CDF) with a higher
Nnorm,ave value is an advantageous wind direction against
θ = 60° in the 3CO (3COF).
On the other hand,
θ = 270° in 3IR (TIRU-CU) with a lower
Nnorm,ave value is a disadvantageous wind direction against
θ = 270° in 3CO (TCOF). In total, the value of
Nnorm, 12-wind (the simple average of the
Nnorm,ave of the 12 wind directions) of 0.801 of the 3IR is 3% larger than 0.778 of the 3CO (see
Table 3).
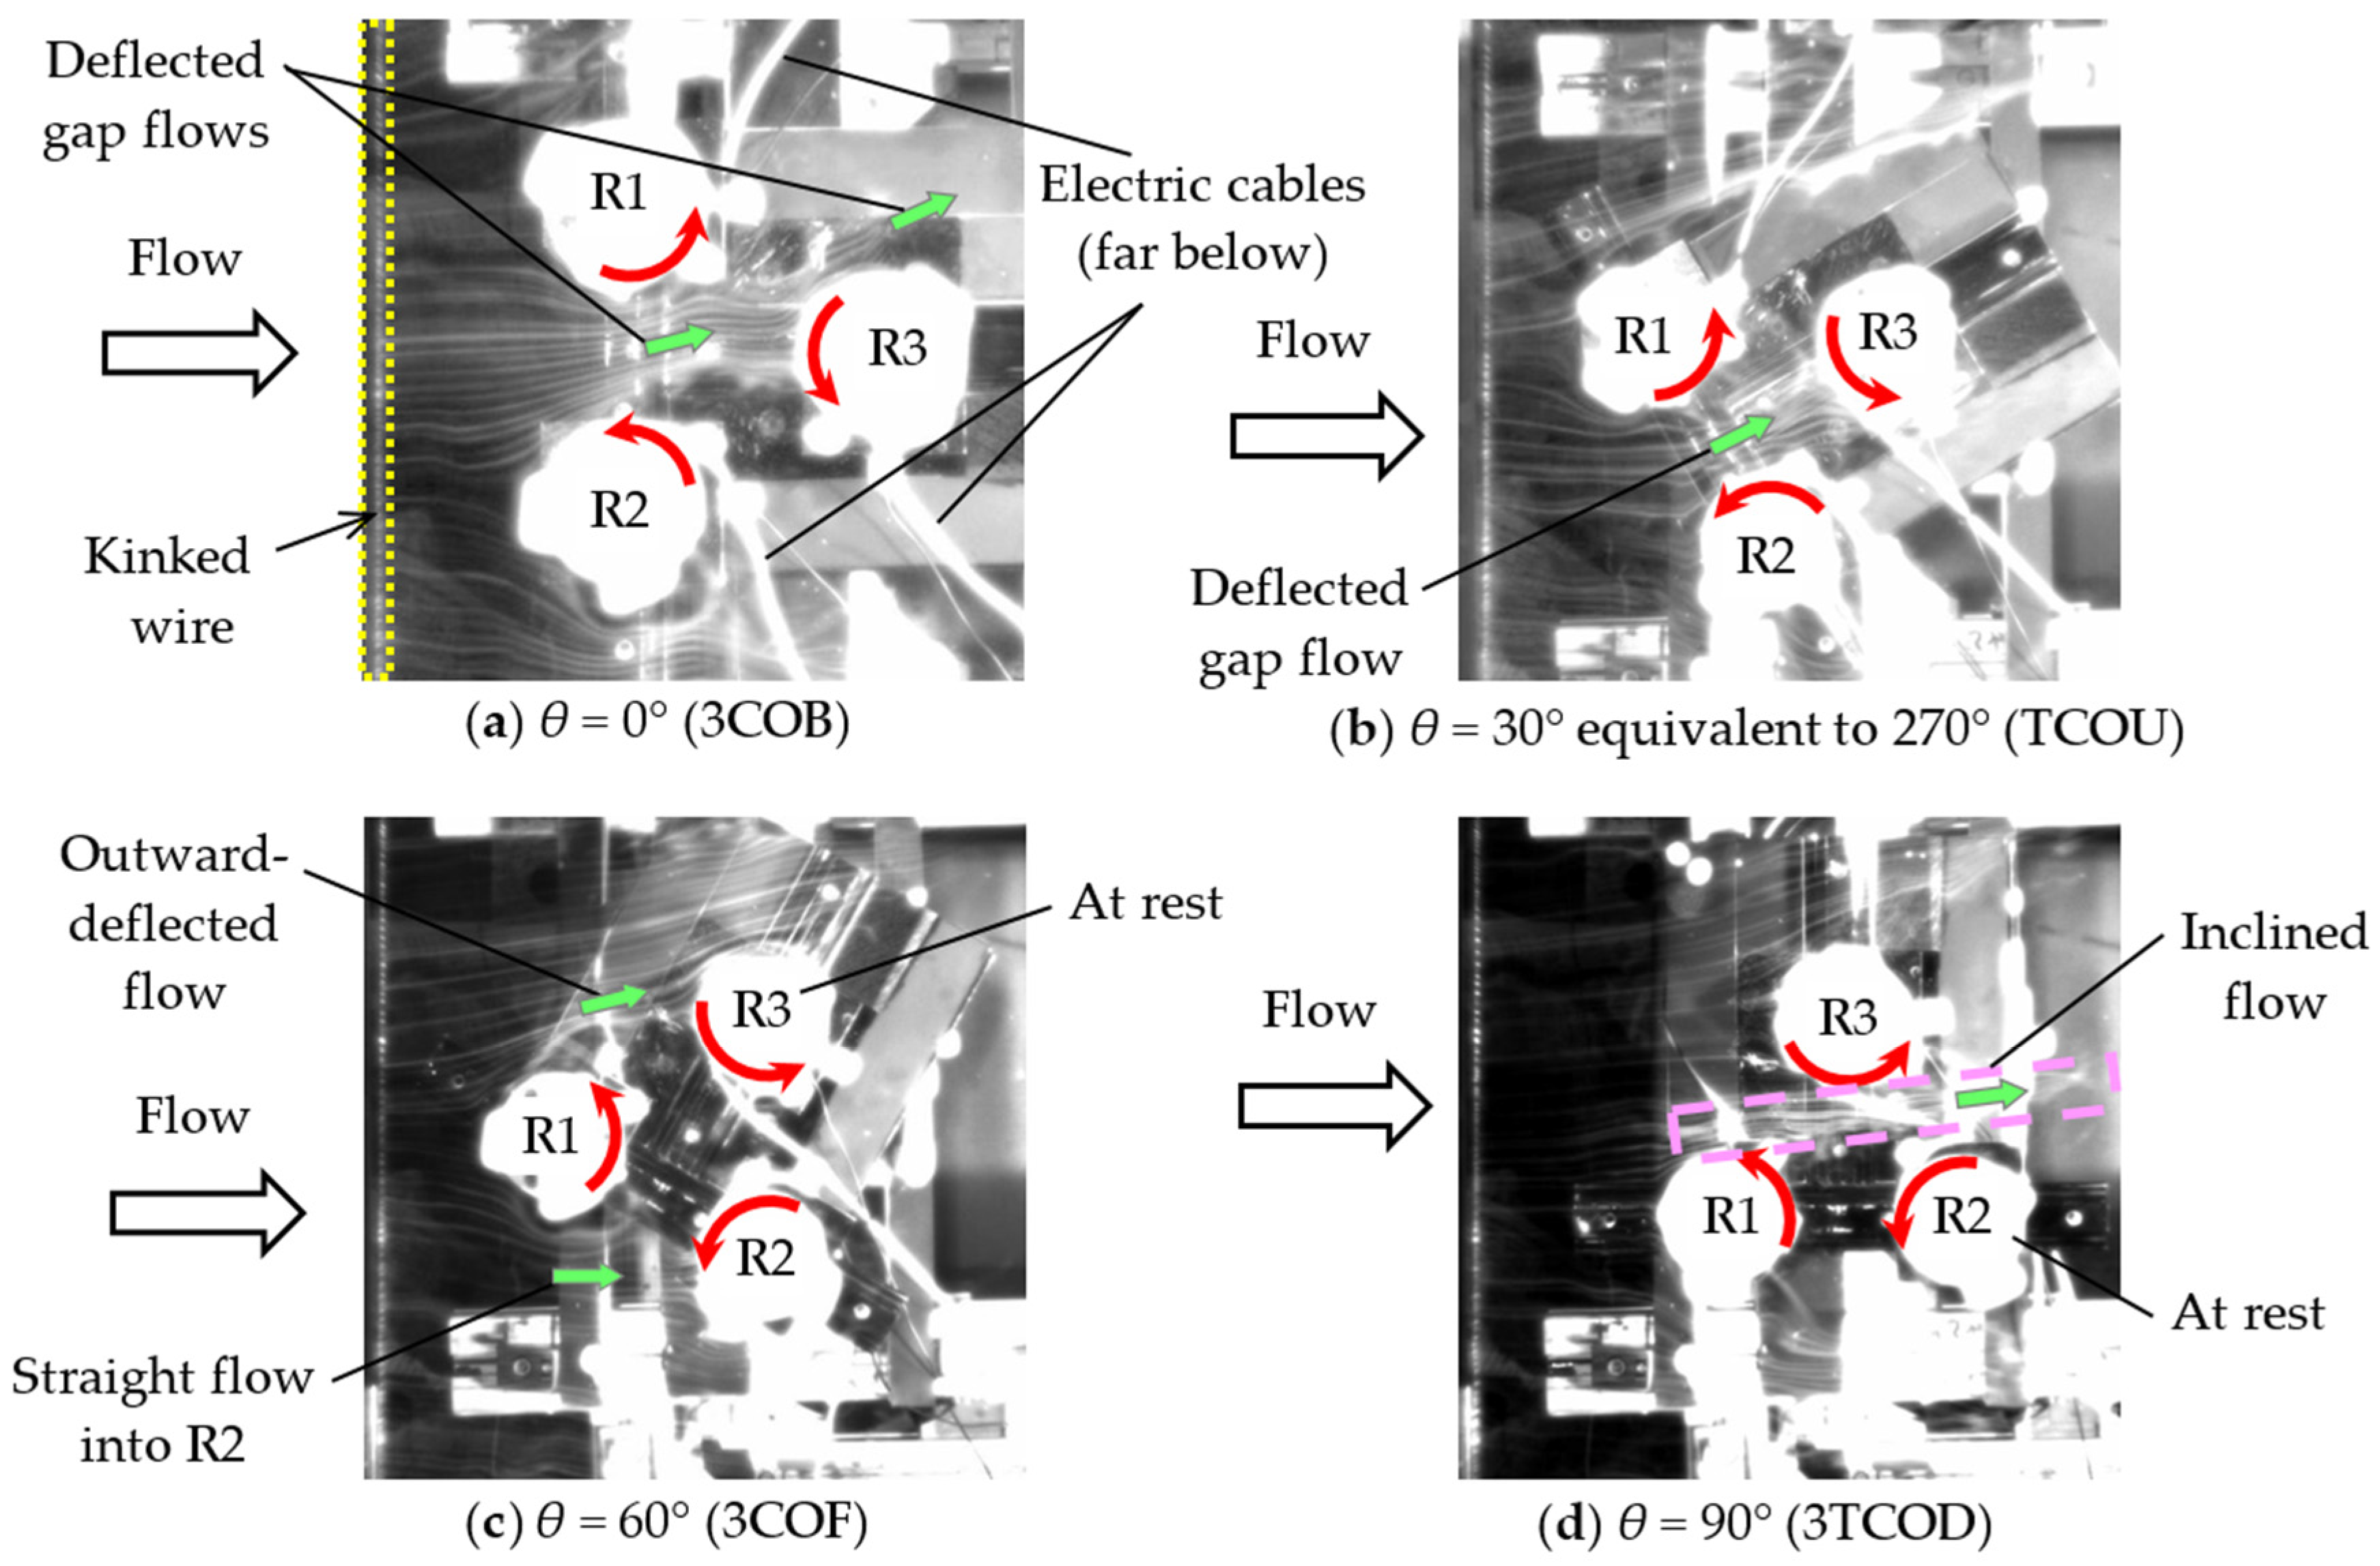
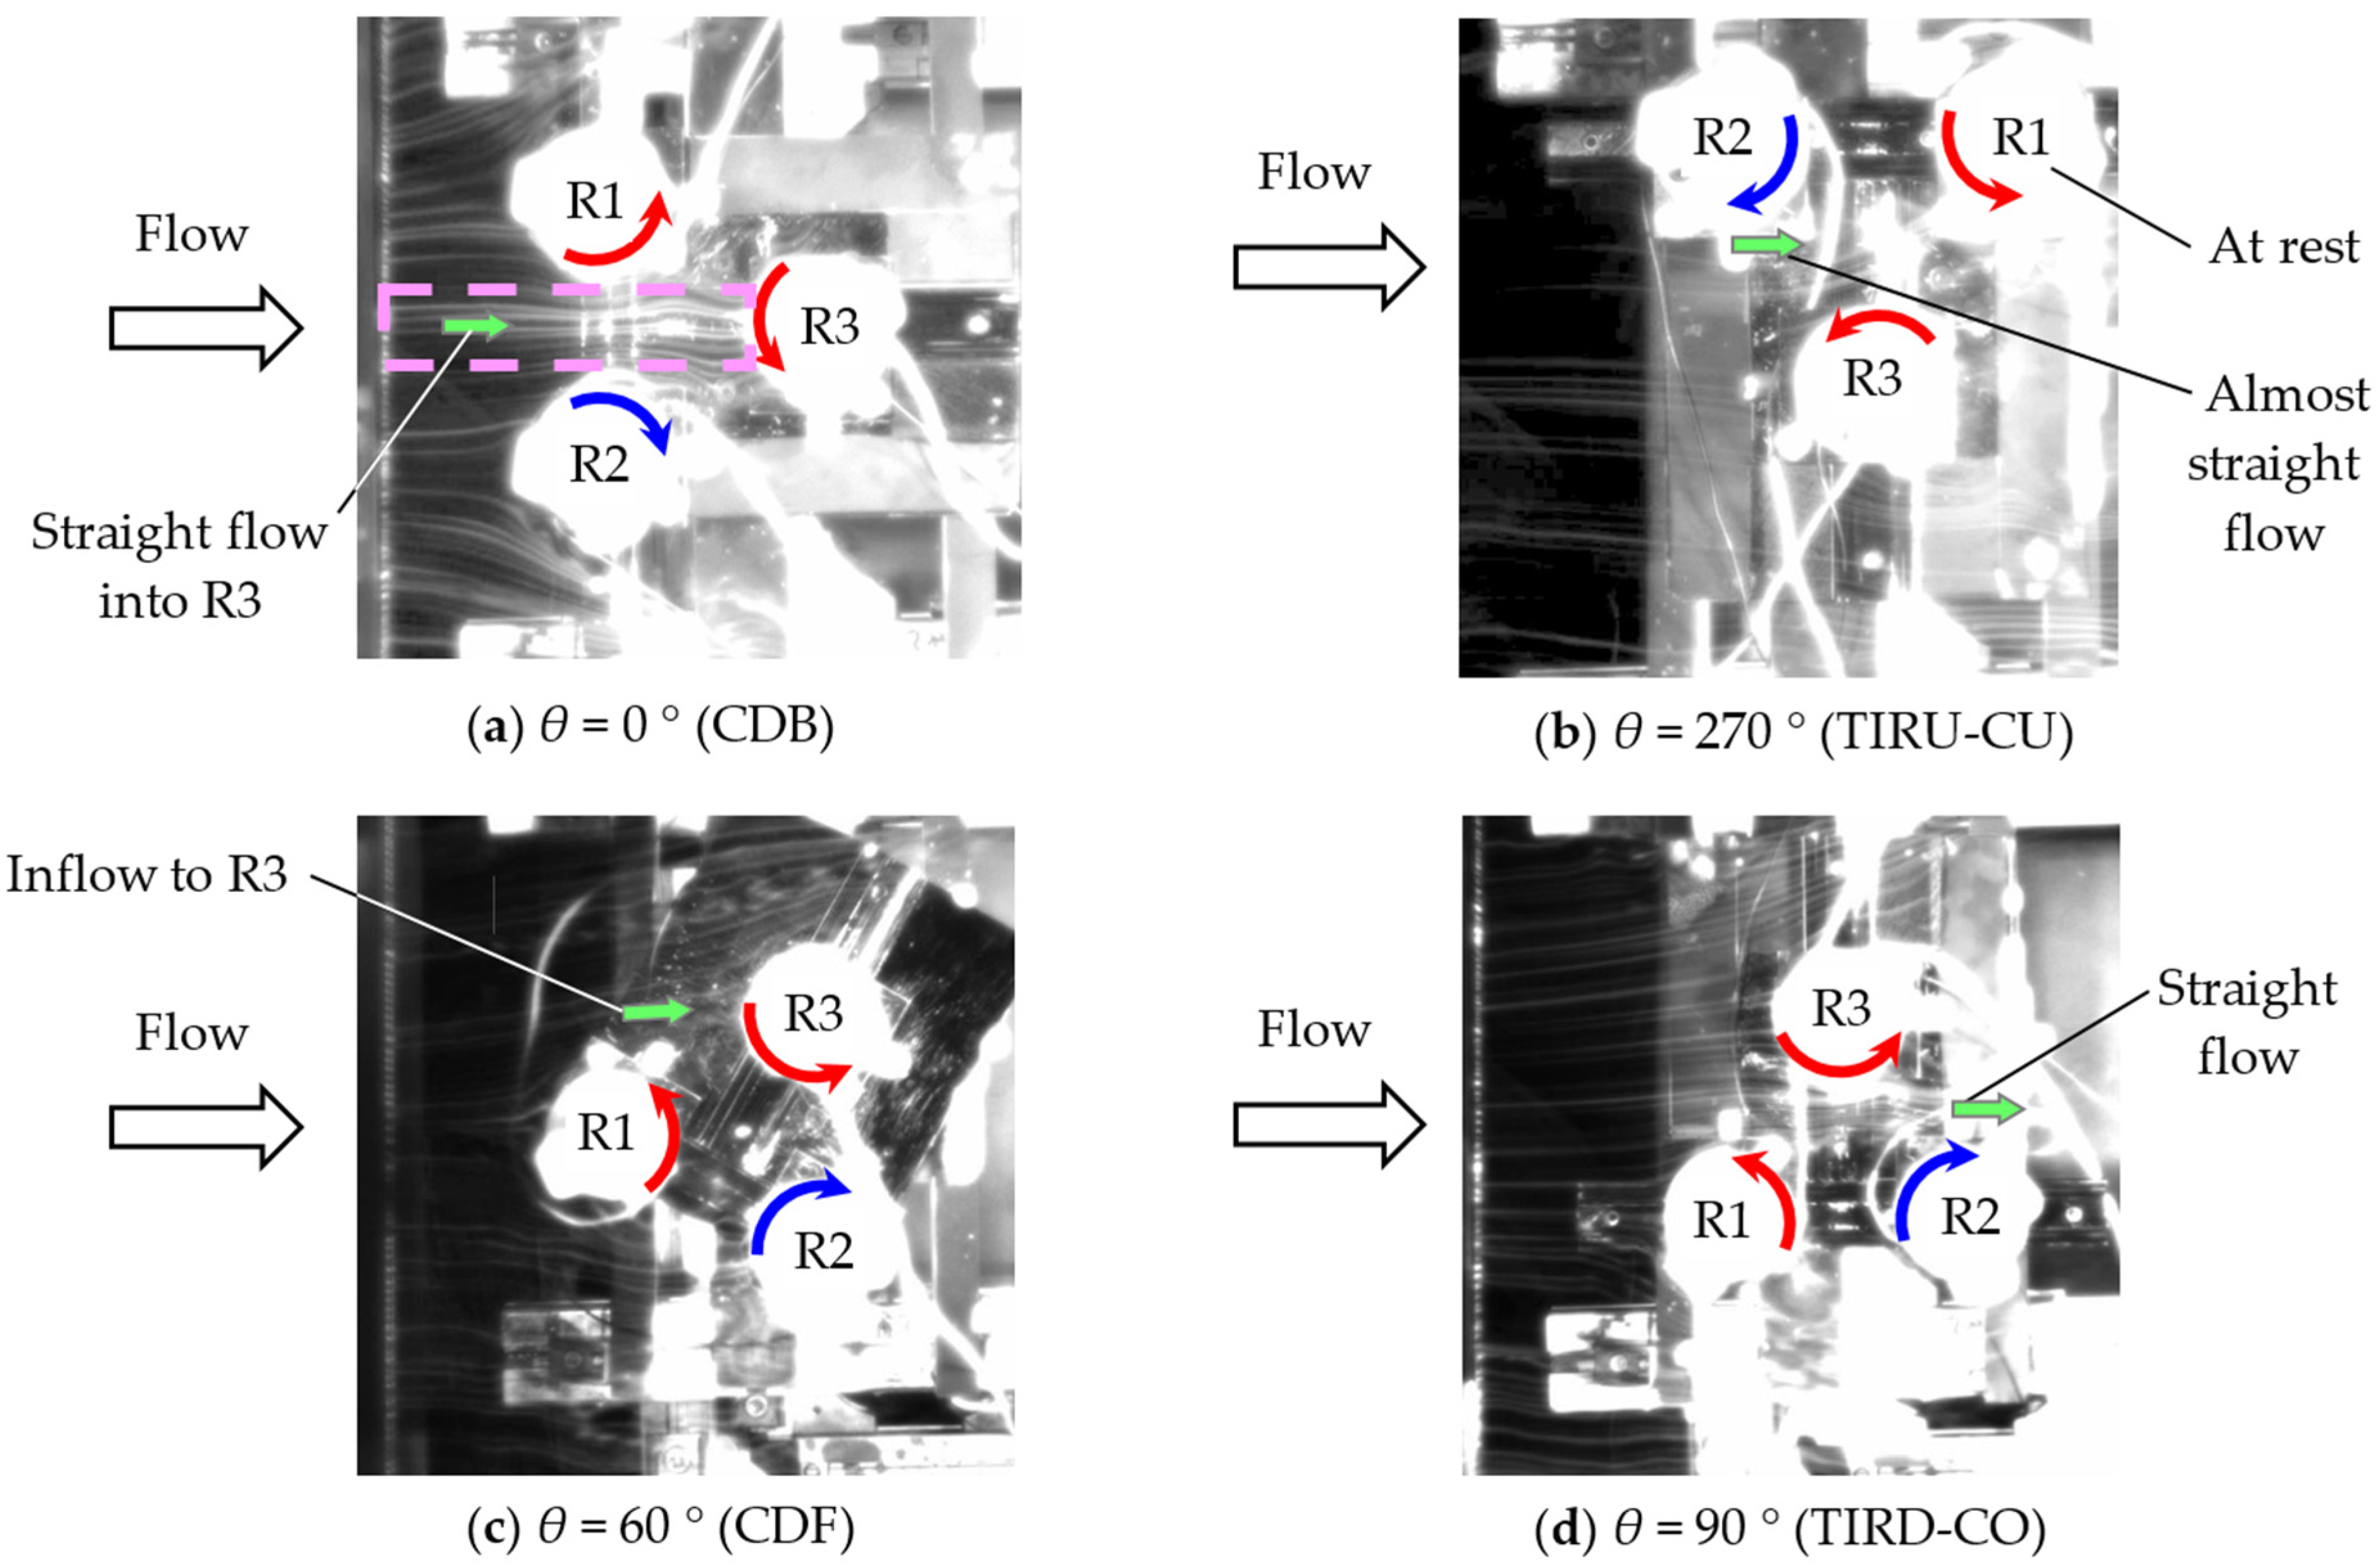
Figure 22 and
Figure 23 show the streak lines observed using a smoke-wire method in the cases of the 3CO configuration and 3IR configuration, respectively. A stainless-steel wire, which is enclosed in the yellow dotted frame in
Figure 22a, was horizontally set 2.7
D upstream of the center of a trio of rotors. The apparatus is the same as that used in [
20]. The critical parameter in the visualization of the flow is the rotational speed
N of each rotor in order to maintain the tip speed ratio
λ =
πDN/(60
V). Since the ratio of a uniform velocity in visualization to rotational speed measurements at 12 m/s is 1/6, each rotor speed is precisely adjusted one-sixth of the rotational speed presented in
Figure 17 by using a variable external resistance. Electric cables located far below the trio of turbines are also seen in the visualization, as shown in
Figure 22a.
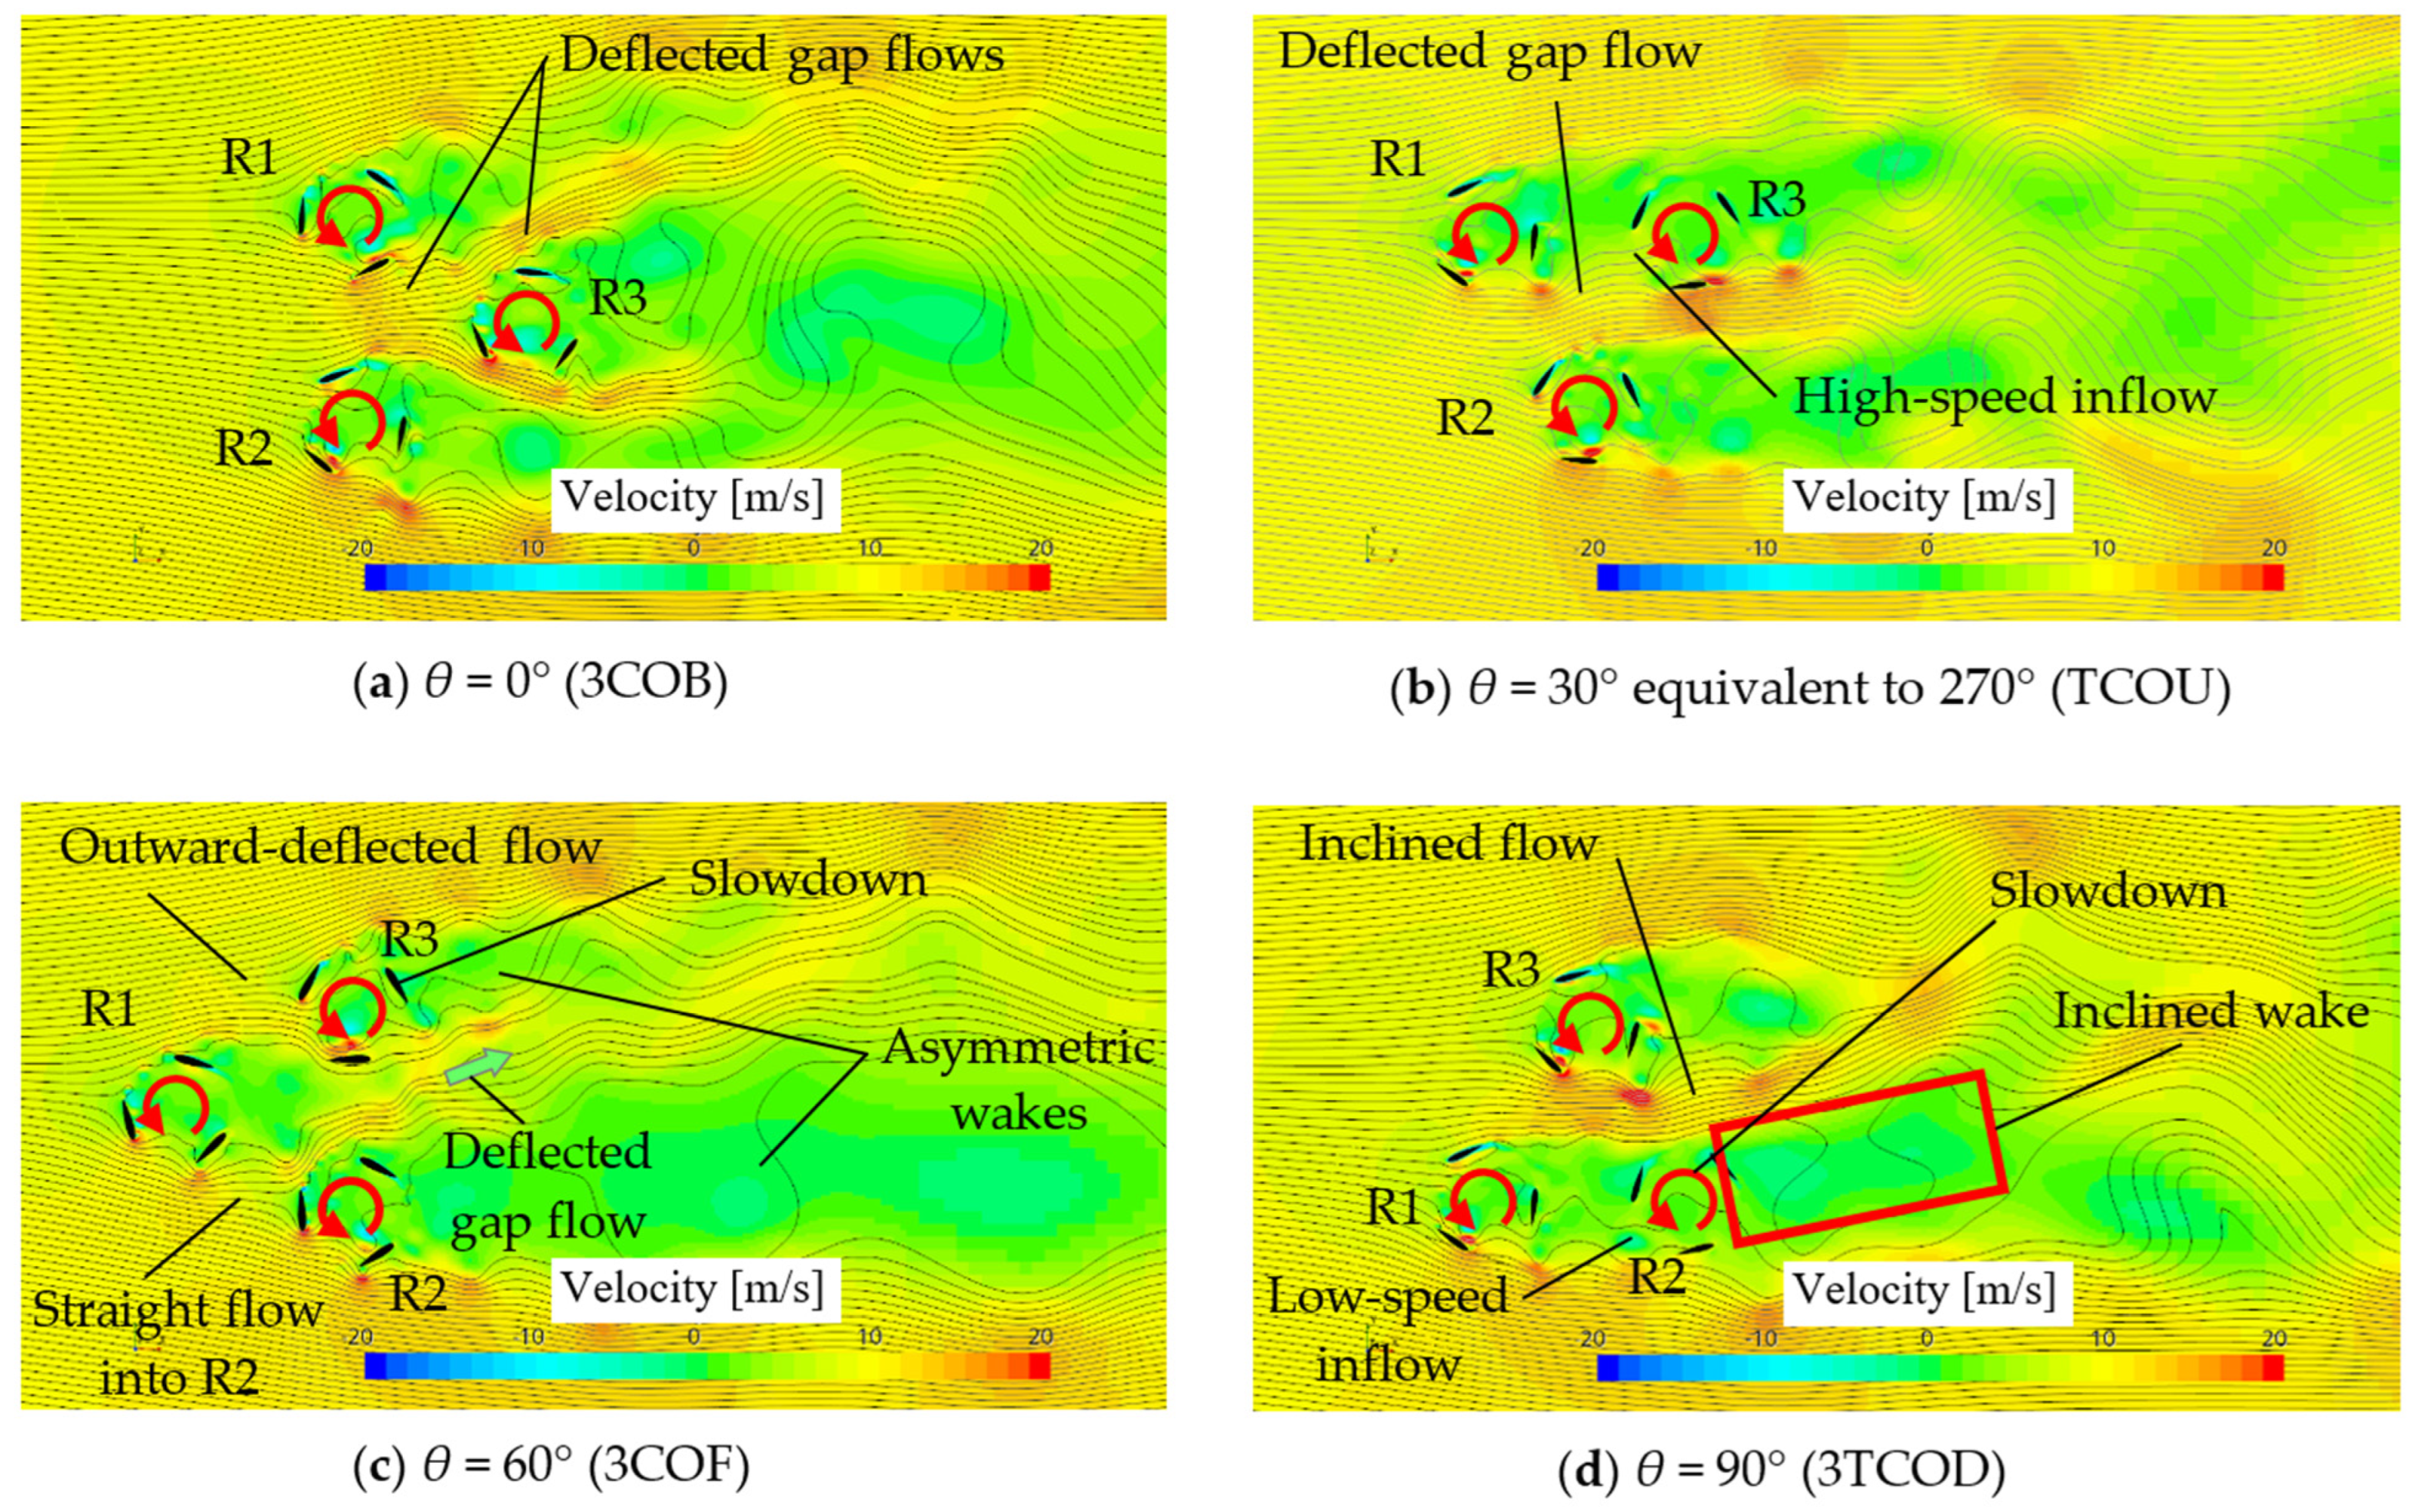
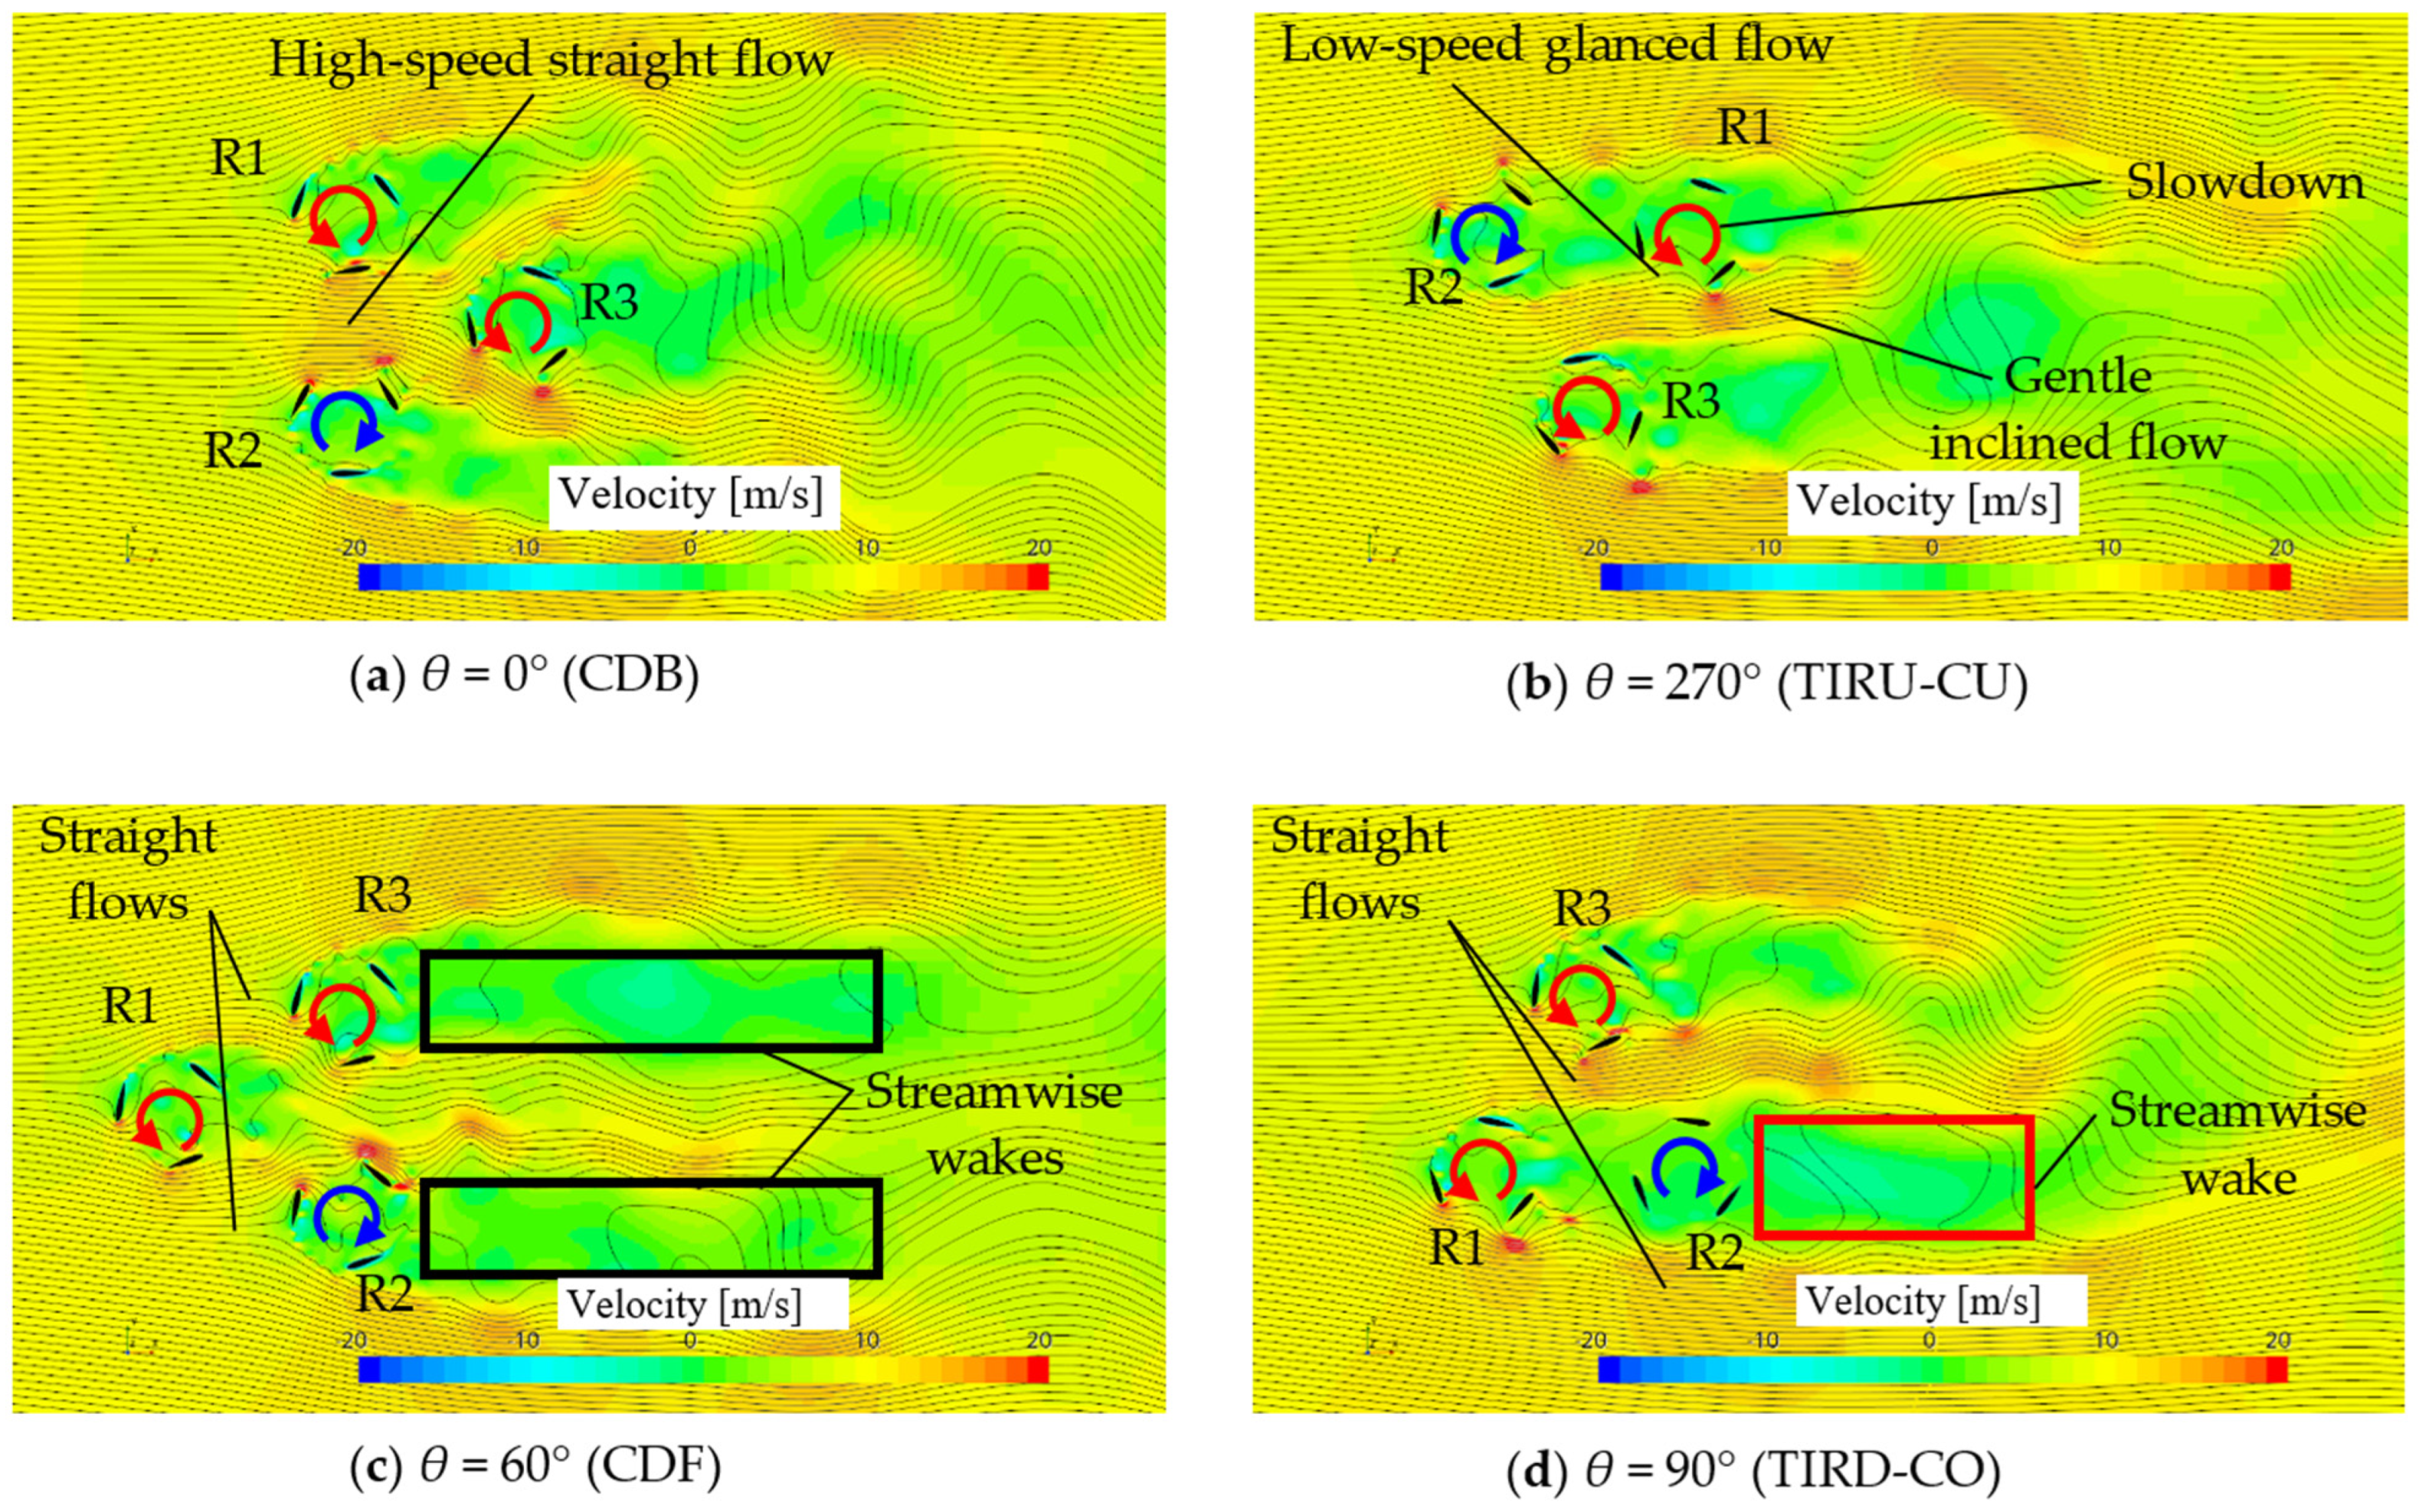
Figure 24 and
Figure 25 present the distributions of the streamwise component of flow velocity conducted by the corresponding 2D CFD with the DFBI method [
16] in the cases of the 3CO and 3IR configurations, respectively. The color in
Figure 24 and
Figure 25 indicates the magnitude of the velocity.
First, we explore the flow patterns in the 3CO configuration in
Figure 22. At wind direction
θ = 0°, called 3COB (see
Figure 22a), the distances of the adjacent streak lines contract between the upwind rotors (R1 and R2), which implies the flow acceleration between R1 and R2. This is also confirmed in the CFD results in
Figure 24a. Subsequently, the accelerated gap flow deflects toward the R1 side (upper-side) and flows partially into the downwind rotor (R3).
At wind direction
θ = 30°, called TCOU, in which all rotors rotate relatively fast, the accelerated flow between R1 and R2 deflects toward the center of R3 in
Figure 22b (see the relatively high-speed inflow shown in yellow just in front of R3 in
Figure 24b).
At
θ = 60°, called 3COF, the outward-deflected flow in front of R3 glanced off the outer edge (upper-side) of R3, as shown in
Figure 22c and
Figure 24c. Furthermore, the flow in front of R3 receives a negative effect from R2-driven induced velocity. This outward deflection is caused by R1- and R2-driven induced velocities, resulting in deceleration in front of R3. On the other hand, R1- and R3-driven induced velocities have an accelerating effect on the flow in front of R2. These results imply that much momentum flows into R2; subsequently, asymmetric wakes (accompanied by deflected gap flow between them) are generated behind R2 and R3, as shown in
Figure 24c. These are the reasons for the stoppage of R3 (black triangle in
Figure 17c).
The deflected gap flow from R2 to R3 can also be seen in a 3CO-like layout (not in an equilateral triangle) using three Savonius turbines conducted by Shaheen et al. [
28] (see their Figure 19).
Similarly, at
θ = 90°, called 3TCOD, the downwind rotor R2 stops, indicated by the green cross in
Figure 17c (a remarkable decrease in the speed in CFD in
Figure 19b), since the flow between R2 and R3 diverges toward the opposite side (upper-side) of R2 enclosed by the lavender broken frame in
Figure 22d. This can be seen in the inclined high-speed zone shown in the red contour in the CFD results in
Figure 24d. Note that the low-speed inflow shown in green just in front of R2 in
Figure 24d contrasts to the high-speed inflow in front of R3 seen in
Figure 24b. Furthermore, the remarkably inclined wake zone enclosed by a red solid frame behind R2 is also contrastive to the straight wake zone, which is investigated later in
Figure 25d in the opposite rotational direction of R2.
The above-mentioned flow deflection occurs through the combinational results of the Magnus effect and induced-velocity effect, originating from the three rotating turbines. Regarding the two parallel-like layouts in the 3CO configuration, the average rotational speed performance in the 3COB layout (θ = 0°) is greater than that in the 3COF layout (θ = 60°). Regarding the two tandem-like layouts in the 3CO configuration, the TCOU layout (θ = 30°) shows better performance compared with that in the 3TCOD layout (θ = 90°). These two relationships are common results obtained by the experiments and the CFD.
The former relationship (3COB > 3COF) is also confirmed in the normalized overall power coefficient by Zanforlin [
22] for
gap/
D = 2 (see her Figure 10b), by Shaheen et al. [
28] (see their Figures 22 (3COF-like layout) and 26 (3COB-like layout)), and by Silva and Danao [
29] for
gap/
D = 1 (see their Table 6), with all based on 2D CFD.
Regarding the order of rotational speed
Nnorm, ave at
θ = 60° in the 3CO configuration (i.e., 3COF), R2 rotates at the fastest speed for the
gap/
D = 0.5 and 1. This is the same result in three Savonius turbines in a 3COF-like layout independent of rotor gap ratio conducted by Shaheen et al. [
27] (see their Figure 21) and on three Darrieus turbines in a 3COF layout by Silva and Danao [
28] for
gap/
D = 1.
Next, we examine the flow patterns in the 3IR configuration in
Figure 23. At wind direction
θ = 0°, called CDB (see
Figure 23a), the contracted streak lines between the upwind rotors (R1 and R2) directly flow into the downwind rotor (R3). The large high-speed zone surrounded by the three rotors is seen in the CFD results in
Figure 25a. Therefore, the value of
Nnorm,ave in this layout takes the maximum value of 0.9618 among the whole 16 independent layouts (see
Table 2). This value is 106% of 0.9087 obtained in the case of 3COB (
θ = 0° in the 3CO layout). The corresponding 2D CFD shows 103% in this comparison (CDB to 3COB).
The order of rotational speed
Nnorm, ave at
θ = 0° in the 3IR configuration (i.e., CDB) is R1 > Ave. > R2/R3, as seen in
Figure 17d or
Figure 17f for
gap/
D = 1 or 2. This agrees with the order of the power coefficient for CDB obtained by Zheng et al. [
23] (see their Figure 19) based on 2D CFD.
At wind direction
θ = 60°, called CDF, although the induced velocity of the upwind rotor (R1) causes negative effects on the flow before the downwind rotor (R3), the opposite rotation of R2 produces positive effects on the flow in front of R3. The wakes behind R2 and R3 show a relatively symmetric straight flow pattern enclosed by black solid frames in
Figure 25c.
This indicates that the upper-side flow of R1 gives its streamwise momentum relatively directly into R3. This flow pattern is clearly different from that in the largely outward-deflected wake flow in the 3CO configuration at the same wind direction of
θ = 60° (3COF). Hence, R3 continues to rotate in the case of CDF, which is in contrast to the result (R3 stopped) in the case of 3COF. This leads to a significant advantage in the
Nnorm,ave at the CDF layout (
θ = 60° in the 3IR configuration) over
Nnorm,ave at 3COF, as seen in
Figure 21 (indicated by CDF > 3COF).
At
θ = 90°, called TIRD-CO, both flows of the upper and lower sides of R2 straightly move downstream, generating the above-mentioned streamwise wake zone behind R2 (
Figure 25d).
At
θ = 270°, called TIRU-CU (see
Figure 23b), since the gap flow between R2 and R3 is almost straight in contrast to the largely deflected flow in
Figure 22b, the gap flow in the TIRU-CU layout does not flow fully into the downwind rotor R1 but glances off the inner edge (lower-side) of R1.
Consequently, R1 stops to rotate in the experiment, or R1 takes the minimum
Nnorm,ave value in the CFD (see
Figure 20a). Remember that the TCOU layout in
Figure 22b for
θ = 30° is equivalent to that in
θ = 150° and 270° only for the 3CO configuration, as explained in
Table 2. There is a remarkable difference in
Nnorm,ave between the TIRU-CU layout and the TCOU layout in the same wind direction (see
Figure 21).
Finally, it is interesting to note that among the six parallel-like layouts (
θ = 0°, 60°, 120°, 180°, 240°, and 300°), the
Nnorm,ave value in the 3IR configuration always exceeds that in the 3CO configuration in the experiments (see
Figure 21a). In contrast, the
Nnorm,ave value in the 3IR configuration falls below that in the 3CO configuration regarding the six tandem-like layouts (
θ = 30°, 90°, 150°, 210°, 270°, and 330°).


