Article

Shades of Green: Life Cycle Assessment of a Novel Small-Scale Vertical Axis Wind Turbine Tree

1
Faculty of Environmental Management, Prince of Songkla University, Hat Yai 90110, Thailand
2
Faculty of Economics, Tay Nguyen University, Buon Ma Thuot 630000, Vietnam
3
Sustainable Energy Management Program, Wind Energy and Energy Storage Centre (WEESYC), Faculty of Environmental Management, Prince of Songkla University, Hat Yai 90110, Thailand
4
Cemme Center of Excellence in Metal and Materials Engineering, Prince of Songkla University, Hat Yai 90110, Thailand
5
Institute for Environmental and Transport Studies, Ho Chi Minh City University of Transport, Ho Chi Minh City 72308, Vietnam
6
Independent Researcher, 5561, 5th Line, Alliston ON L9R 1V2, Canada
7
Environmental Assessment and Technology for Hazardous Waste Management Research Center, Faculty of Environmental Management, Prince of Songkla University, Hat Yai 90110, Thailand
8
Program of Sustainable Energy Management, Faculty of Environmental Management, Prince of Songkla University, Hat Yai 90110, Thailand
*
Author to whom correspondence should be addressed.
Energies 2022, 15(20), 7530; https://doi.org/10.3390/en15207530
Submission received: 14 September 2022 / Revised: 5 October 2022 / Accepted: 9 October 2022 / Published: 12 October 2022
(This article belongs to the Special Issue Vertical-Axis Wind Turbine)

Abstract

:
Are small-scale wind turbines green? In this study, we perform a ‘cradle to grave’ life cycle assessment of a novel domestic-scale 10 kW vertical axis wind turbine tree which uses combined Savonius and H-Darrieus blades. Situated at a test site in Surat Thani, Thailand, SimaPro software was used to evaluate the environmental impact profile of the tree. Comparisons to the Thai grid mix were made, using both with and without end-of-life treatments. Impact profiles were calculated using wind data collected over two years at Surat Thani, and from wind data from a higher capacity factor (CF) site at Chiang Mai, Thailand. Energy and greenhouse gas payback times were estimated for both locations. The relative magnitudes of impacts were compared with environmental prices protocol, and we investigated reductions in impacts using three mitigative scenarios: changes to design, transportation and materials. The results showed that Chiang Mai had a CF = 7.58% and Surat Thani had a CF = 1.68%. A total of 9 out of 11 impacts were less than the grid values at Chiang Mai, but at Surat Thani, 9 of 11 impacts were more than the grid values. End-of-life treatments reduced impacts by an average of 11%. The tower and generator were majority contributors to impacts (average 69%). Greenhouse gas and energy payback times were 28.61 and 54.77 years, and 6.50 and 12.50 years for Surat Thani and Chiang Mai, respectively, with only the Chiang Mai times being less than the turbine’s estimated lifetime. Location changes mitigated impacts most, followed by design, transportation, and then materials. We make recommendations to further improve the environmental impact profile of this turbine tree.

1. Introduction

‘Green’ is a term associated with the reduction of the environmental impacts of technologies and products. Products involving renewable energy are often unquestioningly deemed green and are marketed as such. When measuring the greenness of a product though, a level of focus not only on the finished item is needed, because products are more correctly defined in a broader sense. A product is, in reality, the sum of all the stages of its life, including design, materials acquisition, manufacture, transportation, operation, and end-of-life treatment. Therefore, products may be more comprehensively tested for environmental impacts via a life cycle assessment (LCA). Indeed, there may be aspects of a product’s life cycle that make it less meritorious of a ‘green’ moniker.
LCA is a general methodology that assesses the environmental impacts at all stages of products, processes, or services. Glassbrook et al., Martínez et al., and Wang and Teah are examples of studies in which LCAs have been used to assess environmental impacts, energy payback times and cumulative energy requirements of wind turbines [1,2,3].
Rising electrical demand, fossil fuel use and greenhouse gas concerns have led to burgeoning use of wind resources. The total global capacity of wind installations increased from 24 GW in 2001 to 591 GW in 2018, a rise of 2363% [4]. Wind energy has been regarded as having more potential than any of the other renewable energy technologies [5].
In Thailand, where our research was carried out, the cumulative wind energy capacity reached 648 MW at the end of 2018 [6], and the Thai government’s aim is to generate 3000 MW by 2036 [7].
When LCAs have been used to compare wind with other ‘renewable’ power generation methods, mixed results have been found. The global warming potential (GWP) for wind energy in Ontario, Canada was found to be intermediate between hydro- and nuclear power [8]. Wang et al. [9] analyzed the environmental impact of hydroelectricity, wind, and nuclear power in China. Wind energy’s harmful ecological effects were found most significant, followed by nuclear and hydroelectricity. Asdrubali et al. [10] reviewed 100 case studies concerning renewable energy and identified wind energy as being often lowest in environmental impacts.
Wind turbines can be classified according to their scale: large-scale (surpassing 1000 kW), medium-scale (100 kW to 1000 kW), commercial-scale (16 kW to 100 kW), domestic-scale (1.4 kW to 16 kW), mini-scale (0.25 kW to 1.4 kW), and microscale (0.004 kW to 0.25 kW) [11]. Our LCA in this paper concerns a small prototype vertical axis wind turbine (VAWT) tree which is domestic-scale, rated at 10 kW (see Figure 1).
LCAs of small-scale wind turbines have been hitherto few, with mixed results. A 600 W horizontal wind axis turbine (HAWT) assessed in Taiwan had generally unfavorable LCA results [3]. Kouloumpis et al. [12] analyzed the performance and impacts of a 5 kW VAWT in Poland with varied results. More favorable results were found when Lombardi et al. [5] performed LCAs of small-scale VAWTs in Italy. At a time when small-scale VAWT and HAWT technology is developing rapidly, the environmental impact of these turbines needs to be accurately assessed [3].
In Thailand, with low-to-moderate average wind velocities [13], LCAs for smaller scale turbines are rare. Uddin and Kumar [14] compared the impacts of 300 W VAWTs and 500 W HAWTs. Glassbrook et al. [1] assessed potential economic feasibility and life cycle impacts for Thai 400–20,000 W turbines.
Our research here involves an LCA of a domestic-scale VAWT tree, designed and manufactured by the engineering department at Songkla University, Thailand. The overarching design objective of this tree was to devise a VAWT that could be economically feasible in low-wind, space-limited (urban) situations. This design objective resulted in the following physical attributes, which have implications for an environmental impact assessment (see Table 1 below):
The research aims of this study are unique in four ways. First, our research concerns a newly designed VAWT tree, designed for economic feasibility rather than being solely aesthetically pleasing (an economic feasibility study using this design was carried out by Ngoc et al. [23]). Second, few previous LCAs have focused on domestic-scale VAWTs. Third, since LCA research regarding wind turbine feasibility is scarce in Thailand and in most of Southeast Asia, our research augments the LCA literature for this region. Finally, our LCA uses environmental prices [24] to compare impacts with grid values, hitherto rarely carried out for wind systems.

2. Materials and Methods

An LCA may be conducted in four phases [25]:

2.1. Goals and Scope

2.1.1. Goals

Our goals centered on these questions which guided research:
  • How do environmental impacts of the VAWT tree at the lower-wind-speed location of Surat Thani and the higher-wind-speed location of Chiang Mai compare with impacts from the Thai grid mix when assessed with and without an end-of-life option?
  • Which component materials of the VAWT tree contribute most to impacts?
  • What are the energy and greenhouse gas (GHG) payback times at the lower-wind-speed location and the higher-wind-speed location?
  • If the impacts of the VAWT tree are compared with each other using a common basis of comparison, which impacts are most significant?
  • To mitigate important impacts, which change in life cycle aspect would reduce impacts most: transportation, design, or materials? How do these life cycle changes compare with alterations to impacts which result from location change?

2.1.2. Scope

This LCA was ‘cradle to grave’, using SimaPro 9.3.0.3. software [26].
For the two locations considered, we examined all life cycle stages: raw material acquisition, manufacturing, and transportation of the VAWT components (foundation, tower, generator, inverter, and cabling), installation, operation and maintenance, and end-of-life treatment (see Figure 2 for LCA delineation). The electricity generated enters the local grid (under EGAT—Electricity Generating Authority of Thailand).

2.2. Life Cycle Inventory

The tree consists of thirty-three paired turbines (each pair with a nominal power of 320 W, combining 3 Savonius and 3 Darrieus blades, stacked vertically (see Figure 3)).
The dual blade arrangement was designed for low wind sites, having a low cut-in speed (2 m/s). For operational and dimensional details, see Table A1, Appendix A.
System components—material and process inputs for manufacturing and transportation—were matched with relevant background datasets available in Ecoinvent 3 within SimaPro [26].

2.2.1. Raw Material Acquisition and Manufacturing

The VAWT has six material components: the rotor, generator, inverter, cable and controller, tower, and foundation, (see Figure 3). The rotor consists of the blades on the axle. Table A2, Appendix A provides Ecoinvent rotor constituent details. The generator is a synchronous motor with a neodymium magnet (NdFeB). See Table A3 in Appendix A for Ecoinvent inputs. The electrical grid connection comprises an inverter, controller and cables (see Table A6, Appendix A). Composition and proportions for the 5 kW inverter (Shenzhen (China) INVT Electric, Shenzhen, China) were estimated from their website (INVT, 2019) [27]. The tower consists of three 12 m steel H-beam columns reinforced by steel cross struts, supporting four levels of twelve arms hanging 33 turbines. See Table A4 in Appendix A for Ecoinvent inputs. The tree is embedded into a concrete foundation. The foundation contains nine rebar reinforced concrete columns (1.21 × 0.3 × 0.3 m each) and these have thirty-six 0.4 m rebar elements inserted at the top. The equilateral base is rebar-reinforced concrete (sides 6.65 m, 0.15 m thick). See Table A5 in Appendix A for Ecoinvent inputs.

2.2.2. Operation and Maintenance

The turbine does not require any maintenance, lubrication, materials, or energy inputs during its life after commencing operation.

2.2.3. Transport

Transportation was within Thailand (excepting the inverter, which was from China), and included raw material and component delivery and end-of-life disposal. Ecoinvent inputs determined impacts from transport, including fuel extraction, production and use. For calculations, the unit ton-kilometer (tkm) was used. Ecoinvent component details and transportation distances are provided in Table A7 (Appendix A). For Surat Thani, the inverter was assumed to be transported 3015 km by ship from Guangdong to Songkhla Port, then 360 km to the site by commercial vehicle. Concrete was assumed to be produced in Surat Thani and shipped 80 km by cement mixer truck. For Chiang Mai, the inverter was assumed to be transported 3500 km by ship from Guangdong to Bangkok Port, then 686 km to the site by commercial vehicle. Concrete was assumed to be produced in Chiang Mai and shipped 80 km by cement mixer truck.

2.2.4. Disposal and Recycling

The VAWT was still in operation during this research, so end-of-life forecasting is uncertain. We considered two end-of-life Scenarios for both locations, Surat Thani and Chiang Mai: ‘A’ (do nothing—our ‘base case’) and ‘B’ (reuse, recycle and dispose). For A, the VAWT would be left ‘as is’. In B, the foundation would remain in the ground. The permanent magnets are reused [14] since recycling processing is rare [12]. Only glass-fibre-reinforced plastic and paint were assumed 100% disposed of [5]. Other materials were assumed partly disposed of, partly recycled. Aluminum, steel and iron, and copper were considered recyclable at 90% and 95%. Materials and treatments in Scenario B are given in Table A8 (Appendix A).

2.2.5. Turbine Performance and Wind Speed

To compare with other wind turbines, impacts were expressed relative to performance (i.e., power generated) in SimaPro [26], and expressed per kWh. Energy and greenhouse gas payback times are thus functions of local annual wind speed. Power and wind speeds were handled as follows.
Lifetime power generated from the VAWT system was calculated as in [12]:
P O u t = 8760 C F P R p T ,
with P O u t the output power (kWh), and P R p the rated power (kW), C F the capacity factor, and T the system lifetime (years). With output power in kWh and lifetime T in years, the constant 8760 h/year was used.
Although uncertain, we conservatively assume the VAWT will have a 20-year minimum lifetime, based on consideration of components. This value has been used in similar studies [5,28], facilitating comparison of results.
The capacity factor is defined as the actual electricity generated by the wind turbine divided by the theoretical maximum amount that can be generated nominally. For our VAWT, based on Equation (1), P O u t was 87,600 kWh yearly ( P R p being 10 kW).
Data was collected for the VAWT at Surat Thani for two years (May 2019–April 2021). Monthly electricity generated and average wind speeds were sourced from Ngoc et al. [23].
The above considerations yield power output and capacity factors for Surat Thani and Chang Mai as follows (Table 2):

2.2.6. Thailand Electrical Grid Mix

We compared impacts from our VAWT with the existing Thailand electrical low-voltage grid (2018 data from SimaPro [26]). The Thai mix sources in 2018 are shown in Figure 4. The large dependency on non-renewable fossil fuels makes sourcing renewable energy desirable in Thailand.

2.3. Life Cycle Impact Assessment (LCIA) Methods

We performed four major analyses for our LCIA, all via SimaPro [26], as listed in Table 3:

2.3.1. CML-IA Baseline 2000 V3.05 Method

We used the CML-IA baseline 2000 V3.05 method when comparing Scenarios A and B for both Surat Thani and Chiang Mai against the Thai grid. Widely used and with clear interpretation, the equal weighting of 11 impact categories also facilitates comparison [12]. CML-IA baseline results are focused on midpoint (unitary environmental problem) indicators [26], and as such, clarity in terms of their cumulative contributions to aggregate impacts (endpoint indicators) is limited [31]. For this reason, we also evaluated impacts using the environmental prices method (see Section 2.3.3.1), which has a common (monetary) impact assessment, facilitating between-category and aggregate category comparison.

2.3.2. Cumulative Energy Demand (CED): Energy, GHG Payback Times and Component Contribution

Two insightful measures add understanding to LCA impacts. One measure, the energy payback time ( E P ), compares impacts with the time it takes to generate the same electricity as it took to fabricate, transport, and install the VAWT (see Equation (2) below) [28]. Second, after commencing operation, the VAWT ‘replaces’ grid mix electricity (significantly fossil fuel-based), and the amount of time it takes to replace GHGs produced by fabricating, transporting, and installing is the greenhouse gas payback time, G H G P (Equation (3) below) [3]. To calculate G H G P , we used total greenhouse gas emissions as calculated in SimaPro [26] for all life stage components ( G H G k , in Equation (3)) divided by annual emissions, converting turbine energy output to emissions with conversion factor 0.483 kgCO2eq/kWh for Thailand [32].
From Wang and Teah [3]:
E P = k = 1 n E k E a n n u a l ,
GHG P = k = 1 n G H G k 0.483   E a n n u a l ,
E K is the energy consumed during the VAWT’s life cycle. E a n n u a l indicates the annual electricity produced by the VAWT.
Using the CED 1.11 method in SimaPro [26], we obtained results for energy payback time, and used CML-IA baseline 2000 V3.05 results to calculate G H G P . Finally, to examine how payback times might be affected by the use of our prototype in locations with higher wind capacity, we also used a CF = 7.58% (corresponding to average wind speed = 4.8 m/s) at Chiang Mai [23]. Additionally, when implementing CED, we assessed the proportion of six energy sources (non-renewable fossil, nuclear and biomass, and renewable biomass, water and wind/solar/geothermal) used in the five material components.
The above two analyses allow us to understand impacts with respect to component contributions in life stages with and without end-of-life recycling, and with respect to the Thai grid mix.

2.3.3. Comparative Analyses

In this section, we perform two further comparative analyses. First, we make a life cycle assessment considering the relative severity of impacts, using a common basis of comparison (See Section 2.3.3.1 below). Second, we consider four impacts that might be of most concern to modern society and investigate three mitigative scenarios regarding those impacts (See Section 2.3.3.2 below).

2.3.3.1. Environmental Prices of Impacts

In CML-IA, impact results have different, category-specific units, occluding comparison between different impact categories. An in-common means of comparison between different categories is important when prioritizing alterations to aspects of life cycles that will be most effective in reducing overall impacts. In 2018, Bruyn et al. [24] developed a protocol using shadow prices for monetization of environmental impacts arising in LCAs. The method assesses economic welfare lost when impacts occur, estimating mitigation costs (using midpoint values). We used our Scenario A with environmental prices (based on ReCiPe [33] and IPCC [34] protocol) in SimaPro [26], which expresses prices in USD (the in-common basis of comparison).
Interpretations using environmental prices require caution. First, derivations from shadow prices are necessarily estimates only. Second, Bruyn et al. [24] have hitherto only published data for prices per impact unit in 2015, so estimates after this date are likely too conservative. Third, since prices are derived from European estimates, application to other regions entails further estimation due to differences in income levels and costs of living.
Addressing this last issue, we used a unit transfer, with income adjustment as per Navrud [35] in Equation (4):
UP T H L = UP E U GDP T H L GDP E U ϵ ,
UP T H L is the unit environmental price in Thailand; UP E U is the unit environmental price in Europe. Europe, ϵ , is the income elasticity. GDP T H L and GDP E U , the GDP values for Thailand and Europe, were as assigned in Table 4.

2.3.3.2. Comparative Analysis of Three Scenarios on Four Impact Areas

Of the eleven impact categories in CML-IA, among the top globally important impacts of concern today are global warming, ozone depletion, abiotic (resource) depletion, and human toxicity. Considering the likelihood that environmental impacts per kWh were likely to be greater for the low-wind (Surat Thani) location, we sought to assess how these four impacts might be mitigated by changes to life cycle elements. We investigated three different alterations to our Scenario A for this location in SimaPro [26], analyzing with the CML-IA method.
Tremeac and Meunier [28] varied the distance and type of transportation in an LCA for two wind turbines, and found that these could significantly lower impacts in relation to their reference case. In Scenario 1, we imagined changing the main method of transport from ‘Light Commercial Vehicle’ (i.e., by road) to train.
We reasoned, due to construction constraints, that substituting materials for the tower, foundation, and generator would be difficult, but substituting turbine blade material might be possible. Uddin and Kumar [14] found LCA impact reductions when varying materials in turbine construction. Yildiz [15] reported that the choice of steel has been found to have a lower environmental impact than other materials in wind turbine installations. In Scenario 2, we investigated changing blade material from glass-fibre-reinforced plastic to stainless sheet steel.
In a life cycle assessment of onshore wind turbine towers by Gkantou, Rebelo and Baniotopoulos [38] involving four- and six-leg hybrid towers, the former was found to result in less environmental impact than the latter. We imagined a design amendment in our VAWT configuration that might accomplish a similar reduction without compromising power output. Although our turbine uses three arms separated by 120 degrees, this configuration may not be optimal when prevailing winds are parallel to one arm. In a case where wind enters an “open V” of two of our wind tree arms, the third arm is mostly in an inefficient wind shadow area [23]. In Surat Thani, where wind speeds are often only slightly greater than the turbine cut-in speed, turbines in a shadow area will contribute minimally to the tree’s output. We imagined an altered design where the tree always has an open ‘V’ optimally facing the wind (i.e., is rotatable). In our Scenario 3, the third (wind shadow) arm of the wind tree was eliminated. We can then lower materials used by one third. In this scenario the tree has 22 turbines, keeping the same foundation and infrastructure as necessary to support the 22 turbines. Thus, material weights entered into SimaPro [26] were reduced by a third for the rotor, generator, cable, and tower components. In this scenario we kept the same energy output, assuming the contribution from the 11 eliminated turbines in wind shadow was negligible.
A summary of the specific alterations made in each Scenario above is provided below in Table 5.
After examining the effect of these alterations on impacts over the Surat Thani base case, we then compared their magnitude to the impact changes produced when switching the location of the VAWT tree from Surat Thani to Chiang Mai (see Section 2.1 and Section 2.3.1), under Scenario A and with no other change in Scenario.
Finally, to contextualize improvements produced under Scenarios 1 to 3, we compared the eleven new CML-IA numerical impact values of the three Scenarios to the Thai low-voltage grid mix and to our base case Scenario A in Surat Thani. We inspected data for any of the eleven impacts which reduced in value to below those of the base case or Thai grid values.
Since power output is directly related to capacity factor (Equation (1)), and with SimaPro [26] impacts expressed per kWh, we have:
I a I b = C Fb C Fa ,
where I a , I b are impacts for C Fa , C Fb .
Using this relation, we calculated hypothetical CFs that would be necessary for turbine impacts to equal grid impacts.

3. Results

3.1. CML Base Case Analysis

3.1.1. CML Impacts per kWh for Scenarios A and B and Thailand Energy Mix

Table 6 presents the impact results from SimaPro [26] for each scenario and the Thailand grid mix for comparison. Two general trends are clear. First, Scenario A had higher impacts in all categories than Scenario B, for both locations. An end-of-life scenario, when included, lowered impacts by an average of about 11% overall for both locations (11.40% and 10.97% for Surat Thani and Chiang Mai, respectively). Second, despite the Thai grid being largely sourced from fossil fuels (Figure 4), both Scenarios A and B for the prototype VAWT at the low-wind-speed location of Surat Thani had impacts that were usually greater than the Thailand grid impacts (9 out of 11 impacts), although, more encouragingly, both Scenarios A and B at Chiang Mai with a higher wind speed had impacts that were usually less than the Thailand grid impacts (only 2 out of 11 impacts were greater than the grid).

3.1.2. Analysis of Component Contribution

In Figure 5a,b, we present the results of impact contributions from six of the components of the VAWT, those relating to the extraction of raw materials, manufacturing, transportation, and installation and excluding the end-of-life treatment (i.e., Scenario A) for Surat Thani and Chiang Mai. Noteworthy here are the large contributions of the generator and the tower to impacts (69.51%, on average, for Surat Thani and 68.18% for Chiang Mai). These two components usually rank one and two (in 10 out of 11 impact categories for Surat Thani; in 8 out of 11 at Chiang Mai). The other components contributed considerably less (foundation, rotor, cable and controller).
Regarding global warming potential, the tower, the generator, and foundation accounted for most of the impacts: 77.60% for Surat Thani, and 78.54% for Chiang Mai. These components are also the highest contributors toward ozone depletion. For aquatic impacts (eutrophication, acidification, marine aquatic ecotoxicity, fresh water aquatic ecotoxicity), the generator and tower were the major contributors. Some of the components were higher in one particular category (for example, the inverter contributes an anomalously high percentage to abiotic depletion)—see Figure 5a,b and Table 7 for details.

3.1.3. Cumulative Energy Demand (CED): Energy, GHG Payback Times and Component Contribution Results

For Surat Thani and Chiang Mai, the total primary energy consumption was 285,114 MJ and 298,840.6 MJ, respectively, and their annual energy output was 1446.1 kWh and 6640.08 kWh, respectively. From Equations (2) and (3) in Section 2.3.2 above, the energy and GHG payback times were determined to be 54.77 and 28.61 years for Surat Thani and 12.50 and 6.50 years for Chiang Mai (Table 8). When located at the higher wind speed site, Ep and GHGp for the VAWT reduced significantly, by 77.17% and 77.27%, respectively—see Table 8.
In Figure 6, component contributions as calculated in SimaPro to the depletion of renewables and non-renewables are shown for the CF = 1.65% location (results were nearly identical for the CF = 7.58% case). Again, the generator and tower are the most significant impact sources. The generator impacts non-renewable sources heavily, while the tower affects renewables more than non-renewables.

3.2. Environmental Prices Analysis Results

Using our base case scenario for the wind tree prototype and the low-voltage grid, environmental prices were calculated for impacts among 14 categories in the ReCiPe [33] paradigm, and are given in Table 9. These are depicted according to proportion in Figure 7. For the CF = 1.65% location, impact costs were higher for the VAWT than the Thai grid in every category but one, whereas for the CF = 7.58% location, costs were lower than the Thai grid in every category but two. The total cost of VAWT impacts at CF = 1.65% is nearly three times as high as the Thailand low-voltage supply, whereas the total cost of VAWT impacts at CF = 7.58% is about one third less than the Thailand low-voltage supply.
Expressed in USD, for both locations, we can see the top four largest impacts—human toxicity, particulate matter formation, climate change and terrestrial acidification (ranked 1 to 4, respectively)—account for 94% and 95% of the total impacts generated during the life cycle of the wind tree (for S. T. and C. M., respectively). These same four impacts are similarly the top four for the Thai grid (accounting for 90%), but in different rank order.

3.3. Results Comparing Three Mitigative Scenarios vs. Location Change

Results from analyses with Scenarios 1 to 3 with respect to four impacts of concern are given in Table 10 and summarized in Figure 8. Results indicate that of the scenarios involving transport, new materials and design, the latter produced the most significant reductions in impacts of concern (Scenario 3 had reductions in all impact categories (approximately 20% over the base case amounts per kWh), and it had the lowest impacts among the scenarios in all categories). Following this, Scenario 1, transport via train, also had reductions in all categories by about 10% over base case amounts. Our Scenario 2, the use of sheet stainless steel rather than glass-fibre-reinforced plastic, was moderately lower in abiotic depletion and global warming, but had higher or equivalent values to our base case in the other two impact areas of concern.
The above changes indicate real alterations in the impact amounts when implementing the three life cycle changes, with all other factors held constant. However, if we implement none of these, but instead change the tree’s potential output by raising the capacity factor to that found in Chiang Mai, we find that the relative impacts per kWh in the four categories reduced substantially more (by 78%—see Table 10).
A radar plot summarizing these life cycle and location changes is given in Figure 8.
Figure 8. Impact changes of mitigation Scenarios 1 to 3, vs. CF = 7.58% (location change to Chiang Mai).
Energies 15 07530 g008
The results of comparing the entire complement of new impact values of Scenarios 1 to 3 with respect to the Thai grid and base cases are shown in Table 11 (see Table 11 caption for explanation of colors). Of the three mitigative scenarios, changing transportation and design were most effective, followed by materials. Transportation and design showed all impacts as less than the S. T. base case, but these each had only two impacts less than the Thai grid. Material change only yielded four impacts less than the S. T. base case, with only two impacts less than grid values. By comparison, a location change to CF = 7.58% would produce substantially greater reductions than any of these mitigative propositions, resulting in all impacts being lower than the S. T. base case, and nine of eleven impacts less than grid impacts.
CF values allowing the prototype to have impacts equivalent to the grid were calculated (Equation (5)) and are shown in Table 12. Raising the capacity factor to 4% from 1.65% at Surat Thani would change the number of impact categories that are less than the grid from 2 to 7, indicative of the importance of location selection (9 of 11 impacts at Chiang Mai are already less than the grid equivalents at Chiang Mai’s CF of 7.58%). At both of these locations, however, two impacts—abiotic depletion and human toxicity—would still be dramatically higher than grid values even if a very high-capacity factor were attained.

4. Discussion

In Surat Thani, the CML analysis showed Scenario A and Scenario B usually produced higher environmental impacts than the Thai low voltage grid. At Chiang Mai, however, the CML analysis showed Scenario A and Scenario B usually produced lower environmental impacts than the Thai low voltage grid. These results are concomitant with the fact that the impacts in SimaPro [26] are expressed per kWh (at Surat Thani, our tree had low capacity because of the combination of small size and low wind environment). While scaling up the dimensions of wind turbines can result in proportionally less impacts per kWh due to capacity increases, as well as scaling factors and manufacturing experience [39], scaling up at the Surat Thani site would likely not cause reductions due to consistently low wind speeds.
Environmental impacts can be reduced after decommissioning when there is potential for material reuse and recycling [17], and in our assessment the inclusion of an end-of-life treatment scenario always lowered impacts for both locations. For both scenarios in both regions, however, for with and without an end-of-life treatment, the categories of human toxicity and abiotic depletion remained several times larger than grid values, so mitigation methods targeting these might be investigated.
Our finding that tower and generator components are leading contributors to impacts in both locations is consistent with other LCAs on VAWTs (see, for example [12,14]). These components are energy intensive [14] due to constituent materials and masses. In our case, the generator components are often proportionally higher than that found for LCAs of other single wind turbine arrangements, because our design involves a ‘tree’ of 33 turbines, thereby replicating the generator components 33 times. We therefore consider these components, along with the tower and generators, to be the most important subjects of research into material alternatives and/or reductions from structural redesign, en route to a wind tree that has a greener life cycle.
For Surat Thani, (CF = 1.65%) energy and GHG payback times exceeded the VAWT’s estimated lifetime. While calculated times were less than that found for some studies [3], they were more than others [14]. For Chiang Mai (CF = 7.58%), both energy and GHG payback times were dramatically reduced to within the estimated VAWT’s lifetime, indicating the practicality of using this wind tree design at sites of comparable wind speed. Regarding the cumulative energy demand, we again note the disproportionate contributions of the tower and generator to GHGs and non-renewable fossil fuel depletion, and therefore recommend again that these components be scrutinized for alternatives that mitigate these important impacts.
Comparing impacts using environmental prices, our prototypes in both locations were similar to the Thai grid, in that the four largest impact areas were the same. While all impacts are important, it is perhaps disappointing that these aforementioned largest impacts—human toxicity, particulate matter formation, climate change, and terrestrial acidification—are among those impacts of current global concern.
Comparing our mitigative strategies in Scenarios 1 through 3, it is clear that the proposed design change (Scenario 3—removing an arm in a ‘wind shadow’ area) was most effective in reducing environmental impacts of concern. Locating the wind tree at the Chiang Mai site with higher capacity would reap even more benefit. The Chiang Mai base case produced less impacts per kWh than all the other changes implemented in Scenarios 1 to 3.
When considering the entirety of impact categories against the CF = 1.65% base case and Thai grid, design and transportation alterations made the VAWT tree greener, but only location changes made it ‘truly green’, as only then did it largely outperform the Thai grid. Having half of the impacts of the grid is very feasible (requiring a CF = 4%, corresponding to a wind speed between 3 to 4 m/s). However, reducing all impacts to under grid values is likely unachievable with this VAWT due to the high corresponding wind speeds necessary to ameliorate human toxicity and abiotic depletion impacts (see Section 3.3).
Other mitigative alterations might be considered. Situating the prototype on the roof of a suitably constructed building could lower foundational component impacts considerably, and increase CF values as winds increase with height. Ocean and lake shorelines with convectional winds will similarly lead to higher CFs.
These findings underscore the importance of planning. Life cycle assessments, as exemplified by this study, reveal that design and site decisions are as important to environmental concerns as they are to engineering concerns [40].

5. Conclusions

We carried out a life cycle assessment on a novel, 10 kW vertical axis wind turbine tree developed by Prince of Songkla University in Thailand, combining Savonius and Darrieus blades for a low cut-in speed. Using calculated capacity factors for Surat Thani [23] and Chiang Mai [29], we comprehensively assessed environmental life cycle impacts using SimaPro [26]. Table 13 summarizes our analyses, findings and recommendations.
Space and infrastructure limitations often make a case for the use of small-scale wind turbines, but their application has often been considered limited in terms of economic [41] and environmental [3,12] feasibility. Here, we report favorable results of a life cycle assessment of a novel, domestic-scale hybrid-blade VAWT. When used at a location with CF = 7.58%, the VAWT has less environmental impacts than grid impacts.
Alternative energy products are sometimes assessed unquestioningly as ‘green’, or assessed as such based upon a less-than-comprehensive accounting of environmental impacts. Life cycle assessments are an attempt to comprehensively and objectively quantify impacts. In this LCA, we identified aspects of the life cycle of a domestic-scale VAWT that allow it to be ‘greener’ than the extant electrical grid. Locating in situations of at least 3–4 m/s means a majority of impacts drop below grid values. Design and transportation changes can also improve impacts on the environment, but to a lesser extent.
In terms of further research, optimization of design aspects of this VAWT may lead to environmental suitability of this design in even lower wind speed areas. Future design and material alternatives should focus on tower and generator elements, particularly in relation to the four major contributors to environmental cost that were identified in this research.

Author Contributions

Conceptualization, analyses, methodology, writing (original draft)—D.M.N.; writing (review and editing)—D.M.N., K.H., M.L. and K.T.; supervision—M.L. and K.T.; software—P.T.A. All authors have read and agreed to the published version of the manuscript.

Funding

This research was funded by a Ph.D. research grant [TEH-AC 046/2018], Sustainable Energy Management—Prince of Songkla University, Hat Yai, Thailand. Wind tree construction was subsidized by the Electricity Generating Authority of Thailand (EGAT) (61-F405000-11-IO. SS03F3008347).

Data Availability Statement

Not applicable.

Acknowledgments

The work is supported by the Wind Energy and Energy Storage Centre (WEESYC), the Energy Technology Research Center (ETRC), the Centre of Excellence in Materials Engineering (CEME), and Prince of Songkla University.

Conflicts of Interest

The authors declare no conflict of interest.

Appendix A

Table A1. Dimensions and operational characteristics of the wind tree.
CharacteristicMeasure
Rated power (kW)10
Rotor diameter (m)0.72
Height of Darrieus blades (m)0.45
Height of Savonius blades (m)0.6
Cut-in speed (m/s)2.0
Cut-out speed (m/s)15.0
Rated power (kW)10
Table A2. Rotor inventory and matching Ecoinvent records.
SubcomponentsRaw Material/Ecoinvent DatabaseQuantity (kg)
BladesGlass-fibre-reinforced plastic, polyamide, injection moulded {GLO}|market for|APOS, U172.8
HubGlass-fibre-reinforced plastic, polyamide, injection moulded {GLO}|market for|APOS, U105.6
Bearing Steel, chromium steel 18/8 {GLO}|market for|APOS, U6.4
ScrewSteel, chromium steel 18/8 {GLO}|market for|APOS, U0.26
Shaft Steel, chromium steel 18/8 {GLO}|market for|APOS, U160.32
StickSteel, chromium steel 18/8 {GLO}|market for|APOS, U19.2
Table A3. Generator inventory and matching Ecoinvent records.
SubcomponentsRaw Material/Ecoinvent DatabaseQuantity (kg)
GeneratorPermanent magnet, for electric motor {GLO}|production|APOS, U76.8
StatorCopper {GLO}|market for|APOS, U144
Glass-fibre-reinforced plastic, polyester resin, hand lay-up {GLO}|market for|APOS, U96
Table A4. Tower inventory and matching Ecoinvent records.
SubcomponentsRaw Material/Ecoinvent DatabaseQuantity (kg)
TowerSteel, low-alloyed {GLO}|market for|APOS, U2849.43
WeldingWelding, arc, steel {GLO}|market for|APOS, U20
PaintAcrylic varnish, without water, in 87.5% solution state {GLO}|market for|APOS, U25
Table A5. Foundation inventory and matching Ecoinvent records.
SubcomponentsRaw Material/Ecoinvent DatabaseQuantity (kg)
ReinforcementReinforcing steel {GLO}|market for|APOS, U629.83
Concrete baseConcrete block {GLO}|market for|APOS, U27,600
Table A6. Electrical connection inventory and matching Ecoinvent records.
SubcomponentsRaw Material/Ecoinvent DatabaseQuantity (kg)
CableCopper wire, technology mix, consumption mix, at plant, cross Section 1 mm2 (duplicate) EU-15 S138.6
InverterSimplified process15
Aluminium alloy, AlLi {GLO}|market for|APOS, U7.64
Copper {GLO}|market for|APOS, U3.06
Steel, low-alloyed {GLO}|market for|APOS, U1.45
Electronics2.82
ControllerElectronics, for control units {GLO}| market for|APOS, U3
Table A7. Transport methods and distances for components, with Ecoinvent selections.
JourneyMaterial/Ecoinvent RecordDistance (km)
Surat ThaniChiang Mai
RotorTransport, freight, lorry 3.5–7.5 metric ton, euro6 {RER}|market for transport, freight, lorry 3.5–7.5 metric ton, EURO6|APOS, U400600
Generator 600600
Tower 600600
Inverter 360686
Transport, freight, sea, transoceanic ship {GLO}|market for|APOS, U30153500
FoundationTransport, freight, lorry 16–32 metric ton, metric ton, euro6 {RoW}|market for transport, freight, lorry 16–32 metric ton, EURO6|APOS, U600600
End of lifeTransport, freight, lorry 16–32 metric ton, metric ton, euro6 {RoW}|market for transport, freight, lorry 16–32 metric ton, EURO6|APOS, U8080
Table A8. Scenario B treatments.
MaterialTreatment
Aluminum 90% recycled + 10% landfilled
Copper95% recycled + 5% landfilled
Steel 90% recycled + 10% landfilled
Glass-fibre-reinforced plastic100% landfilled
Paint 100% landfilled
ElectronicsTreatment as hazardous waste mass

References

  1. Glassbrook, K.A.; Carr, A.H.; Drosnes, M.L.; Oakley, T.R.; Kamens, R.M.; Gheewala, S.H. Life cycle assessment and feasibility study of small wind power in Thailand. Energy Sustain. Dev. 2014, 22, 66–73. [Google Scholar] [CrossRef]
  2. Martínez, E.; Sanz, F.; Pellegrini, S.; Jiménez, E.; Blanco, J. Life cycle assessment of a multi-megawatt wind turbine. Renew. Energy 2009, 34, 667–673. [Google Scholar] [CrossRef]
  3. Wang, W.C.; Teah, H.Y. Life cycle assessment of small-scale horizontal axis wind turbines in Taiwan. J. Clean. Prod. 2017, 141, 492–501. [Google Scholar] [CrossRef]
  4. Department of Alternative Energy Development and Efficiency. Annual Report; Ministry of Energy: Bangkok, Thailand, 2016.
  5. Lombardi, L.; Mendecka, B.; Carnevale, E.; Stanek, W. Environmental impacts of electricity production of micro wind turbines with vertical axis. Renew. Energy 2018, 128, 553–564. [Google Scholar] [CrossRef]
  6. Department of Alternative Energy Development and Efficiency. Thailand Alternative Energy Situation; Ministry of Energy: Bangkok, Thailand, 2016. Available online: http://webkc.dede.go.th/testmax/sites/default/files/thailandalternative2016.pdf (accessed on 14 November 2018).
  7. Energy Policy and Planning Office Thailand Power Development Plan 2015–2036 (PDP2015). Available online: https://www.egat.co.th/en/images/about-egat/PDP2015_Eng.pdf (accessed on 26 November 2018).
  8. Siddiqui, O.; Dincer, I. Comparative assessment of the environmental impacts of nuclear, wind and hydro-electric power plants in Ontario: A life cycle assessment. J. Clean. Prod. 2017, 164, 848–860. [Google Scholar] [CrossRef]
  9. Wang, L.; Wang, Y.; Du, H.; Zuo, J.; Yi, M.; Li, R.; Zhou, Z.; Bi, F.; Garvlehn, M.P. A comparative life-cycle assessment of hydro-, nuclear and wind power: A China study. Appl. Energy 2019, 249, 37–45. [Google Scholar] [CrossRef]
  10. Asdrubali, F.; Baldinelli, G.; D’Alessandro, F.; Scrucca, F. Life cycle assessment of electricity production from renewable energies: Review and results harmonization. Renew. Sustain. Energy Rev. 2015, 42, 1113–1122. [Google Scholar] [CrossRef]
  11. Shah, S.R.; Kumar, R.; Raahemifar, K.; Fung, A.S. Design, modeling and economic performance of a vertical axis wind turbine. Energy Rep. 2018, 4, 619–623. [Google Scholar] [CrossRef]
  12. Kouloumpis, V.; Sobolewski, R.A.; Yan, X. Performance and life cycle assessment of a small scale vertical axis wind turbine. J. Clean. Prod. 2020, 247, 119520. [Google Scholar] [CrossRef]
  13. Chingulpitak, S.; Wongwises, S. Critical review of the current status of wind energy in Thailand. Renew. Sustain. Energy Rev. 2014, 31, 312–318. [Google Scholar] [CrossRef]
  14. Uddin, M.S.; Kumar, S. Energy, emissions and environmental impact analysis of wind turbine using life cycle assessment technique. J. Clean. Prod. 2014, 69, 153–164. [Google Scholar] [CrossRef]
  15. Yildiz, N.; Hemida, H.; Baniotopoulos, C. Maintenance and End-of-Life Analysis in LCA for Barge-Type Floating Wind Turbine. Wind 2022, 2, 246–259. [Google Scholar] [CrossRef]
  16. Tasneem, Z.; Al Noman, A.; Das, S.K.; Saha, D.K.; Islam, M.R.; Ali, M.F.; R Badal, M.F.; Ahamed, M.H.; Moyeen, S.I.; Alam, F. An analytical review on the evaluation of wind resource and wind turbine for urban application: Prospect and challenges. Dev. Built Environ. 2020, 4, 100033. [Google Scholar] [CrossRef]
  17. Casini, M. Small Vertical Axis Wind Turbines for Energy Efficiency of Buildings. J. Clean Energy Technol. 2015, 4, 56–65. [Google Scholar] [CrossRef] [Green Version]
  18. Jamanun, M.J.; Misaran, M.S.; Rahman, M.; Muzammil, W.K. Performance Investigation of A Mix Wind Turbine Using A Clutch Mechanism at Low Wind Speed Condition. IOP Conf. Ser. Mater. Sci. Eng. 2017, 217, 012020. [Google Scholar] [CrossRef] [Green Version]
  19. Almotairi, A.M.M.; Mustapha, F.; Ariffin, M.K.A.M.; Zahari, R. Synergy of Savonius and Darrieus types for vertical axis wind turbine. Int. J. Adv. Appl. Sci. 2016, 3, 25–30. [Google Scholar] [CrossRef]
  20. Kumar, A.; Nikhade, A. Hybrid Kinetic Turbine Rotors: A Review. Int. J. Eng. Sci. Adv. Technol. 2014, 4, 453–463. [Google Scholar]
  21. Akwa, J.V.; Vielmo, H.A.; Petry, A.P. A review on the performance of Savonius wind turbines. Renew. Sustain. Energy Rev. 2012, 16, 3054–3064. [Google Scholar] [CrossRef]
  22. Energy Systems Research Institute at Prince of Songkla University. Project Report; Development of 10 kW Low Speed Vertical Wind Turbine Using Tree Constructor; Energy Systems Research Institute at Prince of Songkla: Hat Yai, Thailand, 2019. [Google Scholar]
  23. Ngoc, D.M.; Techato, K.; Niem, L.D.; Thi, N.; Yen, H.; Van Dat, N. A Novel 10 kW Vertical Axis Wind Tree Design: Economic Feasibility Assessment. Sustainability 2021, 13, 12720. [Google Scholar] [CrossRef]
  24. de Bruyn, S.; Bijleveld, M.; de Graaff, L.; Schep, E.; Schrote, A.; Vergeer, R.; Ahdou, S. Environmental Prices Handbook; CE Delft: Delft, The Netherlands, 2018. [Google Scholar]
  25. ISO 14044:2006; Environmental Management—Life Cycle Assessment—Requirements and Guidelines. International Organization for Standardization: Geneva, Switzerland, 2006; pp. 652–668. [CrossRef]
  26. PRé. Sustainability SimaPro 9.3.0.3, (Software); PRé: Amersfoort, The Netherlands, 2021.
  27. Invt MG 4–5 kW Single Phase On-Grid Solar Inverter—INVT Solar Power. Available online: https://www.invt.com/products/mg-4-5kw-single-phase-on-grid-inverter-100 (accessed on 28 May 2019).
  28. Tremeac, B.; Meunier, F. Life cycle analysis of 4.5 MW and 250 W wind turbines. Renew. Sustain. Energy Rev. 2009, 13, 2104–2110. [Google Scholar] [CrossRef]
  29. Chaichana, T.; Chaitep, S. Wind power potential and characteristic analysis of Chiang Mai, Thailand. J. Mech. Sci. Technol. 2010, 24, 1475–1479. [Google Scholar] [CrossRef]
  30. Energy Policy and Planning Office. Electricity Statistic. Available online: http://www.eppo.go.th/index.php/en/en-energystatistics/electricity-statistic?orders[publishUp]=publishUp&issearch=1 (accessed on 6 November 2019).
  31. RIVM LCIA: The ReCiPe Model—RIVM. Available online: https://www.rivm.nl/en/life-cycle-assessment-lca/recipe%0Ahttps://www.rivm.nl/en/Topics/L/Life_Cycle_Assessment_LCA/ReCiPe (accessed on 3 October 2022).
  32. EGAT. Sustainability Report 2019; Electricity Generating Authority of Thailand: Bangkok, Thailand, 2019. [Google Scholar]
  33. Goedkoop, M.; Heijungs, R.; Huijbregts, M.; De Schryver, A.; Struijs, J.; Van Zelm, R. ReCiPe 2008: A Life Cycle Impact Assessment Method Which Comprises Harmonised Category Indicators at the Midpoint and the Endpoint Level, 1st ed.; Report I: Characterisation; Ministry of Housing, Spatial Planning and the Environment: The Hague, The Netherlands, 2009. [Google Scholar]
  34. Stocker, T.F.; Qin, D.; Plattner, G.K.; Tignor, M.M.; Allen, S.K.; Boschung, J.; Midgley, P.M. Climate Change 2013: The Physical Science Basis. Contribution of Working Group I to the Fifth Assessment Report of the Intergovernmental Panel on Climate Change; IPCC: Cambridge, NY, USA, 2013. [Google Scholar]
  35. Navrud, S. Possibilities and Challenges in Transfer and Generalisation of Monetary Estimates for Environmental and Health Benefits of Regulating Chemicals; OECD Environment Working Papers; OECD: Paris, France, 2017; Volume 6, p. 10. [Google Scholar] [CrossRef]
  36. Ghani, H.U.; Mahmood, A.; Ullah, A.; Gheewala, S.H. Life cycle environmental and economic performance analysis of bagasse-based electricity in Pakistan. Sustainability 2020, 12, 10594. [Google Scholar] [CrossRef]
  37. Macrotrends. Thailand GDP per Capita 1960–2021|MacroTrends. Available online: https://www.macrotrends.net/countries/THA/thailand/gdp-per-capita (accessed on 28 October 2021).
  38. Gkantou, M.; Rebelo, C.; Baniotopoulos, C. Life Cycle assessment of tall onshore hybrid steel wind turbine towers. Energies 2020, 13, 3950. [Google Scholar] [CrossRef]
  39. Caduff, M.; Huijbregts, M.A.J.; Althaus, H.J.; Koehler, A.; Hellweg, S. Wind power electricity: The bigger the turbine, the greener the electricity? Environ. Sci. Technol. 2012, 46, 4725–4733. [Google Scholar] [CrossRef]
  40. Doerffer, K.; Bałdowska-Witos, P.; Pysz, M.; Doerffer, P.; Tomporowski, A. Manufacturing and recycling impact on environmental life cycle assessment of innovative wind power plant part 1/2. Materials 2021, 14, 220. [Google Scholar] [CrossRef]
  41. Gough, M.; Lotfi, M.; Castro, R.; Madhlopa, A.; Khan, A.; Catalão, J.P.S. Urban wind resource assessment: A case study on Cape Town. Energies 2019, 12, 1479. [Google Scholar] [CrossRef]
Figure 1. The prototype VAWT tree.
Energies 15 07530 g001
Figure 2. LCA system boundary and impact assessments. The dashed box contains the life cycle components.
Energies 15 07530 g002
Figure 3. Wind turbine tree (a) and turbine structure (b).
Energies 15 07530 g003
Figure 4. Thailand electrical grid mix [30].
Energies 15 07530 g004
Figure 5. (a) Environmental impacts of the VAWT per component (Surat Thani); (b) environmental impacts of the VAWT per component (Chiang Mai).
Energies 15 07530 g005
Figure 6. Cumulative energy demand (CED) for renewables and non-renewables per component.
Energies 15 07530 g006
Figure 7. Environmental prices, percent of total impact cost for: (a) S. T. (CF = 1.65%); (b) C. M. (CF = 7.58%); (c) Thai grid. The four largest value impacts are labelled. For the smaller impacts, see Table 9.
Energies 15 07530 g007
Table 1. VAWT tree design attributes and potential LCA effect.
Design AttributePossible Impact on LCA
The design was small-scale (domestic) to fit into a space-limited niche.With decreasing scale of wind turbines and correspondingly lower outputs, it is to be expected that when environmental impacts are expressed in proportion to kWhr, LCA outcomes become less favorable. This has been reported by Uddin and Kumar [14], who found impacts in inverse proportion to capacity factor. Yildiz [15], for example, also noted the inverse relationship between turbine size and energy payback time.
This design was a vertical axis wind turbine to utilize fluctuating wind speed and directions in space-limited settings (vertical axis designs typically require less space than horizontal designs) [16].VAWTs are less efficient than HAWTs due to additional drag created as blades rotate into the prevailing wind [17]. The lower energy output profile, as noted above, means environmental impacts per unit of energy produced may be relatively higher in an LCA analysis.
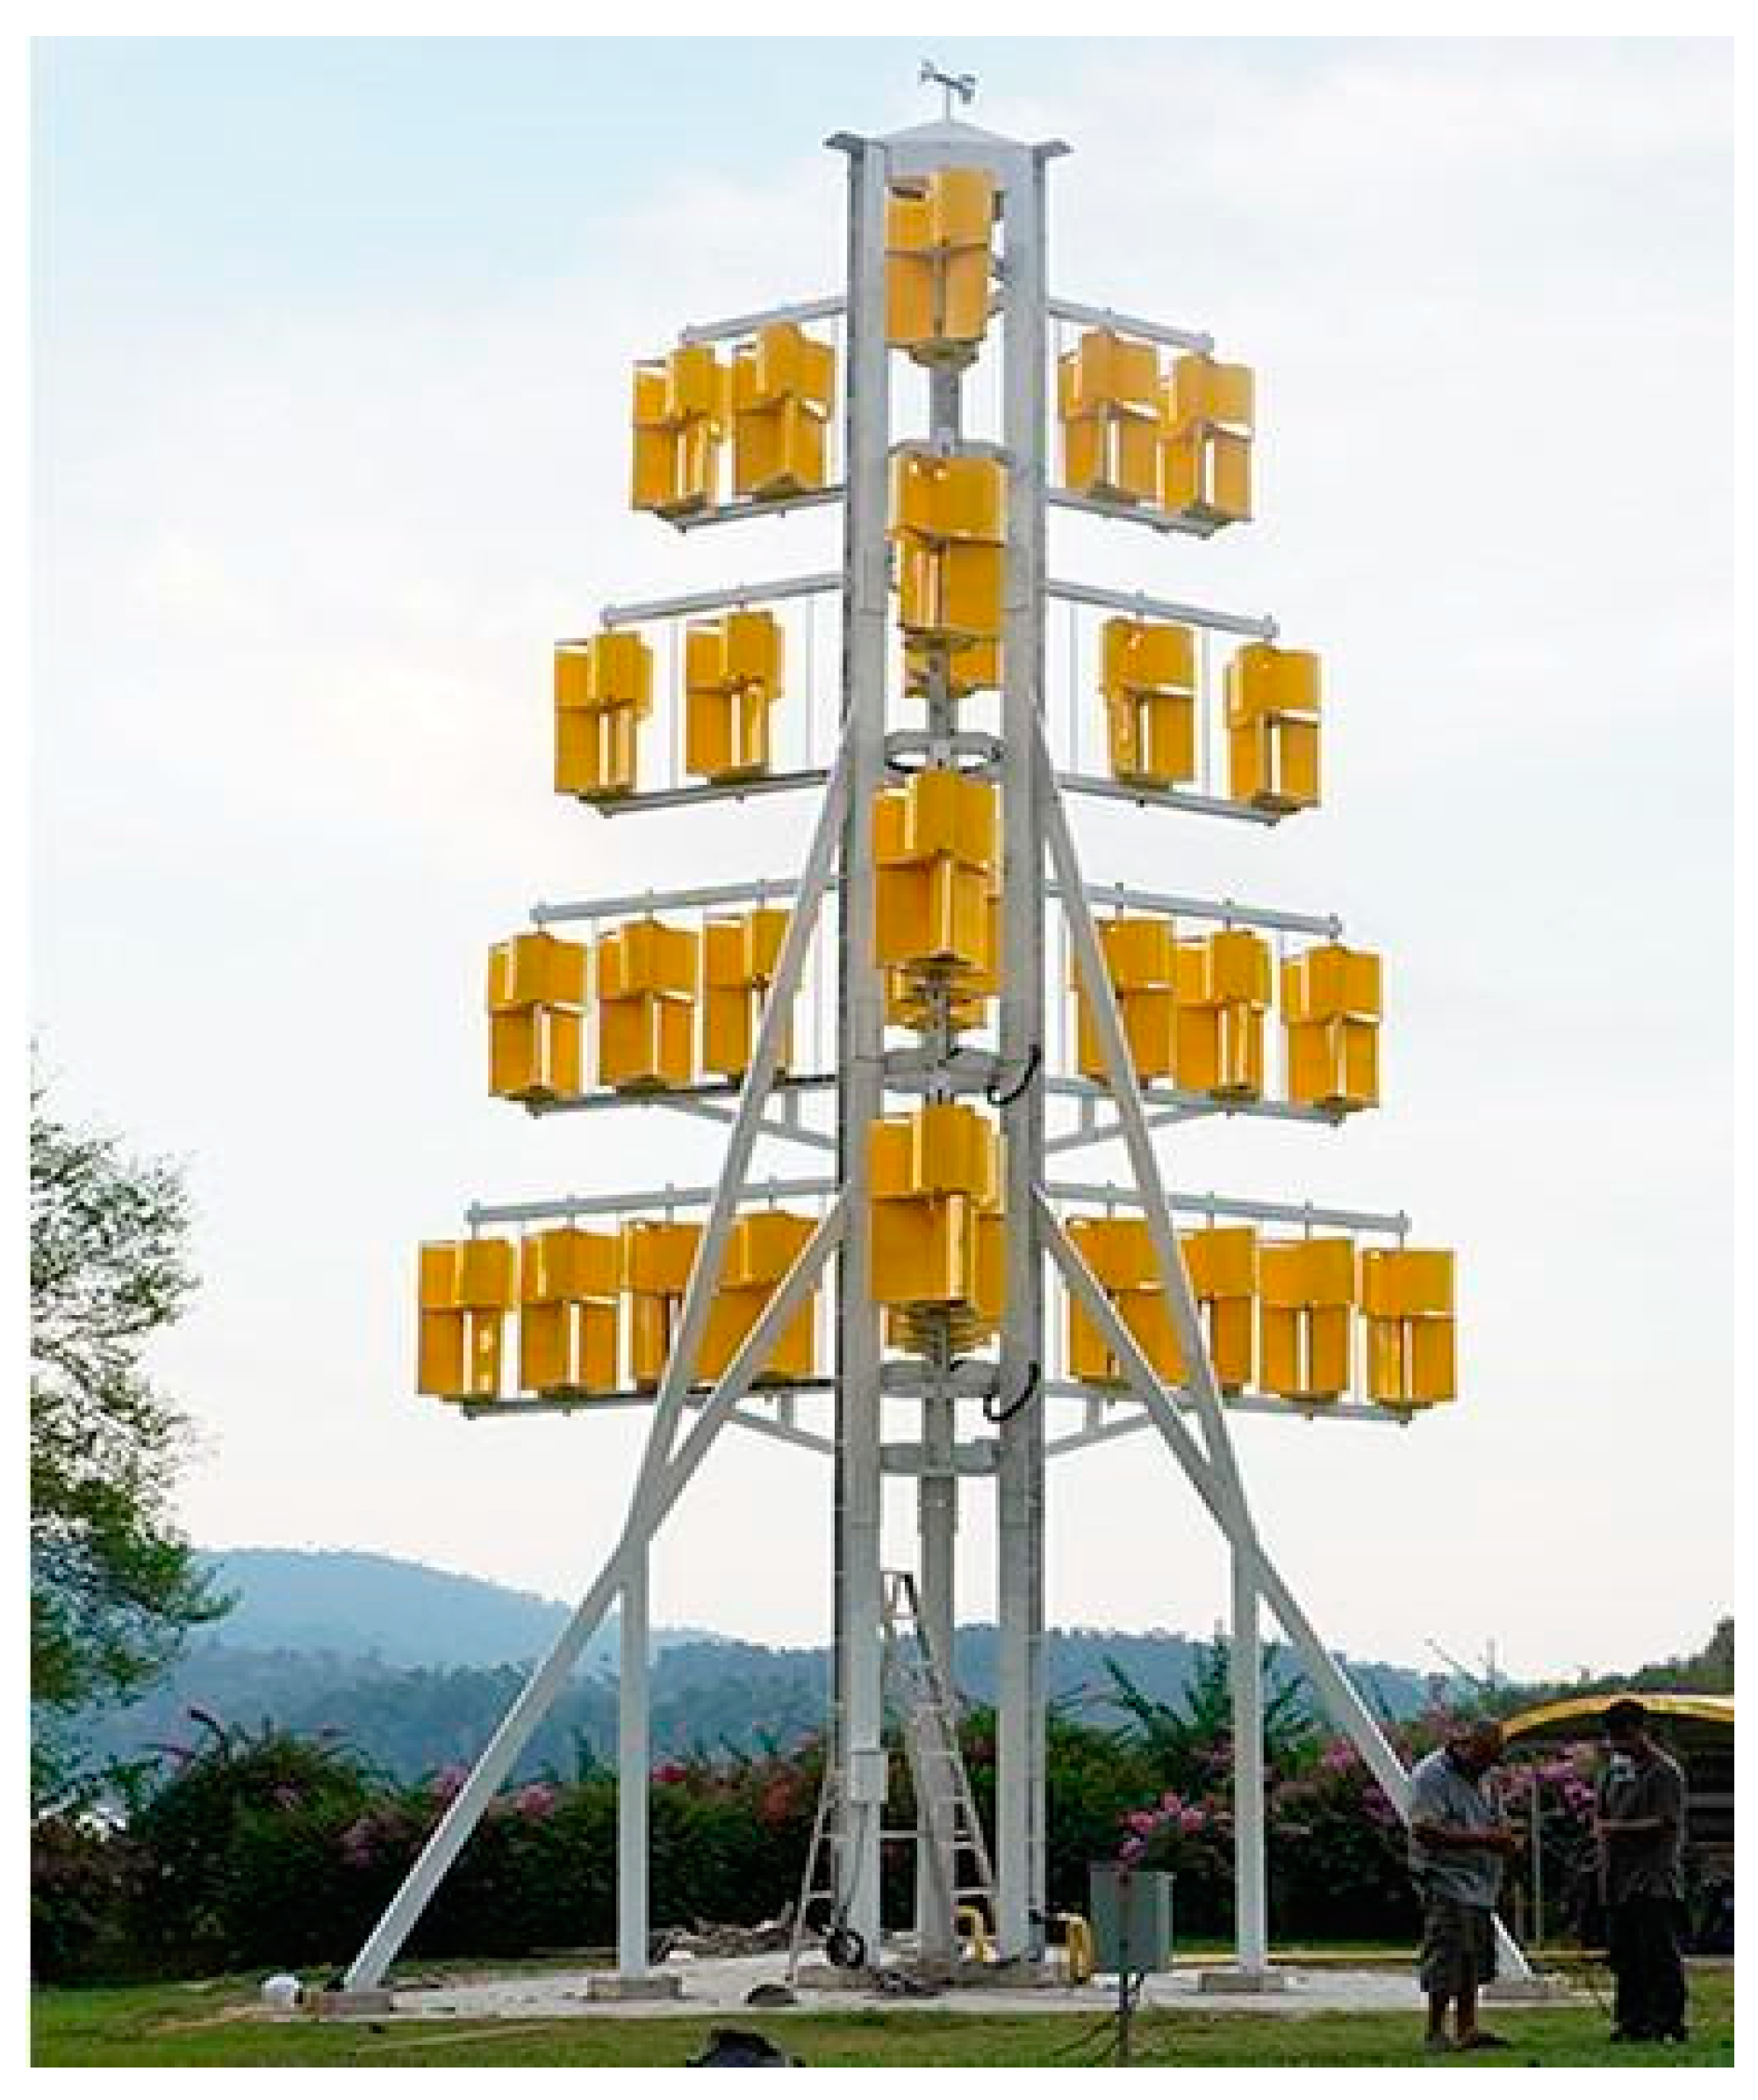
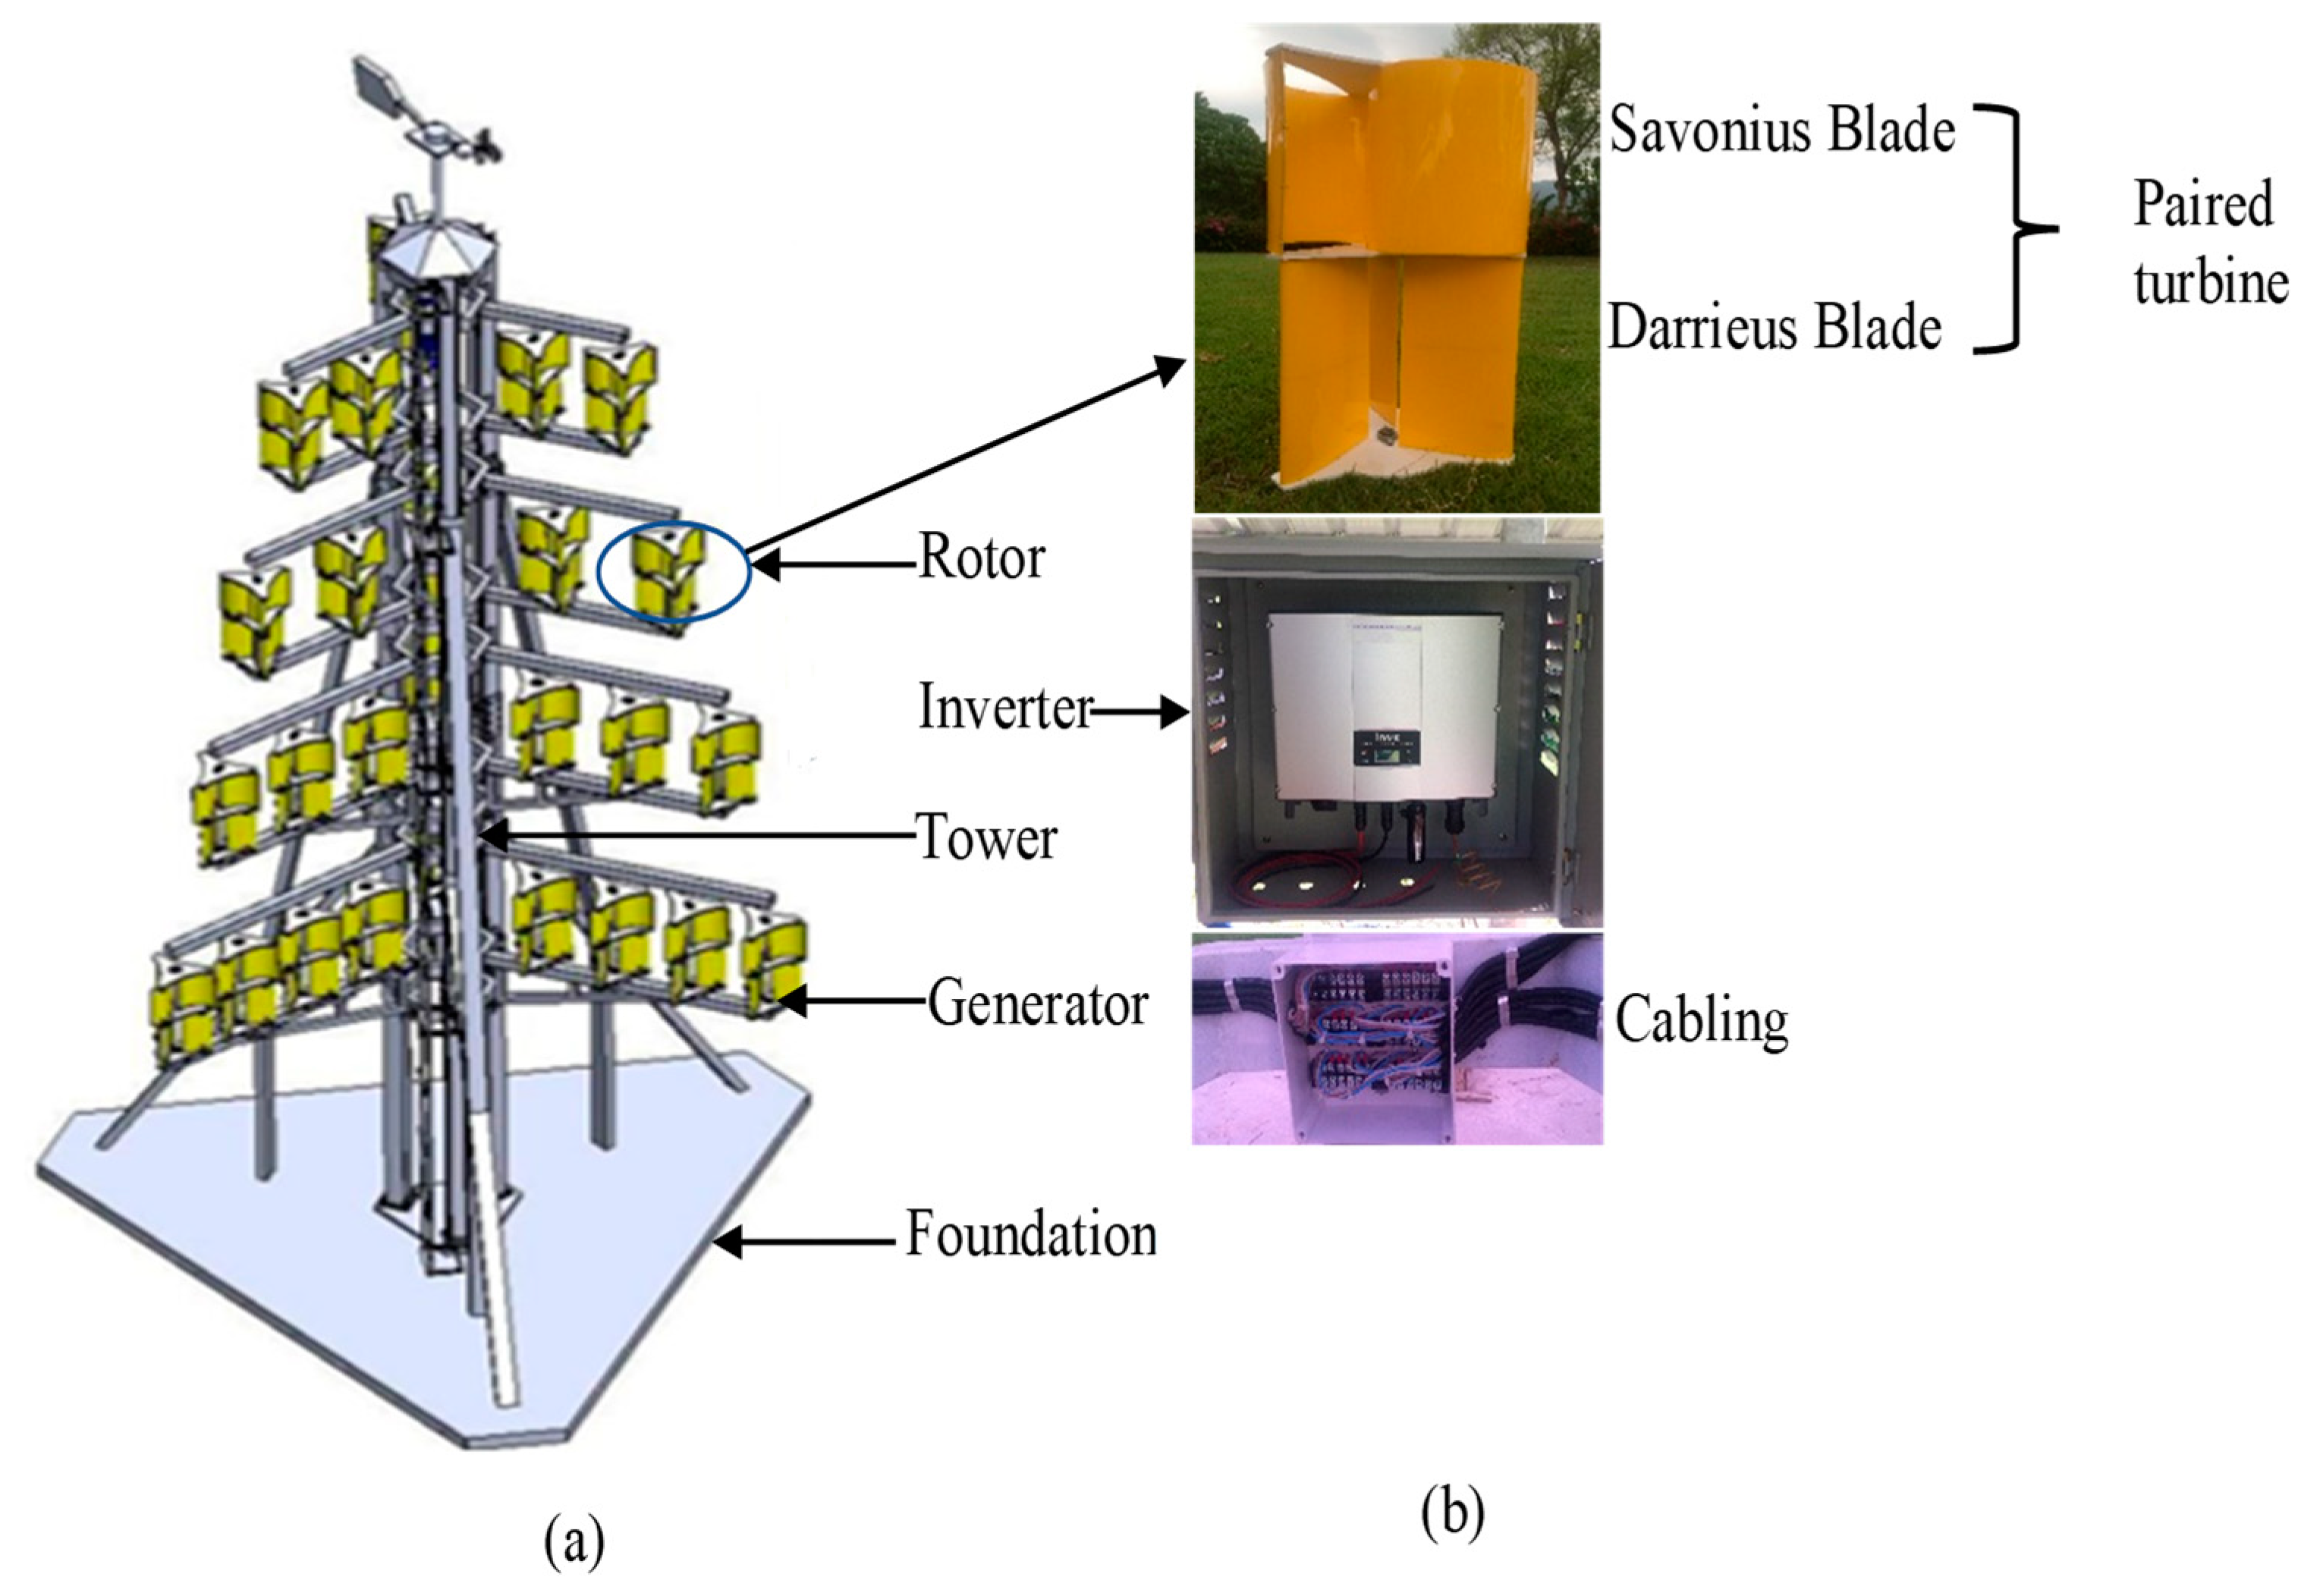
Since Savonius blades offer lower cut-in speeds but lower efficiency than Darrieus blades [18], our turbine tree was designed with combined Savonius-Darrieus turbines (see [19,20]), a design which allows the tree to be used in lower wind situations than Darrieus blades alone, but with higher efficiency than using Savonius blades alone. Additionally, since urban conditions often present complex vortex conditions with varying wind velocity, multiple or stacked turbines can act as out-of-phase generators that reduce moment fluctuations in power [21]. For this reason, a turbine tree of 33 paired turbines was implemented.A turbine tree design, with its repeated use of materials for blades, rotors and generators, may have higher environmental impacts than single turbine designs.
Plastic was used in the design instead of rubber or steel for turbine blades as it was found to have higher performance efficiency [22].The choice of plastic, rather than a more ‘environmentally friendly’ material, may result in higher LCA impacts.
Table 2. Average annual wind speed and capacity factors for Surat Thani and Chiang Mai.
LocationAverage Annual Wind SpeedReferenceCapacity Factor (CF)
Surat Thani2.58 m/sNgoc et al. [23]1.65%
Chiang Mai4.8 m/sChaichana and Chaitep [29]7.58%
Table 3. LCIA Analyses.
AnalysisGoalsSection
Comparison of Scenarios A, B and grid mix (using CML-IA) 1, 2Section 2.3.1
Energy/GHG payback time (CML-IA) (using Equations (2) and (3) below)3Section 2.3.2
Environmental price impacts (using IPCC and ReCIPe 2008, [26] 4Section 2.3.3.1
Mitigative strategies for impacts of concern (CML-IA)5Section 2.3.3.2
Table 4. GDP per capita (2015, USD) used to estimate environmental prices.
CountryGDP (per Capita)Source
Europe25,920Ghani et al. [36]
Thailand5840Macrotrends [37]
Table 5. Changes to CML inputs for Scenarios 1 to 3.
Input/Component ChangedValue in S.T. Base Case ScenarioValue in New Scenario; Scenario Number
Transportation methodLight commercial vehicleTrain; Scenario 1
Material: Turbine bladesGlass fibre-reinforced plasticStainless sheet steel; Scenario 2
Design(a) rotor number3322; Scenario 3
(b) tower weight (kg)2894.432664.012; Scenario 3
Table 6. Scenarios A and B compared with Thailand low-voltage grid impacts (per kWh).
Impact CategoryUnitSurat ThaniChiang MaiThailand
Low-Voltage Grid
Scenarios AScenarios BScenarios AScenarios B
1Abiotic depletionkg Sb eq2.44 × 10−52.43 × 10−55.31 × 10−65.30 × 10−65.54 × 10−7
2Abiotic depletion (fossil fuels)MJ7.716.371.681.398.64
3Global warming (GWP100a)kg CO2 eq6.90 × 10−14.90 × 10−11.50 × 10−11.09 × 10−17.03 × 10−1
4Ozone layer depletion (ODP)kg CFC-11 eq7.03 × 10−86.41 × 10−81.54 × 10−81.40 × 10−82.98 × 10−8
5Human toxicitykg 1,4-DB eq2.362.295.10 × 10−14.99 × 10−12.50 × 10−1
6Fresh water aquatic ecotoxicitykg 1,4-DB eq8.90 × 10−18.70 × 10−11.90 × 10−11.90 × 10−14.30 × 10−1
7Marine aquatic ecotoxicitykg 1,4-DB eq3.28 × 1033.16 × 1037.14 × 1026.87 × 1029.37 × 102
8Terrestrial ecotoxicitykg 1,4-DB eq6.37 × 10−36.08 × 10−31.38 × 10−31.32 × 10−33.50 × 10−3
9Photochemical oxidationkg C2H4 eq3.21 × 10−42.12 × 10−47.00 × 10−54.62 × 10−58.79 × 10−5
10Acidificationkg SO2 eq4.57 × 10−33.90 × 10−39.98 × 10−38.50 × 10−32.03 × 10−3
11Eutrophicationkg PO4 eq2.85 × 10−32.63 × 10−36.21 × 10−45.73 × 10−41.54 × 10−3
Table 7. Component contribution (%) to impacts.
Impact CategoryFoundationGeneratorInverterRotorTowerCable and Controller
S. T.C. M.S. T.C. M.S. T.C. M.S. T.C. M.S. T.C. M.S. T.C. M.
Abiotic depletion 2.543.3141.3041.0137.4037.12 3.57 3.5410.2010.144.924.88
Abiotic depletion (fossil fuels) 16.2020.6433.131.373.623.4319.2018.2326.425.011.401.32
Global warming (GWP100a)22.1025.4024.9023.843.593.4417.5016.7930.6029.301.281.23
Ozone layer depletion (ODP)15.9021.5552.1048.584.454.155.625.2420.418.991.591.49
Human toxicity4.915.2438.0037.874.814.7921.1021.0330.6030.470.600.60
Fresh water aquatic ecotoxicity6.316.7143.3043.118.558.5211.00 10.9229.8029.711.041.04
Marine aquatic ecotoxicity3.884.1869.5069.246.88 6.863.923.9115.0014.930.890.89
Terrestrial ecotoxicity8.819.4921.9021.723.743.719.859.7855.2054.750.550.55
Photochemical oxidation13.2014.4645.9045.264.324.268.107.9927.6027.250.810.79
Acidification11.0012.2355.7054.953.713.6510.7010.5118.0017.720.960.94
Eutrophication9.768.4754.4054.0710.810.774.69 4.6620.80 20.651.391.39
Table 8. Energy and GHG payback time for Surat Thani (CF = 1.65%) and Chiang Mai (CF = 7.58%).
LocationCapacity FactorEnergy Payback Time (EP) (Years)GHG Payback Time (GHGP) (Years)
Surat Thani1.65%54.7728.61
Chiang Mai7.58%12.506.50
Table 9. Environment prices per impact (USD per kWh).
Impact CategorySurat Thani LocationChiang Mai LocationThailand Low-Voltage Grid
Climate change2.30 × 10−25.00 × 10⁻³ 1.7 × 10⁻²
Ozone depletion5.62 × 10−61.30 × 10−61.96 × 10−6
Terrestrial acidification1.8 × 10−24.0 × 10−36.0 × 10−3
Freshwater eutrophication8.89 × 10−41.94 × 10−42.87 × 10−4
Marine eutrophication5.43 × 10−41.19 × 10−42.55 × 10−4
Human toxicity8.1 × 10−21.7 × 10−22.0 × 10−2
Photochemical oxidant formation1.87 × 10−34.16 × 10−47.08 × 10−4
Particulate matter formation5.4 × 10−21.1 × 10−21.3 × 10−2
Terrestrial ecotoxicity9.71 × 10−42.19 × 10−41.19 × 10−4
Freshwater ecotoxicity6.99 × 10−41.53 × 10−45.44 × 10−4
Marine ecotoxicity1.44 × 10−43.15 × 10−59.73 × 10−5
Ionising radiation1.47 × 10−33.32 × 10−41.57 × 10−3
Agricultural land occupation2.42 × 10−35.27 × 10−42.00 × 10−3
Urban land occupation9.13 × 10−42.11 × 10−45.87 × 10−5
Total1.87 × 10−14.10 × 10−26.40 × 10−2
Table 10. LCA results for three Scenarios, 1 to 3 and CF = 7.58% (S.T. base case impacts = 1).
ScenarioImpact Category
Abiotic Depletion (Fossil Fuels)Global WarmingOzone Layer DepletionHuman Toxicity
S.T. base case1.001.001.001.00
Scenario 1: Transport—(train replaces light commercial vehicle)0.910.930.880.99
Scenario 2: new material (stainless steel sheet replaces glass-fibre-reinforced plastic)0.930.951.001.02
Scenario 3: new design (tree, less one ‘arm’)0.800.830.790.77
Chiang Mai location (CF = 7.58%)0.220.220.220.22
Table 11. Scenarios 1 to 3 vs. Surat Thani, Chiang Mai base cases and Thai low voltage mix impacts (per kWh). Light green indicates values less than the S. T. base case only; dark green indicates values less than both the S. T. base case and the Thai low voltage mix.
Base Case Surat ThaniBase Case Chiang MaiScenario 1: TrainScenario 2: New MaterialScenario 3: New DesignThai Low-Voltage Grid
Abiotic depletion2.44 × 10−35.31 × 10−62.42 × 10−52.45 × 10−51.88 × 10−55.54 × 10⁻⁷
Abiotic depletion (fossil fuels)7.711.6837.0137.1376.1628.638
Global warming 6.89 × 10−11.5 × 10−16.43 × 10−16.57 × 10−15.71 × 10−17.03 × 10−1
Ozone layer depletion 7.03 × 10−81.54 × 10−86.18 × 10−87.00 × 10−85.52 × 10−82.98 × 10−8
Human toxicity2.365.14 × 10−12.352.421.832.45 × 10−1
Fresh water aquatic ecotoxicity8.99 × 10−11.95 × 10−18.95 × 10−19. 06 × 10−17.05 × 10−14.27 × 10⁻¹
Marine aquatic ecotoxicity3.28 × 1037.14 × 1023.27 × 1033.28 × 1032.40 × 1039.37 × 102
Terrestrial ecotoxicity6.40 × 10−31.40 × 10−36.30 × 10−36.40 × 10−35.40 × 10−33.50 × 10⁻³
Photochemical oxidation3.21 × 10−47.00 × 10−53.15 × 10−43.28 × 10−42.56 × 10−48.79 × 10⁻⁵
Acidification5.00 × 10−39.98 × 10−44.00 × 10−34.00 × 10−33.00 × 10−32.00 × 10⁻³
Eutrophication3.00 × 10−36.21 × 10−42.00 × 10−33.00 × 10−32.00 × 10−31.00 × 10⁻³
Table 12. CF values for impacts equivalent to Thai grid.
Impact CategoryS.T. (CF)C.M. (CF)
Abiotic depletion72.6272.49
Abiotic depletion (fossil fuels)1.471.22
Global warming 1.621.17
Ozone layer depletion 3.893.57
Human toxicity15.9215.42
Fresh water aquatic ecotoxicity3.483.36
Marine aquatic ecotoxicity5.785.56
Terrestrial ecotoxicity3.012.87
Photochemical oxidation6.033.99
Acidification3.733.18
Eutrophication3.062.82
Table 13. Summary of life cycle analyses, results and conclusions/recommendations.
AnalysisResultsConclusions/Recommendations
CML-IA base case analysis, Scenarios A, B (no end-of-life, end-of-life treatment)In Surat Thani, (CF = 1.65%), Scenario A and B impacts usually higher than Thai grid, only lower for global warming and abiotic depletion (fossil fuels); in Chiang Mai, (CF = 7.58%), Scenario A and B impacts usually lower than Thai grid, only higher for human toxicity and abiotic depletion; recycling and reuse is effective (Scenario B impacts always lower than Scenario A); end-of-life treatment lowers impacts (both locations) by an average of 11%This VAWT has environmental benefits. Site selection is important. Regarding impacts, the VAWT outperformed the Thai grid at CF = 7.58% but underperformed the grid at CF = 1.65%. CF > 4% recommended to halve impacts. Recycling and reuse strategies should be incorporated into planning. Materials with higher recycling potential should be used.
Component Contribution to ImpactsTower and generator dominate impacts in 10 of 11 categories.Research into material alternatives or structural redesign, especially with respect to tower and generator.
Energy and GHG Payback TimesAt CF = 7.58%, energy and GHG payback times are within estimated VAWT lifespan, but exceed lifespan for CF = 1.65%. CED indicates tower and generator deplete renewables and non-renewables the most.Installation at locations of higher windspeed (CF > 4%) is desirable. Research alternate materials for tower and generator.
Environmental PricesMonetizing impacts with environmental prices indicate four impact categories (human toxicity, particulate matter formation, climate change and terrestrial acidification) account for the majority (94% or 95%) of costs. These percent contributions are independent of CF.Research into design, materials and transportation alternatives to mitigate costs from climate change, particulate matter, human toxicity and terrestrial acidification impacts.
Mitigative Alterations to Life Cycle (Scenarios 1 to 3)—effects on GHG, Human Toxicity, Ozone Depletion, Abiotic Resource Depletion; Grid impact CF equivalents.The ranking of the potential of mitigative alterations to make the VAWT more environmentally friendly (than grid impact values) is: 1. CF, 2. design changes, 3. transportation changes, 4. material changes (in that order). CF = 4% means at least 60% of impact categories are less than grid impact values.During planning, consider CF at site with respect to cut-in, rated wind speed, and calculate the CF necessary to achieve impacts equivalent to or less than grid impacts. Consider prevailing wind direction at site with respect to redesigns. Optimize transportation to reduce fossil fuel consumption.
Publisher’s Note: MDPI stays neutral with regard to jurisdictional claims in published maps and institutional affiliations.

