Article

Optimization Approach for Planning Soft Open Points in a MV-Distribution System to Maximize the Hosting Capacity

by
Ricardo de Oliveira
*,
Leonardo Willer de Oliveira
and
Edimar José de Oliveira
Electrical Energy Department, Federal University of Juiz de Fora, Juiz de Fora 36036 900, Minas Gerais, Brazil
*
Author to whom correspondence should be addressed.
Energies 2023, 16(3), 1035; https://doi.org/10.3390/en16031035
Submission received: 29 November 2022 / Revised: 7 January 2023 / Accepted: 14 January 2023 / Published: 17 January 2023
(This article belongs to the Special Issue New Challenges in Electrical Power Distribution Networks)

Abstract

:
Distributed energy resources (DERs) based on renewable power, such as photovoltaic (PV), have been increasing worldwide. To support this growth, some technologies have been developed to increase the hosting capacity (HC) of distribution networks (DNs), such as the Soft Open Point (SOP), which can replace normally open switches in DNs with the advantage of allowing power and voltage control. The benefits of SOPs in terms of increasing distributed generation (DG) hosting capacity can be enhanced by network reconfiguration (NR). In this work, an optimization-based approach is proposed for placing SOP in DN with simultaneous NR; that is, the proposed algorithm consists of a promising alternative to previous works in the literature that deal with SOP placement and NR in an iteratively way or in a two-step procedure, considering that better results can be obtained by simultaneously handling both options, as shown in the introduced case studies. The optimization problem is modeled as nonlinear mixed-integer programming, and solved by a Multi-objective Artificial Immune System (MOAIS). The proposed algorithm is applied to a well-known medium-voltage (MV) test system that is widely used for the problem at hand, and the results show the effectiveness of the proposed approach to maximize the HC by optimizing the SOP installation site in the tested system. An important outcome is that the association of SOP planning and NR in a simultaneous manner tends to provide better quality solutions, where HC can overcome 400% for multiple SOPs. Another outcome is that the proposed MOAIS is able to provide good concurrent solutions to support the decision-making of the DN planner.

1. Introduction

In recent years, topics such as sustainable development and energy transition have been relevant worldwide. In this scenario, the development of generation plants based on renewable energy plays an important role in reducing the negative impact of fossil fuels and greenhouse gas emissions. Data provided by REN21 [1] show that the share of renewable energy in electricity generation rose from 20.4 % in 2011 to 28.3% in 2021. The annual addition of renewable power capacity was around 315 GW in 2021, of which at least 175 GW was related to photovoltaic (PV) [2].
Due to the current scenario and the perspective of increasing DER penetration, the concept of HC has become important for distribution system operators (DSOs) and other players, since HC represents the system capacity to host DG without exceeding the system’s operational limits [3]. Many strategies have been proposed in the literature to enhance HC, such as: energy storage systems, static var compensators, network reconfiguration (NR), smart inverters, on-load tap changer control, network reinforcement and soft open points (SOPs). A recent review of these strategies is provided in [4].
SOPs are power electronic devices that are placed at normally open points of DNs to provide flexible and accurate power and voltage control. The first studies that addressed the application of SOPs analyzed their benefits for the operational performance of DNs. In [5], the benefits of improving the voltage profile, feeder load balancing and reducing losses were discussed in detail. In [6], the optimal placement and sizing of SOPs was achieved through mixed integer non-linear programming (MINLP) that considers the equipment cost to minimize the DN energy loss and the SOPs capital/operation costs. In [7], the same performance metrics as adopted in [5] were assessed in a multi-objective optimization-based framework, in which the integration of two metaheuristics to determine the optimal operation of SOP was proposed. Furthermore, variations in the objective functions with increased DG penetration were compared and discussed, considering the network without SOP, with one SOP and the NR optimization. An overview of benefit quantification of SOPs to distribution systems was found in [8].
Due to the increase in DERs, some studies have addressed the SOP capability of enhancing HC, as in [9], where it was considered to link two feeders. Similarly, two SOPs with predefined placements and capacities were investigated in [10] to maximize HC. In [11], a metaheuristic was used to maximize DG penetration by installing one SOP replacing a tie-switch. The SOP size was kept fixed and the case studies considered DG in different positions. The increase in DG penetration using NR and SOPs was evaluated and discussed in [12]. Two metaheuristics were applied, one being for the NR problem and the other to optimize the SOP operation in an iterative manner. A nonconvex nonlinear programming problem was presented in [13] to maximize HC by SOPs, also having predefined places and sizes. The case studies were performed with the SOP size and location kept fixed. In [14], a metaheuristic was proposed to solve the NR problem, the SOP allocation or the combination of both, with HC maximization defined as a single objective. To assess both options, a two-stage approach was adopted, where NR was carried out first, and then the SOP was planned and allocated based on the reconfigured network. Moreover, the optimization-based approach of [14] handled uncertainties presented by renewable-based DGs and loads. Previous studies did not address HC maximization as a multi-objective problem; that is, the cost of SOPs was not considered.
Multi-objective approaches have also been proposed in the literature [15,16,17,18]. A weighted multi-objective function was presented in [15], aimed toward achieving three goals: to minimize total power loss, load balancing and fast voltage stability indexes. DG and SOP allocation is carried out using a metaheuristic after the NR process. However, HC maximization is not among the objectives. In [16], the SOP placement was based on the results of the NR process to maximize DG penetration. The Pareto method was used to provide a set of trade-off solutions among different objectives: minimize power loss and maximize the load balance and DG penetration level. However, [16] did not conduct SOP sizing. Another work that jointly and iteratively addressed NR and SOP allocation within a multi-objective optimization was presented in [17], by applying a metaheuristic and a weighted objective function formed by the following criteria: HC, power loss, load balancing and voltage stability. However, SOP costs were not considered. In [18], a multi-objective bilevel optimization was proposed where SOPs and NR were also iteratively optimized. The first level sought to maximize HC and minimize the total cost associated with the SOPs and system power loss, and the second level was dedicated to NR. Metaheuristics were proposed at both levels.
As investigated in previous studies, the combination of SOP and NR maximizes the benefits of both, since NR can change the topology and the set of tie switches. Thus, as the SOP allocation considers the tie switches’ places as a candidate by which to receive SOP, the NR can provide better solutions. Therefore, SOP optimization and NR are complementary strategies to maximize HC. However, in all studies, SOP optimization and NR are achieved in an iterative manner; that is, through a step-by-step procedure, where SOP optimization is performed in one step, and NR is carried out in the other.
A summary of the previously detailed single- and multi-objective optimization approaches is presented in Table 1. In the column “SOP allocation—Site”, the term “Limited” means that a limited set of branches are considered to receive SOPs. In the column “SOP allocation—Size”, the term “Predefined” means that the size is not optimized, but it is set at a predefined rated power. In the column “NR and SOP allocation”, “Two step” means that NR is carried out first and SOP allocation is performed after NR; “Iterative” means that these tasks are iteratively performed, one after the other until a convergence criterion is reached; “Simultaneous” means that these efforts are simultaneously optimized, which tends to provide better results, as shown in the introduced case studies, and dispenses of the need for defining convergence criteria that may be non-optimal. From Table 1, the contribution of the proposed approach is to provide a simultaneous method that considers the HC, loss and cost criteria, in addition to optimizing the site and size of the SOP. PLoss denotes system active power loss.
The present paper proposes a multi-objective metaheuristic approach to optimal SOP placement in DN together with NR. The novelty is that the proposed algorithm solves the SOP optimization and NR problems in a single step; the problems are simultaneously solved, which tends to improve the set of Pareto nondominated solutions, as shown in the introduced results. The multi-objective algorithm is based on the single-objective method from [19], and is called the Multi-objective Artificial Immune System (MOAIS). The single-objective method of [19], known as the Artificial Immune System (AIS), is a bio-inspired meta-heuristic that is able to handle the NR problem in DNs. In [19], it is applied for energy loss minimization. The same objective under uncertainties regarding load demand and wind-based DG was considered in [20], where interval loss was used to guide the AIS algorithm through the search space. In [21,22], the AIS was applied to solve the NR problem under the distribution system expansion planning perspective, considering investment, operation, carbon dioxide emission and reliability costs, as well as uncertainties regarding load and wind-based DG. Thus, the algorithm of [19] was considered because it is appropriate for NR and, thus, can handle the DN topological constraints of radiality and connectivity. It must be highlighted that the multi-objective version of AIS, MOAIS, is a novelty of the present work. In the present paper, SOP allocation comprises the optimal placement, where the installation site is decided by the MOAIS algorithm and the optimal operation of SOP is achieved by a nonlinear optimal power flow (OPF) embedded in MOAIS. Case studies were carried out on a well-known medium-voltage (MV) system, widely used in the context of the problem at hand, to confirm the applicability of MOAIS and its effectiveness. Therefore, the main contributions of this work are:
  • A novel multi-objective algorithm to simultaneously solve SOP optimization and network reconfiguration in a single step, which tends to provide a better Pareto set of concurrent solutions, as shown in the introduced case studies;
  • A novel multi-objective algorithm named MOAIS that combines the capability of the method from [19] to solve the NR problem with the potential of the Pareto method to obtain concurrent nondominated solutions;
  • In the literature, only the work of [18] proposed a multi-objective tool that had HC maximization and SOP cost minimization as goals. However, optimization was achieved in a step-by-step method, as previously described. However, the present paper intends to contribute to the literature regarding SOP planning under the HC and inherent cost standpoints.
In addition to this introductory section, the paper has other four sections: Section 2 provides a background comprising the SOP operation, the single-objective AIS from [19] and the Pareto method; Section 3 presents the proposed methodology and multi-objective algorithm; the case studies are discussed in Section 4, and Section 5 provides the main conclusions.

2. Background

This section presents a brief description on the SOP operation model, the single-objective AIS from [19] and the Pareto method [23].

2.1. SOP Operation Model

An SOP is a power electronic device that can replace normally open switches in DNs and is able to transfer active power flow between adjacent feeders, as well as compensating reactive power through its connecting busses. A general representation of an SOP in an MV distribution network is shown in Figure 1, where the back-to-back voltage source converter (VSC) topology adopted in this work is illustrated.
The relevant variables in Figure 1 for the SOP model are:
P I S O P , P J S O P SOP active powers at terminals I and J, in p.u., respectively.
Q I S O P , Q J S O P SOP reactive powers at terminals I and J, in p.u., respectively.
Based on the representation of the SOP from Figure 1, the connection terminals I and J belong to adjacent feeders. The SOP operation can be modeled as [5,15]:
P I S O P + P J S O P = 0
P I S O P 2 + Q I S O P 2 S I S O P
P J S O P 2 + Q J S O P 2 S J S O P
where:
S I S O P , S J S O P rated power of VSCs connected to terminals I and J, in p.u., respectively.
Equation (1) represents the internal power balance constraints of SOP; Equations (2) and (3) provide the SOP capacity constraints. In the present work, the internal power loss of the SOP is neglected due to its loss coefficient of around 0.02 [6,18], which is relatively low compared with the system loading condition.

2.2. Single-Objective AIS Algorithm

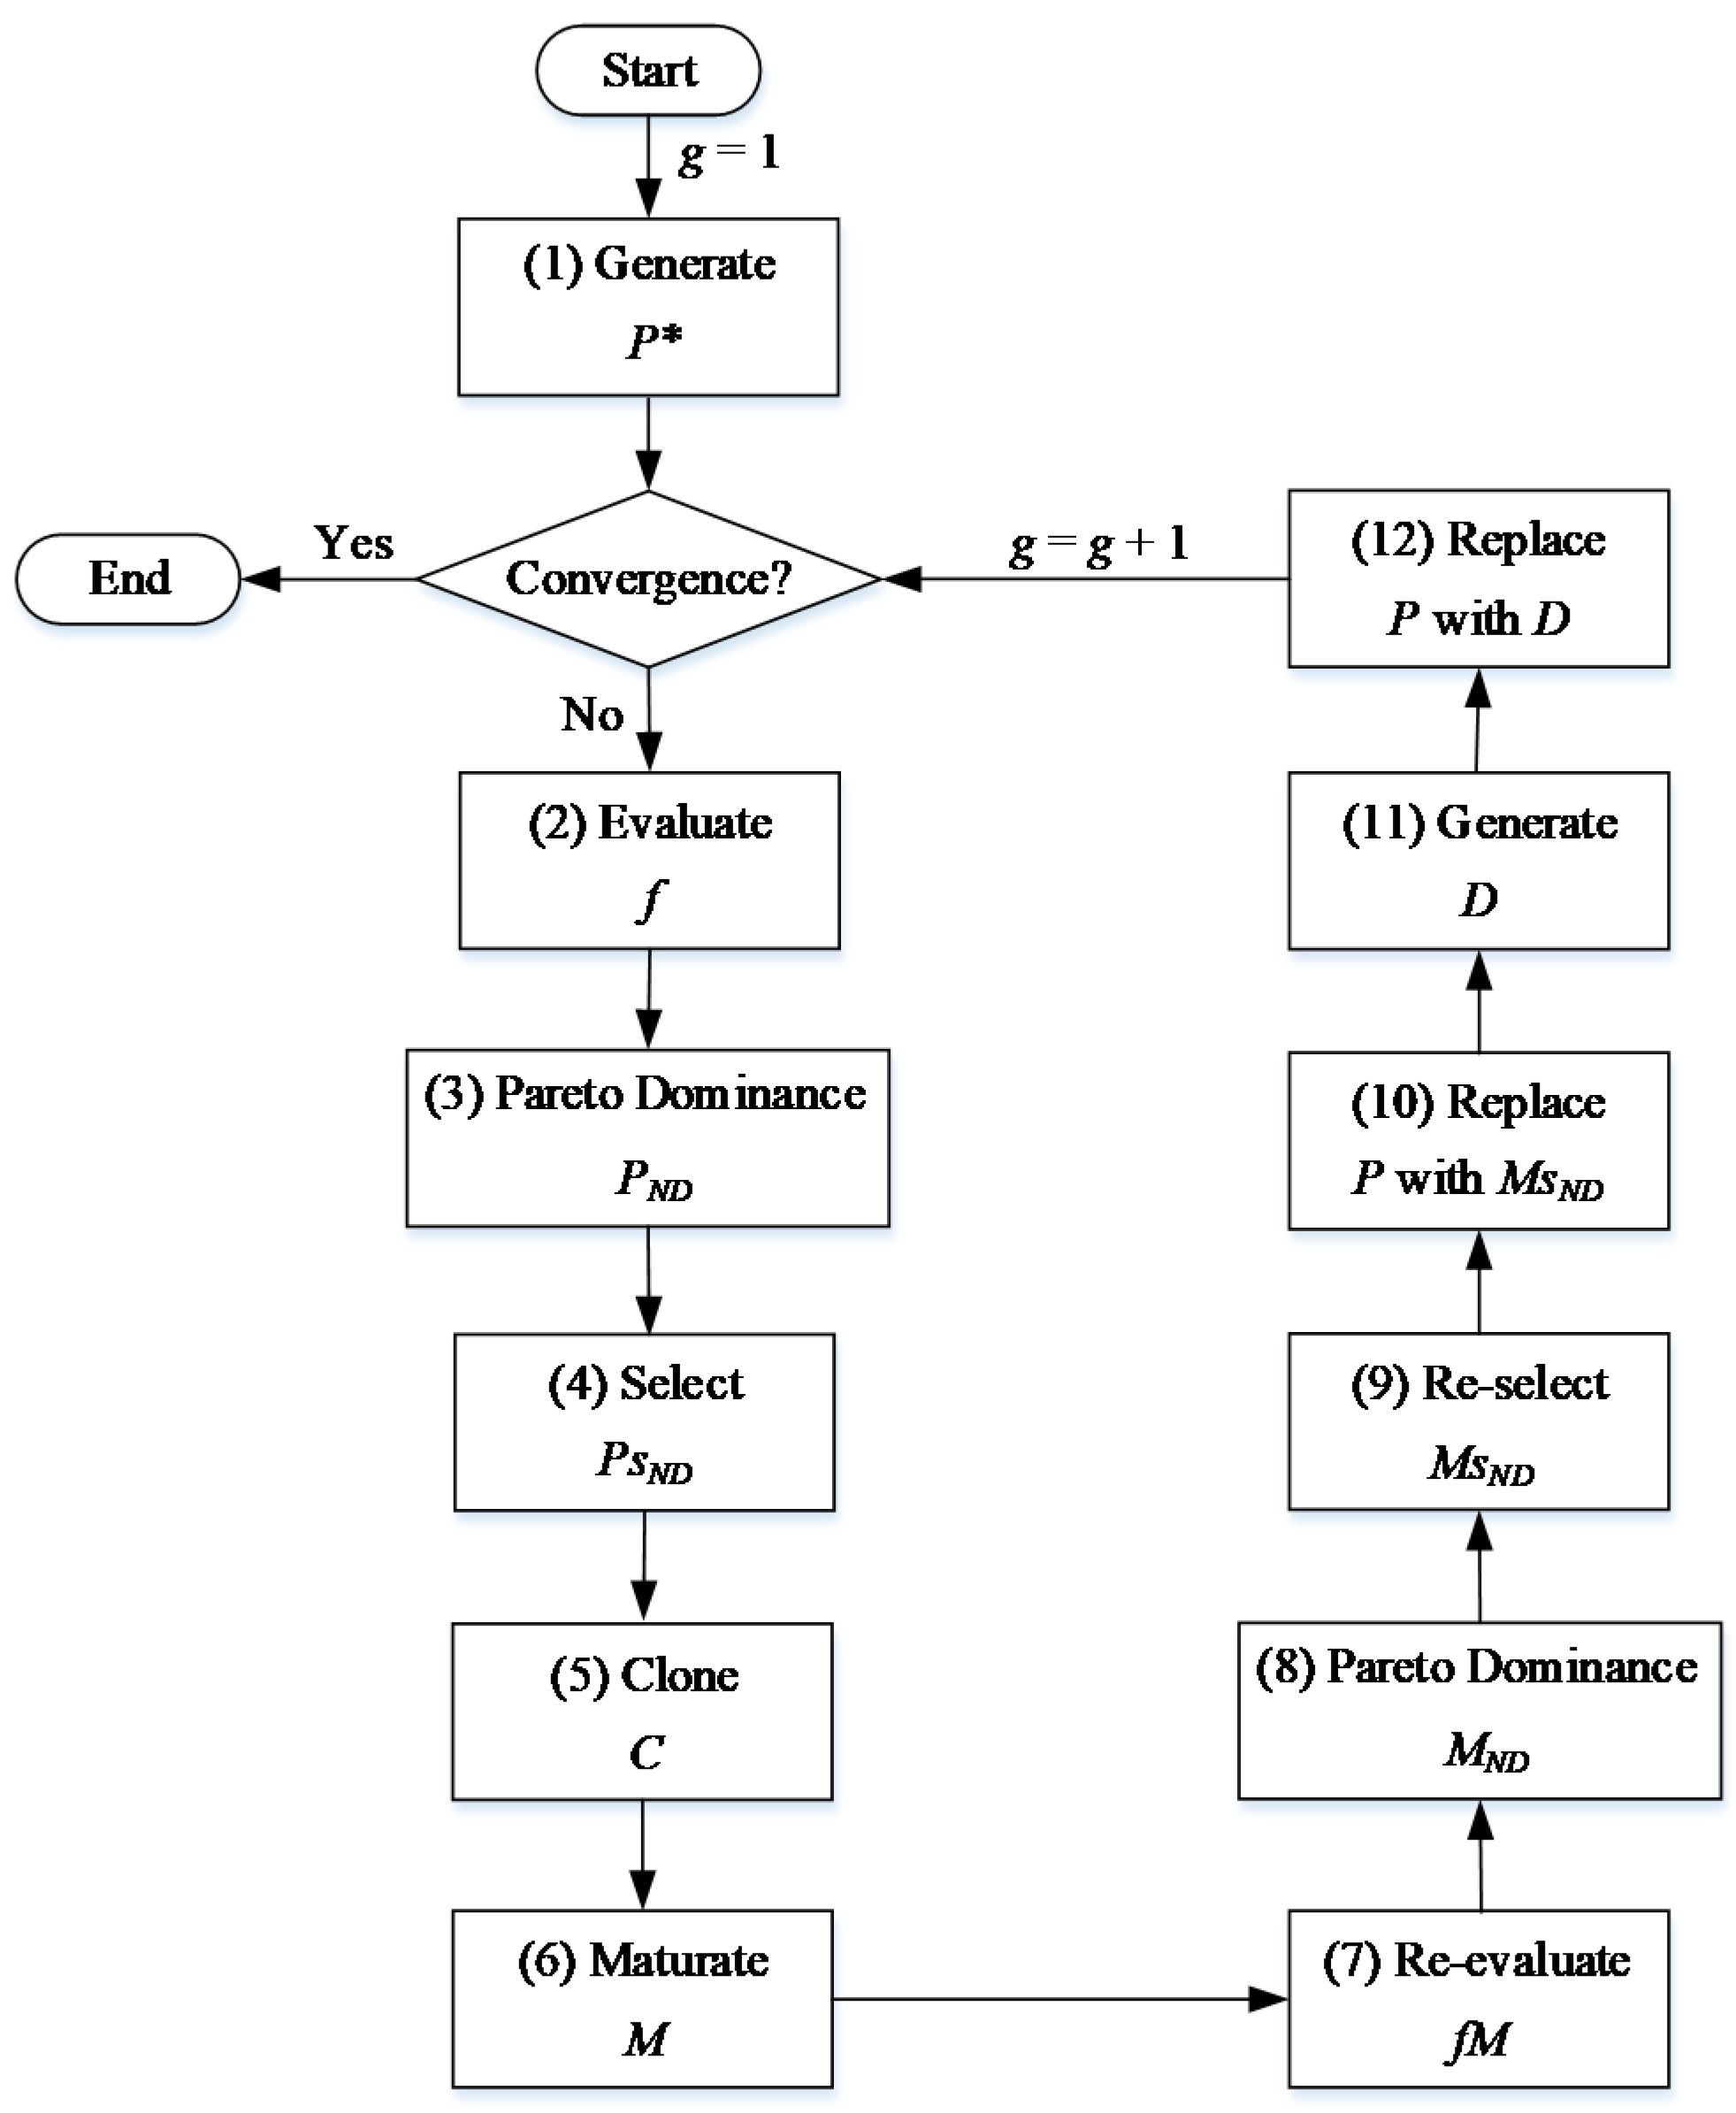
The AIS algorithm from [19] is named CLONR, and is based on the clonal selection algorithm of [24] for combinatory problems. However, CLONR is appropriate for the reconfiguration problem. Therefore, the size L of a candidate solution, named as the antibody in AIS, is equal to the total number of maneuverable switches in DN. Figure 2 shows the flowchart of the CLONR algorithm and its steps are summarized below.
Step (1): Consists of the generation of the initial set of solutions (P*) at the first step, g = 1, named as generation in AIS/CLONR. All solutions in this set meet the radiality and connectivity constraints by using the branch exchange process [25,26,27] in the initial radial configuration.
Step (2): Evaluates the fitness, or affinity in AIS, of the current set of solutions, or repertoire P*.
Step (3): Selects the n best solutions from P* to form Ps.
Step (4): The Ps set is subjected to the cloning process, where the number of clones of a given solution is proportional to its fitness or affinity. The set of clones C is obtained.
Step (5): Consists on the somatic hypermutation, or simply, the mutation process, that seeks to provide changes in the solutions of C to improve the search space coverage. The mutation probability of a solution is inversely proportional to this affinity to try and introduce more variations in the worst solutions. Set M is formed, maintaining the radiality and connectivity of its solutions by applying the branch exchange method to the configurations sorted for mutation from C [25,26].
Step (6): Similar to Step (2) to evaluate the M affinity.
Step (7): Similar to Step (3) to form Ms from M.
Step (8): Substitutes the worst solutions of P for the solutions of Ms.
Step (9): Generates d solutions as described in Step (1) to obtain set D.
Step (10): Substitutes the worst d solutions of P by the solutions of D.
Notice that Steps (5)–(10) seek to introduce diversity in the solution set P, aiming to enhance the search in the solution space. After Step (10), the convergence condition is verified and the algorithm ends when one of the following criteria is reached: (i) the number of generations reaches the limit gmax; or (ii) the best solution of P remains the same over gest iterations. In the case of no convergence, the algorithm returns to Step (2).

2.3. Pareto Method

The Pareto dominance criteria [23] are applied to provide concurrent solutions for a multi-objective optimization problem. These criteria are defined hereinafter.
Criterion 1. Pareto Dominance.
Supposing two solutions, X and Y, X dominates Y (denoted as X > Y) if
f k ( X ) f k ( Y ) , k [ 1 , 2 ]
Criterion 2. Pareto Optimality.
A solution X is called Pareto-optimal if
Y   |   f k Y f k X   k 1 , 2
Notice that a set with Pareto-optimal solutions is called a Pareto optimal front.

3. Proposed Approach

3.1. HC Maximization Model

The nonlinear programming model to maximize HC in radial DN can be modeled as:
max H C = u n d g P u D G / v n l p P l v
Subject to:
P g k P l k + P k S O P + P k D G + m Ω k C H k m P k m = 0
Q g k Q l k + Q k S O P + m Ω k C H k m Q k m = 0
C H k m = 0 or 1
Z ¯ min Z ¯ Z ¯ max
where:
ndgSet of DG units;
nlpSet of load busses;
P u D G Active power injected by the uth DG unit, in p.u.;
Ω k Set of busses directly connected to bus k;
CHkmValue associated with maneuverable switch k-m;
Pgk, QgkActive and reactive injections at bus k, respectively, in p.u.;
Plk, QlkActive and reactive power load at bus k, in p.u., respectively;
Pkm, QkmActive and reactive power flow through branch k-m, in p.u., respectively;
P k D G DG active power injected at bus k, in p.u.;
P k S O P , Q k S O P SOP active and reactive powers at bus k, in p.u., respectively;
Z ¯ Vector containing the other OPF variables that have lower and upper limits, in p.u.; and
Z ¯ min , Z ¯ max Vectors containing the lower and upper limits, in p.u., respectively, of the variables Z ¯ .
Equation (6) defines the first objective function of the reconfiguration problem with SOP placement, which represents the maximization of the DG hosting capacity in the system. Equations (7) and (8) correspond to the constraints of nodal active and reactive power balance, respectively, where Pgk and Qgk refer to the power from the substation to the radial distribution network if bus k is a substation; otherwise, Pgk and Qgk are equal to zero. Constraint (9) shows that the switch modeling in the formulated problem implies the treatment of the discrete variables CHkm. Notably, the DGs are modeled as injections with a unitary power factor, and thus the DG reactive power is not considered in (8).
The unit value for CHkm indicates the closed branch k-m, while CHkm = 0 indicates an open branch. Due to the presence of these variables, the reconfiguration problem has a combinatory and large-scale nature for real systems. All other optimization variables have their limits established in (10). This set of constraints includes the nodal voltage limits and currents through the network branches.

3.2. Total Power Losses

The total DN power loss is formulated as:
P L o s s = k = 1 n b u s m Ω k C H k m g k m V k 2 + V m 2 2 V k V m cos ( θ k m )
where:
nbusTotal number of busses;
gkmConductance of branch k-m, in p.u.;
VkVoltage magnitude at bus k, in p.u.; and
θkmPhase angle between busses k and m, in radians.

3.3. Total Annual Cost Formulation

The total annual cost takes into account the capital (CCap) and operational (COper) costs of SOPs as [6,18]:
C T o t = C C a p + C O p e r
C C a p = λ ( 1 + λ ) q ( 1 + λ ) q 1 c S O P S b 1000 i = 1 n s o p max ( S I S O P i , S J S O P i )
C O p e r = α c S O P S b 1000 i = 1 n s o p max ( S I S O P i , S J S O P i )
where:
λDiscount rate;
qSOP lifetime, in years;
cSOPSOP capital cost per unit capacity, in $/kVA;
SbBase power of the system, in MVA;
αCoefficient of the annual operational costs.
Regarding the cSOP parameter, although there is a scalability aspect in real applications that implies a nonlinear behavior of the cost in relation to the equipment capacity, the present work considers a linear behavior ($/kVA) to provide the same handling as the literature [6,18], and thus to conduct a proper assessment under premises from the literature.

3.4. Proposed MOAIS Algorithm

The proposed MOAIS algorithm seeks to optimize the objective functions f1, f2 and f3 of Equations (15)–(17), respectively, where f1 consists of the HC formulated in Equation (6), f2 is the total power losses in the distribution system and f3 consists of the total annual cost of the planned SOPs. It must be highlighted that f1 is subject to constraints (7)–(10), as previously described, and that f2 and f3 are calculated after solving model (6). In particular, f3 is obtained as a function of the variables S I S O P i and S J S O P i .
f 1 = max H C
f 2 = min P L o s s
f 3 = min C T o t
For the application of the Pareto method, k ∈ [1,2,3] in Equations (4) and (5) relate to the three previous objective functions f1, f2 and f3. The MOAIS steps follow the same basic structure of the single-objective AIS in Figure 2, but with particularities developed to consider the multi-objective feature and the SOP allocation together with NR, resulting in the algorithm in Figure 3, the steps of which are described below.
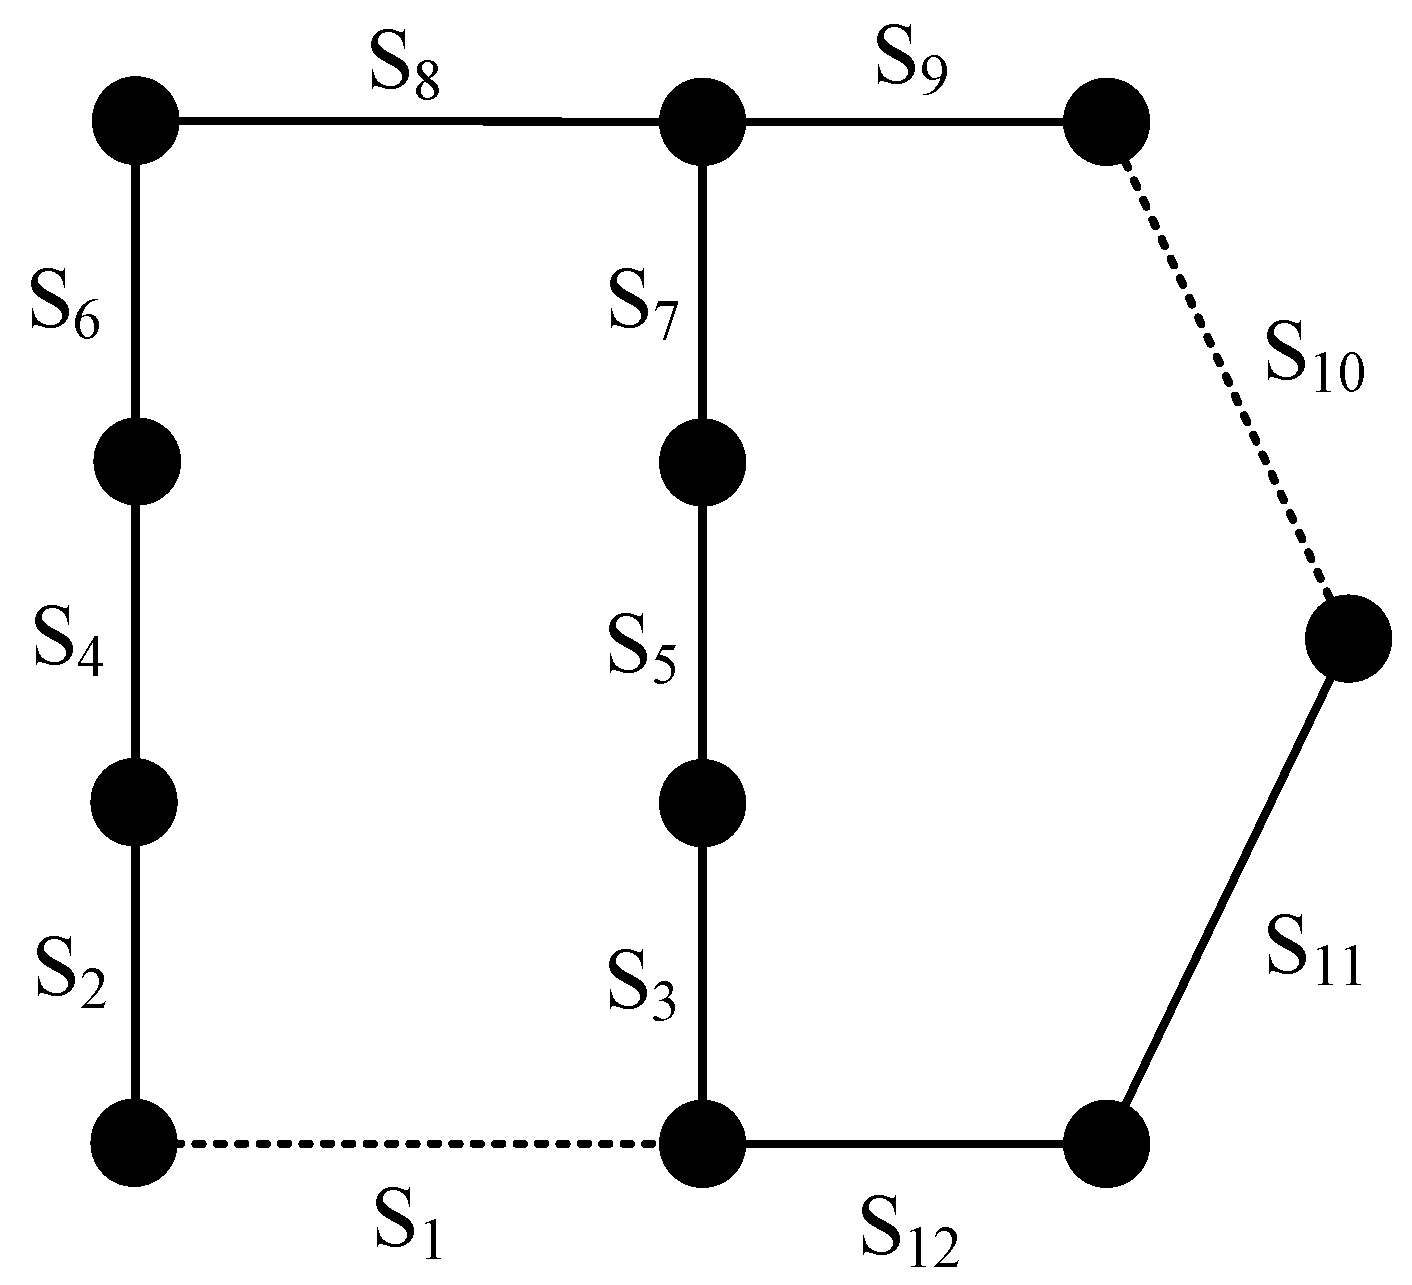
Step (1): As previously described, the initial set of solutions is obtained by applying the branch exchange procedure [25,26,27] to the initial radial system topology, which is named base topology. From this process, all of the solutions of the initial set P* are radial and connected as the base topology. In the proposed MOAIS, the SOP representation consists of choosing random branches of a given solution, among those related to open switches, to receive SOPs, so the radial and connected structure is maintained. The tutorial system in Figure 4 [19] illustrates this proposal, in which branches are coupled to the maneuverable switches S1–S12, and S1 and S10 are open.
From Figure 4, the base topology is represented as in Equation (18), considering that ‘0′ and ‘1′ mean open and closed maneuverable switches, respectively. The code of Equation (19), in turn, represents a radial and connected configuration derived from (18) by the branch exchange process.
P 1 = 0 S 1 1 S 2 1 S 3 1 S 4 1 S 5 1 S 6 1 S 7 1 S 8 1 S 9 0 S 10 1 S 11 1 S 12
P 2 = 1 S 1 0 S 2 1 S 3 1 S 4 1 S 5 1 S 6 1 S 7 1 S 8 1 S 9 0 S 10 1 S 11 1 S 12
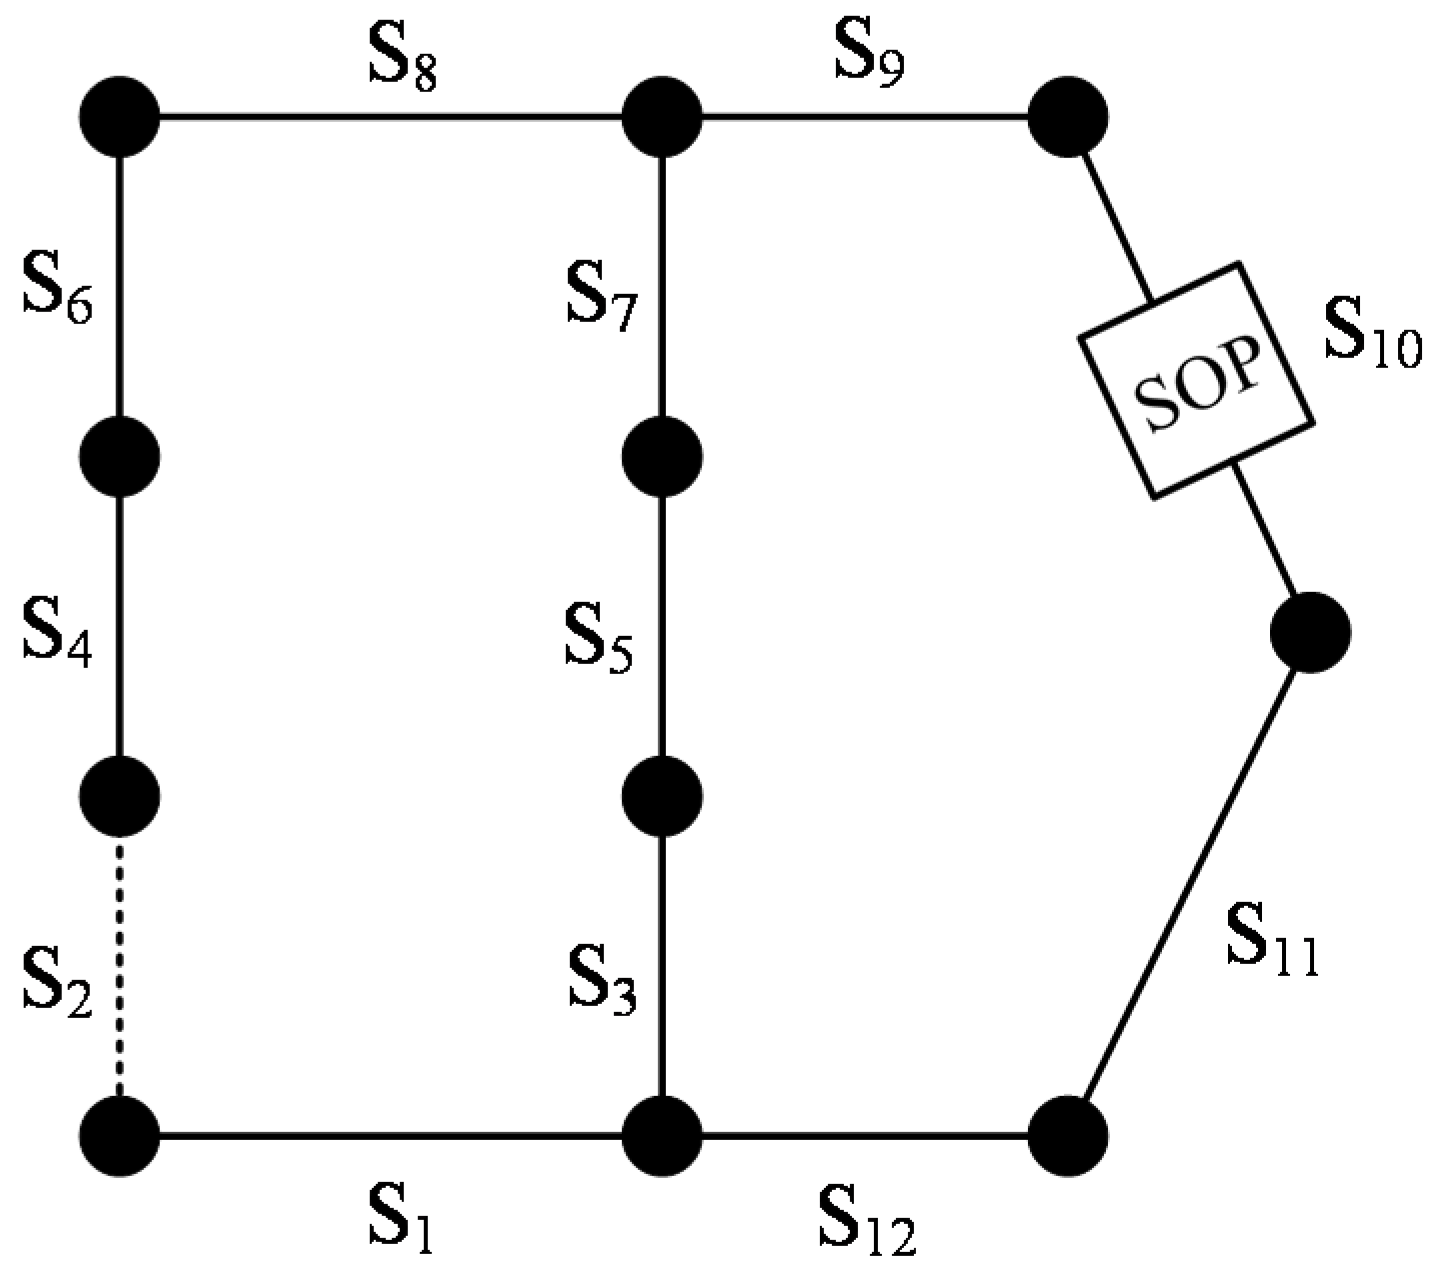
Therefore, after obtaining P2, a random position among those related to open switches, that is, S2 or S10, can be chosen to receive SOP. This process is random and none position or both—S2 and S10—can also be chosen to receive SOPs. Considering, for instance, that S10 of P2 is chosen to receive SOP, the resulting solution P 2 * is represented by Equation (20) and illustrated in Figure 5, assuming that value ‘2′ means an SOP at the corresponding position. Notice that the resulting solution remains radial and connected as previously described.
P 2 * = 1 S 1 0 S 2 1 S 3 1 S 4 1 S 5 1 S 6 1 S 7 1 S 8 1 S 9 2 S 10 1 S 11 1 S 12
Step (2): In this step, for example, considering two objectives, both f1 and f2, formulated in Equations (15) and (16), respectively, must be obtained by solving the OPF problem of (6).
Step (3): This step determines the Pareto dominance among the solutions of the current set P, from f1 and f2 obtained in the previous step and the application of Criteria 1 and 2 of Equations (4) and (5), respectively, to the solutions of P. The dominated and nondominated subsets, PDO and PND, are thus obtained from P.
Step (4): In the proposed MOAIS, the n best solutions from the nondominated subset PND are found to form PsND. The crowding distance (CD) metric of [28,29] is used to find the n best solutions from PND. According to this metric, the nondominated solutions in PND are ranked according to their contribution to the diversity of PND [28]. Considering f1 and f2, CDi is obtained for the nondominated solution ‘i’ as formulated in (21) and (22), where f k min and f k max are the minimum and maximal values of objective k, respectively, nobj is the number of objective functions and fk,i is the value of objective function k for nondominated solution i. Thus, CDi> CDj means that ‘i’ lies in a less-crowded region of the nondominated Pareto front [28] and, therefore, must receive priority to be selected in comparison with ‘j’. In summary, the solutions with the n greater CD values are selected in this step.
C D i = k = 1 n o b j C D i , k f k max f k min
C D i , k = , if   f k , i = min f k , i | i P N D or   f k , i = max f k , i | i P N D min f k , i f k , i " | i , i " P N D : f k , i " < f k , i < f k , i , otherwise
Step (5): The cloning process is applied to the PsND set according to the normalized fitness of the solutions in PsND, which are formulated as in Equation (23).
f i * = 1   / { 1 + exp [   ( C D i C D ¯ ) / δ C D ] }
where:
f i * Normalized fitness function of solution ‘i’;
C D ¯ Mean value of the CDs of the solutions in PsND; and
δ C D Standard deviation of the CDs of the solutions in PsND.
From (23), it can be highlighted that the normalized fitness f i * is directly proportional to the crowding distance CD, as introduced in the previous step. The sigmoid normalization of Equation (23) was proposed in [19] due to its suitable behavior for the NR problem. From obtaining the fitness f*, the number of clones of a solution ‘i’ is directly proportional to f i * , as in [19] and formulated in Equation (24).
N c i = r o u n d ( β f i * )
where:
NciNumber of clones of solution ‘i’;
round(.)Round operator to the nearest integer value; and
β Control parameter for the cloning process.
Step (6): The mutation procedure consists of performing modifications in some selected topologies from set C to form set M. These modifications maintain the radiality and connectivity of the changed solutions by applying the branch exchange process of [25,26], as well as the selection of some positions, among those related to open switches, to receive SOPs, as described in Step (1) and illustrated in Figure 4 and Figure 5. In order to try and maintain the good solutions in the mutation set M, the probability of mutation of a given solution ‘i’ is inversely proportional to its fitness f i * , as formulated in Equation (25) [19].
p i =   exp ( ρ f i * )
where:
piMutation probability of solution ‘i’; and
ρControl parameter for the hypermutation process.
Step (7): Similar to Step (2) to obtain f1 and f2 for all solutions in M.
Step (8): Similar to Step (3) to determine the Pareto dominance of the solutions in M and the set of dominated and nondominated solutions in M, MDO and MND, respectively.
Step (9): Similar to Step (4) to form MsND from MND.
Step (10): Substitutes the worst solutions of P by the solutions of MsND.
Step (11): Generates d solutions as described in Step (1) to obtain set D;
Step (12): Substitutes the worst d solutions of P by the solutions of D.

4. Case Studies

4.1. General Description

Table 2 presents the parameters of the MOAIS algorithm defined for all case studies, where nvar is the number of optimization variables related to the number of maneuverable switches, since each switch can change its status through the NR process or can receive the SOP. Despite the number of parameters, some of them, gest, n and d, are functions of others, gmax and NAb, and that these settings are suitable for all of the case studies. The development was carriedout using MATLAB® software version 9.8.0.1323502 (R2020a), and the toolbox fmincon was used to solve the problem formulated in (6).
The proposed approach was applied to the widely known medium voltage 33-bus distribution system [26], and its topology is shown in Figure 6. Notably, this system has been used in the literature for the problem at hand, and thus was chosen in the present work. It is a radial system with thirty-two sectionalized switches and five tie-switches, the voltage level is 12.66 kV and the active and reactive demands are 3.715 MW and 2.3 MVAr, respectively. In Figure 6, B in red denotes the branch number of the distribution system.
Aiming to evaluate the proposed MOAIS algorithm, four case studies were performed considering DG units connected to busses 6, 12, 15 and 31, as shown in Figure 6. The general data and input parameters are provided in Table 3. An additional case is also part of the case set, and its parameters and data are described later. The following cases are assessed:
Case 1: Seeks to validate the MOAIS algorithm by comparing the obtained results with those from [16] in the same simulation conditions; by establishing a limit for HC (f1) at 200%. The two objective functions considered in the Pareto method are f1 and f2. As mentioned in [16], the number of SOPs is limited to one. Moreover, S I S O P i = S J S O P i = 2MVA, which is the SOP size in this case;
Case 2: The same conditions of Case 1, but without any constraint to the limit of HC (f1);
Case 3: The multi-objective optimization is performed with objectives f1 and f3, and there is no constraint to HC (f1). Therefore, as the cost of SOPs (f3) is among the objectives, the number of SOPs and their rated powers are variables of the optimization problem. The maximum SOP size is 50MVA;
Case 4: The same conditions of Case 3, but including objective f2. Therefore, Case 4 considers all of the objectives: f1, f2 and f3;
Case 5: Seeks to compare MOAIS results with others from the literature.
As in [16], the following conditions are considered in all cases: (i) reverse active power flow is allowed from the distribution system to the substation; (ii) peak load level (100%); (iii) DGs with fixed power and unit power factor; (iv) ideal SOPs; there are no internal losses in the equipment.

4.2. Case 1

The proposed MOAIS is compared with [16]. Notice that, in [16], the SOP optimization is achieved after the NR process, whereas, in the present work, these tasks are carried out in a simultaneous way. The best results from [16] are shown in Table 4, where all of them have HC at a limit of 200%. These solutions are obtained by changing the SOP place among the open switches previously defined by the NR process.
Table 5 shows the nondominated solutions from MOAIS, which form the Pareto front in Figure 7 and are identified by their ordered pair (f1, f2 in this case) numbers (OP#). It is worth noting that there is only one solution that presents HC at 200%. The others present lower HC, but also lower power losses, thus being nondominated.
Notice that OP#4 has HC at a limit of 200% and power loss lower than all of the solutions in Table 4, which proves that the proposed MOAIS OP#4 defines a better trade-off between f1 and f2, and MOAIS can obtain a better solution than in [16]. This can be explained by the proposed MOAIS simultaneously performing the entire optimization (NR and SOP optimization), which tends to provide better results in comparison with step-by-step approaches, as that from [16]. Solution OP#4 determines that branches B7-B10-B13-B27 must receive tie switches, and that B30 must receive a 2-MVA SOP. As MOAIS is a multi-objective approach, it can obtain other solutions having lower HC, but also lower power loss, which implies worse f1 but better f2. This is the purpose of the proposed tool; providing concurrent solutions in terms of the considered criteria or objectives, aimed at supporting decision-making.
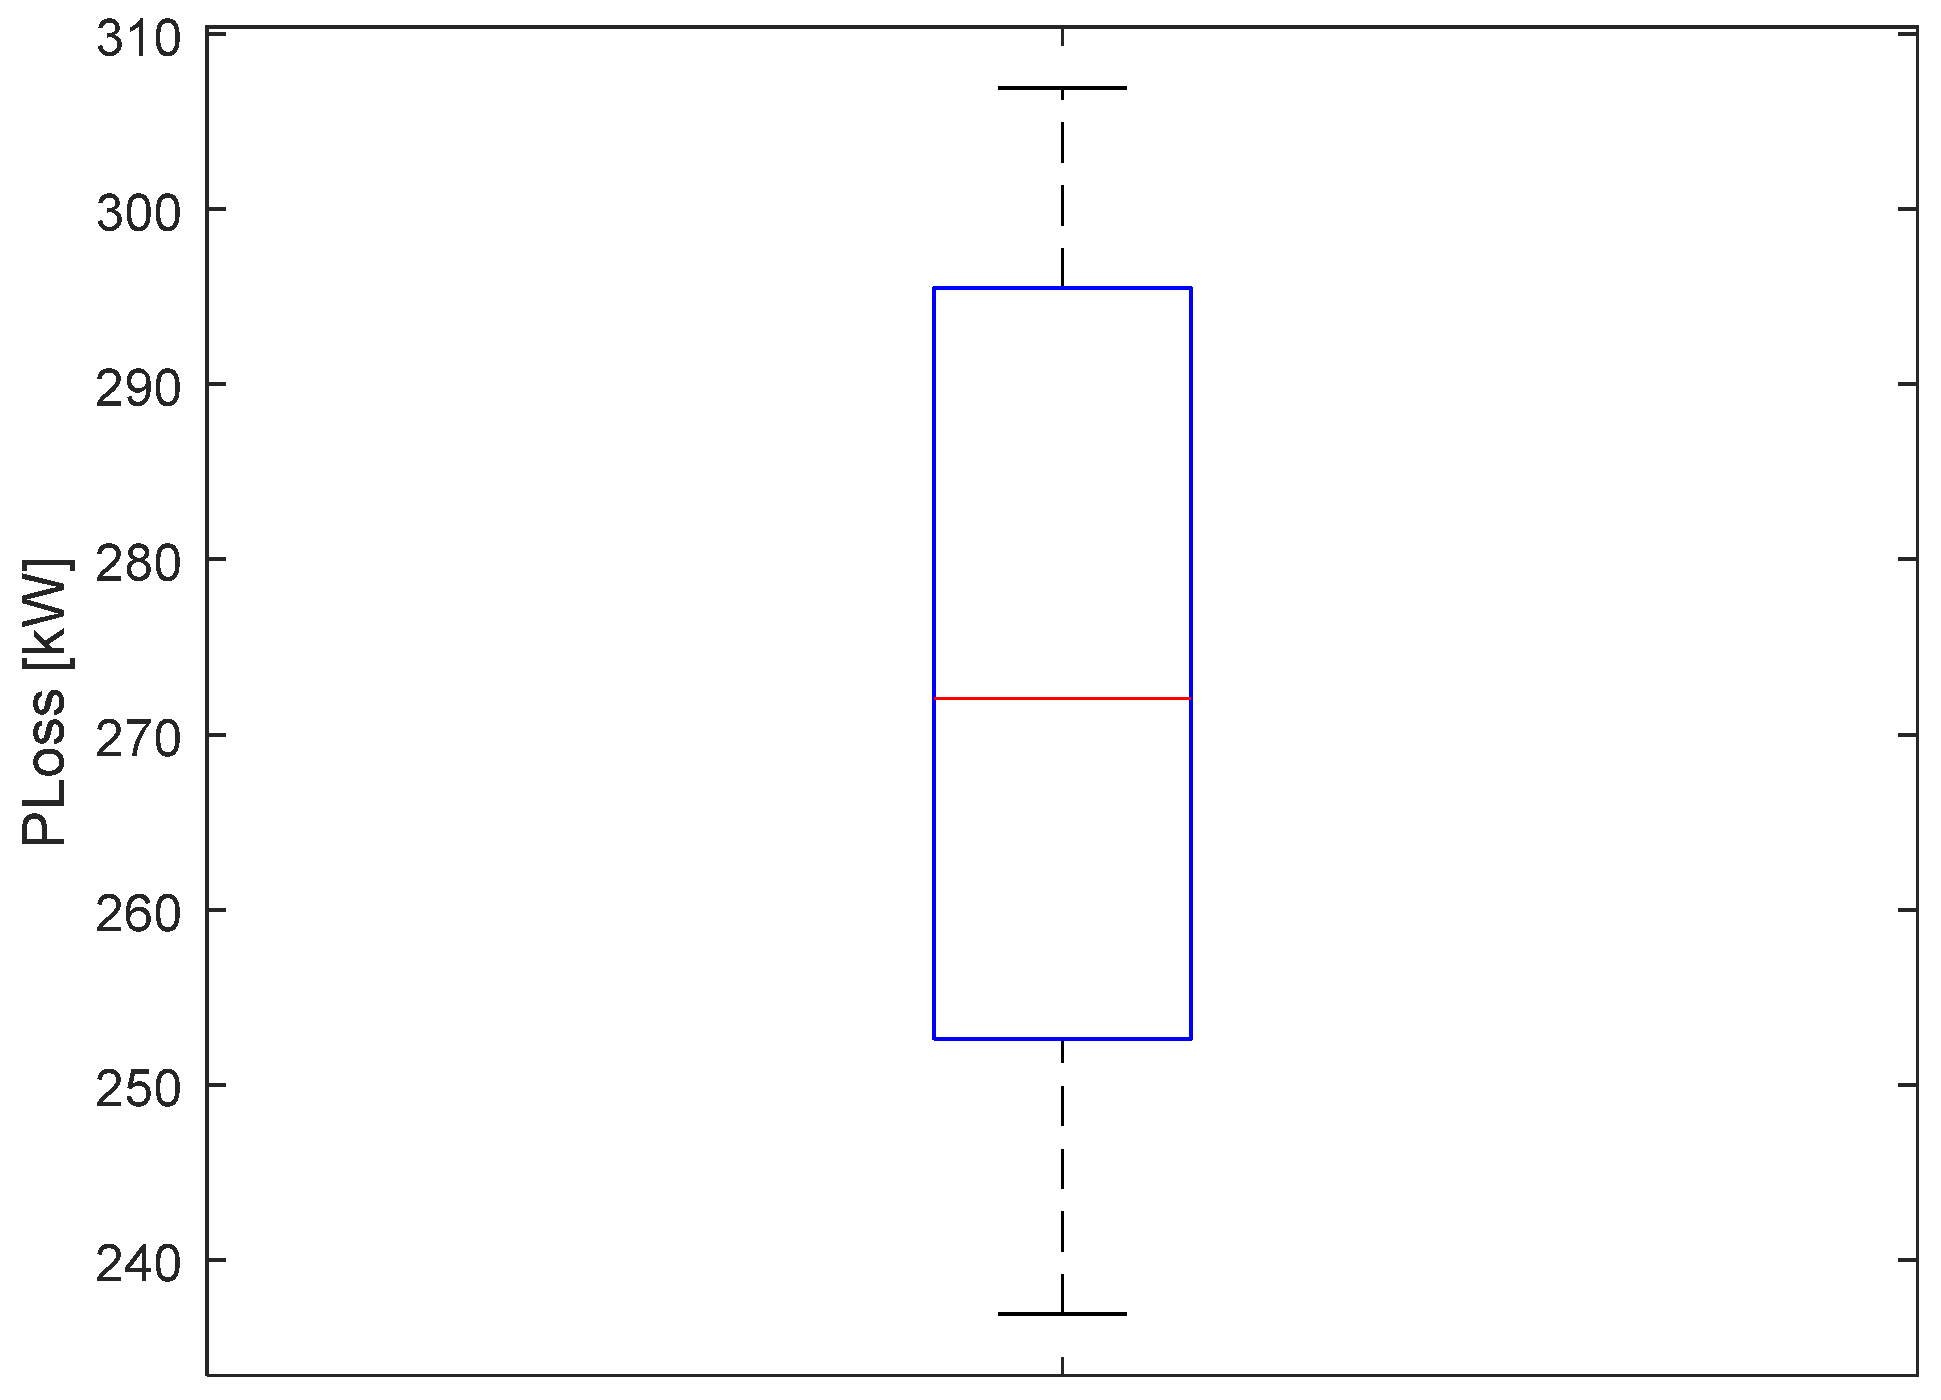
Due to the probabilistic feature of the MOAIS search process, thirty runs were performed and the statistical results for the minimum obtained power loss are shown in Figure 8; which displays the median (272.05 kW). The lower and upper quartiles are 252.6 kW and 295.5 kW, respectively, which represents a deviation of around -7% to 9% in relation to the median; less than 10% in both directions. Only the power loss is evaluated in this case because the HC level is limited to 200%, and all of the thirty runs obtained a solution having this value.

4.3. Case 2

Table 6 presents the nondominated solutions and Figure 9 shows the corresponding Pareto front from the proposed MOAIS. As the limit of 200% is not imposed on HC in this case, there are solutions with values substantially greater than, for instance, OP#15, that has an HC greater than 318%, with one SOP at B25 and tie switches at B7-B21-B22-B34. It can be highlighted that this solution, as well as all of the others, meet the network constraints related to the voltage and current limits. However, as the HC increases, the power loss also increases, demonstrating a trade-off between f1 maximization and f2 minimization.
As shown in Figure 9, it is noted that MOAIS provides a wide range of values for HC and PLoss, which is important information to support decision-makers. In addition, by the shape of the Pareto front curve, there is a knee where the increase in HC varies from approximately 300% to 318%, whereas there is a significant increase in PLoss.
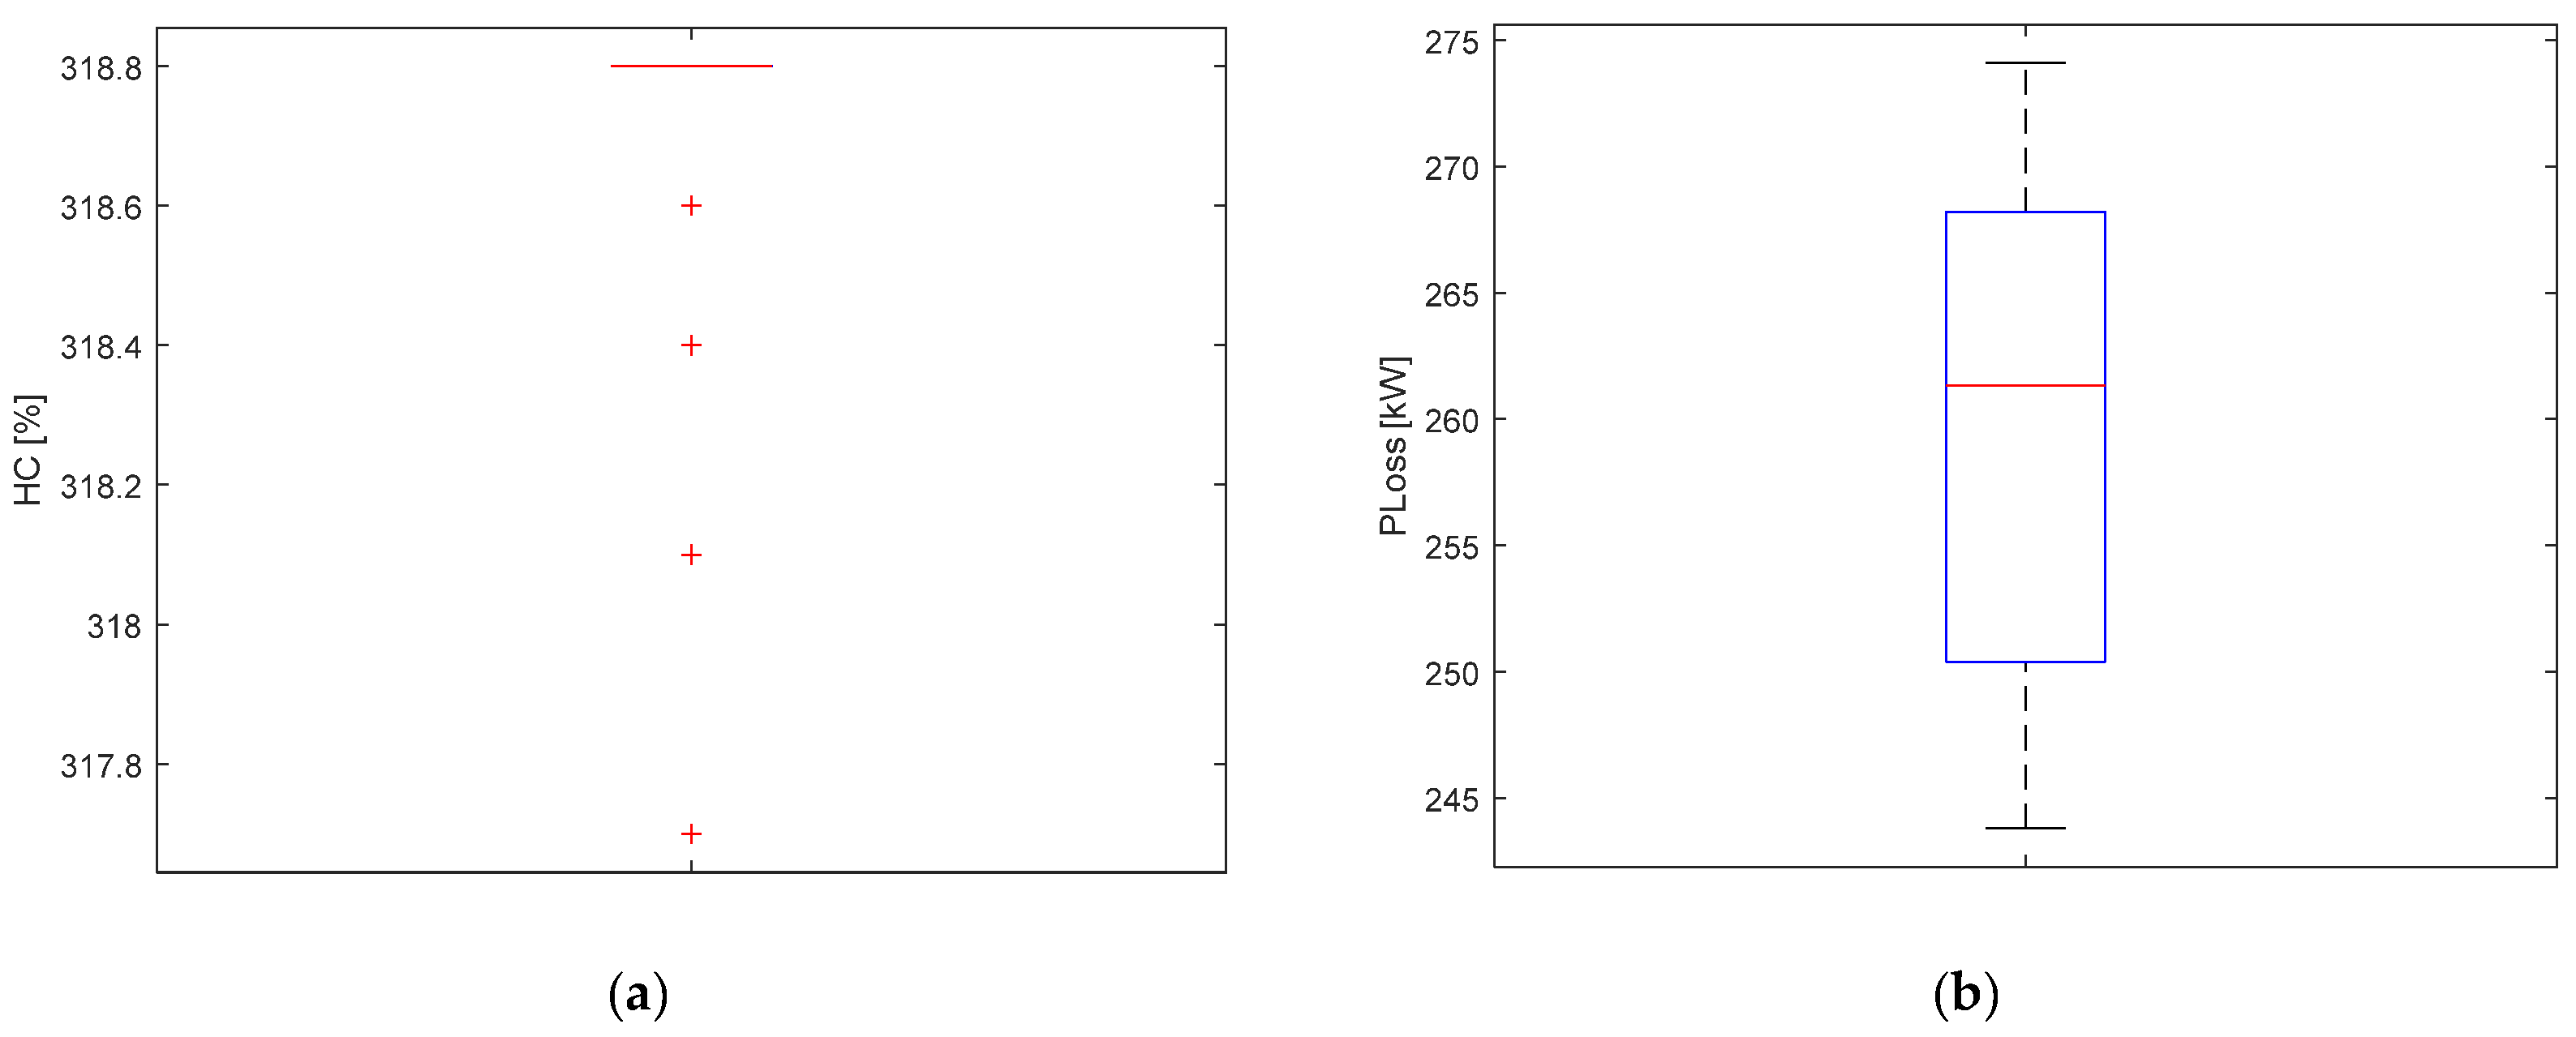
As in the previous case, the MOAIS algorithm was run thirty times. The dispersions of the obtained maximum HC and minimum power loss in Case 2 are shown in Figure 10a and Figure 10b, respectively. In this case, there was no relevant dispersion among the obtained HC levels, and the maximum value of 318.78% was obtained twenty-three times. Thus, in Figure 10a, due to the same results of twenty-three runs, there is no box in the boxplot and the other results correspond to the marked points. The lowest HC value was 317.7% (a deviation of around 0.3% in relation to the maximum value). From Figure 10b, the power loss median is 261.34 kW. Half of the PLoss results are greater than or equal to the median. The lower and upper quartiles are 250.4 kW (deviation of around −4%) and 268.2 kW (deviation of around 3%), respectively. These results show the robustness of MOAIS to obtain the same HC solutions (76.7% of the time), or to obtain other results with a lower deviation—lower than 5% in this case.

4.4. Case 3

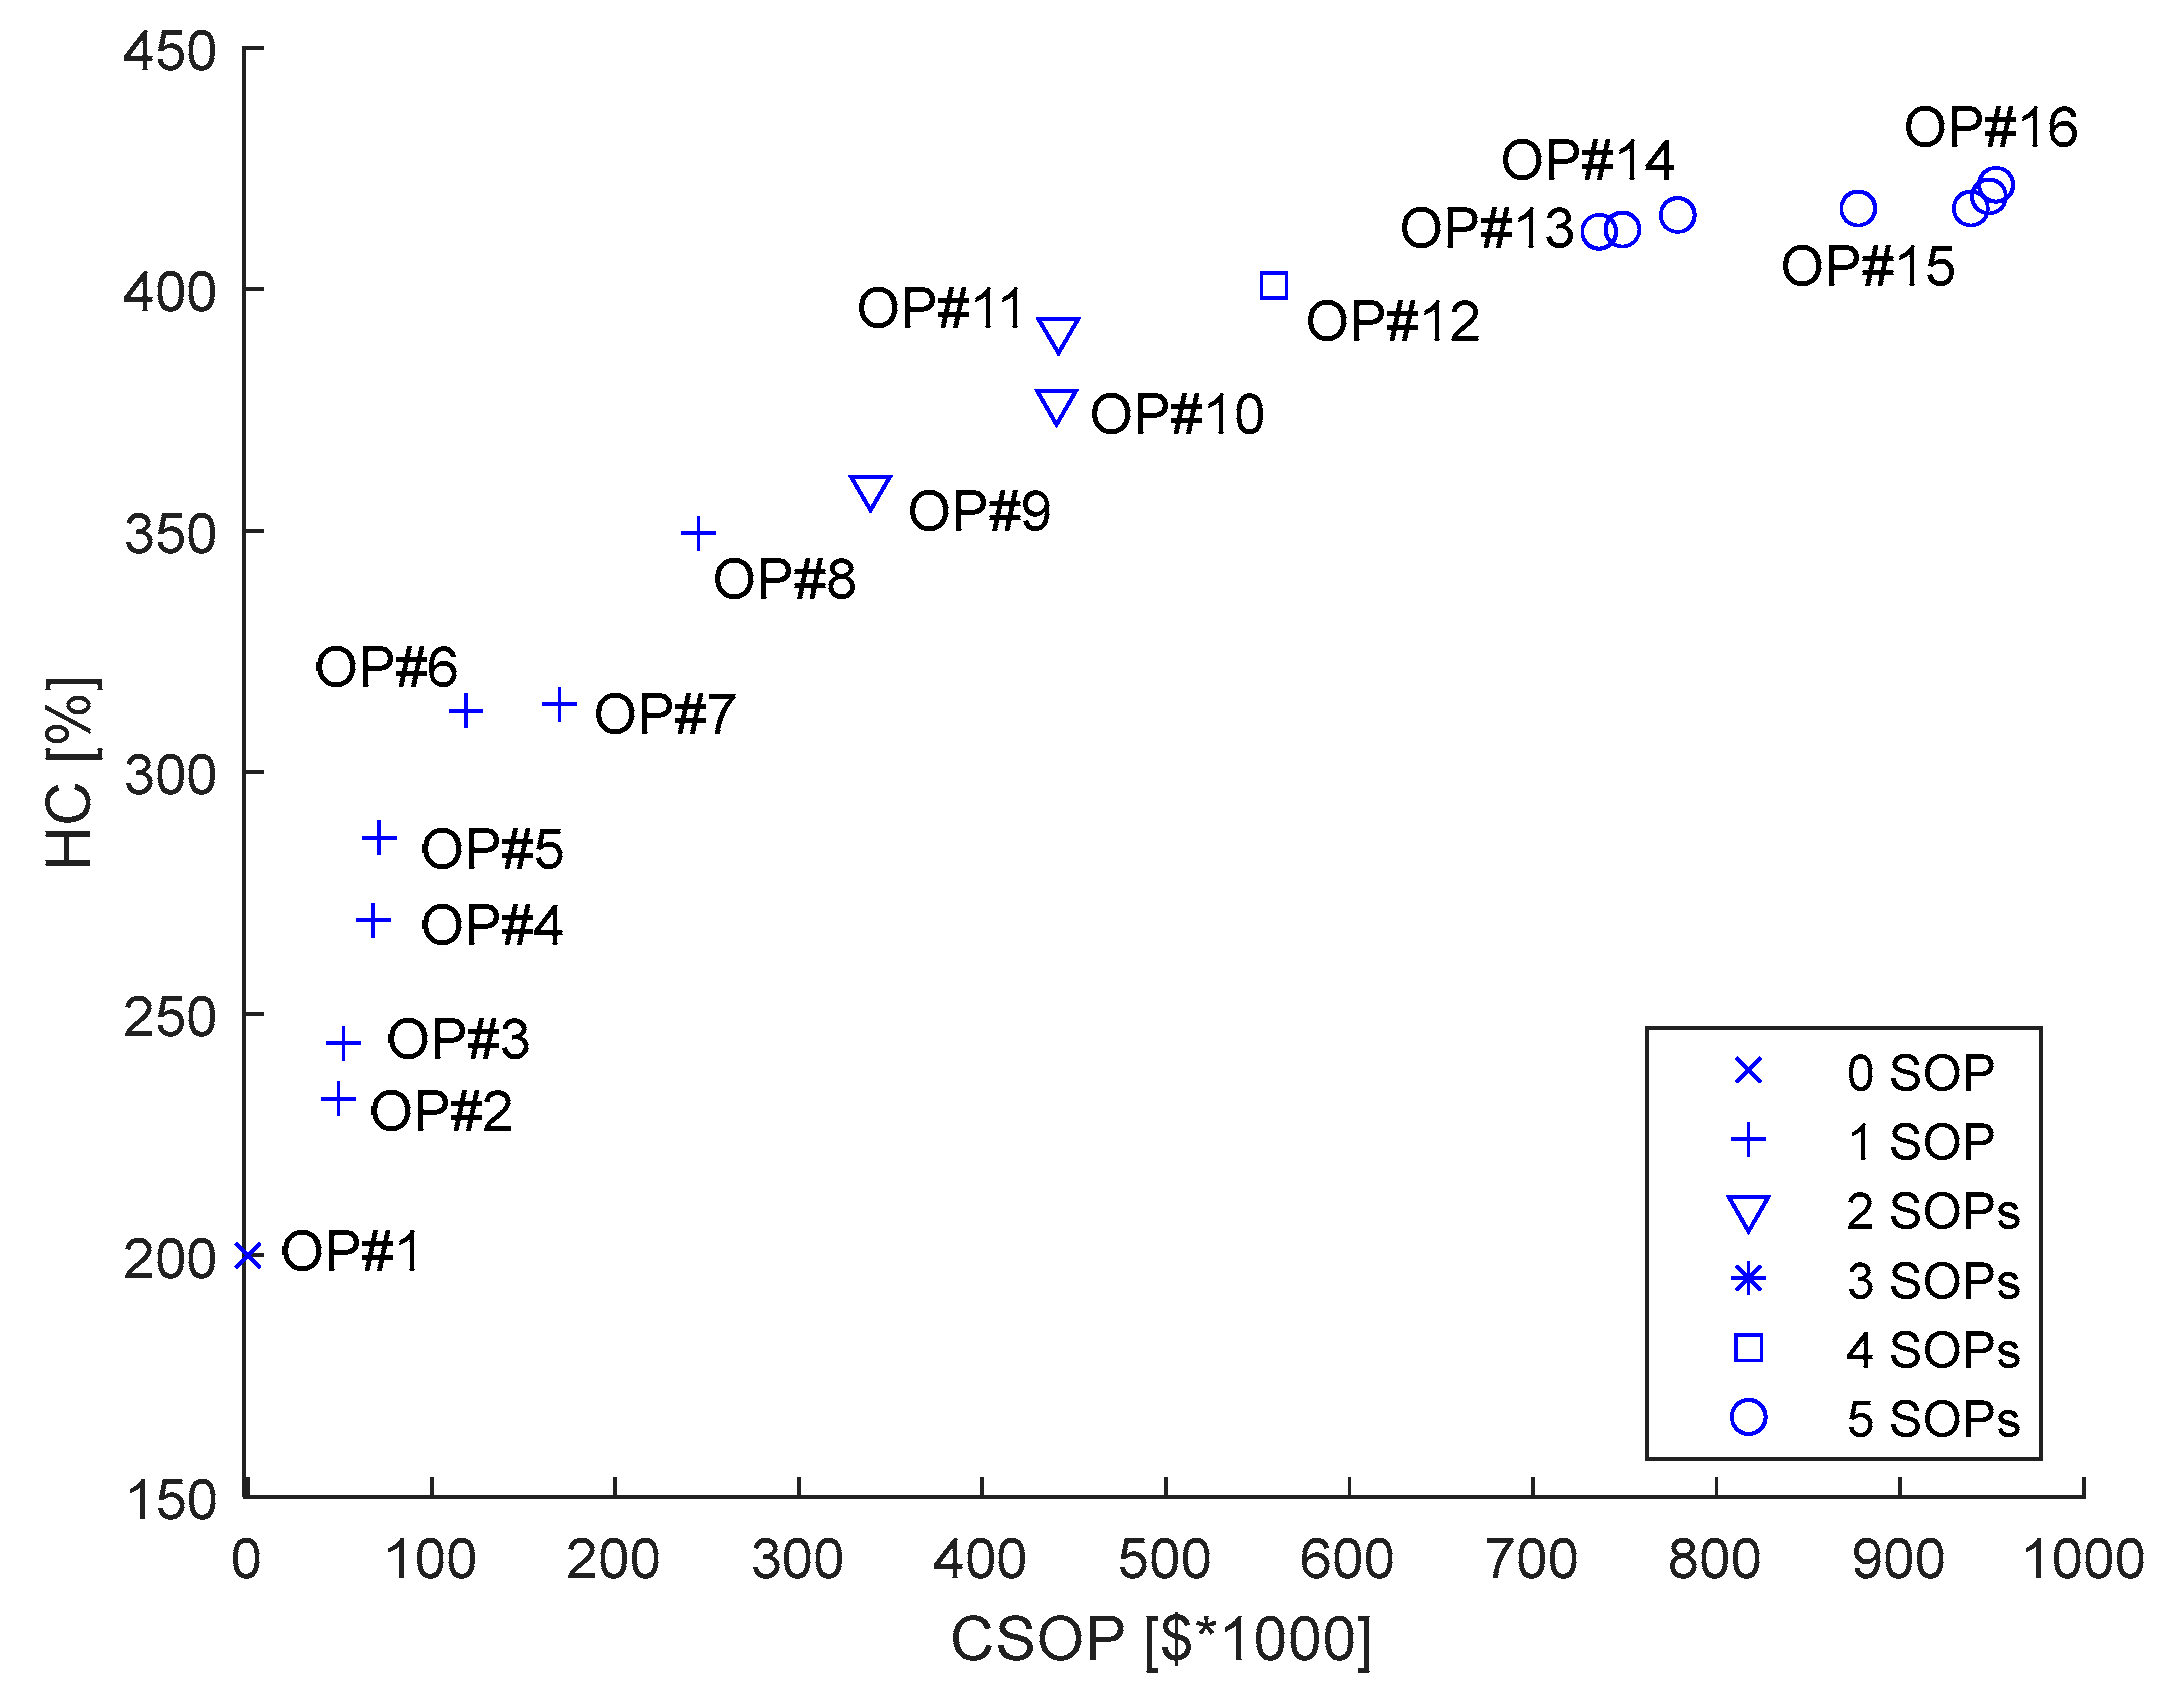
Table 7 shows the nondominated solutions in terms of f1 and f3 criteria. MOAIS can obtain nondominated solutions to form the Pareto front in Figure 11, where the number of SOPs is limited to the number of open switches in the base topology.
From the Pareto front, the total cost of SOPs CSOP increases as the number of devices increases. Moreover, CSOP also increases as the rated power of the equipment (SOP size in Table 7) increases. In addition, the Pareto front depicts the trade-off between the two objectives; as the HC increases (better f1), the total cost of SOPs also increases (worse f3). The results indicate the effectiveness of MOAIS to obtain solutions for multiple SOPs. From Figure 11, the Pareto front can support decision-makers in choosing the best solution according to their priorities.

4.5. Case 4

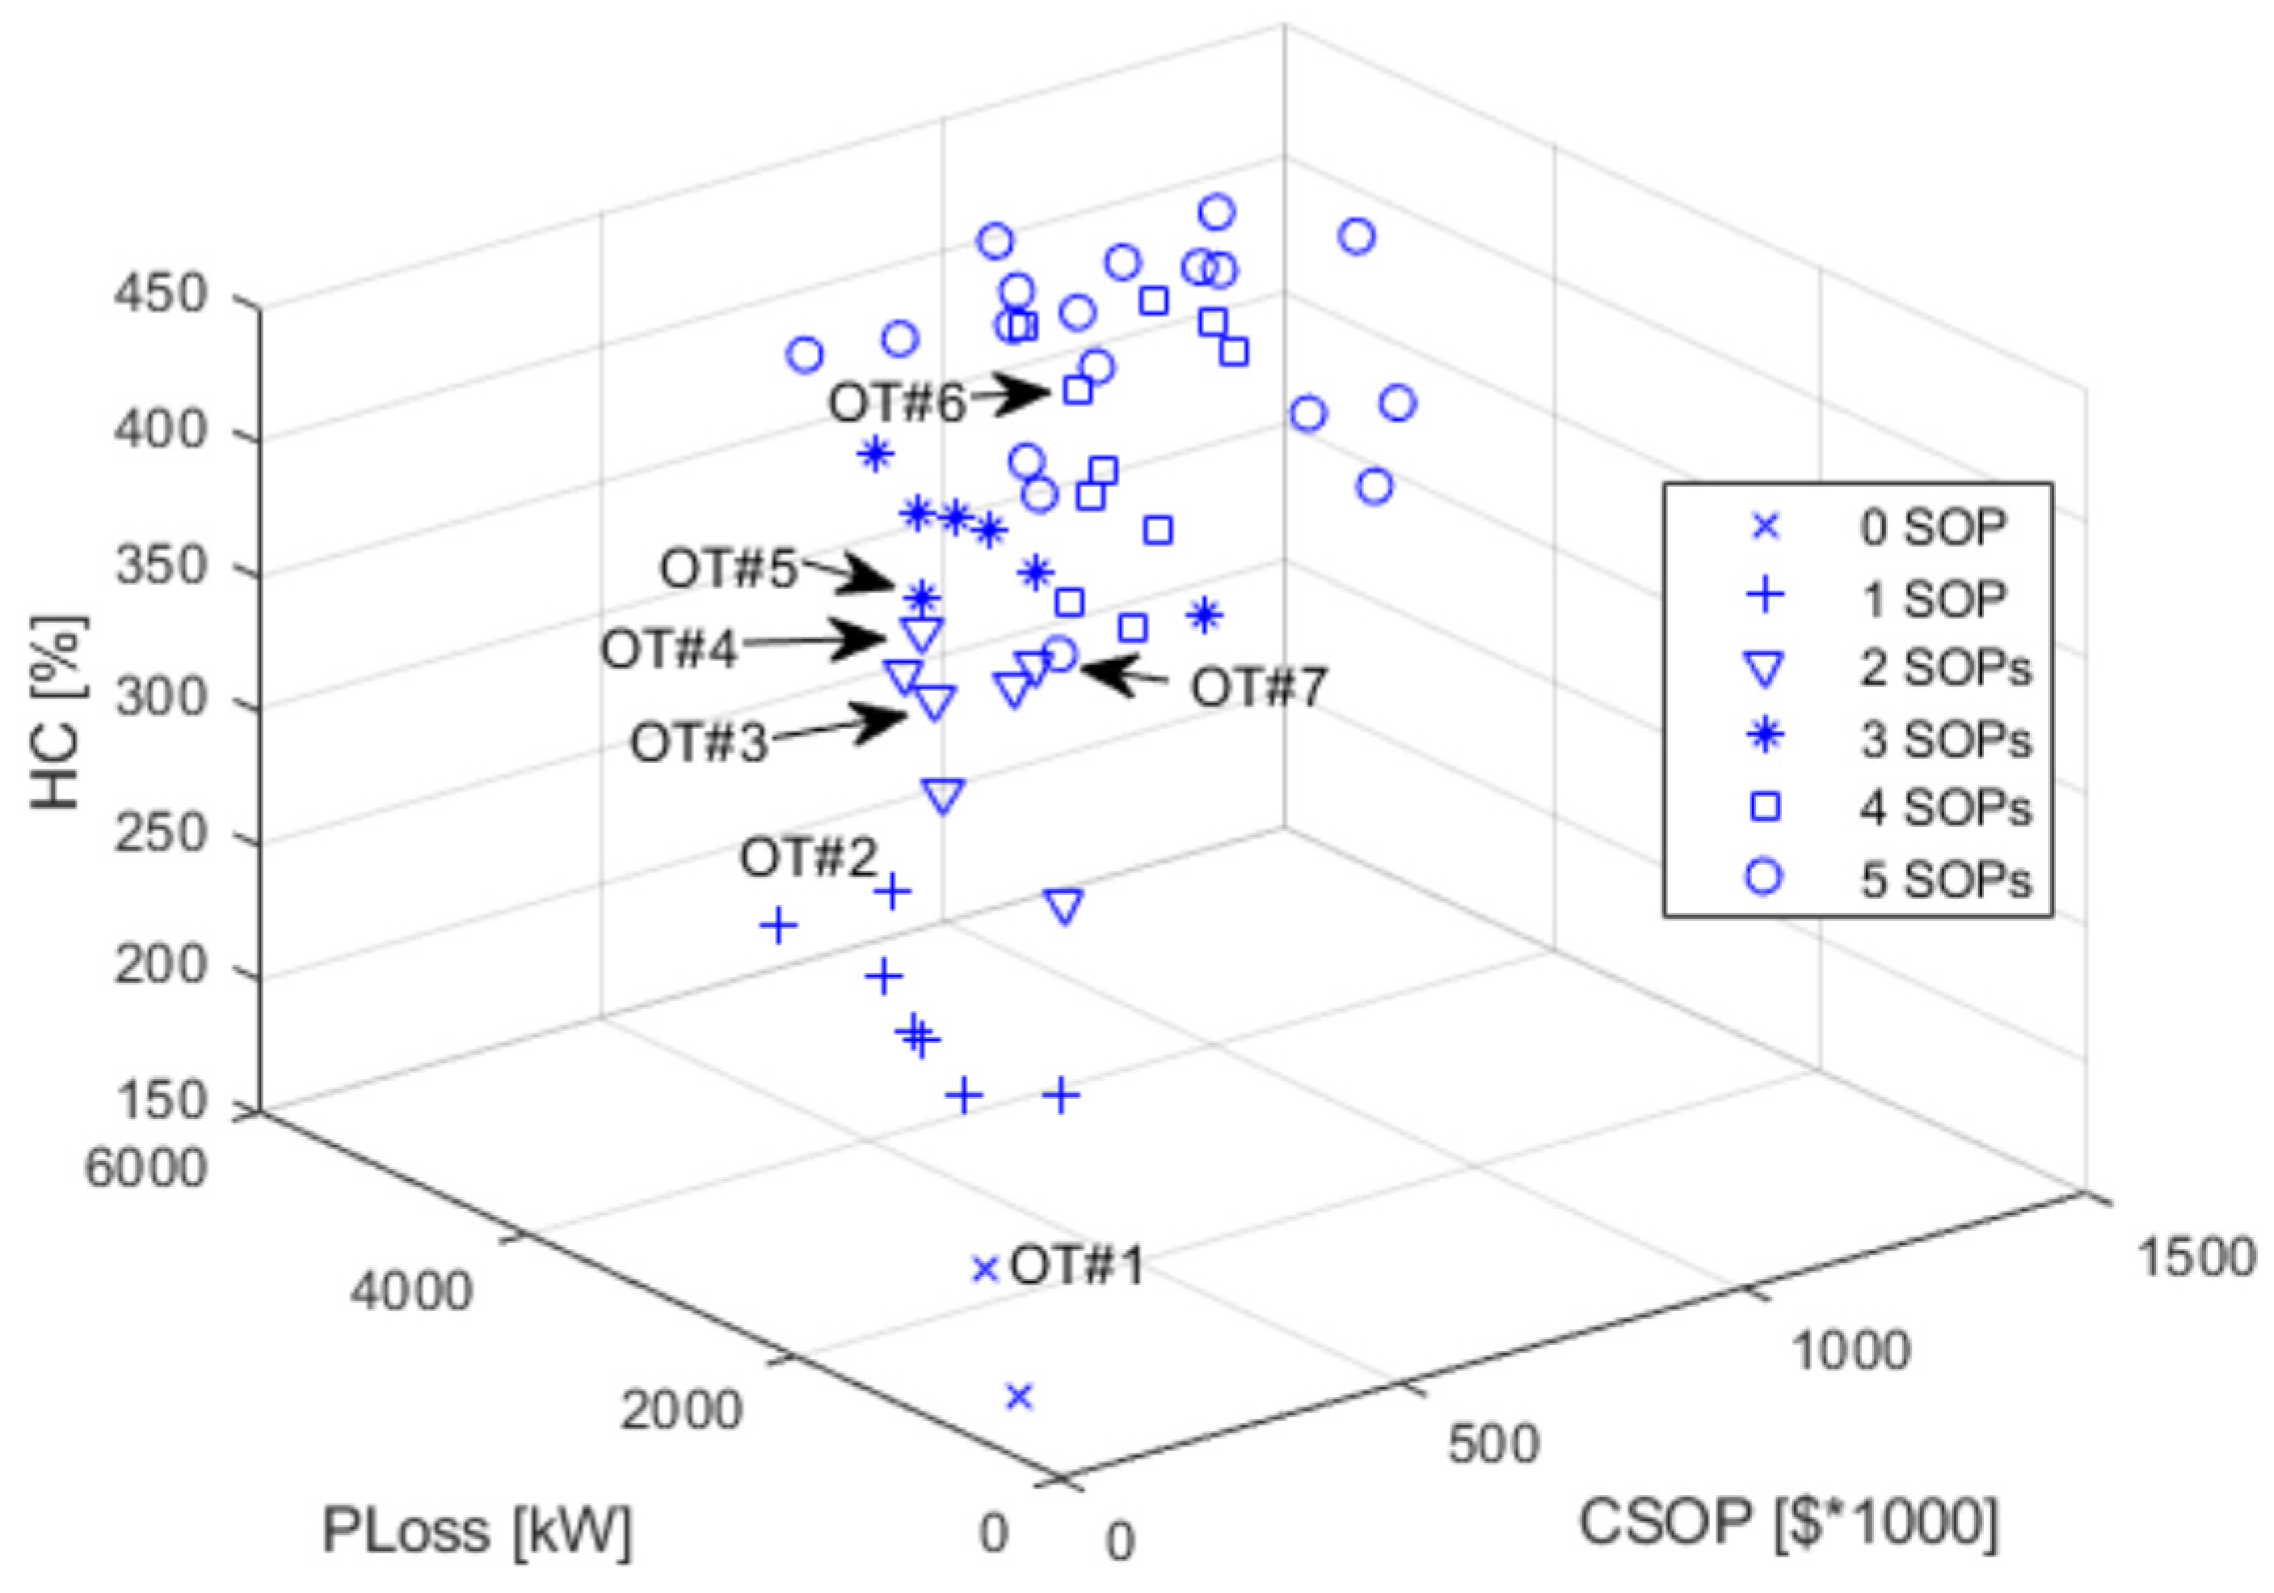
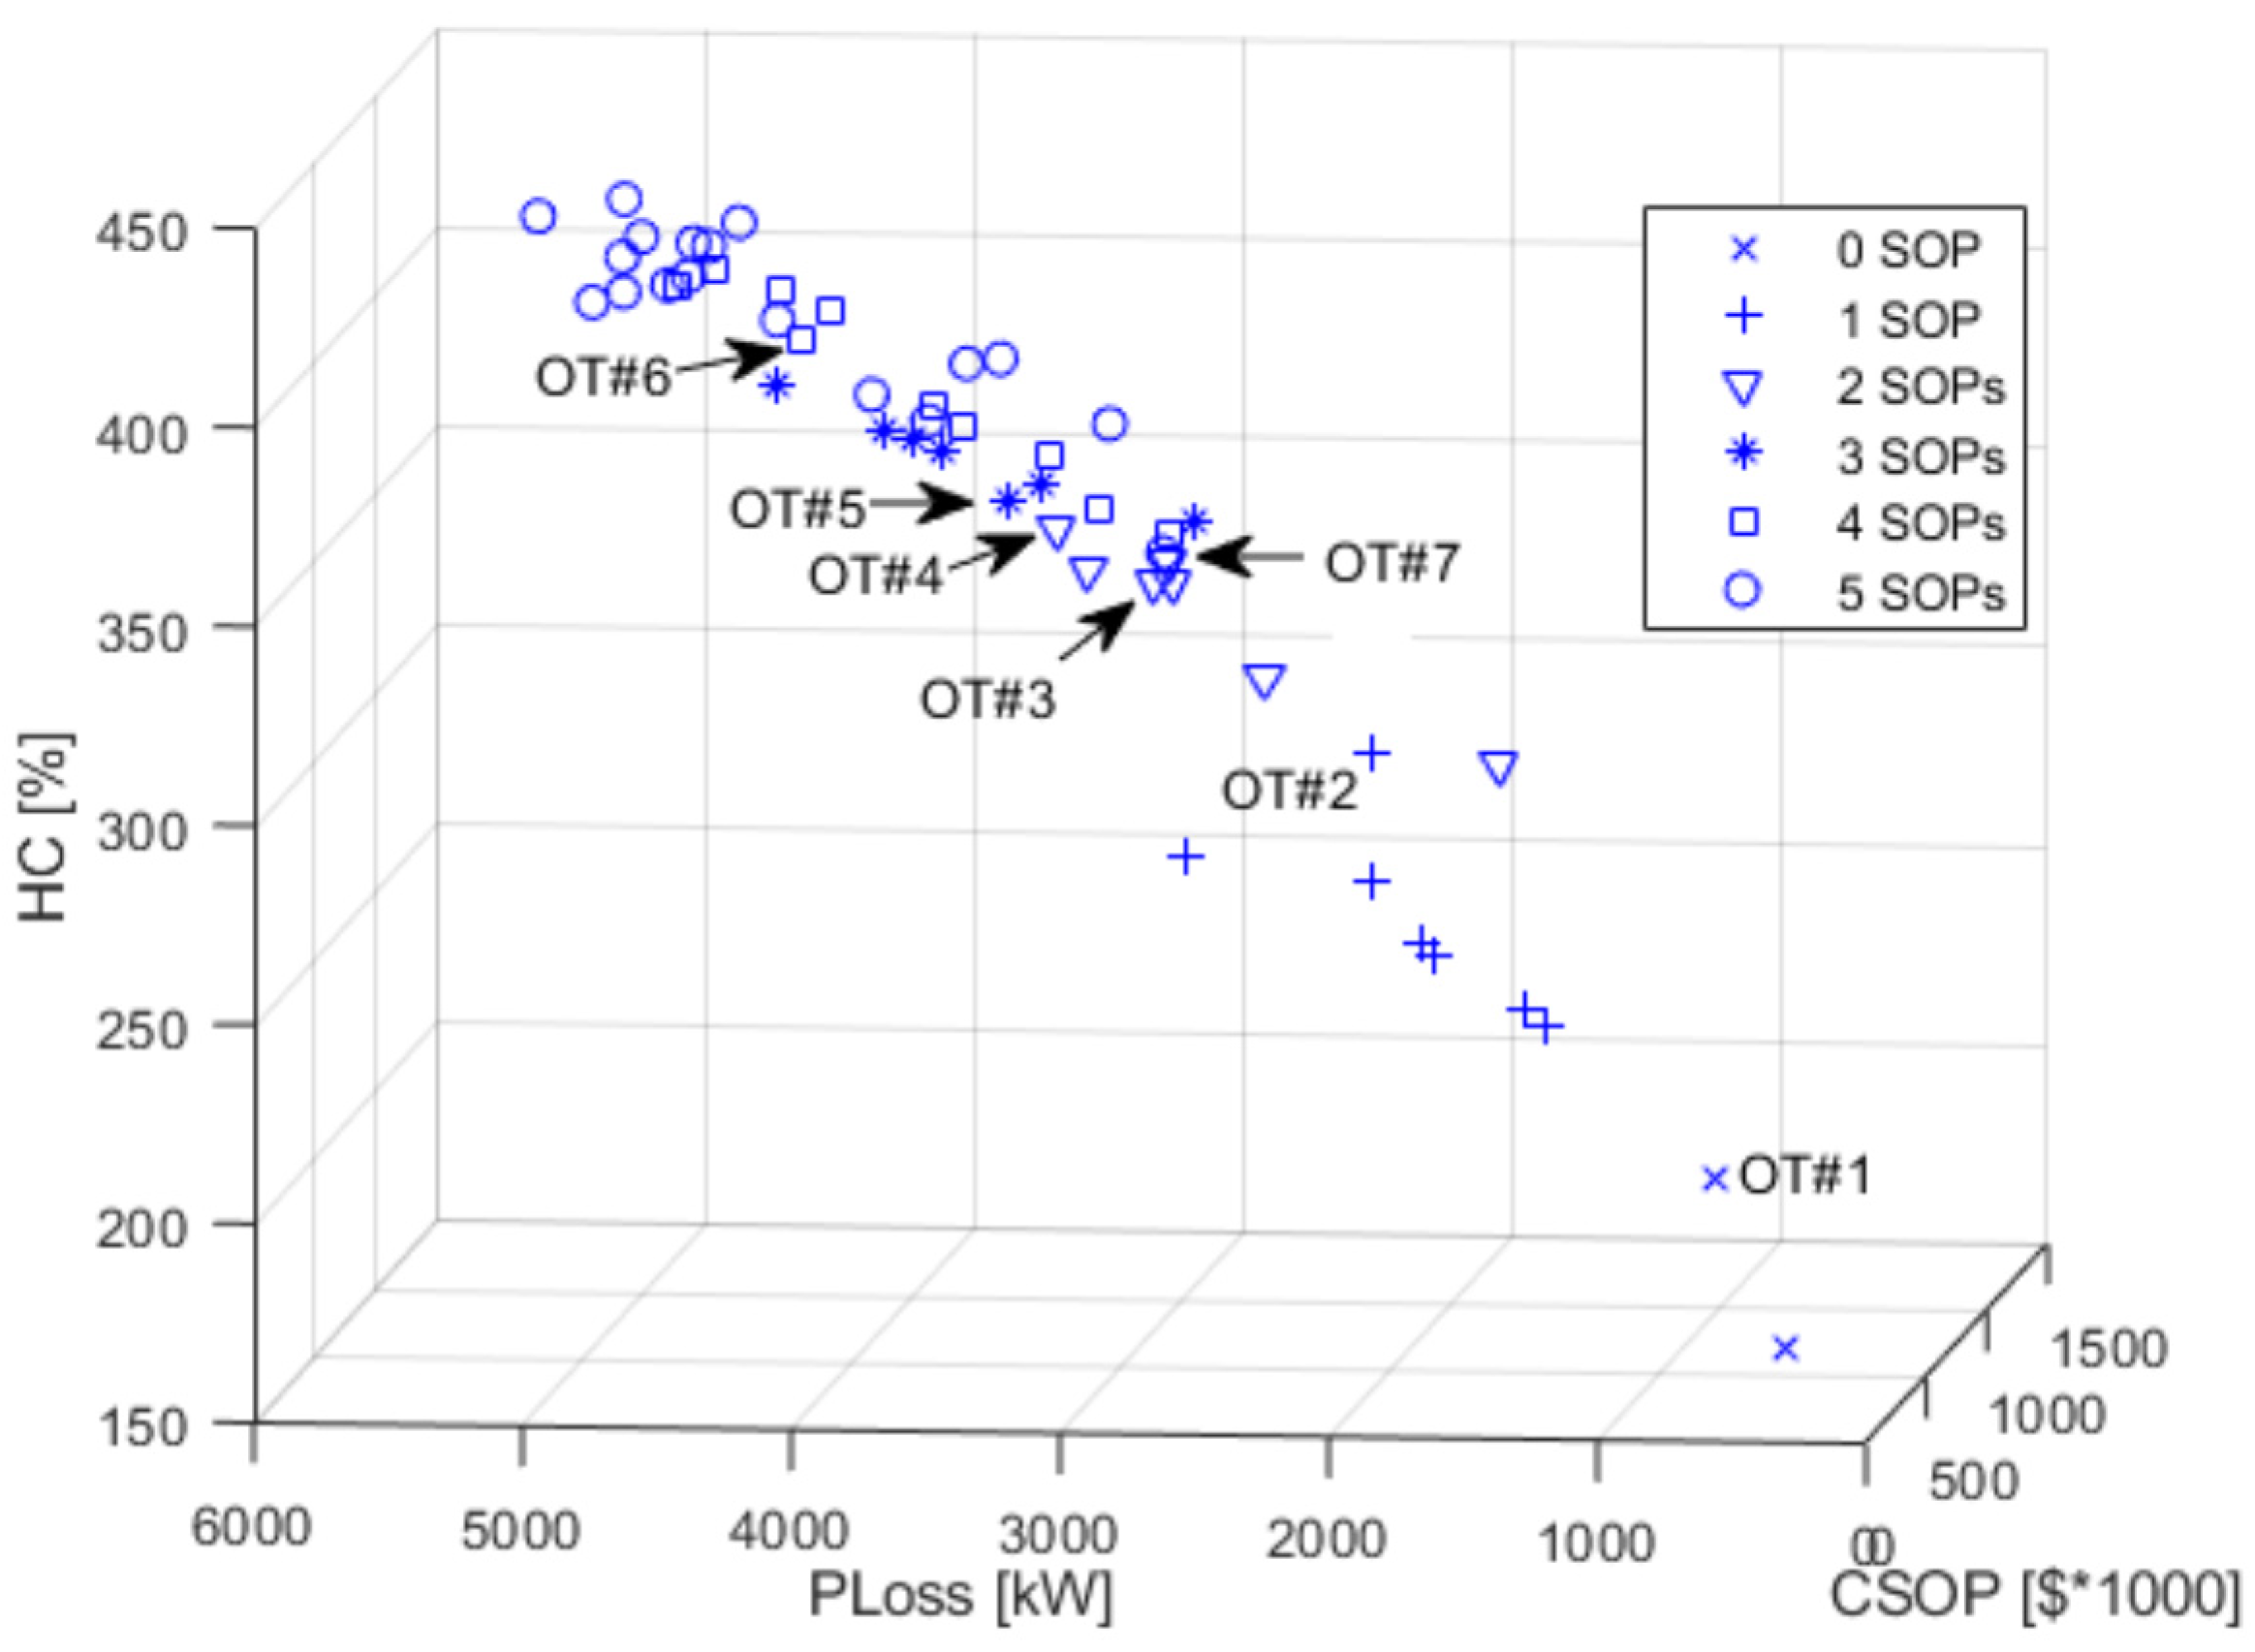
Figure 12 shows the Pareto front in three dimensions containing solutions represented by ordered triples (OT) formed by values for {f1, f2, f3}. Notice that the HC levels (f1) increase with the number of SOPs, as expected. However, the power loss (f2) and the cost of SOPs (f3) also increase with HC and the amount of equipment, showing the trade-off between f1 and the pair f2-f3. Therefore, the proposed MOAIS algorithm is flexible to allow the analysis of options for planning SOP and tie switches under the three criteria (f1, f2, f3) in a joint tool, providing a holistic assessment for decision-makers.
Figure 13 and Figure 14 show two-dimensional (2-D) curves obtained from the Pareto front in Figure 12. For instance, in Figure 13, assuming a limit for the investment at $500,000.00, solutions OT#3, OT#4 and OT#5 can provide HC above 350%. However, from Figure 14, OT#3 has the lowest power loss among OT#3, OT#4 and OT#5. Thus, option OT#3 has the best trade-off under all criteria in this case (limit of $500,000.00 for investment).
Table 8 shows a chosen set of nondominated solutions where the diversity among them can be analyzed by comparing them under the three criteria. From this table and Figure 13 and Figure 14, it is observed that OT#2 has the highest HC and approximately the same SOP costs among the solutions that have one SOP allocated. However, OT#2 has the highest power loss among this set of solutions. For further analysis, supposing that an HC above 350% is desired and sufficient, OT#7 is better than OT#6 under the other criteria.

4.6. Case 5

This case presents analyses of MOAIS results against others from [12] and [14].
(a)
Reference [12]:
In [12], the SOP optimization and the NR process are interactively performed, whereas, in the present work, these tasks are carried out in a simultaneous way. The simulation conditions and parameters are the same as in Case 2, but the voltage upper limit is considered at 1.05 p.u. and the light loading condition is at 50%. DG units are connected to busses 5, 17 and 21, and the SOP size is 3MVA. The two objective functions considered are f1 and f2.
Three solutions from MOAIS are shown in Table 9. OP#1 refers to the base case, that is, without SOP and NR; OP#2 consists of NR without SOP allocation and OP#3 is obtained from NR and the allocation of one SOP, where OP#3 maximizes HC. The ordered pairs are also indicated in the Pareto front in Figure 15. It should be noted that OP#1 and OP#2 are compatible with the solution from [12], and OP#3 has the maximum HC (399.86%), greater than that from [12] (379.32%). As in [12], OP#3 was obtained considering relaxed current limits.
(b)
Reference [14]:
In [14], the SOP optimization and the NR process are performed in a two-stage approach, whereas, in the present work, these tasks are carried out in a simultaneous way. For an analysis under the same conditions as [14], the data inputs of Table 10 are valid for this comparison.
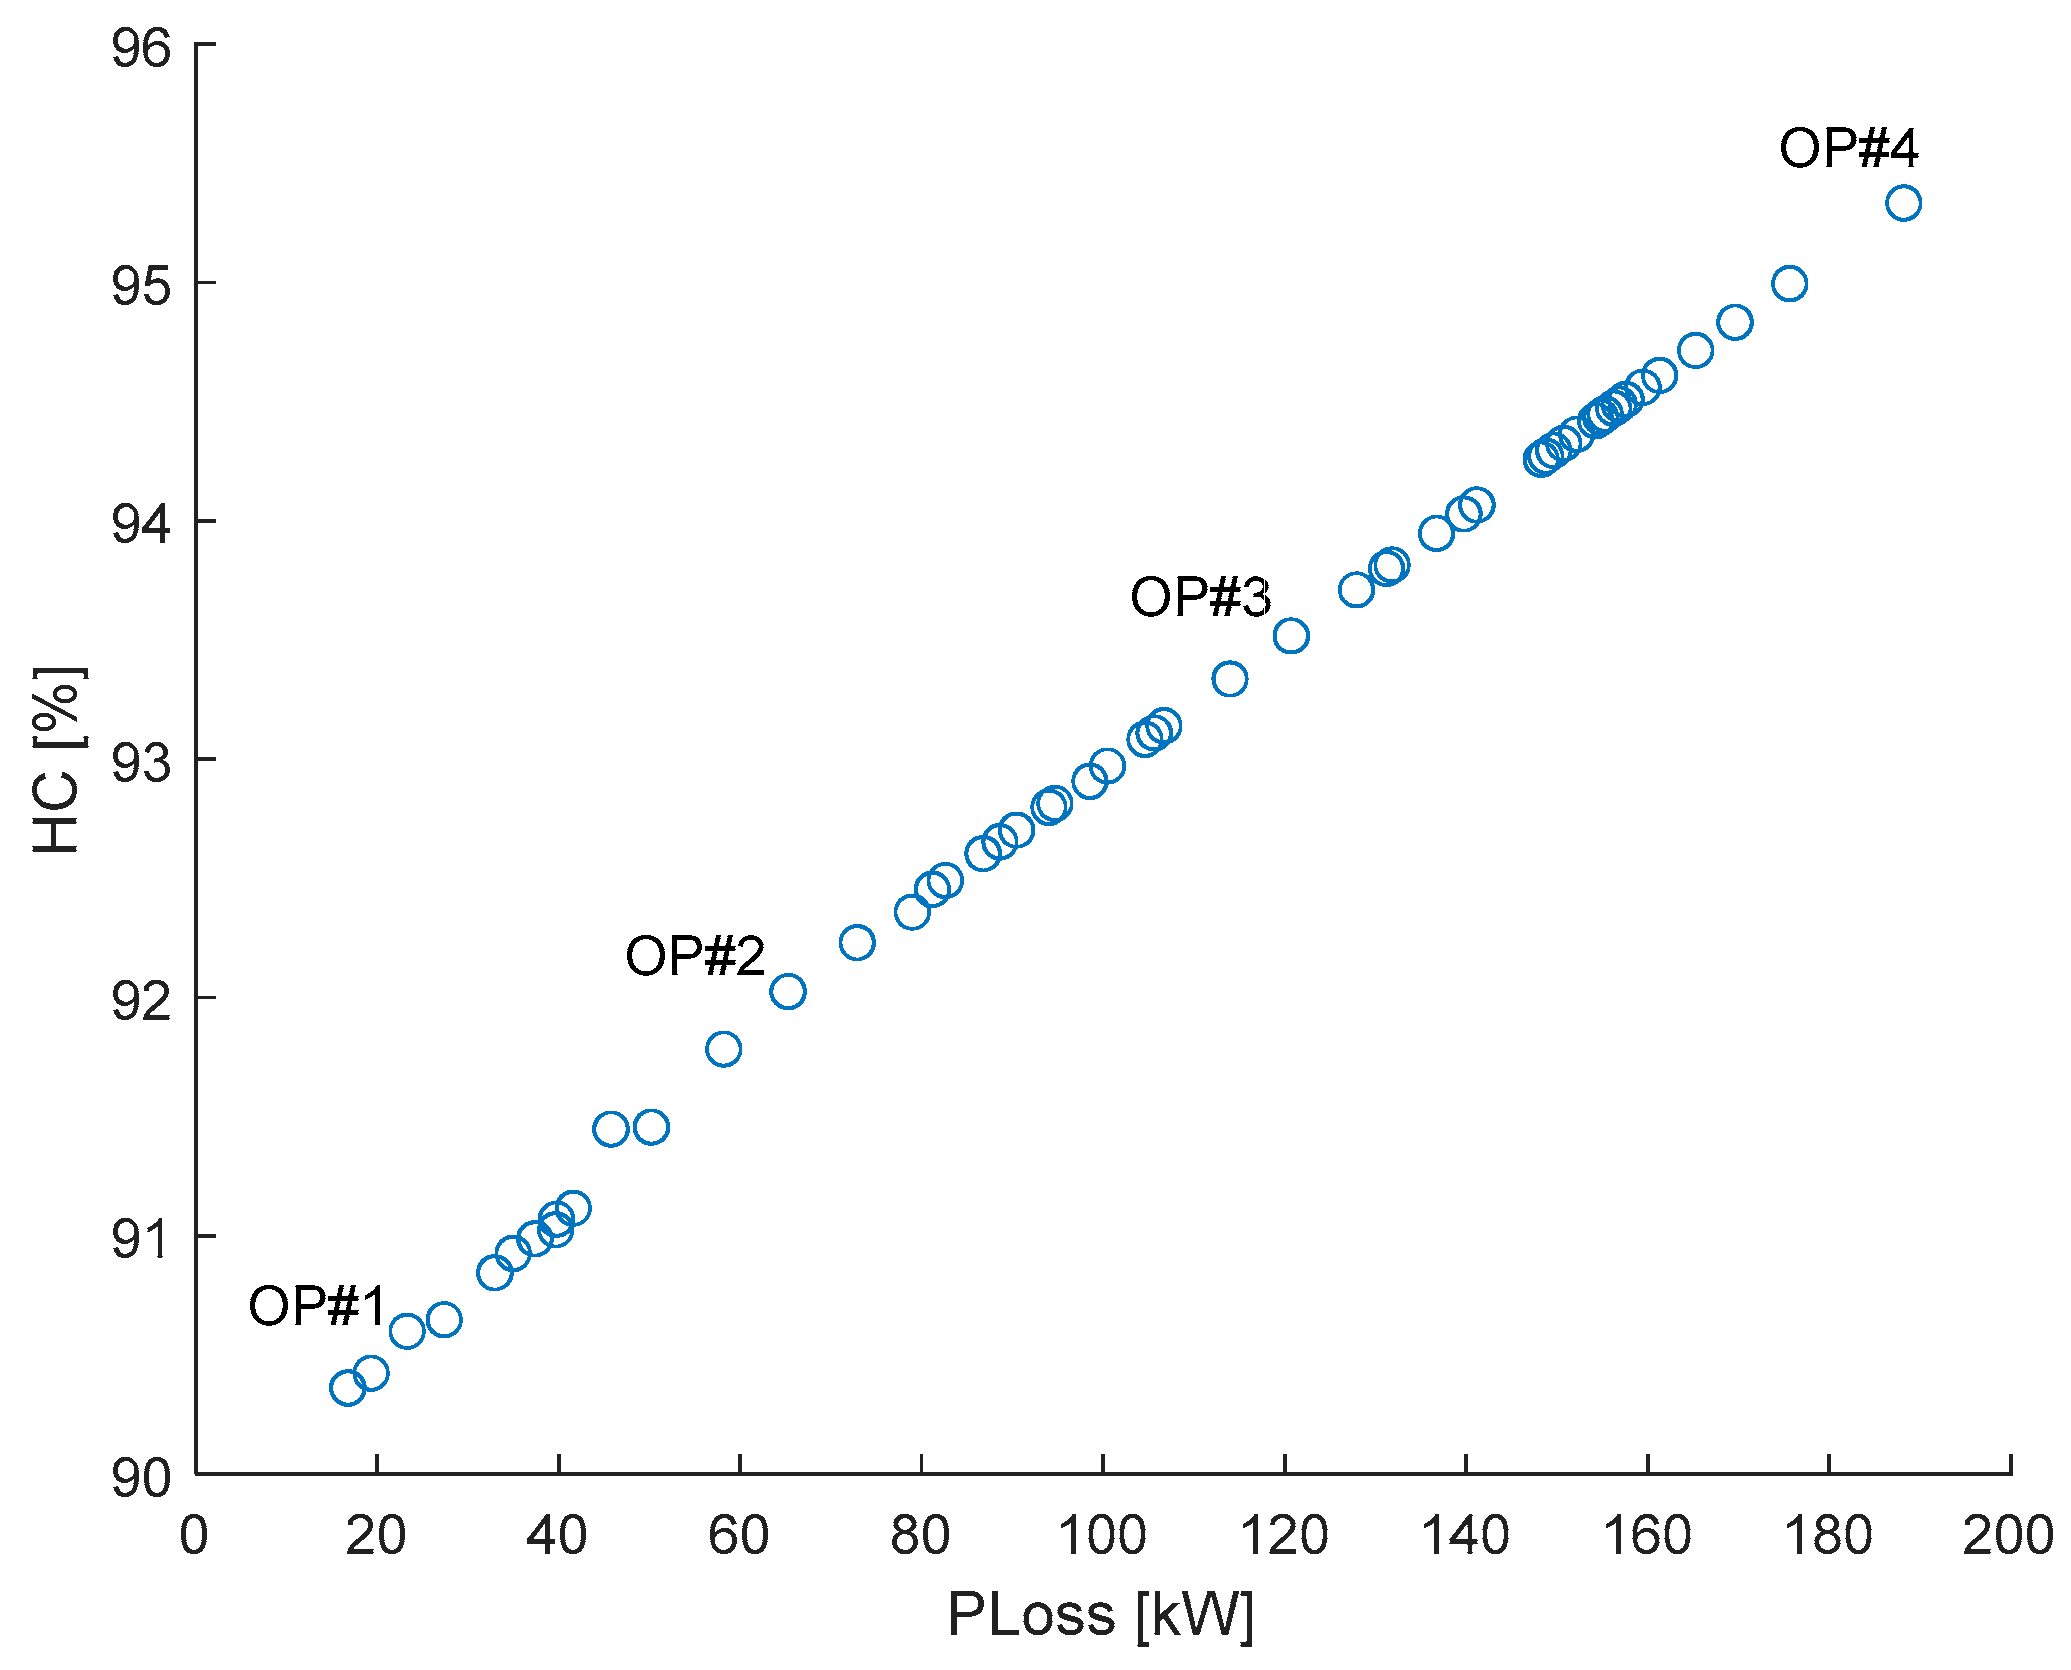
Moreover, as in [14], the following conditions are considered in this case: (i) reverse active power flow is not allowed from the distribution system to the substation; (ii) DGs power factor is 0.9 leading; (iii) maximum SOP size is 0.25MVA; (iv) DG units are at busses 5, 11, 16, 20, 23 and 31. In these conditions, the MOAIS was run for objective functions f1 and f2. Table 11 shows four solutions from MOAIS which are marked in Figure 16 and have an HC greater than the 86.8% denoted in [14]. In addition, from Figure 16, it can be seen that there is a wide range of nondominated solutions.
Therefore, MOAIS proves to be robust for the SOP allocation problem with simultaneous NR and, as also shown in the other case studies, MOAIS is able to provide a wide range of concurrent solutions.
The computation times for the case studies through the proposed MOAIS are shown in Table 12 and refer to average processing times. The MOAIS algorithm uses the search mechanism described in item 3.4, which depends on the parameters’ setup to lead an efficient search across the solution space with an acceptable computation effort. Good quality solutions are achieved even under the high complexity of a problem, associated with non-prohibitive computation times for the operation planning purpose and the standpoint that does not require real-time decisions; pointing to a potential application of MOAIS to the problem at hand.

5. Conclusions

The present paper proposed a new optimization-based approach for placing SOP in DN with simultaneous NR. The obtained results showed the ability of MOAIS to obtain the Pareto optimal front under a varying number of criteria, and to deal with the SOP allocation and NR problems in a simultaneous way through multi-objective analysis. The novelty lies in the proposed MOAIS algorithm that can handle the discrete variables related to both discrete problems, SOP allocation and NR, meeting the radial and connectivity topology constraints at the same time.
Table 13 shows a summary of the main comparative analyses considered in the case studies with respect to maximum HC. The results show the effectiveness of the proposed MOAIS compared to other approaches and prove it is robust for maximum HC determination. In addition, in Case 1, it was shown that MOAIS achieved a better result (minimum active power loss) in comparison with [16]—236.9 kW (MOAIS) × 247.8 kW [16]. Regarding Cases 3 and 4, from the obtained results, it can be concluded that a multiple allocation of SOPs can increase HC to levels that overcome 400%, without violating the system constraints related to current and voltage rates. However, the maximization HC affects other criteria, such as the minimization of the system power loss and investment cost in SOPs, which points to the need for a framework that can establish a good trade-off among all criteria and offer concurrent solutions to the planner.
The simultaneous and multi-objective approach proposed found good concurrent and well-distributed solutions in a wide range of the Pareto front in order to support the system planner with diverse options. In addition to the good distribution of concurrent solutions, the quality of the obtained frontiers was proven by comparisons with their solutions and others from the literature, as in Cases 1 and 5, as well as in Table 13. Thus, MOAIS provides solutions compatible or better than those from the literature, as well as other diverse plans that can be considered as good quality decisions by the system planner, depending on the planning criteria. Therefore, the proposed MOAIS proved to be a potential tool to support decision-makers in the planning task under the present requirements and constraints.
Other criteria, such as reliability and self-healing, should be included in the algorithm and analyses, which is promising for future investigations. Moreover, the inclusion of uncertainties regarding loads and DG output power in the MOAIS algorithm, considering daily loading profiles and real time-series of renewable resources, is a potential continuation of the present work.

Author Contributions

Conceptualization, L.W.d.O.; methodology, R.d.O.; software, R.d.O.; validation, E.J.d.O.; formal analysis, R.d.O., L.W.d.O. and E.J.d.O.; investigation, R.d.O.; data curation, L.W.d.O.; writing—original draft preparation, R.d.O.; writing—review and editing, L.W.d.O.; supervision, L.W.d.O. and E.J.d.O. All authors have read and agreed to the published version of the manuscript.

Funding

This research received no external funding.

Data Availability Statement

Not applicable.

Acknowledgments

This research was supported in part by CNPq, FAPEMIG, CAPES, Group SMART4GRIDS, and Instituto Nacional de Energia Elétrica (INERGE).

Conflicts of Interest

The authors declare no conflict of interest.

References

  1. REN21—Renewable Energy Policy Network for the 21st Century (2022) Renewables 2022 Global Status Report, Paris. Available online: https://www.ren21.net/wp-content/uploads/2019/05/GSR2022_Full_Report.pdf (accessed on 16 September 2022).
  2. IEA (International Energy Agency). Snapshot of Global PV Markets—2022. IEA Photovoltaic Power Systems Programme. Report IEA-PVPS T1-42:2022, 2022. Available online: https://iea-pvps.org/snapshot-reports/snapshot-2022/ (accessed on 16 September 2022).
  3. Abideen, M.Z.U.; Ellabban, O.; Al-Fagih, L. A Review of the tools and methods for distribution networks’ hosting capacity calculation. Energies 2020, 13, 2758. [Google Scholar] [CrossRef]
  4. Ismael, S.M.; Abdel Aleem, S.H.E.; Abdelaziz, A.Y.; Zobaa, A.F. State-of-the-art of hosting capacity in modern power systems with distributed generation. Renew. Energy 2019, 130, 1002–1020. [Google Scholar] [CrossRef]
  5. Cao, W.; Wu, J.; Jenkins, N.; Wang, C.; Green, T. Benefits analysis of soft open points for electrical distribution network operation. Appl. Energy 2016, 165, 36–47. [Google Scholar] [CrossRef] [Green Version]
  6. Wang, C.; Song, G.; Li, P.; Ji, H.; Zhao, J.; Wu, J. Optimal siting and sizing of soft open points in active electrical distribution networks. Appl. Energy 2017, 189, 301–309. [Google Scholar] [CrossRef]
  7. Qi, Q.; Wu, J.; Long, C. Multi-objective operation optimization of an electrical distribution network with soft open point. Appl. Energy 2017, 208, 734–744. [Google Scholar] [CrossRef]
  8. Jiang, X.; Zhou, Y.; Ming, W.; Yang, P.; Wu, J. An overview of soft open points in electricity distribution network. IEEE Trans. Smart Grid 2022, 13, 1899–1910. [Google Scholar] [CrossRef]
  9. Thomas, L.J.; Burchill, A.; Rogers, D.J.; Guest, M.; Jenkins, N. Assessing distribution network hosting capacity with the addition of soft open points. In Proceedings of the 5th IET International Conference on Renewable Power Generation (RPG), London, UK, 21–23 September 2016. [Google Scholar] [CrossRef] [Green Version]
  10. Ji, H.; Li, P.; Wang, C.; Song, G.; Zhao, J.; Su, H.; Wu, J. A strengthened SOCP-based approach for evaluating the distributed generation hosting capacity with soft open points. Energy Procedia 2017, 142, 1947–1952. [Google Scholar] [CrossRef]
  11. Liang, H.; Zhang, K.; Li, S.; Ge, L.; Wang, Q.; Han, T. Allowable DG penetration Capacity Calculation of SNOP-based flexible distribution network. In Proceedings of the China International Conference on Electricity Distribution, Tianjin, China, 17–19 September 2018. [Google Scholar] [CrossRef]
  12. Qi, Q.; Wu, J. Increasing distributed generation penetration using network reconfiguration and soft open points. Energy Procedia 2017, 105, 2169–2174. [Google Scholar] [CrossRef]
  13. Ji, H.; Wang, C.; Li, P.; Zhao, J.; Song, G.; Wu, J. Quantified flexibility evaluation of soft open points to improve distributed generator penetration in active distribution networks based on difference-of-convex programming. Appl. Energy 2018, 218, 338–348. [Google Scholar] [CrossRef]
  14. Abbas, A.S.; Abou El-Ela, A.A.; El-Sehiemy, R.A. Maximization approach of hosting capacity based on uncertain renewable energy resources using network reconfiguration and soft open points. Int. Trans. Electr. Energy Syst. 2022, 2022, 14. [Google Scholar] [CrossRef]
  15. Diaaeldin, I.M.; Abdel Aleem, S.H.E.; El-Rafei, A.; Abdelaziz, A.Y.; Calasan, M. Optimal soft open points operation and distributed generations penetration in a reconfigured Egyptian distribution network. In Proceedings of the 25th International Conference on Information Technology (IT), Zabljak, Montenegro, 16–20 February 2021. [Google Scholar] [CrossRef]
  16. Qi, Q.; Wu, J.; Zhang, L.; Cheng, M. Multi-objective optimization of electrical distribution network operation considering reconfiguration and soft open points. Energy Procedia 2016, 103, 141–146. [Google Scholar] [CrossRef]
  17. Ali, Z.M.; Diaaeldin, I.M.; El-Rafei, A.; Hasanien, H.M.; Abdel Aleem, S.H.E.; Abdelaziz, A.Y. A novel distributed generation planning algorithm via graphically-based network reconfiguration and soft open points placement using Archimedes optimization algorithm. Ain Shams Eng. J. 2021, 12, 1923–1941. [Google Scholar] [CrossRef]
  18. Diaaeldin, I.M.; Abdel Aleem, S.H.E.; El-Rafei, A.; Abdelaziz, A.Y.; Zobaa, A.F. Enhancement of hosting capacity with soft open points and distribution system reconfiguration: Multi-objective bilevel stochastic optimization. Energies 2020, 13, 5446. [Google Scholar] [CrossRef]
  19. Oliveira, L.W.; Oliveira, E.J.; Gomes, F.V.; Silva Junior, I.C.; Marcato, A.L.M.; Resende, P.V.C. Artificial Immune Systems applied to the reconfiguration of electrical power distribution networks for energy loss minimization. Int. J. Electr. Power Energy Syst. 2014, 56, 64–74. [Google Scholar] [CrossRef]
  20. Oliveira, L.W.; Seta, F.S.; Oliveira, E.J. Optimal reconfiguration of distribution systems with representation of uncertainties through interval analysis. Int. J. Electr. Power Energy Syst. 2016, 83, 382–391. [Google Scholar] [CrossRef]
  21. Da Silva Seta, F.; Oliveira, L.W.; Oliveira, E.J. Comprehensive approach for distribution system planning with uncertainties. IET Gener. Transm. Distrib. 2019, 13, 5467–5477. [Google Scholar] [CrossRef]
  22. Seta, F.S.; De Oliveira, L.W.; De Oliveira, E.J. Distribution system planning with representation of uncertainties based on interval analysis. J. Control. Autom. Electr. Syst. 2020, 31, 494–510. [Google Scholar] [CrossRef]
  23. Michalewicz, Z.; Fogel, D.B. How to Solve it: Modern Heuristics; Springer Science & Business Media: Berlin/Heidelberg, Germany, 2013. [Google Scholar] [CrossRef]
  24. Castro, L.N.; Von Zuben, F.J. Learning and optimization using the clonal selection principle. IEEE Trans. Evol Comput. 2002, 6, 239–251. [Google Scholar] [CrossRef]
  25. Civanlar, S.; Grainger, J.J.; Yin, H.; Lee, S.S.H. Distribution feeder reconfiguration for loss reduction. IEEE Trans Power Deliv. 1988, 3, 1217–1223. [Google Scholar] [CrossRef]
  26. Baran, M.E.; Wu, F.F. Network reconfiguration in distribution systems for loss reduction and load balancing. IEEE Trans Power Deliv. 1989, 4, 1401–1407. [Google Scholar] [CrossRef]
  27. Shin, J.R.; Kim, B.S.; Park, J.B.; Lee, K.Y. A new optimal routing algorithm for loss minimization and voltage stability improvement in radial power system. IEEE Trans. Power Syst. 2007, 22, 648–657. [Google Scholar] [CrossRef]
  28. Gong, M.; Jiao, L.; Du, H.; Bo, L. Multiobjective Immune Algorithm with Nondominated Neighbor-based Selection. Evol. Comput. 2008, 16, 225–255. [Google Scholar] [CrossRef]
  29. Deb, K.; Pratap, A.; Agarwal, S.; Meyarivan, T. A fast and elitist multiobjective genetic algorithm: NSGA-II. IEEE Trans. Evol. Comput. 2002, 6, 182–197. [Google Scholar] [CrossRef]
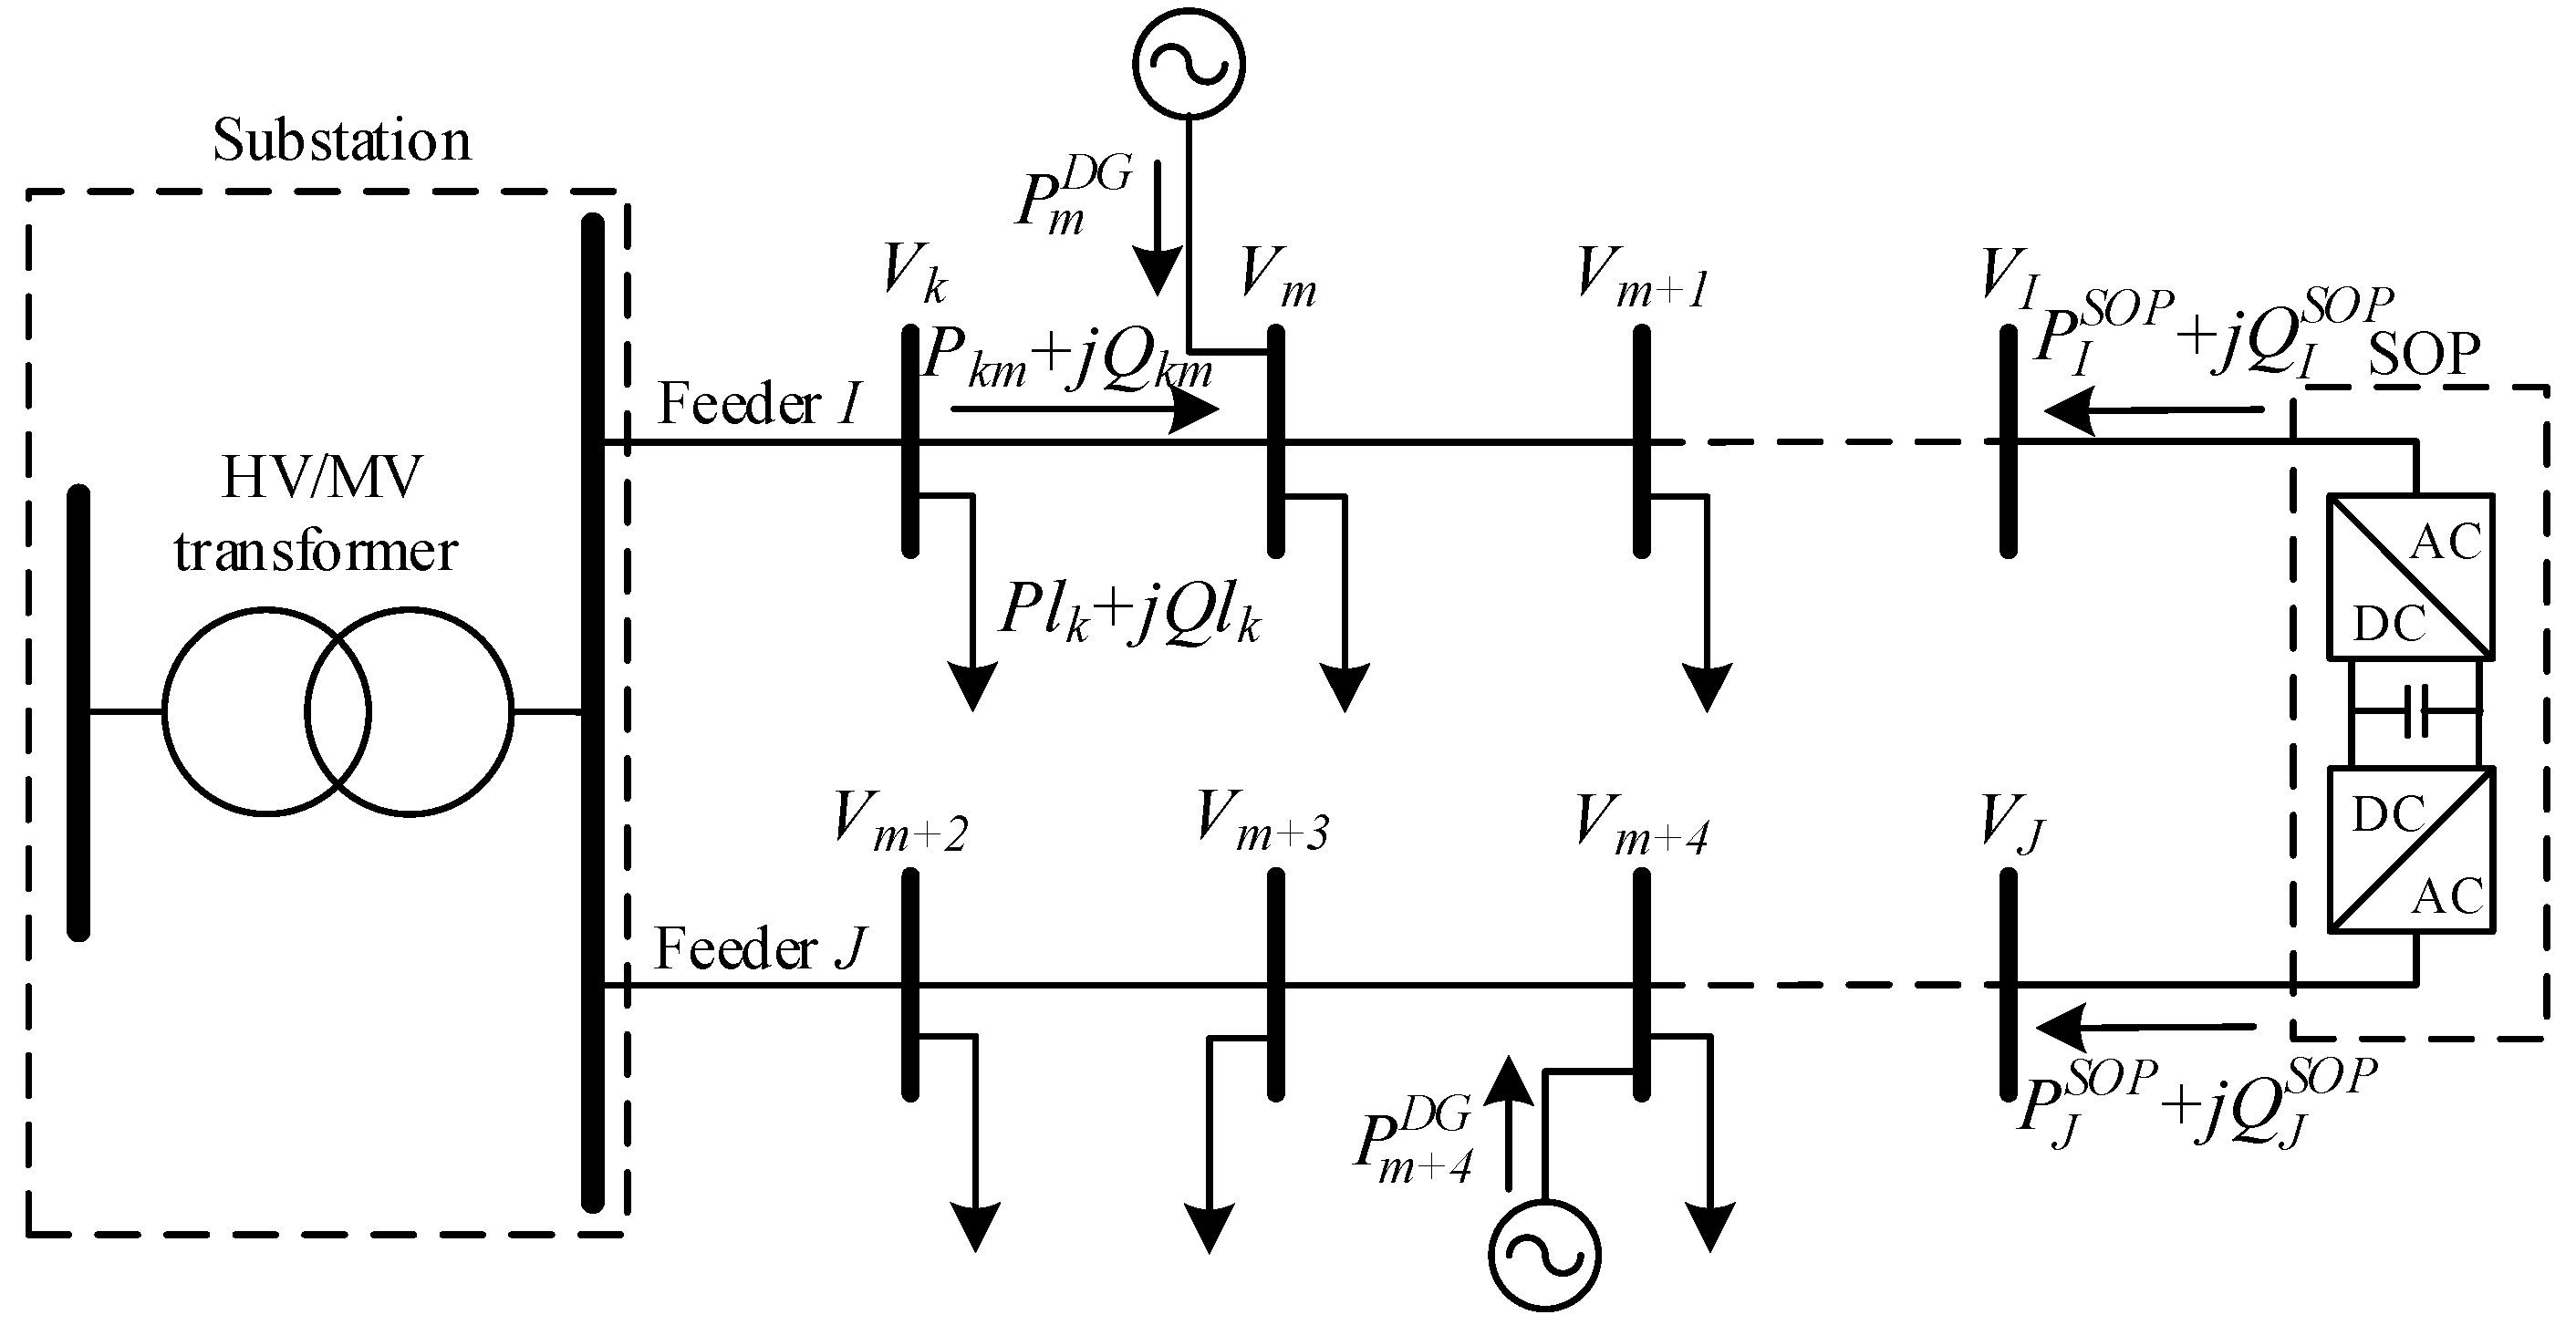
Figure 1. Medium-voltage DN with a SOP connected.
Energies 16 01035 g001
Figure 2. AIS/CLONR flowchart [19].
Energies 16 01035 g002
Figure 3. Proposed MOAIS flowchart.
Energies 16 01035 g003
Figure 4. Tutorial system from [19].
Energies 16 01035 g004
Figure 5. Candidate solution having an SOP at branch S10.
Energies 16 01035 g005
Figure 6. MV 33-bus distribution system in the modified form.
Energies 16 01035 g006
Figure 7. Pareto front of Case 1.
Energies 16 01035 g007
Figure 8. Dispersion of the MOAIS simulations, Case 1.
Energies 16 01035 g008
Figure 9. Pareto front of Case 2.
Energies 16 01035 g009
Figure 10. Dispersion of the MOAIS simulations, Case 2. HC on the left (a) and PLoss on the right (b).
Energies 16 01035 g010
Figure 11. Pareto front of Case 3.
Energies 16 01035 g011
Figure 12. Pareto front of Case 4.
Energies 16 01035 g012
Figure 13. 2-D Pareto front (PLoss × HC).
Energies 16 01035 g013
Figure 14. 2-D Pareto front (CSOP × HC).
Energies 16 01035 g014
Figure 15. Pareto front for comparison with [12].
Energies 16 01035 g015
Figure 16. Pareto front for comparison with [14].
Energies 16 01035 g016
Table 1. Summary of the previous single- and multi-objective optimization approaches.
Ref.Single-
Objective
Multi-ObjectiveSOP AllocationNR and SOP Allocation
Max
HC
Max
HC
Min
PLoss
Min
SOP costs
Other MetricsSiteSize
[7]LimitedPredefinedTwo-step
[10]LimitedPredefinedOnly SOP allocation
[11]LimitedPredefinedOnly SOP allocation
[12]PredefinedIterative
[13]LimitedPredefinedOnly SOP allocation
[14]Two-step
[15]Two-step
[16]PredefinedTwo-step
[17]Iterative
[18]Iterative
Proposed
approach
Simultaneous
Table 2. MOAIS Parameters.
ParameterValue
Population size (NAb)2 × nvar
gmax100
β20
ρρ1 = 1.0; ρ2 = 0.2
gest(20/100) × gmax
n(10/100) × NAb
d(5/100) × NAb
Table 3. General data and input parameters.
ParameterValueParameterValue
V ¯ k min (p.u.)0.95λ0.08
V ¯ k max (p.u.)1.08q (years)20
I ¯ k m max (A)300 [16]α0.01 [6]
cSOP ($/kVA)308.8 [6]
Table 4. Optimal solutions from [16].
Power
Loss
(kW)
Open SwitchesSOP
Site
SOP Outputpowers
(MW, MVAr, MVAr)
P I S O P 1 Q I S O P 1 Q J S O P 1
496.92B9-B14-B28-B32B7−0.476−0.709−1.720
444.90B7-B14-B28-B32B9−0.048−1.113−0.636
465.48B7-B9-B28-B32B140.382−1.023−0.683
268.98B7-B9-B14-B32B28−0.0770.2201.252
247.80B7-B9-B14-B28B320.5141.0150.327
Table 5. Nondominated solutions from MOAIS, Case 1.
Power
Loss
(kW)
HC
(%)
OP
#
Open
Switches
SOP SiteSOP Output Powers
(MW, MVAr, MVAr)
P I S O P 1 Q I S O P 1 Q J S O P 1
234.81114.381B8-B12-B16-B20-B28--------
235.77126.922B8-B14-B16-B20-B28--------
236.33135.983B7-B16-B21-B26-B34--------
236.902004B7-B10-B13-B27B301.8950.3850.446
Table 6. Nondominated solutions from MOAIS, Case 2.
Power
Loss
(kW)
HC (%)OP #Open
Switches
SOP SiteSOP Outputpowers
(MW, MVAr, MVAr)
P I S O P 1 Q I S O P 1 Q J S O P 1
250.38144.831B7-B25-B34-B35-B36--------
261.48155.852B8-B11-B16-B28-B33--------
296.33173.833B8-B10-B27-B32-B33--------
402.79184.144B7-B14-B24-B34-B35--------
424.92211.035B7-B9-B14-B28-B34--------
509.62216.126B13-B19-B25-B34-B35--------
1265.41297.307B10-B14-B24-B33B25−0.0032.000−1.107
1345.47302.658B10-B14-B25-B33B22−0.5381.925−0.672
1570.33306.709B7-B9-B14-B23B25−0.7231.864−0.521
1596.45307.9010B14-B22-B25-B33B70.1551.991−0.563
2153.38313.0411B7-B11-B21-B22B25−0.1931.989−0.836
2168.48313.1412B7-B10-B21-B22B25−0.2441.984−0.838
2536.25317.4513B7-B12-B25-B33B22−0.1071.995−0.868
2558.45317.7314B7-B12-B22-B33B25−0.1011.997−0.873
2595.51318.7815B7-B21-B22-B34B25−0.0831.996−1.038
Table 7. Nondominated solutions from MOAIS, Case 3.
CSOP
($ × 1000)
HC
(%)
OP
#
Open
Switches
SOP
Site
SOP Size
(MVA)
0.00199.931B3-B8-B10-B15-B22----
49.30232.412B4-B10-B12-B32B21.43
51.99243.903B2-B4-B9-B15B211.51
68.19269.354B2-B6-B11-B35B261.97
71.44286.425B3-B11-B14-B28B172.07
118.72312.716B5-B15-B21-B34B233.44
169.83314.097B10-B19-B23-B36B344.92
245.43349.438B4-B8-B10-B33B247.11
339.19358.859B6-B27-B33B13-B215.01/4.81
440.62376.6010B8-B27-B34B3-B168.28/4.48
441.52391.4311B6-B22-B33B9-B185.77/7.01
559.05400.8212B7B14-B17-B24-B332.82/6.55/6.33/0.48
736.18411.8513--B7-B8-B14-B24-B324.19/1.87/2.55/6.15/6.55
778.96415.3214--B7-B8-B14-B32-B372.61/1.31/5.40/5.75/7.48
877.29416.6915--B7-B8-B14-B20-B373.55/3.57/3.72/7.78/6.79
952.34421.5716--B3-B10-B14-B28-B316.67/0.65/3.68/7.04/9.53
Table 8. Some solutions from the Pareto front.
CSOP
($ × 1000)
PLoss
(kW)
HC
(%)
OT
#
Open
Switches
SOP
Site
SOP Size
(MVA)
0.00558.37216.261B3-B14-B15-B21-B26----
129.621902.13317.432B7-B9-B14-B24B303.75
366.122812.50351.643B7-B11-B13B8-B273.49/7.11
424.633205.14363.294B4-B10-B35B16-B235.36/6.93
461.913401.81368.345B9-B26B13-B20-B344.15/5.92/3.31
875.464353.75394.216B4B10-B13-B24-B306.32/4.98/7.09/6.95
557.952866.27352.757--B6-B10-B13-B24-B295.92/1.27/0.84/5.79/2.32
Table 9. Nondominated solutions from MOAIS, comparison with [12].
Power
Loss
(kW)
HC
(%)
OP #Open
Switches
SOP Site
99.1278.911B33-B34-B35-B36-B37--
214.41146.032B8-B10-B17-B27-B33--
8670.90399.863B2-B28-B34-B35B07
Table 10. General data and input parameters, Case 5b.
ParameterValueParameterValue
V ¯ k min (p.u.)0.95Loading level (%)90
V ¯ k max (p.u.)1.05 I ¯ k m max (A)300
Table 11. Nondominated solutions from MOAIS, comparison with [14].
Power
Loss
(kW)
HC
(%)
OP #Open
Switches
SOP SiteSOP Size
(MVA)
23.3190.601B7-B14-B33-B37B340.10
65.2992.022B10-B20-B32-B34B30.25
120.7193.523B2-B8-B10-B27B210.25
188.2195.334B2-B11-B24-B35B290.25
Table 12. Average computation times from MOAIS.
Case StudyAverage Time (s)
1650.8
21133.8
32572.7
42721.7
5a1031.1
5b1402.8
Table 13. Comparative analysis of maximum HC (Literature × MOAIS).
Case StudyMaximum Hosting Capacity (%)
ReferenceProposed MOAIS
1 [16]—Limited to 200%Limited to 200%
5a [12]—379.32399.86
5b [14]—86.8095.33
Disclaimer/Publisher’s Note: The statements, opinions and data contained in all publications are solely those of the individual author(s) and contributor(s) and not of MDPI and/or the editor(s). MDPI and/or the editor(s) disclaim responsibility for any injury to people or property resulting from any ideas, methods, instructions or products referred to in the content.