Abstract
The transportation sector has the highest energy demand worldwide and bears the primary responsibility for CO2 emissions. Electromobility has emerged as the most feasible way to alleviate this problem. However, its potential depends heavily on the development of renewable energies. Island regions raise additional barriers to electromobility due to their heavy dependence on fossil fuels. This article addresses this challenge by presenting a comprehensive well-to-wheel framework to assess the levels of efficiency and CO2 emissions of electromobility options such as battery and plug-in electric vehicles (BEVs and PHEVs). The results were compared with those for internal combustion engine vehicles (ICEVs). The framework proposed takes account of various factors including the extraction, refining, and transport of oil, different segments of land vehicles, and electricity system operations. The framework is demonstrated with a case study of the Spanish Canary archipelago. The results show that BEVs improve efficiency and CO2 emissions by around 30% compared to ICEVs on islands where the share of renewable energies is higher than 21%. In contrast, limited renewable generation may lead to BEVs polluting up to 15% more than ICEVs. PHEVs should be considered as a suitable alternative if the share of renewable generation is higher than 35%.
1. Introduction
The last decade has been decisive in terms of countries’ agreeing to tackle the impact of climate change [1]. The European Union (EU) stands as the head promoter of this measure, leading the race toward energy transition [2,3]. Through its Next Generation EU recovery package, the EU has provided long-term funding to boost greener and more resilient economies [4]. The support packages cover a wide range of energy sectors including land transportation; this sector is the most important due to its weight and impact on consumption, pollution, and public health. According to the International Energy Agency, transportation is the highest energy-demanding sector worldwide, with road transport having the most extensive impact on final energy consumption, accounting for 21% of that consumption. Fossil fuels used in land transport produces 24% of the total CO2 emissions [5]. Achieving climate goals requires massive changes to this sector including investment in sustainable transportation and zero-emission mobility [6]. From a technical perspective, improvements in vehicle consumption are key to coping with the decarbonization goals established by the EU. Recent regulatory requirements push automakers to reduce the emissions of their fleets sold to below 95 g CO2/km by imposing penalties for non-compliance [7,8].
Although internal combustion engine vehicles (ICEVs) will continue to dominate the market in the near future, the car industry is diversifying the alternatives to include vehicles using alternative fuels such as liquefied petroleum gas (LPG) or hybridized vehicle fleets [9]. The production of plug-in electric vehicles (PEVs) has been expanding annually, becoming a potential solution to lessen energy consumption and greenhouse gas (GHG) emissions. In contrast, fuel cell electric vehicles powered by hydrogen appear only as a long-term alternative due to the current lack of infrastructure development.
The electrification of a light-duty vehicle fleet appears to be the most feasible means to reduce energy consumption and emissions in European countries. The high penetration of renewables and the poor share of fossil fuel electricity production make it possible for most continental areas of the EU to reduce urban pollution and emissions outside of the vehicles. However, the advantages of PEVs are reduced by the intensive use of oil-derivate fuels in electricity production, which is the case in some remote regions in the EU.
The Azores and Madeira (Portugal), Guadeloupe, Martinique, Mayotte, Reunion Island and Saint Martin (France), and the Canary Islands (Spain) are the outermost archipelagos of the EU. These islands have a population of close to 4.7 million inhabitants (which represents around 1% of the total of the EU-27) and are highly dependent on tourism (18 million visitors per year) [10]. The Canary Islands account for almost half the total population, about 85% of the visitors, and the largest GDP of the archipelagos. Currently, 96% of its primary energy sources are derived from oil, and nearly 20% of the electricity sector production is in renewables. Land transportation is the primary consumer sector (accounting for 34% of final consumption) [11]. Consequently, more aggressive action is required to achieve carbon neutrality. In this context, the government has declared a climate emergency [12]. Aligned with European policies and the Spanish framework, the regional government has proposed a singular strategy to decarbonize the economy of the Canary Islands [13,14]. The Energy Transition Plan for the Canary Islands (PTECan) sets intermediate goals for 2030 and a goal of carbon neutrality by 2040 [14].
Despite the current dominance of oil in the energy sector in the Canary Islands, progress on renewables in these isolated systems during the next decade will impact the positive contribution of PEVs to improve energy efficiency and reduce emissions in land transport. This paper assesses the impact of a representative pool of light-duty vehicles classified by powertrains and segments. A well-to-wheels (WtW) methodology was applied to evaluate the energy consumption and CO2-eq emissions by these island systems. Two scenarios were addressed: (i) the base case, which was the electricity mix for the year 2021 for different charging schedules (off-peak, mid-peak and on-peak); and (ii) future scenarios proposed in PTECan (2030). These scenarios will allow us to evaluate the impact on WtW of a high diversity of electricity mixes ranging from 100% conventional to nearly 70% planned on regional energy strategies.
This work contributes to the literature on PEVs as a way to reduce emissions in isolated systems by analyzing the potential policy measures with reference to the current situations and future scenarios. The results obtained from this case study can be applied in similar regions and act as a benchmark for the development of sustainable mobility strategies in island territories.
The rest of this paper is organized as follows. Section 2, the methods section, sets out the WtW methodology and reviews the relevant literature. The WtW modeling and different pathways and scenarios are also discussed. Section 3 presents the results, and policy implications are discussed in Section 4. Concluding remarks are presented in Section 5.
2. Methods
This section proceeds as follows. First, the methodology and literature review are presented. Second, the energy context of the Canary Islands is described and the current and medium-term (2030) energy scenarios are detailed. The electricity mixes are crucial in determining the impacts of PEVs on energy consumption and emissions, as revealed in the results section. The WtW modeling and the different scenario pathways are then presented. Finally, the car sales on the Canary Islands were used to build a car inventory.
2.1. Methodology Background
Various methodologies can used to assess the impacts of vehicles during their useful life. Two of the main ones are life cycle analysis (LCA) and WtW. The former is a widely used methodology that evaluates the impacts as the entire environmental footprint of a defined product (see Figure 1a). This form of assessment covers all sources required for the manufacturing (step 1) and construction (step 2) process (water, energy, materials, and others), the resources used during the product lifespan (step 3), and the second-life or post-treatment performed when it becomes obsolete (step 4) [15].
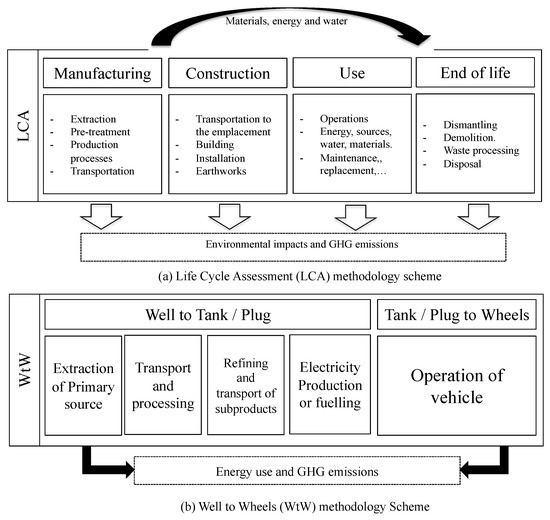
Figure 1.
Life cycle assessment and well-to-wheels methodology schemes.
There are limitations in assessing manufacturing, the first step in the LCA, due to the lack of information from the manufacturers and suppliers. There are some generic databases about the materials and manufacturing process impacts [16]. However, vehicle manufacturing and its components depend on a country’s energy mix and water resources. As such, each vehicle model has its own supply chain and logistics, making it almost impossible to collect all of the required information. The same challenge is faced in the final step, the end-of-life evaluation; some case studies were identified, but these depend on multiple conditions and general databases [17,18].
The method most often used to evaluate the impacts on emissions and energy consumption is the WtW, which covers the vehicle’s operation [19]. The method partially maps onto the third step of the LCA and depends directly on where the vehicle is located and used. Hence, the collection of data seems to be more accurate when the vehicle database is large, as in this case.
WtW methodology is a specific LCA broadly used in respect of transporting fuels and vehicles (see Figure 1b) [20]. The analysis is divided into two stages. The first stage, well-to-tank (WtT) for internal combustion cars, or well-to-plug (WtP), for plug-in cars, includes the assessment of primary source extraction, transport, processing to elaborate fuel subproducts, transport of subproducts to the refueling station, and electricity production to the charger just for PEVs. The second stage, tank-to-wheels (TtW) for ICEVs and plug-to-wheels (PtW) for PEVs, assesses the vehicle operation, which is unique for each vehicle model, but similar between different vehicle powertrain technologies and body types (segments). Finally, the WtW methodology quantifies the energy use and GHG emissions from the well of extraction of the principal sources to the wheels of the vehicle during its operation.
2.2. Literature Review
The existing literature includes several in-depth studies of light-duty vehicle consumption and emissions using the WtW method. Most emphasize that the advantages of PEVs lie in their potential energy efficiency and low GHG emissions powered by an intensive renewable mix. For example, the European Commission and the Join Research Center performed a WtW assessment of future automotive fuels and powertrains in the European context for hundreds of alternative fuel sources (pathways) [16]. They concluded that the possible hybridization of conventional engine technologies could provide further energy and GHG-emission benefits. In respect of the PEV, its powertrain is more efficient than that of ICEVs, reducing the overall energy usage despite GHG emissions depending critically on the source of the electricity.
A recent study addressed the latter issue in depth, conducting a WtW comparison of 143 countries according to their different electricity mixes [21]. The authors concluded that 52 countries were under the threshold of the ICEV fuel economy (51 miles per gallon equivalent), meaning that for countries such as China, India, and several African countries, it is less polluting to drive an ICEV than a battery electric vehicle (BEV). These countries are characterized by the intensive use of oil-derivate fuels and coal in their electricity production. The use of BEVs improves the fuel economy in other countries such as Iceland, Paraguay, and Norway in which the electricity source is nearly 100% renewable [21].
Other studies have evaluated different future scenarios for places with coal-intensive mixes such as Beijing (China) using real-world data and end-of-pipe emissions control [22]. The authors note that BEVs can reduce WtW CO2 compared with ICEVs even with the high emission ratio of the system. In general, the literature presents BEVs as a technology with the potential to reduce impacts. In one example, Haugen et al. evaluated the pathways offering the best potential energy efficiency and low-carbon potential powertrain technologies (fuel cell hydrogen and battery electric cars). The authors concluded that BEVs optimize energy in renewable systems compared with fuel cell hydrogen alternatives [23].
In the WtW literature presented, the transportation of fossil fuels gains relevance when remote locations need to be supplied. There have been a set of studies to address the impact of light-duty vehicles in such territories. For example, a recent study evaluated the energy consumption and emissions of the different powertrains in real-life conditions on the island of Tenerife. The authors found that the current high carbon emissions of the electricity mix and the large size of batteries in BEVs limit their potential benefits [24]. Similarly, another study evaluated the emissions through a LCA by comparing generic ICEVs and BEVs in the Canaries. These results reveal that a normalized BEV pollutes more in islands with poor renewable presence [25].
We extracted a general conclusion from the existing studies: the energy efficiency and the GHG-equivalent emissions of PEVs are highly dependent on the renewable share of the electricity mix. However, there are several nuances to this. For example, there is a large variety of light-duty vehicles in the market (more than 400 types of light-duty vehicles in the new registrations) belonging to different segments and powertrains. Each of these models has a particular market share that could be used to determine an average representative market car of the technology and segment. Furthermore, from the WtW perspective, charging efficiency and management have a crucial role in reducing the global impacts of PEVs. It is also important to analyze the impact on near-future scenarios with a potential high renewable share to understand the impact of today’s PEVs.
Our contribution to the literature is an analysis of the case of island territories. The study meets many of the characteristics described above in that it considers: (i) a remote area for fuel transport by tankers; (ii) an isolated electric power systems, characterized by difficulties in the introduction of renewables (with a share of around 21%) and high electricity losses from the grid (over 8%); (iii) that the mobility routines of island inhabitants cover fewer kilometers per day than continental users, impacting the charging patterns of PEVs; and (iv) a car market where sport utility vehicles (SUV) have dominated new registrations in previous years (reaching more than half of total new car registrations) [26]. The results provide information relevant to policy development or investment decisions based on environmental awareness related to light-duty vehicle transportation.
2.3. WtW Modeling: The Canary Island Case Study
The following subsection explains how the case study proposed is modeled. First, the aim and scope of the model are defined. Second, a basic model and the scenarios are detailed. Third, the database is extended in relation to the first part of the methodology, from the extraction of crude oil to its importation to the islands as a final product. Next, the scenarios proposed for analyzing the different insular electrical systems in the Canary Islands are set out. Finally, the database related to the vehicle inventory is described.
2.3.1. Aim and Scope
The aim of this WtW assessment is the quantification and analysis of the impacts of the different light-duty-vehicle powertrains and body types in terms of global energy consumption and total GHG emissions in the isolated region of the Canary Islands.
The analysis covers the impacts of fuel production and logistics processes on energy usage in the operation of vehicles. This study attempts to identify the impact of electricity mixes on the transport sector, specifically for PEVs. Data were from the six electric power systems in the Canaries for 2021 and categorized this into four different charging schedules: (i) average; (ii) off-peak, (iii) mid-peak, and (iv) on-peak times. In addition, the impact of renewable deployment in PEVs in the next decade was analyzed in terms of the PTECan strategy. Specifically, the four isolated systems that make up the archipelago for PEVs were evaluated.
The car inventory was collected from 2019 (pre-COVID) new-car registrations in the Canary Islands and classified by powertrains and segments. The powertrains were divided into seven categories: ICEVs (i) using gasoline, (ii) using diesel, (iii) using LPG, ICEV hybrids, (iv) mild hybridization electric vehicles (MHEVs), and (v) full hybridization electric vehicles (HEVs) and PEVs in the form of either (vi) plug-in electric vehicles (PHEVs) or BEVs. Five different body types (segments) were considered: urban (A), compacts (B&C), large (D&E), SUVs (J), and VANs (M). Finally, the focus was solely on the WtW excluding:
- Material extraction and transportation to build car components and their transportation to the automobile assembly centers; excluded mainly due to the lack of information from the manufacturers and material providers for each car model.
- End-of-life alternatives; there are several ways to reduce the impact by extending the life of vehicles or their components, but this depends on multiple parameters and exceeds the aim of this work.
2.3.2. WtW Modeling
The WtW methodology requires specific modeling, which was developed in Python 3.7, and implicates several databases for the processes in each pathway (see Figure 2). A series of different pathways were included in the models, building on each process step (s) in turn, from fuel production to the vehicle’s wheels (defined in a total of s steps). For the WtT or WtP pathways (Figure 2a), a Monte Carlo experiment was executed for each path (1.000 simulations). In the case of PEVs, this simulation was combined with the scenarios proposed for the different Canary Island systems in 2021 and 2030 (PTECan).
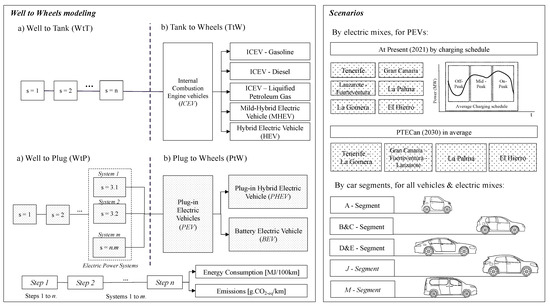
Figure 2.
Modeling scheme.
In the second step, the TtW and PtW (Figure 2b) were evaluated. This modeling accounts for the energy consumption and emissions for the Canary Islands’ fleet of newly registered cars. Finally, the two parts were combined by mixing multiple scenario pathways. For the ICEVs (gasoline, diesel, LPG, MHEVs, and HEVs), the results were disaggregated by segments (A, B&C, D&E, J, and M). In the case of PEVs, which include PHEVs and BEVs, the results depend on the various charging conditions of the electric power systems. For this case, the simulation was combined with the scenarios proposed for the different Canary Island systems in 2021 (by electricity system and charging schedule) and 2030 (PTECan).
Likewise, for the PEVs, the previously used vehicle segments were again considered. The present study evaluated a total of 35 and 280 pathways for the ICEVs and PEVs, respectively, in terms of energy consumption (MJ/100 km) and total emissions (g CO2-eq/km). Finally, the WtW energy consumption per km covered by vehicles was calculated according to Equation (1):
where s represents the step number (see Figure 2), and WtW energy consumption (WtWcons.) is the total energy consumed from the well-to-wheels of the cars for each unit of distance covered (measured in MJ/100 km). The WtT or WtP (for PEVs) total expended energy is the total energy expended per fuel or electricity transported to the refueling station of the charging station. Finally, the TtW car consumption is the worldwide harmonized light vehicle test procedure (WLTP) homologation expressed in MJ per 100 km [27].
WtWcons. = (Σi = 1,…,s (1 + WtTcons., s)) s · TtWWLTP, cons
In terms of emissions from WtW (Equation (2)), the summary of the emission focus was considered. From the WtT or WtP, the emission for each focus (s = 1 to 7) should be multiplied by the total energy consumed from this step.
WtWCO2. = (Σj = 1,…,s (1 + ntWcons, s) · WtTCO2, s) s · TtWWLTP, CO2
The sum of a path’s emissions (WtWCO2, s) was translated from the vehicle per distance covered (in g CO2-eq/km). The variable WtTCO2, s, represents the emissions focus for each step s (measured in g CO2-eq/MJ). Finally, ntWs is the energy consumed from the wheels to the emission focus, and TtWWLTP, CO2 is the WLTP homologated by vehicle, expressed in g CO2-eq per 100 km.
2.3.3. Fuel Pathway in the Canary Islands
Figure 3 details the energy pathways for each vehicle and the processes covered from the well of the energy source to the vehicle’s wheels (given that 96% of the primary energy sources in the Canaries are oil based). In Figure 3, each step (s) of the process and each emission focus (f) are shown along the pathways.
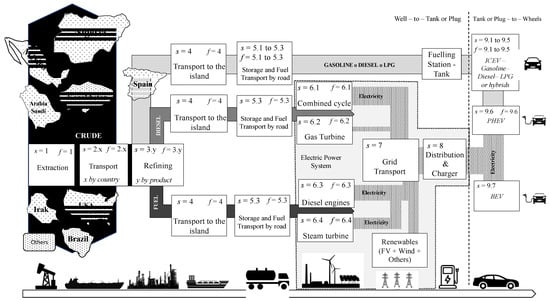
Figure 3.
Pathways from the well-to-wheels in the Canary Islands.
The first step is the extraction of crude, which in the Canaries is a mix from more than 20 producing countries. The oil exporting nations most represented in Spain’s oil imports are Nigeria (20%), Mexico (15%), Saudi Arabia (10%), Kazakhstan (8%), Iraq (6%), the United States (6%), and Brazil (5%) [28]. The average energy consumption for the extraction, flaring, and venting associated with oil extraction (Figure 3, s = 1) for an average yield is between 92.7% and 94.3%. These processes are responsible for emissions allocated out of the Canaries of around 3.75–4.75 g CO2/MJ (f = 1) [29].
Crude is transported by sea using oil tankers (Figure 3, s = 2), with load capacities from 60,000 to 160,000 tons per trip. The energy consumption of one of these tankers is nearly 49 to 51 tons of fuel per day [16]. Table 1 details the distance of the routes to continental Spain and the energy efficiency of transport measured in relative energy losses related to the energy contained in the cargo.

Table 1.
Inventory of crude imports to mainland Spain by tankers.
The oil refining efficiencies and CO2-eq emissions per fuel product from Spanish facilities are not easily accessible due to confidentiality concerns and a lack of industry transparency. The refineries’ energy efficiency and emissions depend on the following: (i) the level of technological development; (ii) the type of refinery composition; (iii) the investment in energy efficiency; (iv) the type of crude; (v) the output products produced; (vi) the environmental requirements arising from national legislation; (vii) the location of the plant, which determines the climatic and seasonal factors and the planning and optimization of each process; and (viii) the implementation of the energy management strategies.
The crude oil destined to fuel the Canary Island’s energy consumption is sourced from various countries and is usually refined in one or more of the eight Spanish refineries. As per Han et al. [29], the efficiencies and emissions from refining processing in the European plants were included in the study (see Table 2). From EuroStat [30], the average consumption of oil derivatives for the last decade (2011–2020) was recorded with the following share range for each product: (i) 3.7–4.1% of LPG; (ii) 44.2–47.0% gasoline; (iii) 26.1–29.5% diesel; and (iv) 2.5–4.2% fuel oil. There was a variation in the energy efficiency of the process (s = 3.1 to 3.4) and the associated emissions for each petroleum product (f = 3.1 to 3.4).
Table 2.
Inventory of the refining processes by subproduct.
In a subsequent step, the final oil-derivate products are separated and transported to the Canary Islands in specific tankers. Therefore, to calculate the efficiency of the process, the calculation of the process’s efficiency was simplified by using the diesel energy consumption data of a representative vessel [16]. The efficiency of the tanker that transports the oil-derivates from Iberian Spain to the Canary Islands (1500 km) is around 99.5% (s = 4) and pollutes between 0.6 and 0.4 g CO2-eq/MJ of fuel (f = 4).
Once the product arrives on the islands, the fuel is discharged and stored. Therefore, all emissions from this downstream process related to the movement and fuel processing are considered as indirect-local emissions (f = 5 to 5.3). The process efficiencies (s = 5.1 to 5.3) and the emissions of the diesel and fuel-oil storage were calculated. The process generally consumes steam to maintain adequate temperatures and conserve energy. The efficiencies in road transport are between 99.6% and 99.9% for diesel or gasoline and 99.5% and 99.7% for LPG [16]. Finally, they arrive at the refueling stations to load the tanks of the ICEVs (completing the WtT path) or to the power plants to produce electricity (following in the next subsection).
2.3.4. Canary Islands Electrical Systems and Scenarios
In 2021, the Canary Islands depended on petroleum-derived fuels for 96% of its primary energy supply, making the energy transition toward decarbonization a daunting task [11]. Although the electrification of all fields is crucial to push renewable energies, the island’s current electricity sector only accounts for 20% of its final energy consumption. Within this percentage, only 20% was from renewable facilities in 2021 [31]. Therefore, the remaining electricity (80%) came from oil-derivate fuels (specifically fuel oil and diesel oil), causing overruns and a high rate of emissions (nearly four times over that of continental Spain) [32,33]. Furthermore, the Canary Islands has six isolated electric power systems, differentiated in size and characteristics according to the particularities of each island (Figure 4). The systems with the largest rate of renewables are El Hierro, Gran Canaria, and Tenerife, accounting for 56.2%, 21.4%, and 21.5%, respectively. The high share of renewables in these systems is explained by the operation of pumped hydro storage. For the remaining systems, renewable participation ranges between 21% and 10%, except for La Gomera (which is without a large renewable installation) [34,35].
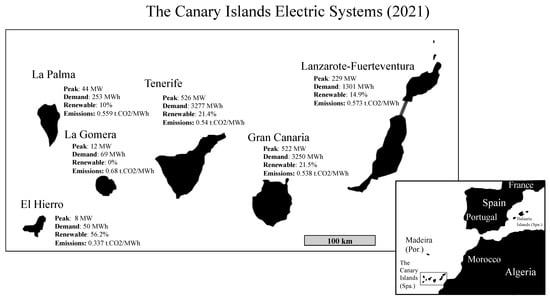
Figure 4.
The features of the Canary Islands electric power systems (2021).
In the case of PEVs such as BEVs and PHEVs, the energy consumed from the well-to-plug goes through the electric power systems that feed these vehicles with electricity. The electricity is produced through a mix of technologies, which may differ depending on the scheduled time, the renewable installed, and the electric power system of each island (Figure 3, s = 6). The more renewable capacity in the system, the less energy consumption, and emissions from the well-to-wheels of the PEV.
Depending on the electricity mix, the emission rate (t.CO2-eq/MWh) could vary by technology (f = 6). Each production technology had an associated emission-rate factor and an efficiency. In addition, each island had singular values, depending on the particularities of each plant, extracted from the energy reports of the Canary Islands for the last five years [11]. This produced the data in Table 3, which shows the emission rate and grid-loss values of each island system; the former was from the transmission system operator database for 2021 [31], and the latter was contained in [11].
Table 3.
Emission rate by system and the electricity grid losses from the power station to the plug.
The particularities of each island are detailed in Figure 5. In the base case scenarios (2021), both the average and time-schedule mixes were presented for the six isolated power systems in the Canary Islands. Specifically, three different periods during which electric vehicles may be plugged in were considered. In off-peak hours (from midnight to 8 a.m.), the predominant electricity-producing technology is wind power. In the mid-peak period (between 8 a.m. and 4 p.m.), solar resources are dominant (if the system installs photovoltaics). Finally, during on-peak periods (from 4 p.m. to midnight), the predominant technologies are wind power and remnant solar. The six isolated systems represented in the base case are (a) Tenerife, (b) Gran Canaria, (c) Fuerteventura–Lanzarote, (d) La Palma, (e) La Gomera, and (f) El Hierro.
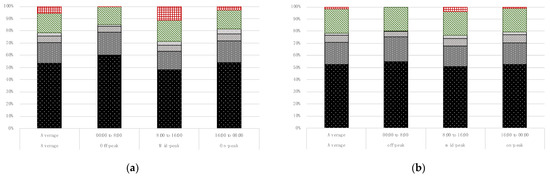
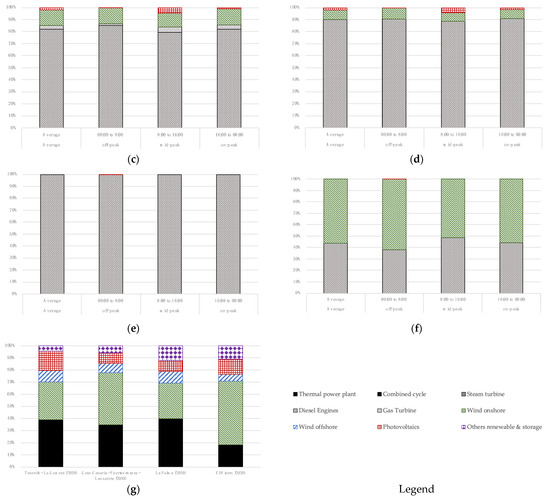
Figure 5.
Electricity mixes by technology including hourly periods in 2021: (a) Tenerife 2021; (b) Gran Canaria 2021; (c) Fuerteventura-Lanzarote 2021; (d) La Palma 2021; (e) La Gomera 2021; (f) El Hierro 2021. (g) Average PTECan scenarios (2030) for the future systems.
Future scenarios (PTECan) are also included in Figure 5g to determine the average in the four systems covering the archipelago according to the 2030 energy plans: Tenerife–La Gomera, Gran Canaria–Lanzarote–Fuerteventura, La Palma, and La Gomera. To complete the information of the electric power systems, Table 3 presents the average emission rate and grid losses (s = 7) for each scenario [11]. Finally, a set of efficiencies from the distribution grid and the electric charging supply equipment (s = 8) were considered, which ranged from 89 to 95% [36].
2.3.5. Canary Islands Light-Duty Vehicles Inventory
The car fleet in the Canary Islands is one of the oldest in Spain and Europe, with an average vehicle age of 13.1 years old (12.1 in mainland Spain) [37]. This figure is directly the result of the islands having one of the lowest incomes per capita in the country [38]. The fleet size is nearly 1.5 million, implying one of the highest vehicle-per-inhabitant rates (0.67) in Europe.
Sales trends in the Canary Islands show the minimal use of diesel-powered vehicles (these have historically remained below 20% of sales) [39]. This is a particular phenomenon in the Canaries; in the rest of Spain, diesel sales have historically been above 40%. This is primarily the result of low taxes on gasoline in the islands. Today, gasoline cars lead new registrations, accounting for 89% of private vehicles versus 7% for diesel-powered cars. In addition to these two ICEV technologies, around 9% of the fleet is hybrid (both mid- and full-hybrid). PEVs only represent 2.5% of sales, and LPGs less than 1% [27]. The expected trend in the coming years is a decrease in diesel vehicles to a negligible value. In addition, the share of gasoline vehicles will gradually decrease with the likely increase in sales of vehicles using zero-emission technologies such as PEVs and alternative fossil fuels.
There was a notable increase in the SUV segment’s share of recently-registered vehicles; this share was 30% in 2015 and grew to above 50% in 2020 [39]. SUVs are less aerodynamic, heavier, and therefore less efficient [26]. This share trend is troubling, being much higher than the European figures in 2019 (27%). Other segments complete the islands’ market share as follows: urban vehicles, 4%; compact vehicles, 36%; multi-purpose vehicles (MPV), 3%; minivans, 2%; sedans, 2%; and the remainder being sports cars, microcars, and luxury vehicles [27].
Around 54,985 vehicles were registered on the islands in 2019 [37]. This new registration information was collected to build a car inventory from the Dirección General de Tráfico database. The year 2019 is not biased by the impacts of COVID-19 on the economy and is therefore a more accurate representation of the annual figures for newly registered cars. From this database, a data-mining process was undertaken to filter and discard registrations that did not meet the criteria of being new light-duty vehicles for private use. First, the registration of old cars imported from other countries was eliminated from the original database. Second, non-private sales from companies such as rental, public services, or private companies were filtered. Registrations for car models that were not homologated by WLTP standards were then removed; since September 2018, this has been mandatory for manufacturers. Transformation of the data resulted in a total of 47,786 of new light-duty vehicles for private users categorized among the 470 different models by engine or bodywork.
Newly registered cars homologated with the WLTP standards were selected to complete the database. This procedure is a globally harmonized standard to determine the level of consumption, pollutants, CO2 emissions, and electric range of light-duty vehicles [40].
Table 4 shows the car inventory by segment and technology, detailing the average consumption and emission, and the total sub-sample. It collects the results and data mining of a sample of 47,786 vehicles from the European WLTP homologation cycle. The segments were grouped according to the body type: (i) small cars (segment A); (ii) midsize cars (segments B&C); (iii) large or family cars (segments D&E); (iv) SUVs, all-roads, and crossovers (segment J); and (v) MPVs and VANs (segment M).
Table 4.
Car inventory by the average consumption and emissions by technology and segment.
In addition, data for seven different powertrains were collected: (a) ICEVs fueled by gasoline; (b) ICEVs fueled by diesel; (c) ICEVs fueled by LPG; (d) MHEVs, ICEVs that usually have a 48 V battery providing a light hybridization, HEVs with an internal combustion engine (gasoline or diesel) complemented with an electrical drive to provide some support in the boosting or a short electric range in cities; (e) PHEVs that incorporate a midsize battery and an electric drive to cover a range from 20 to 80 km, and the optional charging from the grid; and (f) full BEVs with large batteries (from 20 to 100 kWh) providing a full electric drive.
Gasoline, diesel, and LPG vehicles have the highest fuel consumption and pollutants of light-duty vehicles. Cars fueled by LPG stand out for their high emissions in the smaller segments, but these results are enhanced in large vehicle cases (D, E, and SUVs). It is important to note that LPG produces fewer pollutants in urban areas due to the low grade of sulfur and nitrogen oxides. Hybridization seems to be the most feasible solution to reduce emissions from ICEVs. Mild hybridization (MHEV) reduces emissions by only 3% (5% of their energy consumption) compared to gasoline ICEVs. Nevertheless, full hybridization (with HEVs) decreases emissions by 18% (20% less energy consumption). Hybridization is a potential solution to reduce energy consumption and direct emissions for a full range of vehicle segments; HEVs maximize this reduction effect. In sum, the energy consumption and emissions of the average segment are ballasted by the high portion of Canary Island vehicle sales being in the SUV (J) segment, accounting for more than 53% of all powertrain technologies.
In contrast, Table 4 shows the energy consumption and direct emissions (for PHEVs) from the plug to the wheels, that is, as established by the WLTP homologation cycle corresponding to the 2019 new registrations in the Canary Islands. The most prominent data in the table reflect PEVs as having a lower consumption and emissions than ICEVs. Furthermore, the average BEV is three times more efficient than any ICEV, except the HEV. It is important to note that BEVs do not emit directly, so they reduce pollution in urban areas (where combustion vehicles consume and pollute more). Conversely, PHEVs pollute locally when the vehicle’s battery level falls. In general, BEVs have the best figures with respect to PHEVs, requiring half of the energy for moving without emitting GHGs.
3. Results
The results of the models (Section 2.3) are set out in the following section. The different paths of the propulsion technologies were collected based on the vehicle inventory data. For each path, the parameters contained in Section 2.2 were aggregated to the modeling. Finally, the model equations were applied to obtain the results. The results are presented in three subsections: (i) WtW results for conventional (gasoline, diesel, and LPG) and hybrid (mild-HEV and HEV) vehicles; (ii) WtW results for PEVs (PHEVs and BEVs) for current scenarios by island systems; and finally (iii) WtW results for PEVs in future energy scenarios according to PTECan (2030).
3.1. Well-to-Wheels Results for Internal Combustion Engine and Hybrids Cars
Three possible paths were identified for ICEVs. For these vehicles, steps 1 to 2 were equal (from the extraction to the arrival at the refining). However, the paths differed from steps 3 to 5 depending on the fuel used by each vehicle in the ICEV inventory. Table 5 summarizes the energy consumption and total emissions for the entire fuel life cycle from the WtW in the ICEVs. It is important to emphasize that these results are immutable, that is, to the best of the authors’ knowledge, it will not be possible to improve these emissions directly in a significant way over time.
Table 5.
The WtW results for the ICEV and hybrid vehicles.
The diesel vehicle fleet was revealed to be the most polluting throughout the cycle. Diesel vehicles in the D, E, and J (SUV) segments performed worse than the gasoline-equivalent cars in terms of local pollutants, GHG emissions, and energy consumption. In addition, the portion of these segments that include diesel sales caused the average consumption and emissions to be the worst out of the whole Canary Island fleet.
The fuel life cycle GHG emissions of the LPG fleet in the Canary Islands was below that diesel but above gasoline. However, this technology delivered promising results in the longer and heavier vehicles such as the D, E, and J (SUV). In these segments, the reduction in emissions was around 10%.
Based on the WtW assessment, hybridization remains the most feasible option for vehicles that use fossil fuels. The cycle for vehicles with total hybridization stands out, with energy consumption and emissions reduced by 21% and 26%, compared to gasoline and diesel ICEVs, respectively. HEVs led the reduction in emissions and consumption reductions for almost all segments (except for the M-segment).
Finally, the MHEVs were advantageous in segments A, B, and C (smaller cars). It is striking how emissions and energy consumption soared in the heavy-vehicle segments, where mild hybridization produced similar figures to gasoline or diesel. This phenomenon is driven by light hybridizations of high-performance vehicles that are also heavy.
3.2. Well-to-Wheels Results for Plug-In Electric Vehicles for Current Scenarios
As expected, the life cycle of fuels for PEVs (PHEV and BEV) is highly determined by the generation technologies of the electrical system where the batteries are recharged. Thus, the results presented below depend on the relevant electric system and the charging schedule. As such, and with the same conventional technologies in production, the paths will be the same until the refining process (s = 2). Oil is required to produce electricity, fuel, or gas, the values of which will be specific to each system (steps 3 to 6). Finally, depending on the system, the electrical losses will vary (step 6). It is also important to highlight that the emissions and energy consumption will vary over time, given that the energy transition is still in full swing.
We now analyze the current scenarios for each of the systems used in the Canary Islands. The WtW results for the PEVs are presented in three tables: (i) Table 6 sets out the results for the biggest islands (Tenerife and Gran Canaria); (ii) Table 7 details the midsize systems (Fuerteventura–Lanzarote and La Palma); and, finally, (iii) Table 8 shows the results for the smaller systems (La Gomera and El Hierro). All tables contain the PHEV and BEV consumption (in MJ/100 km) and emissions (in g CO2-eq/MJ) by segment. In addition, the impact of the charging schedule is listed (off, mid or on-peak times) for each path.
Table 6.
The WtW results for PEVs in big-size systems (Tenerife and Gran Canaria in 2021).
Table 7.
The WtW results for PEVs on midsize systems (Fuerteventura–Lanzarote and La Palma in 2021).
Table 8.
The WtW results for PEVs on small-size systems (La Gomera and El Hierro in 2021).
In general, this study found that PHEVs consumed and polluted 39% more than BEVs in Tenerife and Gran Canaria. Compared to gasoline ICEVs, BEVs improved the energy consumption and emissions by around 30–31% and 27–29%, respectively; these figures were for the average fleets by segment. In these big systems, BEVs polluted less than all conventional and hybrid cars from the WtW. Conversely, PHEVs had a greater impact on average; roughly 14% over the equivalent average gasoline ICEV.
There were no significant differences in the average PEV charging between the systems in Tenerife and Gran Canaria, however, there were differences in the charging schedule. For example, in Gran Canaria, the charging schedule does not fluctuate because wind production during the day is stable. In contrast, Tenerife has a large share of photovoltaics in the mix, producing a decompensation of the impacts of charging schedules; it was 15% less polluting and efficient to charge aa vehicle in the middle of the day (when solar has on-peak hours) compared with off-peak times. In general, off-peak periods are less favorable for charging from the WtW perspective.
As previously pointed out, the car segment is relevant to determining the WtW impacts. An urban vehicle with electric technology pollutes 10% more than a SUV (the most popular segment). However, the effect of the charging schedule can be decisive in Tenerife, making a SUV less polluting if it is charged during the day (110.5 g CO2-eq/km) than an urban vehicle charged at night (117.2 g CO2-eq/km). Thus, in Tenerife, the charging schedule factor is more determinant of WtW than the vehicle segment. However, in Gran Canaria, this was not the case.
As in larger isolated systems, PHEVs generated much more impact than the BEVs in the midsized systems of Fuerteventura–Lanzarote and La Palma (around 38% more). Taking the gasoline ICEV as a reference, BEVs reduced emissions and energy consumption by between 21% and 16% for Fuerteventura–Lanzarote and La Palma, respectively. The charging schedule was not relevant, mainly due to the scarcity of photovoltaics and the lack of renewable limitations in the off-peak hours. Conversely, the segment is a determining factor in the WtW. Driving a SUV could incur 6% more energy consumption and emissions than vehicles in the B or C segment (compact). Comparing HEVs and BEVs, the results for the emissions and energy consumption were similar in the Fuerteventura–Lanzarote system, but slightly higher in the case of La Palma.
La Gomera is a particular case since it does not have large-scale renewable energy facilities and the PEV-charging schedule is less important. The use of 100% conventional sources increased the impacts of the plug-in vehicle relative to the other islands. For example, a BEV polluted up to 15% more than gasoline, while a PHEV reached up to 44% more.
El Hierro, in comparison, is an example of an early energy transition: renewable sources currently exceed 55% of its electricity mix. In this case, BEVs and PHEVs had lower impacts than all of the conventional vehicles (up to 66% less than gasoline for BEVs). The predominance of wind installations with energy storage has been to the detriment of solar energy, reducing the renewable share in daylight hours (mid-peak). These differences mean that the PEV–WtW impacts during the night were up to 22% lower than the daytime loads. Finally, the vehicle segment was the third factor impacting WtW in El Hierro. For example, a vehicle in segment B emitted 6% less GHGs than one in segment J or up to 22% less than one in segment M.
3.3. Well-to-Wheels Results for Plug-In Electric Vehicles for Future Energy Transition Scenarios
The transition to a decarbonized mix is one of the most important efforts to take place this century. The Canary Islands are not alien to this transformation and have an ambitious project to decarbonize the islands by 2040. The preliminary PTECan document proposes an intermediate objective of above 60% renewables in the Canary Islands mix by 2030. In addition, a set of interconnections between islands is projected, for example, Tenerife–La Gomera (2025) or the systems of Gran Canaria and Lanzarote and Fuerteventura (2030). The most relevant WtW scenario results (see Table 9) related to the PEV fleet considered in this study are detailed below.
Table 9.
The WtW results for PEVs in the PTECan scenarios (2030).
In all of the scenarios considered, the energy consumption of the WtW cycle improved notably, except for ICEVs (consumption remained stable as these vehicles cannot benefit from a quantitative jump in the consumption results). PHEVs were below 120 g CO2-eq, an improvement on the best conventional technology (HEVs). This means that a large share of renewables is required for the islands to take advantage of plug-in hybridization.
The BEVs drastically improved the WtW emissions, reaching reductions of 69% compared to gasoline, 71% to diesel, and 60% to HEVs for all island systems in 2030. Concerning the WtW energy consumption, a BEV in 2030 will require 60% less energy than an average ICEV.
Finally, Figure 6 summarize the results from the WtW from all average scenarios.
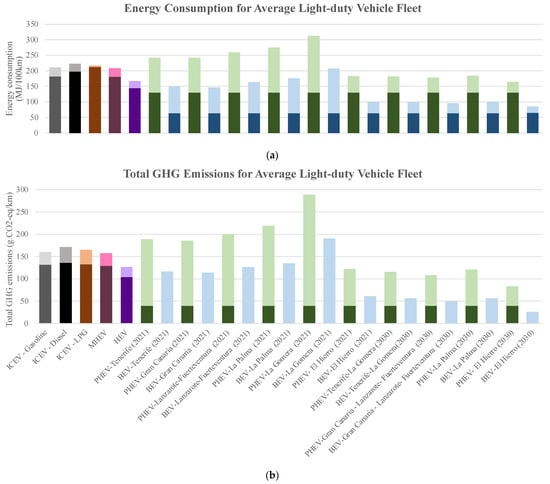
Figure 6.
Results of the WtW impacts in the average scenarios for an average vehicle. The darkest portion represents the WtT or WtP impacts and the lightest shows the TtW or PtW impacts: (a) energy consumption; (b) GHG emissions.
4. Discussion and Policy Implications
The results of this case study are critical in encouraging more sustainable automobile technologies in island regions such as the Canary archipelago. Today’s policies to promote alternative propulsion technologies for light-duty vehicles for private consumers have been established at the national level. However, these policies are biased by an energy situation in mainland Spain that differs from the island regions. In general, PEV technologies are promoted via direct subsidies on the purchase. Currently, this aid ranges from EUR 4500 to 9000 per BEV or PHEV (with more than 90 km of electric range), and there is a tax exemption for purchases in the Canary Islands (for ICEVs, the tax rate is between 9.5 and 13.5%). The remaining PHEVs could also benefit from the MOVES III program aid of EUR 2500 to 5000 [41].
These PEV promotion policies, in place since 2010, are failing if compared to the sales forecast for 2020 [42]. The 2013 report on prospective BEVs in the Canary Islands established a goal of 29,089 passenger cars in 2020. The reality is that in 2020, only a total of about 3806 BEVs (0,2% of the total car fleet) were purchased, only 13% of the estimated forecast. As a result, the question of why the promotion of alternative powertrain technologies has failed needs to be asked.
The results of this study may shed light on technologies that should not be promoted today, given that the islands’ electricity mix mainly comprises fossil fuels (see the summary in Figure 6). For example, PHEVs should not be promoted by subsidies in the islands overall, but can be promoted on the island of El Hierro, where 56% of the mix is from renewables. On the other hand, it would be interesting to discourage heavy and inefficient vehicles such as those in the J segment (SUVs and crossover vehicles). Indeed, they have always been popular on the islands given their topography and the agricultural activity conducted in rural areas. However, the change in urban consumer behavior with respect to new SUV registrations puts the climate goals at risk [26].
Today, light-duty vehicles are classified by labeling the powertrain technology and pollutant regulations (Figure 7). Zero-labeling includes all BEVs and PHEVs if the electric range surpasses 40 km. The remaining hybrids and alternative fuel cars such as LPG are covered by eco-labeling. Finally, C-labeling is a new registration for conventional vehicles following the EURO 6 standards. The question is whether this labeling system generates the right incentives to meet the decarbonization goals in the Canary Islands.
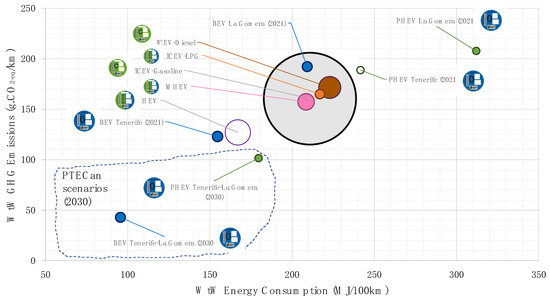
Figure 7.
The global representation of results and eco-labeling correspondence.
This study demonstrates that on these islands, where fossil fuels dominate, PHEVs have the lowest energy efficiency and the highest emissions of all newly registered vehicles. Moreover, MHEVs or LPG-powered vehicles (with eco-labeling) do not significantly improve the figures for gasoline or diesel cars. In addition, the M and J segments, which are currently the most popular, showed the worst results, but could be given an eco-label if they are MHEV or PHEVs. The conclusion is that promoting these technologies and segments is contrary to the energy transition goals in the Canaries archipelago. More recently, there have been discussions about changing the labeling criteria. This new proposal erases eco-labeling and creates D-labeling, which depends on emissions in the WLTP homologation cycle. This means that an A-segment gasoline car with WLTP emissions under 95 g CO2/km will qualify for this labeling, much to the detriment of a large PHEV-SUV with emissions over this limit. One suggestion to improve this new labeling criterion would be to include the indirect impacts depending on the island or region that could influence energy consumption and emissions.
Another interesting result of this study is that the full-HEVs seem to have an excellent performance in all vehicle segments, and are very competitive in terms of energy consumption and emissions in the Canary Islands. In addition, HEVs are one of the most popular alternative powertrains, holding consumer confidence (representing almost 8% of sales). With regard to alternative fuels, it seems that the use of LPG stands out in segments D, E, and J (SUVs), with emissions and energy consumption lower than gasoline and diesel.
With these general conclusions relevant to energy policy, the promotion of BEVs in all of the islands’ electrical systems is recommended (except for La Gomera until it connects with the Tenerife system). The HEVs should be promoted via tax reductions as they offer potential emission reductions in cities. The use of alternatives to gasoline and diesel such as LPG should only be encouraged in segments D, E, and J. Conversely, this study does not recommend promoting MHEVs, given their low potential for emissions and consumption reduction. Furthermore, PHEVs should only be incentivized in systems where recharging with at least 35% renewable energy is assured. Finally, government aid should focus on more efficient and lower-pollutant vehicles from the A, B, and C segments, instead of SUVs. The indirect impacts produced by vehicles are also relevant, especially in PHEVs. For these cars, this study’s recommendation is that there be no promotion in the short-term due to the low current share of renewables in the islands.
5. Conclusions
Road transportation is one of the most polluting sectors globally. Governments can meet their environmental commitments by boosting policies focused on alternative green solutions. The situation in the Canary Islands is critical due to the intense use of petroleum derivatives and an energy dependence of 96% in 2021, and electricity mixes only reach an average of 21% from renewables, impacting directly on the electromobility potential.
Based on the results of this study, the following relevant findings for the energy policy of the archipelago are offered:
- The advantages of PEVs as a mitigator of equivalent emissions are partially lost as a result of the use of oil derivatives in electricity generation. The impact on the environment of PEVs depends significantly on the cleanliness of the electricity production.
- BEVs are a better alternative than an ICEV gasoline average car when the electricity mix surpasses 6% from renewables or 15% to improve the HEV figures.
- The breakout point for PHEVs requires over 35% renewable energy mixes to improve the ICEV gasoline results.
- For Tenerife and Gran Canaria (bigger systems), BEVs remain as the preferred solution to reduce WtW impacts.
- In midsize systems (Fuerteventura–Lanzarote and La Palma), BEVs return similar results to HEVs.
- La Gomera represents the worst case for PEVs due to the scarcity of renewable facilities on the island.
- El Hierro represents an early energy transition island and PEVs offer a potential reduction of 66% in comparison to gasoline cars.
We made the following conclusions concerning the charging schedule:
- In the Tenerife system, the influence of photovoltaics causes a large reduction in the GHG emissions for PEVs when these are plugged in during mid-peak hours.
- Conversely, on El Hierro, off-peak charging during the night potentially reduces the WtW impacts of PEVs. For the remaining islands, the charging schedule does not have a significant impact on the WtW.
The influence of car body type directly influences the WtW consumption and emissions.
- The most popular cars sold today (SUVs) are the greatest polluters of all segments. On average, these cars produce 6% more impacts (energy consumption and emissions) than those in the A, B, and C segments (urban and compact cars).
To conclude, the following elements of general interest can be highlighted:
- In the sub-optimal renewable-share scenarios (below 6%), BEVs could be equal to or more polluting than some ICEVs in the current scenarios. Thus, in most scenarios, BEVs improved the figures of all ICEV technologies in the Canary Islands.
- PHEVs require greener mixes (more than 35% of renewable energy) to improve the equivalent emissions of ICEVs (gasoline or diesel). However, PEVs have become the best solution for achieving a reduction of about 60% in CO2 in the roadmap to 2030 scenarios. Nevertheless, it is also important to note that PEVs do not pollute locally, reducing dangerous gases in cities.
- Future research in this area should focus on how the charging management influences the WtW impacts on isolated systems to promote initiatives to reduce the impact of PEVs.
Author Contributions
Methodology, A.J.R.-D. and J.B.-S.; Software, A.J.R.-D. and J.B.-S.; Validation, J.B.-S. and F.J.R.-R.; Formal analysis, J.B.-S. and F.J.R.-R.; Investigation, A.J.R.-D., F.J.R.-R. and J.B.-S.; Resources, A.J.R.-D. and F.J.R.-R.; Data curation, A.J.R.-D.; Writing—original draft preparation, A.J.R.-D. and F.J.R.-R.; Writing—review and editing, A.J.R.-D., F.J.R.-R. and J.B.-S.; Visualization, A.J.R.-D.; Supervision, F.J.R.-R. and J.B.-S.; Project administration, F.J.R.-R.; Funding acquisition, Not applicable. All authors have read and agreed to the published version of the manuscript.
Funding
This research received no external funding.
Institutional Review Board Statement
Not applicable.
Informed Consent Statement
Not applicable.
Data Availability Statement
Not applicable.
Acknowledgments
A.J. Ramirez Diaz thanks the Cabildo de Tenerife, Tenerife 2030, Fondo de Desarrollo de Canarias (FDCAN), and Marco Estratégico de Desarrollo Insular (MEDI) for the support through the call for technology transfer projects of the Agustín de Betancourt. The authors express their gratitude for the helpful advice of Yannick Perez (Chaire Armand Peugeot and Centralé-Supelec). F.J. Ramos Real appreciates the unconditional support of Omaha Ramos.
Conflicts of Interest
The authors declare no conflict of interest.
References
- Delbeke, J.; Runge-Metzger, A.; Slingenberg, Y.; Werksman, J. The Paris Agreement. In Towards a Climate-Neutral Europe; Routledge: Oxfordshire, UK, 2019; pp. 24–45. [Google Scholar] [CrossRef]
- European Commission. The European Green Deal; European Commission: Brussels, Belgium, 2019; pp. 47–65. [Google Scholar]
- European Commission. Europe on the Move: Commission Completes Its Agenda for Safe, Clean and Connected Mobility; European Commission: Brussels, Belgium, 2018; Volume 2050. [Google Scholar]
- European Commission, Directorate-General for Budget. EU Budget Policy Brief: The EU as an Issuer: The NextGenerationEU Transformation; European Commission: Brussels, Belgium, 2022. [Google Scholar]
- International Energy Agency. Tracking Transport 2020; International Energy Agency: Paris, France, 2020. [Google Scholar]
- International Energy Agency. Global EV Outlook 2021; International Energy Agency: Paris, France, 2020. [Google Scholar]
- European Commission. Sustainable & Smart Mobility Strategy; European Commission: Brussels, Belgium, 2020. [Google Scholar]
- European Parliament. Regulation (EU) 2019/631 of the European Parliament and of the Council of 17 April 2019, Setting CO2 Emissions Performance Standars for New Passenger Cars and for New Light Commercial Vehicles, and Repealing Regulations (EC); European Parliament: Brussels, Belgium, 2019; Volume 10, pp. 1–21. [Google Scholar]
- U. S. Energy Information Administration. Global Transportation Energy Consumption: Examination of Scenarios to 2040 Using ITEDD; U.S. Energy Information Administration: Washington, DC, USA, 2017. [Google Scholar]
- Maldonado, E. Energy in the EU Outermost Regions (Renewable Energy, Energy Efficiency)—Final Report; European Comission: Brussels, Belgium, 2017; pp. 1–21. [Google Scholar]
- Gobierno de Canarias. Anuario Energético de Canarias 2020; Gobierno de Canarias: Las Palmas de Gran Canaria, Spain, 2021. [Google Scholar]
- BOE Ley 7/2021, de 20 de Mayo, de Cambio Climático y Transición Energética. Boletín Of. Estado 2021, 121, 26798–26800.
- MITECO. Plan Nacional Integrado de Energía y Clima 2021–2030; Ministerio para la Transición Ecológica y el Reto Demográfico: Madrid, Spain, 2020; p. 25. [Google Scholar]
- Gobierno de Canarias. Preeliminary PTECan; Gobierno de Canarias: Las Palmas de Gran Canaria, Spain, 2021. [Google Scholar]
- Jensen, A.A.; Elkington, J.; Christiansen, K.; Hoffmann, L.; Møller, B.T.; Schmidt, A.; van Dijk, F. Life Cycle Assessment (LCA)—A Guide to Approaches, Experiences and Information Sources; European Environment Agency: Copenhagen, Denmark, 1997. [Google Scholar]
- Prussi, M.; Yugo, M.; De Prada, L.; Padella, M.; Edwards, M. JEC Well-To-Wheels Report V5; Publications Office of the European Union: Luxembourg, 2020; ISBN 9789276201090. [Google Scholar]
- López, A.I.; Ramírez-Díaz, A.; Rodriguez, I.; Gurriarán, J.; Mendez-Perez, J.A. Wind Farm Energy Surplus Storage Solution with Second-Life Vehicle Batteries in Isolated Grids. Energy Policy 2023, 173, 113373. [Google Scholar] [CrossRef]
- Ioakimidis, C.S.; Murillo-Marrodán, A.; Bagheri, A.; Thomas, D.; Genikomsakis, K.N. Life Cycle Assessment of a Lithium Iron Phosphate (LFP) Electric Vehicle Battery in Second Life Application Scenarios. Sustainability 2019, 11, 2527. [Google Scholar] [CrossRef]
- Shen, W.; Han, W.; Chock, D.; Chai, Q.; Zhang, A. Well-to-Wheels Life-Cycle Analysis of Alternative Fuels and Vehicle Technologies in China. Energy Policy 2012, 49, 296–307. [Google Scholar] [CrossRef]
- Moro, A.; Helmers, E. A New Hybrid Method for Reducing the Gap between WTW and LCA in the Carbon Footprint Assessment of Electric Vehicles. Int. J. Life Cycle Assess. 2017, 22, 4–14. [Google Scholar] [CrossRef]
- Sivak, M.; Schoettle, B. Fuel Sources for Electricity in the Individual Countries of the World and the Consequent Emissions from Driving Electric Vehicles; The University of Michigan: Ann Arbor, MI, USA, 2017. [Google Scholar]
- Ke, W.; Zhang, S.; He, X.; Wu, Y.; Hao, J. Well-to-Wheels Energy Consumption and Emissions of Electric Vehicles: Mid-Term Implications from Real-World Features and Air Pollution Control Progress. Appl. Energy 2017, 188, 367–377. [Google Scholar] [CrossRef]
- Haugen, M.J.; Paoli, L.; Cullen, J.; Cebon, D.; Boies, A.M. A Fork in the Road: Which Energy Pathway Offers the Greatest Energy Efficiency and CO 2 Reduction Potential for Low-Carbon Vehicles? Appl. Energy 2020, 283, 116295. [Google Scholar] [CrossRef]
- García-Afonso, Ó.; Santana-Méndez, I.; Delgado-Torres, A.M.; González-Díaz, B. On the Road to a Sustainable Transport Mobility in Isolated Power Systems: The Role of Light-Duty Powertrain Electrification. J. Clean. Prod. 2021, 320, 128646. [Google Scholar] [CrossRef]
- Nuez, I.; Ruiz-García, A.; Osorio, J. A Comparative Evaluation of CO2 Emissions between Internal Combustion and Electric Vehicles in Small Isolated Electrical Power Systems—Case Study of the Canary Islands. J. Clean. Prod. 2022, 369, 133252. [Google Scholar] [CrossRef]
- Ramírez-Díaz, A.J.; Ramos-Real, F.J.; Rodríguez-Brito, M.G.; Rodríguez-Donate, M.C.; Lorente de las Casas, A. Determining Factors of Consumers’ Choice of Sport Utility Vehicles in an Isolated Energy System: How Can We Contribute to the Decarbonization of the Economy? Energies 2022, 15, 6454. [Google Scholar] [CrossRef]
- Dirección General de Tráfico Microdatos Sobre Matriculaciones (2019)—Portal Estadístico. Database. Madrid, Spain. 2019. Available online: https://sedeapl.dgt.gob.es/WEB_IEST_CONSULTA/subcategoria.faces (accessed on 11 January 2023).
- Boletín Estadístico de Hidrocarburos 227. CORES. Corporación de Derecho Público Tutelada Por El Ministerio Para La Transición Ecológica y El Reto Demográfico. Serie de Boletines Estadísticos. Madrid, Spain. 2020. Available online: https://www.cores.es/sites/default/files/archivos/publicaciones/boletin-est-hidrocarburos-277-diciembre-2020.pdf (accessed on 11 January 2023).
- Han, J.; Forman, G.S.; Elgowainy, A.; Cai, H.; Wang, M.; Divita, V.B. A Comparative Assessment of Resource Efficiency in Petroleum Refining. Fuel 2015, 157, 292–298. [Google Scholar] [CrossRef]
- Statistics|Eurostat. Complete Energy Balances. Available online: https://ec.europa.eu/eurostat/databrowser/view/NRG_BAL_C__custom_2070609/bookmark/table?lang=en&bookmarkId=32cc350a-f381-4d7f-97ad-234904d4afd8 (accessed on 26 October 2022).
- Red Eléctrica de España. Demanda a Tiempo Real. Islas Canarias; Database; Red Eléctrica de España: Madrid, Spain, 2021. [Google Scholar]
- Red Eléctrica de España. Emisiones de CO 2 Asociadas a La Generación de Electricidad En España; Database; Red Eléctrica de España: Madrid, Spain, 2020; p. 2. Available online: https://www.ree.es/sites/default/files/04_SOSTENIBILIDAD/Documentos/Metodolog%C3%ADa_calculo_inventario_GEI_2020.pdf (accessed on 11 January 2023).
- Ministerio de Industria Energía y Turismo Real. Decreto 738/2015, de 31 de Julio, Regula La Actividad de Producción de Energía Eléctrica y El Procedimiento de Despacho En Los Sistemas Eléctricos de Los Territorios No Peninsulares; Ministerio de Industria Energía y Turismo Real: Madrid, Spain, 2015; Volume 183, pp. 66752–66903. [Google Scholar]
- Díaz, A.R.; Ramos-Real, F.J.; Marrero, G.A.; Perez, Y. Impact of Electric Vehicles as Distributed Energy Storage in Isolated Systems: The Case of Tenerife. Sustainability 2015, 7, 15152–15178. [Google Scholar] [CrossRef]
- Ramos-Real, F.J.; Barrera-Santana, J.; Ramírez-Díaz, A.; Perez, Y. Interconnecting Isolated Electrical Systems. The Case of Canary Islands. Energy Strateg. Rev. 2018, 22, 37–46. [Google Scholar] [CrossRef]
- Apostolaki-Iosifidou, E.; Codani, P.; Kempton, W. Measurement of Power Loss during Electric Vehicle Charging and Discharging. Energy 2017, 127, 730–742. [Google Scholar] [CrossRef]
- EFE. La Antigüedad Del Parque Automovilístico de Canarias Sube a Los 13,1 Años. Agencia EFE. Edición Canar. Santa Cruz de Tenerife, Spain. 2020. Available online: https://www.eldia.es/economia/2021/03/17/parque-automovilistico-canarias-tercero-envejecido-43350985.html#:~:text=En%20el%20conjunto%20del%20pa%C3%ADs,esperadas%20de%20coches%20de%20350.000 (accessed on 11 January 2023).
- Aguilar, J.M.; Ramos-Real, F.J.; Ramírez-Díaz, A.J. Improving Indicators for Comparing Energy Poverty in the Canary Islands and Spain. Energies 2019, 12, 2135. [Google Scholar] [CrossRef]
- Dirección General de Tráfico Portal Estadístico. Matriculaciones 2010–2020. Database; Madrid, Spain. Available online: https://sedeapl.dgt.gob.es/WEB_IEST_CONSULTA/subcategoria.faces (accessed on 11 January 2023).
- Fontaras, G.; Zacharof, N.G.; Ciuffo, B. Fuel Consumption and CO2 Emissions from Passenger Cars in Europe—Laboratory versus Real-World Emissions. Prog. Energy Combust. Sci. 2017, 60, 97–131. [Google Scholar] [CrossRef]
- Ministerio para la Transición Ecológica y el Reto Demográfico. Real Decreto 266/2021 de 13 de Abril, Por El Que Se Aprueba La Concesión Directa de Ayudas a Las Comunidades Autónomas y a Las Ciudades de Ceuta y Melilla Para La Ejecución de Programas de Incentivos Ligados a La Movilidad Eléctrica (MOVES III) En El Marc; Boletín Oficial del Estado (BOE): Madrid, Spain, 2021; p. 41. [Google Scholar]
- Instituto Tecnológico de Canarias, S.A. Estudio Para La Implantación Del Vehículo Eléctrico En Canarias; Instituto Tecnológico de Canarias S.A.: Santa Cruz de Tenerife, Spain, 2013; p. 242. [Google Scholar]
Disclaimer/Publisher’s Note: The statements, opinions and data contained in all publications are solely those of the individual author(s) and contributor(s) and not of MDPI and/or the editor(s). MDPI and/or the editor(s) disclaim responsibility for any injury to people or property resulting from any ideas, methods, instructions or products referred to in the content. |
© 2023 by the authors. Licensee MDPI, Basel, Switzerland. This article is an open access article distributed under the terms and conditions of the Creative Commons Attribution (CC BY) license (https://creativecommons.org/licenses/by/4.0/).