Abstract
In pursuit of Finland’s carbon neutrality objective by 2035, integrating renewable energy sources into the power grid is essential. To address the stochastic nature of these resources, additional sources of flexibility are required to maintain grid stability. Meanwhile, district heating network (DHN) operators in Finland are decommissioning fossil fuel-based combined heat and power plants (CHPs) and electrifying heating systems with heat pumps (HPs) and electric boilers. A techno-economic assessment and the optimized operation of DHN-connected HPs and electric boilers in providing ancillary balancing services were explored in this study. The primary goal was to maximize the potential revenue for DHN operators through participation in the day-ahead electricity market and frequency containment reserve (FCR) balancing markets. Three interconnected DHNs in the Helsinki metropolitan area were optimized based on 2019 data and each operator’s decarbonization strategies for 2025. HPs are expected to achieve the highest profit margins in the FCR-D up-regulation market, while electric boilers could generate substantial profits from the FCR-D down-regulation market. In contrast to other balancing markets studied, the FCR-N market exhibited limited profit potential. Sensitivity analysis indicated that spot electricity prices and CO2 emission allowance prices significantly influence the profitability derived from balancing markets.
1. Introduction
The Paris Agreement ratified by the world community represents a commitment to work together to mitigate the human-induced greenhouse effect [1]. To decarbonize the energy sector and expand renewable sources of power generation, the European Commission has launched a “European green deal” [2]. At the national level, the Finnish government has committed to achieving carbon neutrality by 2035 [3]. The widespread integration of intermittent power generation can lead to imbalances between electricity demand and supply, resulting in power shortages or surpluses that can cause fluctuations in grid frequency [4]. For example, in Finland, wind power capacity increased by 76% from 2021 to 2022 to 5677 MW, while the average electricity consumption was 9360 MW [5]. As a result, ancillary services are required to respond to an unanticipated deficiency or surplus in power production or consumption in a cost-effective and efficient manner [6]. Recently, the provision of ancillary services from wind and nuclear power has been introduced in Finland. Loviisa nuclear power plant, for example, has joined the frequency containment reserve for disturbance (FCR-D) down-regulation market [7,8]. Balancing markets guarantee the availability of adequate reserve capacity to meet the necessary energy demand and maintain grid frequency stability [9].
Power-to-heat (P2H) technologies, encompassing heat pumps (HPs), electric boilers, and combined heat and power (CHP) plants, can play a crucial role in enhancing the flexibility and grid support capabilities of the electrical power system [10,11,12,13,14]. Terreros et al. [15] explored the potential for the utilization of HPs in the Austrian electricity market as a solution to the stochasticity of renewable heat sources and the large number of unprofitable biomass boilers in rural district heating. Through participation in both the day-ahead and balancing markets, HPs could save energy costs, while simultaneously earning additional revenues. District heating networks (DHNs) possess substantial electrical capacities due to existing CHP plants and HPs [16,17]. Finland’s DH sector, which boasted a 50% market share of space heating in 2021 [18], aims to decarbonize by integrating large-scale HPs and electric boilers, alongside biomass fuels [19]. Boldrini et al. [20] evaluated the technical potential of DHNs to contribute to frequency containment reserves (FCR), and automatic and manual frequency restoration reserves (aFRR and mFRR) markets, and estimated the potential at country and EU levels based on appropriate assumptions. A significant degree of flexibility can be provided by DHNs based on the findings of the study. Javanshir et al. [21] conducted a literature and industry review and proposed the optimal operation of an electrified DHN to participate in day-ahead electricity and balancing markets for a hypothetical mid-sized city DHN, considering the technical requirements of providing a reserve in each market. The results indicated the economic benefits of providing balancing services from HPs in the aFRR market. According to Wang et al. [22], CHP plants could provide flexibility to reduce wind power production curtailment and increase revenue through providing ancillary services. They compared the flexibility of different CHP types and operation modes. Haakana et al. [23] proposed a methodology to optimize the operation of a CHP plant in various energy markets, with a focus on electricity reserve market opportunities. The literature discusses the benefits of DHN-connected P2H units for providing balancing services. However, some of the research gaps, to the best of the authors’ knowledge, remain understudied. The interaction between the operation of a reserve unit in a DHN and other production units that do not provide reserve capacity, is often neglected in the literature [23].
Addressing the identified research gaps, this study investigates the economic feasibility of utilizing DHN-connected HPs and electric boilers to provide reserve capacities in various FCR balancing markets in Finland. The Helsinki metropolitan area’s DHN, encompassing the interconnected DHNs in Helsinki, Espoo, and Vantaa cities, was selected as the case study. This system produced approximately 11.1 TWh of DH for over one million people in 2022 [18]. The case study was simulated and the operation in the day-ahead electricity market and FCR balancing markets was optimized for both 2019, as the base year (with regular electricity prices), and 2025, assuming the heat generation fleet of the case study aligned with the carbon neutrality plans of the Helsinki area municipalities. A 15 min time resolution was also incorporated in modeling the reserve provision. The overarching objective was to maximize the profitability of the operator in the aforementioned markets. With the electrification of DH systems in Finland, larger capacity HPs and electric boilers are becoming available, which could contribute to the balancing markets and generate additional revenue.
The structure of the paper is as follows. In the methods section, Section 2.1. explains the optimal operation of the case study DHN in the day-ahead electricity market (without considering the reserve provision). In Section 2.2, the studied balancing markets, their requirements, and the operation of the system in these markets, are explained. The configuration of the case study DHN is explained in Section 2.3. The results of the simulations and the conclusions are placed in Section 3 and Section 4.
2. Methods
This section summarizes the modeling process and the assumptions employed. The case study DHN was simulated and optimized using EnergyPRO software (version 4.9), employing a deterministic model [24,25]. The overall goal is to maximize the profit from the day-ahead and FCR markets for the operator, while meeting the heat demand. In the following subsections, the optimal operation of the case study to fulfill the heat demand (without providing the reserve capacity) is described first. This is followed by an explanation of the case study’s operation in the FCR markets in Section 2.2. It is important to emphasize that these two stages are sequential, meaning the output of the first stage serves as input to the second. While the objective of the first stage (the day-ahead scheduling stage) is to minimize the marginal heat production cost, the second stage aims to allocate the optimal amount of reserve capacity to maximize the revenue gained from the balancing markets. A summary of the case study and its configuration in the investigated years (2019 and 2025) is provided in the last subsection.
2.1. The Optimal Operation of the DHN to Provide Heat (Day-Ahead Scheduling Stage)
This subsection explains the modeling process and optimal operation of the case study to minimize the marginal heat production cost of the system. The electricity generated from CHP plants is traded in the day-ahead electricity market, with the realized spot prices, in the Finnish bidding area. Consequently, this stage is termed the day-ahead scheduling stage.
The case study DHN is simulated and optimized using the commercial EnergyPRO software [24,25]. The software produces a cost-efficient solution, ensuring that the heat supply meets the heat demand on an hourly basis. It aims to minimize the annual net operating costs of the system. The calculation of each unit’s production cost encompasses the fuel consumption costs, fuel tax, operation and maintenance (O&M) expenses, and the CO2 allowance cost of fuels. For HPs and electric boilers, the operational costs include electricity consumption and distribution costs, electricity tax, and O&M costs. CHP units generate revenue by selling electricity in the day-ahead electricity market. The inputs used for the simulation include the historical day-ahead electricity prices [26], fuel prices [27], CO2 allowance prices under the European Union Emissions Trading System (EU ETS) [28], weather data [29], and hourly heat demand, calculated based on the heating degree days for each city [16], along with the annual heating demand. The district heating sector in Finland operates as a natural monopoly, meaning there is no competitive heat market and, hence, heat sales revenue is not factored into the analysis [30].
In this study, heat demand is required to be met in an hourly time step. The running orders of production units are determined every hour, based on the net production costs and revenues (for CHP units). However, technical constraints like the start-up and shut-down times, and limits on fuel usage, also influence the running order [30]. The software optimizes the operation strategy not by sequential hourly calculations, but by committing the production units to the most advantageous periods first. Figure 1 in the study depicts the inputs and outputs used in the model.
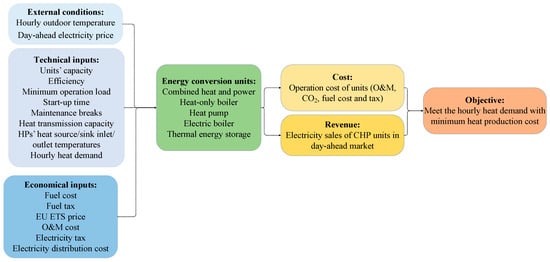
Figure 1.
Parameters for inputs and outputs employed in the model during the day-ahead scheduling stage.
2.2. The Operation of the DHN in the Balancing Markets (Balancing Stage)
This subsection explains the mathematical modeling and operation of the system when it participates in providing reserve capacities. This study proposes the provision of reserve capacity from HPs and electric boilers within the case study DHN. The objective at this stage is to optimize the allocation of reserve capacity from these units across various FCR balancing markets, following the day-ahead scheduling stage.
2.2.1. Market Background
The detailed description, key characteristics, and requirements of each balancing market, as of 2021, specified by the Finnish transmission system operator (TSO), Fingrid [9], are summarized in [21]. The focus of this study is the different FCR markets, including the frequency containment reserves for normal operation (FCR-N), and the frequency containment reserves for disturbances (FCR-D) for upward and downward regulations, which are explained in this subsection [9]. The FCR-N and FCR-D are activated in response to frequency deviations. During normal operation and disturbances, they control the regulated grid frequency. The purpose of the FCR-N is to maintain the frequency within the standard frequency range of 49.9 Hz to 50.1 Hz [9]. When the frequency deviation exceeds this range, the FCR-D aims to limit the deviation to 49.5 Hz or 50.5 Hz. As a symmetrical product, the FCR-N must possess the ability to both up- and down-regulate. The FCR-D is categorized into separate up- and down-regulation products. This study assumes that the reserve units are capable of providing FCR products. Historical capacity prices from Finnish FCR markets and the measured frequency in 2019 were used as inputs for both the studied years, 2019 and 2025 [9].
2.2.2. Energy Analysis
Reserve units offer their capacity to balancing markets in exchange for compensation. During periods of oversupply (demand exceeding supply), these units provide a downward reserve (down-regulation) by either increasing electricity consumption or decreasing generation. Conversely, during periods of undersupply (higher demand than supply), reserve units provide an upward reserve (up-regulation) by reducing electricity consumption or ramping up electricity generation. As the gate-closure time of the FCR market (18:30 EET time zone in the hourly market one day before the operation day (D-1)) takes place after the day-ahead market trades have been published (14:00 EET time zone in day D-1) [9], it is then known exactly how much of the capacity from a reserve unit has been tied to the day-ahead market (the day-ahead scheduling stage). Hence, after the day-ahead scheduling stage, the operator can offer the available capacity from the reserve units to the balancing markets.
The objective is to maximize the revenue from balancing markets by maximizing the offered reserve capacity. The most optimal approach for this is depicted in Figure 2, illustrating an example of a HP/electric boiler participating in the FCR-N market. In Figure 2a, MW of the unit’s capacity in a particular hour is tied to the day-ahead market (by consuming electricity) to provide heat. Thus, to be able to offer the highest possible and symmetrical capacity for the FCR-N at this hour, MW should be offered to this market, enabling the unit to provide both up-regulation and down-regulation. The contrast to this situation is depicted in Figure 2b. and refer to the maximum and minimum capacities of the unit, whereas indicates the tied capacity from the unit in the day-ahead stage. The maximum capacity bid to the FCR-N market is 5 MW [9]. In this study, the minimum load for a large-scale HP is considered to be 10% of the maximum load [31].
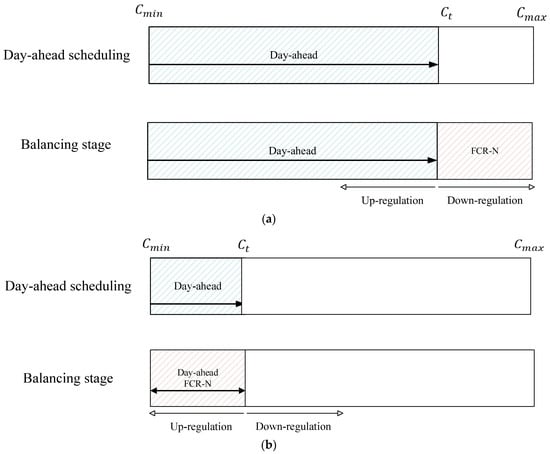
Figure 2.
Allocation of reserve capacity in the FCR-N balancing market for a HP/electric boiler (a) when and (b) when during the day-ahead scheduling stage.
Hence, at each timestep, the maximum capacity offered to the FCR-N market can be calculated by the following equation, where denotes the maintained capacity in the FCR-N market [9]. The same equation can be applied to the electric boiler.
Separate bids for up-regulation and down-regulation are required for the FCR-D up-regulation and FCR-D down-regulation markets, respectively. Due to the longer start-up time of HPs compared to the required activation time of reserve units in FCR markets, HPs are considered to provide FCR-D down-regulation (increasing electricity consumption) only when they are already in operation during the day-ahead stage [21]. For electric boilers, however, this is not the case as they can provide a fast activation time, even when they are not running during a particular period in the day-ahead stage [21]. Figure 3 illustrates the capacity allocation mechanism of a HP/electric boiler for the FCR-D up-regulation and FCR-D down-regulation markets, respectively.
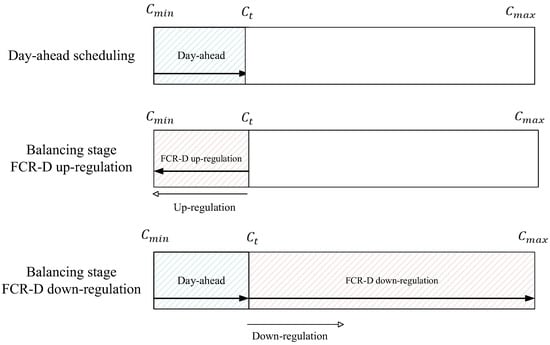
Figure 3.
Capacity allocation of a HP/electric boiler to the FCR-D up-regulation and down-regulation markets.
Equations (2) and (3) express the maximum capacity allocation to the FCR-D up-regulation and down-regulation markets, respectively, considering the maximum bid of 10 MW for these markets. and represent the maintenance capacities in the FCR-D up-regulation and down-regulation markets, respectively.
The accepted reserve capacity bid, in the FCR markets, is activated on the operation day. The activation has a linear correlation with the frequency deviation, as depicted in Figure 4 [9].
indicates the 15 min average of the local measured frequency [9]. The activation of reserve units on the operation day can lead to heat imbalances, as they increase or decrease their electricity consumption in response to frequency deviations. Since the primary function of DHNs is to provide heat, this study assumes that HOBs can dynamically adjust their production levels, if feasible. Owing to their proximity to end-users and rapid response times, HOBs can effectively address heat imbalances. While calculating the profit gained from balancing markets, the study also considers the associated changes in the operational costs of HOBs in the balancing stage.
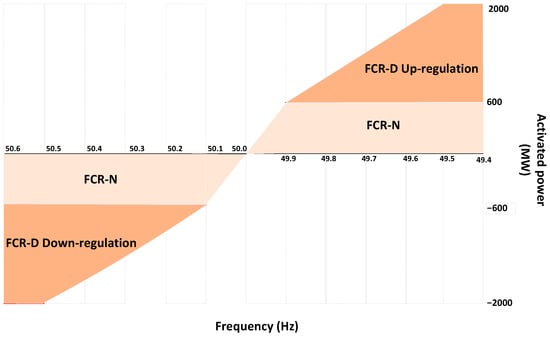
Figure 4.
The relationship between frequency and activation of a reserve unit in FCR markets [9].
2.2.3. Economic Analysis
The TSO compensates reserve providers for keeping their reserve capacity on standby for activation. This payment, known as the capacity payment (or capacity fee), is computed as the multiplication of the accepted capacity from the auction by the realized capacity price for that specific hour. In addition, providers receive an activation payment (termed the energy fee) based on the actual amount of energy activated. The calculation of the energy fee involves multiplying the activated energy in the respective balancing market by the upward/downward balancing price, adhering to the one-price system. In this system, the purchase and sales prices of the imbalance energy are the same [9]. During periods of up-regulation, the price of the imbalance energy matches the up-regulation price, and during down-regulation, it equates to the down-regulation price. In hours with no regulation, the imbalance energy price is the Finnish day-ahead price. Table 1 in the study showcases the various mechanisms of this pricing system [9]. Figure 5 presents a comparison of the average capacity prices in the FCR-N and FCR-D hourly markets against the average prices for down-regulation, up-regulation, and spot prices in 2019 [24,29].

Table 1.
Various price systems models in the balancing markets [9].
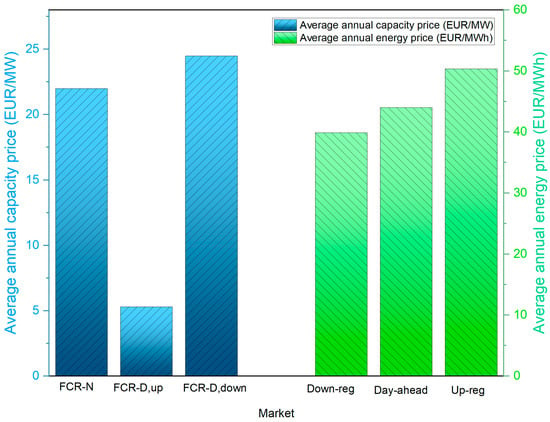
Figure 5.
Annual average capacity and realized energy prices in 2019.
To create a more accurate model, 15 min granularity in the balancing market was considered in this study. Figure 6 depicts the schematic of a reserve unit when providing, for example, FCR in the market with 15 min granularity. The local measured frequency in 2019, gathered from [32], was used in the 15 min resolution to model the activation of the reserve units in FCR markets, using Equations (4)–(6) [21].
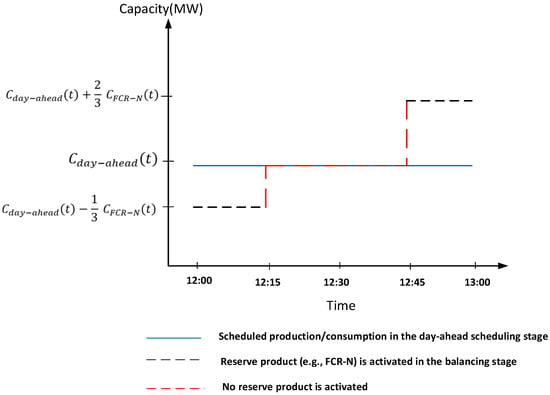
Figure 6.
The schematic of 15 min granularity in the balancing stage.
According to this model and the single-price system, the day-ahead cost, energy, and capacity fees for a reserve unit participating in FCR markets can be calculated as follows:
where is the capacity of a reserve unit tied to the day-ahead market (day-ahead scheduling stage) and is the hourly day-ahead prices gathered from Nordpool [26]. , , and are the capacity prices in the corresponding markets [9]. and are the activated up-regulation and down-regulation capacities in each market during 15 min intervals multiplied by the up-regulation balancing prices of the corresponding hour, , and down-regulation price, , respectively. The net profit for each reserve unit gained from each of the mentioned markets is the sum of the capacity and energy fees. The net profit for each city’s DHN operator from participating in the balancing markets was obtained through the sum of the profits from all the reserve units within the city’s DHN and the change in the operation cost of the HOBs resulting from increasing or decreasing their production level to compensate for the heat imbalances after activating the reserve capacities. Figure 7 summarizes the inputs and outputs used in the simulation during balancing market participation.

Figure 7.
Parameters for inputs and outputs utilized in the model during balancing markets participation (balancing stage).
2.3. Case Study DHN
The Helsinki metropolitan region encompasses three cities: Helsinki, Espoo, and Vantaa. In each city, a designated DHN owner is responsible for managing the local DHN. These operators have each developed their own strategies and timelines for transitioning their DH systems to more sustainable, low-carbon solutions. Although there are several heat exchanger stations enabling bidirectional heat flow between these cities, there is no overarching joint DH optimization for the region [18]. The heat transfer capacity from Espoo to Helsinki is 120 MW, while it is 130 MW between Vantaa and Helsinki [18]. For the purposes of this study, heat transmission between these cities was assumed to be without cost, facilitating the optimization of the entire system as a unified entity in a theoretical scenario.
In 2019, Helsinki was mainly dependent on natural gas and coal-fired CHPs and HOBs to meet the heat demand. The DHN operator, Helen, is planning to curb coal usage by 2025 by shutting down two coal-fired CHP units, with the combined thermal output of 720 MW, to be replaced with large-scale HPs, electric boilers, and thermal energy storage facilities [19]. The DHN operator in Espoo, Fortum, has made a commitment to phase out coal use by 2025. To facilitate this transition, the introduction of low-carbon technologies is planned, including heat recovery from data centers, the deployment of new HPs, and the utilization of biomass-fueled power plants [33]. However, two gas-fired CHP plants will continue to operate within Espoo’s DHN. In Vantaa, the primary heat source is a waste-to-heat power plant, which not only caters to the baseload, but is also slated for expansion as part of the decarbonization efforts to eliminate coal usage by 2022 [34]. The waste processed in this facility is sourced from the entire metropolitan area. Additionally, Vantaa is in the process of developing the world’s largest underground thermal storage system, with a capacity of 90 GWh and a volume of 1 million m3 [34]. The financial parameters, including fuel and CO2 allowance prices, as well as fuel and electricity taxes, are detailed in Table A1 in Appendix A. Comprehensive listings of the specific units within each DHN for the years 2019 and 2025 can be found in Table A2, Table A3 and Table A4 in Appendix A. Figure 8 depicts the supply side of the studied DHN, comparing the share of fuel consumption in 2019 and 2025.
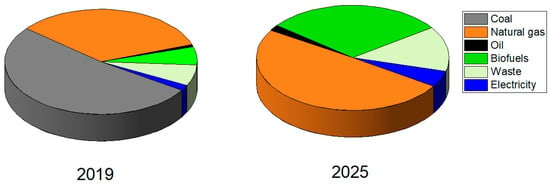
Figure 8.
The share of fuel consumption in the case study DHN in 2019 and 2025 (2019 results indicate real case study fuel consumption, while 2025 results illustrate the simulation results).
Due to the uncertainty associated with future fuel and electricity prices, the same historical fuel and electricity prices for 2019 were also used for the simulation of 2025. As capacity prices in different balancing markets have not significantly changed in recent years [9], the same hourly capacity prices were used in the FCR-N and FCR-D up-regulation markets for 2019 and 2025. Due to the introduction of the FCR-D down-regulation market in 2021, the 2022 capacity prices for this market were used in both simulations. The increasing EU ETS prices affect fossil fuel costs. While for 2019, the historical EU ETS prices with the annual average of 24.9 EUR/ton CO2 were used, in the 2025 simulations the EU ETS prices of 2022 with the annual average of 80 EUR/ton CO2 were considered. However, this is not expected to have any significant impact on the electricity market price in Finland, as electricity production will be practically carbon-free in Finland in 2025 and Finland will not be a net importer of electricity anymore. It was assumed that all HPs and electric boilers in the DH system can provide balancing services. Table 2 summarizes the reserve providing units in each DH system in 2019 and 2025. The HPs were modeled based on the heat source and sink inlet and outlet temperatures [17].

Table 2.
Technical characteristics of reserve providing units in the case study DHN [19,30,33].
3. Results
The results of the simulations are presented in this section. First, the case study was calibrated against the actual fuel consumption of each DH system for the year 2019, as gathered from the annual reports, published by the case study’s operators [19,33,34]. Table A2 in Appendix A summarizes the numerical results of the validation. Figure 9, Figure 10 and Figure 11 illustrate the unit-level results, encompassing the operational hours of each individual reserve unit in the day-ahead scheduling stage, the annual available capacity of each unit in FCR markets, and the annual profit generated by each unit from those markets, respectively. In contrast, Figure 12 shows the city-level results for the Helsinki and Espoo DHNs.
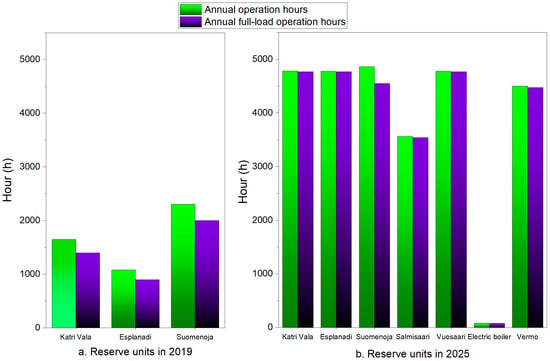
Figure 9.
Annual operation hours and annual full-load operation hours of the reserve units in the day-ahead scheduling in: (a) 2019 and (b) 2025.
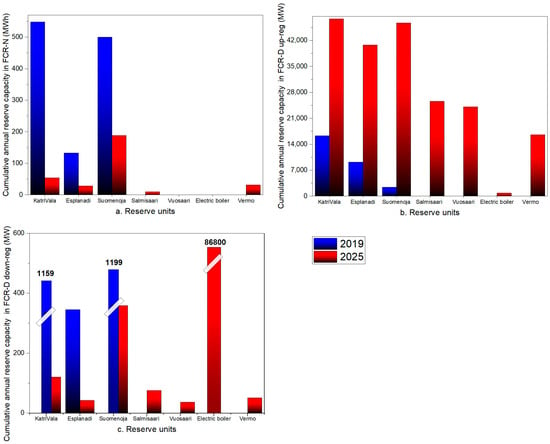
Figure 10.
Annual cumulative reserve capacity for each reserve unit within the case study DHN in 2019 and 2025: calculated as the product of the available reserve capacity and annual hours of availability of each unit, presented for (a) FCR-N, (b) FCR-D up-regulation, and (c) FCR-D down-regulation.
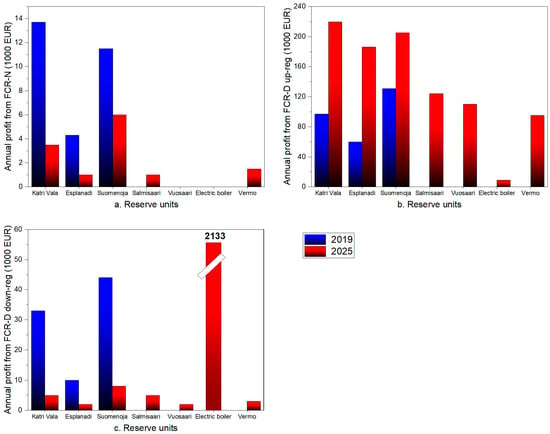
Figure 11.
The cumulative annual net profit of each reserve unit gained from: (a) FCR-N, (b) FCR-D up-regulation, and (c) FCR-D down-regulation markets in 2019 and 2025.
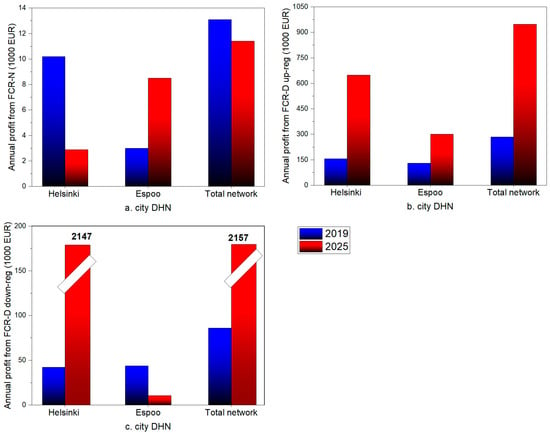
Figure 12.
The cumulative annual net profit for each city DHN from: (a) FCR-N, (b) FCR-D up-regulation, and (c) FCR-D down-regulation markets in 2019 and 2025.
Figure 9 and Figure 10 show the relationship between the operation of a unit in the day-ahead stage and the availability of reserve capacity for that unit in FCR markets. Figure 9 depicts the annual operational hours and annual full-load operation hours of the reserve units in the day-ahead stage for both 2019 and 2025. Notably, HPs are expected to operate more frequently in 2025 compared to 2019, driven by factors like higher fuel costs and reduced baseload CHP capacity. Electric boilers have recently gained traction in DH systems across Nordic countries, primarily utilized during periods of extremely low or even negative electricity prices. In the simulation, the electric boiler was only engaged for a very limited number of hours in 2025, operating at full capacity throughout.
Figure 10 illustrates the cumulative available reserve capacity of each reserve unit throughout the year, calculated by multiplying the unit’s available reserve capacity (calculated with Equations (1)–(3)) by the total number of hours it is available for operation in the day-ahead scheduling stage. As discussed in Section 2.2, when a reserve unit operates at maximum capacity in the day-ahead stage, it is not available for FCR-N or FCR-D down-regulation markets. Therefore, units with a higher ratio of full-load operating hours to total operating hours in the day-ahead stage, such as Katri Vala, Esplanadi, and Suomenoja HPs in 2025 (see Figure 9b), exhibit lower available reserve capacity for FCR-N or FCR-D down-regulation markets (see Figure 10a,c). The limited availability of reserve capacity from Vuosaari, Salmisaari, and Vermo HPs in 2025 for FCR-N and FCR-D down-regulation markets stems from their near-constant operation at full capacity in the day-ahead stage (see Figure 9b).
Figure 11 presents the cumulative annual net profit earned by each reserve unit, calculated as the sum of the cumulative annual capacity fees (derived from Equations (8)–(10)) and energy fees (derived from Equation (11)), from various FCR markets in both 2019 and 2025. Due to the projected decrease in the HPs’ total available reserve capacities for FCR-N and FCR-D down-regulation markets in 2025 (as indicated in Figure 10), revenues from these markets are also expected to decline, as depicted in Figure 11a,c. On the contrary, revenue from FCR-D up-regulation is anticipated to increase in 2025. The highest revenue is observed for the electric boiler in the FCR-D down-regulation market.
Figure 12 shows the cumulative annual net profit for each city-level DH system and the overall case study DH system, encompassing Espoo, Helsinki, and Vantaa cities. In the context of 2019, the Helsinki DH garnered significantly higher profits from the FCR-N market compared to the Espoo DH. However, with the heat generation fleet of 2025, Helsinki DH’s profit from this market would be lower than Espoo DH’s, despite the increased capacities of HPs within the Helsinki DH. Figure 9 and Figure 10a indicate that the Katri Vala and Esplanadi HPs within the Helsinki DH would possess considerably lower reserve capacities in the FCR-N in 2025 compared to the Suomenoja HP, which operates in the Espoo DH. Figure 9b depicts how the shutting down of substantial CHP capacities in the Helsinki DH system would result in augmented full-load operation hours for the HPs with day-ahead schedules. As a consequence of the increased operating hours of HPs in the day-ahead scheduling in 2025, as illustrated in Figure 9, both cities can earn more from the FCR-D up-regulation market. The electric boiler could deliver notable profits from the FCR-D down-regulation market for the Helsinki DH in 2025.
Given the intricate and uncertain nature of future energy market developments, it is crucial to pinpoint the primary factors influencing the modeling outcomes. Among these factors, electricity prices and fuel costs hold significant sway, with increasing EU ETS prices particularly impacting fuel costs for power plant operators [28]. To address these complexities, a sensitivity analysis was conducted, varying the electricity prices and EU ETS prices for the 2025 simulations. Figure 13 presents the outcomes for the case study DHN, with the 2025 generation fleet employing the assumed historical EU ETS prices of 2022, with an annual average of 80 EUR/tonCO2, as well as the projected prices for 2025, with an annual average of 110 EUR/tonCO2 [32]. Figure 13a highlights the share of heat generated annually by HPs within each city DHN relative to their respective annual heat demand. As EU ETS prices escalate, fuel costs surge, leading to a decline in CHP production and a corresponding rise in HP production. Figure 13b–d depicts the cumulative annual net profit for each FCR market based on various EU ETS prices. With higher EU ETS prices, revenues from all markets, except for the FCR-D down-regulation market, would increase. The reduced reserve capacity available in the FCR-D down-regulation market, due to the higher operating hours of the electric boiler in the day-ahead scheduling system, contributes to the lower achievable total net profit under higher EU ETS prices [32]. As the operation hours of CHPs decrease in response to higher EU ETS prices, HPs must operate more extensively to meet the heat demand, thereby expanding their capacity for the FCR-D up-regulation market, as demonstrated in Figure 13c.
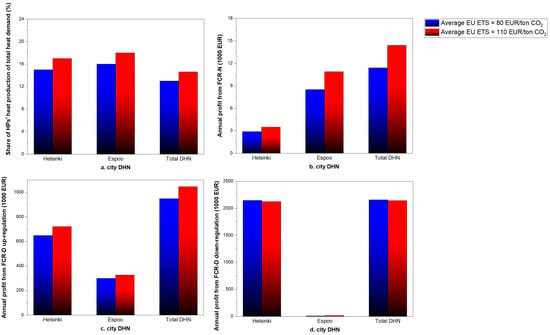
Figure 13.
(a) Proportion of heat produced annually by HPs in each city’s DHN relative to the annual heat demand; cumulative annual net profit of each city’s DHN in (b) FCR-N, (c) FCR-D up-regulation, and (d) FCR-D down-regulation markets.
Figure 14 presents the simulation outcomes for the 2025 generation fleet under varying electricity prices. It is crucial to emphasize that the up-regulation and down-regulation prices are cleared in accordance with the day-ahead prices, as depicted in Table 1. Hence, altering the day-ahead prices in the sensitivity analysis leads to simultaneous modifications in the up-regulation and down-regulation prices. Figure 14a illustrates the proportion of HP-generated heat within each city’s DHN relative to its annual heat demand, along with the annual average of the spot prices on the right y-axis, while Figure 14b-d showcase the cumulative annual net profit for each city’s DH system and the entire network derived from the FCR-N, FCR-D up-regulation, and FCR-D down-regulation markets, respectively. Rising spot prices translate into higher revenue generated from electricity sales by CHP units in the day-ahead market. Consequently, CHP operation rates increase, while HPs experience reduced hours of operation in the day-ahead scheduling, as illustrated in Figure 14a.
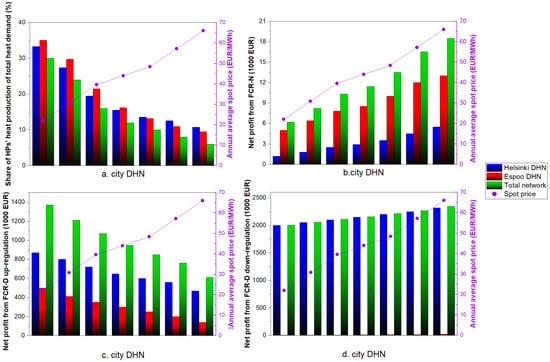
Figure 14.
(a) Proportion of annual heat production by HPs in each city’s DHN relative to its annual heat demand, under varying electricity spot prices. Cumulative annual net profit for each city’s DHN in: (b) FCR-N, (c) FCR-D up-regulation, and (d) FCR-D down-regulation markets.
As there are no HPs or electric boilers in the Vantaa DHN, increasing electricity prices have no impact on CHP operation, and Vantaa’s CHP units are not depicted in the figure. The reduced operation of HPs and the electric boiler in the day-ahead scheduling with increasing electricity prices results in higher income from FCR-N and FCR-D down-regulation markets. Conversely, FCR-D up-regulation would generate lower profits in higher electricity prices.
4. Conclusions
In their pursuit of carbon neutrality by 2035, district heating network (DHN) operators in Finland aim to decarbonize their systems by retiring fossil-fueled combined heat and power plants (CHPs) and investing in large-scale heat pumps (HPs) and electric boilers (electrification approach). The decommissioning of CHP units, however, eliminates the benefits of simultaneous electricity and heat production, a feature particularly valuable during periods of elevated electricity market prices and in the cold Nordic climate. This necessitates exploration of new revenue streams for electrified heat generation units through alternative markets, such as balancing markets. Additionally, the growing integration of wind power generation into the Finnish electricity grid, with installed capacity surpassing 60% of average electricity demand in 2022 [35], underscores the demand for alternative balancing providers. This study delved into the techno-economic analysis and economic feasibility of utilizing HPs and electric boilers operating within a large and electrified DHN to provide ancillary balancing services to the Finnish electrical power system. Simulations were conducted using the interconnected DHNs of Helsinki, Espoo, and Vantaa cities, serving 1.1 million people in the capital region of Finland. The key findings from this study are summarized below:
- Among the markets studied, the FCR-D up-regulation market is expected to be the most lucrative balancing market for large HPs. In total, HPs could achieve achievable net profits of EUR 285,000 and EUR 940,000 in the analyzed cases of 2019 and 2025 DHNs, respectively, from this market. In both cases examined, the FCR-N market was the least profitable for HPs and electric boilers.
- Electric boilers, which have recently been introduced into Finnish DH systems, are primarily employed during periods of low day-ahead electricity prices. While the electric boiler in the case study DHN would be in operation for merely 1% of hours in 2025 in the day-ahead scheduling, it could generate a net profit of approximately EUR 2.2 million for the Helsinki DH system from the FCR-D down-regulation market, exhibiting the most substantial individual benefits among the ancillary services markets analyzed.
- Higher CO2 emission allowance prices (EU ETS prices) increase the net profit derived from the FCR-N and FCR-D up-regulation markets. Considering the upward trend of CO2 emission allowance prices in recent years, an increasing profit from these markets is anticipated in the upcoming years. The profit from the FCR-D down-regulation market was shown to decline marginally with higher ETS prices.
Currently, DH systems in Finland face significant uncertainties regarding their future operating conditions. The interruption of natural gas and biomass imports from Russia to Finland since 2022 has propelled the prices of these fuels, and future price levels remain unpredictable. They could persist at a higher level than anticipated in this study, enhancing the competitiveness of HP technologies, while also highlighting the need for a diversified and secure energy supply. This study suggests that DHN operators must remain adaptable to changing market conditions. The fluctuating nature of electricity and EU ETS prices requires dynamic management strategies to maximize revenues and maintain operational efficiency. The findings indicate the necessity for strategic planning in the integration of HPs and electric boilers. This includes considerations for operational scheduling and balancing market participation to optimize financial returns and energy efficiency.
Considering the increasing integration of renewable energy sources, such as wind power, future studies could explore the role of other potential balancing providers in complementing HPs and electric boilers. Other suggestions for future works include analyzing the long-term sustainability and environmental impact of the shift to HPs and electric boilers in DHNs, considering the entire lifecycle of these technologies, and investigating the potential for diversifying energy sources within DHNs to enhance the resilience against fuel supply uncertainties and fluctuating prices, thereby ensuring a stable and secure energy supply.
Author Contributions
Conceptualization, N.J.; methodology, N.J.; software, N.J.; validation, N.J.; formal analysis, N.J.; data curation, N.J.; writing—original draft preparation, N.J.; writing—review and editing, S.S.; visualization, N.J.; supervision, S.S.; project administration, S.S.; funding acquisition, S.S. All authors have read and agreed to the published version of the manuscript.
Funding
This work was supported by Doctoral research funding from the Aalto University School of Engineering.
Data Availability Statement
Data is contained within the article.
Conflicts of Interest
The authors declare no conflict of interests. This is an academic contribution based on data from open sources and does not represent the official view or the actual operation of any organization.
Nomenclature
| Indices | Abbreviations | ||
| Time | aFRR | Automatic frequency restoration reserve | |
| COP | Coefficient of performance | ||
| Parameters | CHP | Combined heat and power unit | |
| Measured frequency (HZ) | DHN | District heating network | |
| FCR-N Capacity Hourly Market Prices | EU ETS | European Union emissions trading system | |
| FCR-D Capacity Hourly Market Prices | FCR | Frequency containment reserve | |
| Down-Regulation Balancing Market Price | FCR-N | Frequency containment reserve for normal operation | |
| Up-Regulation Balancing Market Price | FCR-D | Frequency containment reserve for disturbances | |
| FLH | Full-load hour | ||
| HOB | Heat-only boiler | ||
| Variables | HP | ||
| mFRR | Manual frequency restoration reserve | ||
| O&M | Operation & maintenance cost (EUR) | ||
| P2H | Power-to-heat | ||
| Maintained capacity in FCR-N market | TSO | Transmission system operator | |
| Maintained capacity in FCR-D up-regulation market | |||
| Maintained capacity in FCR-D down-regulation market | |||
| Maintained capacity in day-ahead market | |||
| Activated FCR-N capacity during 15 min block | |||
| Activated downward capacity during 15 min block | |||
| Activated upward capacity during 15 min block | |||
Appendix A

Table A1.
Financial parameters used in simulations in 2019 and 2025.
Table A1.
Financial parameters used in simulations in 2019 and 2025.
| Parameter | Value (EUR/MWh) | |
|---|---|---|
| Fuel tax [36,37] | ||
| Coal | HOB | 29.2 |
| CHP | 21.5 | |
| Natural gas (NG) | HOB | 20.6 |
| CHP | 13.0 | |
| Light fuel oil (LFO) | - | 27.5 |
| Heavy fuel oil (HFO) | - | 24.5 |
| Fuel cost [27] | ||
| Coal | 7.8 * | |
| NG | 23.2 * | |
| HFO | 54.1 * | |
| LFO | 76.2 * | |
| Bio-oil | 67.0 | |
| Wood pellet | 46.7 | |
| Forest chips | 22.2 | |
| Waste | −7.95 | |
| Electricity costs | ||
| Electricity spot price [26] | 44.0 ** | |
| Distribution cost | Helsinki [30] | 32.80 |
| Espoo [38] | 31.40 | |
| Electricity tax [36] | 6.9 | |
| CO2 price [39] (EUR/tonCO2) | 25 (2019)/80 (2025) *** |
* While average monthly values of fuel prices are used in the simulation, the value in the tables refers to the yearly average value. ** Hourly values of spot price used in the simulation, while this refers to the yearly average value. *** Hourly values of CO2 allowance prices are used in the simulations.

Table A2.
Production units in the Helsinki DHN in 2019 and 2025 [19].
Table A2.
Production units in the Helsinki DHN in 2019 and 2025 [19].
| Unit | Fuel | Thermal Output (MW) |
|---|---|---|
| Existing | ||
| HOB | LFO | 136 |
| HOB | HFO | 873 |
| HOB | Coal | 170 |
| HOB | NG | 912 |
| HOB | Wood pellet | 92 |
| HP Katri Vala | Wastewater | 105 |
| HP Esplanadi | Wastewater | 22 |
| Hanasaari CHP | Mix (coal and biomass) | 420 |
| Salmisaari CHP | Mix (coal and biomass) | 300 |
| Vuosaari CHPs | NG | 587 |
| Thermal storage | - | 45,000 m3 * |
| To be decommissioned by the beginning of 2025 | ||
| HOB | Coal | 170 |
| Salmisaari CHP | Coal | 300 |
| Hanasaari CHP | Coal | 420 |
| To be deployed/expanded after 2019 | ||
| Vuosaari HOB | Biomass | 260 |
| Salmisaari HOB | Wood pellet | 150 |
| HP Salmisaari | Ambient air | 20 |
| HP Vuosaari | Sea water | 13 |
| HP Katri Vala | Wastewater | 155 |
| Electric boiler | Electricity | 280 |
| Thermal storage | - | 260,000 m3 |
* The combined volume of two thermal storage facilities within the Helsinki DHN.

Table A3.
Production units in the Espoo DHN in 2019 and 2025 [40].
Table A3.
Production units in the Espoo DHN in 2019 and 2025 [40].
| Unit | Fuel | Thermal Output (MW) |
|---|---|---|
| Existing | ||
| Suomenoja HPs (3, 4) | Wastewater | 70 |
| Vermo HOB | Bio-oil | 35 |
| Kivenlahti HOB | Wood pellets | 90 |
| HOB | LFO | 85 |
| HOB | NG | 456 |
| HOB | Coal | 80 |
| Thermal storage | - | 18,000 m3 |
| Suomenoja 1 CHP | Coal | 160 |
| Suomenoja 2 CHP | NG | 214 |
| Suomenoja 6 CHP | NG | 80 |
| To be decommissioned by the beginning of 2025 | ||
| Suomenoja 1 CHP | Coal | 160 |
| To be deployed/expanded after 2019 | ||
| Vermo HP | Ambient air | 11 |
| Kivenlahti HOB | Woodchips | 52 |
| Espoo Datacenter | Datacenter | 100 |

Table A4.
Production units in the Vantaa DHN in 2019 and 2025 [34].
Table A4.
Production units in the Vantaa DHN in 2019 and 2025 [34].
| Unit | Fuel | Thermal Output (MW) |
|---|---|---|
| Existing | ||
| HOB | NG | 427 |
| HOB | LFO | 92 |
| Martinlaakso 1 CHP | Wood chips | 100 |
| Jätevoimala CHP waste | Waste | 140 |
| Martinlaakso 2 CHP | Wood chips | 135 |
| Martinlaakso 4 CHP | NG | 90 |
| To be deployed/expanded after 2019 | ||
| Thermal storage | - | 1,000,000 m3 |
| Martinlaakso CHP | Wood chips | 22.5 |
| HOB | Waste | 64 |

Table A5.
Comparison of fuel consumption from simulations versus the real case study in 2019.
Table A5.
Comparison of fuel consumption from simulations versus the real case study in 2019.
| Fuel Consumption (GWh) | Helsinki DHN | Espoo DHN | Vantaa DHN | |||
|---|---|---|---|---|---|---|
| Real Situation | Simulation | Real Situation | Simulation | Real Situation | Simulation | |
| Coal | 6500 | 5500 | 2042 | 1800 | 600 | 850 |
| Natural Gas | 5000 | 6800 | 729 | 1300 | 245 | 350 |
| Oil | 106 | 0 | 4.6 | 1.0 | 1.5 | 0.9 |
| Bio | 226 | 350 | 244 | 150 | 533 | 680 |
| Waste | 0 | 0 | 0 | 0 | 1120 | 1137 |
| Electricity | 133.6 | 95 | 180 | 55 | 0 | 0 |
| Total | 11,965 | 12,745 | 3200 | 3306 | 2500 | 2247 |
References
- United Nations. Climate Change: The Paris Agreement | UNFCCC. Available online: https://unfccc.int/process-and-meetings/the-paris-agreement/the-paris-agreement (accessed on 22 June 2021).
- European Climate Law. Available online: https://ec.europa.eu/clima/eu-action/european-green-deal/european-climate-law_en (accessed on 4 December 2021).
- Finland’s Integrated Energy and Climate Plan. työ- ja elinkeinoministeriö. December 2019. Available online: https://julkaisut.valtioneuvosto.fi/handle/10024/161977 (accessed on 25 January 2022).
- Cramton, P. Electricity market design. Oxf. Rev. Econ. Policy 2017, 33, 589–612. [Google Scholar] [CrossRef]
- Energy Year 2022—Electricity—Energiateollisuus. Available online: https://energia.fi/en/newsroom/publications/energy_year_2022_-_electricity.html#material-view (accessed on 16 May 2023).
- van der Veen, R.A.C.; Hakvoort, R.A. The electricity balancing market: Exploring the design challenge. Util Policy 2016, 43, 186–194. [Google Scholar] [CrossRef]
- Nuclear Power to the Reserve Market—ePressi. Available online: https://www.epressi.com/tiedotteet/energia/ydinvoima-mukaan-reservimarkkinoille.html (accessed on 15 May 2023).
- Hae Tuulivoima Reservimarkkinoille-Pilottiin 16.1.2023 Mennessä—ePressi. Available online: https://www.epressi.com/tiedotteet/energia/hae-tuulivoima-reservimarkkinoille-pilottiin-16.1.2023-mennessa.html (accessed on 15 May 2023).
- Fingrid-Reserves and Balancing Power. Available online: https://www.fingrid.fi/en/electricity-market/reserves_and_balancing/ (accessed on 5 December 2021).
- Pudjianto, D.; Djapic, P.; Aunedi, M.; Gan, C.K.; Strbac, G.; Huang, S.; Infield, D. Smart control for minimizing distribution network reinforcement cost due to electrification. Energy Policy 2013, 52, 76–84. [Google Scholar] [CrossRef]
- Baeten, B.; Rogiers, F.; Helsen, L. Reduction of heat pump induced peak electricity use and required generation capacity through thermal energy storage and demand response. Appl. Energy 2017, 195, 184–195. [Google Scholar] [CrossRef]
- Vanhoudt, D.; Geysen, D.; Claessens, B.; Leemans, F.; Jespers, L.; van Bael, J. An actively controlled residential heat pump: Potential on peak shaving and maximization of self-consumption of renewable energy. Renew. Energy 2014, 63, 531–543. [Google Scholar] [CrossRef]
- Cooper, S.J.G.; Hammond, G.P.; McManus, M.C.; Rogers, J.G. Impact on energy requirements and emissions of heat pumps and micro-cogenerators participating in demand side management. Appl. Therm. Eng. 2014, 71, 872–881. [Google Scholar] [CrossRef]
- Melsas, R.; Rosin, A.; Drovtar, I. Value Stream Mapping for Evaluation of Load Scheduling Possibilities in a District Heating Plant. Trans. Environ. Electr. Eng. 2016, 1, 62–67. [Google Scholar] [CrossRef][Green Version]
- Terreros, O.; Spreitzhofer, J.; Basciotti, D.; Schmidt, R.R.; Esterl, T.; Pober, M.; Kerschbaumer, M.; Ziegler, M. Electricity market options for heat pumps in rural district heating networks in Austria. Energy 2020, 196, 116875. [Google Scholar] [CrossRef]
- Javanshir, N.; Hiltunen, P.; Syri, S. Is Electrified Low-Carbon District Heating Able to Manage Electricity Price Shocks? In Proceedings of the International Conference on the European Energy Market, EEM 2022, Ljubljana, Slovenia, 13–15 September 2022. [Google Scholar] [CrossRef]
- Javanshir, N.; Syri, S.; Teräsvirta, A.; Olkkonen, V. Abandoning peat in a city district heat system with wind power, heat pumps, and heat storage. Energy Rep. 2022, 8, 3051–3062. [Google Scholar] [CrossRef]
- Finnish Energy. District Heating Statistics. Available online: https://energia.fi/en/newsroom/publications/district_heating_statistics.html#material-view (accessed on 18 February 2022).
- Power Plants | Helen. Available online: https://www.helen.fi/en/company/energy/energy-production/power-plants (accessed on 1 February 2023).
- Boldrini, A.; Jiménez Navarro, J.P.; Crijns-Graus, W.H.J.; van den Broek, M.A. The role of district heating systems to provide balancing services in the European Union. Renew. Sustain. Energy Rev. 2022, 154, 111853. [Google Scholar] [CrossRef]
- Javanshir, N.; Syri, S.; Tervo, S.; Rosin, A. Operation of district heat network in electricity and balancing markets with the power-to-heat sector coupling. Energy 2023, 266, 126423. [Google Scholar] [CrossRef]
- Wang, J.; You, S.; Zong, Y.; Traeholt, C.; Zhou, Y.; Mu, S. Optimal dispatch of combined heat and power plant in integrated energy system: A state of the art review and case study of Copenhagen. Energy Procedia 2019, 158, 2794–2799. [Google Scholar] [CrossRef]
- Haakana, J.; Tikka, V.; Lassila, J.; Partanen, J. Methodology to analyze combined heat and power plant operation considering electricity reserve market opportunities. Energy 2017, 127, 408–418. [Google Scholar] [CrossRef]
- EMD International A/S, EnergyPRO. Available online: https://www.emd.dk/energypro/ (accessed on 23 March 2020).
- Østergaard, P.A.; Andersen, A.N.; Sorknæs, P. The business-economic energy system modelling tool energyPRO. Energy 2022, 257, 124792. [Google Scholar] [CrossRef]
- Statistics Finland-Energy Prices. Available online: https://www.stat.fi/til/ehi/kuv_en.html (accessed on 23 March 2022).
- EU Emissions Trading System (EU ETS) | Climate Action. Available online: https://ec.europa.eu/clima/policies/ets_en (accessed on 23 March 2021).
- Finnish Meteorological Institute. Weather Data. Available online: https://en.ilmatieteenlaitos.fi/ (accessed on 12 April 2021).
- Patronen, J.; Kaura, E.; Torvestad, C. Nordic Heating and Cooling; Nordic Council of Ministers: Copenhagen, Denmark, 2017. [Google Scholar] [CrossRef]
- Su, Y.; Hiltunen, P.; Syri, S.; Khatiwada, D. Decarbonization strategies of Helsinki metropolitan area district heat companies. Renew. Sustain. Energy Rev. 2022, 160, 112274. [Google Scholar] [CrossRef]
- Technology Data. Danish Energy Agency 2016. Available online: https://ens.dk/en/our-services/projections-and-models/technology-data (accessed on 12 April 2021).
- Fingrid. Available online: https://www.fingridlehti.fi/en/finland-switching-to-15-minute-imbalance-settlement/#e2892316 (accessed on 21 February 2023).
- Fortum. Available online: https://www.fortum.com/files/fortum-sustainability-2020/download (accessed on 23 March 2022).
- Vantaan Energia. Available online: https://www.vantaanenergia.fi/ (accessed on 1 February 2023).
- Finnish Wind Power Association. About Wind Power in Finland. Available online: https://tuulivoimayhdistys.fi/en/wind-power-in-finland-2/wind-power-in-finland/about-wind-power-in-finland (accessed on 17 June 2021).
- Tax Rates on Electricity and Fuels—Vero.fi. Available online: https://www.vero.fi/en/businesses-and-corporations/taxes-and-charges/excise-taxation/sahkovero/Tax-rates-on-electricity-and-certain-fuels/ (accessed on 23 March 2022).
- Electricity Production and in Combined Production of Heat and Electricity—Vero.fi. Available online: https://www.vero.fi/en/businesses-and-corporations/taxes-and-charges/excise-taxation/excise-duty-refunds/electricity-production-and-in-combined-production-of-heat-and-electricity/ (accessed on 12 April 2022).
- Electricity Distribution Prices | Caruna. Available online: https://caruna.fi/en/products-and-services/home-and-real-estate/electricity-distribution-prices (accessed on 14 December 2023).
- Carbon Price Viewer—Ember. Available online: https://ember-climate.org/data/carbon-price-viewer/ (accessed on 13 June 2021).
- Espoo Clean Heat | Fortum. Available online: https://www.fortum.com/products-and-services/heating-cooling/espoo-clean-heat (accessed on 1 February 2023).
Disclaimer/Publisher’s Note: The statements, opinions and data contained in all publications are solely those of the individual author(s) and contributor(s) and not of MDPI and/or the editor(s). MDPI and/or the editor(s) disclaim responsibility for any injury to people or property resulting from any ideas, methods, instructions or products referred to in the content. |
© 2023 by the authors. Licensee MDPI, Basel, Switzerland. This article is an open access article distributed under the terms and conditions of the Creative Commons Attribution (CC BY) license (https://creativecommons.org/licenses/by/4.0/).