Author Contributions
Conceptualization, I.P., P.L., A.L., W.K., M.O., J.F., Z.K. and A.T.; methodology, I.P., W.K. and A.T.; software, P.L. and I.P.; validation, A.T., J.F., M.O. and Z.K.; formal analysis, A.L., M.O., J.F. and Z.K.; investigation, P.L., I.P. and A.L.; resources, W.K. and A.T.; data curation, P.L. and W.K.; writing—original draft preparation, P.L.; writing—review and editing, P.L., A.T. and A.L.; visualization, I.P. and W.K.; supervision, A.T., Z.K., J.F. and M.O.; project administration, J.F., A.T. and I.P.; funding acquisition, A.T. and J.F. All authors have read and agreed to the published version of the manuscript.
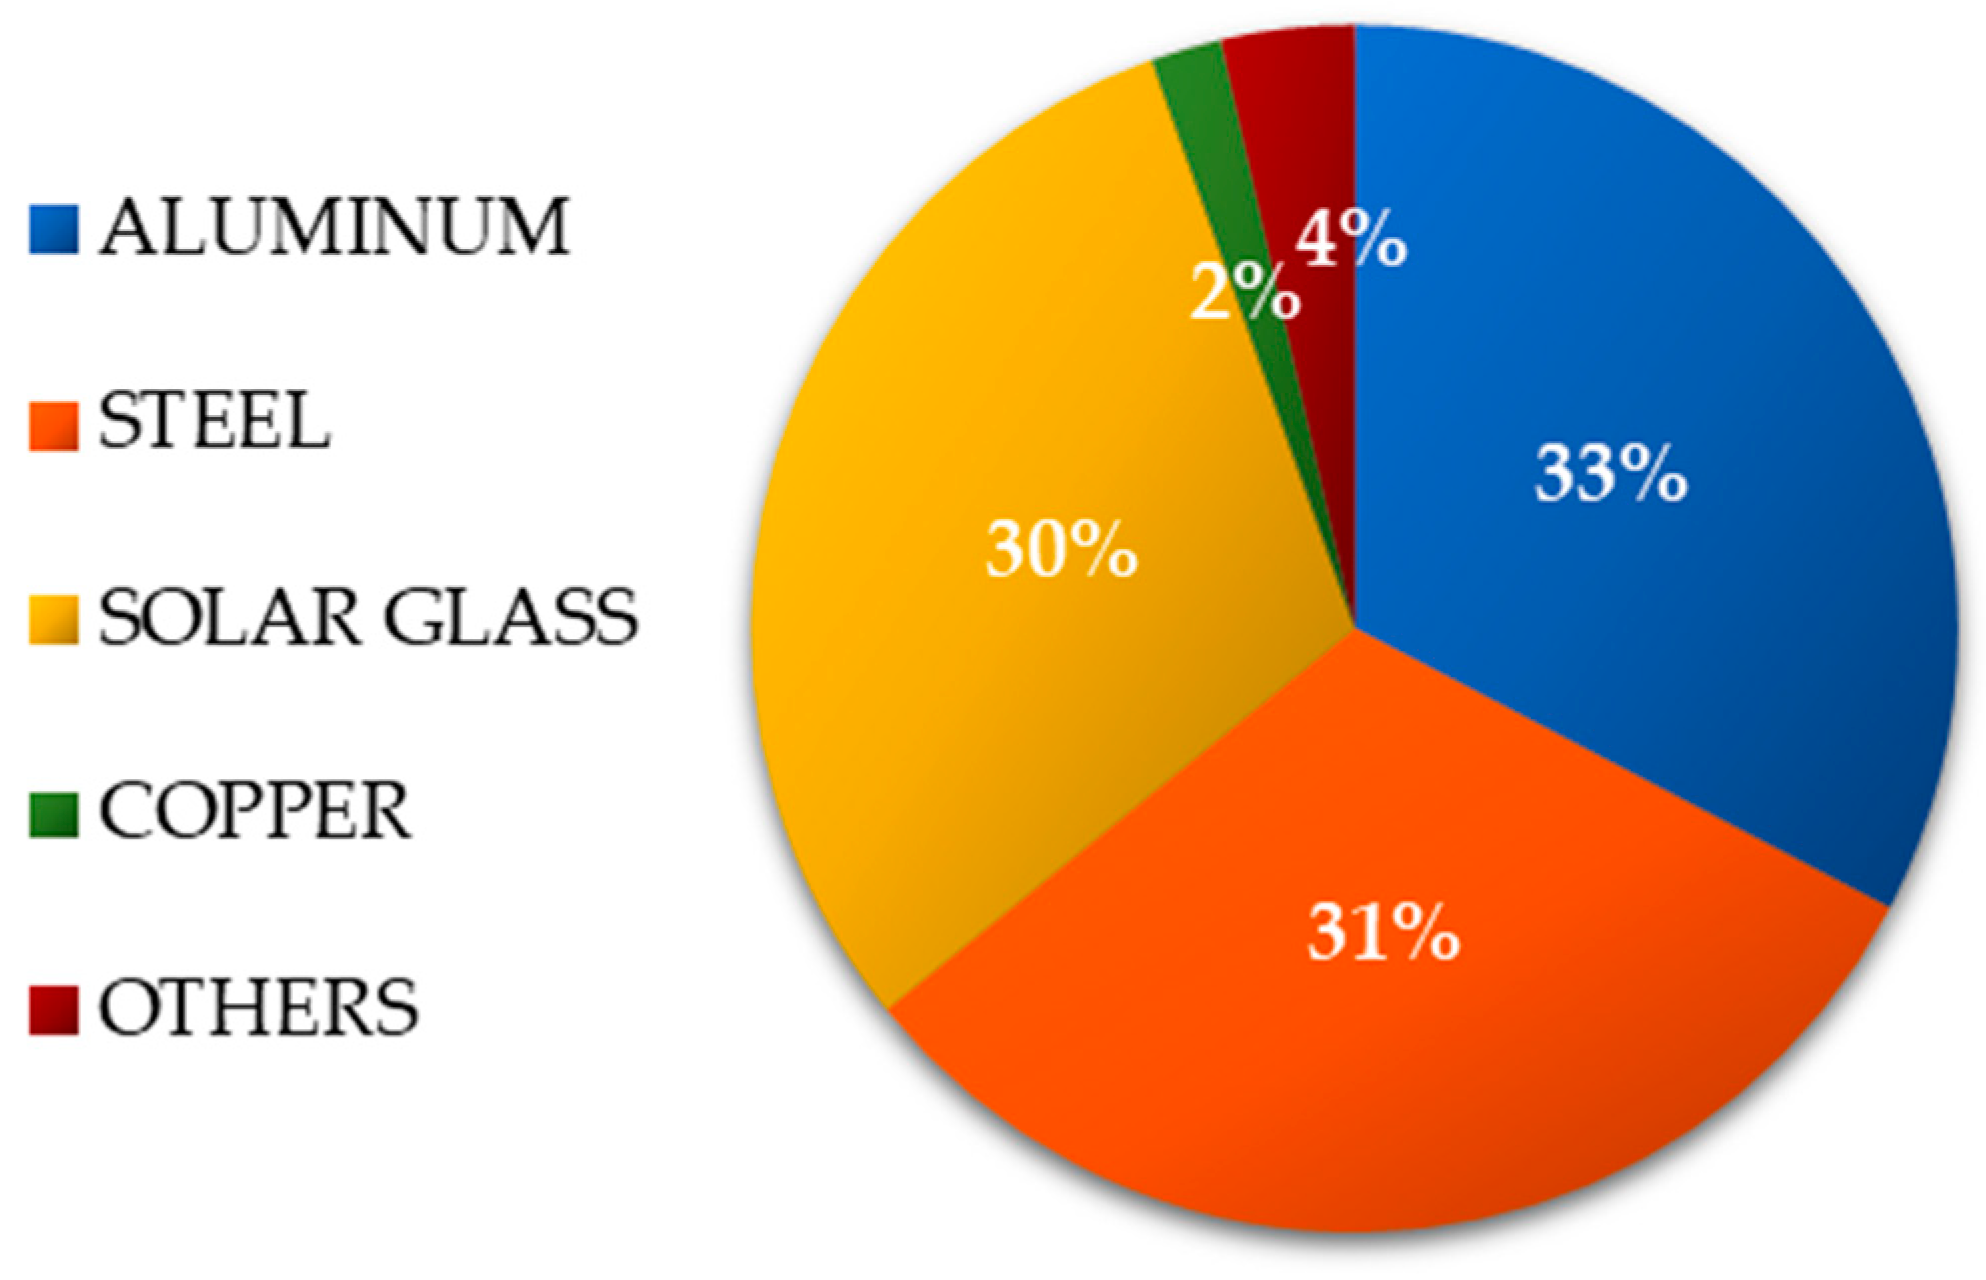
Figure 1.
Dividend by percentage of the mass of materials in the solar power plant under consideration (investor data).
Figure 1.
Dividend by percentage of the mass of materials in the solar power plant under consideration (investor data).
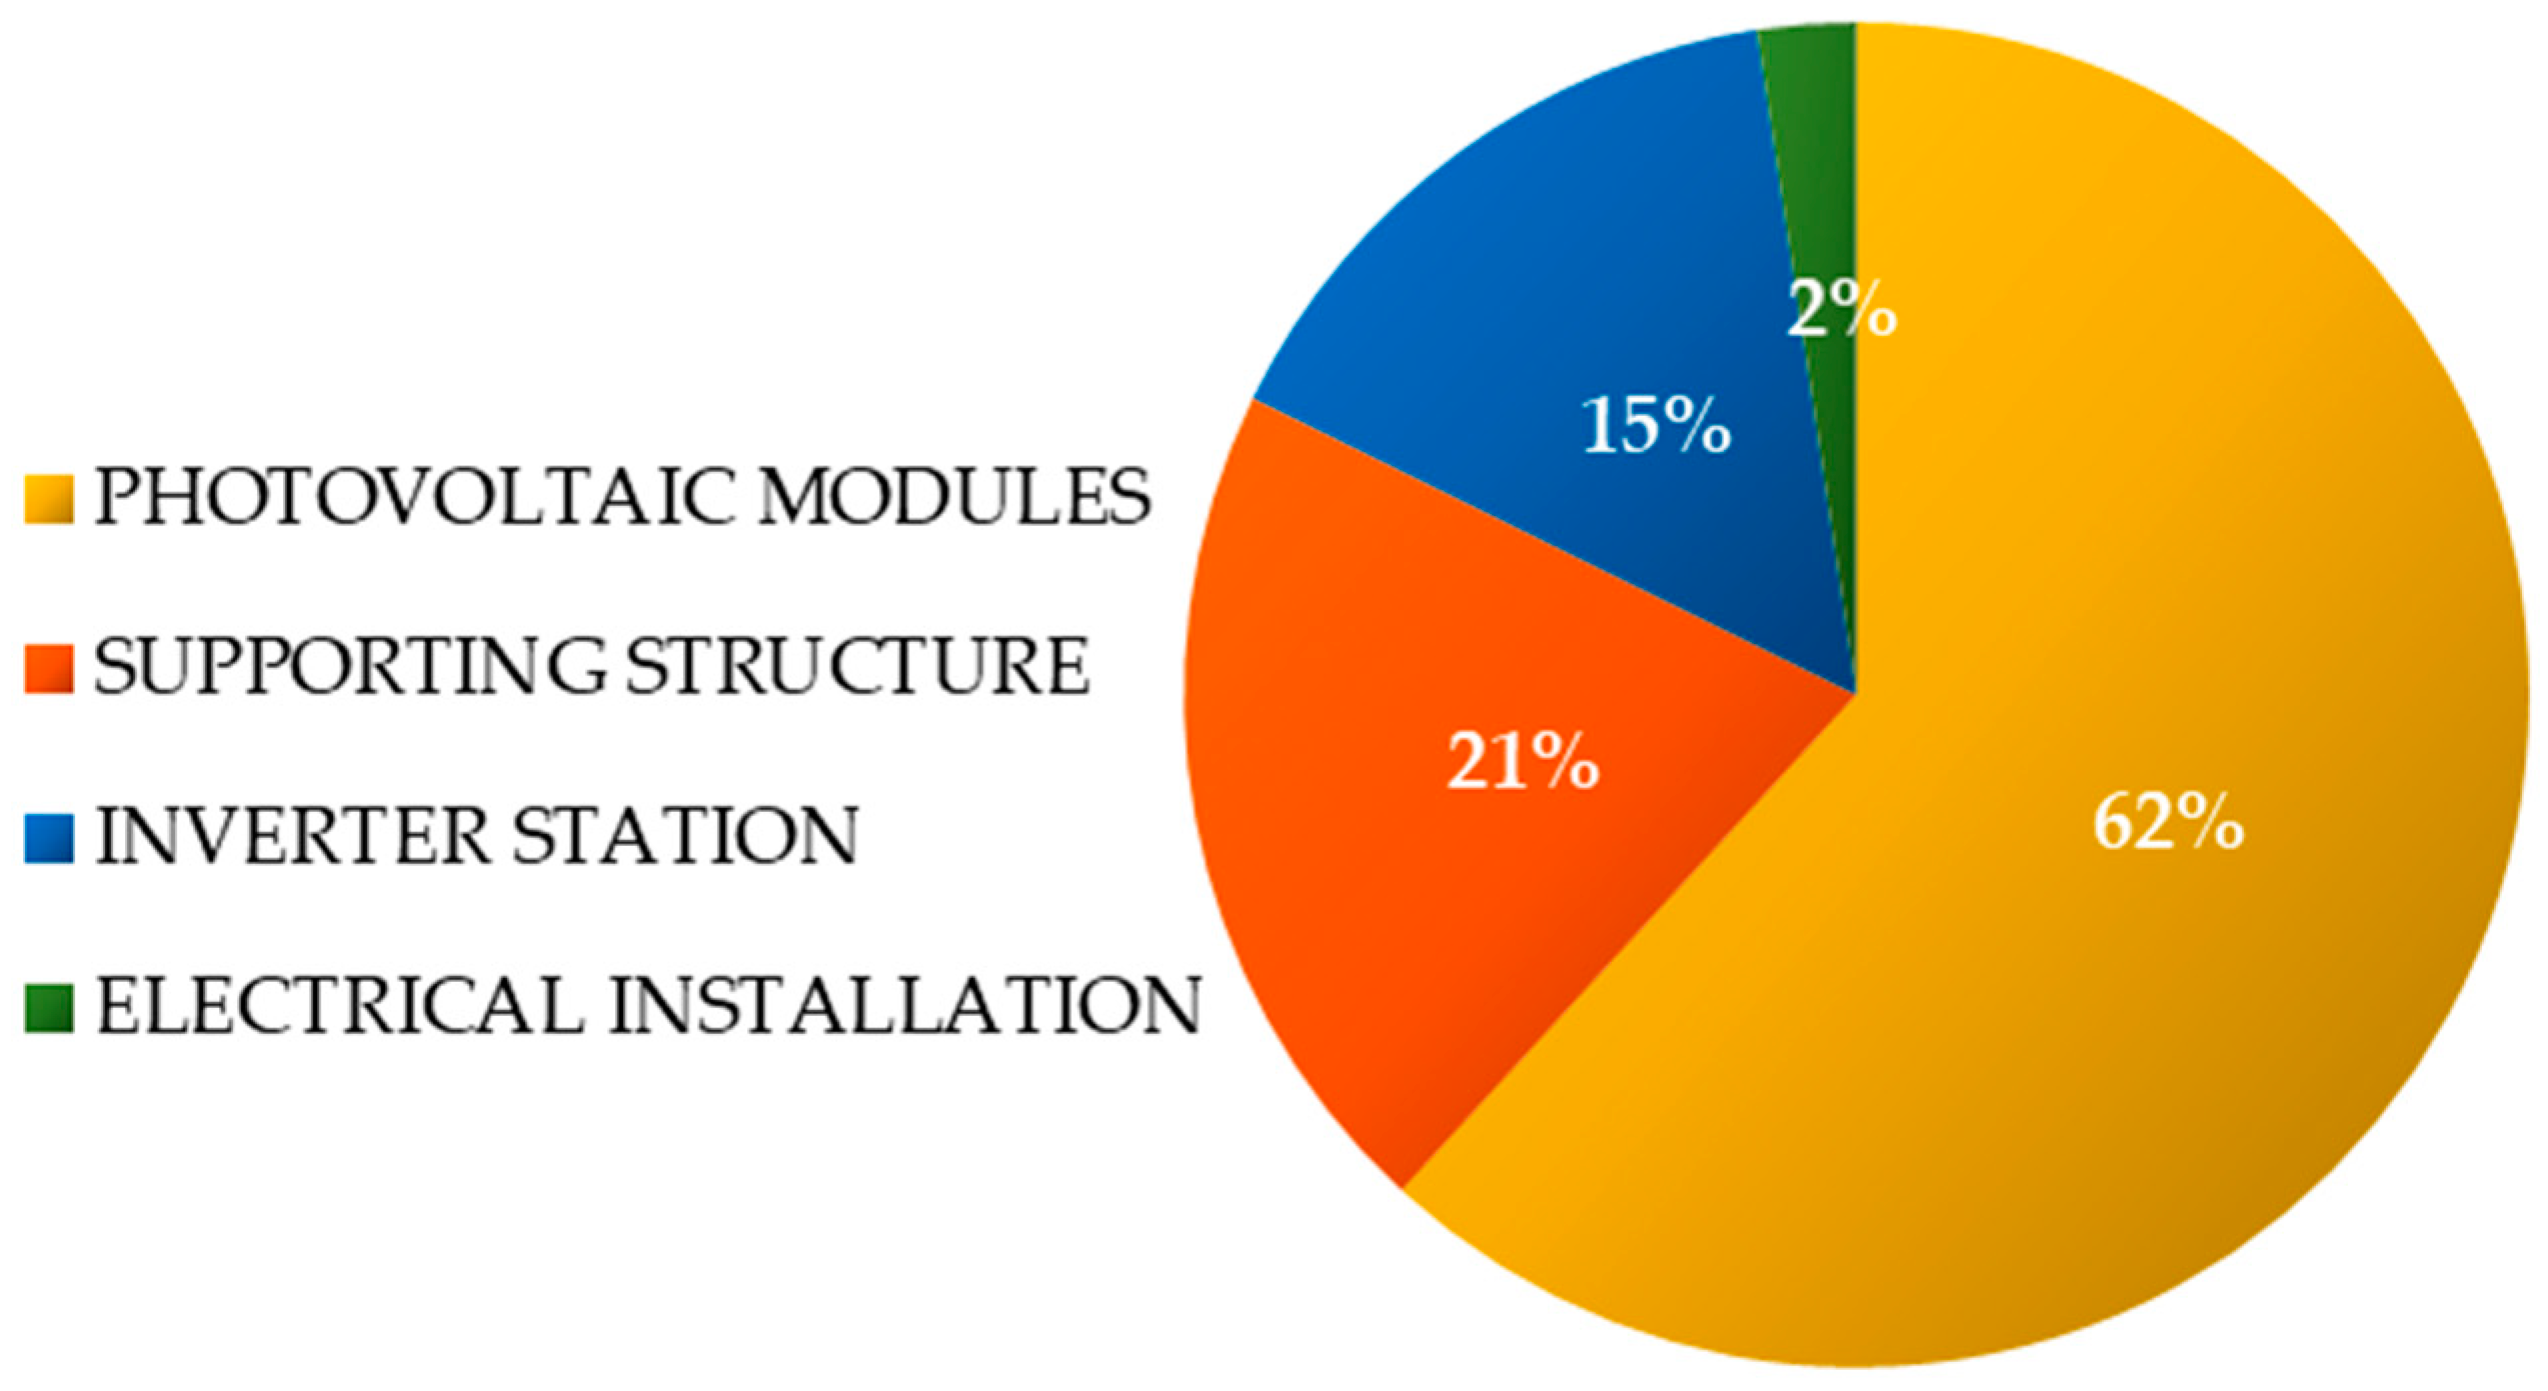
Figure 2.
Percentage breakdown of the components in the solar power plant under consideration (investor data).
Figure 2.
Percentage breakdown of the components in the solar power plant under consideration (investor data).
Figure 3.
An illustration of the primary phases of an LCA analysis [
2,
36].
Figure 3.
An illustration of the primary phases of an LCA analysis [
2,
36].
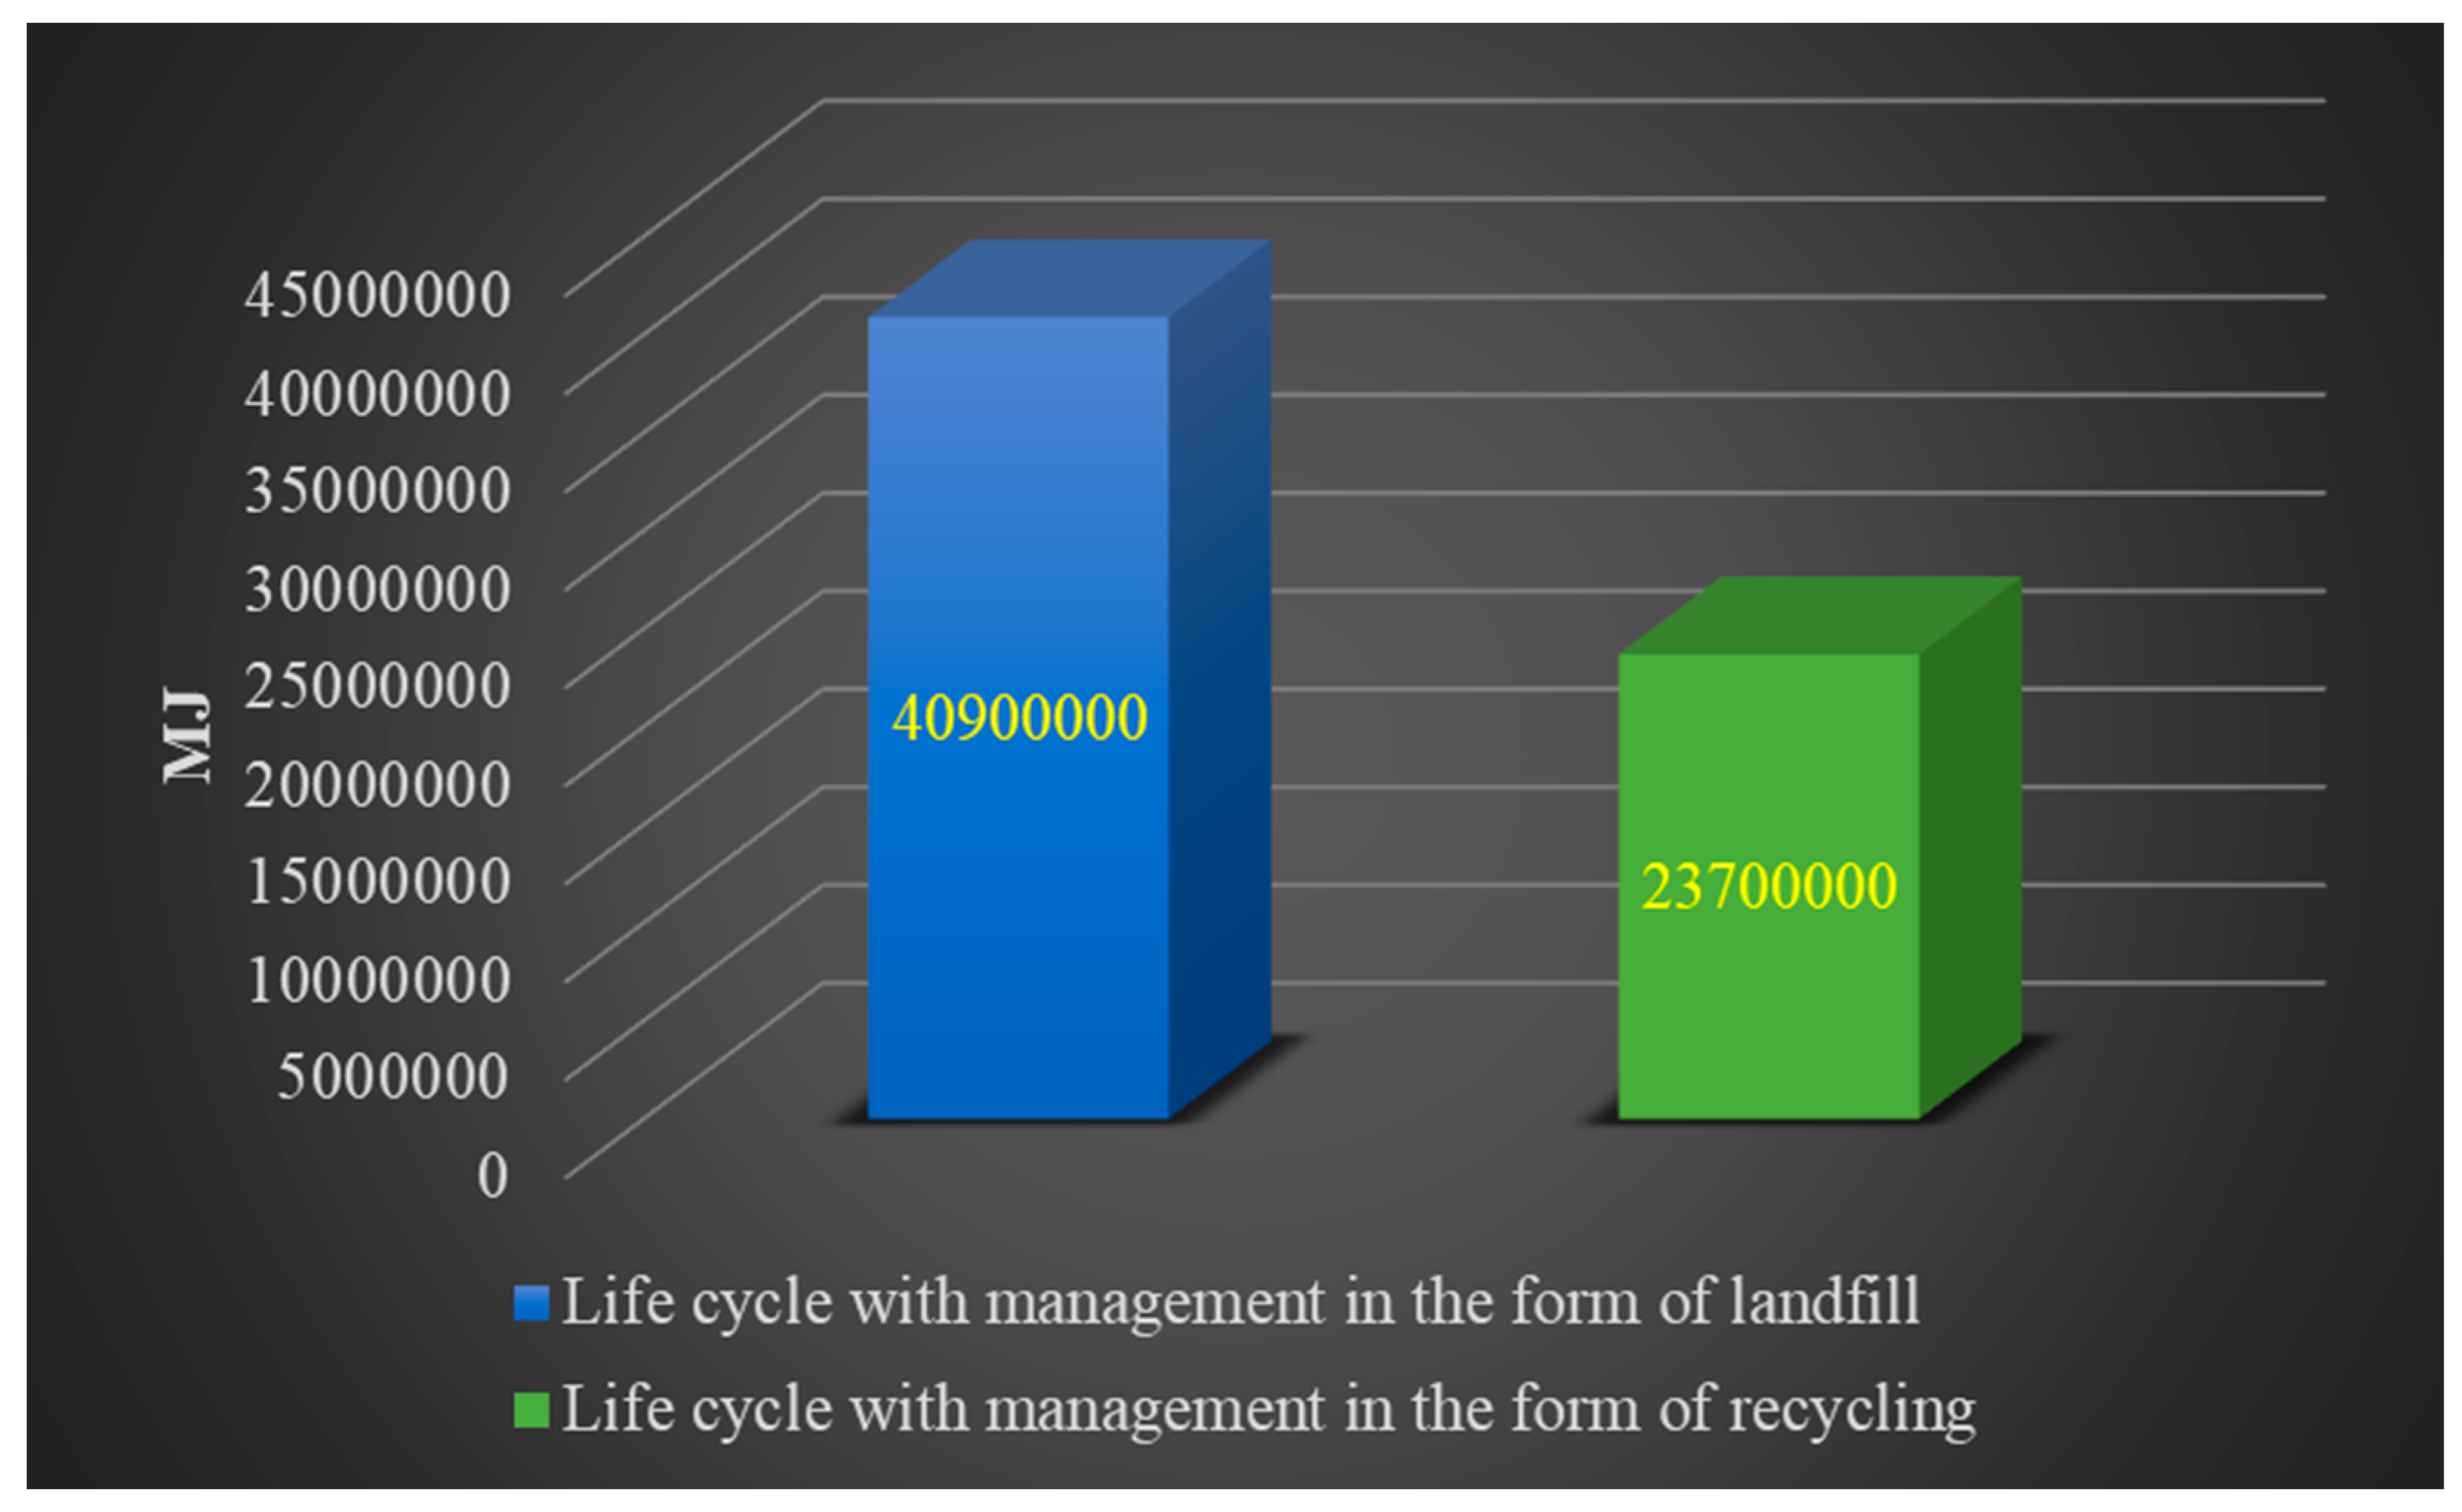
Figure 4.
Characterization of the overall energy demand during the course of the examined solar power plant’s life cycle (CED model), accounting for the way that materials, components, and polymers are managed after consumption (unit: MJ) (personal investigation).
Figure 4.
Characterization of the overall energy demand during the course of the examined solar power plant’s life cycle (CED model), accounting for the way that materials, components, and polymers are managed after consumption (unit: MJ) (personal investigation).
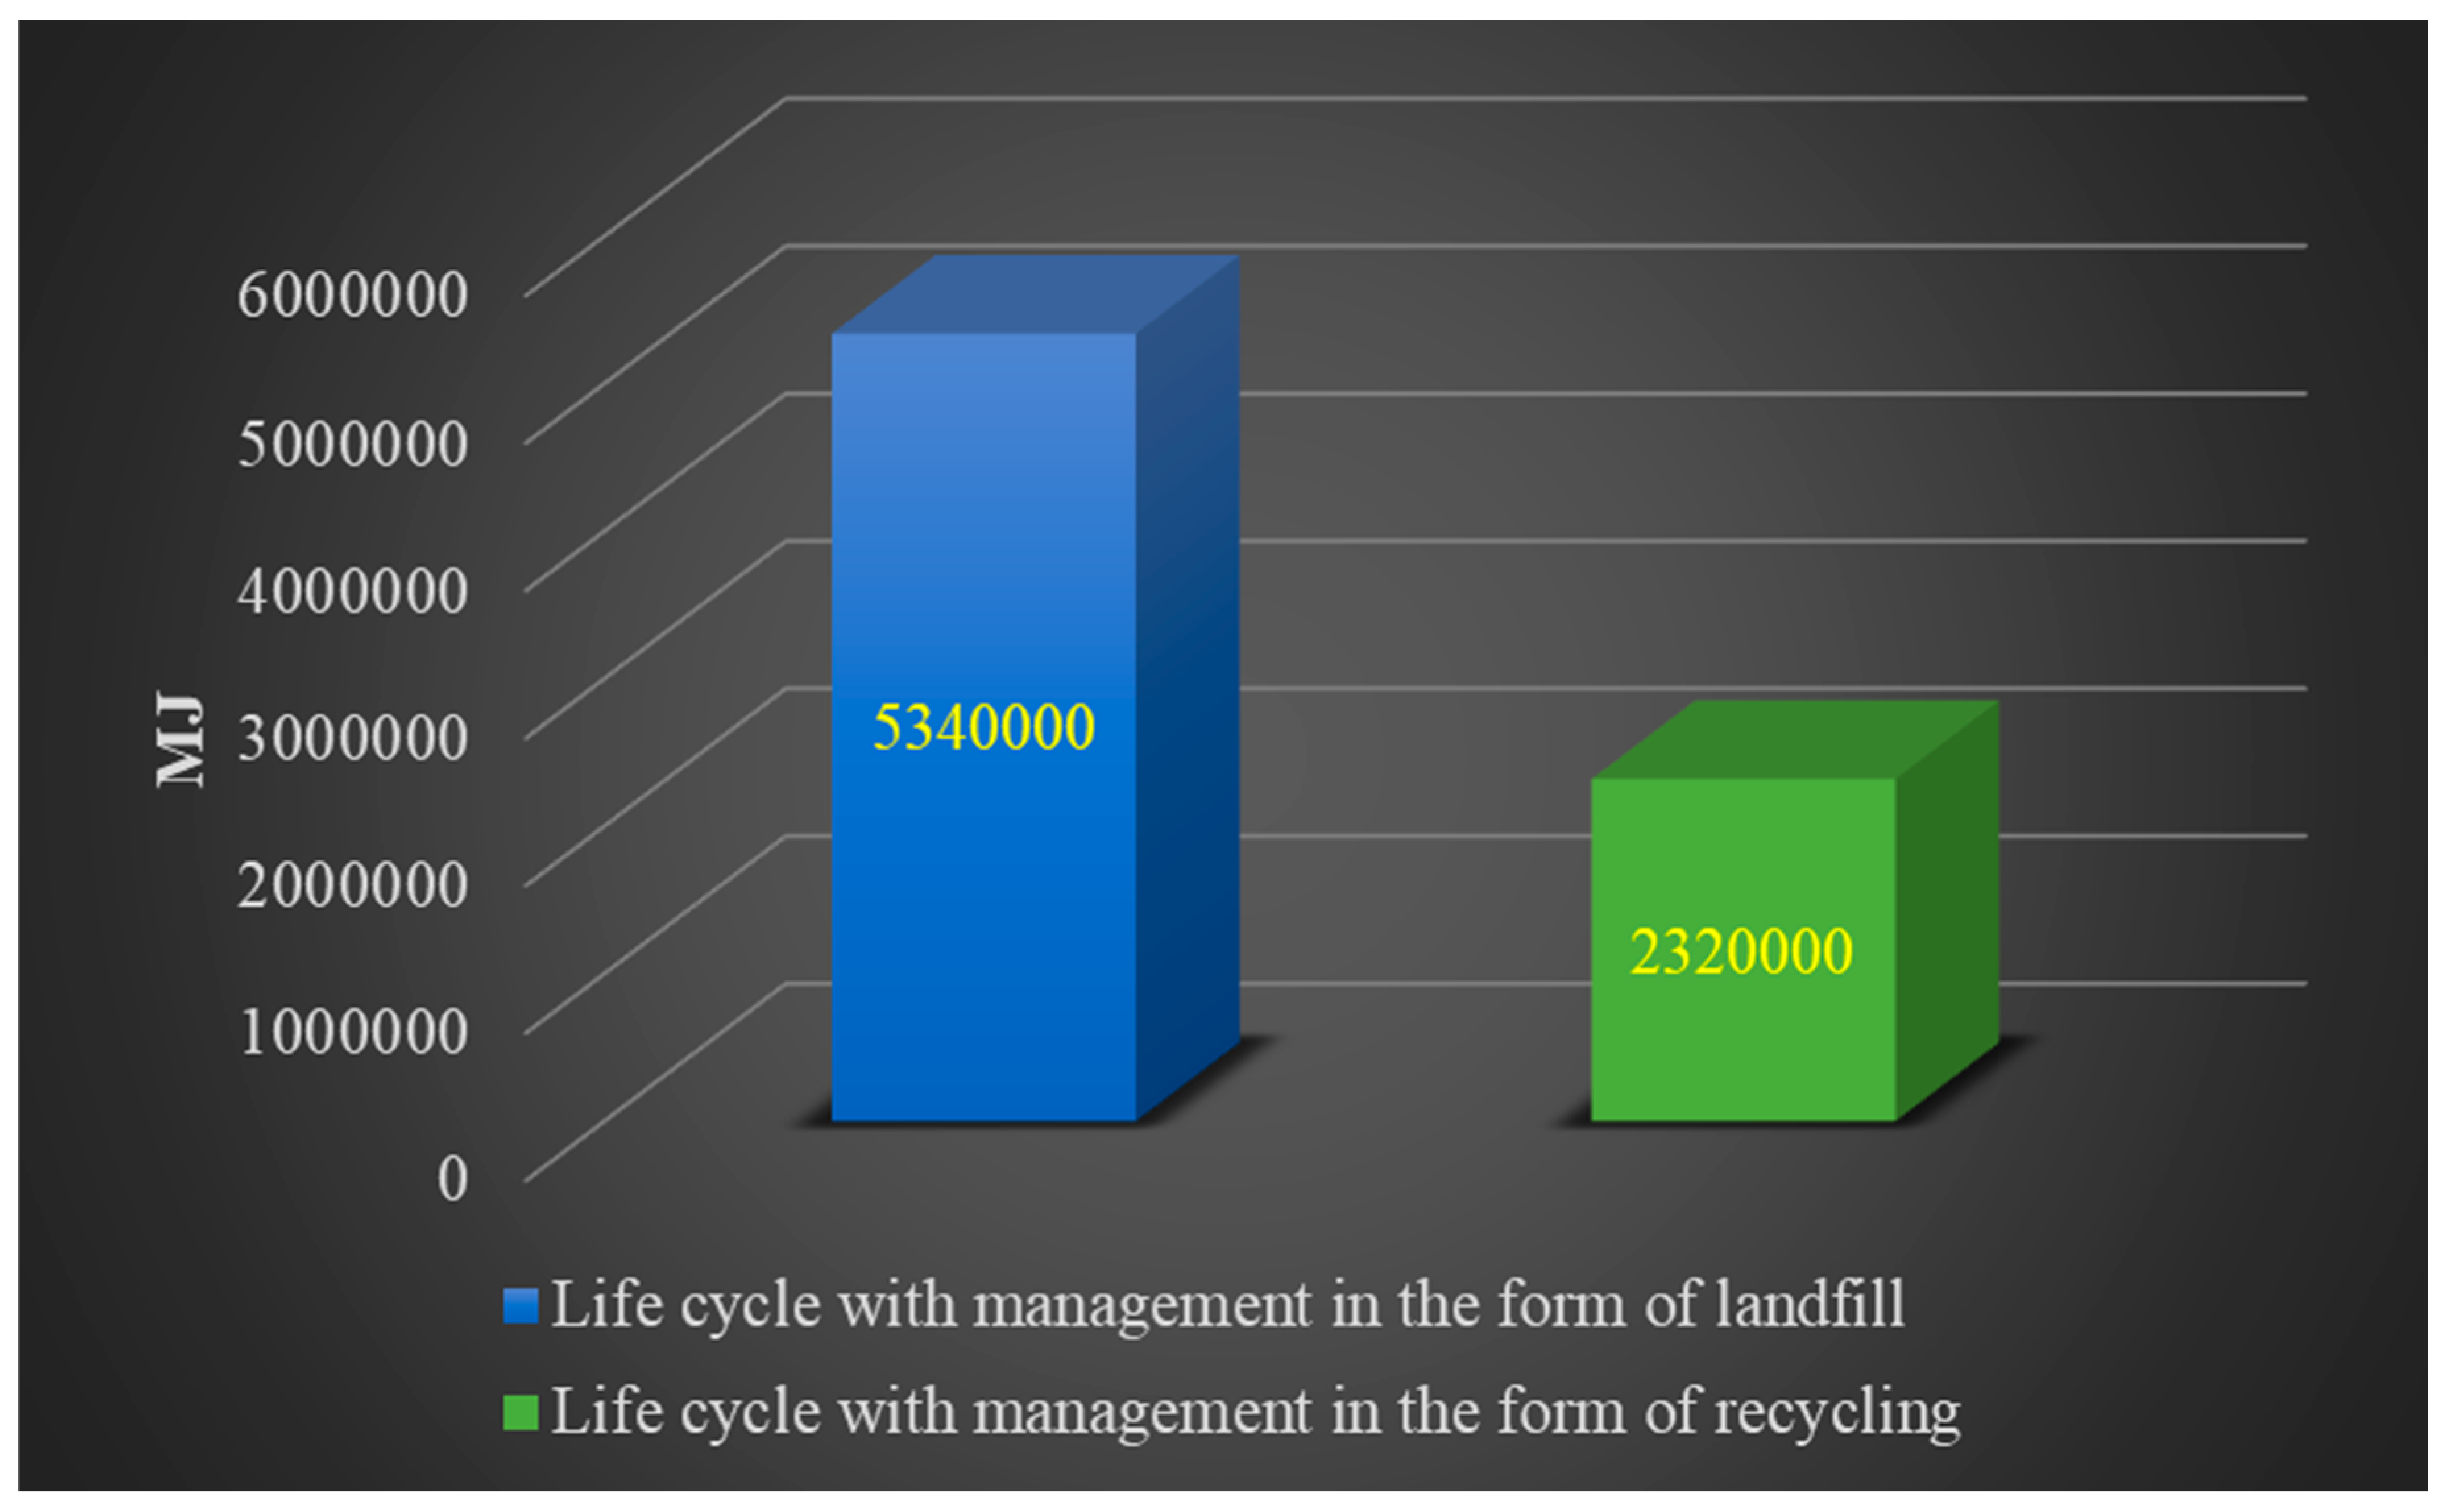
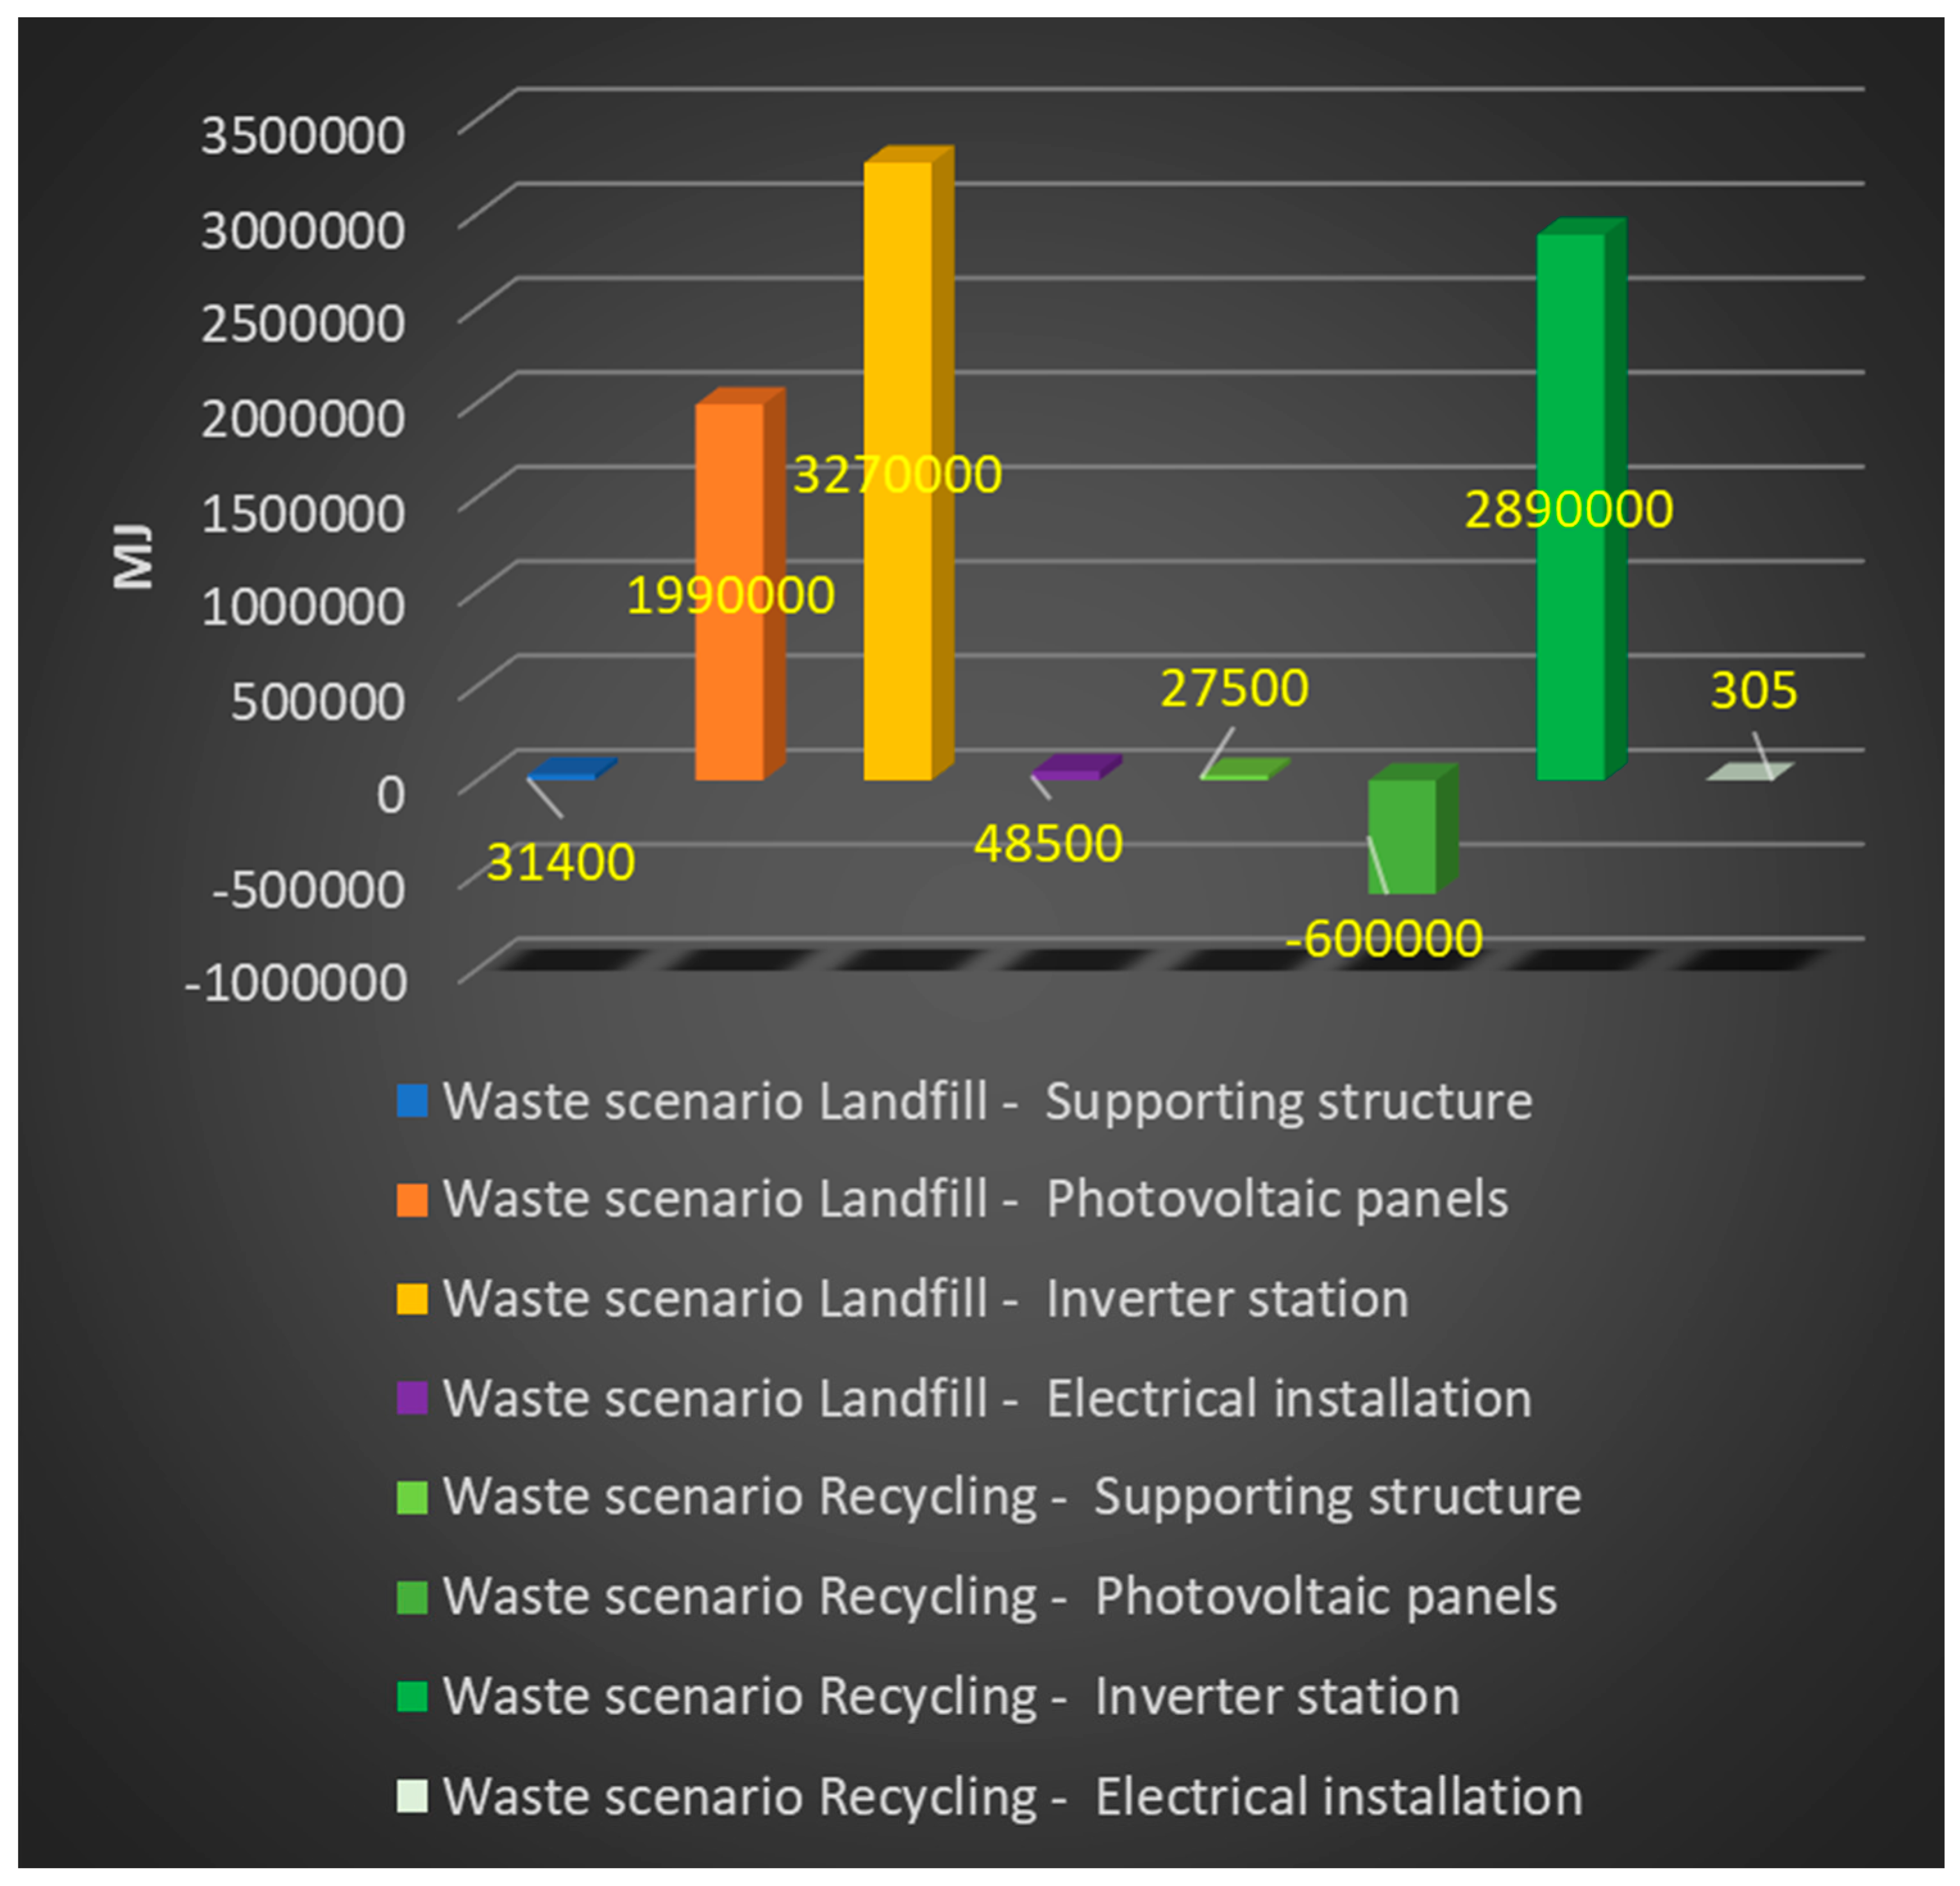
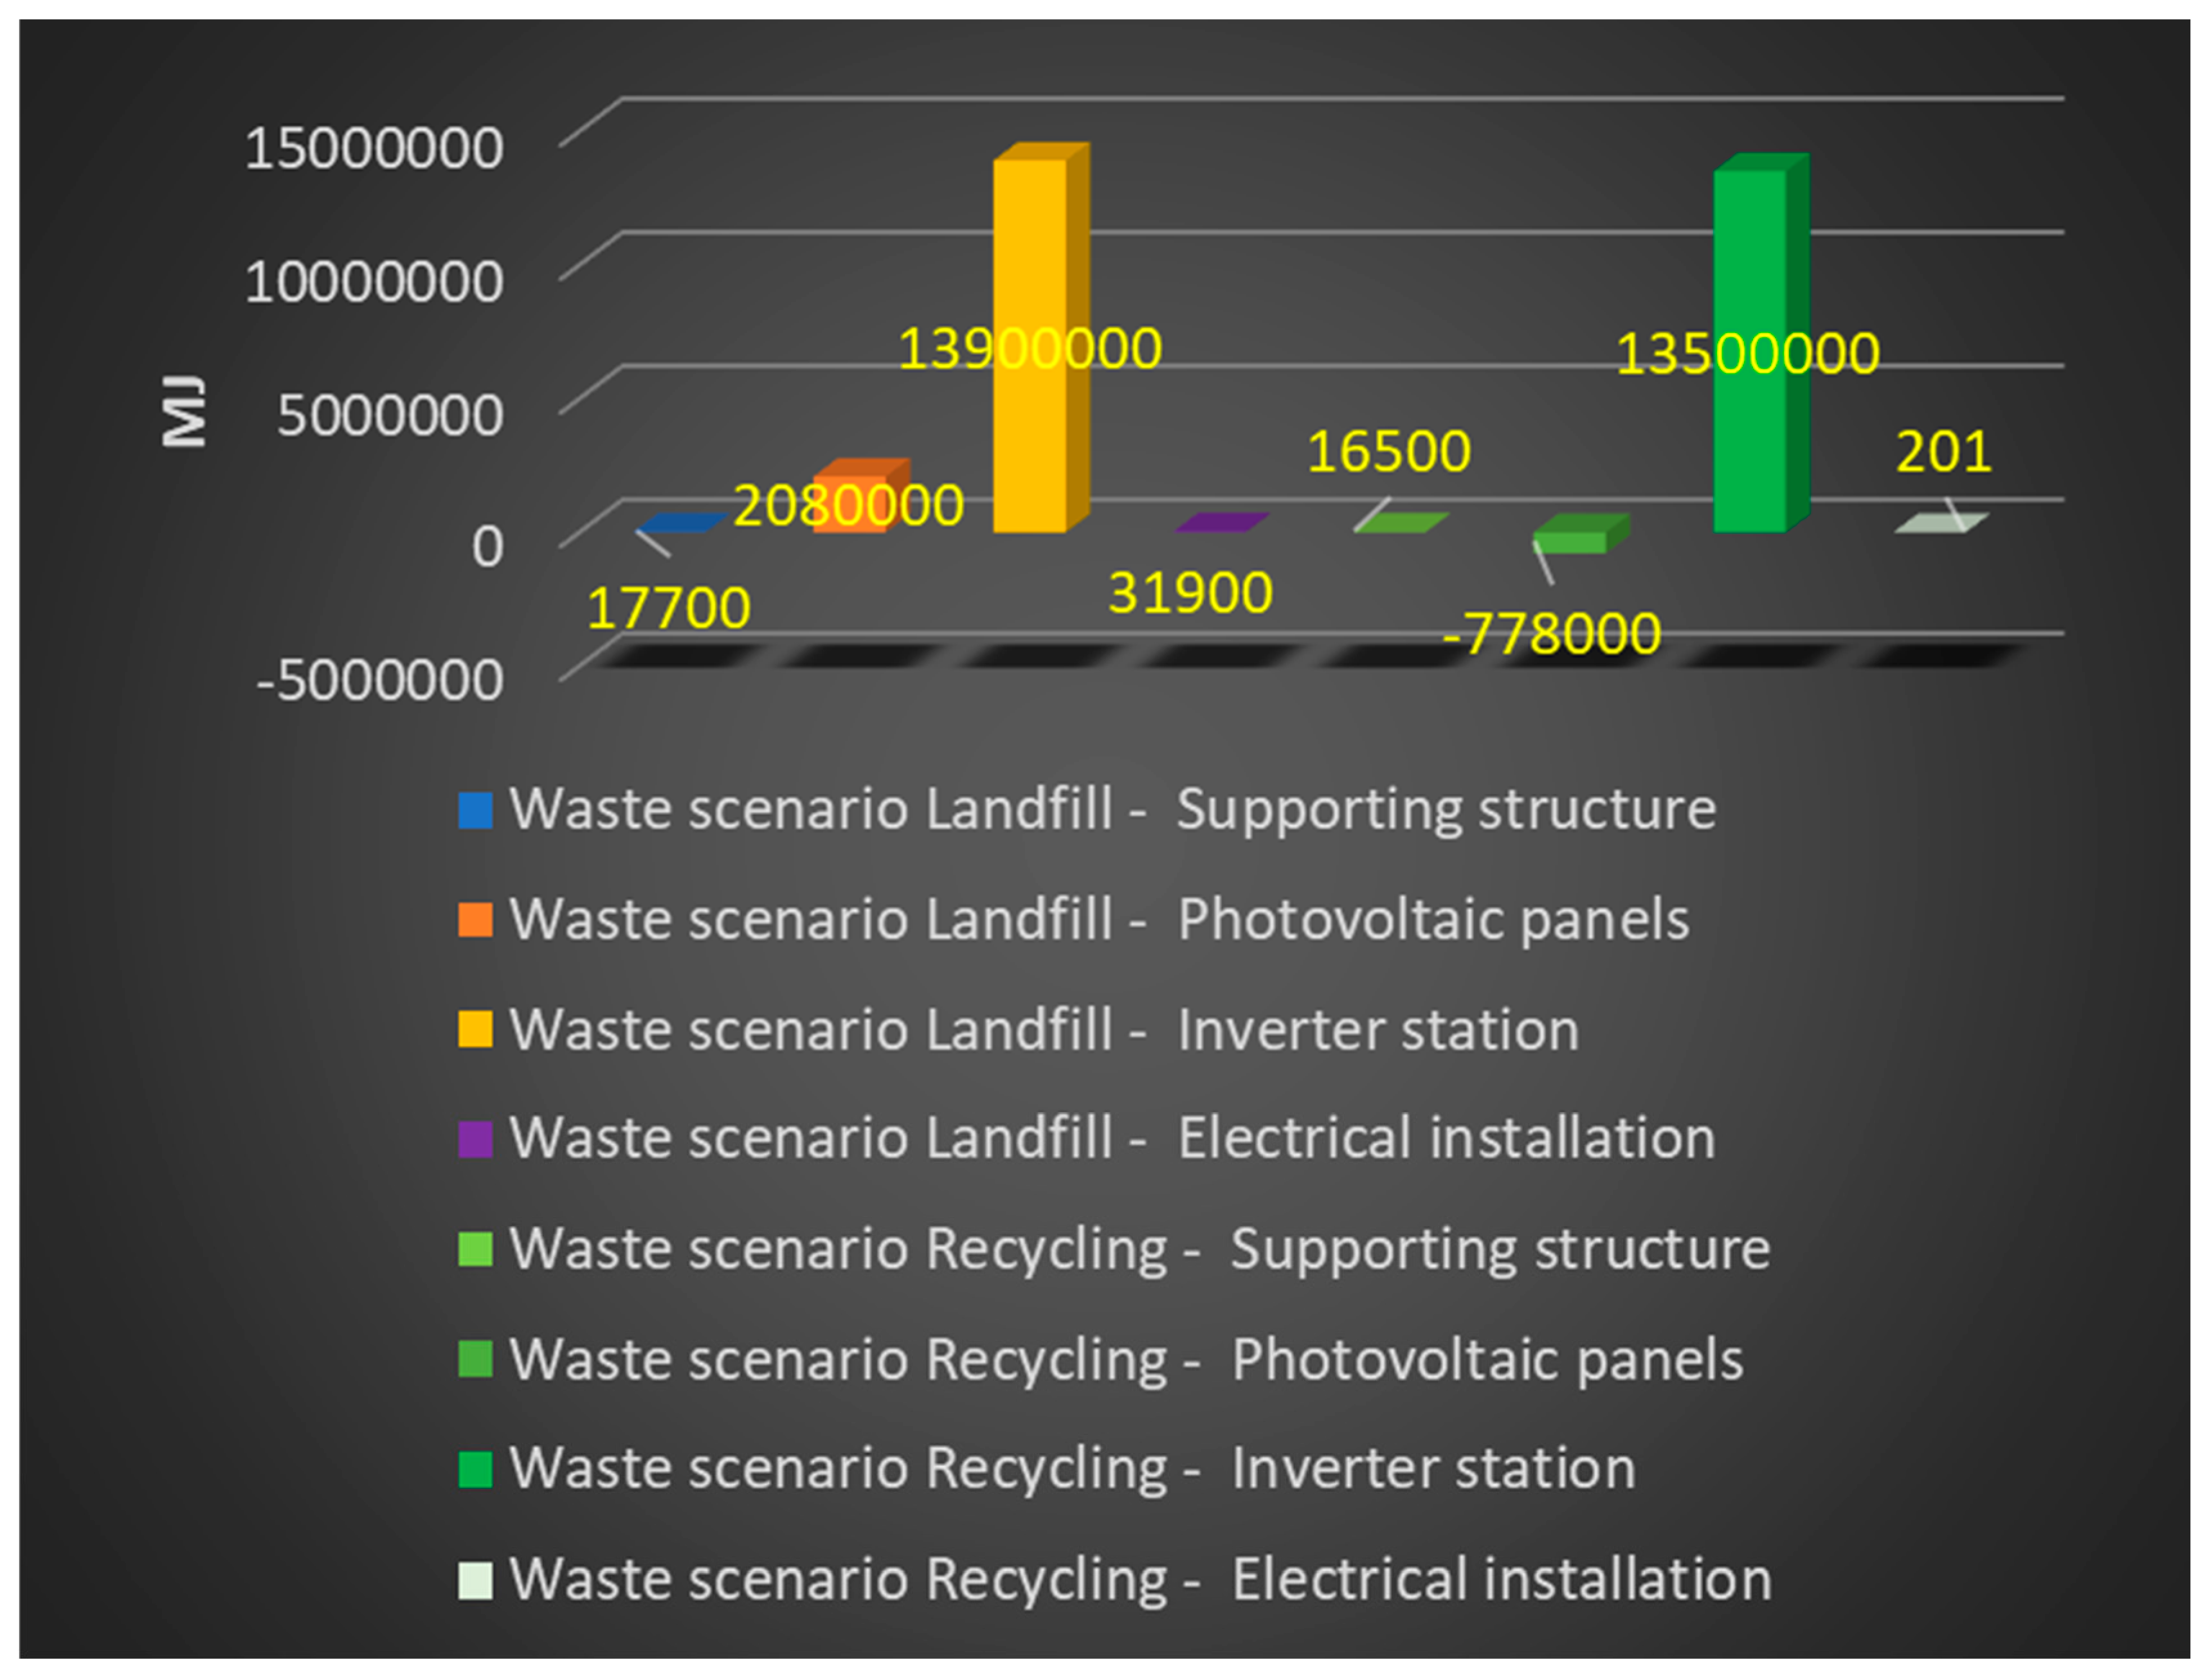
Figure 5.
Characterization of the overall energy consumption over the course of the life cycle of each unit in the examined solar power plant (CED model), accounting for the post-consumer materials and element management strategy (unit: MJ) (personal investigation).
Figure 5.
Characterization of the overall energy consumption over the course of the life cycle of each unit in the examined solar power plant (CED model), accounting for the post-consumer materials and element management strategy (unit: MJ) (personal investigation).
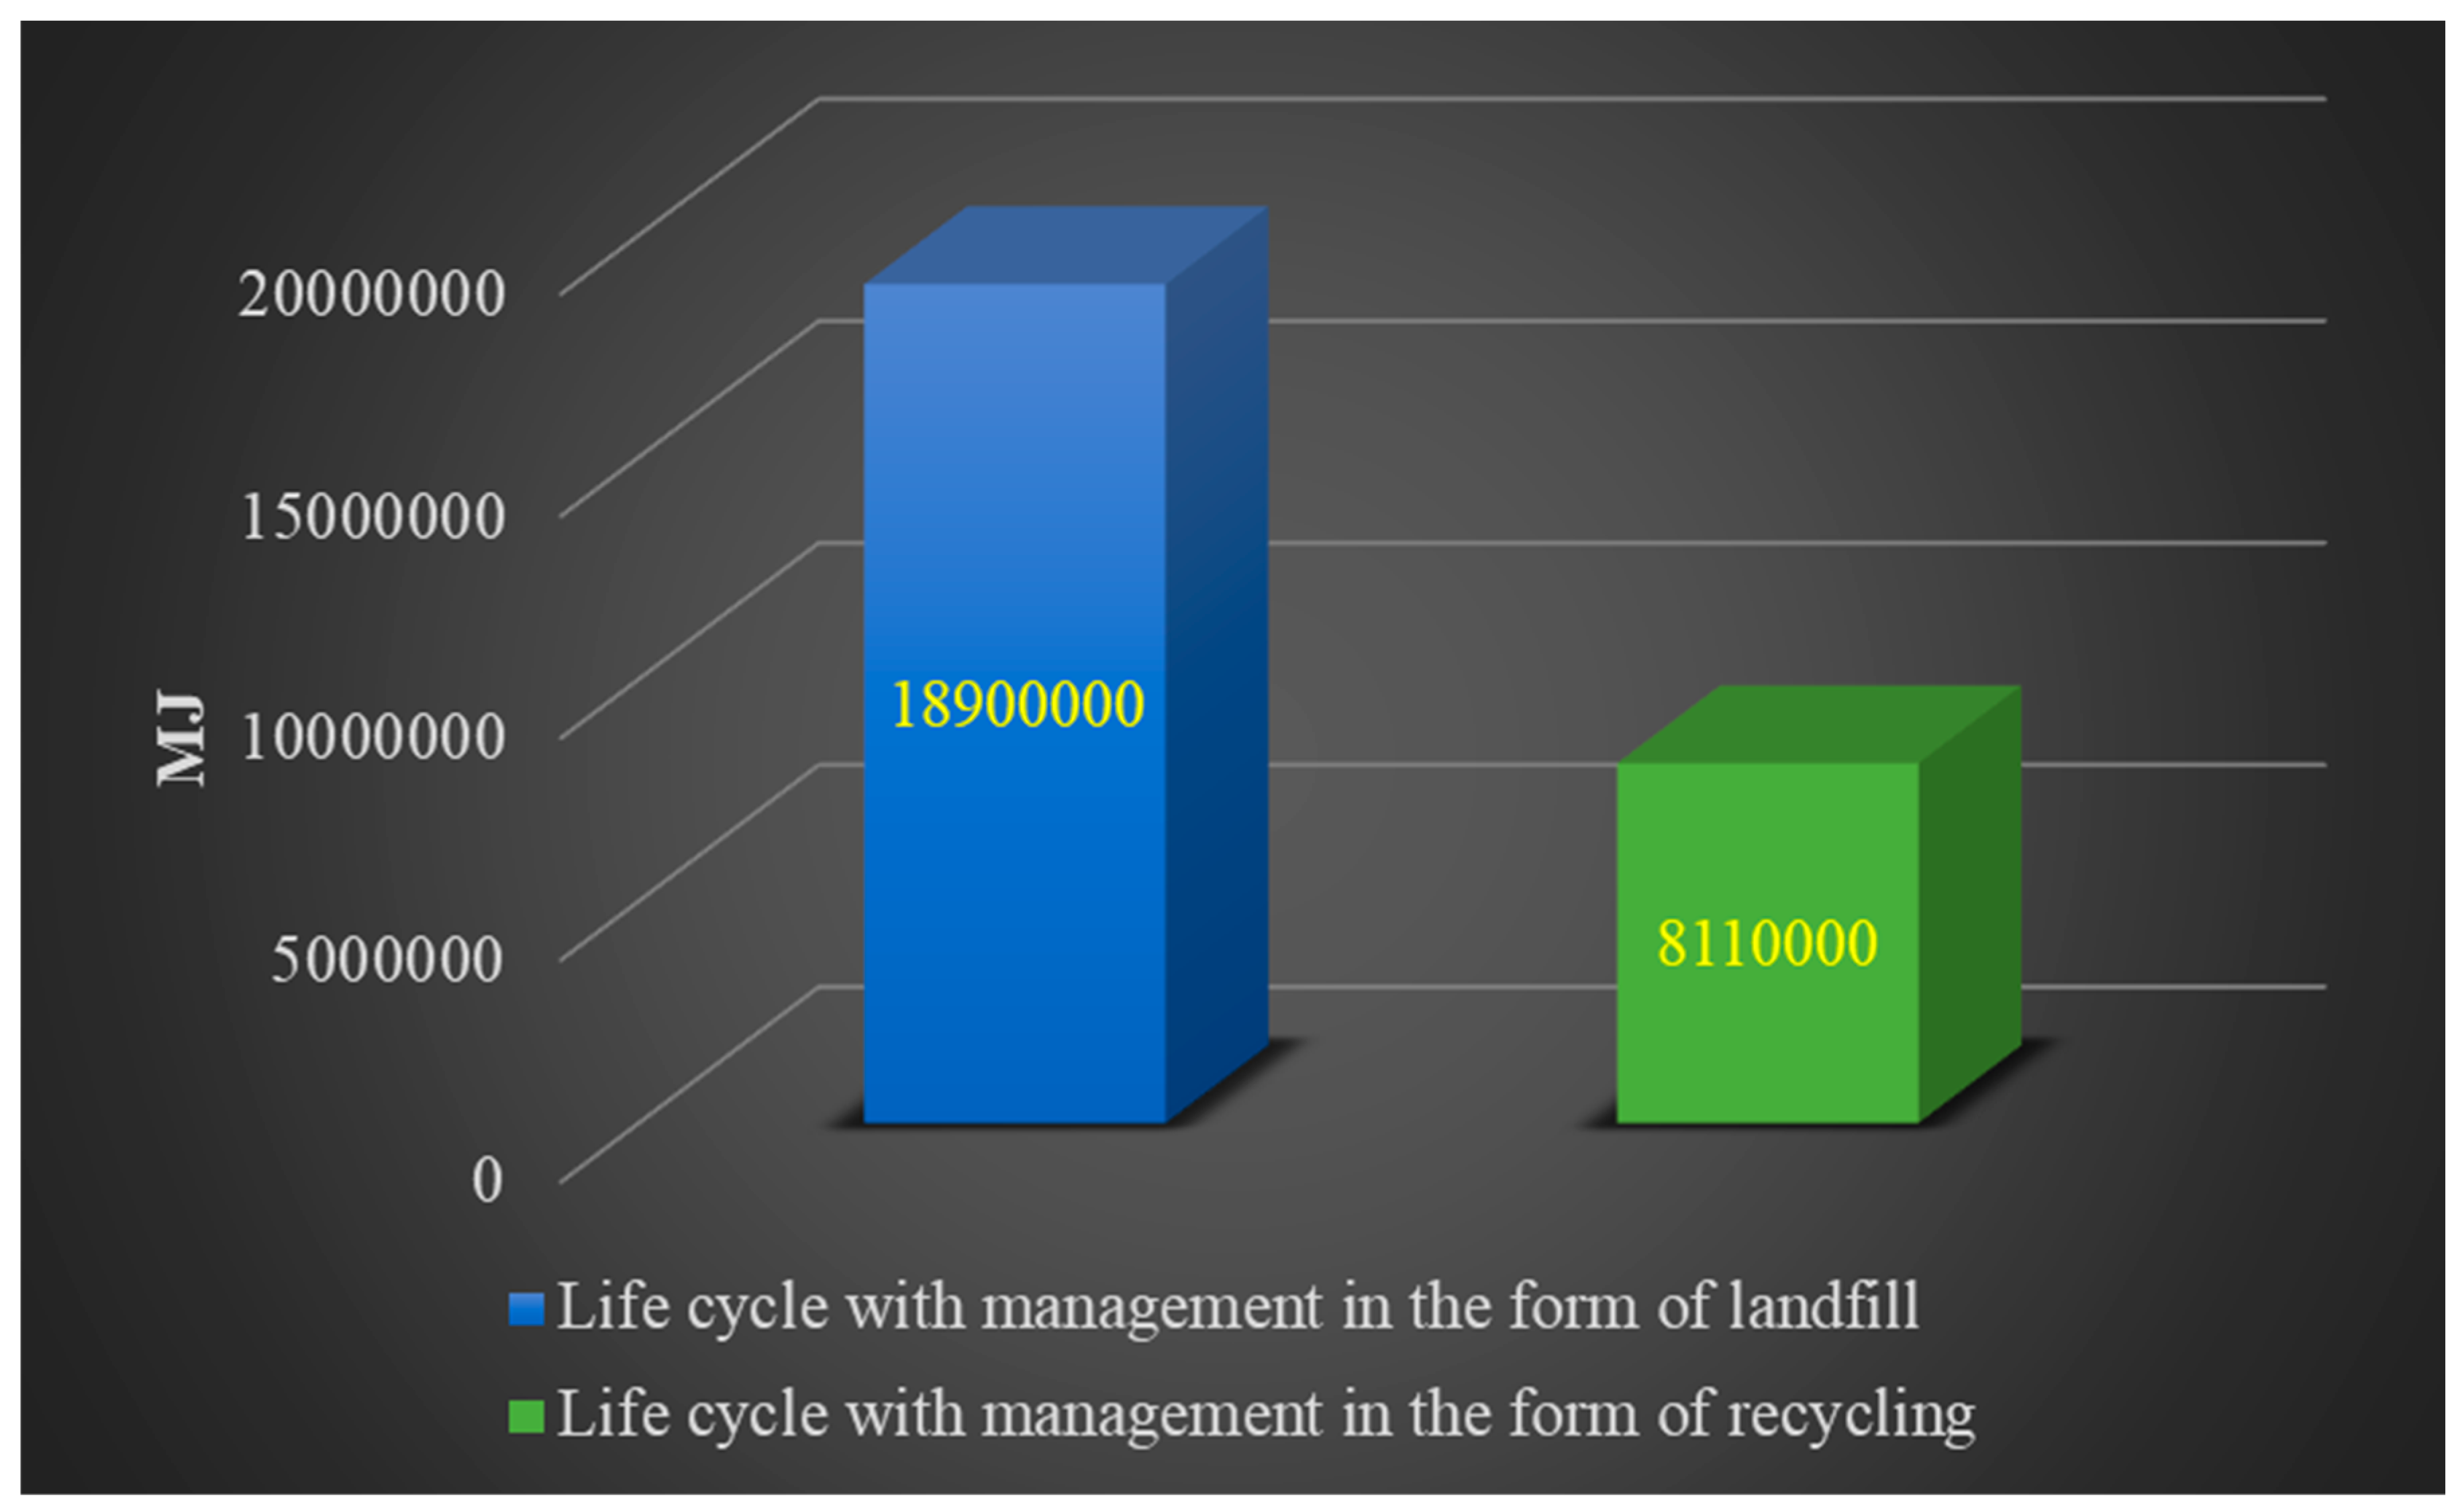
Figure 6.
Characterization of the overall energy demand in the domain of processes connected to the extraction of non-renewable fossil fuels (CED model) during the life cycle of the examined solar power plant, taking into consideration the technique of managing plastics, materials, and elements after consumption (unit: MJ) (personal investigation).
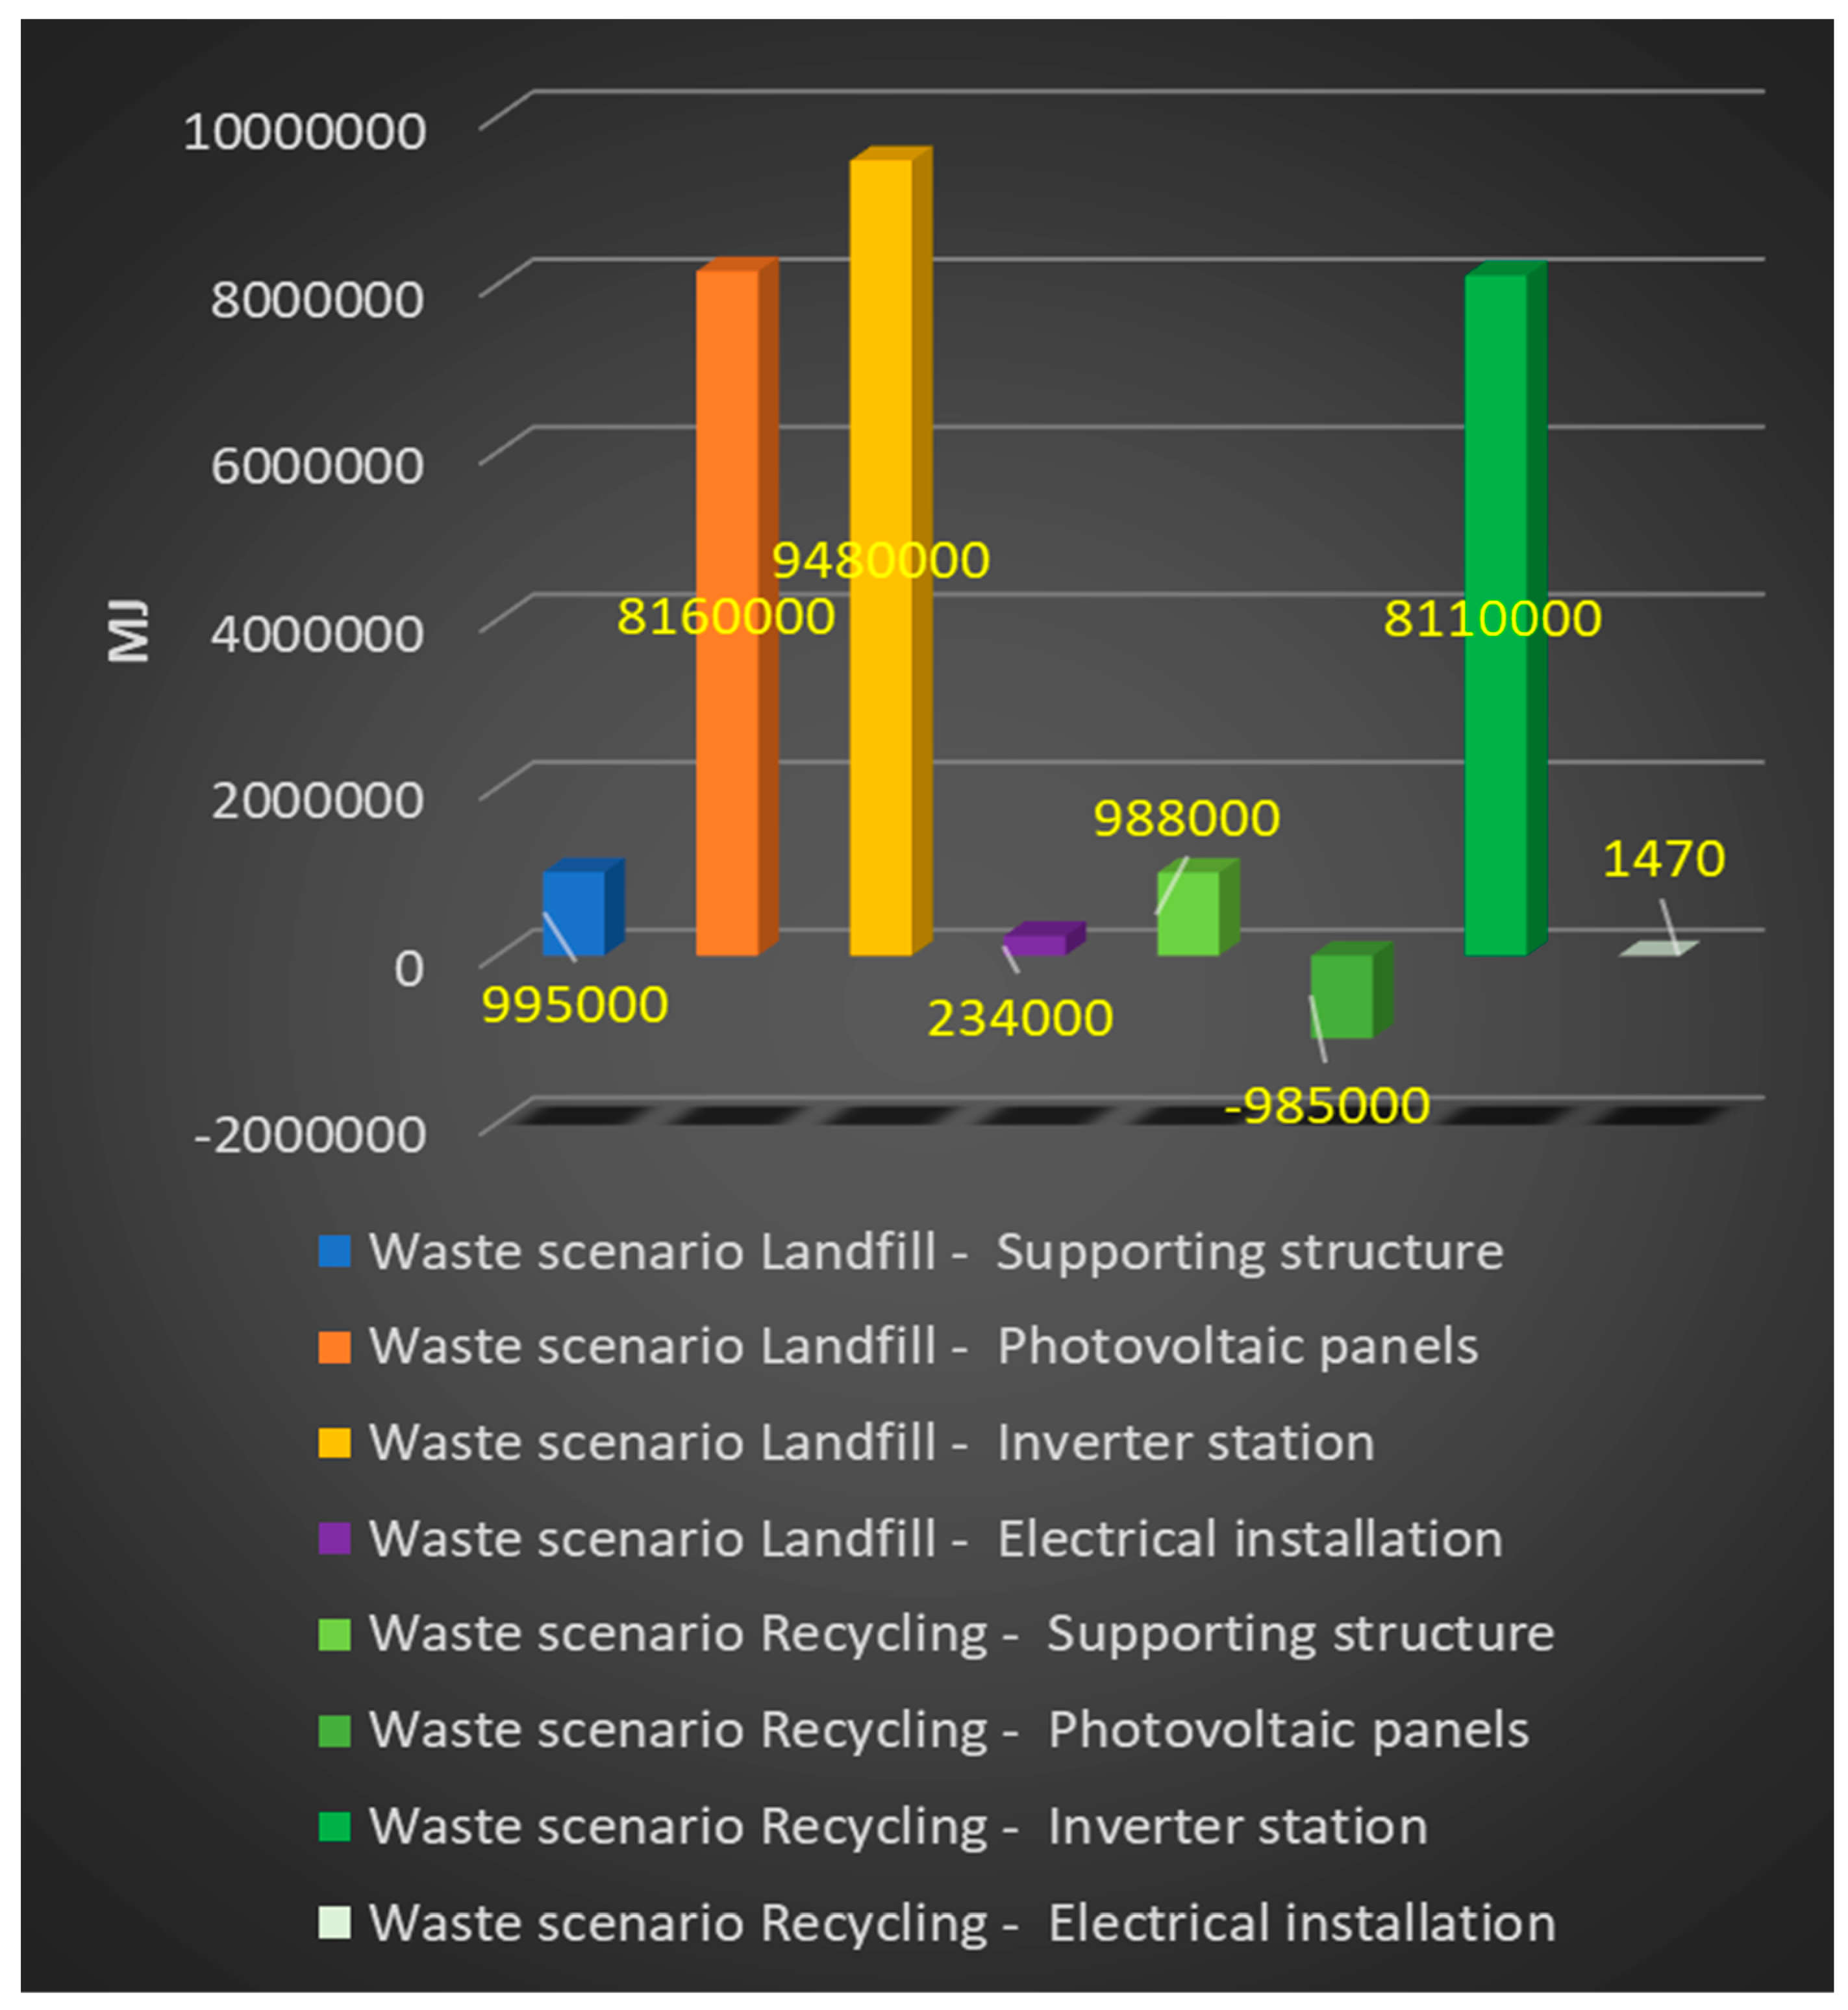
Figure 7.
Characterization of the total energy demand in the life cycle of each unit of the examined solar power plant with regard to the processes involved in the extraction of non-renewable fossil fuels (CED model), accounting for the way in which materials, plastics, and other elements are managed after consumption (MJ as the unit) (personal investigation).
Figure 8.
Characterization of the overall energy demand over the course of the examined photovoltaic power plant’s life cycle in the context of the processes involved in obtaining energy from renewable sources, such as hydropower plants (CED model), while accounting for the technique of managing plastics, materials, and elements after consumption (MJ as the unit) (personal investigation).
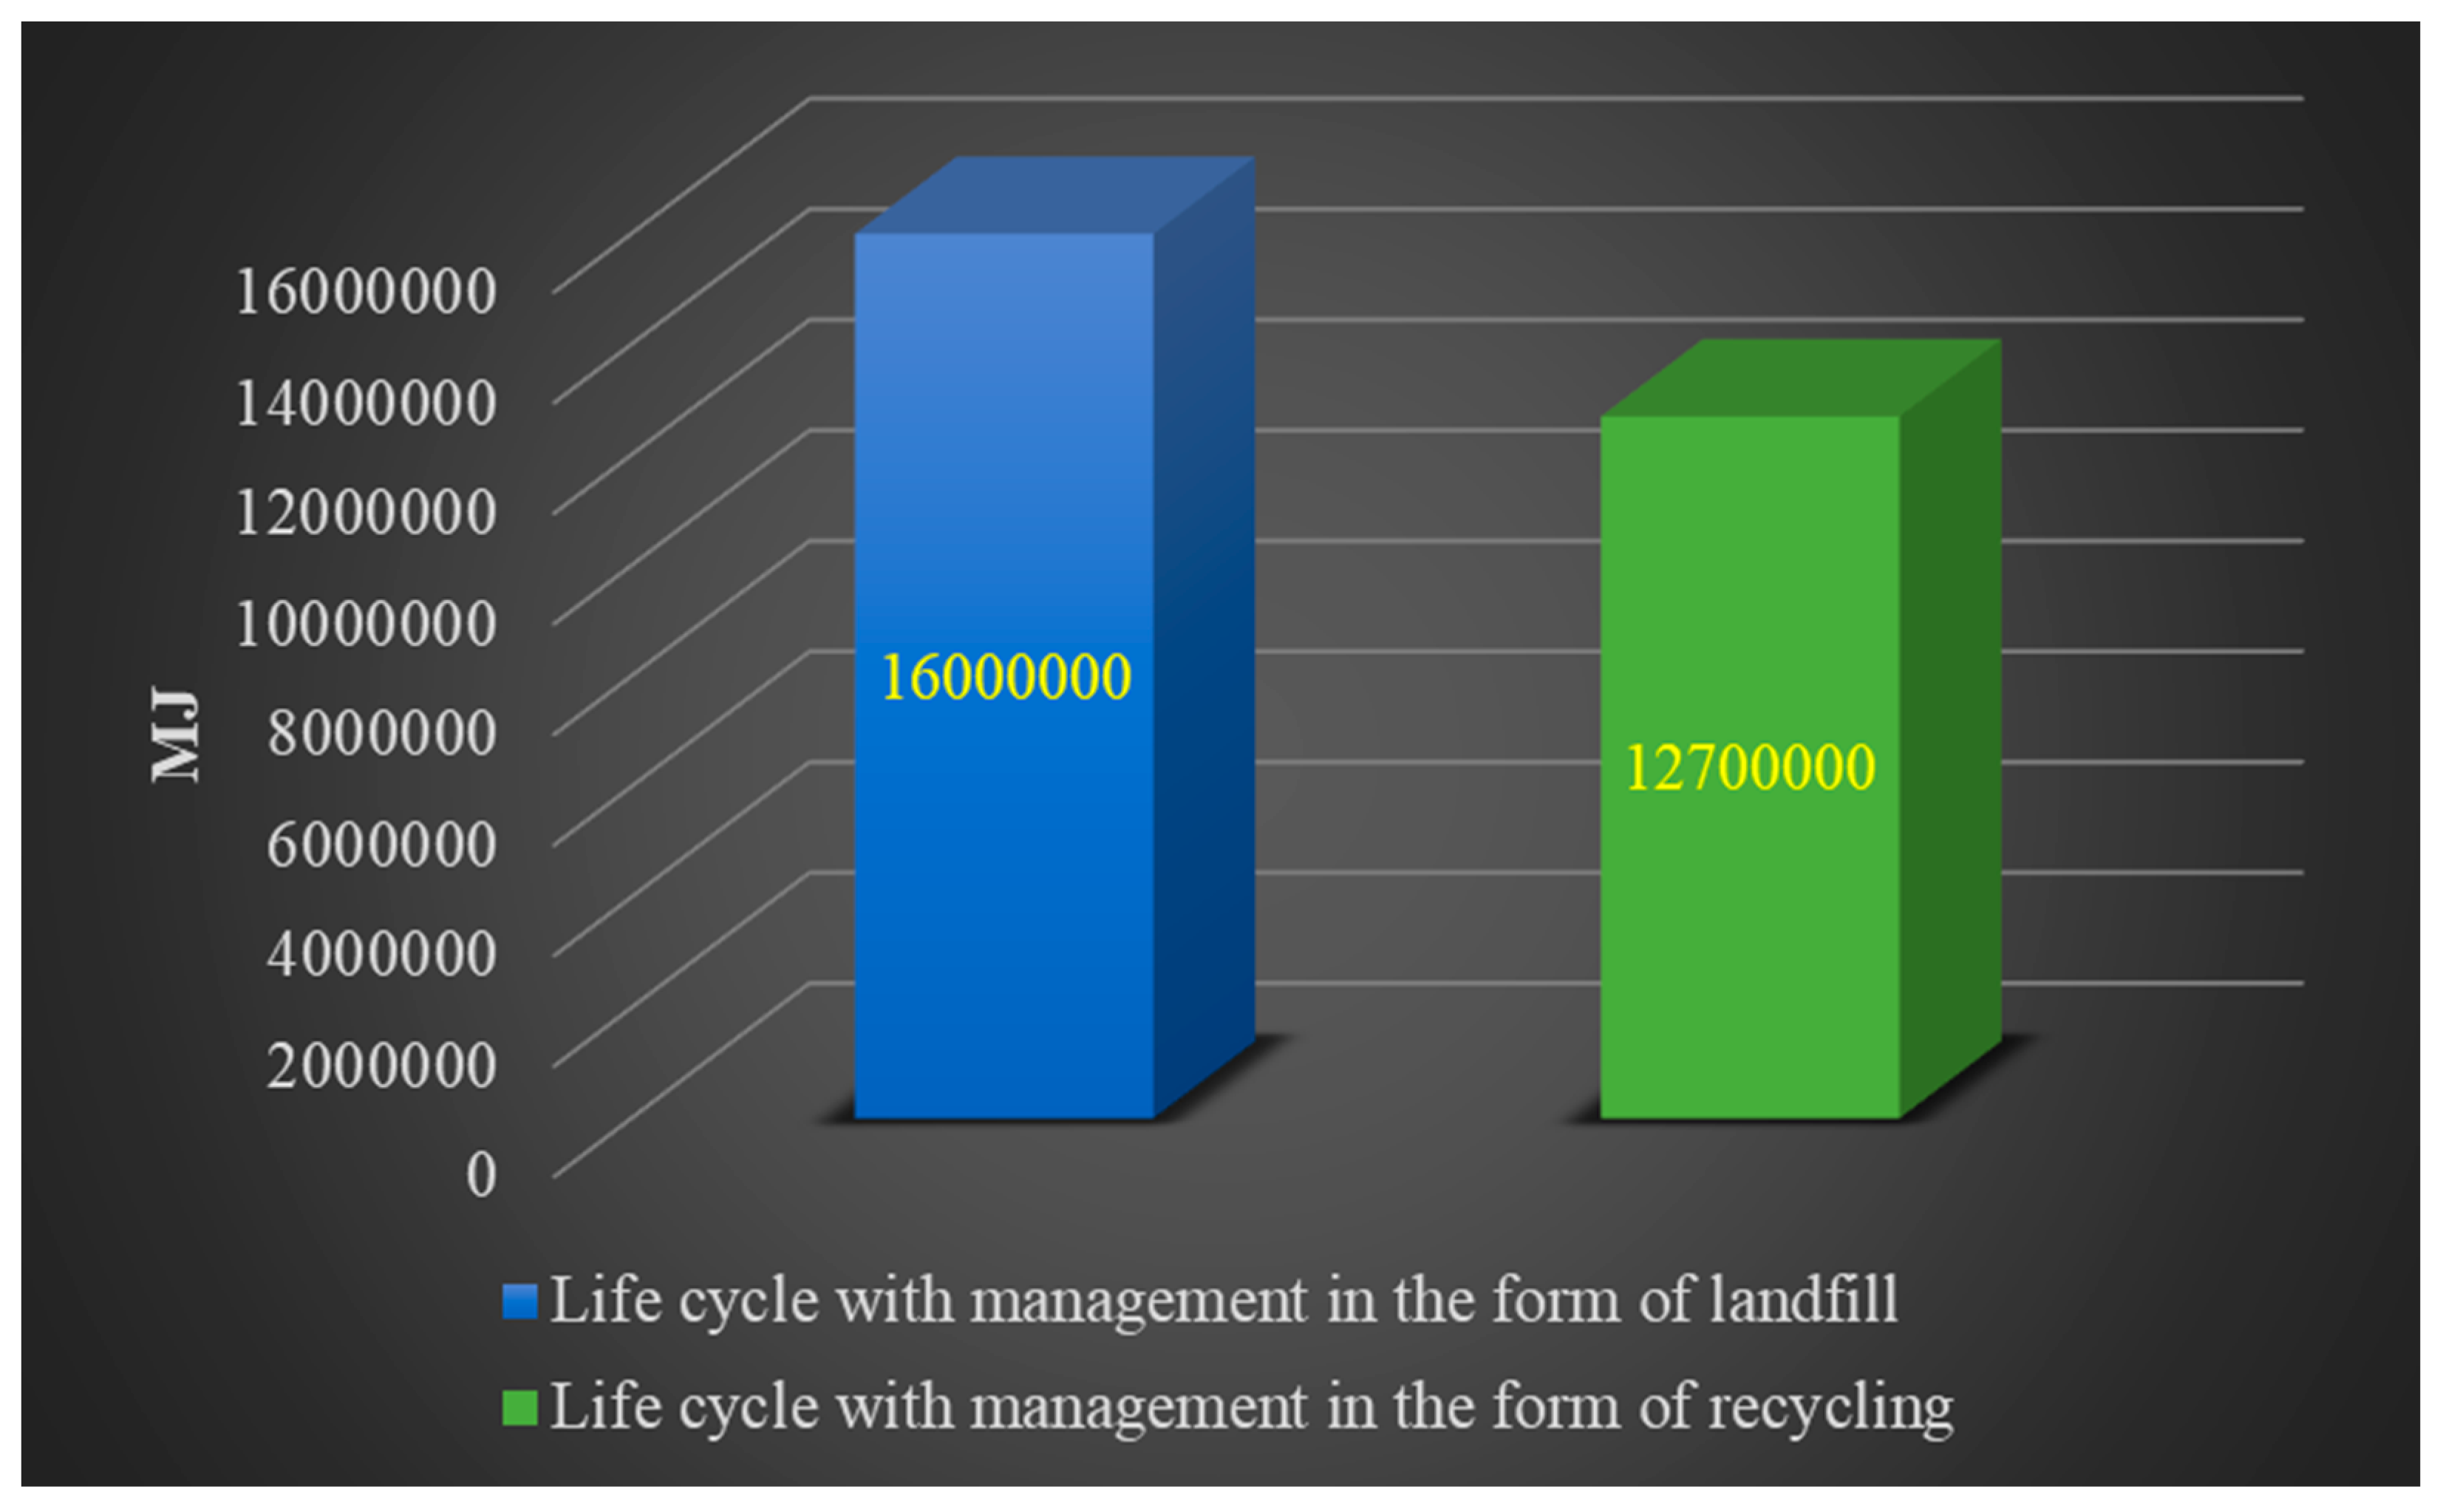
Figure 9.
In the area of processes related to obtaining energy from renewable sources—hydropower plants (CED model)—characterization of the total energy demand in the life cycle of individual units of the analyzed photovoltaic power plant, taking into account the method of post-consumer management of plastics, materials, and elements (unit: MJ) (personal investigation).
Figure 10.
Characterization of the overall energy demand over the course of the examined photovoltaic power plant’s life cycle in the context of nuclear energy-related operations (CED model), accounting for the strategy for managing polymers, materials, and components after consumption (unit: MJ) (personal investigation).
Figure 11.
Characterization of the total energy demand in the life cycle of each unit of the examined photovoltaic power plant with regard to nuclear energy-related processes (CED model), accounting for the way that materials, plastics, and other elements are managed after consumption (unit: MJ) (personal investigation).
Table 1.
Energy consumption by source, World [
3].
Table 1.
Energy consumption by source, World [
3].
| World | Years |
|---|
| Energy Consumption by Source [TWh] | 1965 | 2022 |
|---|
| Other renewables | 55.95 | 2413.81 |
| Biofuels | 9.03 | 1199.21 |
| Solar | 0.00 | 3448.24 |
| Wind | 0.00 | 5487.60 |
| Hydropower | 2729.89 | 11,299.82 |
| Nuclear | 72.47 | 6702.34 |
| Gas | 6303.83 | 39,413.04 |
| Coal | 16,140.18 | 44,854.04 |
| Oil | 17,996.53 | 52,969.59 |
Table 2.
Bill of materials for the solar power plant under analysis (investor data).
Table 2.
Bill of materials for the solar power plant under analysis (investor data).
| Bill of Materials |
|---|
| Material Name | Mass | Unit |
|---|
| Aluminum | 85,120 | kg |
| Steel | 82,000 | kg |
| Solar glass | 79,230 | kg |
| Copper | 5000 | kg |
| Others | 9264 | kg |
Table 3.
List of the solar power plant components that have been examined (investor data).
Table 3.
List of the solar power plant components that have been examined (investor data).
| List of Elements |
|---|
| Name of the Element | Mass | Unit |
|---|
| Photovoltaic modules | 161,100 | kg |
| Supporting structure | 53,320 | kg |
| Inverter station | 40,000 | kg |
| Electrical installation | 6194 | kg |
Table 4.
Characterization of energy consumption during the course of the examined solar power plant’s life cycle (CED model), accounting for the post-consumer management strategy for materials, plastics, and other elements (unit: MJ) (personal investigation).
Table 4.
Characterization of energy consumption during the course of the examined solar power plant’s life cycle (CED model), accounting for the post-consumer management strategy for materials, plastics, and other elements (unit: MJ) (personal investigation).
| No | Element of a Technical Object | Photovoltaic Power Plant |
|---|
| Waste Scenario | Landfilling | Recycling |
|---|
| Impact Category | | |
|---|
| 1 | Nonrenewable, fossil | 1.89 × 10⁷ | 8.11 × 10⁶ |
| 2 | Nonrenewable, nuclear | 5.34 × 10⁶ | 2.32 × 10⁶ |
| 3 | Nonrenewable, biomass | 1.31 × 10³ | 1.30 × 10³ |
| 4 | Renewable, biomass | 2.49 × 10⁵ | 1.99 × 10⁵ |
| 5 | Renewable, wind, solar, geothermal | 3.74 × 10⁵ | 3.60 × 10⁵ |
| 6 | Renewable, water | 1.60 × 10⁷ | 1.27 × 10⁷ |
| TOTAL | 4.09 × 10⁷ | 2.37 × 10⁷ |
Table 5.
Characterization of energy consumption throughout the life cycle of each unit in the examined photovoltaic power plant (CED model), accounting for the post-consumer materials and element management system (landfill) (unit: MJ) (personal investigation).
Table 5.
Characterization of energy consumption throughout the life cycle of each unit in the examined photovoltaic power plant (CED model), accounting for the post-consumer materials and element management system (landfill) (unit: MJ) (personal investigation).
| No | Waste Scenario | Landfilling |
|---|
| Element of a Technical Object | Supporting Structure | Photovoltaic Panels | Inverter Station | Electrical Installation |
|---|
| Impact Category |
|---|
| 1 | Nonrenewable, fossil | 9.95 × 10⁵ | 8.16 × 10⁶ | 9.48·× 106 | 2.34 × 10⁵ |
| 2 | Nonrenewable, nuclear | 3.14 × 10⁴ | 1.99 × 10⁶ | 3.27 × 10⁶ | 4.85 × 10⁴ |
| 3 | Nonrenewable, biomass | 2.18 × 10² | 3.21 × 10² | 7.63 × 10² | 1.01 × 101 |
| 4 | Renewable, biomass | 1.05 × 10⁴ | 7.70 × 10⁴ | 1.54 × 10⁵ | 7.57 × 10³ |
| 5 | Renewable, wind, solar, geothermal | 3.97 × 10³ | 2.80 × 10⁴ | 3.40 × 10⁵ | 2.51 × 10³ |
| 6 | Renewable, water | 1.77 × 10⁴ | 2.08 × 10⁶ | 1.39 × 10⁷ | 3.19 × 10⁴ |
| TOTAL | 1.06 × 10⁶ | 1.23 × 10⁷ | 2.71 × 10⁷ | 3.24 × 10⁵ |
Table 6.
Characterization of energy consumption throughout the life cycle of each unit in the examined photovoltaic power plant (CED model), accounting for the post-consumer materials and element management system (recycling) (unit: MJ) (personal investigation).
Table 6.
Characterization of energy consumption throughout the life cycle of each unit in the examined photovoltaic power plant (CED model), accounting for the post-consumer materials and element management system (recycling) (unit: MJ) (personal investigation).
| No | Waste Scenario | Recycling |
|---|
| Element of a Technical Object | Supporting Structure | Photovoltaic Panels | Inverter Station | Electrical Installation |
|---|
| Impact Category |
|---|
| 1 | Nonrenewable, fossil | 9.88 × 10⁵ | −9.85 × 10⁵ | 8.11 × 10⁶ | 1.47 × 10³ |
| 2 | Nonrenewable, nuclear | 2.75 × 10⁴ | −6.00 × 10⁵ | 2.89 × 10⁶ | 3.05 × 10² |
| 3 | Nonrenewable, biomass | 2.18 × 10² | 3.21 × 10⁻¹² | 7.63 × 10² | 6.35 × 10⁻² |
| 4 | Renewable, biomass | 1.05 × 10⁴ | 4.01 × 10⁴ | 1.48 × 10⁵ | 4.76 × 101 |
| 5 | Renewable, wind, solar, geothermal | 3.94 × 10³ | 1.75 × 10⁴ | 3.39 × 10⁵ | 1.58 × 101 |
| 6 | Renewable, water | 1.65 × 10⁴ | −7.78 × 10⁵ | 1.35 × 10⁷ | 2.01 × 10² |
| TOTAL | 1.05 × 10⁶ | −2.31 × 10⁶ | 2.50 × 10⁷ | 2.04 × 10³ |
Table 7.
Characterization of energy demand throughout the life cycle of the examined solar power plant with regard to the processes involved in the extraction of non-renewable fossil fuels (CED model), accounting for the technique of managing polymers, materials, and components after consumption (MJ as the unit) (personal investigation).
| No | Element of a Technical Object | Photovoltaic Power Plant | Emission Area |
|---|
| Waste Scenario | Landfilling | Recycling |
|---|
| Substance | | |
|---|
| 1 | Coal, brown | 1.20 × 10⁶ | 9.28 × 10⁴ | Raw Materials |
| 2 | Coal, hard | 5.05 × 10⁶ | 1.64 × 10⁶ | Raw Materials |
| 3 | Gas, mine, off-gas, process, coal mining/m3 | 9.29 × 10⁴ | 2.28 × 10⁴ | Raw Materials |
| 4 | Gas, natural/m3 | 5.91 × 10⁶ | 4.49 × 10⁶ | Raw Materials |
| 5 | Oil, crude | 6.63 × 10⁶ | 1.85 × 10⁶ | Raw Materials |
| 6 | Peat | 9.53 × 10³ | 1.01 × 10⁴ | Raw Materials |
| 7 | Remaining substances | 5.97 × 10² | 3.85 × 101 | x |
| TOTAL | 1.89 × 10⁷ | 8.11 × 10⁶ | |
Table 8.
Characterization of energy demand throughout the life cycle of each unit in the examined photovoltaic power plant, with special attention to the processes involved in the extraction of non-renewable fossil fuels (CED model). This is performed while accounting for the post-consumer management strategy used for plastics, materials, and elements (landfill) (unit: MJ) (personal investigation).
| No | Waste Scenario | Landfill | Emission Area |
|---|
| Element of a Technical Object | Supporting Structure | Photovoltaic Panels | Inverter Station | Electrical Installation |
|---|
| Substance |
|---|
| 1 | Coal, brown | 1.40 × 10⁴ | 7.23 × 10⁵ | 4.44 × 10⁵ | 1.59 × 10⁴ | Raw Materials |
| 2 | Coal, hard | 7.23 × 10⁵ | 2.33 × 10⁶ | 1.93 × 10⁶ | 6.41 × 10⁴ | Raw Materials |
| 3 | Gas, mine, off-gas, process, coal mining/m3 | 1.30 × 10⁴ | 4.67 × 10⁴ | 3.21 × 10⁴ | 1.12 × 10³ | Raw Materials |
| 4 | Gas, natural/m3 | 6.97 × 10⁴ | 1.60 × 10⁶ | 4.16 × 10⁶ | 7.73 × 10⁴ | Raw Materials |
| 5 | Oil, crude | 1.75 × 10⁵ | 3.47 × 10⁶ | 2.91 × 10⁶ | 7.56 × 10⁴ | Raw Materials |
| 6 | Peat | x | x | 9.50 × 10³ | 2.59 × 101 | Raw Materials |
| 7 | Remaining substances | 3.85 × 101 | 5.58 × 10² | x | 2.91 × 10⁻¹¹ | x |
| TOTAL | 9.95 × 10⁵ | 8.16 × 10⁶ | 9.48 × 10⁶ | 2.34 × 10⁵ | |
Table 9.
Energy demand characterization throughout the life cycle of each unit in the examined photovoltaic power plant, with special attention to the processes involved in the extraction of non-renewable fossil fuels (CED model). This is conducted while accounting for the post-consumer management strategy used for plastics, materials, and elements (recycling) (unit: MJ) (personal investigation).
| No | Waste Scenario | Recycling | Emission Area |
|---|
| Element of a Technical Object | Supporting Structure | Photovoltaic Panels | Inverter Station | Electrical Installation |
|---|
| Substance |
|---|
| 1 | Coal, brown | 1.37 × 10⁴ | −2.23 × 10⁵ | 3.02 × 10⁵ | 1.00 × 10² | Raw Materials |
| 2 | Coal, hard | 7.23 × 10⁵ | −5.74 × 10⁵ | 1.49 × 10⁶ | 4.03 × 10² | Raw Materials |
| 3 | Gas, mine, off-gas, process, coal mining/m3 | 1.30 × 10⁴ | −1.33 × 10⁴ | 2.31 × 10⁴ | 7.04 × 100 | Raw Materials |
| 4 | Gas, natural/m3 | 6.87 × 10⁴ | 4.41 × 10⁵ | 3.98 × 10⁶ | 4.86 × 10² | Raw Materials |
| 5 | Oil, crude | 1.70 × 10⁵ | −6.17 × 10⁵ | 2.30 × 10⁶ | 4.75 × 10² | Raw Materials |
| 6 | Peat | x | 5.51 × 10² | 9.50 × 10³ | 1.63 × 10⁻¹ | Raw Materials |
| 7 | Remaining substances | 3.85 × 101 | 1.16 × 10⁻¹⁰ | −9.31 × 100 | 1.83 × 10⁻¹³ | x |
| TOTAL | 9.88 × 10⁵ | −9.85 × 10⁵ | 8.11 × 10⁶ | 1.47 × 10³ | |
Table 10.
Characterization of energy demand throughout the life cycle of the examined solar power plant, taking into consideration the process of managing polymers, materials, and elements after consumption in the context of activities linked to acquiring energy from renewable sources, such as hydropower plants (CED model) (unit: MJ) (personal investigation).
| No | Element of a Technical Object | Photovoltaic Power Plant | Emission Area |
|---|
| Waste Scenario | Landfill | Recycling |
|---|
| Substance | | |
|---|
| 1 | Energy, potential (in hydropower reservoir), converted | 1.60 × 10⁷ | 1.27 × 10⁷ | Raw Materials |
| 2 | Remaining substances | x | x | x |
| TOTAL | 1.60 × 10⁷ | 1.27 × 10⁷ | |
Table 11.
Energy demand characterization throughout the life cycle of each unit in the examined photovoltaic power plant, with a focus on the processes involved in obtaining energy from hydropower plants and renewable sources of energy (CED model) and accounting for the post-consumer management of plastics, materials, and elements (landfill) (unit: MJ) (personal investigation).
| No | Waste Scenario | Landfilling | Emission Area |
|---|
| Element of a Technical Object | Supporting Structure | Photovoltaic Panels | Inverter Station | Electrical Installation |
|---|
| Substance |
|---|
| 1 | Energy, potential (in hydropower reservoir), converted | 1.77 × 10⁴ | 2.08 × 10⁶ | 1.39 × 10⁷ | 3.19 × 10⁴ | Raw Materials |
| 2 | Remaining substances | x | x | x | x | x |
| TOTAL | 1.77 × 10⁴ | 2.08 × 10⁶ | 1.39 × 10⁷ | 3.19 × 10⁴ | |
Table 12.
Energy demand characterization throughout the life cycle of each unit in the examined photovoltaic power plant, with a focus on the processes involved in obtaining energy from hydropower plants and renewable sources of energy (CED model) and accounting for the post-consumer management of plastics, materials, and elements (recycling) (unit: MJ) (personal investigation).
| No | Waste Scenario | Recycling | Emission Area |
|---|
| Element of a Technical Object | Supporting Structure | Photovoltaic Panels | Inverter Station | Electrical Installation |
|---|
| Substance |
|---|
| 1 | Energy, potential (in hydropower reservoir), converted | 1.65 × 10⁴ | −7.78 × 10⁵ | 1.35 × 10⁷ | 2.01 × 10² | Raw Materials |
| 2 | Remaining substances | x | x | x | x | x |
| TOTAL | 1.5 × 10⁴ | −7.78 × 10⁵ | 1.35 × 10⁷ | 2.01 × 10² | |
Table 13.
Characterization of energy demand throughout the life cycle of the examined solar power plant in the context of nuclear energy production processes (CED model), accounting for the post-consumer handling of polymers, materials, and components (unit: MJ) (personal investigation).
Table 13.
Characterization of energy demand throughout the life cycle of the examined solar power plant in the context of nuclear energy production processes (CED model), accounting for the post-consumer handling of polymers, materials, and components (unit: MJ) (personal investigation).
| No | Element of a Technical Object | Photovoltaic Power Plant | Emission Area |
|---|
| Waste Scenario | Landfilling | Recycling |
|---|
| Substance | | |
|---|
| 1 | Uranium | 5.34 × 10⁶ | 2.32 × 10⁶ | Raw Materials |
| 2 | Remaining substances | x | x | x |
| TOTAL | 5.34 × 10⁶ | 2.32 × 10⁶ | |
Table 14.
Energy demand characterization throughout the life cycle of each unit in the examined photovoltaic power plant in terms of nuclear energy-related processes (CED model), accounting for the way that materials, plastics, and other elements are managed after consumption (landfill) (unit: MJ) (personal investigation).
| No | Waste Scenario | Landfilling | Emission Area |
|---|
| Element of a Technical Object | Supporting Structure | Photovoltaic Panels | Inverter Station | Electrical Installation |
|---|
| Substance |
|---|
| 1 | Uranium | 3.14 × 10⁴ | 1.99 × 10⁶ | 3.27 × 10⁶ | 4.85 × 10⁴ | Raw Materials |
| 2 | Remaining substances | x | x | x | x | x |
| TOTAL | 3.14 × 10⁴ | 1.99 × 10⁶ | 3.27 × 10⁶ | 4.85 × 10⁴ | |
Table 15.
Energy consumption characterization throughout the life cycle of each unit in the examined photovoltaic power plant in terms of nuclear energy-related processes (CED model), accounting for the recycling of materials, plastics, and other post-consumer waste (recycling) (unit: MJ) (personal investigation).
| No | Waste Scenario | Recycling | Emission Area |
|---|
| Element of a Technical Object | Supporting Structure | Photovoltaic Panels | Inverter Station | Electrical Installation |
|---|
| Substance |
|---|
| 1 | Uranium | 2.75 × 10⁴ | −6.00 × 10⁵ | 2.89 × 10⁶ | 3.05 × 10² | Raw Materials |
| 2 | Remaining substances | x | x | x | x | x |
| TOTAL | 2.75 × 10⁴ | −6.00 × 10⁵ | 2.89 × 10⁶ | 3.05 × 10² | |

 ,
, 


