1. Introduction
Direct utilization of coal and petroleum coke as primary fuels in combustion releases sulfur and nitrogen elements as oxides, contributing to environmental issues such as acid rain and photochemical smog [
1]. Biomass types, such as wood, crop, forestry, and livestock waste [
2], represent an excellent renewable energy source with a broad distribution and low carbon content. Consequently, the net carbon dioxide emissions to the atmosphere are nearly negligible, thereby mitigating the greenhouse effect [
3]. Biomass with a moisture content of 50% is only suitable for combustion in specialized boilers and is economically viable in combined heat and power plants or medium- to high-capacity heating plants. To utilize the biomass in low-power boilers for central heating, the sample must be dried to a moisture content below 15% [
4]. The high moisture content in biomass increases the cost of obtaining it. Biomass with high water content is often transported over long distances, resulting in increased weight, reduced calorific value, and higher fuel transportation costs [
5]. While using unprocessed biomass near the production site offers advantages such as agglomeration, granulation [
6], and pelletization, it becomes economically advantageous when considering densification, storage area, and transportation costs.
There are approximately 300 known species of willows, with most of them being in the form of shrubs. This genus is represented in Poland by 28 species and numerous hybrids, often challenging to classify. In the Greater Poland Voivodeship, the oldest brittle willow is in the Klempicz, Lubasz municipality. It is 166 years old, has a circumference of 741 cm, a diameter of 235 cm, and a height of 17 m [
7]. It is most commonly considered a weeping variety of the white willow with drooping branches and is widespread throughout Europe. Notably, willow belongs to the photosynthetic C4 plant type, which enhances its suitability for biofuel production [
8,
9]. It thrives in challenging climatic conditions, requires minimal fertilization, and exhibits a low dependence on plant protection products. It has the potential to produce approximately 310–340 L of ethanol per ton. Caslin (2015) reported willow yield in the field as 15 tons/hectare [
10], which allows the production of 4650–5100 L of ethanol per hectare, in comparison with the ethanol yield of sugarcane (approximately 6200 L per hectare), switchgrass (9500 L of ethanol per hectare) [
11,
12], and maize (approximately 3800 L per hectare) [
13,
14]. However, the economic viability of willow ethanol production is subject to ongoing debate. Utilizing willow-derived bioethanol demands a higher water volume than gasoline production and usage. The production and utilization of ethanol necessitates 169 percent more water than gasoline requires. A substantial portion of this increased water usage is linked to the production of enzymes and chemicals employed in bioconversion [
14].
As another compromising application, the thermal degradation of biomass presents a complex research challenge due to the diverse fractions within its structure. Biomass cells consist of microfibers at the microscopic level, where bundles of cellulose particles are enveloped by hemicellulose. At the same time, lignin is situated between the micro-fibers and in amorphous regions [
15]. These three biomass fractions exhibit different thermal resistance. Consequently, the mass loss curves during wood biomass torrefaction reveal three distinct zones: the hemicellulose and cellulose decomposition zone between 200 and 300 °C and the gradually increasing lignin decomposition zone spanning 300 to 500 °C [
16]. The research primarily focuses on the first zone, which pertains to the distribution of hemicellulose within a relatively low-temperature range of 225 to 300 °C. This process is commonly referred to as torrefaction and is used for roasting coffee beans. The resultant product of this process, known as torrefied wood or roasted wood, has applications as a fuel for grilling [
17]. Moreover, torrefied wood is increasingly recognized as a potential renewable fuel with enhanced energy density compared to raw biomass, suitable for gasification and co-combustion with coal in commercial power generation processes [
18]. Torrefaction steps are shown in
Figure 1.
Over the past 15 years, there has been a growing utilization of biomass derived from agricultural crops, industrial waste, and wood industry waste as a fuel source in the energy industry [
20,
21]. Perennial plants are particularly suitable for energy production due to their long-term cultivation cycle [
22,
23], making willow an efficient energy species. The co-combustion of biomass with fossil fuels, primarily coal, for thermal energy generation is also gaining prominence [
24]. The bottom ash generated from biomass combustion can be repurposed as a fertilizer, leading to increased interest in studying its chemical composition in agricultural applications [
25,
26]. Additionally, it has been proposed to be used as an additive in anaerobic digestion but has resulted in a decrease in methane yield [
27].
Despite numerous research findings on the pyrolysis of forest-origin biomass and biomass from targeted crops, limited attention has been given to the temperature range encountered during the torrefaction process. Consequently, further research is warranted to enhance our understanding of torrefaction’s chemical and physical processes, particularly the reaction mechanisms occurring in biomass.
The primary objective of our research is to design a torrefaction reactor to maintain optimal flow conditions, ensuring the maximum heating rate of crushed biomass (approximately 280 °C) within the torrefaction chamber. This setup aims to initiate the exothermic reaction efficiently. The reactor’s design minimizes the contact between the char and pyrolytic gases [
4]. Gases generated during the biomass coaling process exit the reactor and are combusted, which aids in temperature control and reactor stability. Another advantage of this reactor design lies in its unique drying and thermolysis system, allowing for the recovery of additional heat from the hot exhaust gases. Unprocessed biomass with a high moisture content exhibits lower calorific values compared to biomass with a lower water content. This is particularly evident when willow is transported directly from the field.
This paper reports the research outcomes of the biomass torrefaction process applied to willow, an energy plant. The experimentation involved TGA and DTA thermogravimetric analyses, characterizing the material as biomass. The study delves into the kinetic model of the torrefaction process, detailing the reactions and mechanisms at play. The objective of this model is to furnish recommendations and guidelines for industrial biomass torrefaction facilities, focusing on key parameters such as the operating temperature, residence time, and particle size of the torrefied biomass [
28]. These insights enhance our understanding of the torrefaction process, offering valuable information for optimizing its industrial application.
Coal, a sedimentary rock of plant origin, predominantly consists of elemental carbon and aromatic or hydroaromatic hydrocarbon compounds [
29]. It contains relatively weak bonds, such as methylene, ether, and thioether, along with functional groups or oxygen functional groups like phenols, ethers, or disulfides [
30]. The functional groups’ arrangement defines carbon’s chemical characteristics within coal, the extent of macromolecular aromaticity, and the degree of condensation in aromatic structures [
31]. In light of this information about hard coal, this study also explores torrefied biomass and coal co-combustion.
2. Materials and Methods
2.1. Material
The samples were collected from the experimental fields of the Institute of Horticulture in Skierniewice, Poland. The biomass was transported to the Department of Thermal Technology and Refrigeration laboratory and cut before drying them in an electric dryer. The samples were cut into 5 to 10 cm lengths and evenly distributed on a tray to dry them thoroughly and ensure good contact with the air flowing over them during drying. Drying was carried out by following the Standard Method 2450-C for drying and determining the moisture content. The drying process lasts 24 h at a temperature of 110 °C [
32]. The weight of the samples was measured before and after the drying process, and the results were used to determine the moisture content.
2.2. Thermogravimetric, Elemental Analysis, and FTIR
The subsequent stage involved the torrefaction process of willow samples, employing a thermogravimetric analyzer. The experimental conditions were established to heat the samples to 290 °C with heating rates ranging from 10 to 100 K/min and maintain this temperature for 15 min under isothermal conditions. Kinetic measurements for torrefaction were carried out using a Perkin Elmer Pyris 6 thermogravimeter supplied from Perkin Elmer, Shelton, CT, USA, equipped with an autosampler alongside a TG apparatus. Samples with weights ranging from 4 to 8 mg were analyzed. The torrefied biomass analysis occurred under a continuous nitrogen flow of 20 mL/min. Throughout the process, the weight of the torrefied biomass was continuously monitored using a TG thermobalance. A dedicated computer program connected to the thermogravimeter enabled temperature monitoring and facilitated the generation of mass loss profiles over time as a function of temperature. Due to the ash content in samples, the measured masses were corrected and determined as follows [
33]:
In this context, Winitial pertains to the initial mass of the dry sample, Wash refers to the ash mass of the dry sample, and WTGA designates the constant mass recorded by the thermogravimeter, measured as a function of time.
The samples were subjected to comprehensive elemental and technical analysis to assess the composition of carbon, hydrogen, nitrogen, and sulfur by using the Perkin/Elmer 2400 Series II CHNS/O Elemental Analyzer supplied from Perkin Elmer. This analysis also encompassed the evaluation of volatile components, moisture content, ash content, heat of combustion, and calorific value.
To gain further insights, thermogravimetric analysis was integrated with the examination of gases generated during biomass torrefaction, referred to as “torgas”. Fourier transform infrared (FTIR) analysis was utilized to determine the presence of water vapor, carbon dioxide, carbon monoxide, methane, and trace amounts of formaldehyde acids.
The analyses followed a consistent approach: 2D and 3D graphs depicted the natural frequencies of molecules on the y-axis and wavelengths on the x-axis, aligned with specific molecule and bond types. This enabled chemical compound identification in torgas. However, the FTIR analysis could not quantify compound amounts, only identifying their presence. Quantitative analysis was carried out using mass spectrometry for exhaust gases from torrefied biomass and coal co-combustion. FTIR combined with thermogravimetric analysis isolated prevalent carbon-like compounds. Subsequent subsections detail the identified chemical compounds.
The experiments were employed on willow with particle sizes ranging from 0.2 to 0.8 mm. The experiments were conducted at 20 to 290 °C temperature within an argon atmosphere. The total time in the thermogravimeter chamber was 47 min; notably, the residence time excludes the heating period (with a heating rate of 10 K/min, comprising 27 min for heating from ambient temperature to the desired torrefying temperature and 20 min of isothermal torrefaction at 290 °C).
2.3. Kinetic Modeling
In the context of this study, an investigation was conducted to ascertain the suitability of the two-step mechanism in describing mass loss kinetics in biomass at torrefaction temperatures. It involved comparing the formation of volatiles and evaluating the first- and second-stage reactions, particularly for more resilient biomass varieties, in relation to xylan depletion. The kinetic mechanism employed to model willow torrefaction is presented in
Scheme 1 and in Equations (2) and (3) [
34]. Consistent with the Di Blasi and Lanzetta model [
34], it suggests the formation of intermediate B contributing to volatile generation during this reaction step.
Assuming that all reactions are first order, the equations can be solved analytically. Integrating the differential equations with the initial condition that only A is known at the beginning of the reaction can lead to an equation for the relative weight of the solid products [
34]:
M—relative mass of solid products;
Therefore, the research presented in this chapter considers solid formations and volatile product formations as parallel formations and aims to determine the parameters k1 and k2 and the parameters kV1 and kV2.
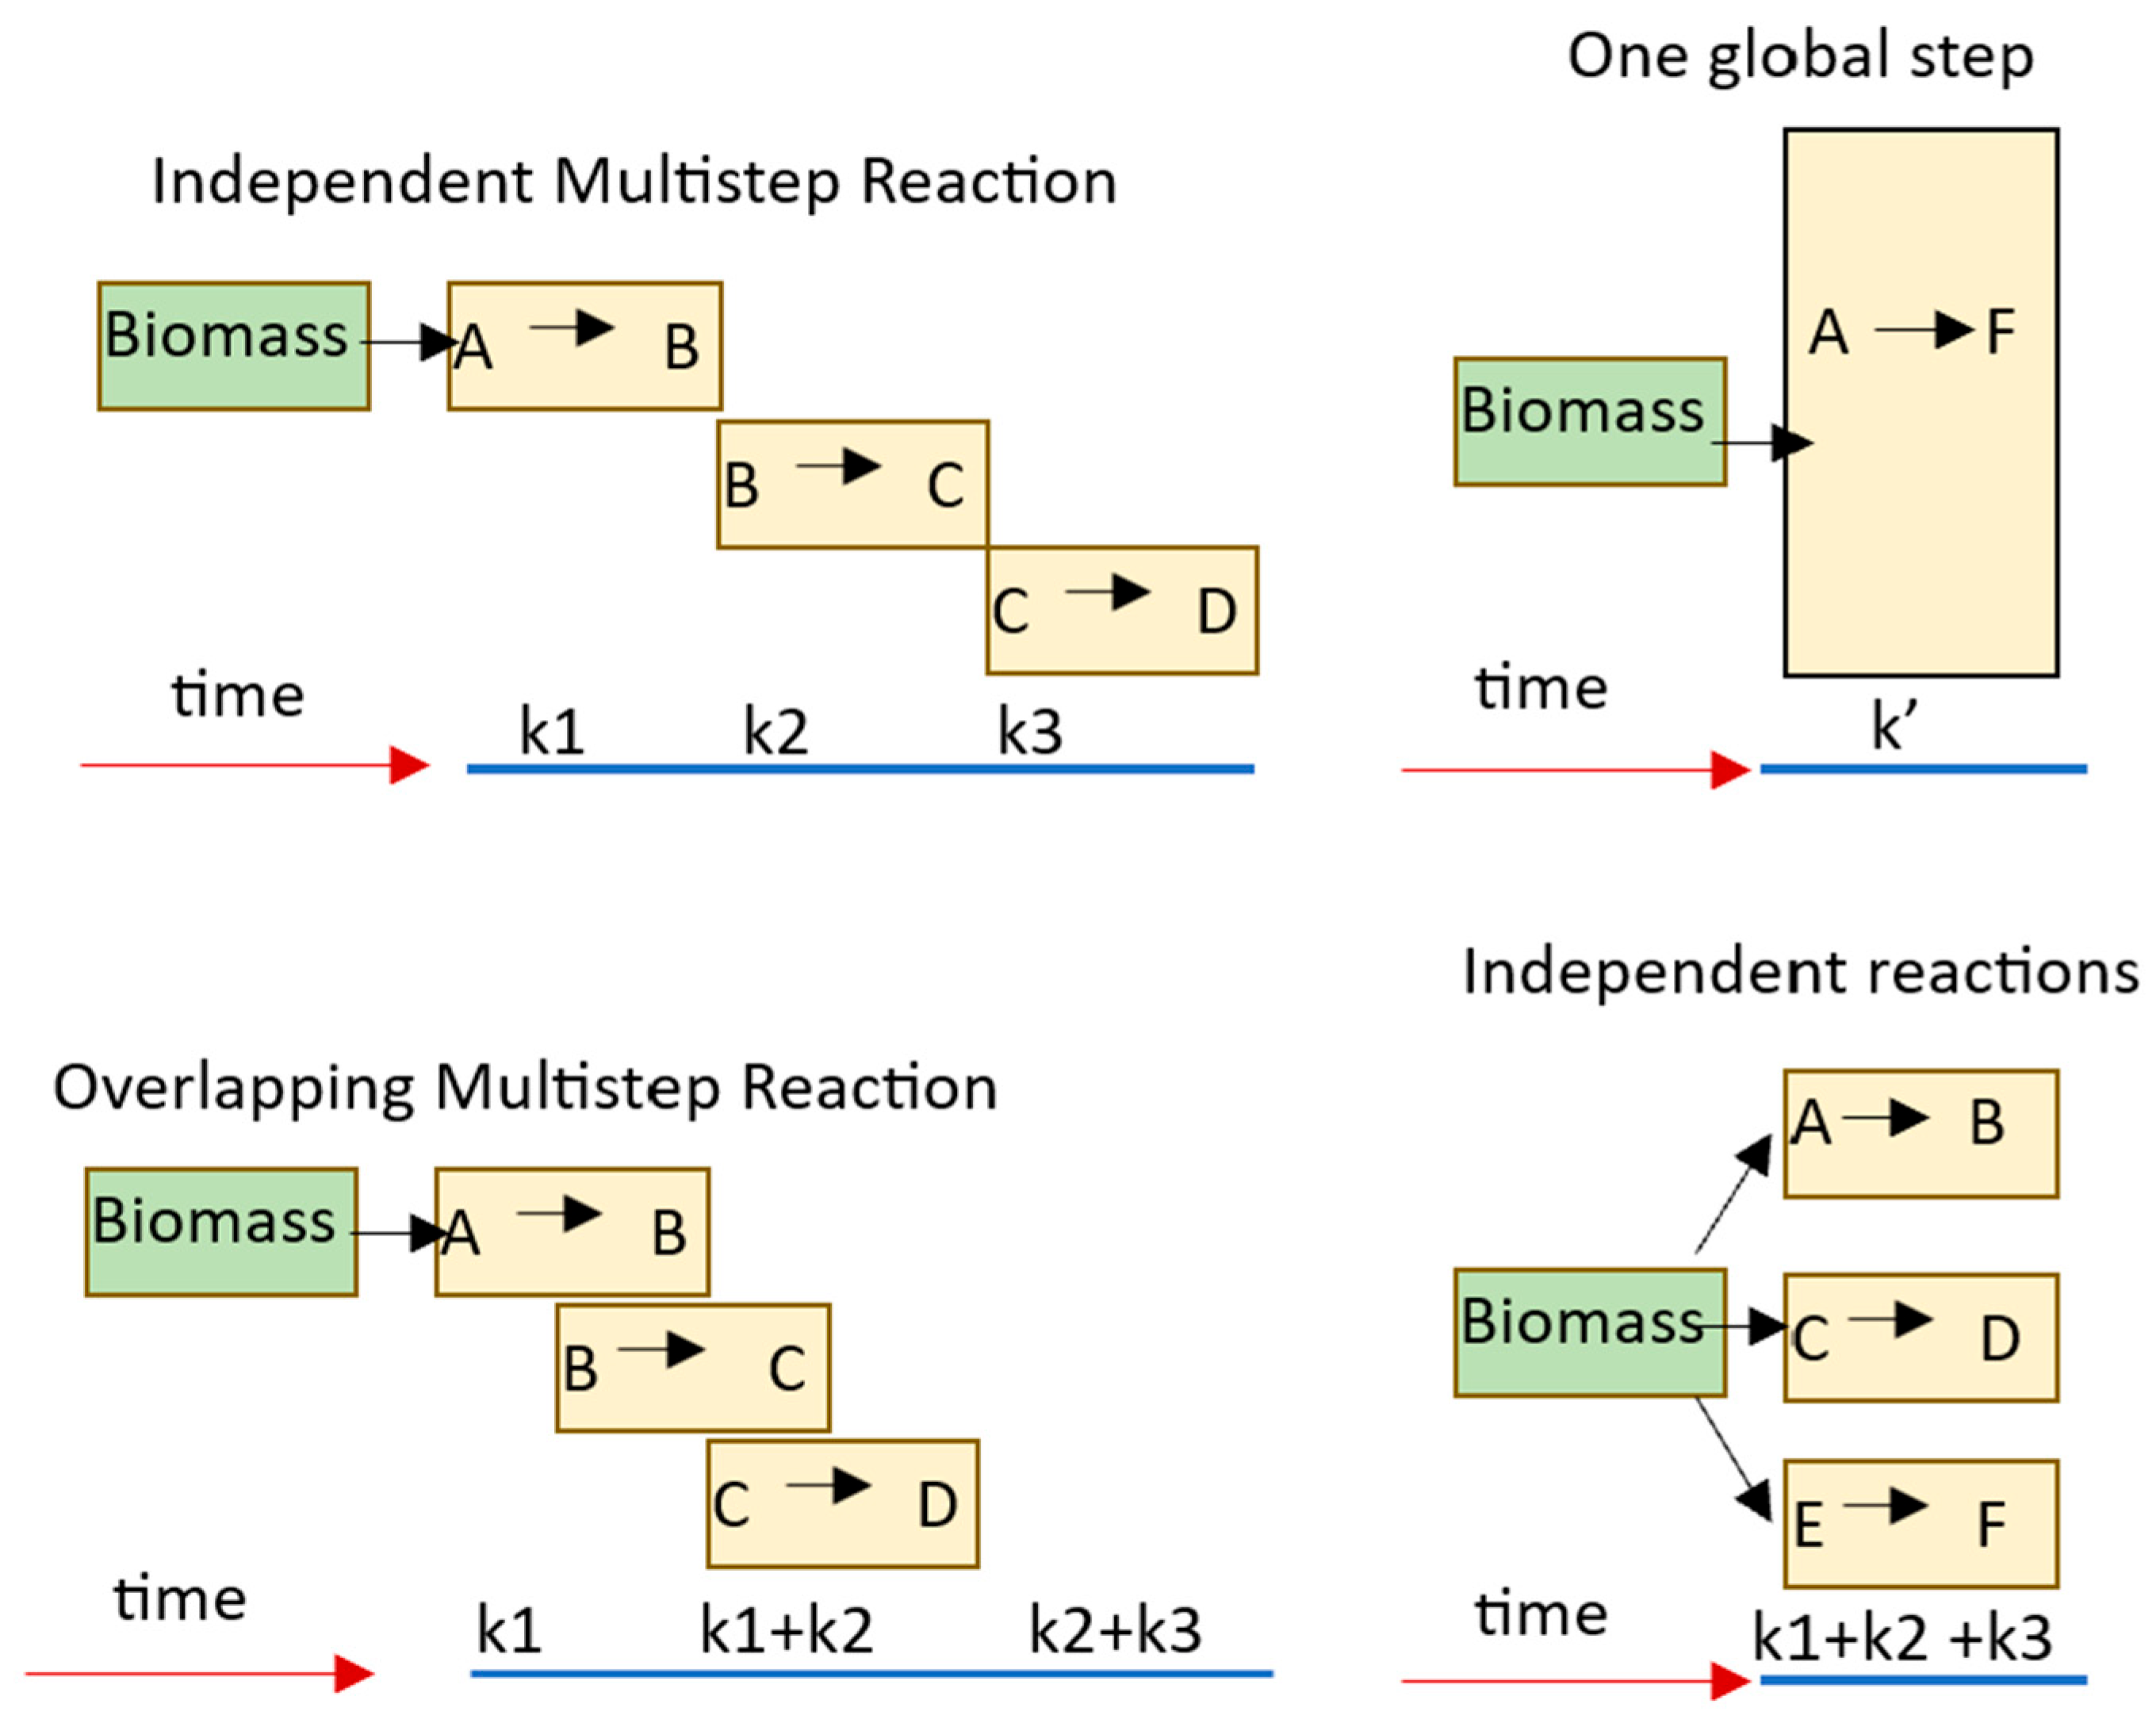
The main kinetic models described in the literature for hemicellulose degradation are shown in
Figure 2. The global one-step reaction gives a general idea of how the torrefaction occurs [
35]. The kinetics of the overall reaction is a good reflection of the process. Still, comparing parameters consistently with other researchers [
36] who stated that simple kinetics models cannot model hemicellulose decomposition is challenging. Studies conducted on multi-step reaction mechanisms show better results [
37].
2.4. Batch Torrefaction Reactor Design
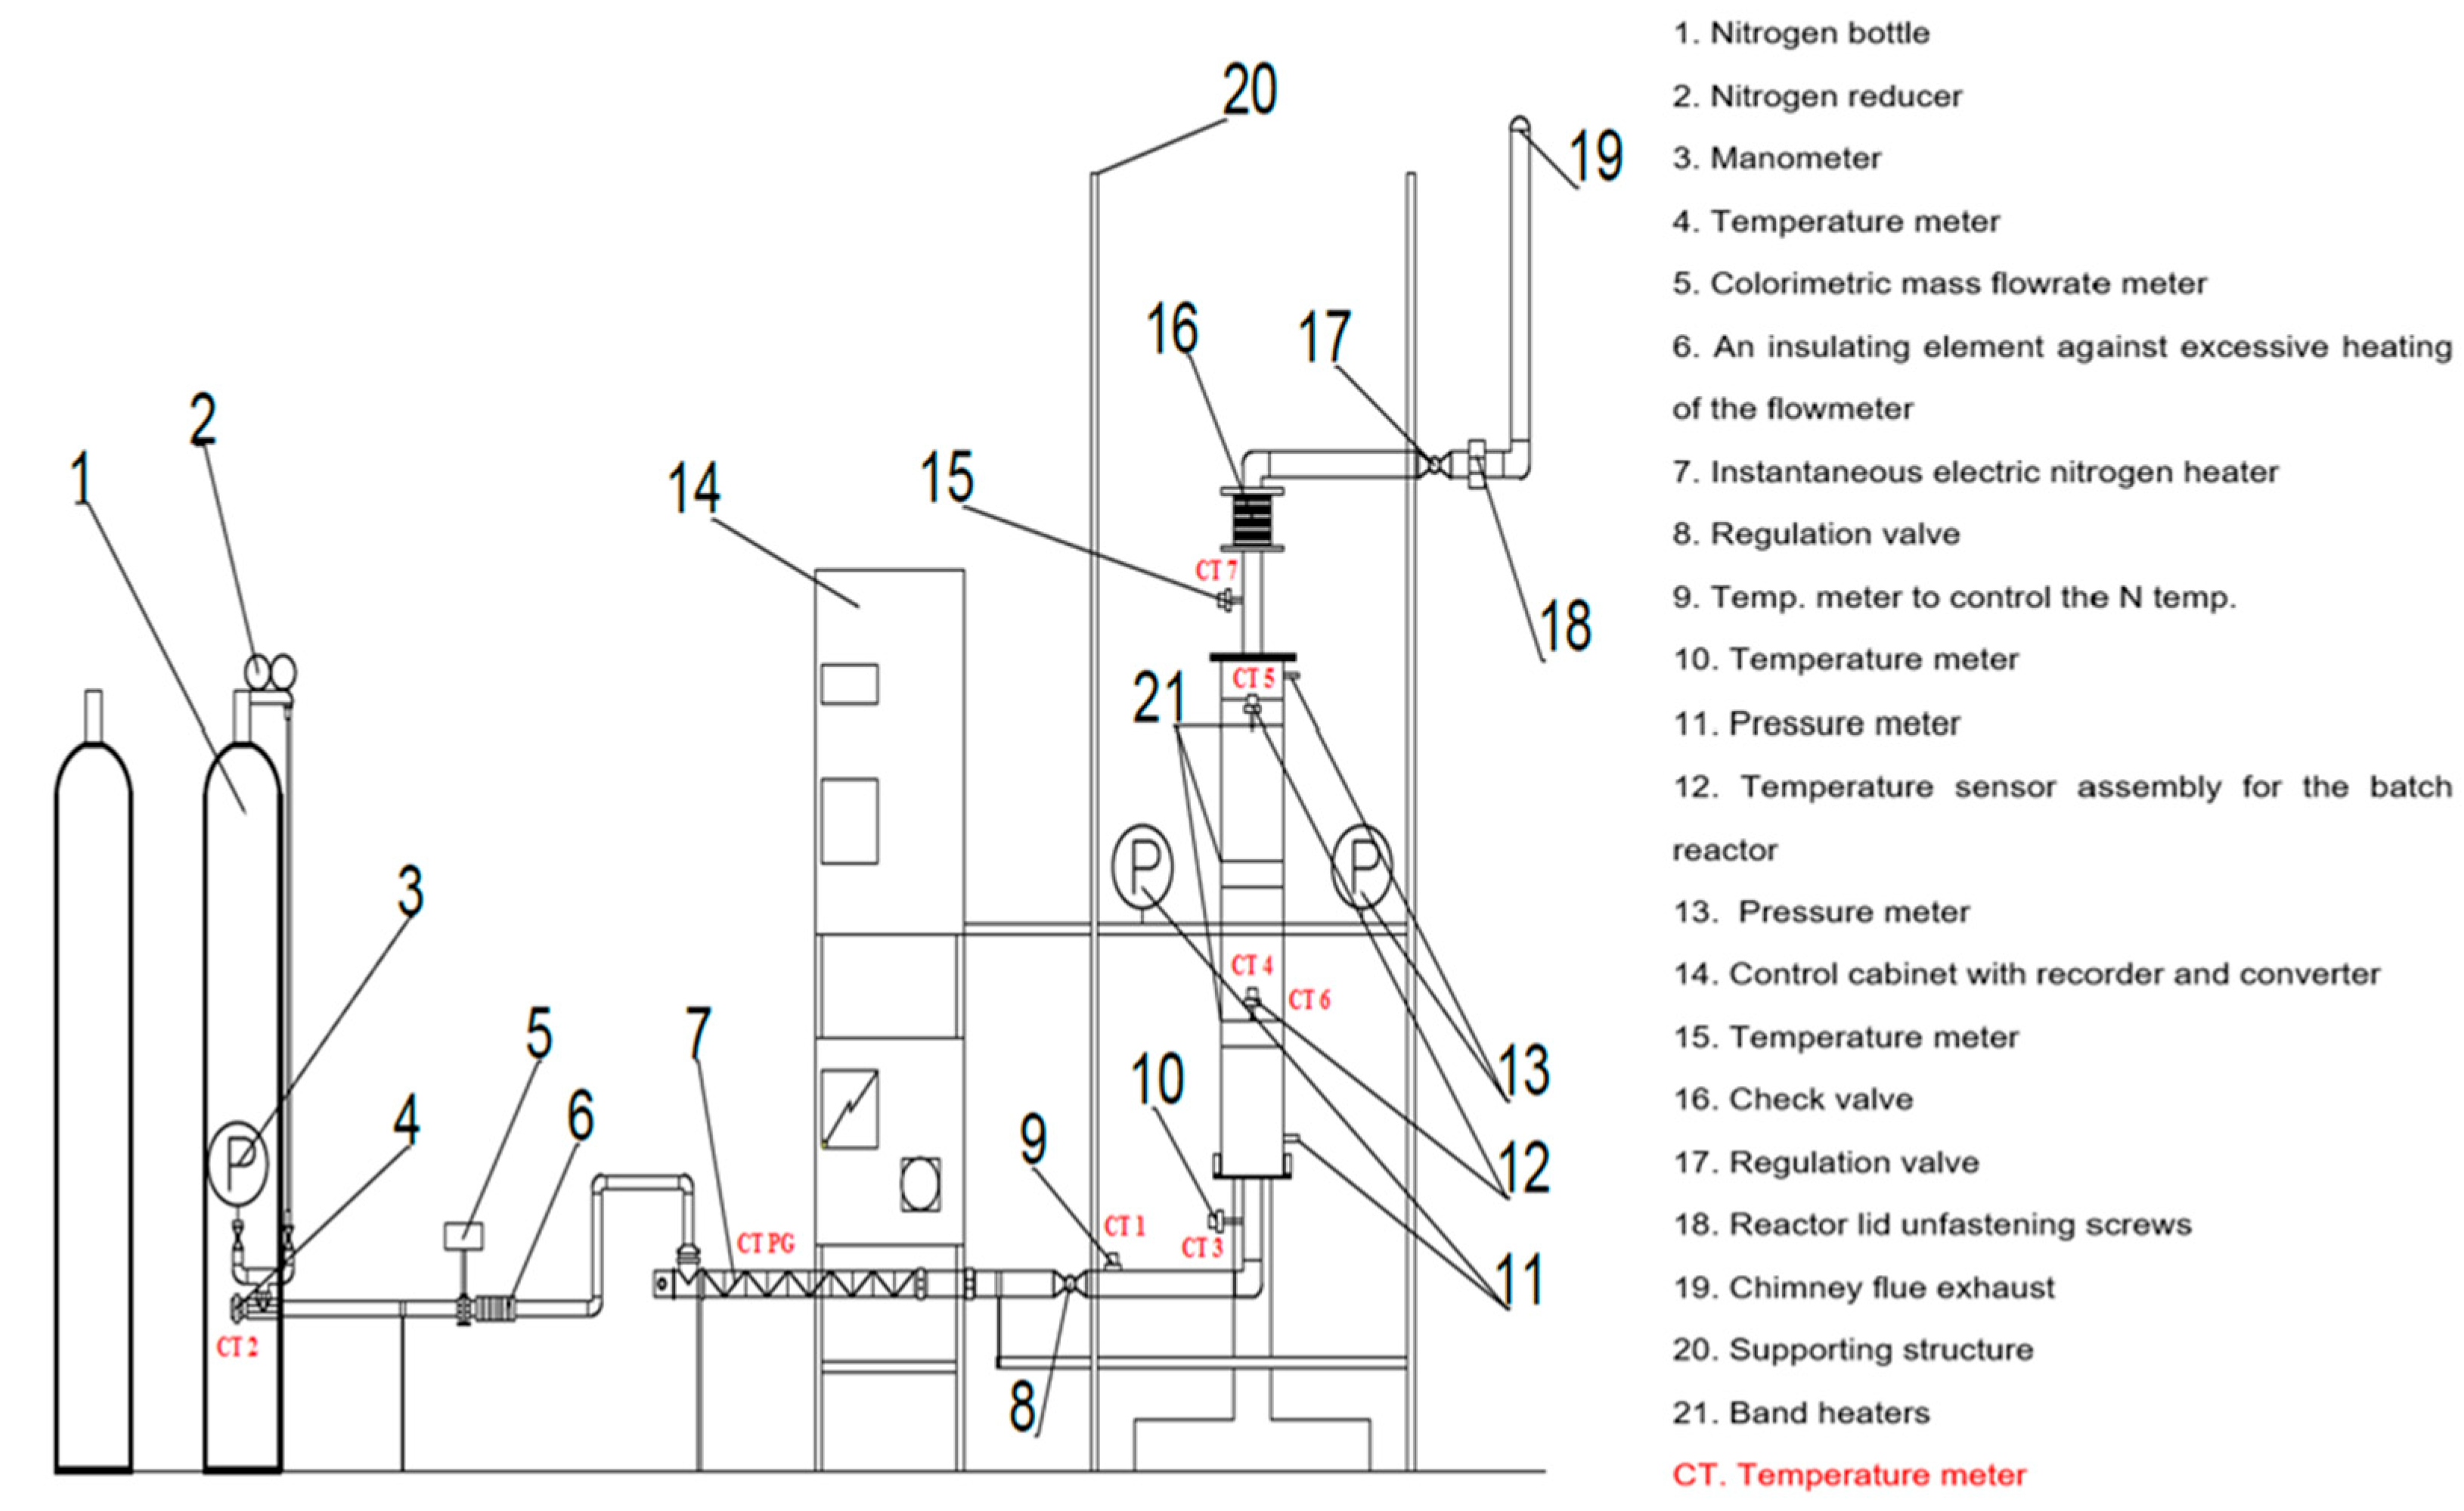
The research on biomass torrefaction from targeted crops was conducted using a specially designed and dedicated installation featuring a batch reactor for biomass torrefaction. The installation operates under an inert gas atmosphere, specifically nitrogen. It was constructed within the Department of Heating and Cooling Technology laboratory at the Faculty of Mechanical Engineering, Lodz University of Technology.
The batch torrefaction reactor installation comprises the following components shown in
Figure 3:
- -
A batch reactor equipped with three sieves of varying perforation sizes;
- -
A flow of electric nitrogen heater with a power capacity of 3 × 3 kW;
- -
A calorimetric mass flow meter designed for gas measurement;
- -
Two high-temperature mechanical control valves;
- -
An inter-flanged plate check valve;
- -
A poppet valve;
- -
Cylinders containing technical nitrogen and a nitrogen reducer;
- -
Three manometers with separators serving as pressure sensors;
- -
Eight thermocouples for temperature measurement;
- -
A multi-channel recorder recording temperature, pressure, and standard signals;
- -
A power controller for regulating the nitrogen flow heater;
- -
A control unit featuring a microprocessor;
- -
Structural elements, as well as sealing and insulation materials;
- -
Three resistance heaters coated with ceramic, each with a power capacity of 2 × 3 kW.
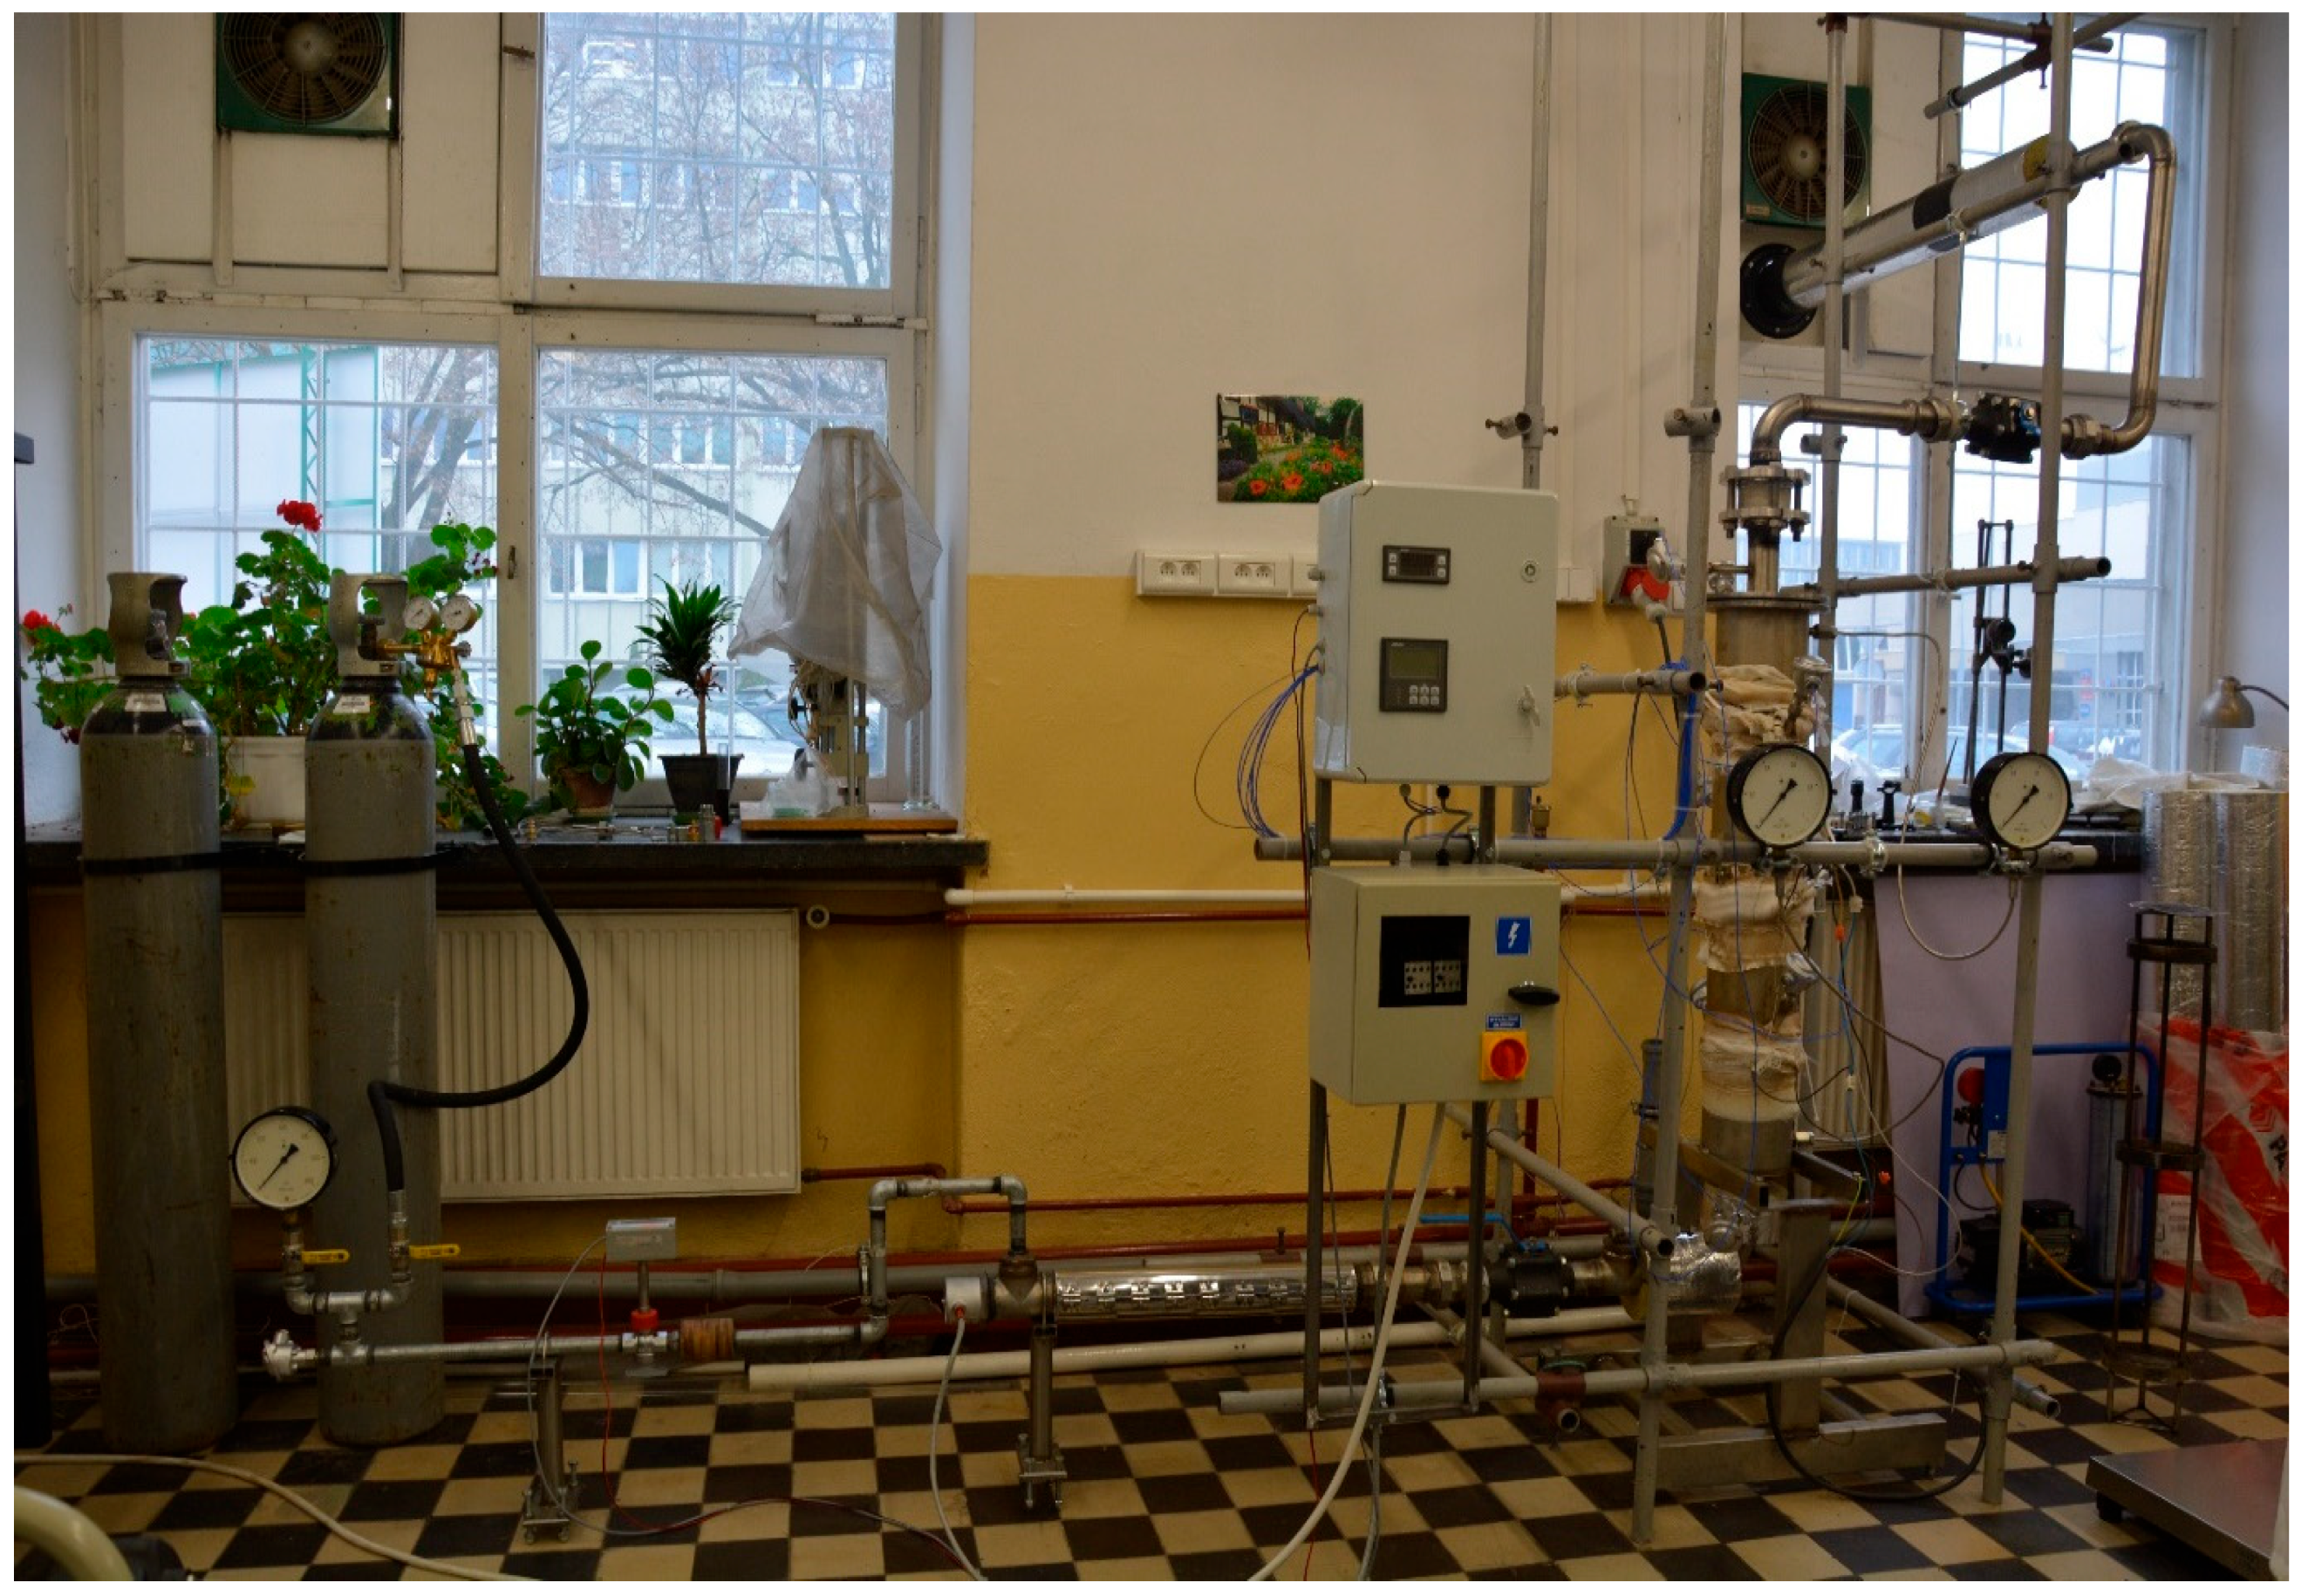
This installation (
Figure 4) enables the research team to experiment with varying particle sizes on biomass fuels’ thermal and chemical degradation processes. The types of fuels used may differ in composition, molecular structure, and fuel properties. By employing this setup, the team aims to gain insights into the kinetics of biomass co-combustion, biomass torrefaction products, and the overall thermo-chemical degradation process in an oxygen-free environment.
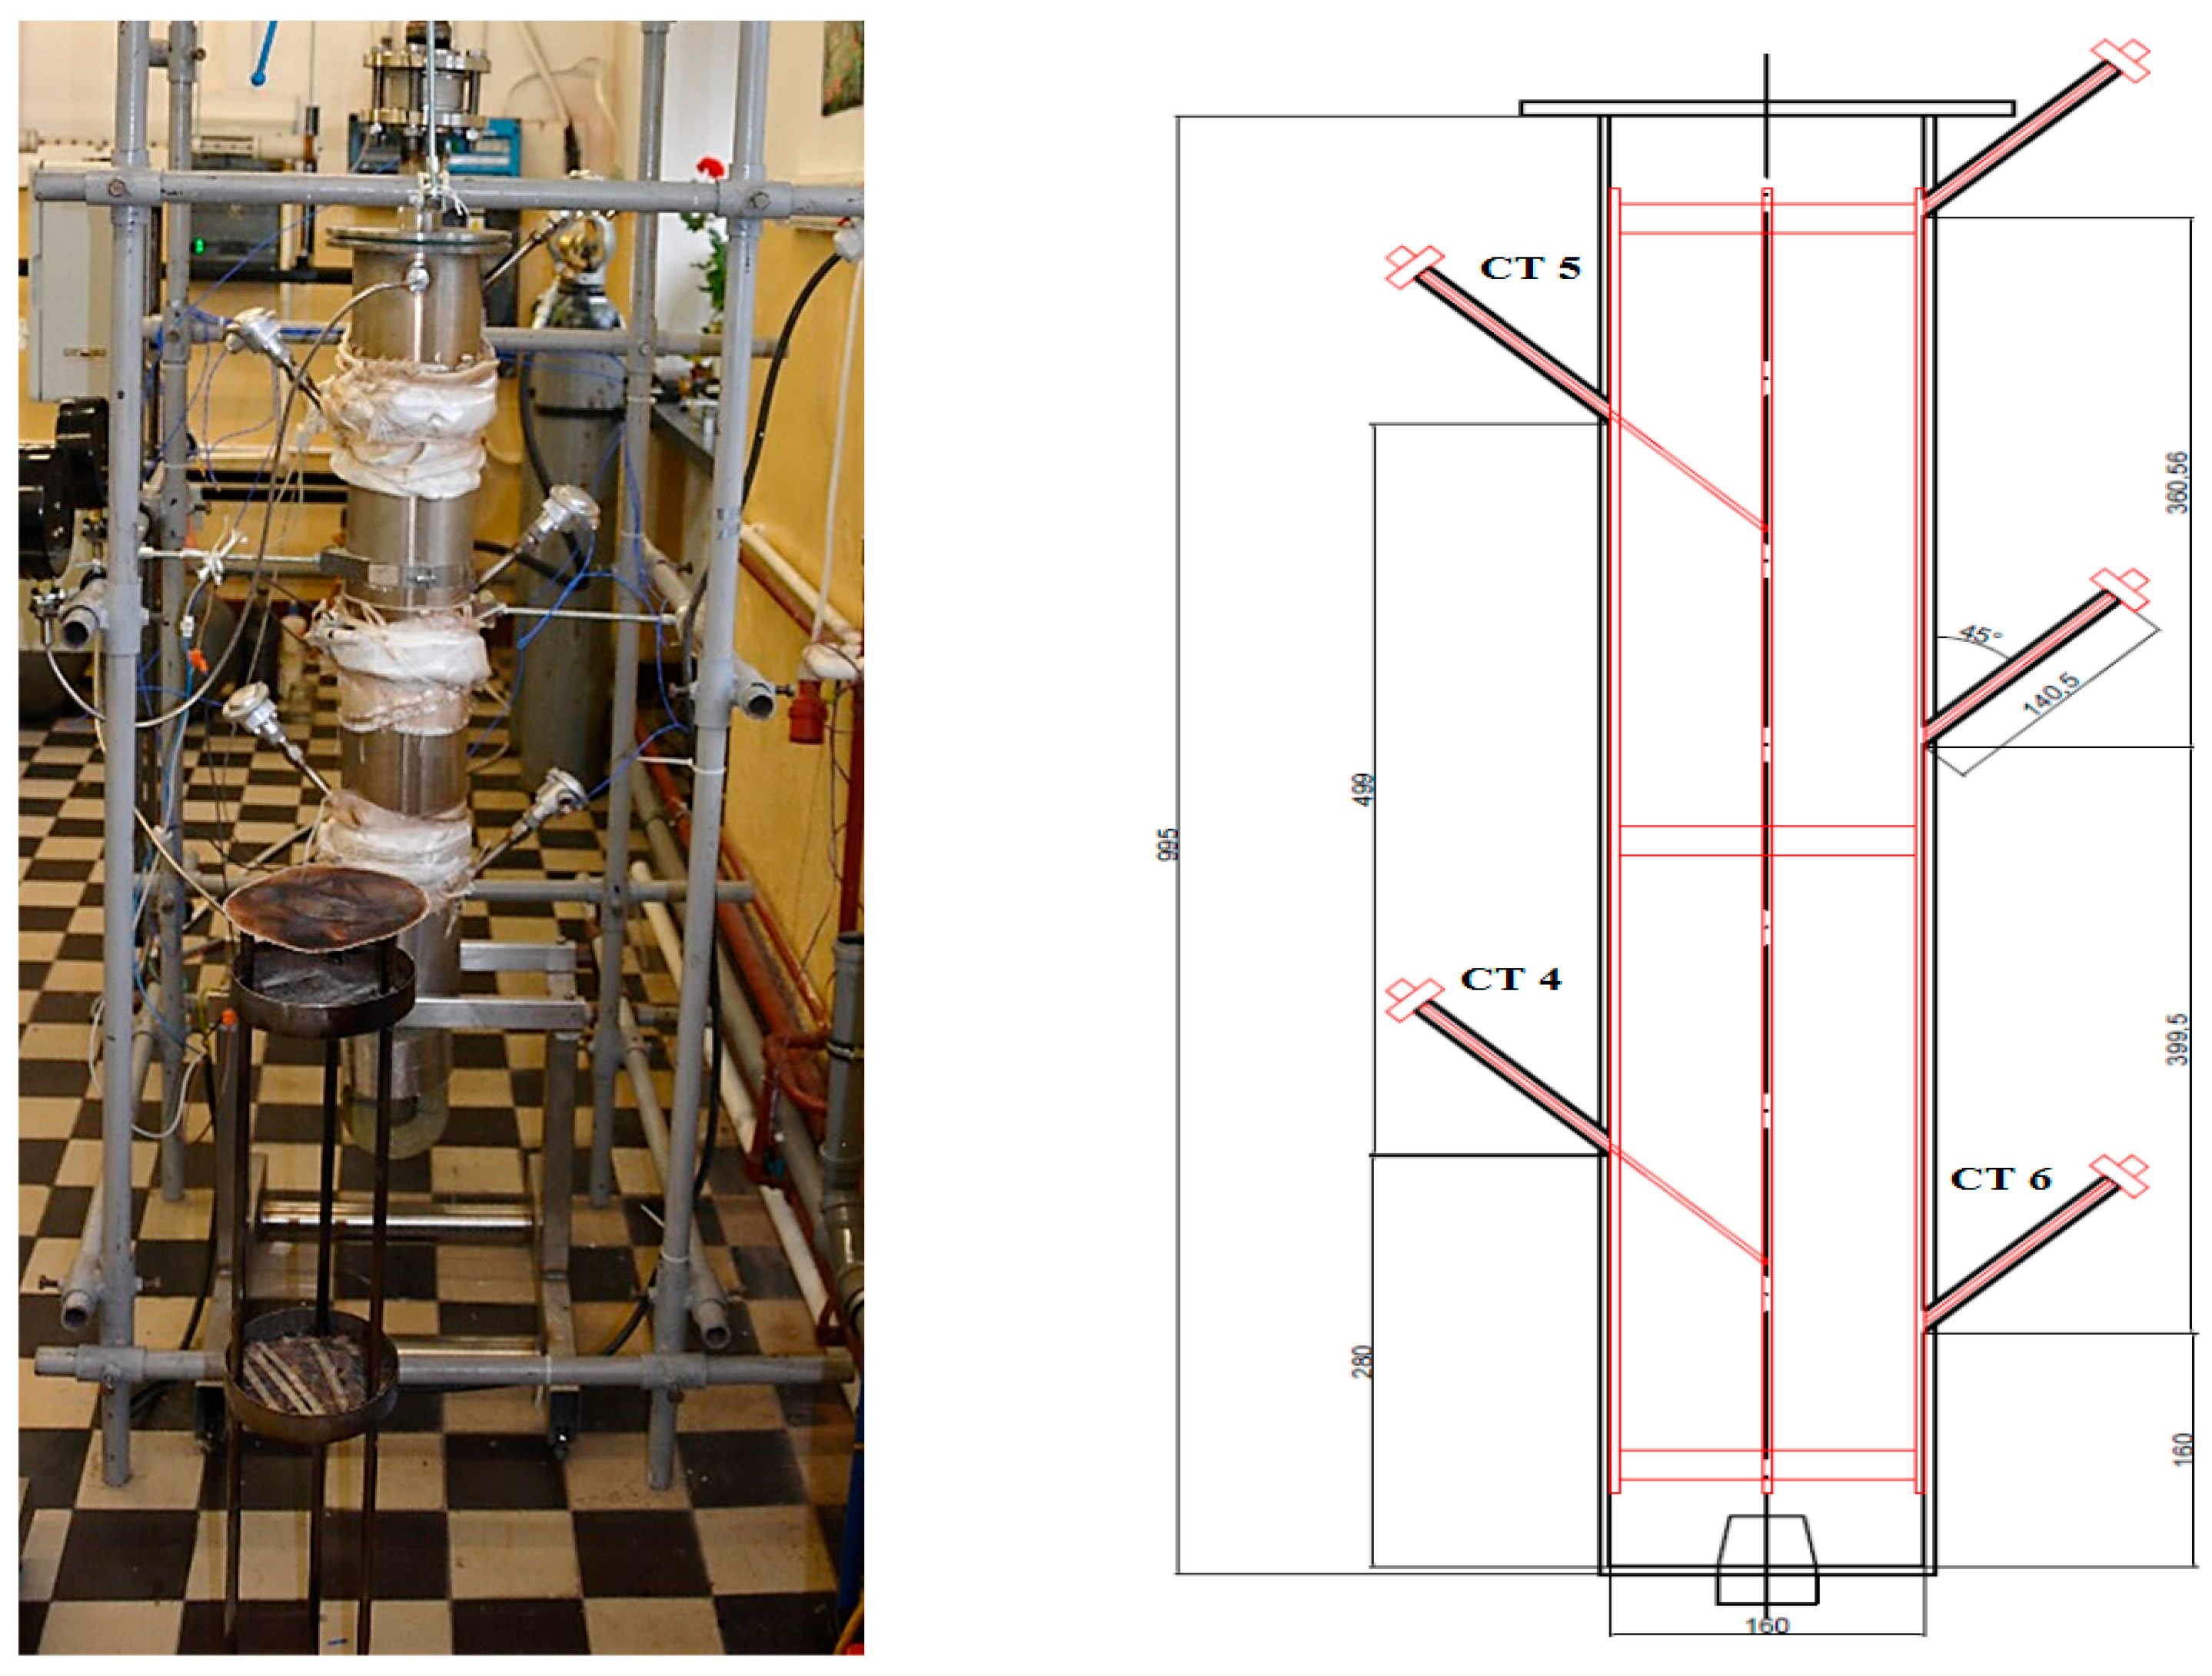
As seen from
Figure 5 the biomass samples were placed on three parallel plates with perforation, then placed from the top of the reactor through the inside. The temperature sensors CT4, CT5, and CT6 measured the temperature inside the batch reactor.
The research process for biomass torrefaction involves gas cylinders containing compressed technical nitrogen gas. During the initial phase of the process, the gas is decompressed and directed through a mushroom valve and into a dedicated calorimetric gas flow meter designed for nitrogen flow measurement. Subsequently, the gas flows through a flow electric nitrogen heater, which undergoes electrical heating—the temperature of the nitrogen after expansion changes from approximately 20 °C to 300–350 °C. To ensure the appropriate flow conditions, two high-temperature control valves were positioned at the inlet and outlet of the batch reactor, allowing overpressure generation.
The nitrogen flow rate is maintained at 40 L/min [
38], and the biomass particles inside the reactor are preheated for approximately 30 min during each experiment. The biomass is distributed on specially designed sieve rings with different hole sizes. This enables the evaluation of the impact of the torrefaction process on biomass particles with varying sizes and levels of granulation. Each ring contains a 20 g biomass sample, which is prepared beforehand. Preparation involves removing foreign bodies and impurities from the biomass, followed by chopping, grinding to appropriate dimensions, sieving using an automatic sieve, and drying at 110 °C using an electric dryer.
The hot nitrogen transfers heat to the biomass within the reactor, resulting in thermal and chemical degradation during the torrefaction process. Consequently, some moisture and energy are converted into torgas, a mixture primarily composed of water vapor, methane, carbon monoxide, and various forms of formaldehyde acids. The released torgas escapes from the reactor through a special high-temperature non-return valve into the environment. To be able to monitor the temperature during the experiment, nine thermocouples are positioned in the reactor at 45° intervals. Additionally, temperature sensors for nitrogen are placed at the inlet and outlet of the flow electric nitrogen heater, and pressure gauges are located at the reactor’s inlet, outlet, and before the calorimetric mass flow meter.
The entire installation is insulated using a wool-aluminum thermal shield, and all pipe connections, valves, and the reactor itself are sealed. After each measurement, the system is shut down for cooling, and the nitrogen cylinder is closed along with the control valves. The torrefied biomass, in the form of calcined rings, is removed from the batch reactor and subjected to technical and elemental analysis to determine the magnitude of changes resulting from the torrefaction process. Furthermore, calorific value measurements are conducted on the tested biomass samples to assess the energy density and calculated energy balances. The reactivity of the biomass was also analyzed using thermogravimetric analysis. Torrefied biomass (
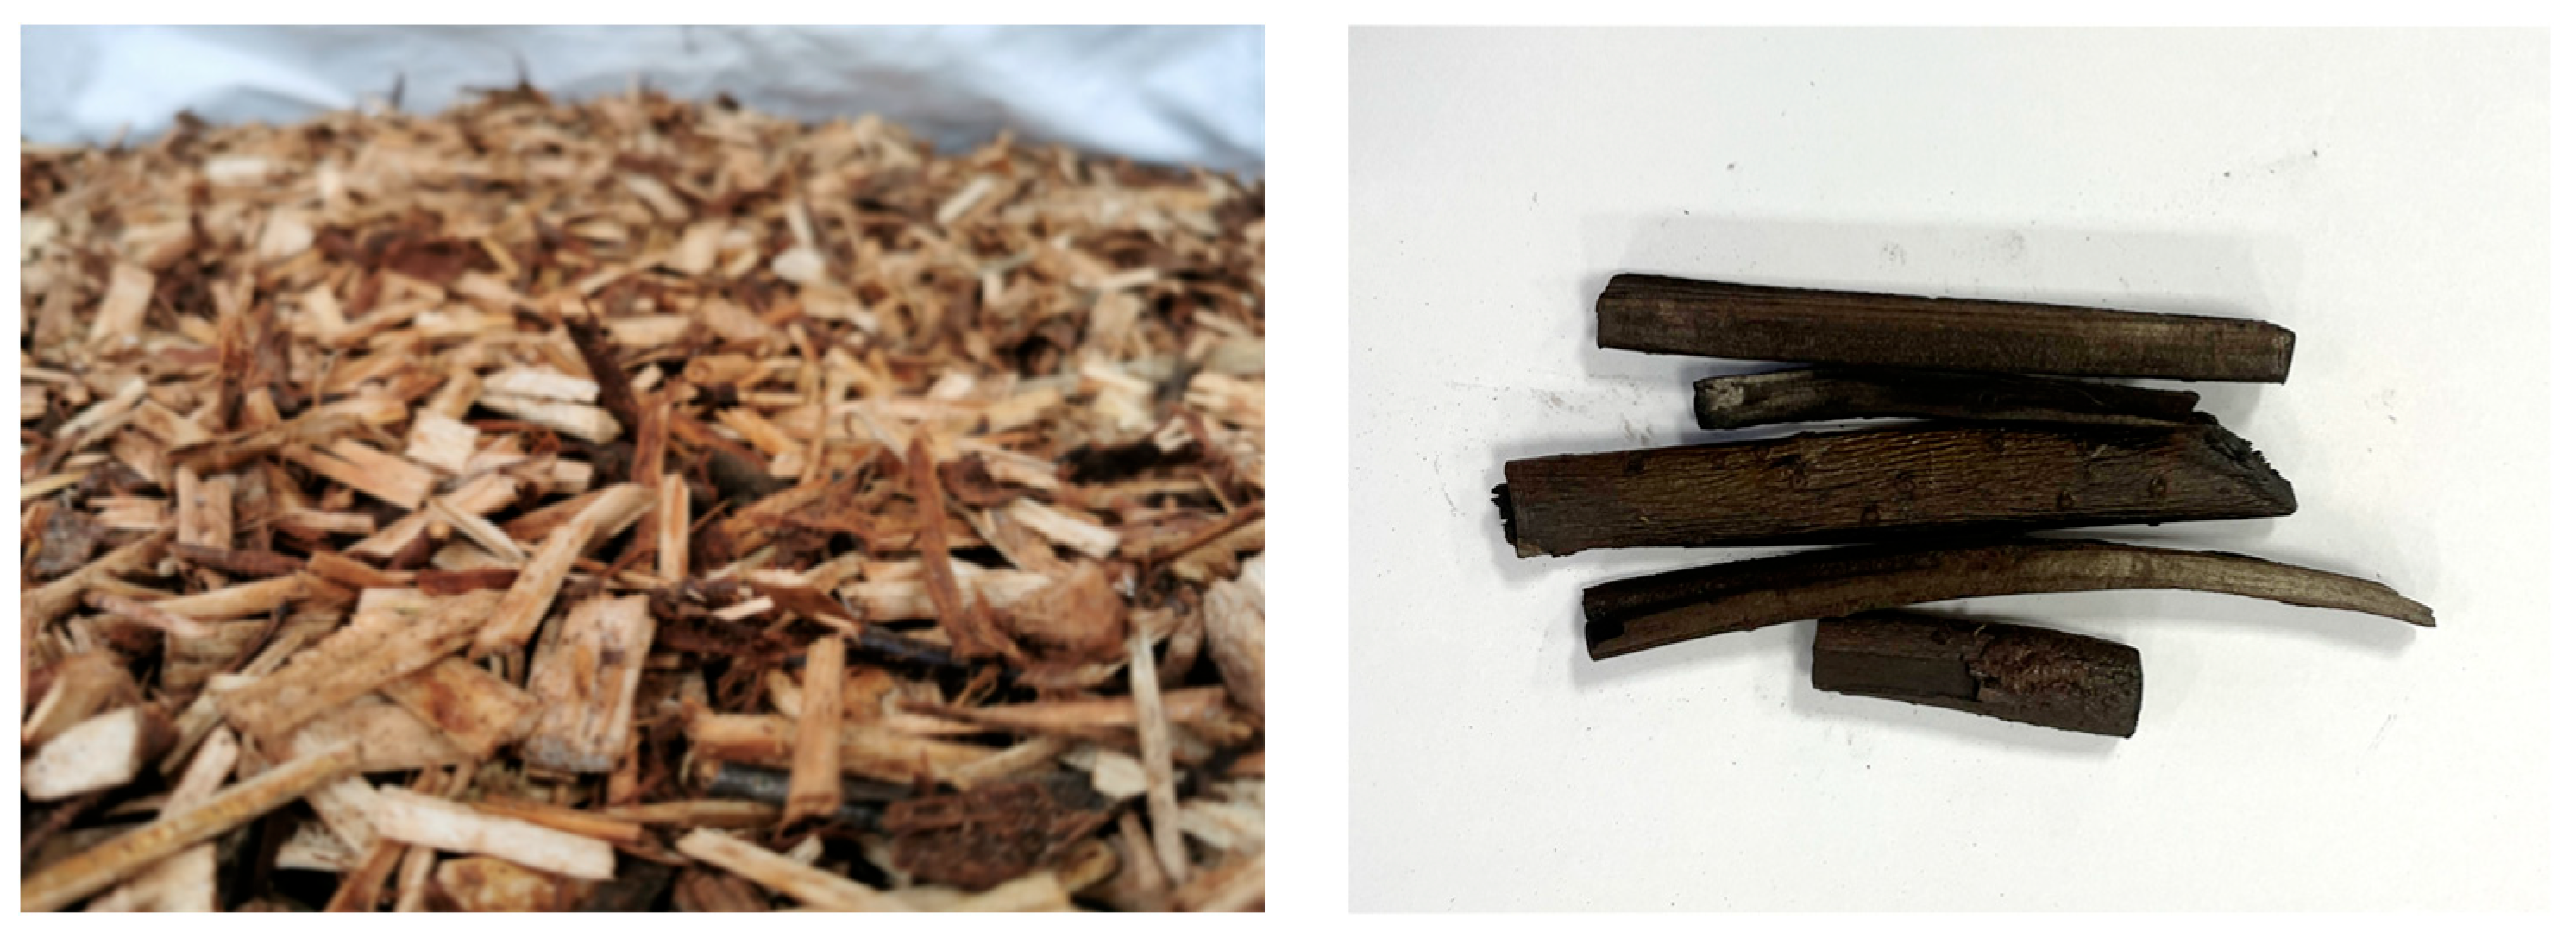
Figure 6) typically exhibits a mass loss of around 30%.
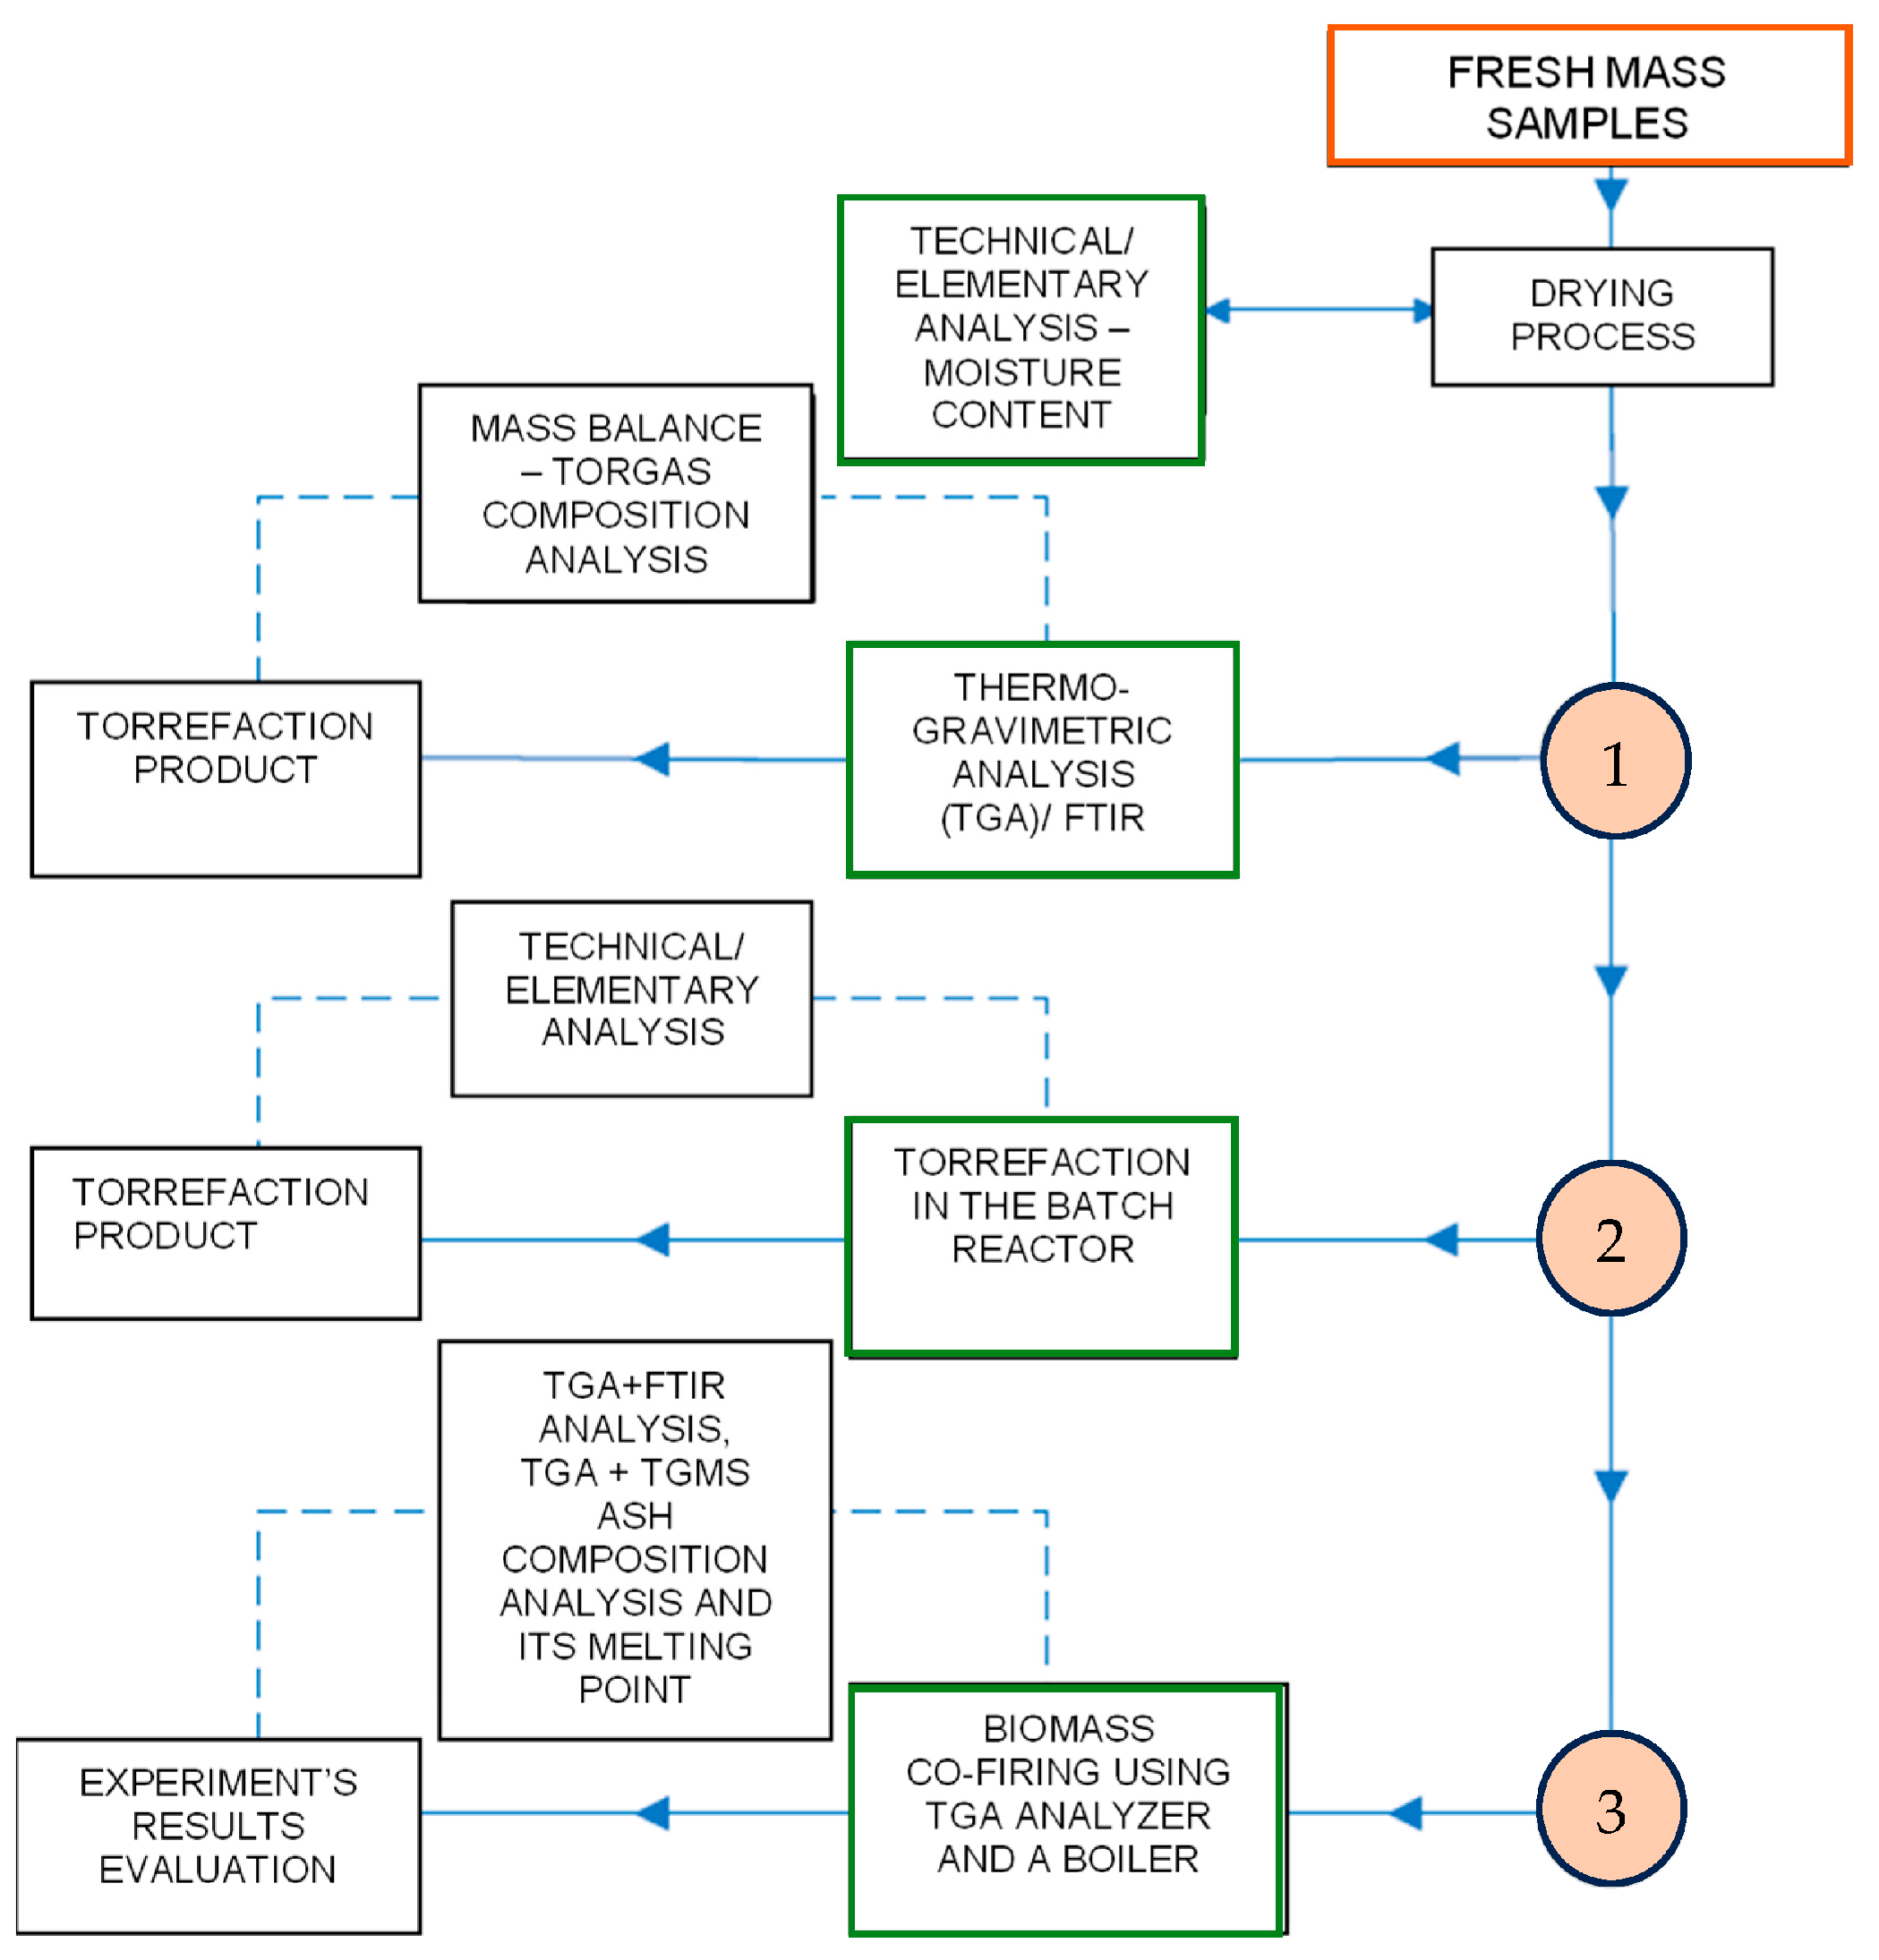
The schematic representation elucidating the procedural framework employed in this study is delineated in
Figure 7. The block diagram intricately illustrates the tripartite sequence encompassing distinct phases in biomass treatment. Commencing with the initial thermal gravimetric analysis (TGA), the investigation progresses to the second phase involving the torrefaction process conducted within a batch reactor. The culmination of this sequence is the ultimate step of co-firing torrefied biomass with coal. Each segment within the diagram encapsulates sub-blocks dedicated to the comprehensive analysis of process conditions and the resultant product quality assessment.
2.5. Co-Combustion of Raw Biomass and Torrefied Biomass with Coal
Willow biomass was divided into two groups: the first group comprised unprocessed biomass subjected only to the drying process, while the second group included biomass that underwent torrefaction in a batch reactor (which yielded the highest calorific value among the torrefied samples). These biomass samples were combined with hard coal from the Katowice mine in Poland in three proportions: 25% biomass and 75% coal, 50% biomass and 50% coal, and 75% biomass and 25% coal. Each mixture had a total weight of 20 mg. The samples were incinerated in a thermogravimeter chamber connected to a mass spectrometer (simulated in
Figure 8) under atmospheric air conditions at temperatures of 1000 °C. The mass loss over time was recorded every second, allowing for the creation of a TG mass loss curve. The mass spectrometer facilitated the determination of the composition of flue gases [
39] generated during the co-combustion process and the identification of the time and temperature at which individual components were most intensively formed. This method allowed for identifying and quantifying the specific compounds formed and emitted during the co-combustion process.
Mass spectra of various compounds are collected in the form of spectral atlases. A wide spectrum database is available through the American National Institute of Standards and Technology [
40].
Figure 8.
Combination of a thermogravimeter with a mass spectrometer simulated by Cui et al. (2014) [
41].
Figure 8.
Combination of a thermogravimeter with a mass spectrometer simulated by Cui et al. (2014) [
41].
3. Result and Discussion
3.1. TGA/DTG Torrefaction Results
Kinetic measurements for torrefaction were conducted using a Perkin Elmer Pyris 6 thermogravimeter equipped with an autosampler in conjunction with a TG apparatus. The samples analyzed had a weight range of 4 to 8 mg. The torrefied biomass analysis was performed under a continuous nitrogen flow of 20 mL/min. Ceramic crucibles were employed to contain the biomass particles, which were then positioned within the apparatus. Throughout the process, the weight of the torrefied biomass was continuously monitored using a TG thermobalance. The temperature during torrefaction ranged from ambient conditions at 20 °C to 300 °C, with heating rates spanning from 10 to 100 K/min. A dedicated computer program connected to the thermogravimeter enabled temperature tracking and facilitated the generation of mass loss profiles over time as a function of temperature.
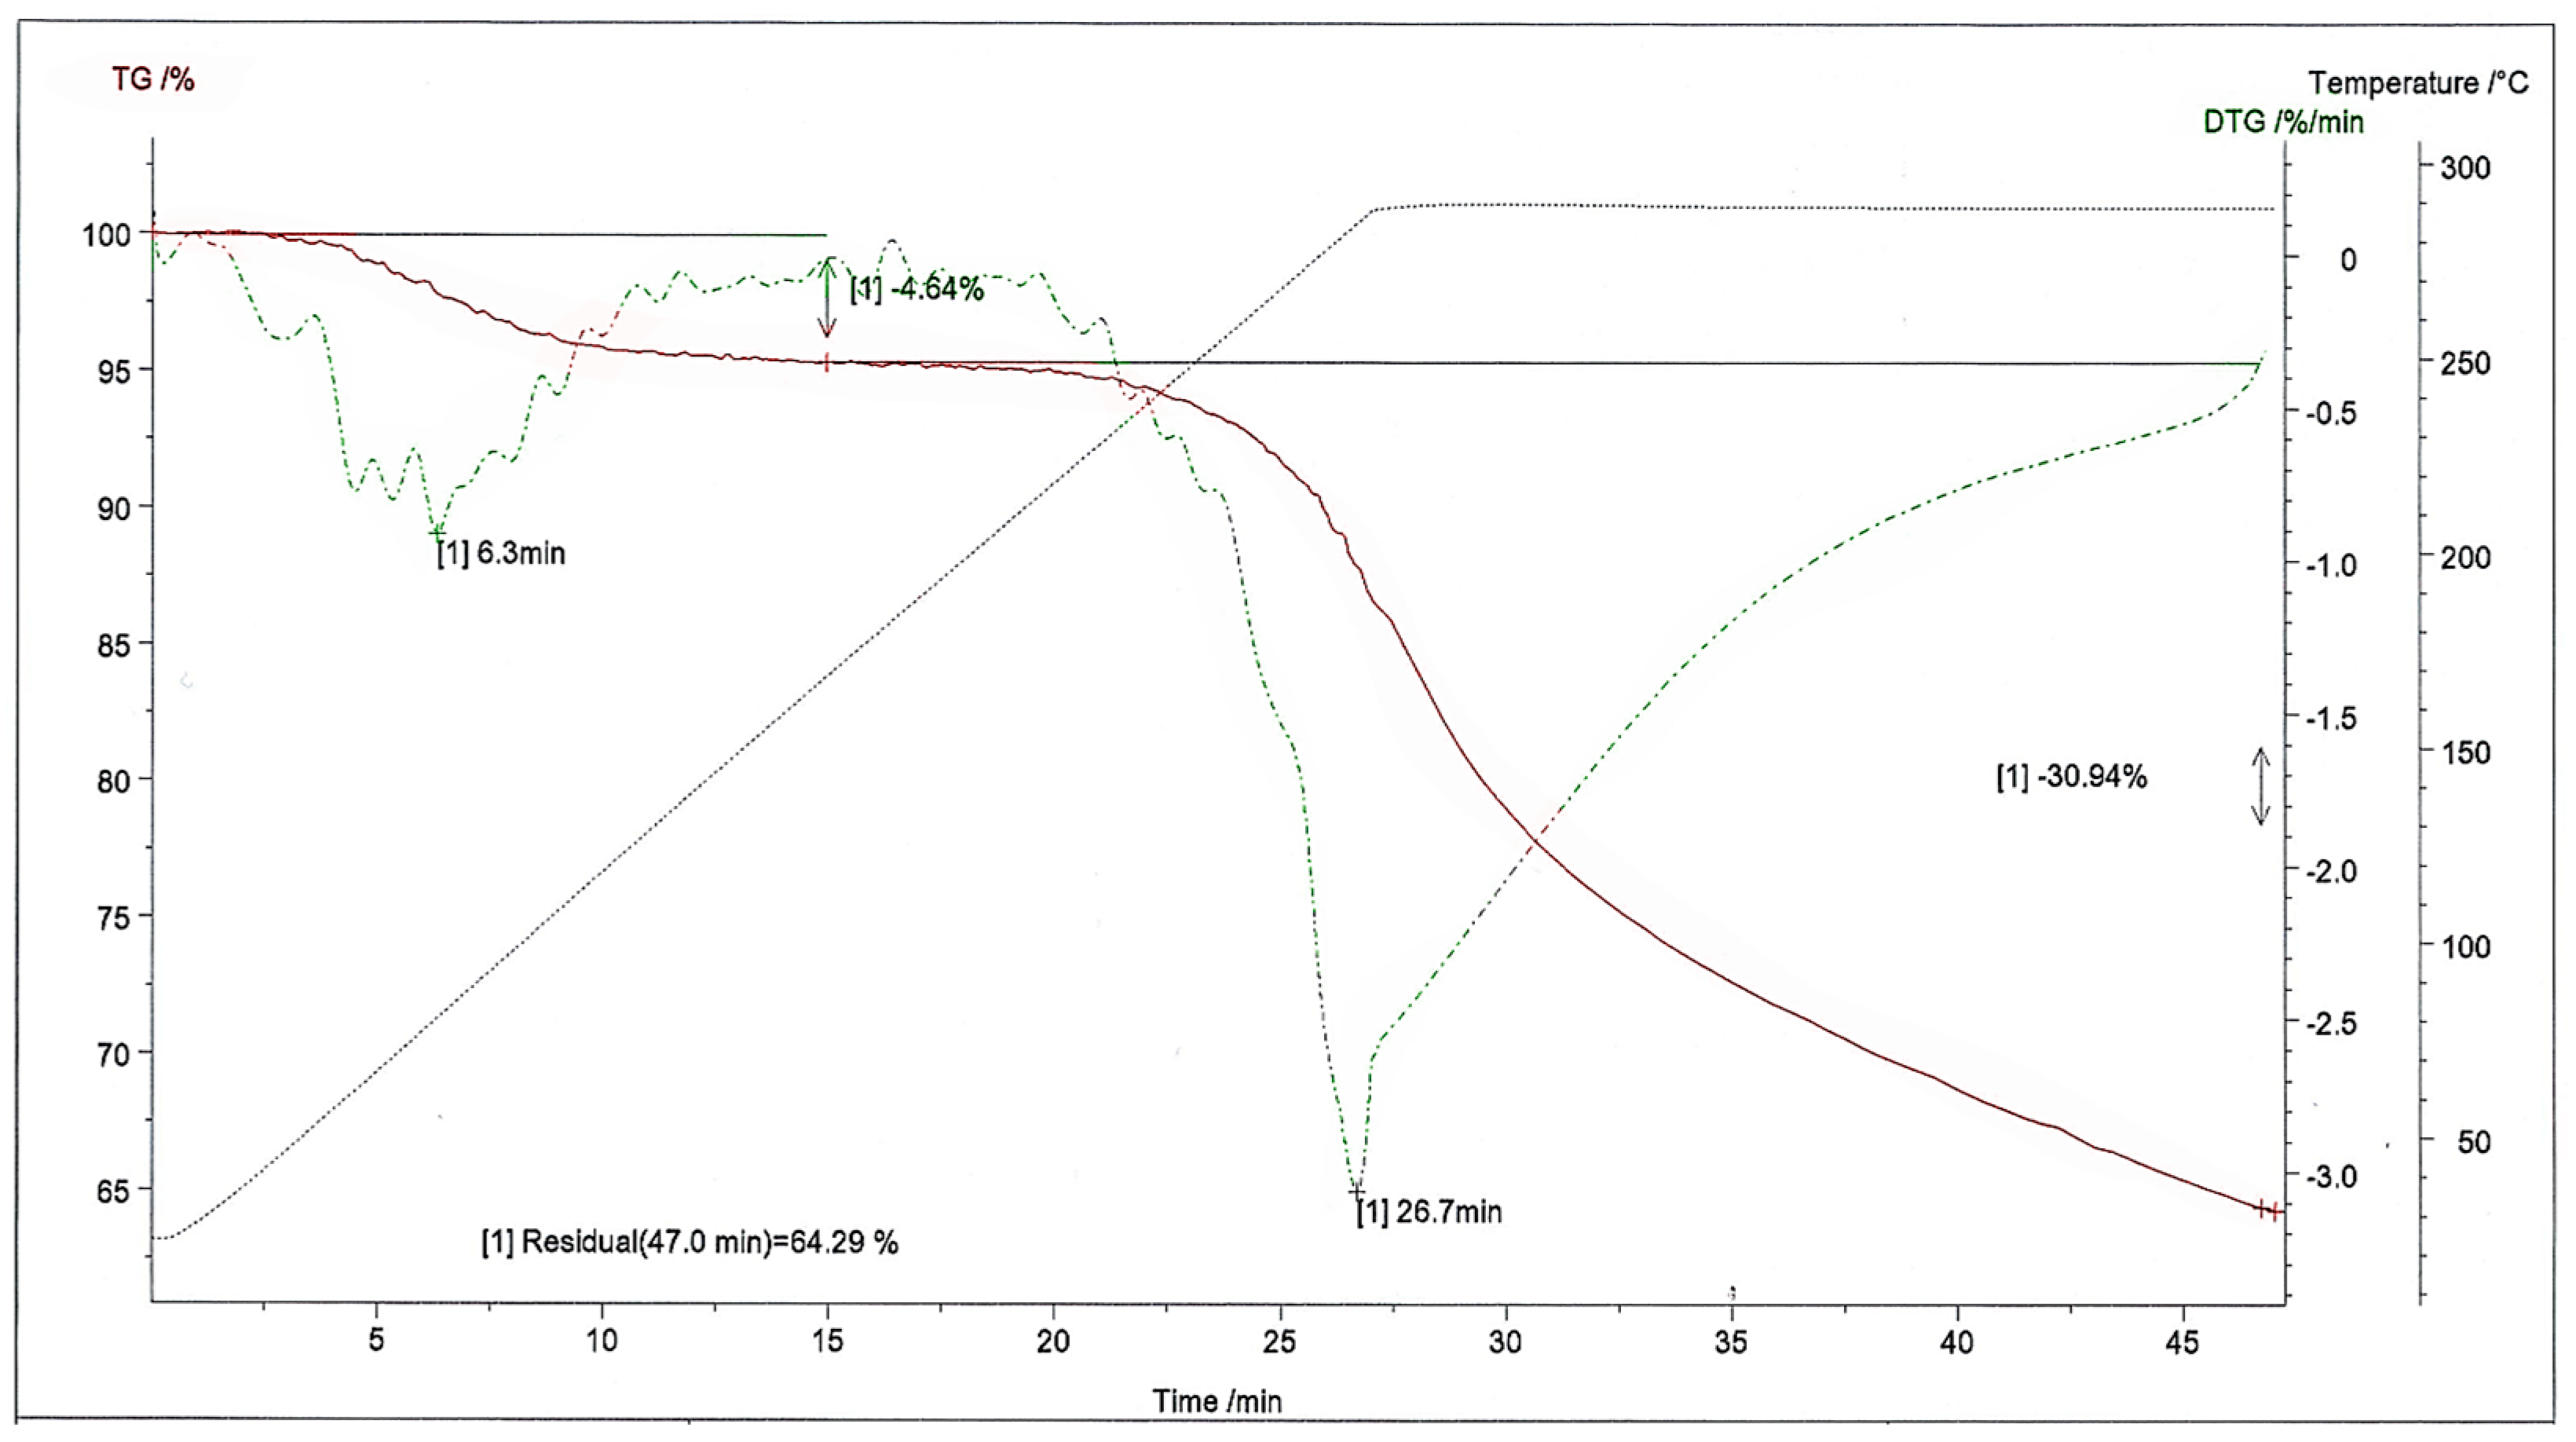
The torrefaction process exhibited three distinct stages of reaction. The first stage demonstrates the humidity loss of biomass. During the initial heating phase, the biomass is subjected to heat until it attains the specified temperature for the drying stage. Simultaneously, moisture within the biomass gradually undergoes evaporation towards the conclusion of this phase. The second stage (hemicellulose decomposition [
42]) demonstrated a substantial mass loss, around 5%, which increased as the temperature increased. The third stage primarily involved the decomposition of cellulose and the secondary charring of hemicellulose fragments. Conversely, the end of the third stage retained a lower mass, accounting for approximately 63% of the initial mass left from the original biomass, as shown in
Figure 9.
The high xylan content [
43] also explains the weight loss in the willow; although from a catalytic point of view, effects due to mineral substances may also play a significant role.
3.2. TG/FTIR Analysis
The formation of carbon dioxide can be attributed to the decarboxylation of acid groups present in the biomass. However, the origin of carbon monoxide cannot be solely attributed to dehydration or decarboxylation reactions. Existing literature [
44] suggests an elevated generation of carbon monoxide, possibly through reactions with carbon dioxide and water vapor, with the quantity increasing as the temperature rises. The involvement of mineral substances as catalysts in these reactions is plausible, especially since the torrefaction of willow produced a relatively larger amount of carbon monoxide than biomass containing significantly less mineral content. In the context of torrefaction, the composition of uncondensed gases in the product (with the sum of components totaling 100%) was investigated during willow torrefaction at 290 °C, with gas analysis conducted at 5, 15, and 30 min intervals.
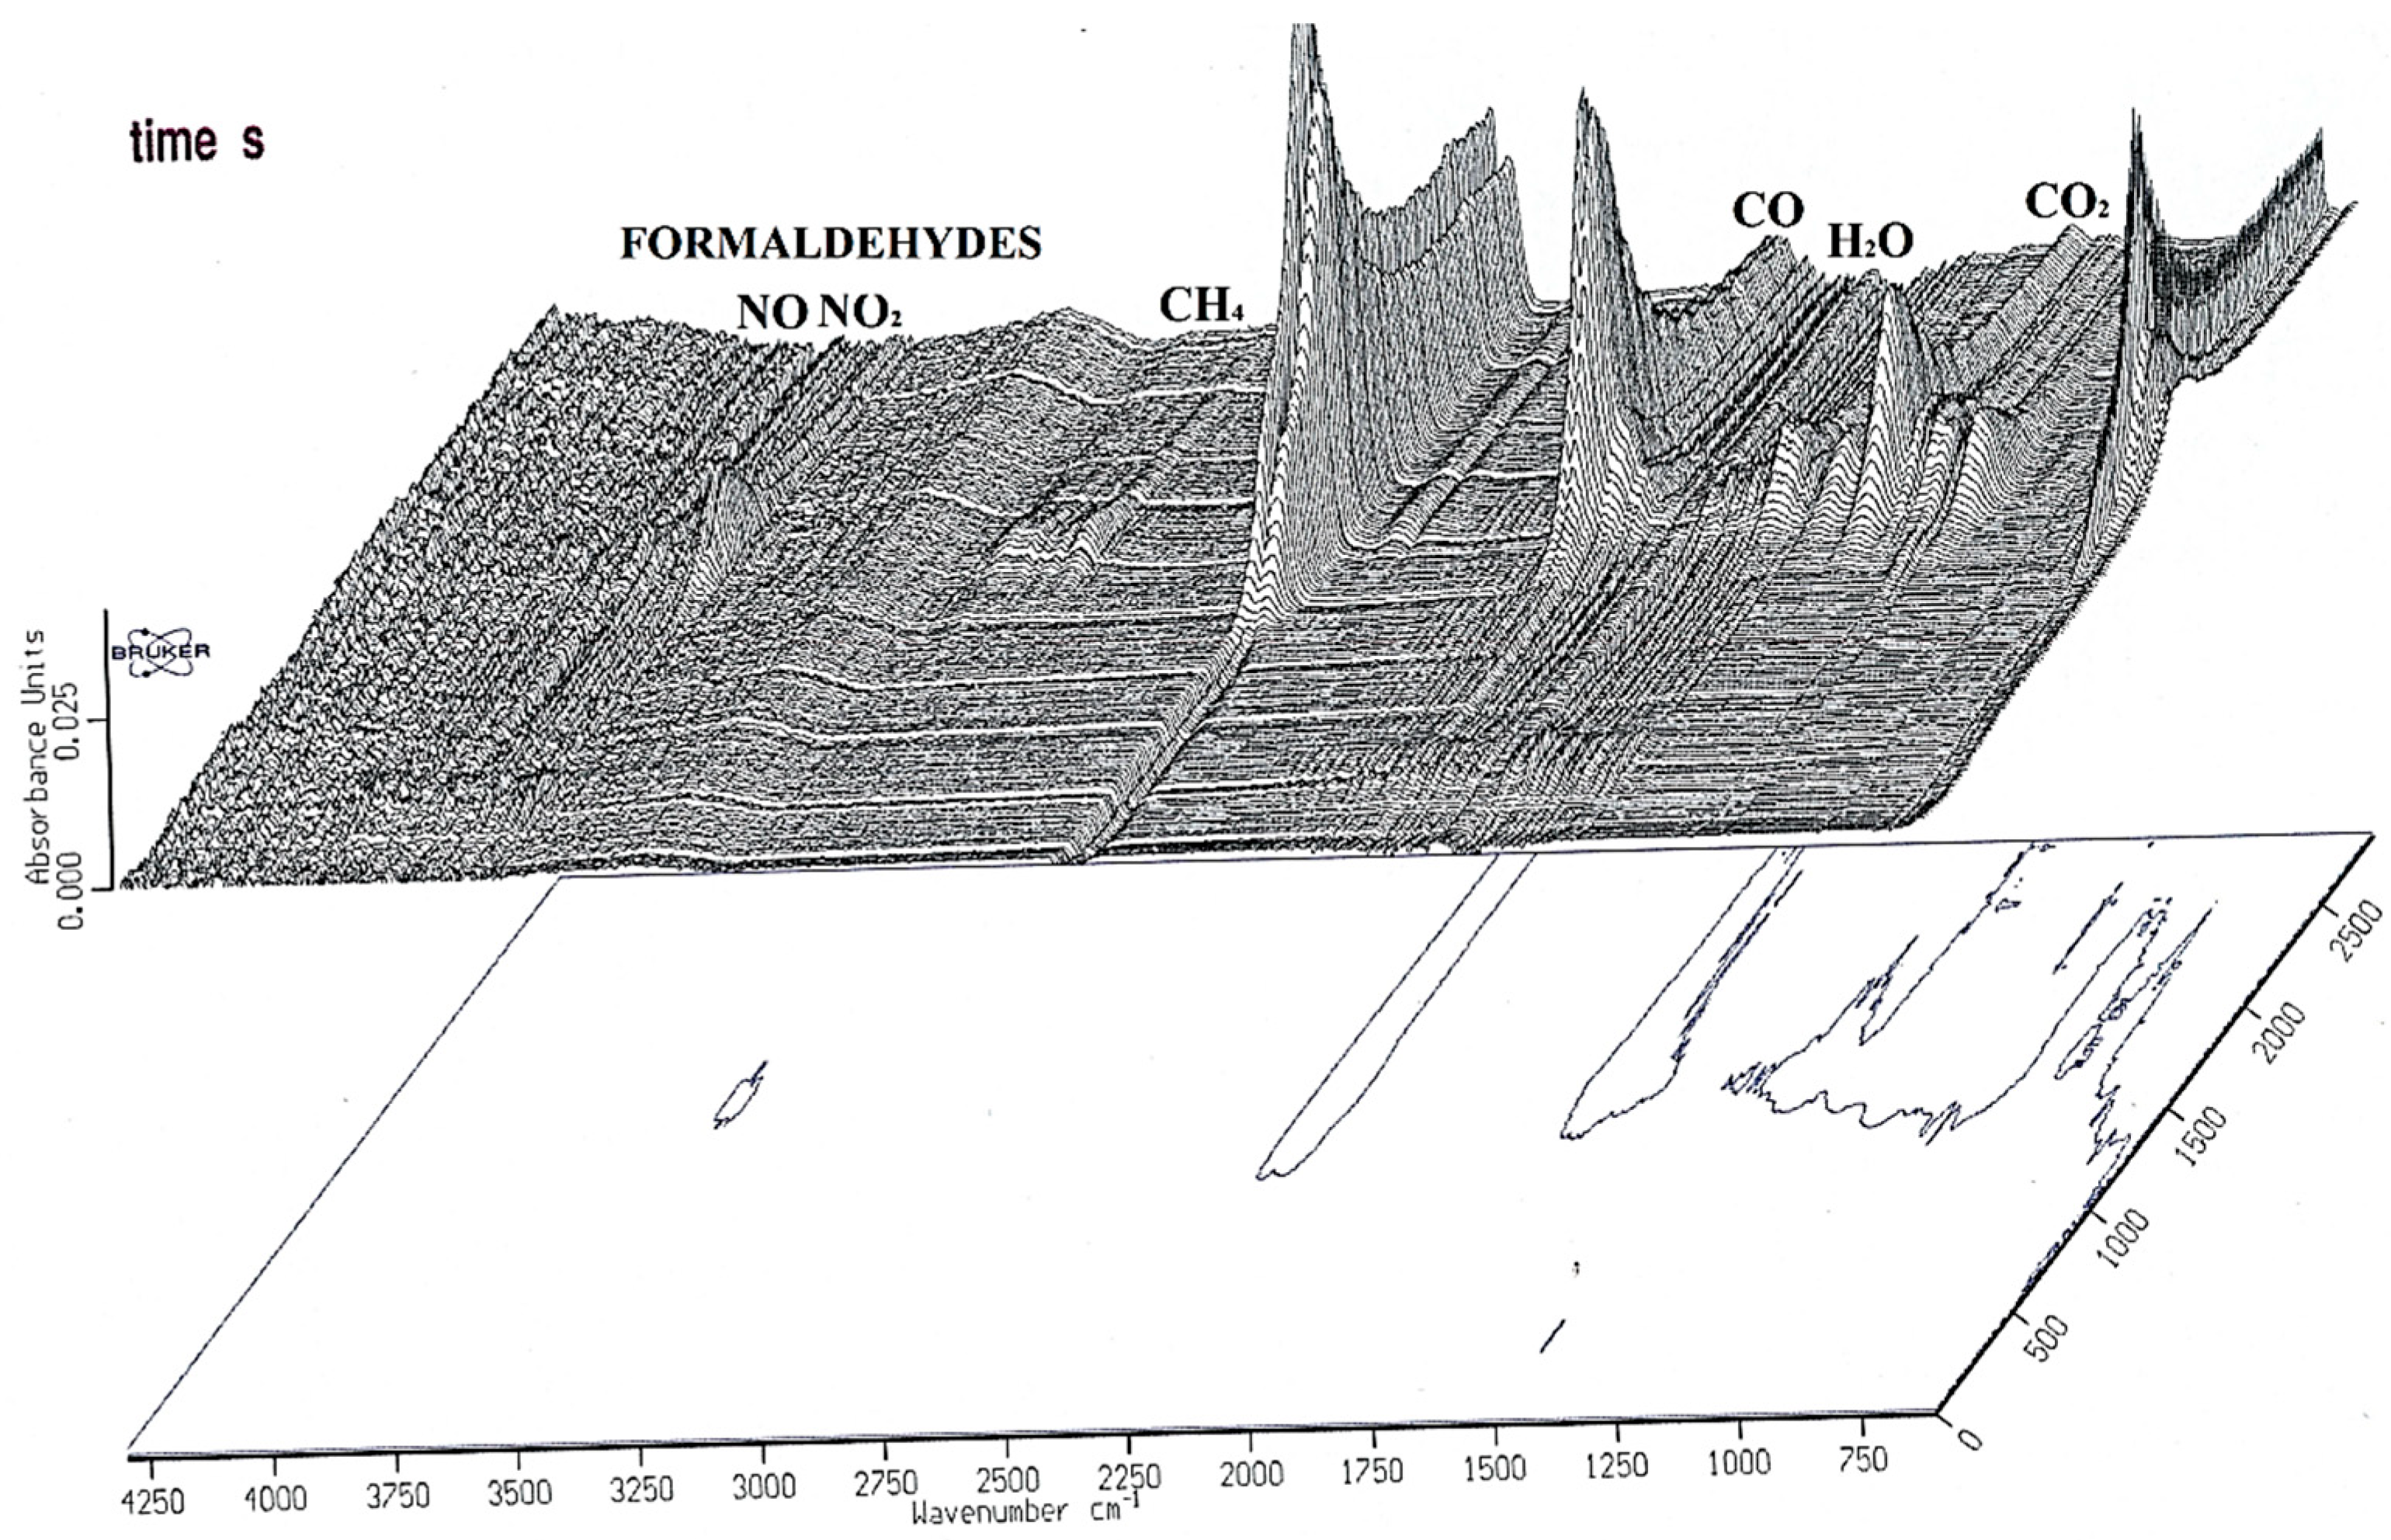
Figure 10 shows a discernible trend, where the carbon dioxide to carbon monoxide ratio decreased over time, aligning with the hypothesis that carbon monoxide forms due to secondary reactions. FTIR analysis unveiled distinct compounds liberated during the torrefaction of willow, encompassing H
2O, CO
2, CO, CH
4, and organic condensing constituents like formaldehyde acids. The resultant gas, known as ‘torgas’, constitutes a blend of flammable organic elements and non-combustibles, influenced by raw material moisture content and process variables. It is worth highlighting that torgas retains moisture, even when the raw material is dry. Around half of torgas’ mass consists of water, with an additional 10% being CO
2. The FTIR wavenumbers on the pick points were shown in
Table 1.
3.3. Kinetic Modelling
Figure 11 displays experimentally obtained mass loss curves for different temperatures in three-hour periods using willow as an example. This range covers the 3–10 min heating time required to elevate the sample from 200 °C to the final temperature of 300 °C (with a heating rate of 10 °C/min). The mass loss curves for willow were modeled in a series model, offering more accurate results than a global one-step reaction model. A demarcation time was identified at temperatures above 250 °C. From this temperature, secondary carbon decomposition reactions appeared to occur.
To determine the reaction order, we constructed a plot of the logarithm of the dimensionless weight field against time. The graphical determination of reaction rates (Kv1 and Kv2) revealed the significance of the first two reactions, emphasizing the initiation speed of the highly reactive hemicellulose decomposition. Of paramount importance in the torrefaction process is the speed of reaction initiation, particularly the decomposition of highly reactive hemicellulose, which should proceed largely unhindered. The subsequent reaction stage, representing cellulose decomposition and the second-stage carbonization reactions of hemicellulose products, extends over a longer timeframe, potentially necessitating the use of disproportionately large torrefaction installations and equipment.
The final coaling yield results from combining the constant yields in the first (Y
1) and second (Y
2) decomposition reactions. The first reaction yield is named Y
1, and the second reaction yield is named Y
2. Y
1 decreases from 88% at 230 °C to 70% at 300 °C, while Y
2 remains relatively constant at 41%. The first reaction represents the substantial weight loss observed in the second reaction and is attributed to the decomposition of various wood components, especially the cellulose fraction. This may occur in conjunction with the carbonization of residual hemicellulose elements. Another possibility is that the primary decomposition products of xylan, including acids, trigger the decomposition of the cellulose fraction. This hypothesis, proposed previously [
19], deviates from the perspective of others who view the biomass decomposition rate as the sum of individual component reactions [
45,
46]. This approach contrasts with models that treat the decomposition rates of biomass components as separate reactions.
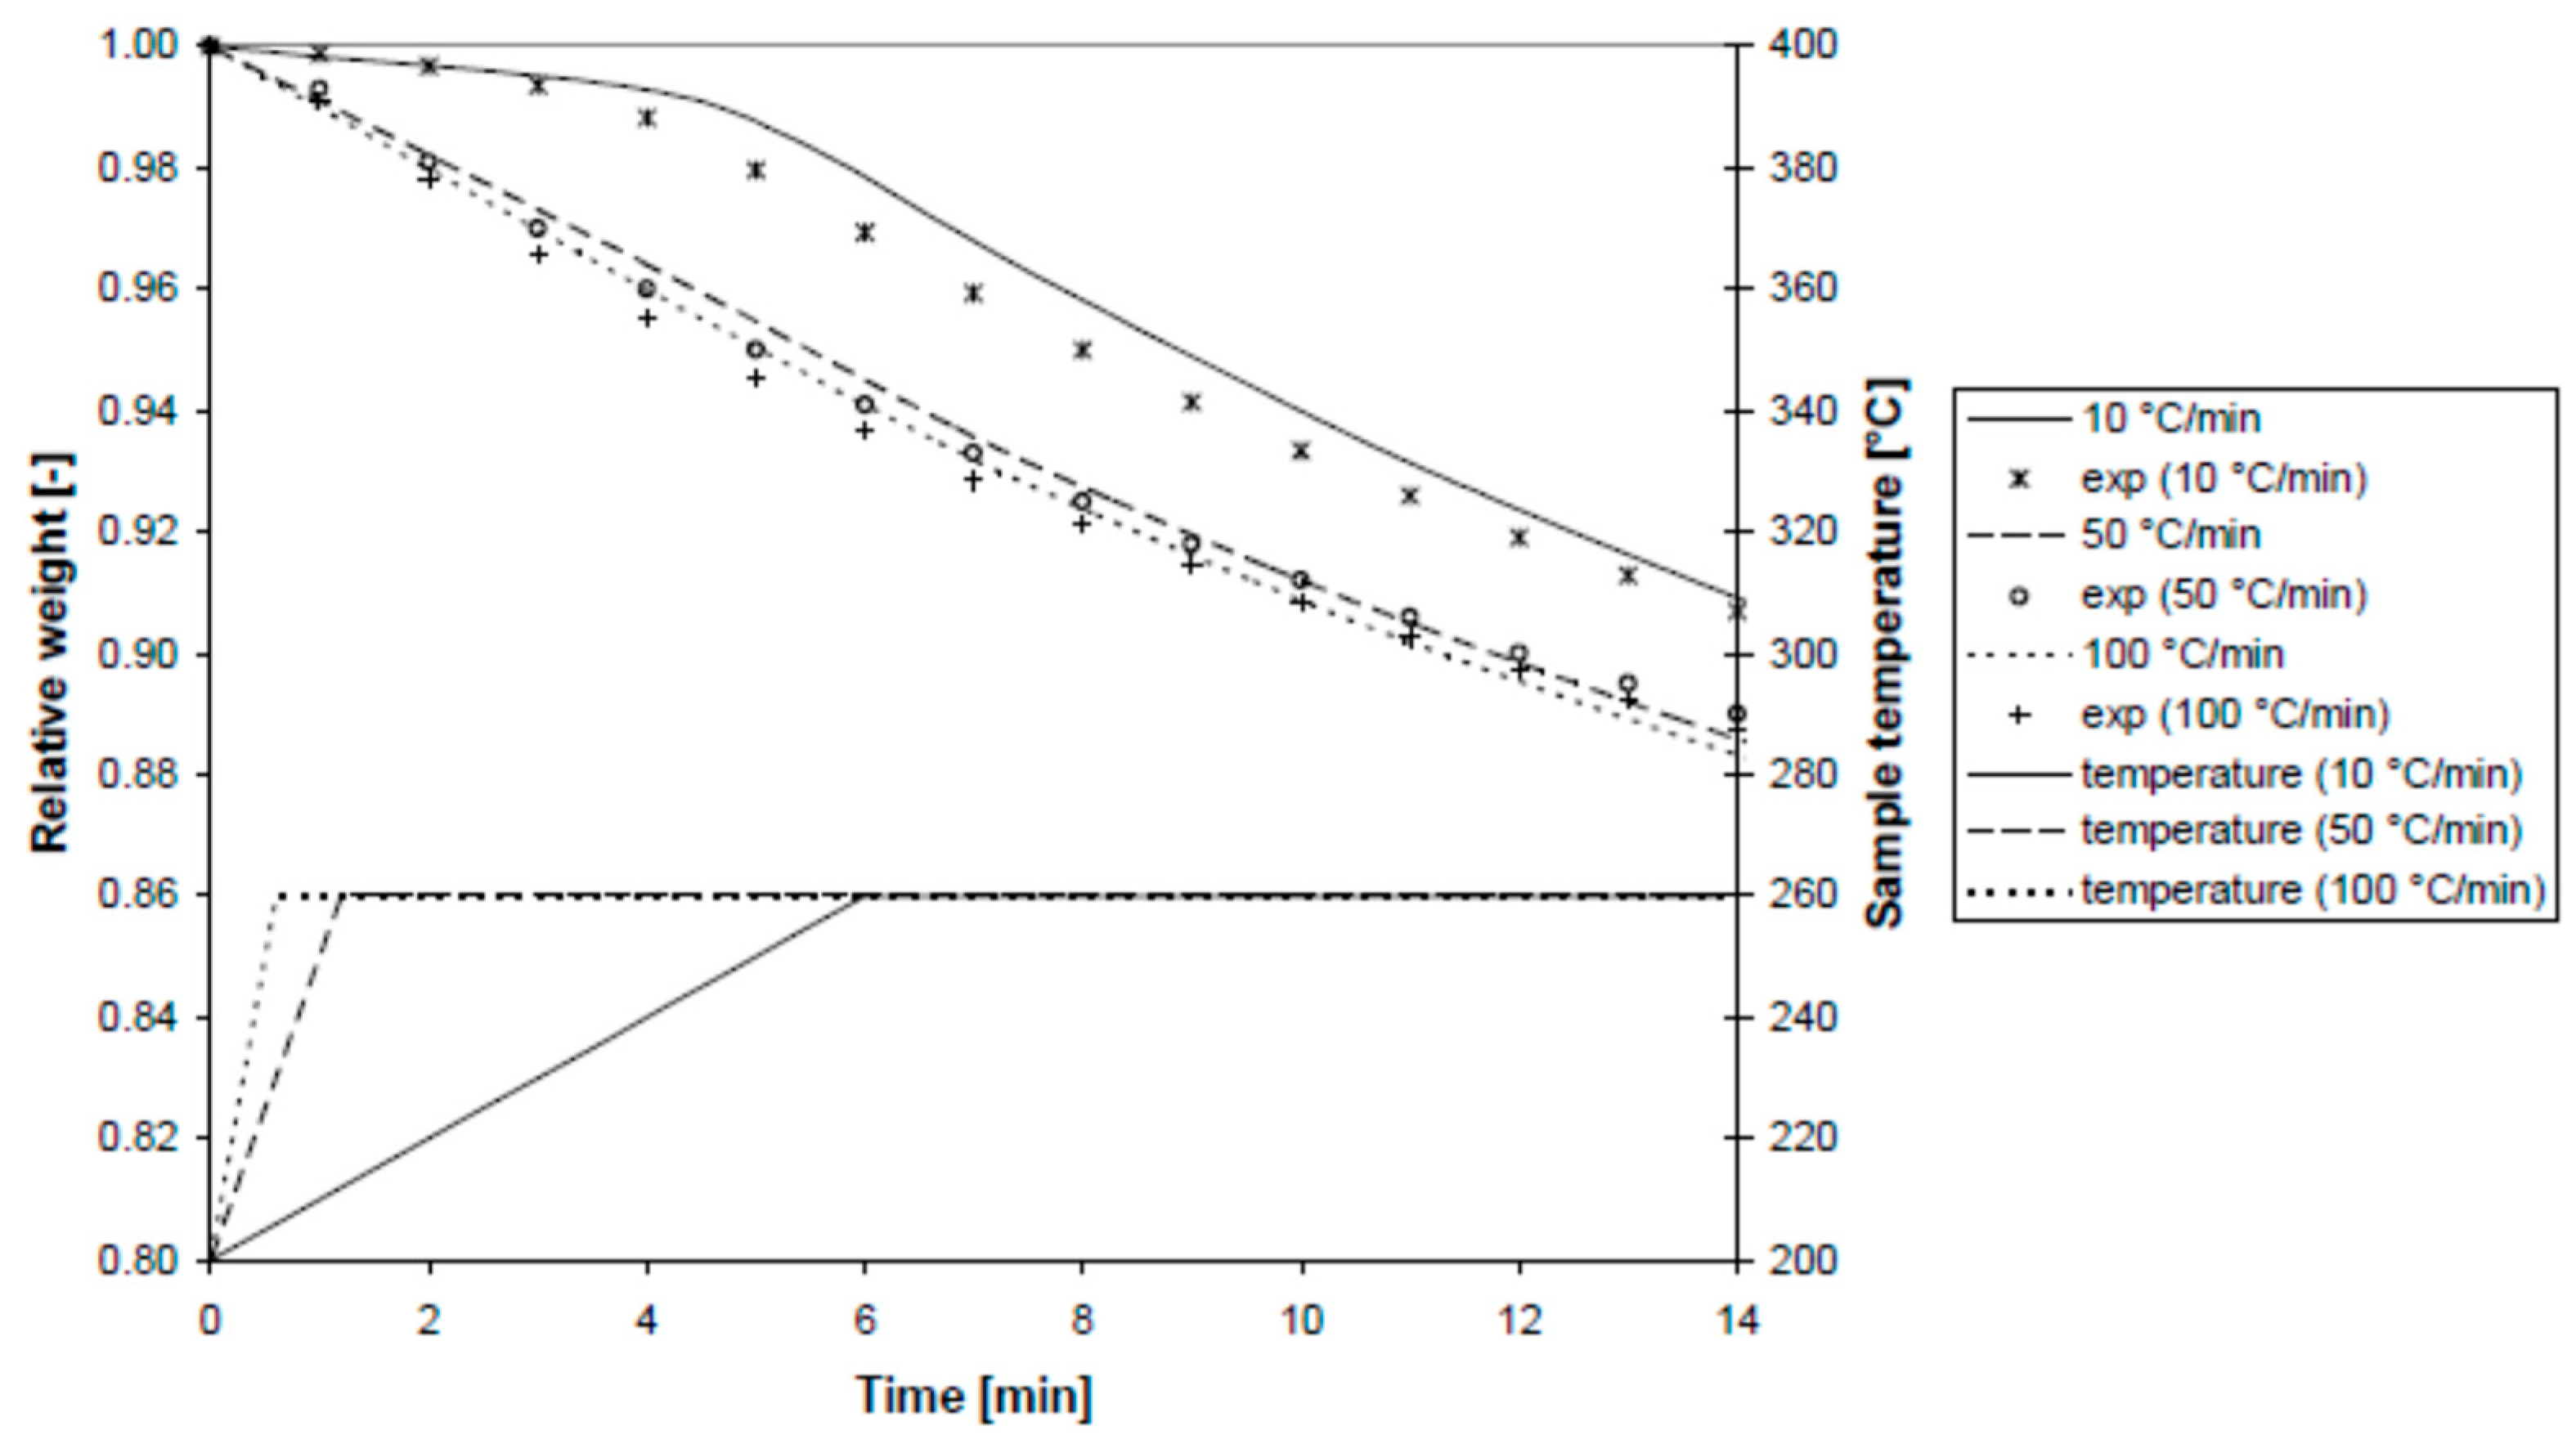
Figure 12 illustrates the sample temperature and relative mass over time at different heating rates (10, 50, and 100 °C/min) and a final temperature of 260 °C. The model was validated at heating rates up to 100 °C/min, accurately predicting weight loss in less than a minute with less than 1% mass loss.
Figure 13 depicts the time needed to achieve intermediate product B, showcasing a reduction from 3 h at 230 °C to 10 min at 300 °C. This abbreviated reaction time positions the torrefaction process as a viable industrial approach, enabling the design of relatively compact torrefaction reactors with high throughputs of approximately 10 kg/s. The maximum area of intermediate B, also depicted in
Figure 13, decreases with rising temperature due to the increased formation of volatiles at elevated temperatures. This observation holds particular significance if these volatiles consist of low-energy molecules like water vapor or carbon dioxide. The rapid cracking of cellulose at temperatures between 300 °C and 320 °C may lead to slag formation, making operation below 300 °C a recommended choice. The favorable selectivity of intermediate products diminishes with temperature, attributed to the higher activation energy of second-stage reactions compared to primary reactions.
A two-stage reaction model can precisely elucidate the reaction kinetics within the temperature range of 230 °C to 300 °C during biomass torrefaction. Notably, the initial stage progresses significantly faster than the subsequent step, allowing for temporal differentiation. The initial step encompasses hemicellulose degradation, while the subsequent step pertains to cellulose degradation. In the first stage, constant efficiency is higher compared to the second stage, ranging from 70% to 88% (with a decreasing trend as temperature rises), as opposed to 41%. This disparity can be attributed to the relatively lower xylan content, a reactive component in the hemicellulose fraction, found in hardwoods like willow, in contrast to cellulose [
47].
A comparative assessment of kinetic parameters during willow torrefaction reveals that xylan undergoes reactions approximately one order of magnitude faster in comparison to conventional leaf biomass, which typically contains up to 30% xylene. It is advisable to investigate kinetic reactions for softwoods such as reed and millet [
48]. Initial observations indicate that softwoods exhibit a notably lower reactivity, leading to the use of lower rate constants. Further research into the thermal degradation of model components, such as glucomannan, comprising 60% to 70% by weight of the hemicellulose fraction in biomass, is recommended to substantiate this finding [
49].
3.4. Batch Torrefaction Reactor
Batch reactor torrefaction aims to optimize the torrefaction process for specific biomass types by determining the ideal temperature and residence time, achieving superior energy density and calorific values with minimal mass loss. Willow was tested at different temperatures during torrefaction: 230 °C, 240 °C, 250 °C, and 260 °C. Previous literature indicates that torrefaction typically takes up to 3 h at 200 °C and as little as 10 min at 300 °C [
50,
51,
52].
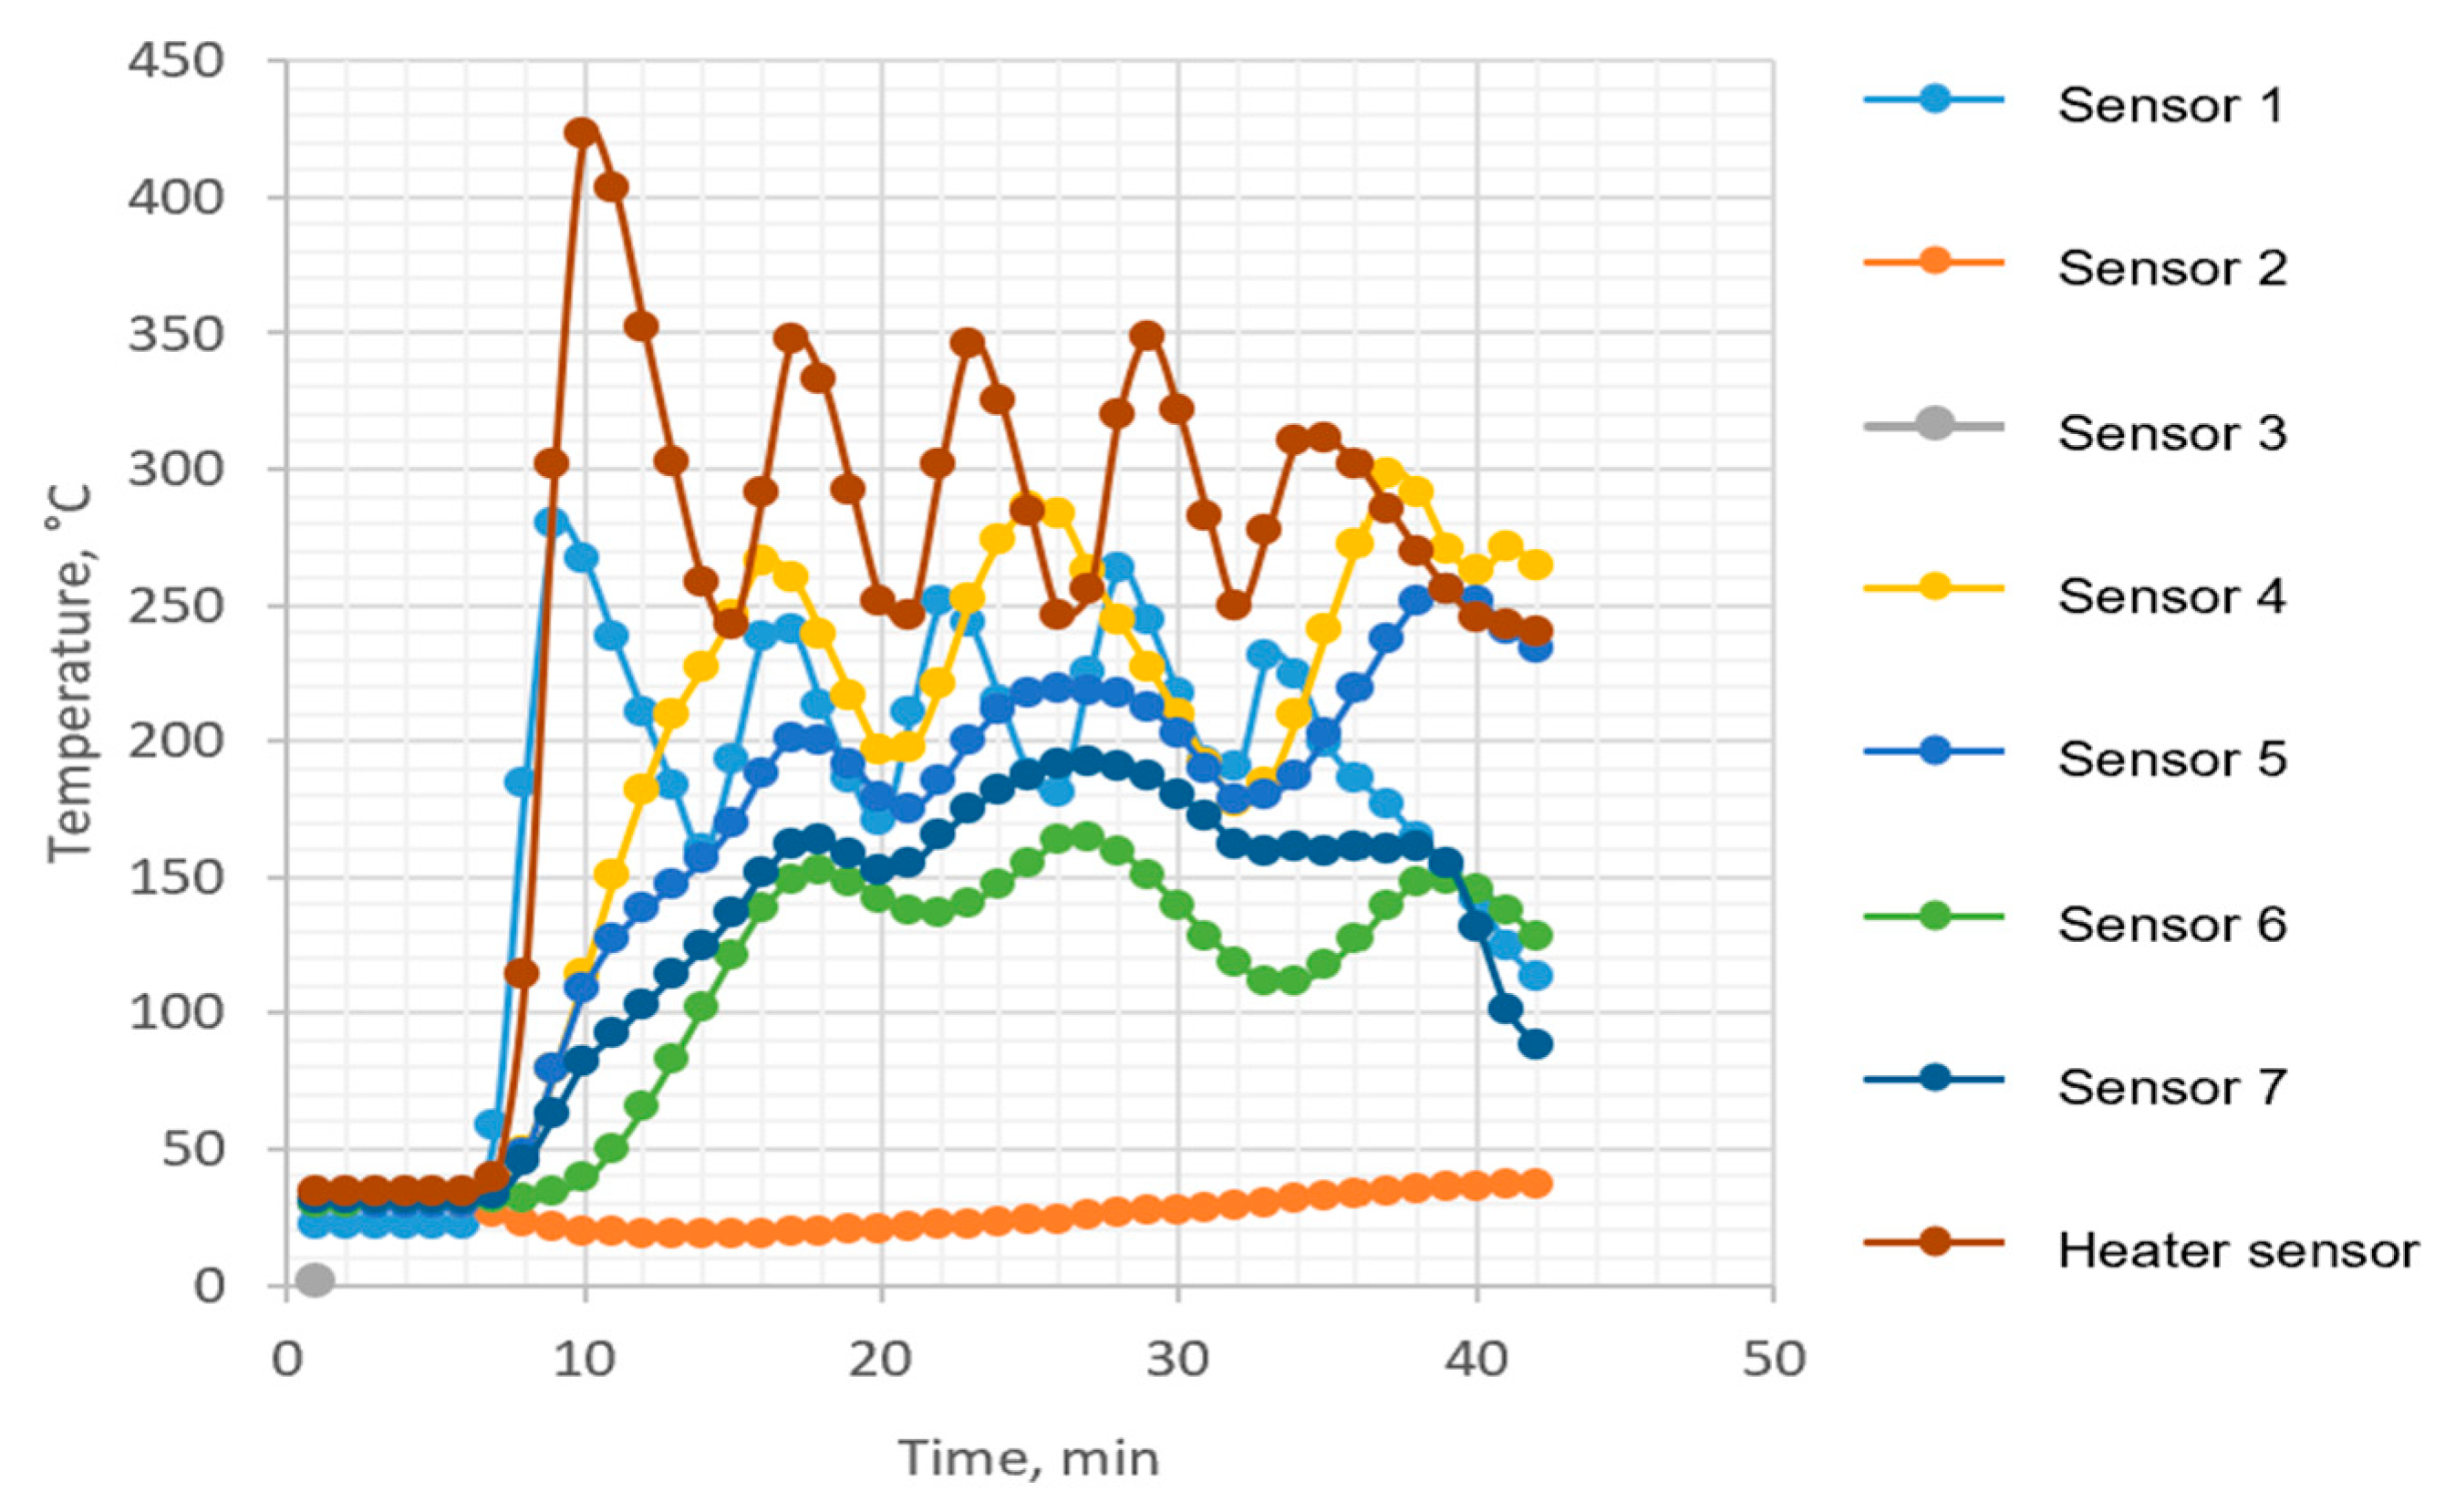
Figure 14 shows the temperature regime inside the torrefaction reactor measured by the temperature controllers CT4, CT5, and CT6 at different points for the whole period of torrefaction itself with the preheating period. The location of temperature sensors may be followed in
Figure 3. Challenges encountered during the research on batch reactor-based torrefaction primarily centered on three aspects. First, the initial heating of the reactor structure led to notable energy losses due to heat radiation to the surroundings. Second, the absence of a suitable control system for the electric flow air heater resulted in suboptimal temperature control for the nitrogen. Lastly, though temperature sensors were correctly positioned within the batch reactor, their locations were not optimal.
It is worth noting that these challenges, while significant, did not compromise the accurate outcomes of torrefaction production or the determination of optimal conditions. Specifically, temperatures exceeding 200 °C and residence times within the bed for torrefaction of the examined energy plant varieties remained unaffected by the issues at hand.
The mass loss at 290 °C with a 15 min residence time was approximately 36–37% in thermogravimetric torrefaction analysis. Conversely, batch reactor operation revealed higher mass losses at lower temperatures, as indicated in
Table 2. This disparity primarily stems from variations in residence times, highlighting the significant influence of residence time on mass loss. Increased residence times correspond to higher mass losses.
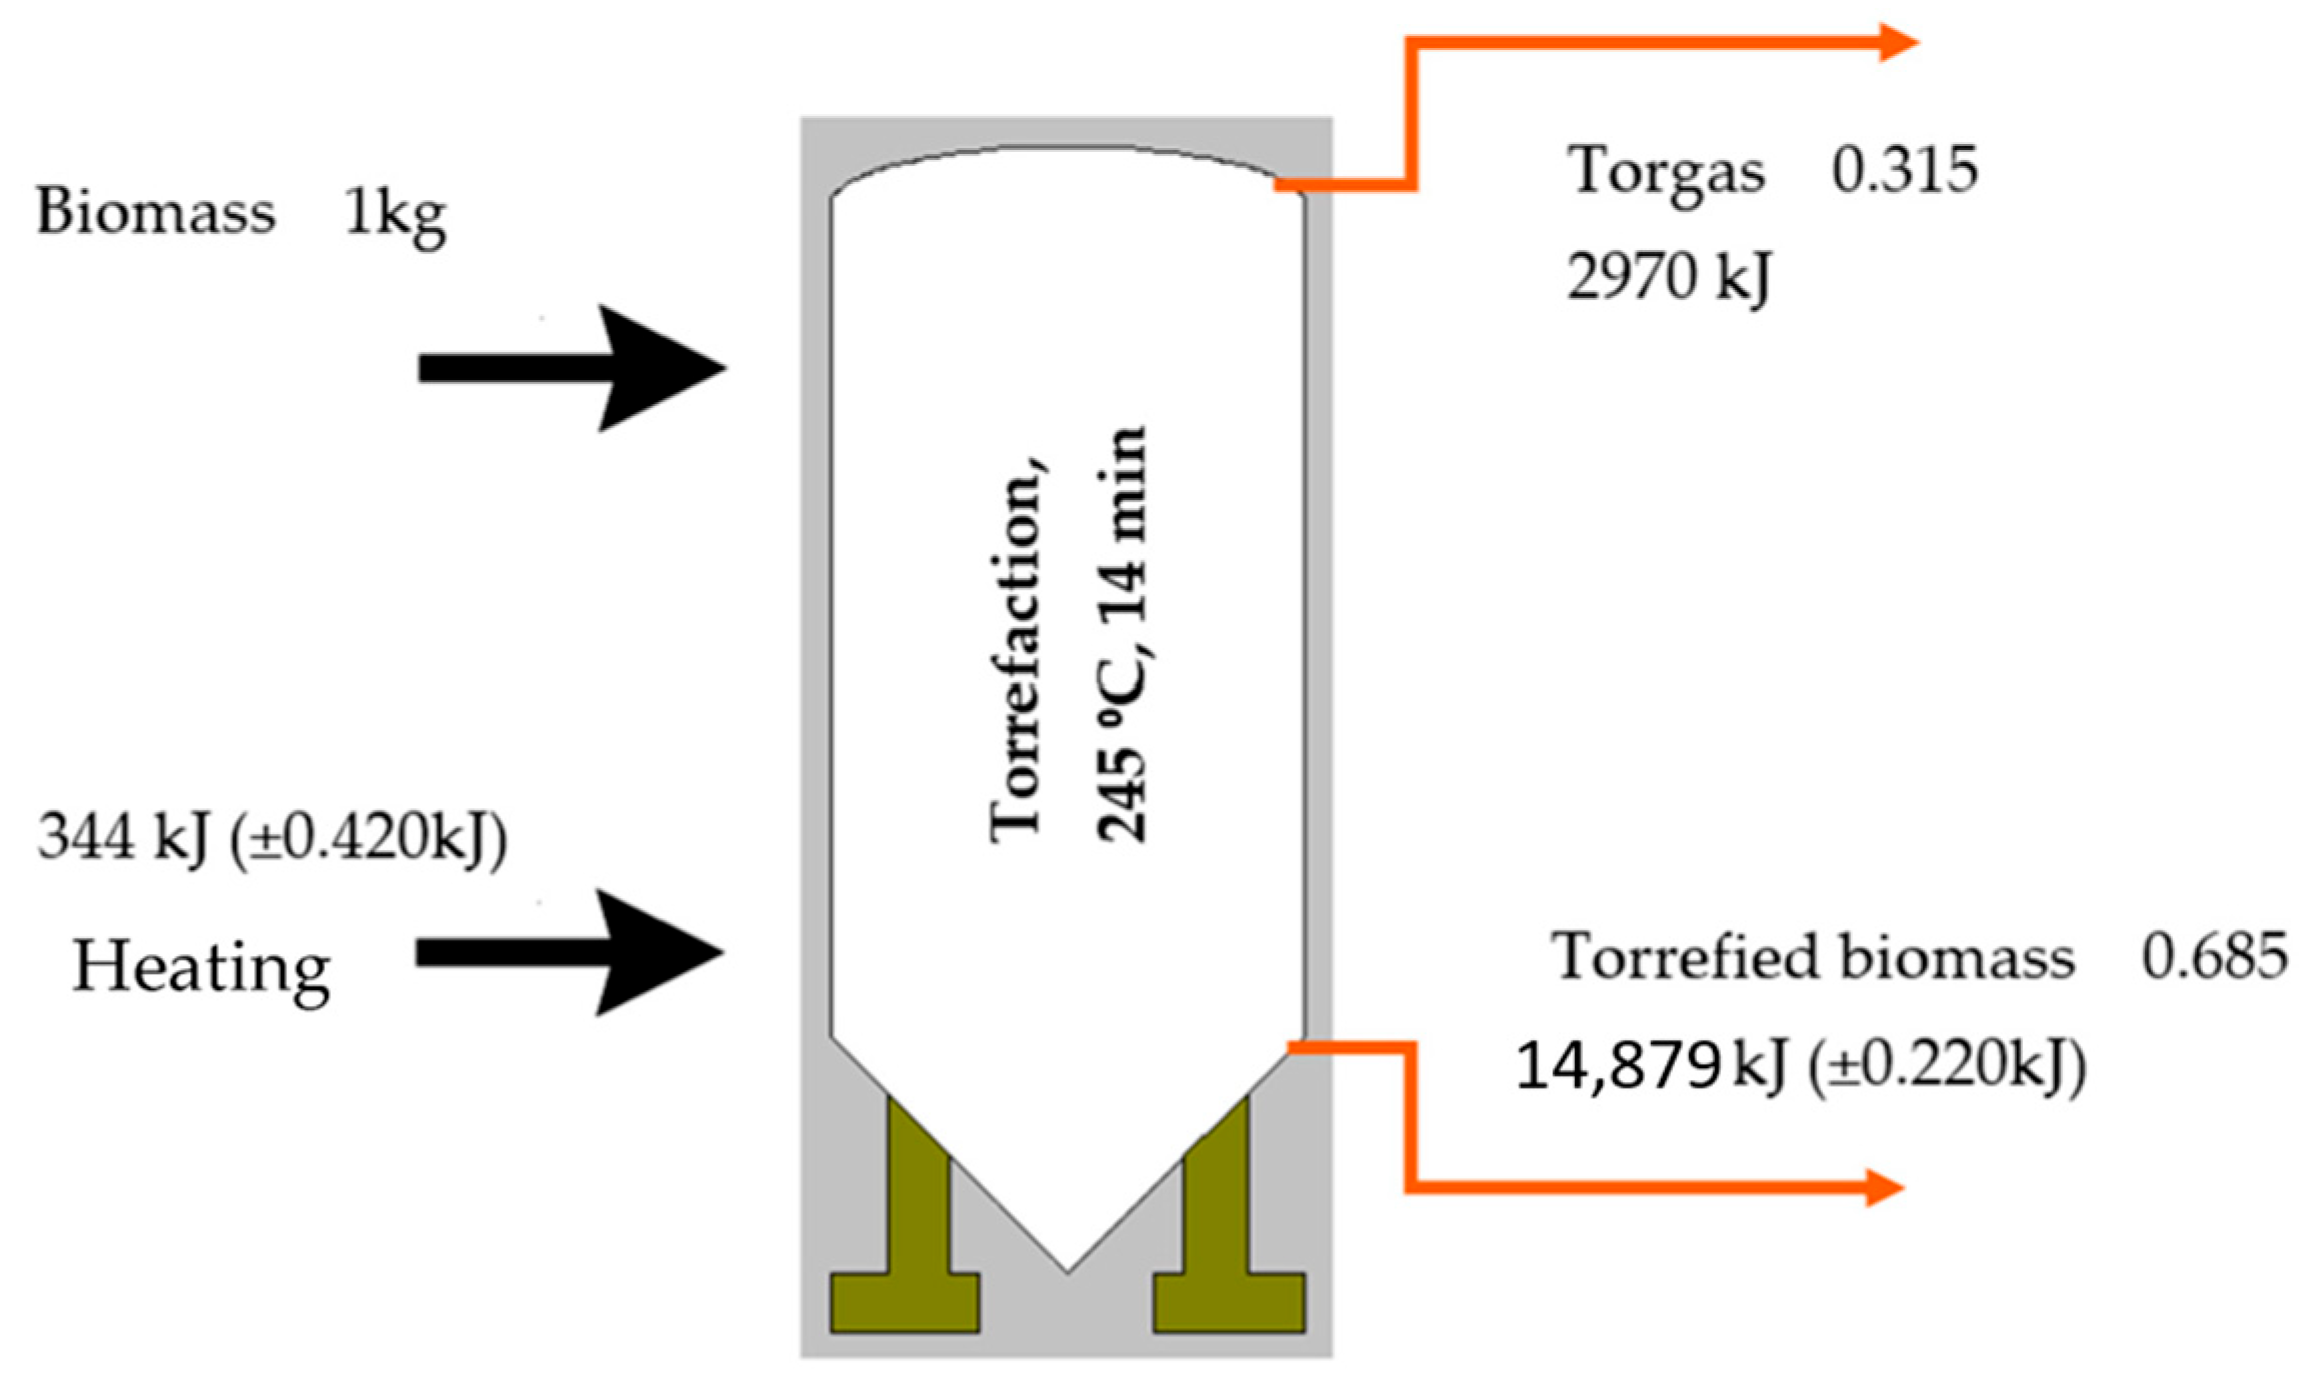
Figure 15 depicts the mass and energy equilibrium of the willow carbonization process within a batch reactor under a nitrogen atmosphere. It was calculated that 344 (±0.420) kJ is the necessary energy amount to preheat the torrefaction reactor. The torrefied biomass (product) energy has been calculated by the retained mass, and the higher heating value of the product was achieved. The same calculations were made for torgas. The authors could show the energy loss according to the system heating energy (preheaters) and mass loss (torgas and its energy content). Through meticulous energy and mass balance analyses, the requisite energy for the torrefaction process to yield biofuel from willow has been determined, considering a 31% mass loss and 10% energy loss (344 kJ) in the overall process perspective.
The basic principle of quantitative CHNS analysis is samples’ high-temperature, oxidative combustion. Gaseous combustion products are purified, separated in absorption columns into individual components (nitrogen, carbon dioxide, sulfur dioxide, water vapor), and detected in the measuring cell of the TCD detector (thermal conductivity detector).
The torrefied wood product exhibits a brown-black hue, reduced volatile matter content, and an enhanced calorific value of 22.41 MJ/kg [
53] (following a 14 min reaction at 245 °C), in contrast to the 18.67 MJ/kg of untreated willow where we may say a 17% increase in energy density was observed in our previous study. Jonas et al. 2012 achieved a 22.4 MJ/kg higher heating value for a 10 min torrefaction process of willow as shown in
Table 3 [
54]. These properties make it well-suited for utilization as a fuel in gasification and/or co-combustion processes. Biomass samples torrefied at temperatures above 250 °C exhibit minimal moisture content (<0.1%). The volatile content of willow decreases from 81–83% to 70–75% during torrefaction. The atomic O/C ratio in the solid product declines from about 0.70 to 0.52–0.60, with a more pronounced reduction at higher temperatures and longer reaction times.
Energy assessment of biomass adheres to conventional solid fuel evaluation criteria, including calorific value, moisture, sulfur, ash content, volatile matter, and fragmentation degree. The calorific value and heat of combustion are fundamental thermophysical parameters for solid biofuels. Calorific value is primarily influenced by moisture and chemical composition [
55]. The calorific value of solid biofuels varies, ranging from 5 to 8 MJ/kg for freshly cut biomass with a moisture content of 50–60% to 15–18 MJ/kg for biomass that has undergone a drying process, resulting in a moisture content of 10–20% [
56]. Completely dried biomass can reach a calorific value of 20 MJ/kg. One disadvantage of biomass is its high moisture content of up to 50% [
57]. Another critical issue is its variability, which depends on the seasoning period and the type of plant, leading to low and fluctuating calorific values. Weather conditions before and during the harvesting of energy crops from arable fields significantly affect their moisture content [
58].
With a moisture content of 50% in biomass, its combustion is possible only in specialized boilers, and it is profitable only in combined heat and power plants and heating plants of medium and high capacity. To carry out the biomass combustion process in low-power boilers for central heating, the biomass should be dried to a value below 15%. From an economic point of view, it is profitable to use unprocessed biomass only a short distance from the place of production. Poland does not have its own standards defining the quality of biomass used for energy purposes. “Noble biomass”, a term commonly used by power engineers, refers to pellets made from various types of biomass and is defined based on compliance with the German standard DIN 51731 [
59], which applies to natural wood pellets [
60].
3.5. Co-Combustion of Biomass with Coal
During the co-combustion process of biomass that has been subjected to a previous torrefaction process using a batch reactor with hard coal and biomass not subjected to the torrefaction process, attention was focused on the ignition temperature at which the first significant loss of mixture mass occurs over time, exhaust gas composition, sample combustion degree and overall kinetics of the co-combustion process. The biomass samples that were characterized by the most optimal degree of coalification and increased calorific value with optimal mass loss were selected for the experiment as residence time 15 min, Taverage = 244.67 °C, weight loss 30.4%.
The objective of the experiment was to compare the co-combustion processes of untreated biomass and coal with those of biomass subjected to torrefaction while elucidating the mechanisms involved and highlighting the benefits of torrefaction for the co-combustion of energy crops with coal. Before the experiments, each sample underwent elemental and technical analyses to determine their physicochemical properties and assess the variations in carbonization levels resulting from torrefaction.
When increasing the biomass fraction in coal mixtures, the initial combustion stage exhibits higher mass loss (up to 40%) during ignition, while the subsequent stages show more minor losses (20–30%). On the contrary, mixtures dominated by biomass (25% coal) exhibit milder initial (15%) and second-stage (15%) losses, with a substantial 80% loss occurring in the third stage during high-temperature ignition.
When comparing the co-combustion process of willow with hard coal through the analysis of the mass loss curve during thermogravimetry (TG, %) and the derivative thermogravimetry (DTG, %/min), the following observations were made:
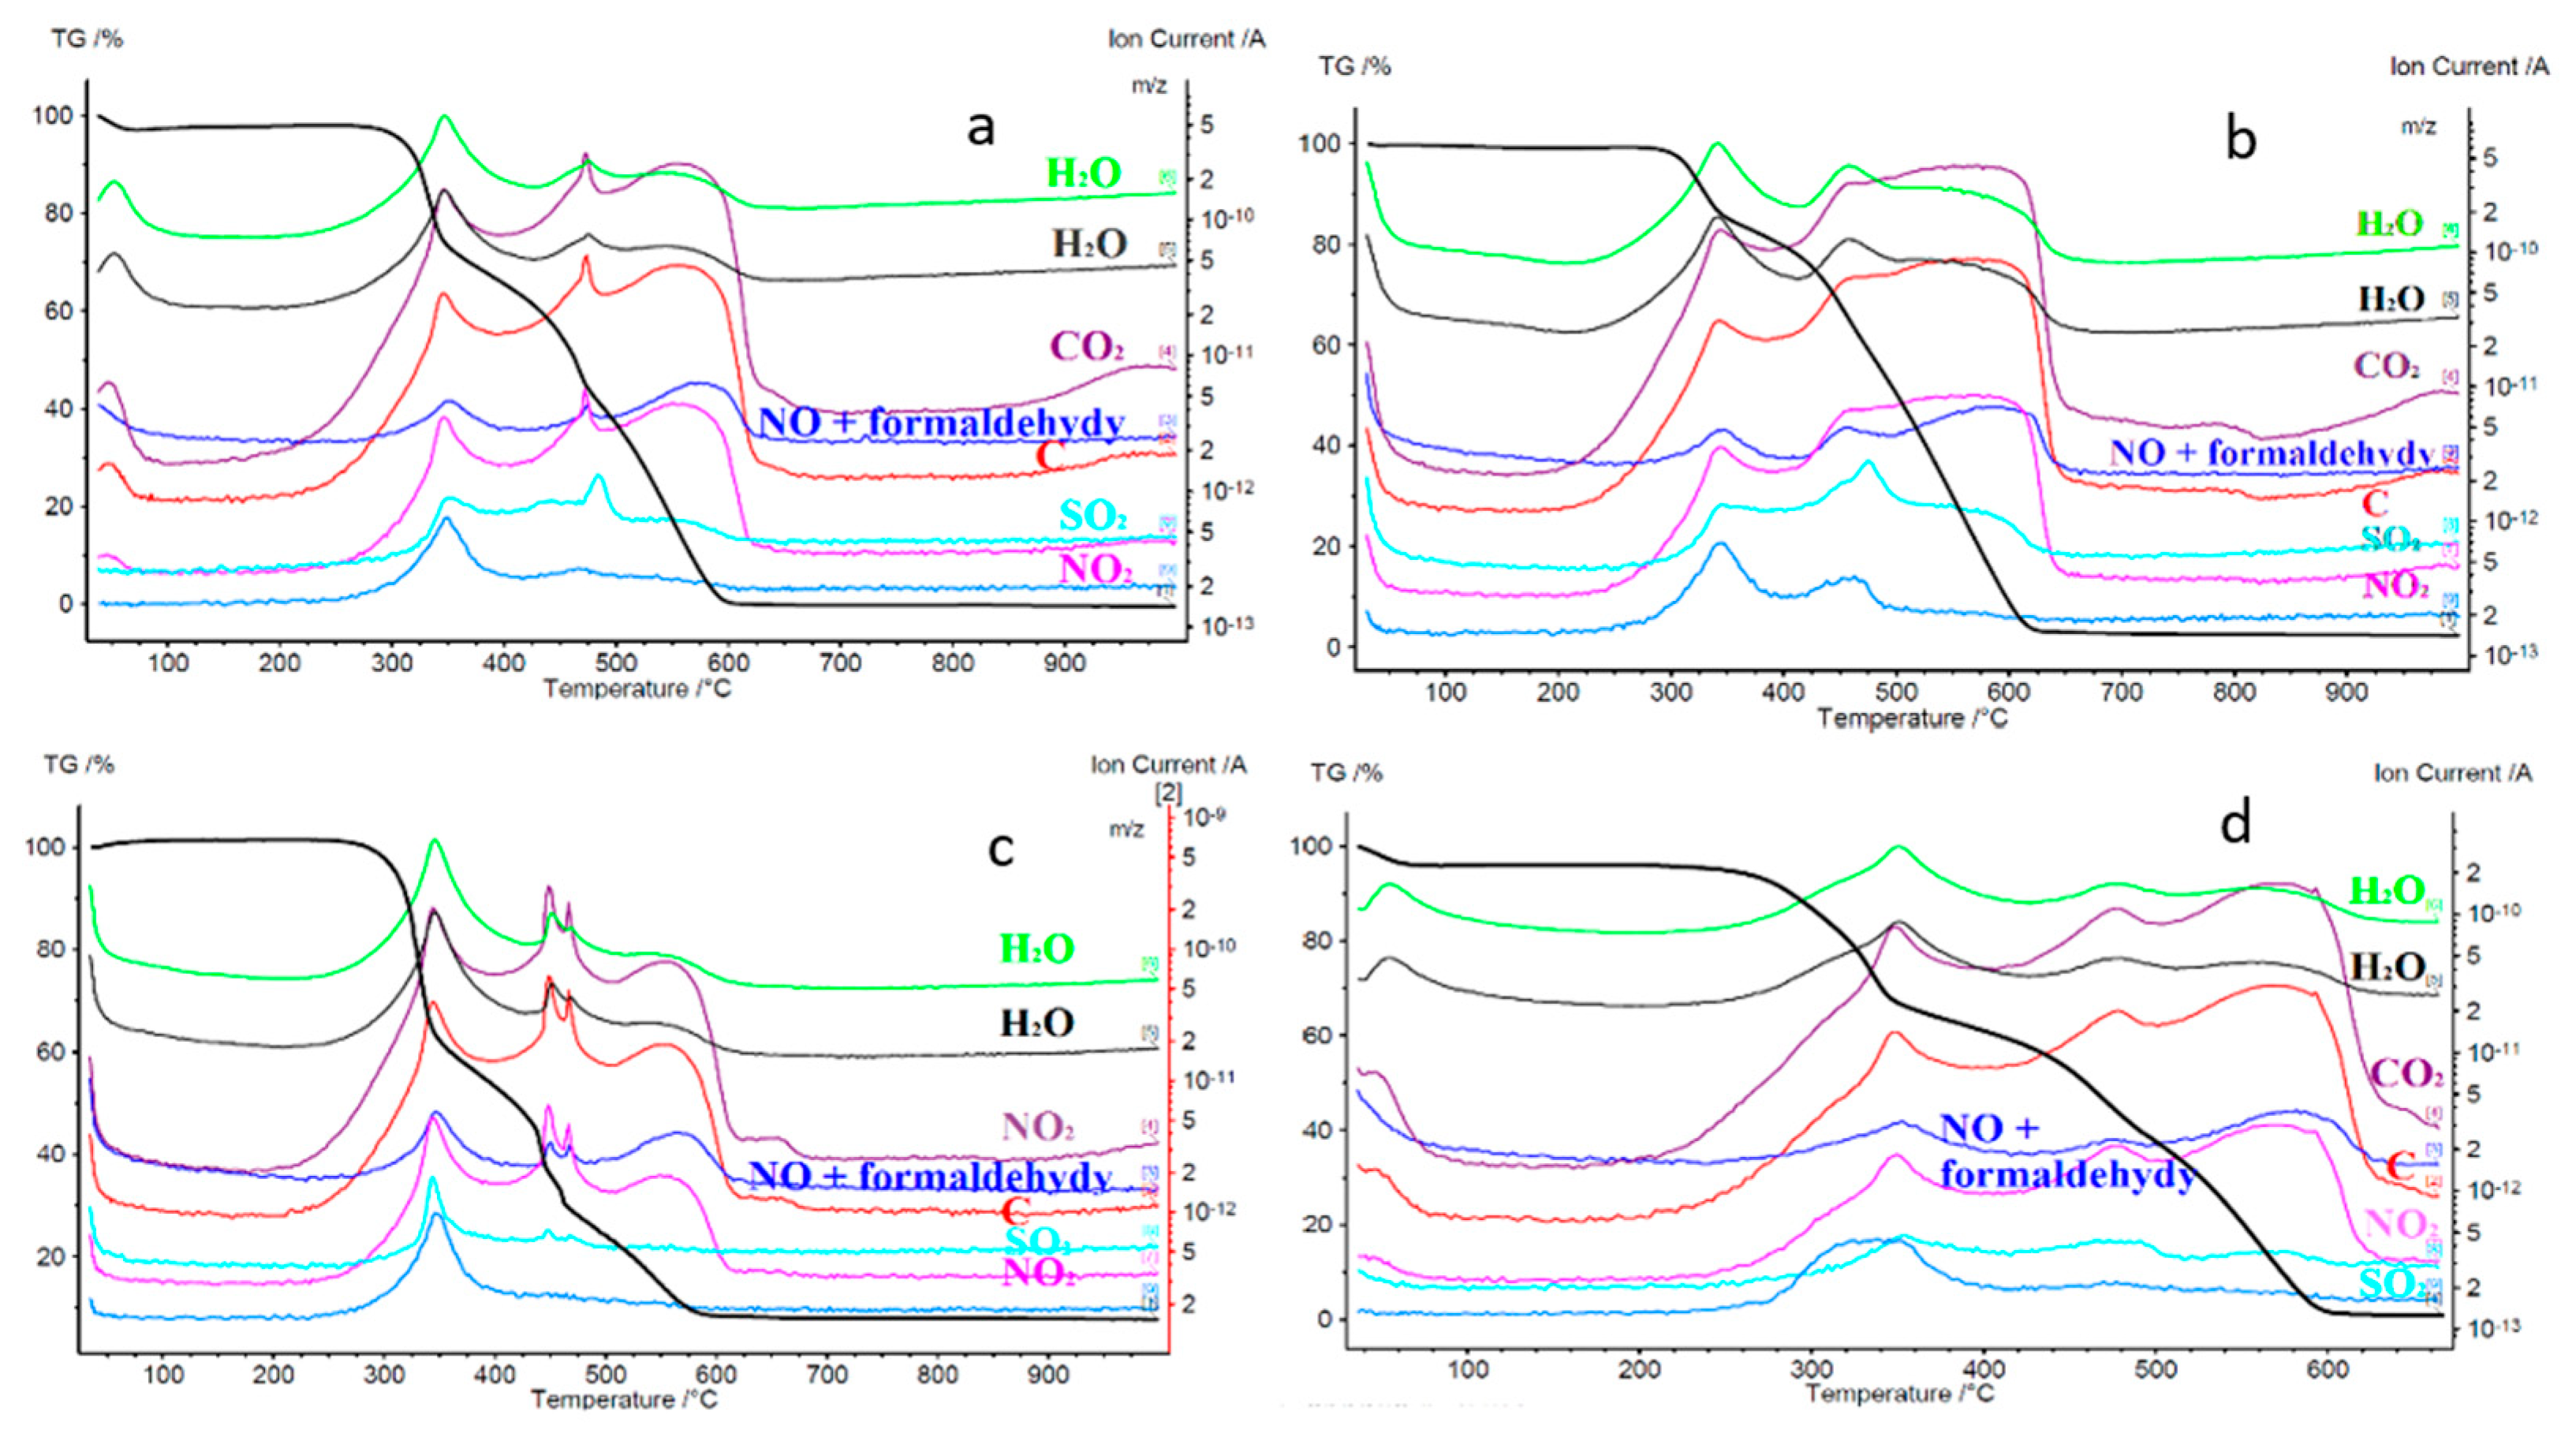
A fuel mixture comprising 75% stratified willow and 25% coal exhibited a slight initial weight loss of 5% at temperatures between 100 °C and 110 °C, primarily due to moisture evaporation. At 331.4 °C, the mixture ignited, leading to a significant weight loss of 26.72%/min. This weight loss was attributed to the combustion of hemicellulose and lignin structures, known for their lower heat resistance than cellulose. At 341.8 °C, the formation of exhaust gases was detected, including H
2O, CO
2, CO, C, NO, NO
2, SO
2, and formaldehyde acids, through mass spectrometry, as shown in
Figure 16. The SO
2 levels experienced a slight rise. This can be attributed to complex processes, encompassing sulfur transformation in the combusted fuel and self-retention of sulfur (SSR), also mentioned in the study of Kopczyński et al. (2017) [
61]. As seen in
Figure 17, another considerable weight loss of 18.62%/min occurred at 439.9 °C, associated with the oxidation of carbon compounds comprising hemicellulose, cellulose, and carbon itself. The final substantial mass loss of 12.63% was observed at 460.8 °C, signifying the conclusion of willow and coal co-combustion. At 552.6 °C, a minor mass loss of 3.73%/min was recorded, with a total mass loss of 7.65%. The co-combustion process ended at 998 °C.
In the case of a fuel mixture containing 50% stratified willow and 50% hard coal, a slight mass loss of 4% was observed at the beginning, attributed to preliminary drying at temperatures around 100 °C. Ignition of the mixture occurred at 333.1 °C, resulting in a weight loss rate of 15–12%/min. An increased proportion of hard coal in the mixture led to reduced weight loss compared to the 75% willow mixture. A second substantial weight loss of 10.39%/min was recorded at 467 °C, with a final significant weight loss of 6.69%/min at 543.4 °C. At the end of the process, 5.95% of the mixture’s mass remained.
In the case of a mixture containing 25% stratified willow and 75% hard coal, an initial mass loss of 2% was observed at temperatures near 120 °C. Ignition of this mixture occurred at 326.4 °C, resulting in a second significant weight loss of 5.83%/min at 458.9 °C, reflecting a slower mass loss rate compared to the 75% hard coal mixture. The third and final substantial weight loss of 6.38% was observed at 554.9 °C, which is higher than in the other two tests due to the dominance of hard coal, characterized by a higher combustion temperature compared to willow. The mixture’s mass was reduced to 4.24% at the end of the co-combustion process. This reduction was primarily due to the higher ash content in the biomass than coal, which dominated the sample.
Comparative thermogravimetric analysis of co-combustion processes revealed higher mass loss rates (%/min) for torrefied biomass at the same co-combustion temperatures. In contrast, unprocessed biomass exhibited more significant overall mass loss at those temperatures shown in
Figure 18. The opposite mechanism was observed in terms of the mass loss itself at the same temperatures, which was more significant for samples with unprocessed biomass. Certainly, both untreated biomass chars and torrefied biomass chars exhibit a higher reactivity than chars derived from bituminous coals (please note that Asfordby represents an exceptionally reactive bituminous coal char). Intriguingly, the torrefied biomass char tends to approach the intrinsic reactivity observed in coal chars.
The incineration of coal chars has been extensively examined across a broad temperature spectrum, primarily at temperatures below 950 °C, with some studies conducted at flame temperatures [
62,
63]. Investigations into both chemical and intrinsic reactivities have been carried out. While porosity develops during combustion, modeling often relies on average surface area values [
64]. In contrast, there is less research on the combustion of biomass chars. Di Blasi [
34] has provided an overview of the knowledge concerning the chemical reactivities of lignocellulosic chars. However, determining intrinsic reactivities requires assessing the surface area simultaneously, which has proven challenging and led to disparate values differing by an order of magnitude.
4. Conclusions
Our batch reactor-based biomass torrefaction research aimed to optimize conditions, focusing on the average torrefaction temperature and sample residence time above 200 °C for maximum energy concentration. Willow torrefaction exhibited a peak mass loss of 34.15% at 243.89 °C for 15 min and a minimum of 30.15% at 245 °C for 14 min, recommended for process optimization in terms of efficiency and economics. Contrary to thermogravimetric analyzer results, longer residence times led to a 42% weight loss. Torrefaction altered biomass composition, enhancing combustion heat and calorific value by increasing carbon and decreasing hydrogen content. A two-stage reaction model emphasized the importance of rapid processing for efficient heat transfer, involving initial hemicellulose and lignin carbonization followed by an extended period above 225 °C. Carbon and nitrogen concentrations increased during torrefaction, while the hydrogen share decreased, and the bound potassium in the mineral component rose. FTIR analysis identified compounds released during torrefaction, forming torgas—a combustible mix influenced by the raw material moisture. However, obtaining a combustible gas meeting process energy requirements is challenging. Prolonged reactor times exceeding 15 min and temperatures above 250 °C result in excessive energy losses, rendering conditions suboptimal for willow. The co-combustion of willow with hard coal reduces sulfur emissions. Yet, co-combusting torrefied biomass with a higher nitrogen content, especially exceeding 50%, increases NOx emissions. Elevated pressure torrefaction may enhance fuel properties for improved co-firing and gasification. Future work includes a steam-powered torrefaction reactor for efficiency, surpassing batch reactors, which will be investigated. Superheated steam torrefaction offers advanced temperature control, superior product quality, and valuable condensate by-products.


