Article

Voltage-Induced Heating Defect Detection for Electrical Equipment in Thermal Images

State Grid Shandong Electric Power Research Institute, Jinan 250002, China
*
Author to whom correspondence should be addressed.
Energies 2023, 16(24), 8036; https://doi.org/10.3390/en16248036
Submission received: 15 November 2023 / Revised: 10 December 2023 / Accepted: 11 December 2023 / Published: 13 December 2023
(This article belongs to the Special Issue Novel Approaches to Electrical Machine Fault Diagnosis: Volume II)

Abstract

:
Voltage-induced heating defect is a type of defect that may occur in transformation substation equipment. Although this type of defect is less common compared to current-induced heating defects, it is crucial to identify it due to its association with severe insulation degradation problems that require prompt intervention. However, the temperature variations caused by these defects may be relatively subtle, making it challenging to distinguish them in thermal images. In this work, considering the characteristics of voltage-induced heating defects and the scarcity of defect data, we propose a two-stage method for defect detection. In the first stage, we employ oriented R-CNN to detect oriented parts of the equipment, accurately localizing the centerline of each part. In the second stage, we extract the temperature distribution along the centerline of specific parts and discretize them as features. Subsequently, we train one-class support vector machines based on the features extracted from normal images for defect diagnosis. Experimental results demonstrate that the proposed method is capable of accurately detecting defects while maintaining a low false positive rate.

1. Introduction

Thermal infrared (IR) technology [1], also known as thermography, is a non-contact imaging technique that captures the thermal radiation emitted by objects. The captured thermal images visualize the temperature distribution on the surface of objects, enabling the identification of abnormal temperature patterns that may indicate potential defects or malfunctions. Due to its non-contact nature, thermography has found widespread application in the inspection of electrical power equipment [2,3,4,5,6]. By detecting hotspots or other abnormal temperature patterns, thermography helps to identify issues such as loose connections, overloaded circuits, faulty components, or insulation problems that may occur in transformation substation equipment [7,8]. The timely identification of anomalies allows for targeted interventions, ensuring that necessary maintenance or corrective measures are implemented promptly, thereby reducing the risk of accidents, electrical hazards, and potential harm to personnel.
However, detecting and analyzing defects in thermal infrared images pose certain challenges. These challenges primarily stem from the following two aspects [9]: (1) Thermal patterns captured in infrared images can be influenced by various factors, including ambient temperature, environmental conditions, and equipment operating conditions. Therefore, it requires expertise and experience to accurately interpret thermal infrared images and distinguish between actual defects and benign temperature variations. (2) The interpretation of thermal infrared images requires knowledge of the specific equipment being inspected and an understanding of the expected thermal patterns under normal operating conditions. For instance, in the case of substation equipment, two common types of defects are current-induced heating defects and voltage-induced heating defects. As depicted in Figure 1, current-induced heating defects often manifest as noticeable hotspots or areas of excessive heat, which can be relatively easier to detect. On the other hand, voltage-induced heating defects manifest as uneven temperature distributions within a single phase or across multiple phases of the equipment. The temperature variations caused by these defects can be relatively subtle and may not be easily distinguishable from normal temperature fluctuations [9].
In this work, we primarily focus on the detection of voltage-induced heating defects. Although these defects may be less common compared to current-induced heating defects, they are of utmost importance to identify due to their association with insulation degradation problems that are severe and require prompt intervention. Furthermore, detecting voltage-induced heating defects poses greater challenges and remains relatively unexplored in the field.
Considering the scarcity of images with defects compared to the abundance of normal images, we propose a two-stage method to detect voltage-induced heating defects. In the first stage, we utilize oriented R-CNN [10], trained on a large number of normal images, to accurately localize various equipment parts such as bushings, flanges, and arc-extinguishing chambers. In the second stage, based on the localized equipment parts, we extract the temperature distribution along the centerline of bushings or arc-extinguishing chambers for defect diagnosis. Specifically, we discretize the temperature distribution and use it as features to train two one-class support vector machines (OC-SVM) [11] using normal samples. These OC-SVMs are then used to detect abnormal temperature patterns within single-phase and multiple-phase equipment parts, respectively. By combining deep model-based part localization with OC-SVM-based defect diagnosis, we effectively leverage the abundance of normal images while addressing the challenge posed by the limited number of defect images. This methodology enables accurate localization of equipment parts and reliable detection of defects, as validated in our experiments. Through comprehensive evaluations, we demonstrate the effectiveness of our approach in detecting voltage-induced heating defects, even with a limited number of defect images.
The remaining sections of this paper are organized as follows. In Section 2, we provide a brief review of related work. Section 3 introduces the characteristics of voltage-induced heating defects, whereas Section 4 presents our proposed method for detecting these defects. In Section 5, we present the experimental results, and finally, Section 6 concludes the paper.

2. Related Works

Since our method comprises equipment localization and defect detection stages, in this section, we provide a brief review of related works in these two aspects and highlight the differences between our method and previous approaches.

2.1. Electrical Equipment Localization

Object localization plays a crucial role in thermal image analysis for electrical equipment. Previous studies have explored various techniques to localize electrical equipment. For instance, two-stage object detection methods such as Faster R-CNN [12] and one-stage methods like YOLO [13] and CenterNet [14] are commonly used to detect various substation or transmission equipment [15,16,17,18]. Segmentation methods such as DeepLab [19] and cross-guidance network [20] are also applied to segment equipment regions. However, as shown in Figure 2, these object detection methods producing upright bounding boxes may include irrelevant background regions when the equipment or part is slanted, leading to background interference. Although segmentation methods provide pixel-level identification, they are sensitive to boundaries, resulting in inaccurate temperature distributions along the centerlines of the equipment parts. To address this issue, Gong et al. [21] proposed an oriented YOLO to detect tilted equipment parts, whereas Zheng et al. [22] designed a rotation region network for detecting tilted equipment. In this work, we adopt oriented R-CNN [10] for equipment part detection, which has demonstrated superior performance in our experiments.

2.2. Electrical Defect Detection

Extensive methods have been developed for electrical defect detection in thermal images. However, most of these methods primarily focus on detecting current-induced heating defects and rarely explore voltage-induced heating defect detection. Typically, these methods adopt segmentation techniques to extract equipment or heating areas and subsequently extract features for analysis. For example, Huda and Taib [7] extracted several hand-crafted features from segmented regions and utilized a multilayer perceptron (MLP) for classifying the defective conditions of electrical equipment. Zou and Huang [23] employed the K-means algorithm to cluster electric equipment regions, followed by feature extraction and input to a support vector machine (SVM) for defect classification. Ullah et al. [24] utilized AlexNet [25] to extract features and then employed SVM to classify defective and non-defective high voltage electrical equipment. In addition, Li et al. [26] adopted various instance segmentation models such as Mask R-CNN [27] and YOLACT [28] to segment equipment instances first and then used a defect determination strategy to recognize defects based on the temperature probability density distribution extracted within segmented regions. Whereas these methods have shown effectiveness in detecting current-induced heating defects, there is a lack of exploration and research on voltage-induced heating defect detection. This highlights the need for further investigation and development of methods specifically tailored to address voltage-induced heating defects in thermal images. Moreover, although support vector machines (SVM) have been employed in the works of Zou and Huang [23] and Ullah et al. [24], they require both normal and abnormal samples for training. In contrast, we adopt one-class SVM [11], which only needs normal samples for learning and is therefore better suited to our scenario where defective images are extremely scarce.

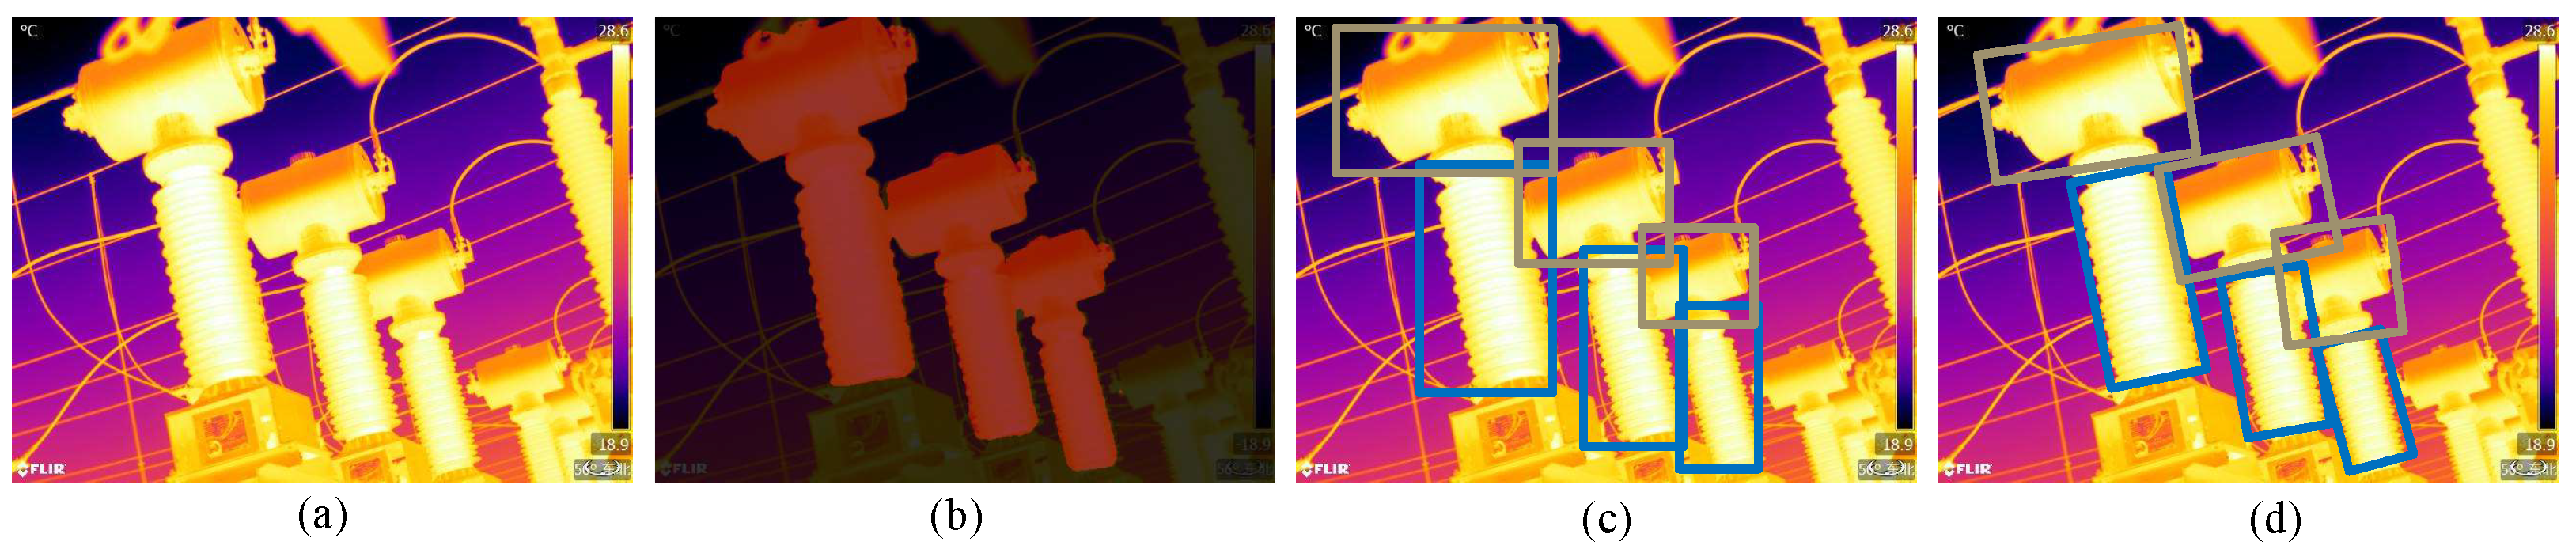
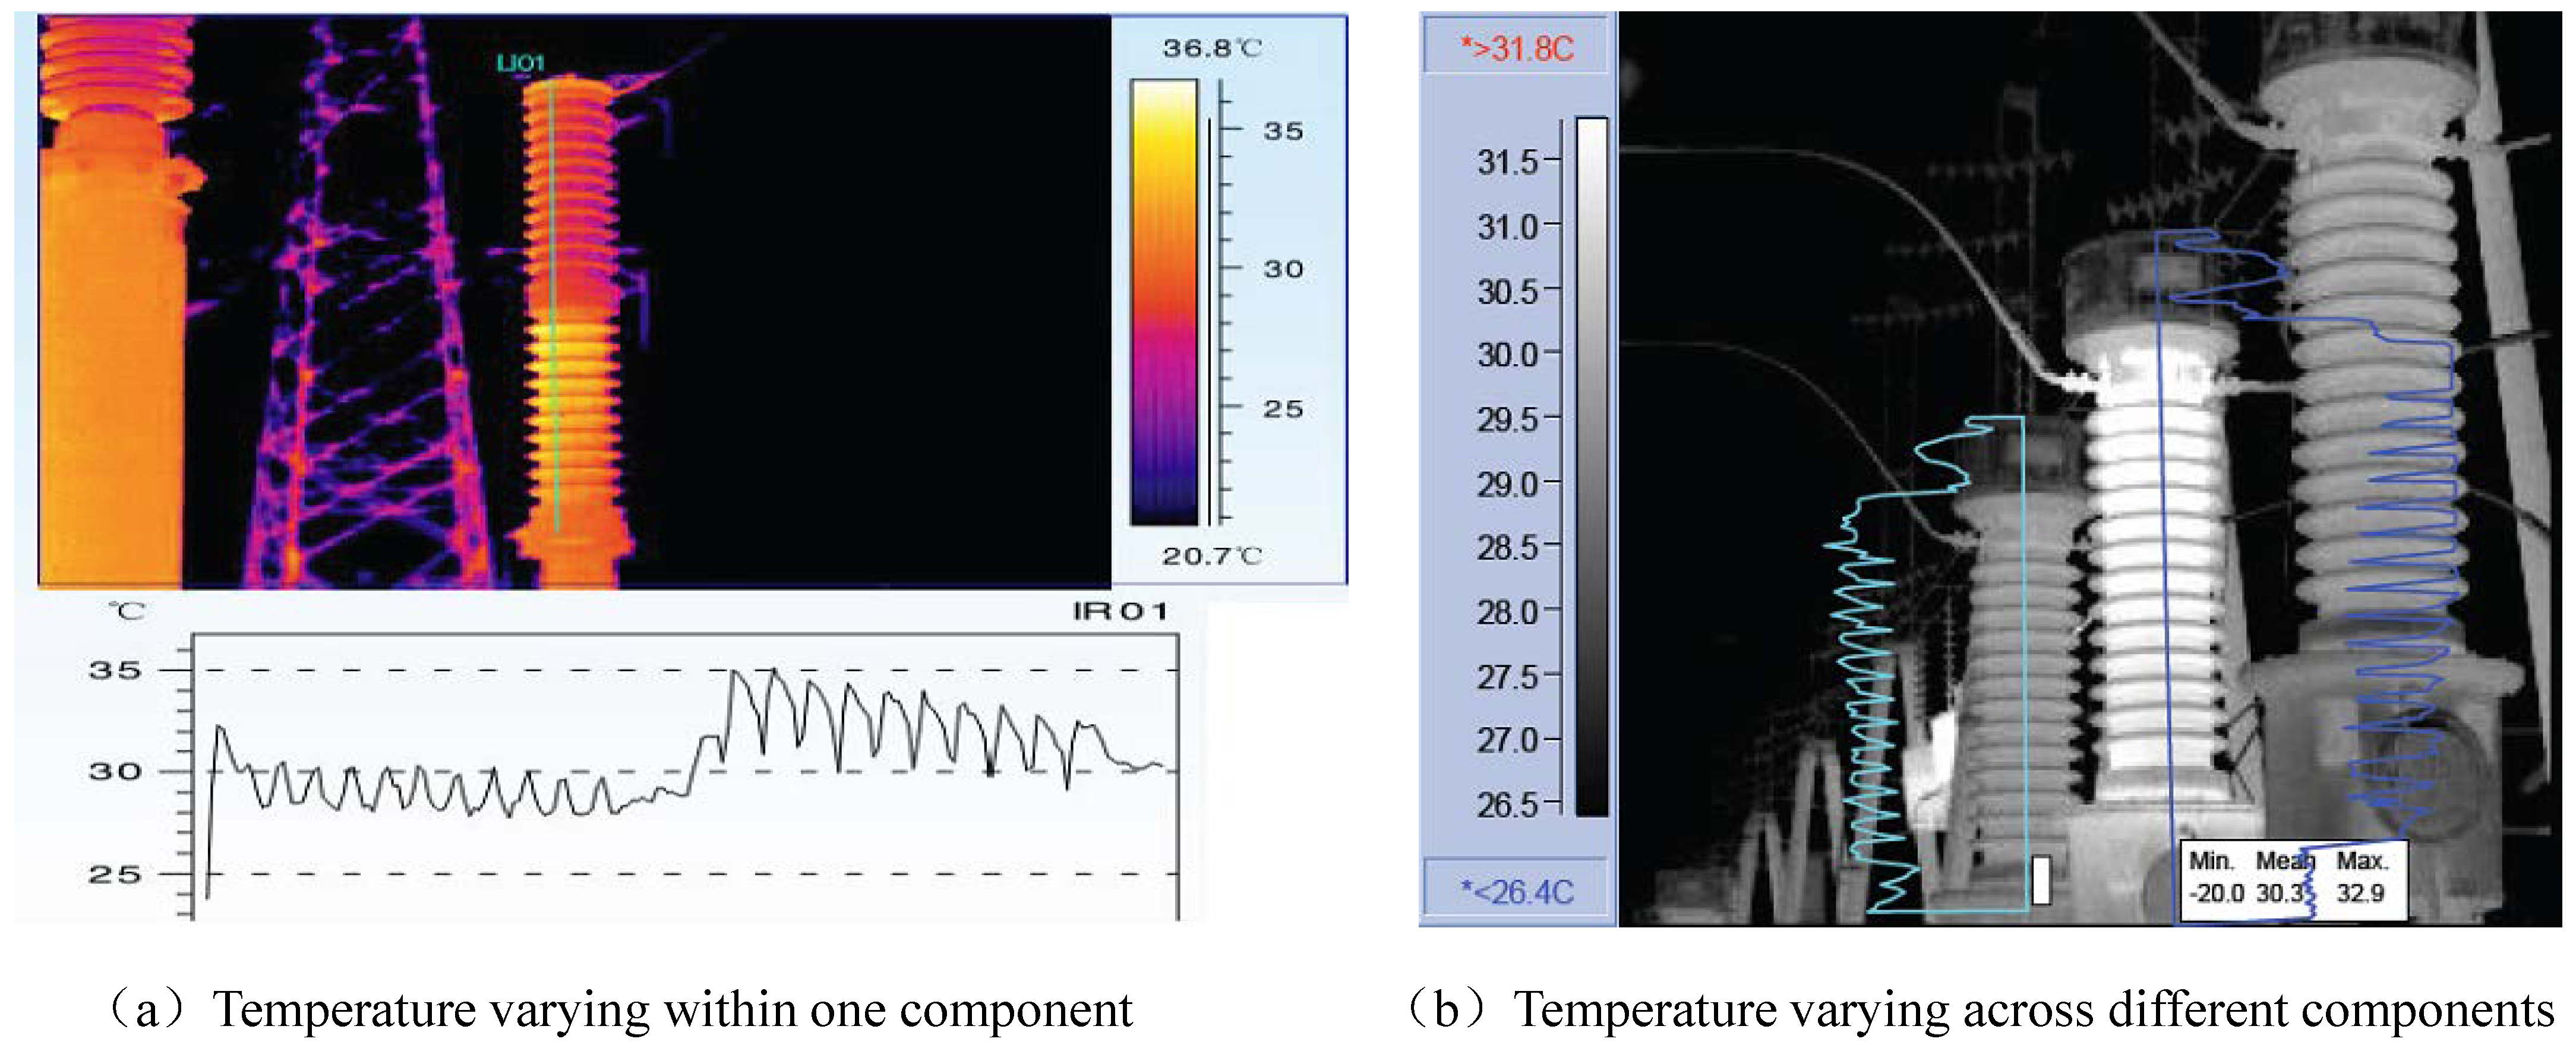
3. The Characteristics of Voltage-Induced Heating Defects

We first analyze the causes and manifestations of voltage-induced heating defects, which help us design an appropriate method for detecting such defects. As introduced in the power industry national standard DLT664-2016 [29], voltage-induced heating defects are mainly caused by dielectric degeneration. These defects can occur due to various factors, including contamination or moisture in the insulator bushing, insufficient oil in the oil-filled bushing, or blockages in the oil or gas paths of the high-voltage bushing. In these cases, the electrical insulation material continuously consumes electrical energy and generates heat as a result of the alternating electric field causing changes in the dielectric polarization direction. This leads to the overall heating of the bushing, although the temperature increase may be subtle, whereas voltage-induced heating defects are less common compared to current-induced heating defects, they should not be overlooked due to their potential severity. Once voltage-induced heating defects occur, they often fall into the category of severe or critical defects and require prompt intervention. Therefore, it is of utmost importance to detect and diagnose these defects promptly to prevent further damage or potential hazards.
In diagnosing voltage-induced heating defects, traditional manual analysis methods typically involve comparing and analyzing temperature differences within a single phase or between multiple phases of the equipment, as illustrated in Figure 3. This highlights the importance of accurately detecting equipment and precisely localizing the centerline of each piece of equipment. Moreover, we also observe that different parts of equipment, such as bushings and bellows, may exhibit distinct temperature patterns. This observation motivates us to localize finer-grained equipment parts for more accurate analysis.

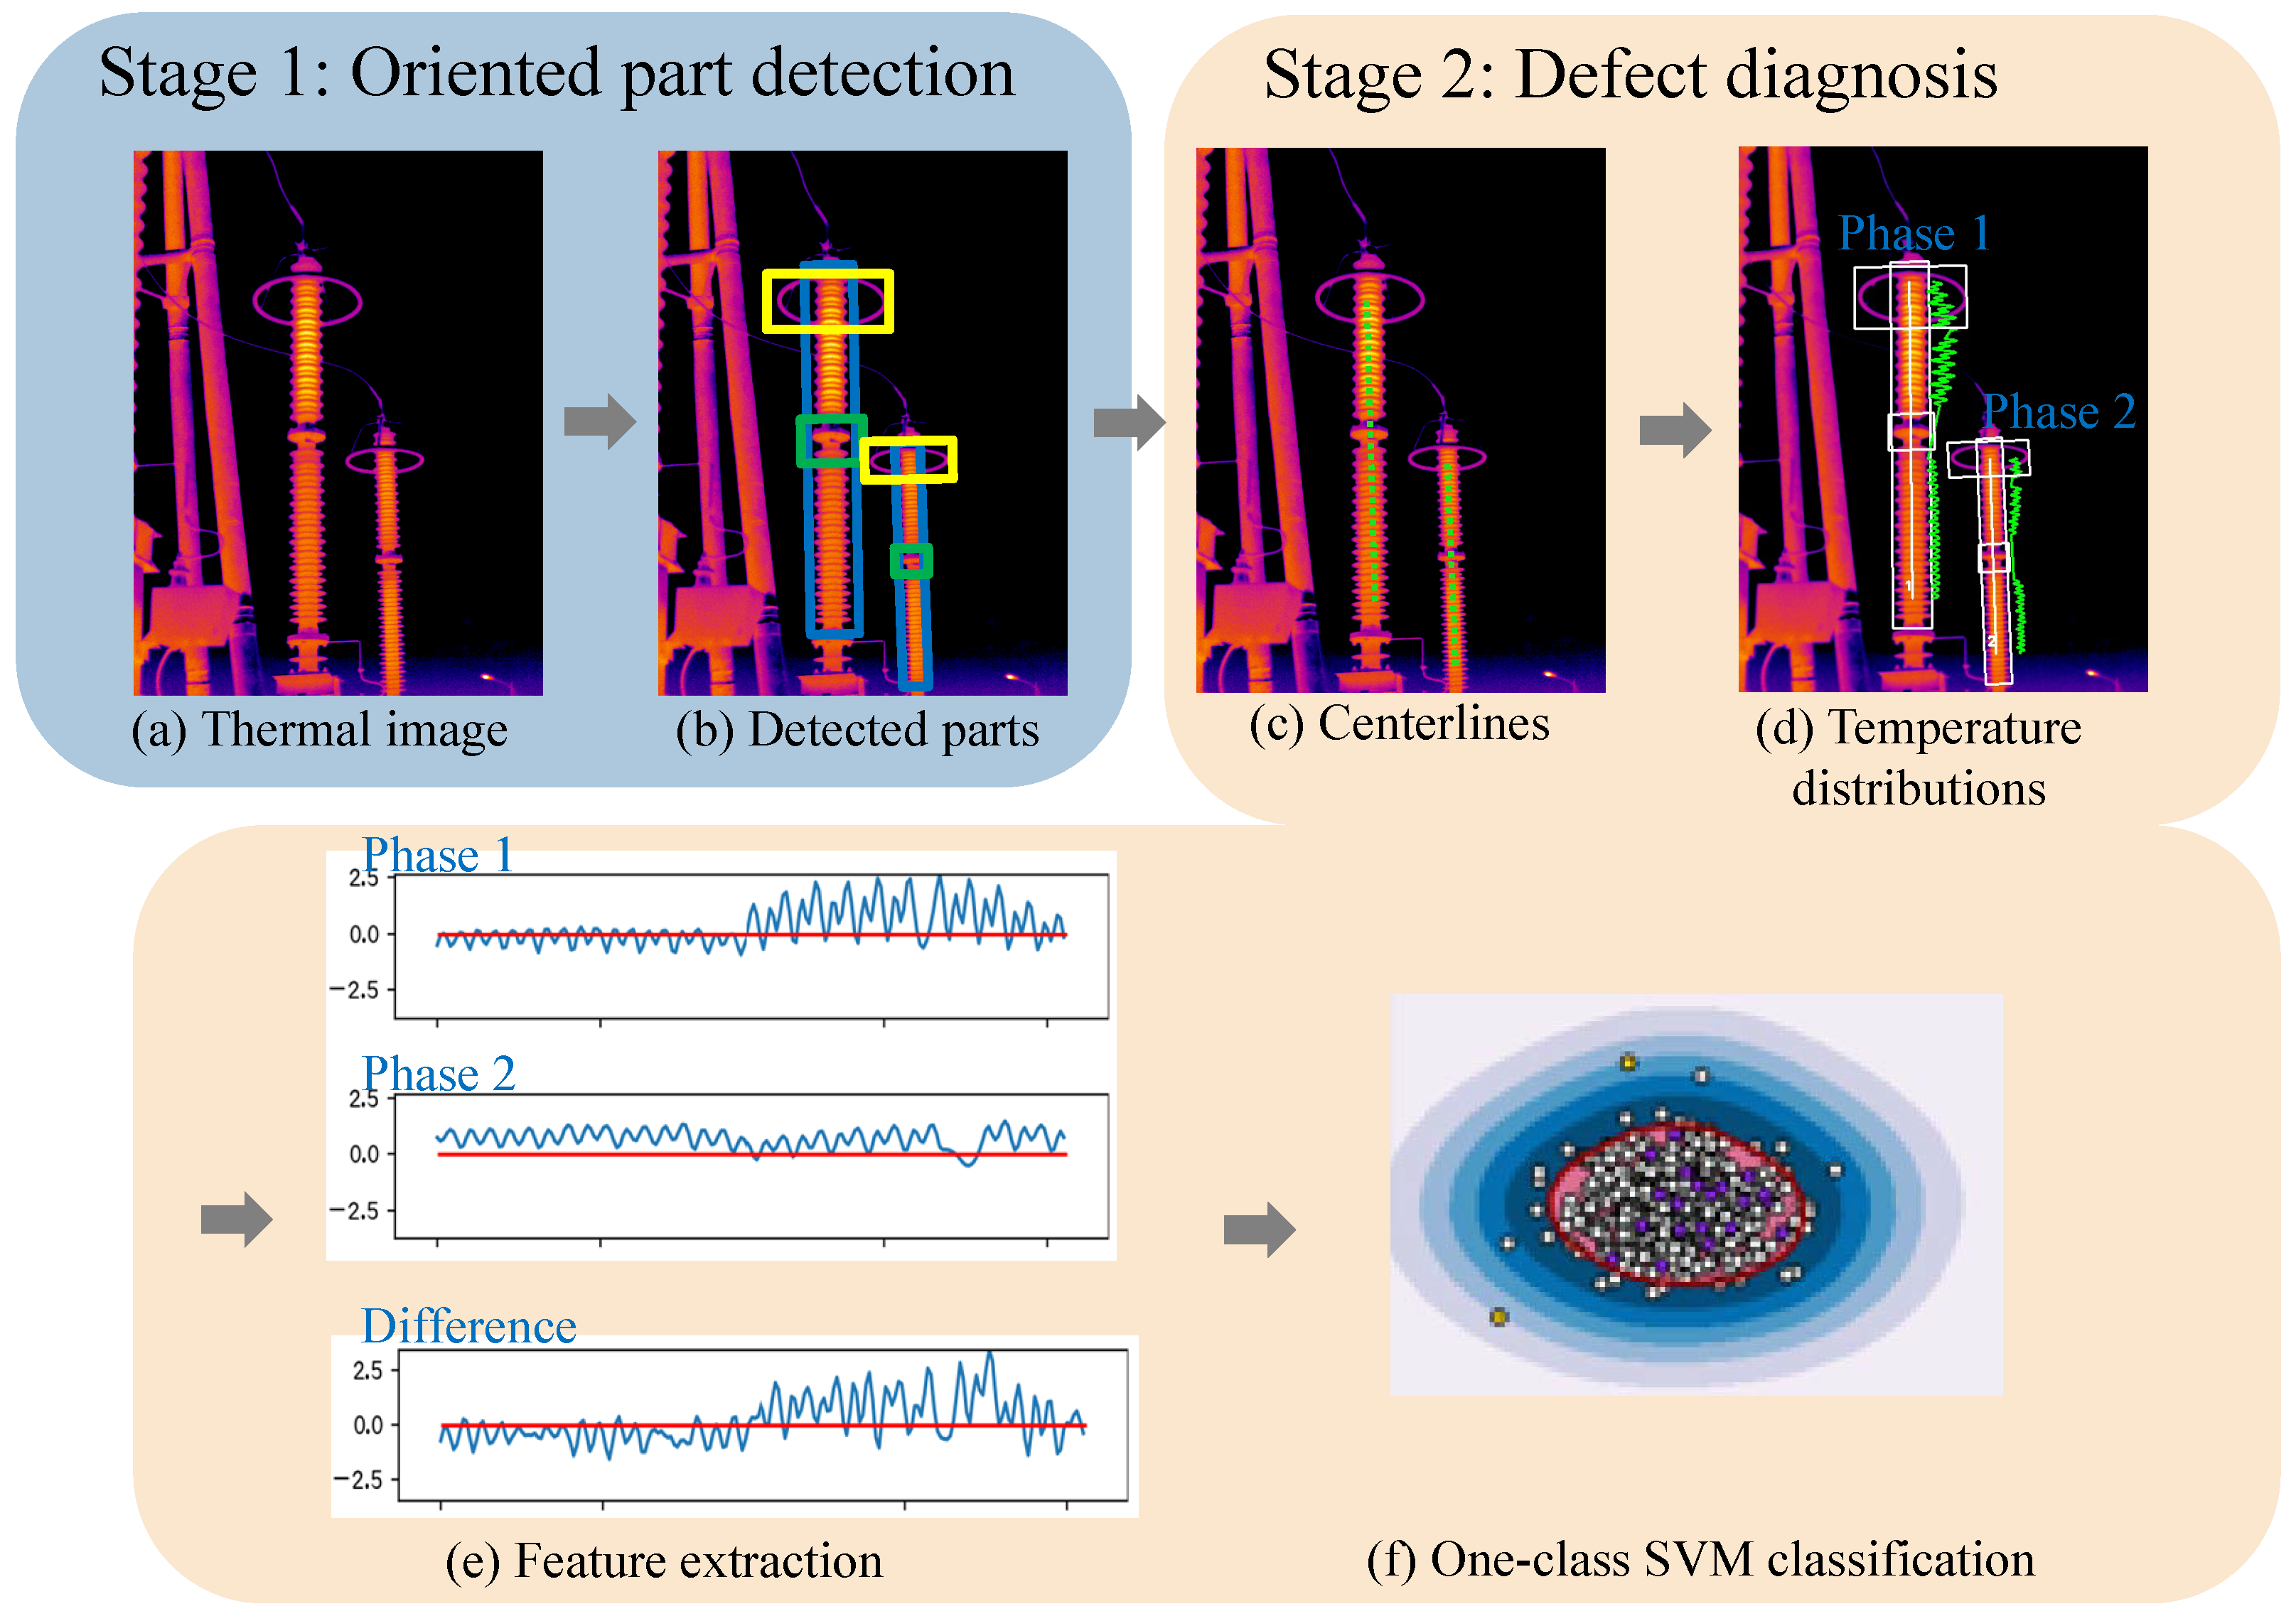
4. The Proposed Method

Based on our understanding of voltage-induced heating defects, we propose a two-stage approach in this work to effectively detect such defects. In the first stage, we employ oriented R-CNN [10], a state-of-the-art oriented object detection method, to detect various equipment parts that might appear slanted in thermal images due to random capturing angles. By utilizing oriented R-CNN, we can accurately localize the centerline of each part based on the produced oriented bounding boxes. In the second stage, we extract the temperature distribution along the centerline of bushings or arc-extinguishing chambers, which are the major equipment parts where voltage-induced heating defects occur. We then extract features from the temperature distributions of single-phase or multiple-phase equipment parts. Next, one-class SVMs [11] are trained based on these features extracted from normal images for defect diagnosis. Figure 4 provides an overview of the entire framework of our proposed method. In the following sections, we will delve into the details of each stage and explain how they contribute to the overall defect detection process.

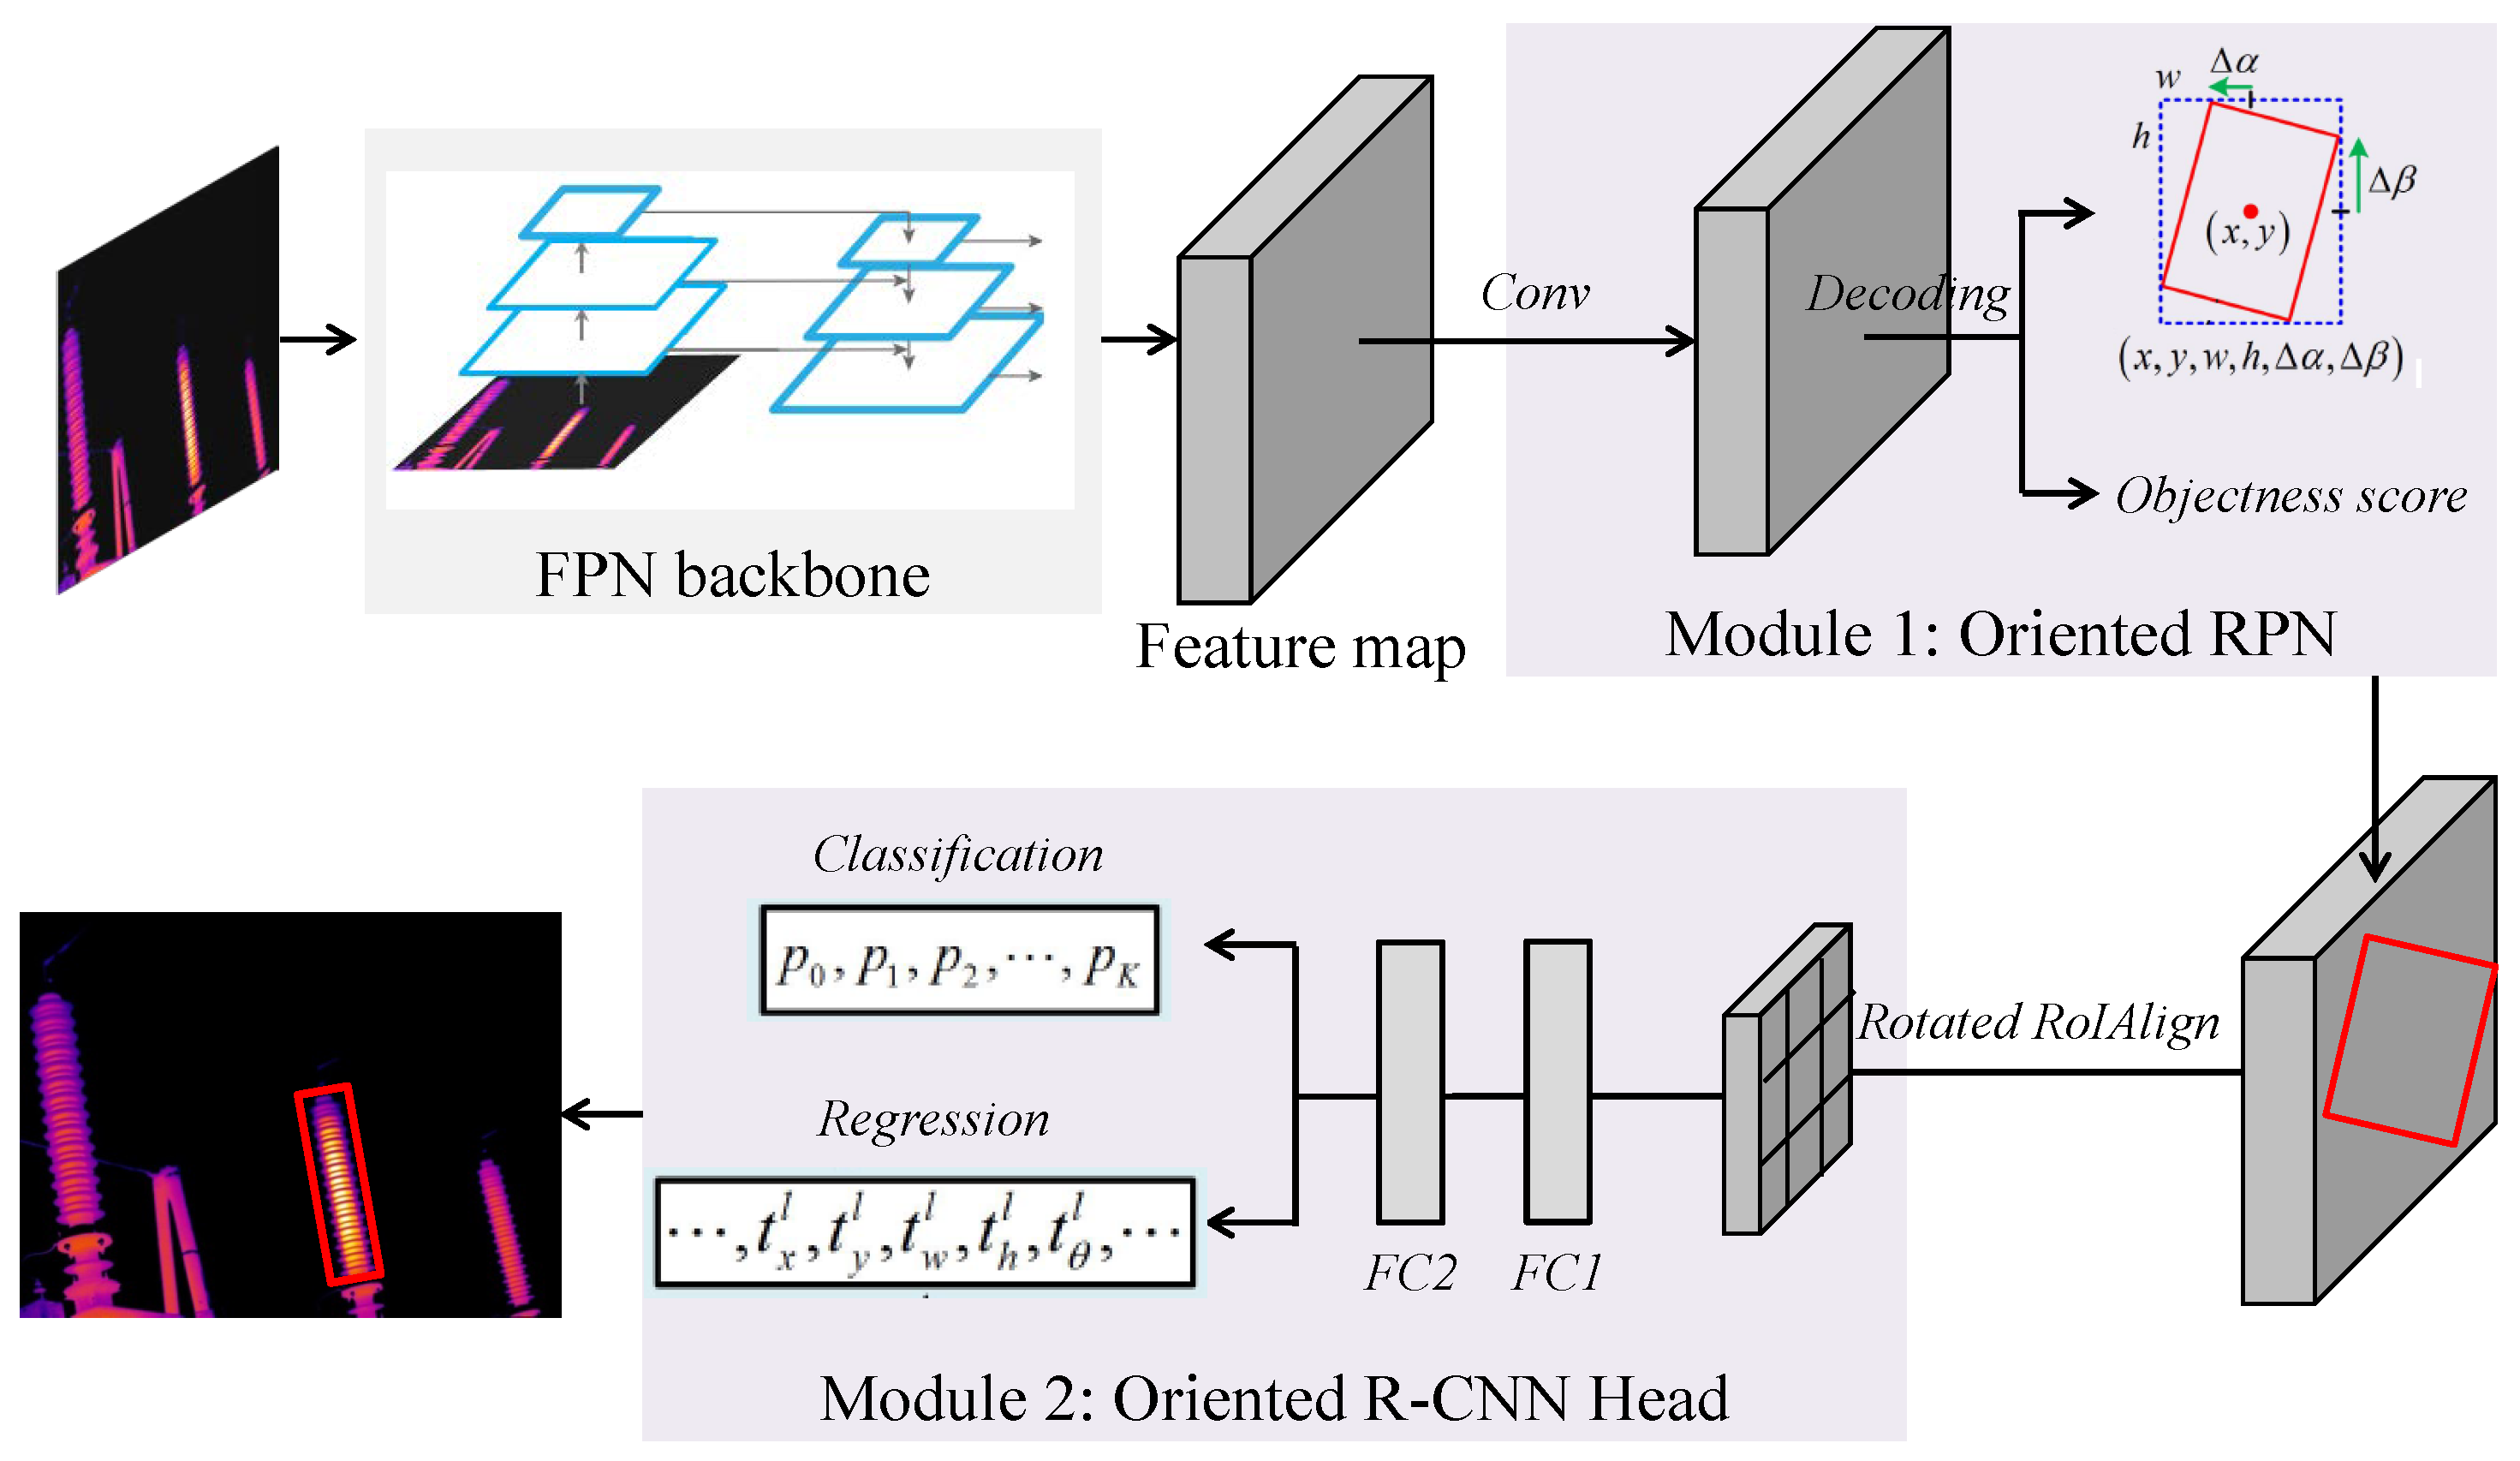
4.1. Oriented R-CNN-Based Part Detection

As discussed in Section 3, the accurate localization of the centerline of equipment parts is crucial for diagnosing voltage-induced heating defects. Moreover, due to the random capturing angles in daily inspections, equipment parts in thermal images may appear tilted to varying degrees. Therefore, we adopt the oriented R-CNN [10] method to detect equipment parts. Compared to conventional upright object detection methods, oriented R-CNN allows us to accurately detect and handle the slanted appearance of various equipment parts, providing more reliable results while reducing background interference.
Figure 5 illustrates the architecture of oriented R-CNN. It utilizes the feature pyramid network (FPN) [30] as the backbone for feature map extraction, followed by an oriented region proposal network (RPN) and an oriented R-CNN head. The oriented RPN generates high-quality oriented proposals, whereas the oriented R-CNN head performs proposal classification and regression. The details of these two modules are introduced as below.

4.1.1. Oriented RPN

The oriented RPN takes five levels of features generated from FPN as input. For each level of features, the oriented RPN attaches a head consisting of a 3 × 3 convolutional layer and two sibling 1 × 1 convolutional layers. One of the sibling layers generates A proposals at each location of a feature map, where A is the number of anchors at a location. Each proposal is represented by ( x , y , w , h , Δ α , Δ β ) , where ( x , y ) denotes the center coordinate of the predicted proposal, w and h represent the width and height of the external rectangle box, and Δ α and Δ β are the offsets relative to the midpoints of the top and right sides of the external rectangle. The other sibling layer in the RPN estimates the objectness score for each proposal, indicating the likelihood of an object being present within the proposal.

4.1.2. Oriented R-CNN Head

The oriented R-CNN head takes the feature maps and a set of oriented proposals as input. Each proposal utilizes rotated region of interest (RoI) alignment to extract a feature vector, which is then passed through two fully connected (FC) layers, followed by two sibling FC layers. One of the sibling layers generates the classification probabilities { p 0 , p 1 , , p K } for the proposal, indicating the likelihood of it belonging to one of the K + 1 classes (K object classes and 1 background class). In our work, we consider K = 6 classes, which include bushing, bellows, grading ring, bushing coupler, flange, and arc-extinguishing chamber. These classes correspond to the parts appearing on four major electrical equipment types: current transformers, voltage transformers, surge arresters, and circuit breakers. Moreover, the other sibling layer produces the offsets of the proposal for each of the K object classes. These offsets are used to refine the localization of the proposal, ensuring accurate alignment with the boundaries of the detected component.

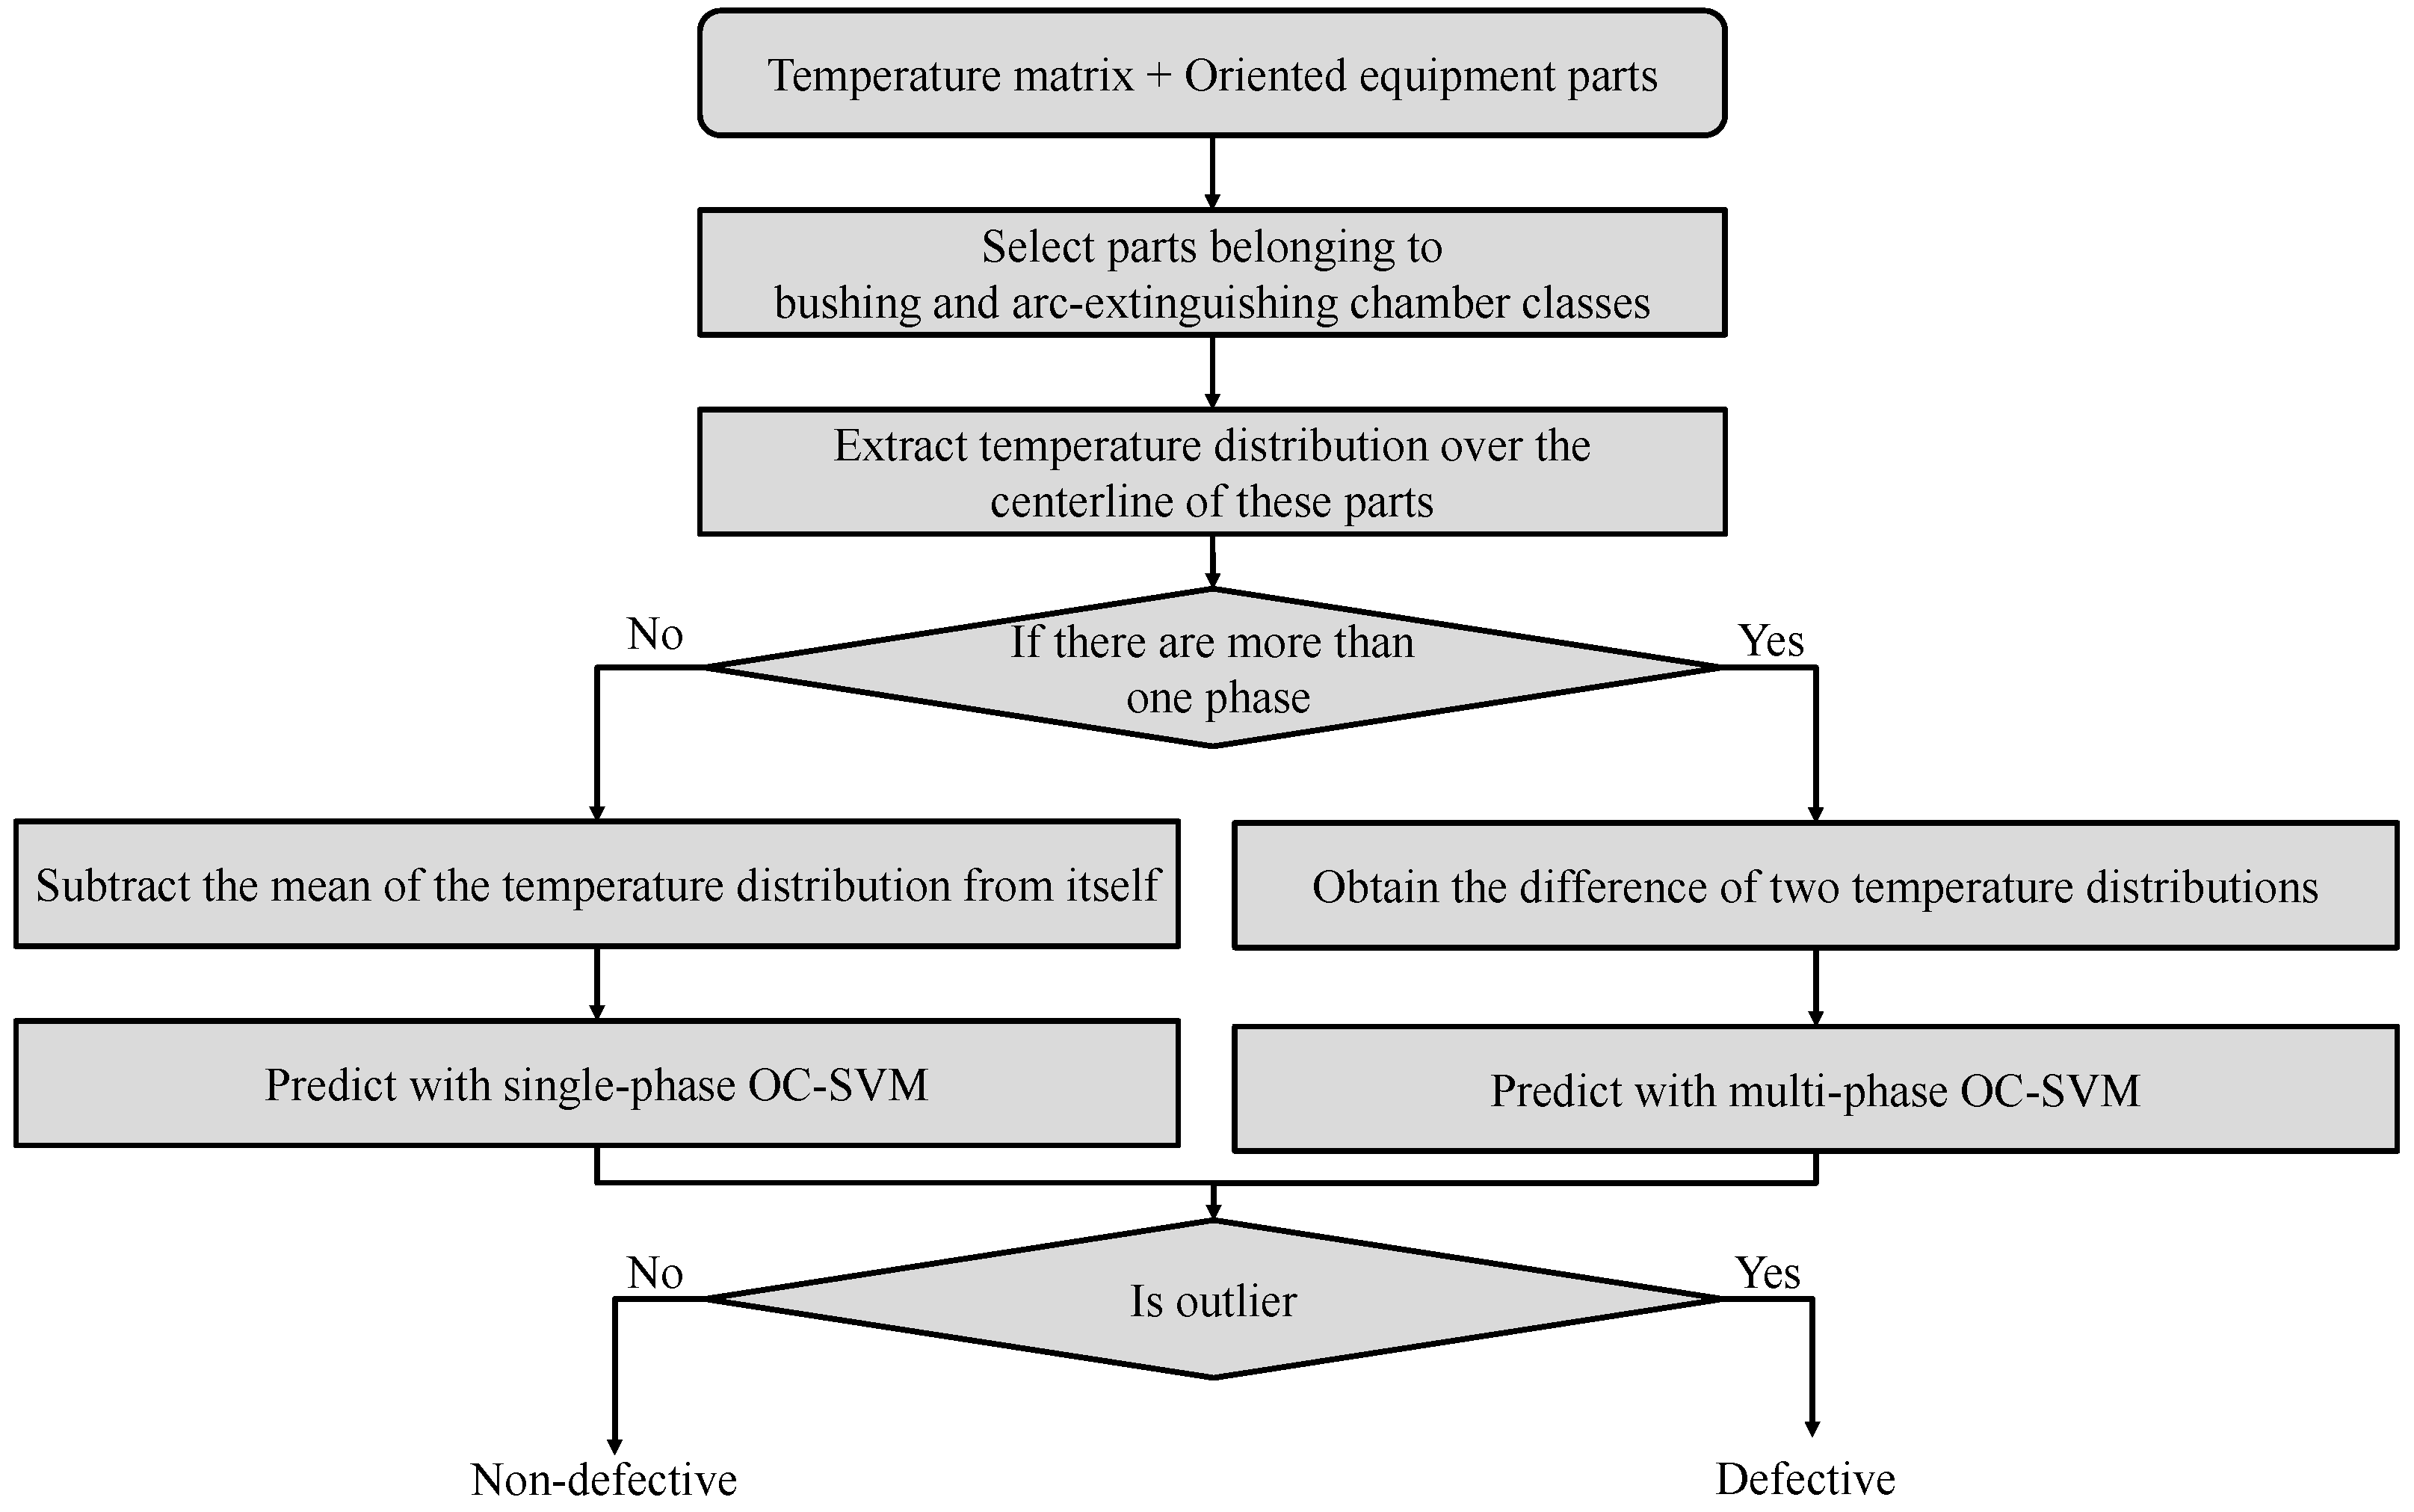
4.2. One-Class SVM-Based Defect Diagnosis

When designing an approach for voltage-induced heating defect detection, we primarily consider the following characteristics: (1) Although there are abundant thermal images collected during routine inspections, the number of images containing voltage-induced heating defects is extremely limited. (2) The voltage-induced heating defects mainly occur on two types of equipment parts: bushings and arc-extinguishing chambers. The abnormal patterns are often manifested as noticeable temperature variations within a single phase or between multiple phases of these equipment parts.
Considering the scarcity of defect data, we adopt one-class SVMs [11] that are trained on normal images for defect detection. The features used for the one-class SVMs are extracted based on the results of the aforementioned oriented part detection. In the following section, we will provide a detailed explanation of the feature extraction process and the utilization of the one-class SVMs.

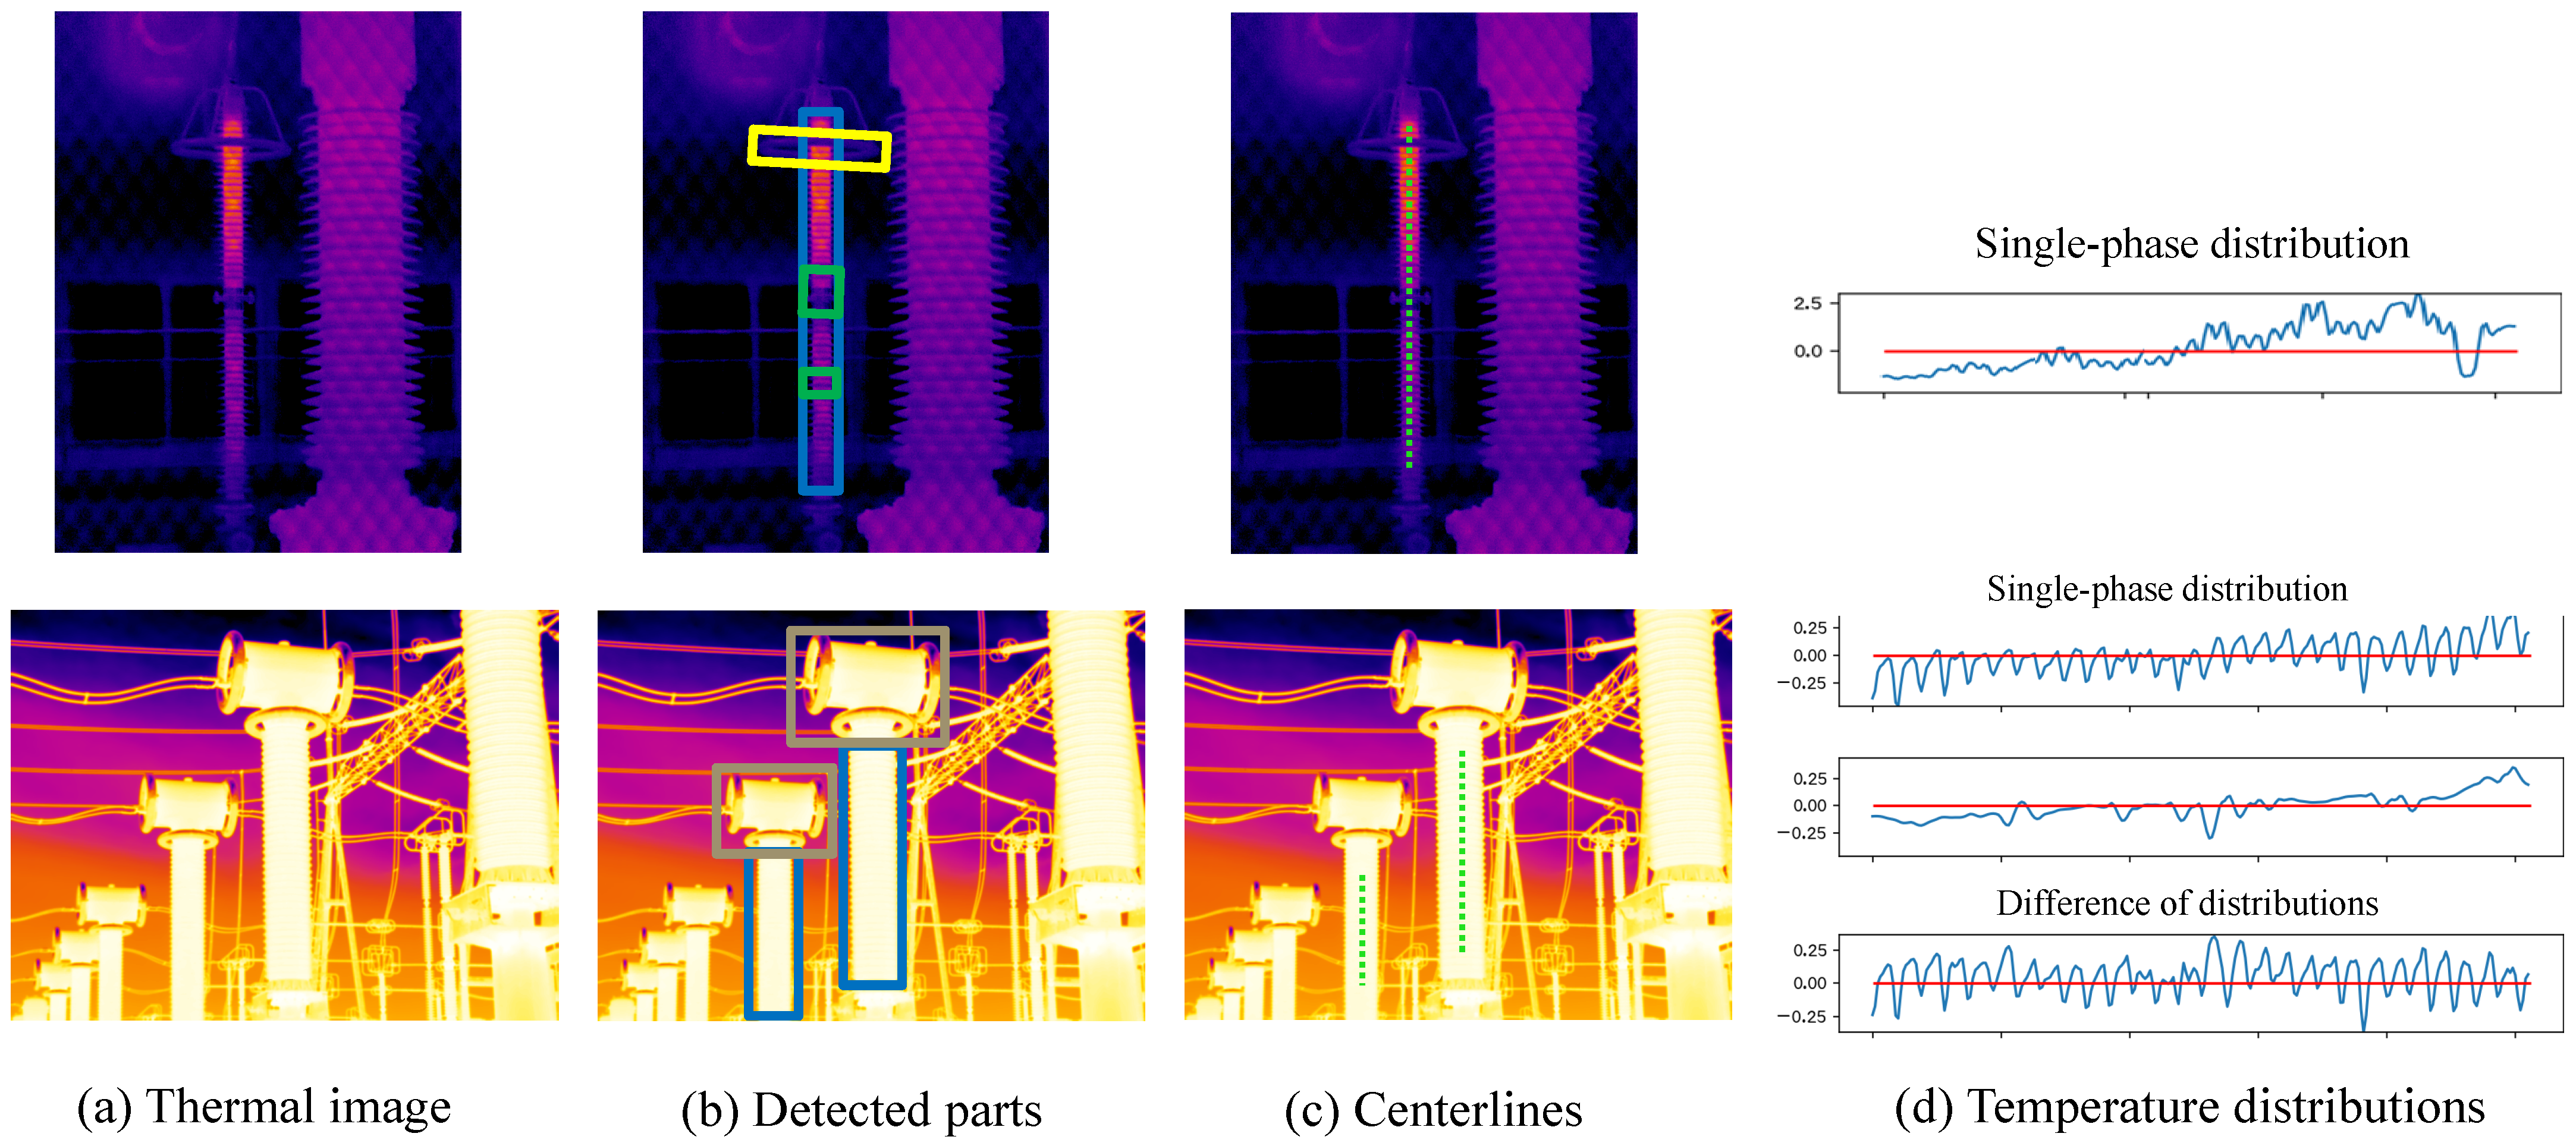
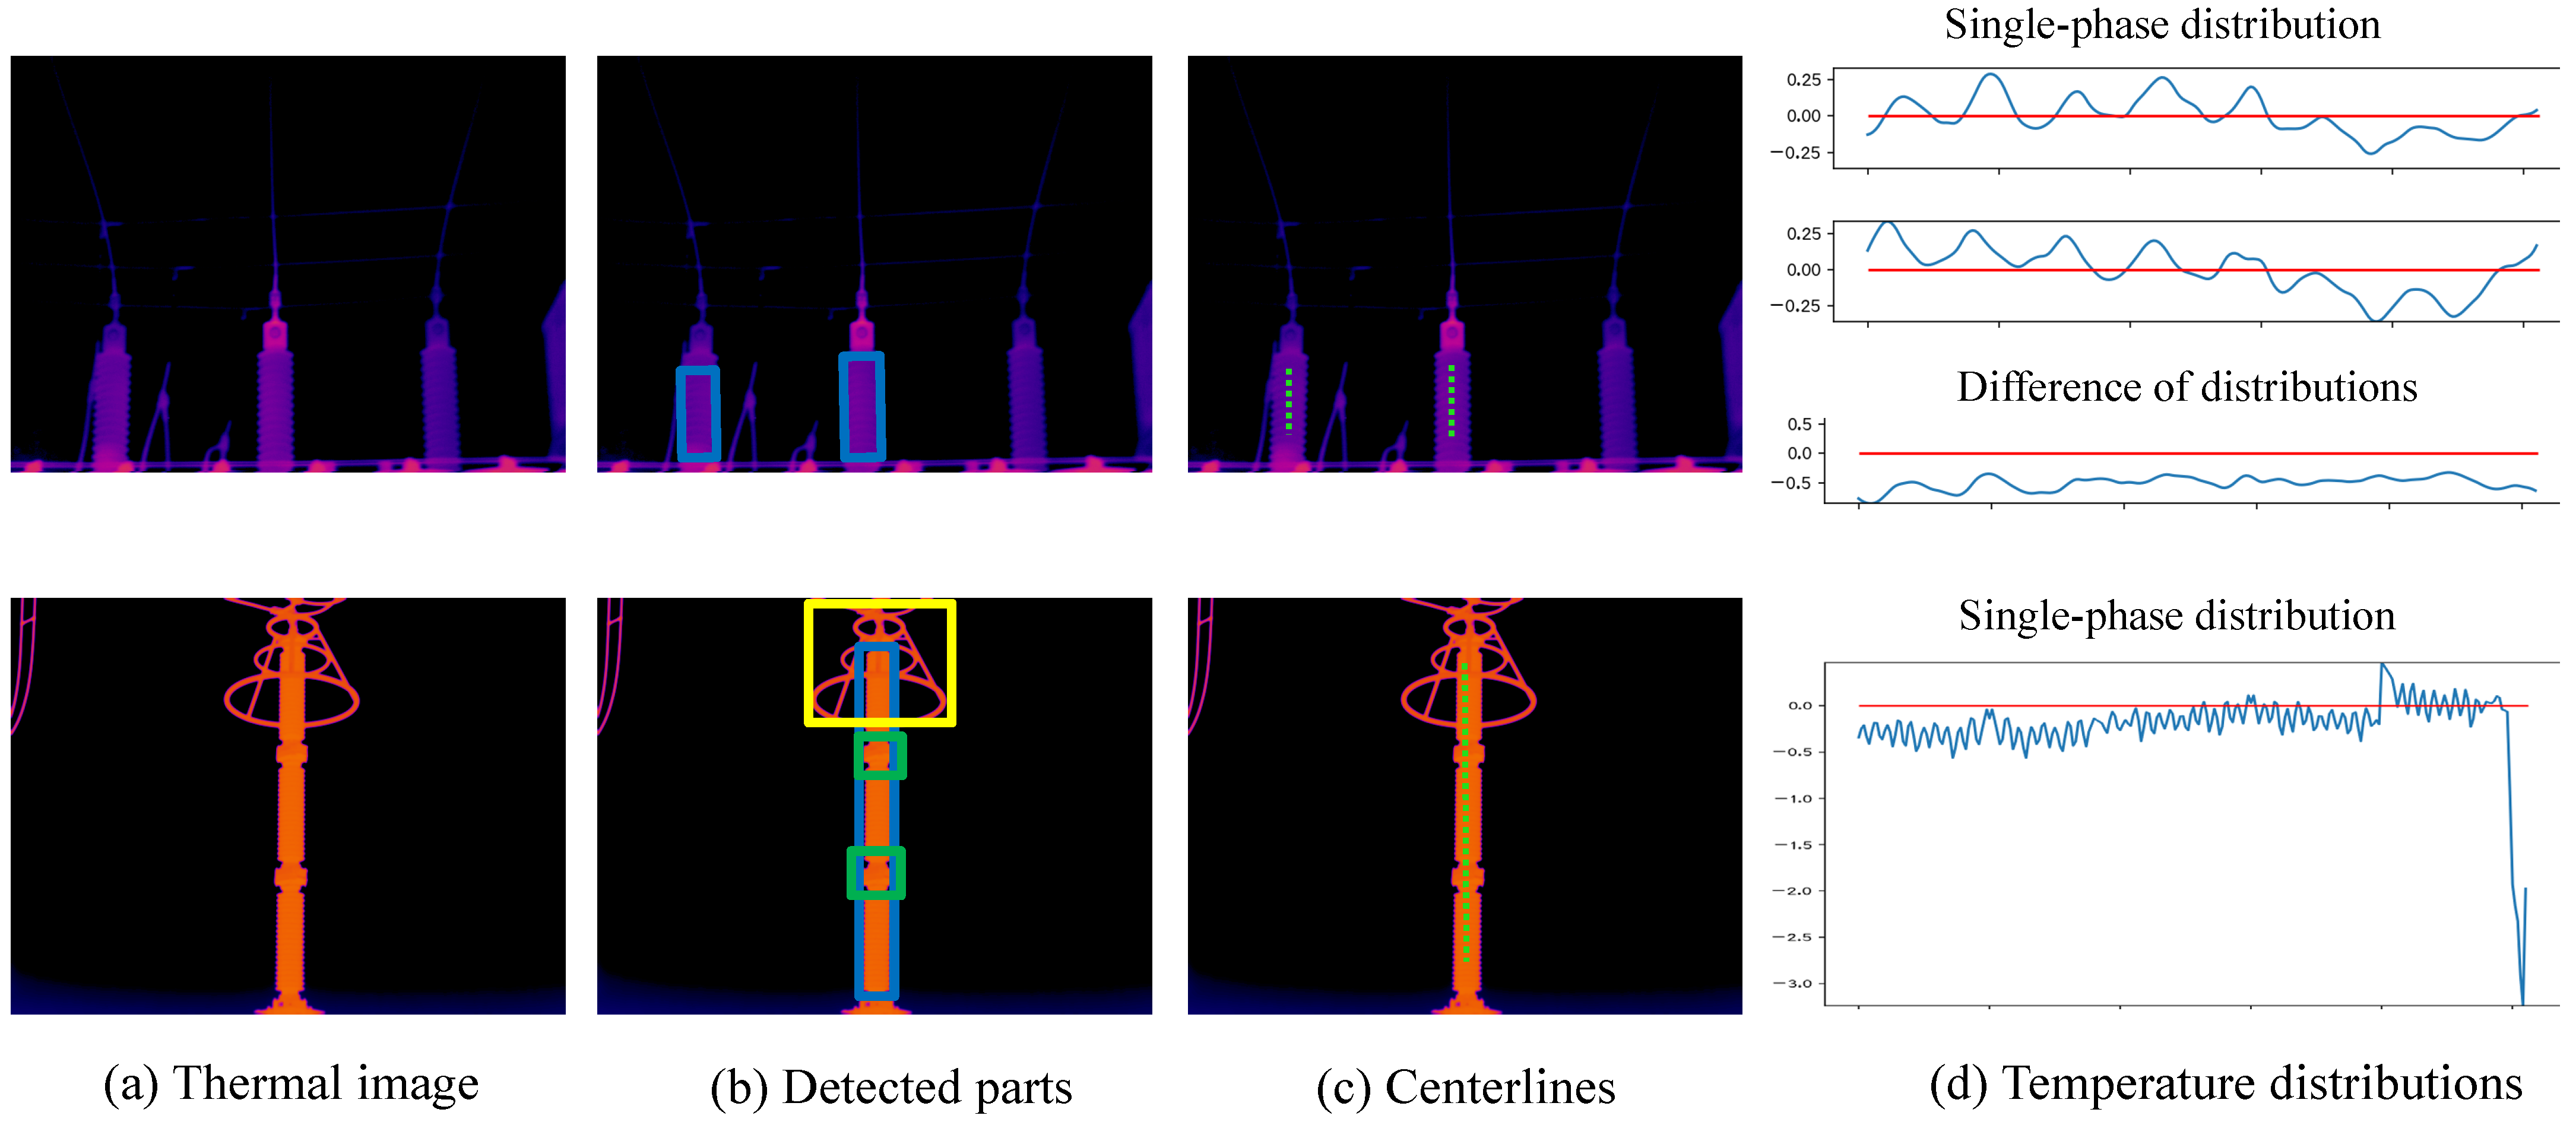
4.2.1. Feature Extraction

Given a thermal image along with its associated temperature matrix and the results of oriented part detection, we first select the parts belonging to the bushing or arc-extinguishing chamber classes. Then, we extract the temperature distribution along the centerline of these parts, as shown in Figure 4c,d. When extracting features from these temperature distributions, we need to consider the following two factors: (1) The temperature distribution varies due to weather and environmental changes, such as significant temperature differences between winter and summer. (2) There are significant differences in temperature distribution among different equipment parts. For example, the temperature of the bellows connecting two sections of a bushing may be lower than the overall temperature of the bushing. To mitigate these interferences, we subtract the mean of the distribution and remove the distributions outside the bushings. Then, for each single-phase scenario, we discretize the processed distribution to obtain a 256-dimensional feature. When multiple phases exist in one image, we additionally discretize the difference between the processed distributions of each pair of phases to obtain another type of feature with a dimension of 256 as well. Each type of these features is used to train a one-class SVM for defect diagnosis. The entire flowchart is illustrated in Figure 6.

4.2.2. One-Class SVM

Different from the conventional support vector machine (SVM) used in [23,24] that requires both normal and abnormal samples for learning, we adopt a one-class support vector machine (OC-SVM) [11] that is trained solely on normal data. OC-SVM learns a decision boundary that maximizes the separation between normal samples and the origin, considering outliers lying on the other side of the decision boundary as abnormal data. Formally, given a set of features { x 1 , , x N } extracted from normal samples, OC-SVM separates the feature set from the origin by solving the following quadratic problem:
min ω F , ξ i R N , ρ R 1 2 | | ω | | 2 + 1 ν N i = 1 N ξ i ρ subject to ω ϕ ( x i ) ρ ξ i , ξ i 0 .
Here, ν ( 0 , 1 ) is a parameter controlling the lower and upper bounds of samples. ϕ ( ) is a function mapping a feature into a dot product space F.
OC-SVM then creates a hyperplane characterized by ω and ρ . The decision function is
f ( x ) = sign i = 1 N α i ϕ ( x i ) · ϕ ( x ) ρ ,
where the coefficients α i are found as the solution of the dual problem:
min α 1 2 α i α j ϕ ( x i ) · ϕ ( x j ) subject to 0 α i 1 ν N , i = 1 N α i = 1 .
Once the one-class SVM is trained and a feature x of a test sample is provided, the sign of f ( x ) indicates whether the sample is an outlier or not. A positive sign indicates a normal sample, whereas a negative sign indicates that the sample is an outlier, potentially exhibiting a defect.

5. Experiments

5.1. Dataset and Evaluation Metrics

We begin by evaluating the performance of our oriented component detection module on a dataset that we constructed by ourselves. This dataset is collected using hand-held thermal cameras in multiple transformer substations and includes four major types of transformer equipment: current transformers (CT), voltage transformers (VT), surge arresters (SA), and circuit breakers (CB). Within this dataset, we manually label six types of components that appear in the four types of equipment, namely bushing, bellows, grading ring, bushing coupler, flange, and arc-extinguishing chamber, as shown in Figure 7d. The statistics of the number of images, equipment, and parts are listed in Table 1, and typical labeled samples are presented in the last column in Figure 7. To evaluate the one-class SVM-based defect diagnosis module, we randomly collect 1000 normal images with a single-phase bushing and 900 normal images with multi-phase bushings for training. Additionally, we have 103 normal images and 9 images with voltage-induced heating defects (due to the scarcity of data) for testing.
For the evaluation of oriented part detection, we follow the common practice of using the Average Precision (AP) for each class and the mean Average Precision (mAP) for all classes as the metrics. The AP measures the area under the precision-recall curve for a class. When computing precision and recall, we consider a predicted bounding box to be a true positive if the Intersection over Union (IoU) with the ground truth is greater than a threshold of 0.5, denoted as AP@50. In the case of defect detection, we utilize the defect recall rate and defect false positive rate as evaluation metrics.

5.2. Implementation Details

We implement our method in PyTorch and conduct all experiments on a single Nvidia GeForce RTX 3090 GPU. The training time for the oriented R-CNN model is approximately 10 h, whereas the one-class SVM model only takes around 2 s to train. The training batch size is set to 2. We adopt the AdamW algorithm with β 1 = 0.9, β 2 = 0.999, and a weight decay of 0.05 to train the oriented R-CNN model. The initial learning rate is set to 0.0001, and it is decreased by a factor of 10 at epochs 8 and 11.
During the training of the oriented part detection model, we apply the following data augmentation techniques to all training images: (1) Padding: we pad the shorter side of each image to ensure equal dimensions. (2) Resizing: the padded image is then resized to a fixed size of 1024 × 1024 pixels. (3) Random flipping: we randomly flip each image along the horizontal, vertical, and diagonal directions. (4) Mean-variance normalization: we normalize the images using the mean and variance of the training dataset. By incorporating these data augmentation techniques, the model can learn from a broader range of data variations, enhancing its ability to generalize and improve its robustness.

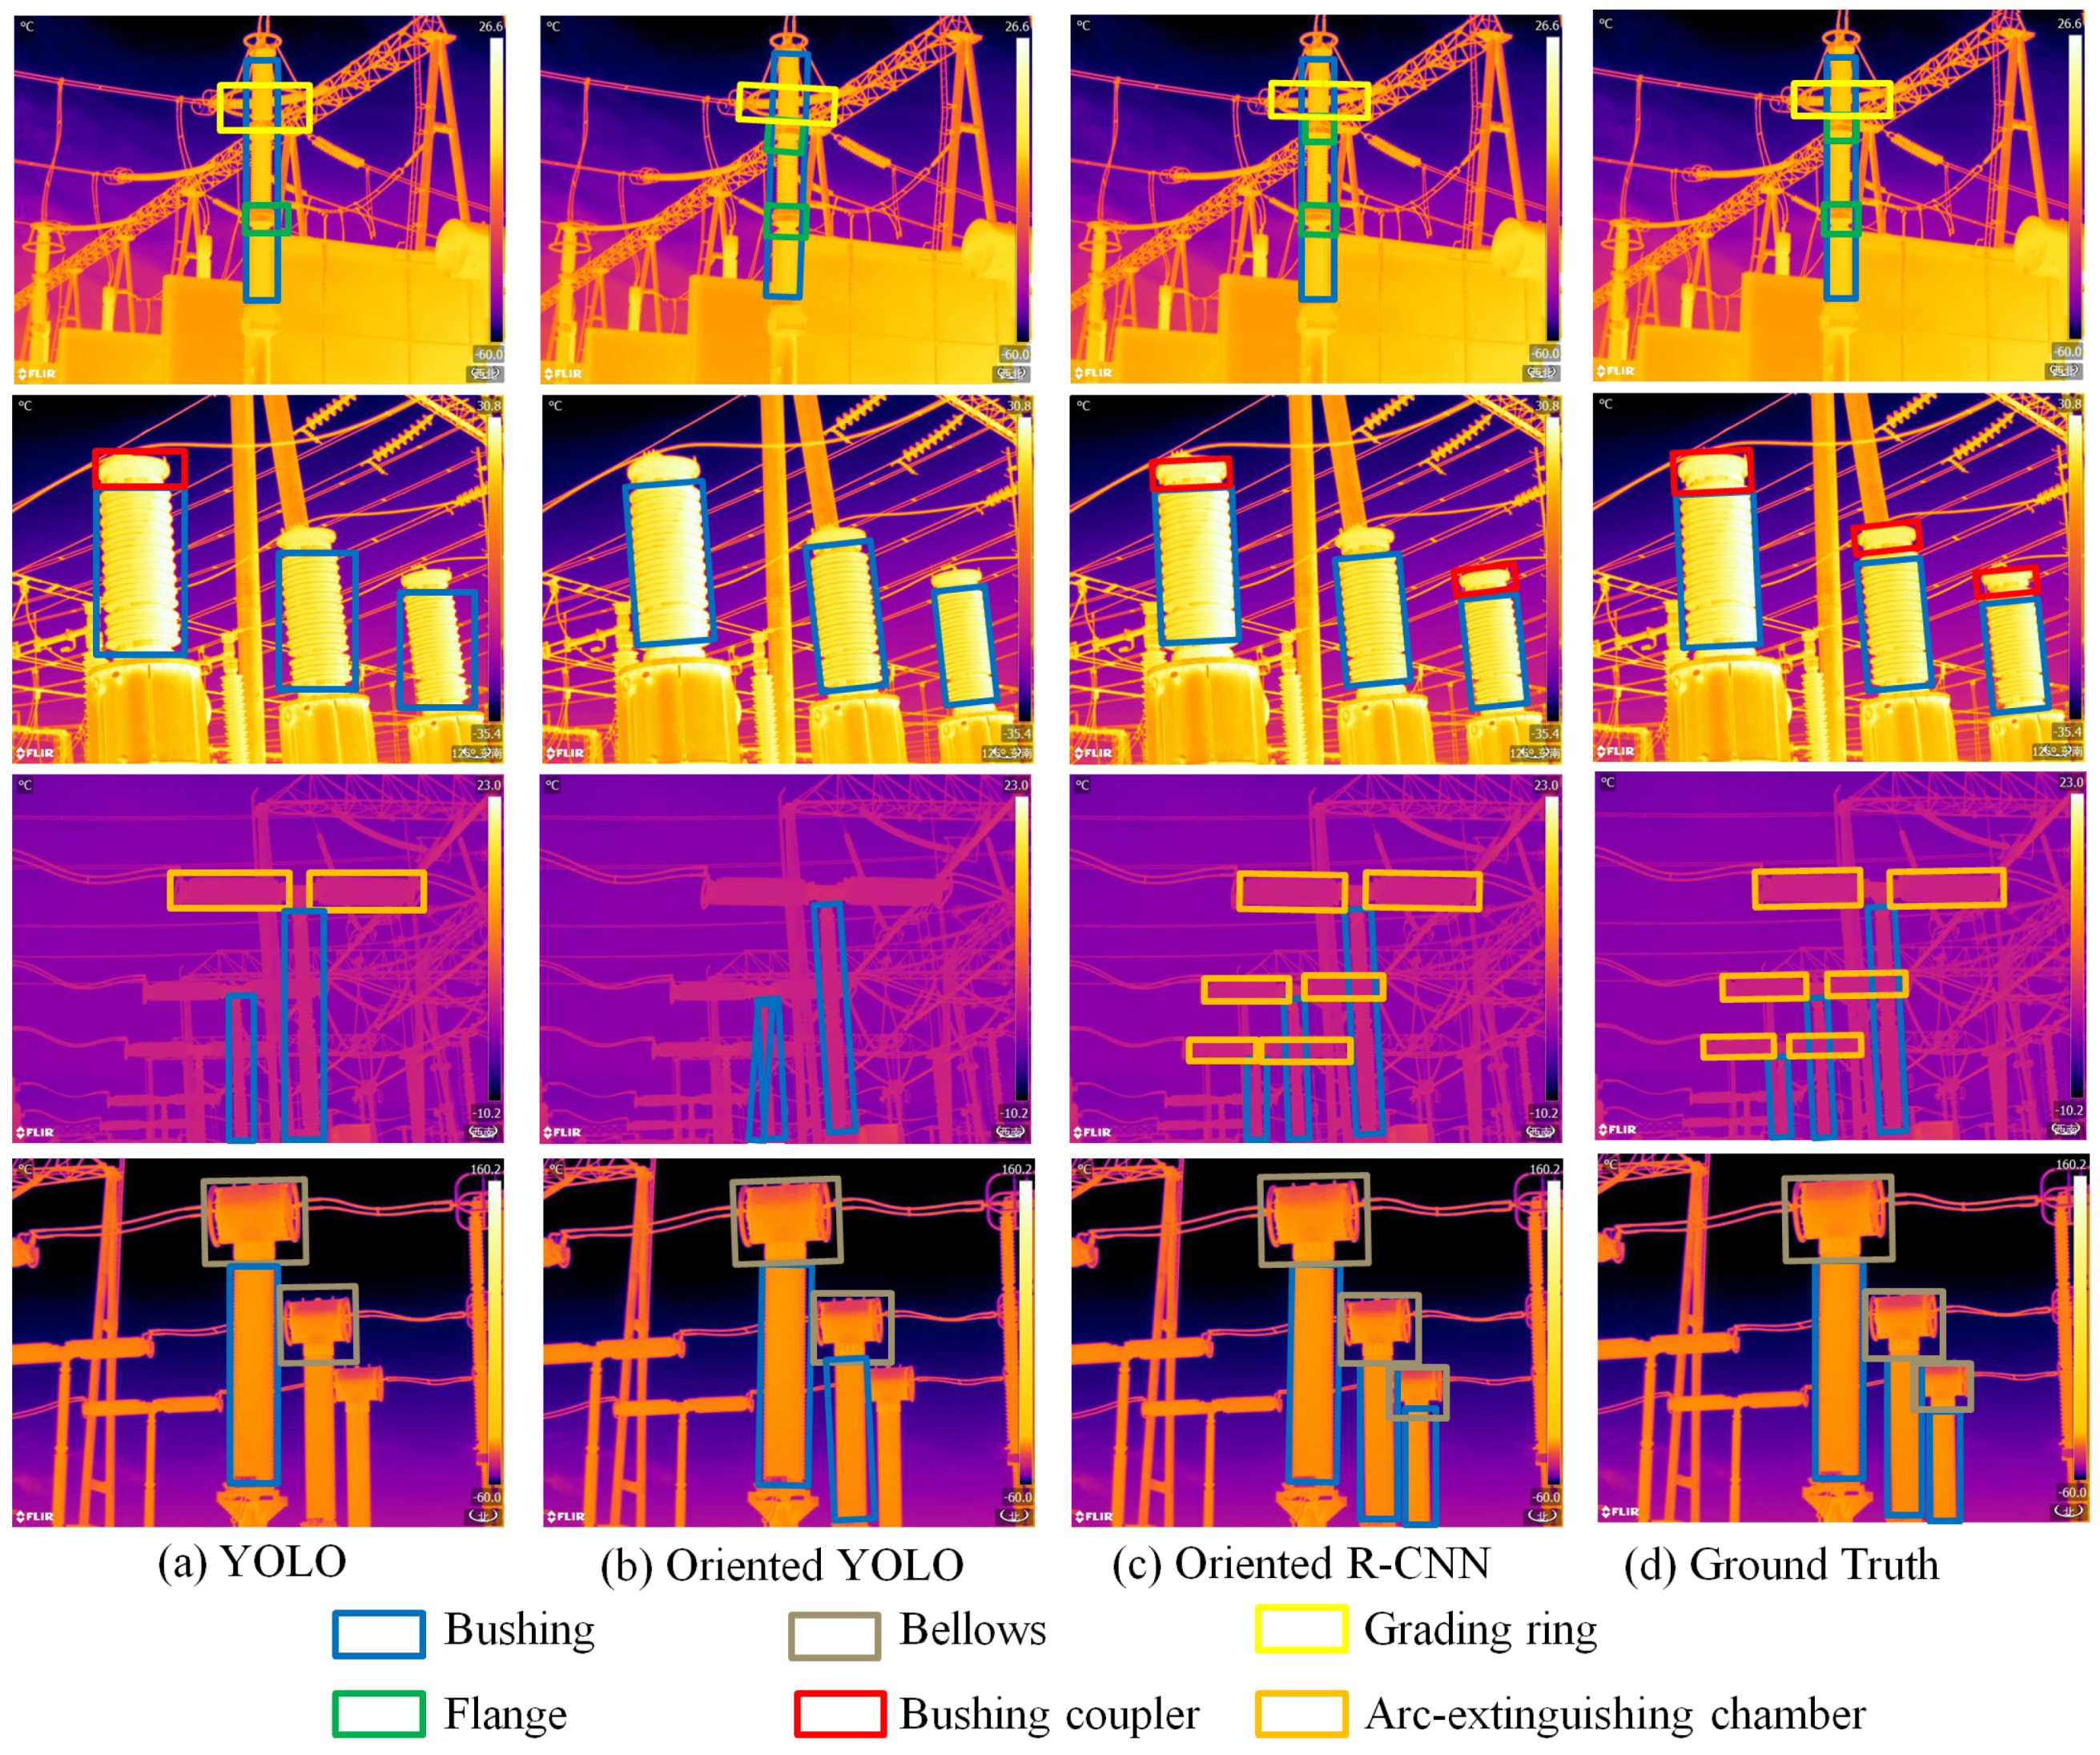
5.3. Effectiveness of Oriented Part Detection

We first conduct an investigation to assess the effectiveness of Oriented R-CNN for oriented part detection. To this end, various settings of this model, including different backbones (ResNet50 and Swin-T), training epochs, and various data augmentation strategies have been tested. The performance results are presented in Table 2. The table shows that the Swin-T-based backbone, trained for 40 epochs with horizontal flipping data augmentation, achieved the highest mean Average Precision (AP) for all classes, reaching an impressive 95.4 % .
We also compare this model to other typical object detection models, including Faster R-CNN [12], YOLO [13], and oriented YOLO [21]. The comparison results are reported in Table 3, whereas Figure 7 presents some qualitative comparisons. Table 3 demonstrates that Oriented R-CNN achieves the highest Average Precision (AP) for each class and the highest mean Average Precision (mAP) across all classes. The results in Figure 7 show that Oriented R-CNN retrieves oriented bounding boxes more accurately and aligns better with the oriented parts.

5.4. Effectiveness of Defect Diagnosis

In order to investigate the effectiveness of our one-class SVM-based defect diagnosis method, we randomly selected 103 images containing bushings or arc-extinguishing chambers from the remaining dataset. Unfortunately, due to the rarity of voltage-induced heating defects, we were only able to collect nine defective images. We used both these normal and defective images for testing. Among the nine defective images, eight were correctly detected as defects. Among the 103 normal images, only one image is mistakenly classified as abnormal. This indicates a recall rate of 88.89% and a false positive rate of 0.97%.
Figure 8 presents typical examples that are correctly diagnosed. As shown in the first row, the voltage-induced heating defect leads to a temperature distribution with noticeable variation. The normal example in the second row shows very subtle temperature variations over the entire bushing. Figure 9 presents two failed cases, where the first case is defective but detected as normal, and the second one is normal but detected as defective. The reason for the failure in the first example is the absence of the top part of the bushing, where the defect occurs. In the second example, the failure lies in the inclusion of temperature distributions from equipment parts other than bushings, which exhibit significant differences.

6. Conclusions

In this work, we have presented a two-stage method for effectively detecting voltage-induced heating defects. Due to the limited availability of defective samples and the abundance of normal images, we trained both the oriented part detection model in the first stage and the one-class SVM model in the second stage using normal samples only. The experimental results on our self-collected dataset demonstrate the effectiveness of our proposed method. The part detection model achieves an mAP of 95.4%, whereas the defect detection achieves a recall rate of 88.89% and a false positive rate of 0.97%. These results highlight the accuracy of our approach in detecting voltage-induced heating defects while maintaining a low false positive rate. This research is particularly valuable considering the scarcity of defect data and the specific characteristics associated with these types of defects. By contributing to the improvement of defect detection techniques, our work enhances the overall safety and performance of such equipment.

Author Contributions

Methodology, Y.L.; Investigation, Z.L.; Resources, Y.S.; Writing—original draft, Y.Y.; Writing—review & editing, Y.L. and W.Z.; Supervision, Y.L.; Funding acquisition, Y.L. All authors have read and agreed to the published version of the manuscript.

Funding

This work was financially supported by Science and Technology Project fund of State Grid Shandong Electric Power Company (No. 520626220008; No. 2022A-018).

Data Availability Statement

Data available on request due to restrictions e.g., privacy or ethical.

Conflicts of Interest

The authors declare no conflict of interest. The funders had no role in the design of the study; in the collection, analyses, or interpretation of data; in the writing of the manuscript; or in the decision to publish the results.

References

  1. Hou, F.; Zhang, Y.; Zhou, Y.; Zhang, M.; Lv, B.; Wu, J. Review on Infrared Imaging Technology. Sustainability 2022, 14, 11161. [Google Scholar] [CrossRef]
  2. Jadin, M.S.; Taib, S. Recent progress in diagnosing the reliability of electrical equipment by using infrared thermography. Infrared Phys. Technol. 2012, 55, 236–245. [Google Scholar] [CrossRef]
  3. Guo, C.; Ren, M.; Xia, C.; Dong, M.; Wang, B. Fault Diagnosis of Power Equipment Based on Infrared Image Analysis. In Proceedings of the 2020 IEEE International Conference on Advances in Electrical Engineering and Computer Applications (AEECA), Dalian, China, 25–27 August 2020; pp. 659–663. [Google Scholar] [CrossRef]
  4. Balakrishnan, G.K.; Yaw, C.T.; Koh, S.P.; Abedin, T.; Raj, A.A.; Tiong, S.K.; Chen, C.P. A Review of Infrared Thermography for Condition-Based Monitoring in Electrical Energy: Applications and Recommendations. Energies 2022, 15, 6000. [Google Scholar] [CrossRef]
  5. Attallah, O.; Ibrahim, R.A.; Zakzouk, N.E. Fault diagnosis for induction generator-based wind turbine using ensemble deep learning techniques. Energy Rep. 2022, 8, 12787–12798. [Google Scholar] [CrossRef]
  6. Attallah, O.; Ibrahim, R.A.; Zakzouk, N.E. CAD system for inter-turn fault diagnosis of offshore wind turbines via multi-CNNs & feature selection. Renew. Energy 2023, 203, 870–880. [Google Scholar] [CrossRef]
  7. Huda, A.; Taib, S. Suitable features selection for monitoring thermal condition of electrical equipment using infrared thermography. Infrared Phys. Technol. 2013, 61, 184–191. [Google Scholar] [CrossRef]
  8. Zarco-Periñán, P.J.; Martínez-Ramos, J.L.; Zarco-Soto, F.J. A novel method to correct temperature problems revealed by infrared thermography in electrical substations. Infrared Phys. Technol. 2021, 113, 103623. [Google Scholar] [CrossRef]
  9. Lin, Y.; Zhang, W.; Zhang, H.; Bai, D.; Li, J.; Xu, R. An intelligent infrared image fault diagnosis for electrical equipment. In Proceedings of the 2020 5th Asia Conference on Power and Electrical Engineering (ACPEE), Chengdu, China, 4–7 June 2020; pp. 1829–1833. [Google Scholar] [CrossRef]
  10. Xie, X.; Cheng, G.; Wang, J.; Yao, X.; Han, J. Oriented R-CNN for Object Detection. In Proceedings of the 2021 IEEE/CVF International Conference on Computer Vision (ICCV), Montreal, BC, Canada, 11–17 October 2021; pp. 3500–3509. [Google Scholar] [CrossRef]
  11. Schölkopf, B.; Williamson, R.; Smola, A.; Shawe-Taylor, J.; Platt, J. Support Vector Method for Novelty Detection. In Proceedings of the Neural Information Processing Systems, NIPS’99; MIT Press: Cambridge, MA, USA, 1999; pp. 582–588. [Google Scholar]
  12. Ren, S.; He, K.; Girshick, R.; Sun, J. Faster R-CNN: Towards Real-Time Object Detection with Region Proposal Networks. In Proceedings of the Advances in Neural Information Processing Systems; Cortes, C., Lawrence, N., Lee, D., Sugiyama, M., Garnett, R., Eds.; Curran Associates, Inc.: Red Hook, NY, USA, 2015; Volume 28. [Google Scholar]
  13. Redmon, J.; Divvala, S.; Girshick, R.; Farhadi, A. You Only Look Once: Unified, Real-Time Object Detection. In Proceedings of the 2016 IEEE Conference on Computer Vision and Pattern Recognition (CVPR), Las Vegas, NV, USA, 27–30 June 2016; pp. 779–788. [Google Scholar] [CrossRef]
  14. Duan, K.; Bai, S.; Xie, L.; Qi, H.; Huang, Q.; Tian, Q. CenterNet: Keypoint Triplets for Object Detection. In Proceedings of the 2019 IEEE/CVF International Conference on Computer Vision (ICCV), Seoul, Republic of Korea, 27 October–2 November 2019; pp. 6568–6577. [Google Scholar] [CrossRef]
  15. Liu, Y.; Ji, X.; Pei, S.; Ma, Z.; Zhang, G.; Lin, Y.; Chen, Y. Research on automatic location and recognition of insulators in substation based on YOLOv3. High Voltage 2020, 5, 62–68. [Google Scholar] [CrossRef]
  16. Han, S.; Yang, F.; Yang, G.; Gao, B.; Zhang, N.; Wang, D. Electrical equipment identification in infrared images based on ROI-selected CNN method. Electr. Power Syst. Res. 2020, 188, 106534. [Google Scholar] [CrossRef]
  17. Jiang, C.; Ren, H.; Ye, X.; Zhu, J.; Zeng, H.; Nan, Y.; Sun, M.; Ren, X.; Huo, H. Object detection from UAV thermal infrared images and videos using YOLO models. Int. J. Appl. Earth Obs. Geoinf. 2022, 112, 102912. [Google Scholar] [CrossRef]
  18. Han, S.; Yang, F.; Jiang, H.; Yang, G.; Wang, D.; Zhang, N. Statistical analysis of infrared thermogram for CNN-based electrical equipment identification methods. Appl. Artif. Intell. 2022, 36, 2004348. [Google Scholar] [CrossRef]
  19. Chen, L.C.; Zhu, Y.; Papandreou, G.; Schroff, F.; Adam, H. Encoder-Decoder with Atrous Separable Convolution for Semantic Image Segmentation. In Proceedings of the European Conference on Computer Vision (ECCV), Munich, Germany, 8–14 September 2018; Ferrari, V., Hebert, M., Sminchisescu, C., Weiss, Y., Eds.; Springer: Cham, Switzerland, 2018; pp. 833–851. [Google Scholar]
  20. Wang, F.; Guo, Y.; Li, C.; Lu, A.; Ding, Z.; Tang, J.; Luo, B. Electrical Thermal Image Semantic Segmentation: Large-Scale Dataset and Baseline. IEEE Trans. Instrum. Meas. 2022, 71, 1–13. [Google Scholar] [CrossRef]
  21. Gong, X.; Yao, Q.; Wang, M.; Lin, Y. A Deep Learning Approach for Oriented Electrical Equipment Detection in Thermal Images. IEEE Access 2018, 6, 41590–41597. [Google Scholar] [CrossRef]
  22. Zheng, H.; Liu, Y.; Sun, Y.; Li, J.; Shi, Z.; Zhang, C.; Lai, C.S.; Lai, L.L. Arbitrary-Oriented Detection of Insulators in Thermal Imagery via Rotation Region Network. IEEE Trans. Ind. Inform. 2022, 18, 5242–5252. [Google Scholar] [CrossRef]
  23. Zou, H.; Huang, F. An intelligent fault diagnosis method for electrical equipment using infrared images. In Proceedings of the 2015 34th Chinese Control Conference (CCC), Hangzhou, China, 28–30 July 2015; pp. 6372–6376. [Google Scholar] [CrossRef]
  24. Ullah, I.; Khan, R.U.; Yang, F.; Wuttisittikulkij, L. Deep Learning Image-Based Defect Detection in High Voltage Electrical Equipment. Energies 2020, 13, 392. [Google Scholar] [CrossRef]
  25. Krizhevsky, A.; Sutskever, I.; Hinton, G.E. ImageNet Classification with Deep Convolutional Neural Networks. In Proceedings of the Advances in Neural Information Processing Systems; Pereira, F., Burges, C., Bottou, L., Weinberger, K., Eds.; Curran Associates, Inc.: Red Hook, NY, USA, 2012; Volume 25. [Google Scholar]
  26. Li, B.; Wang, T.; Hu, Z.; Yuan, C.; Zhai, Y. Two-Level Model for Detecting Substation Defects from Infrared Images. Sensors 2022, 22, 6861. [Google Scholar] [CrossRef] [PubMed]
  27. He, K.; Gkioxari, G.; Dollár, P.; Girshick, R. Mask R-CNN. In Proceedings of the 2017 IEEE International Conference on Computer Vision (ICCV), Venice, Italy, 22–29 October 2017; pp. 2980–2988. [Google Scholar] [CrossRef]
  28. Bolya, D.; Zhou, C.; Xiao, F.; Lee, Y.J. YOLACT: Real-Time Instance Segmentation. In Proceedings of the 2019 IEEE/CVF International Conference on Computer Vision (ICCV), Seoul, Republic of Korea, 27 October–2 November 2019; pp. 9156–9165. [Google Scholar] [CrossRef]
  29. DL/T 664-2016; Infrared Diagnostic Application Specification for Live Equipment. China Electric Power Research Institute: Beijing, China, 2016.
  30. Lin, T.Y.; Dollár, P.; Girshick, R.; He, K.; Hariharan, B.; Belongie, S. Feature Pyramid Networks for Object Detection. In Proceedings of the 2017 IEEE Conference on Computer Vision and Pattern Recognition (CVPR), Honolulu, HI, USA, 21–26 July 2017; pp. 936–944. [Google Scholar] [CrossRef]
Figure 1. Typical examples of defects in substation equipment. Images (ac) illustrate current-induced heating defects, which often manifest as hotspots on the equipment and are relatively easier to detect. Images (df) demonstrate voltage-induced heating defects, which result in uneven temperature distributions within a single phase or across multiple phases of the equipment. These defects are not easily detected by simply identifying regions of excessive heat, as the temperature variations may be subtle.
Energies 16 08036 g001
Figure 2. Illustration of various equipment localization methods. (a) is a thermal image, (b) is segmentation result obtained by DeepLab, (c) is object detection result obtained by YOLO, and (d) shows the result obtained by oriented R-CNN. Compared to (b,c), the oriented bounding boxes detected in (d) help us to localize the centerline of equipment parts more accurately.
Energies 16 08036 g002
Figure 3. Typical examples of voltage-induced heating defects and temperature distribution along the centerline of each equipment component [29]. In (a), we observe abrupt temperature changes within a single-phase equipment, whereas (b) shows variations in temperature distribution across two phases of the equipment.
Energies 16 08036 g003
Figure 4. An overview of the proposed two-stage approach for voltage-induced heating defect detection. The first stage is to localize oriented equipment parts by the oriented R-CNN model. The second stage first extracts features from the temperature distributions along the centerlines of the target parts and then trains one-class SVMs for defect diagnosis.
Energies 16 08036 g004
Figure 5. The architecture of oriented R-CNN. It employs the feature pyramid network (FPN) [30] as the backbone to extract feature maps, followed by an oriented region proposal network (RPN) and an oriented R-CNN head. The RPN is responsible for generating oriented proposals, whereas the R-CNN head performs the classification and regression of these proposals.
Energies 16 08036 g005
Figure 6. The flowchart of feature extraction and one-class SVM-based defect diagnosis.
Energies 16 08036 g006
Figure 7. The qualitative comparison results obtained by different part detection methods. From top to bottom, the equipment is arrester, potential transformer (PT), breaker, and current transformer (CT), respectively.
Energies 16 08036 g007
Figure 8. Correctly diagnosed examples. The first row shows an example with voltage-induced heating defect, in which the temperature distribution exhibits a noticeable variation. The second row is a normal example, with very subtle temperature variations over the entire bushing.
Energies 16 08036 g008
Figure 9. Failed cases. The first row shows an example with a defect but detected as normal, and the second one is a normal example detected as defective.
Energies 16 08036 g009
Table 1. The number of different parts, equipment, and images in the dataset.
EquipmentCurrent TransformerPotential TransformerArresterBreakerTotal No. of Parts
Part
Bushing23651641150617717283
Bellows23650002365
Grading ring0478150601984
Bushing coupler033400334
Flange01737184703584
Arc-extinguishing chamber00020192019
Total no. of equipment (no. of images)2365 (1123)1641 (1159)1506 (644)1984 (1136)7283 (4062)
Table 2. The performance of oriented part detection obtained by the oriented R-CNN model under different settings. Here, ‘H’, ‘V’, and ‘D’ refer to random flips along the horizontal, vertical, and diagonal directions, respectively.
BackboneEpochsAugmentationmAP (%)
ResNet5012H, V, D89.8
H90.5
40H, V, D93.3
H94.5
Swin-T40H, V, D93.8
H95.4
Table 3. The comparison of part detection results in terms of AP (%) and mAP (%).
PartBushingBellowsBushing CouplerGrading RingFlangeArc-Extinguishing ChambermAP (%)
Method
Faster R-CNN [12]82.984.895.090.895.254.583.9
YOLO [13]78.181.794.387.291.053.581.0
Oriented YOLO [21]82.083.390.395.393.571.886.0
Oriented R-CNN90.990.999.899.999.990.995.4
Disclaimer/Publisher’s Note: The statements, opinions and data contained in all publications are solely those of the individual author(s) and contributor(s) and not of MDPI and/or the editor(s). MDPI and/or the editor(s) disclaim responsibility for any injury to people or property resulting from any ideas, methods, instructions or products referred to in the content.

