Abstract
Modifying reservoir surface wetting properties is an appealing topic to the upstream oil and gas industry for enhancing hydrocarbon recovery as the shifting of reservoir rock surface wetting from oil-wet to water-wet has enhanced the oil recovery by as much as 70–80%. In the last few decades, research has been conducted on core flooding experiments to reveal wettability alteration mechanisms associated with macroscopic fluid flow in reservoirs. In recent years, the microscopic wetting state and fluid distribution behavior have been studied using micromodel experimental techniques to promote the fundamental mechanisms of wettability alteration. To provide the concurrent knowledge and technology development, this comprehensive review focuses on micromodel investigations for wettability alteration in chemical-enhanced oil recovery using surfactants and/or nanofluids that reveal microscopic behaviors on the wetting state, fluid distribution, and their associated mechanisms. This comprehensive review focuses on micromodel investigations for wettability alteration in chemical-enhanced oil recovery using surfactants and/or nanofluids that reveal microscopic behaviors on the wetting state, fluid distribution, and their associated mechanisms. Wettability characteristics and measurement techniques are thoroughly assessed to understand the critical role of wettability for enhanced oil recovery. With the microfluidic-based studies, the effect of relative permeability along with the pore network and wetting order on oil recovery have been discussed. Later on, the new development in phase diagram related to viscus fingering and capillary fingering regime have been reviewed via various micromodels. Then, the wettability alteration mechanisms and governing parameters by surfactant and nanoparticles are summarized. Additionally, recent micromodel experiments on surfactants and nanofluid-assisted enhanced oil recovery are reviewed and listed, along with their fabrication methods.
1. Introduction
Oil has been a primary source of energy for the last centuries. Along with technological advancement, energy consumption has increased over the years. Based on the current energy consumption growth rate, the energy demands will be estimated to be around 260 peta watthours by 2050, nearly 50% higher than the current consumption [1]. Recently, many non-conventional and renewable energy sources have been used to reduce the dependency on environmentally harmful resources. Nonetheless, due to the inherently low efficiency and sluggish development of renewable energy technologies, conventional oils are expected to be our primary energy source for the foreseeable future. To meet the increasing energy demands, the recovery rate of conventional oils needs to be increased because only 10% of oils out of total deposits can be recovered from the reservoir via traditional extraction methods [2]. Therefore, several enhanced oil recovery (EOR) techniques have been developed and implemented in the oil recovery process. There are three main stages to completing oil extraction processes: primary, secondary, and tertiary oil recovery [3]. The primary oil recovery process is the first stage of hydrocarbon production, achieved by the reservoir’s natural driving forces, initially present in the reservoir due to rock and fluid expansion, solution gas, water influx, gas cap, and gravity drainage [4]. From the primary process, nearly 10% of oil within the reservoir can be recovered [2]. This small percentage of oil recovery causes the secondary and tertiary processes to extract additional oil from the reservoir. In the secondary recovery process, external fluids like water and gas are injected to recover more oil via a volumetric sweep of the original oil in place (OOIP) while maintaining additional pressure in the reservoir [5]. Water or immiscible gas injections are the most common techniques used in this process [6]. Despite primary and secondary recovery implementation, around 70% of oil remains in the reservoirs [7].
The tertiary recovery method targets immobile oil remaining within the reservoir after the secondary recovery process is completed because primary and secondary oil recovery processes mainly target mobile oil in the reservoir [8]. Tertiary recovery is generally completed by injecting chemicals, gasses, and thermal energy [9]. The term “enhanced oil recovery (EOR)” was adopted in place of tertiary recovery because the chronological term “tertiary” does not suitably describe certain unconventional recovery operations that are applied as a secondary recovery method [9]. In EOR processes, injected fluids interact with the rock, oil, and brine system within the reservoir, altering the reservoir’s rock and fluid properties. Using the appropriate method of injection of gases, thermal energy, and chemicals can significantly impact reservoir oil production efficiency [9]. The major EOR processes, main mechanisms, and challenges are described in detail in Table 1.

Table 1.
Mechanisms and challenges of different EOR methods [6].
An appropriate EOR method should be selected to maximize recovery efficiency based on the wide range of reservoir properties like temperature, depth, the permeability of porous structure, and the type of rocks. In the past few decades, EOR projects have been accomplished mainly based on thermal methods [10]. However, recent target reservoirs for oil recovery are located at higher depths as the old reservoirs are depleted, which makes the thermal method unsuited as this method is not economically efficient at deeper depths [11]. In contrast, chemical EOR methods show great potential in deep reservoirs due to their technical and economic feasibility [11]. Over decades of research, wettability alteration, interfacial tension reduction (IFT), and mobility ratio have been identified as primary governing mechanisms in these methods. In EOR, the wettability alteration is preferably conducted to make the rock reservoir surface water-wet (hydrophilic) from oil-wet (hydrophobic), leading to easy oil extraction. In chemical EOR, wettability alteration is mostly achieved by chemical flooding, which includes surfactant flooding, injection of polymer solutions, alkaline flooding, and nanoparticles suspended in fluids termed nanofluid flooding (also known as nano-assisted flooding).
Many reviews have been published on a specific aspect of the wettability alteration. For example, there is a comprehensive review of theoretical and experimental advancement in surfactant-induced EOR with published literature, mainly from 1970 to 2010 [12]. In this review, the evolution of reservoir wettability and its effect on oil recovery was discussed. Additionally, based on the experimental results of over a half-decade, it was discussed that the effectiveness of surfactants depends not only on the wetting condition of the reservoir but also on other conditions like capillary pressure, rock mineralogy, and porosity. In addition, the chemicals used in wettability alteration and their feasibility were summarized [13]. Based on more than 100 experimental research publications, they found that chemical-based EOR is most effective when conducted in light oil reservoirs. They discussed the need for screening criteria for the use of surfactants. Furthermore, there is a thorough review of the factors affecting surfactant flooding, including the effect of phase behavior, adsorption, and structure–property relationship on wettability alteration [14]. It was concluded that the wettability alteration of sandstone reservoirs requires more attention due to its varying parameters and challenging implementation. Another critical review summarizes the experimental work on nanofluid-assisted wettability alteration [15]. Based on many experimental results, they summarized the mechanisms and factors affecting wettability alteration by nanofluid flooding. Despite the available work for reviews, concerns about a lack the understanding of the wettability alteration mechanisms in various reservoir conditions still exist. Fortunately, an emerging technology, microfluidics associated with microfabrication and reservoir micromodels, has been implemented over the last decades to better understand wettability alteration mechanisms in EOR. The microfluidic technologies enable real-time in situ visualization and various contactless measurements to assess the geochemical changes during the EOR to further understand the underlying mechanism like wettability alteration, which was not possible in the core-based experiments.
Before discussing the new development in understanding the underlying EOR mechanism, we must clarify the microfluidic reservoir technologies and how they closely mimic the actual reservoir conditions. In the initial phase, the microfluidic platforms of reservoir porous structures were mostly fabricated from glass, silicon, and polymeric materials like PMMA, with well-documented methods like acid etching, lithography, and laser cutting. These models were not able to mimic certain properties of the reservoir, such as different wetting orders and the geochemistry of carbonate or sandstone rocks. However, the new fabrication techniques have removed these limitations. Firstly, actual calcite rock was used to fabricate a 2D porous network by acid itching (Figure 1a) [16]. It enabled the assessment of the geochemical effect of reservoir rock on EOR, along with flow visualization. Later, the in situ growth of CaCO3 crystals in the micromodels was visualized by providing Ca2+ and CO32− ion-rich solutions to the targeted zones in the channels. This process enables the fabrication of synthetic carbonate rock reservoir surfaces in the micromodels (Figure 1b) [17]. A coated CaCO3 nanocrystal layer on the borosilicate surface of the microchannel with a controlled thickness of 1–2 μm (Figure 1c) was used to mimic the reservoir structure [18]. Furthermore, well-established methods like salinization, UV-ozone treatment, and UV-initiated polymer grafting are used to achieve different wetting orders into the micromodels. An article about the tailored wetting order in the same pore network was published. In their study, different polymeric crosslinkers with different ratios of hydrophobic and hydrophilic reactive groups were polymerized via UV exposure, modulating a wide range from 60° to 144° contact angle (Figure 2) [19].
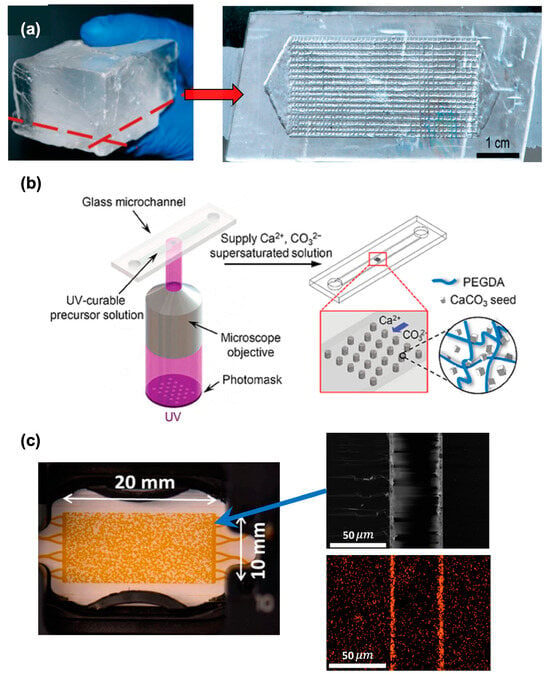
Figure 1.
Evolution of microfluidic fabrication to mimic reservoir rock. (a) Microchannel made out of real calcite rock by acid etching process; (b) in situ growth of CaCO3; (c) nanocrystal layer of CaCO3 in microchannel surface (left—actual microchannel image; right—electron image and electron diffraction spectroscopic image of calcium).
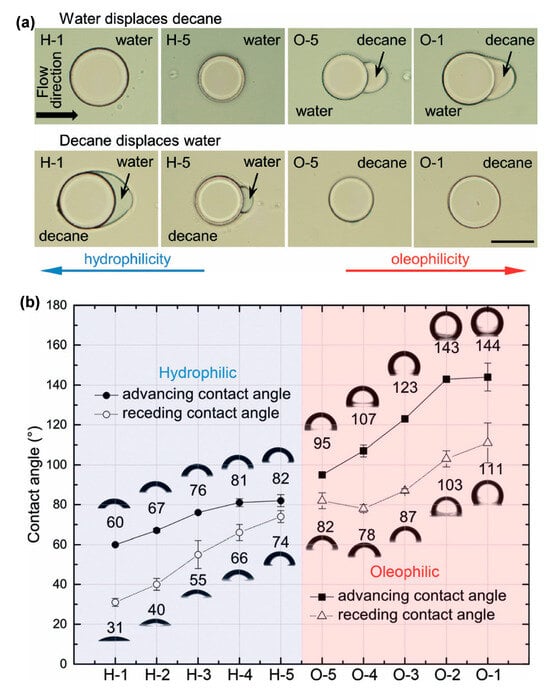
Figure 2.
Demonstration of tailored wetting order in microchannel surface. (a) Actual image of hydrophilic and oleophilic surfaces with H-1 being most hydrophilic and O-1 being most oleophilic (scale bar is 100 µm long). (b) The graph shows the image of different contact angles obtained via different polymeric crosslinkers.
This review is uniquely articulated to cover a fundamental understanding of wettability alteration and then its transition to the new development in the wettability alteration mechanisms, especially related to micromodel-based research. In this work, we provide a comprehensive review for a fundamental understanding of wettability alteration by surfactants and nanofluids with its recent development using microfluidic experiments. In Section 2, we cover the characteristics of wettability, its fundamental measurement techniques, and the effect of reservoir wettability on oil recovery. The following section is dedicated to surfactant-assisted wettability alteration, where different surfactants and their mechanism are thoroughly discussed with microfluidic experimental examples. Similarly, Section 4 discusses nanofluid-based oil recovery with microfluidics. Lastly, the future challenges and opportunities in the oil recovery field via surfactants and nanofluids are discussed.
2. Wettability Characteristics, Measurements, and Its Effect on Oil Recovery
2.1. Wettability Characteristics
Wettability is defined as the ability of a fluid to stay in contact with a solid surface preferentially to another immiscible fluid present due to intermolecular interactions [20]. The cohesive and adhesive forces describe the intermolecular interaction between solids and liquids. Cohesive force attracts similar molecules; adhesive force attracts different molecules. The balance of adhesive and cohesive forces of the oil–water–rock phase defines the wettability conditions of reservoir rocks [20]. The wettability condition of reservoir rocks is one of the most critical factors influencing fluid flow in porous media, subsequently impacting the overall hydrocarbon recovery efficiency [21]. Based on their wettability characteristics, oil reservoirs are divided into water-wet, oil-wet, mixed-wet, and intermediate-wet.
Many studies claim that the reservoirs were originally saline reservoirs before oil migration [13,22]. In some reservoirs, when oil invades the water-occupied porous media, a thin water film is conserved between the rock surface and oil throughout the evolution of the reservoir. These reservoirs exist as water-wet reservoirs. In some other reservoirs, the water films collapsed throughout the development of the multiphase flow, and the reservoirs became oil-wet [23,24]. The water film’s stability depends on the crude oil’s pH and asphaltenes. A detailed investigation of this phenomenon is provided in the literature published by Hirasaki [25], Kovscek et al. [26], and Kaminsky and Radke [27]. In some cases, the reservoir’s wetting condition is heterogeneous, meaning some part of the reservoir is oil-wet, and others are water-wet, defined as mix-wet [28,29]. In some literature, this condition is further classified into two cases: mixed-wet large and mixed-wet small. Mixed-wet large is considered when the large pores of the mixed-wet reservoir are oil-wet, and small pores are water-wet, and vice versa for the mixed-wet small [30]. The mixed-wet order is mostly found in the carbonate reservoirs [28]. Lastly, there is a particular case where reservoir rock does not have a strong affinity for either of the fluids. In other words, the reservoir rock has tendencies for oil and water to adhere to the rock pore surface. This case is classified as intermediate-wet [31]. It is important to note that the fundamental difference between intermediate-wet and mixed-wet is that intermediate-wet lacks a wetting preference or strong affinity for water or oil. In contrast, mixed-wet entails an array of wetting preferences encompassing intermediate wetting conditions. A study analyzes a large group of mixed-wet reservoirs and provides an understanding of mixed-wet reservoirs with theoretical and experimental studies [30].
EOR techniques seek to improve oil recovery by altering the wettability to more water-wet classifications. Every reservoir responds differently to EOR techniques based on its wettability condition. Therefore, it is essential to know the wettability condition of the reservoir before applying any recovery technique. Many wettability measurement techniques have been proposed and improved over time to measure the wettability condition. Three primary techniques, namely the contact angle test, the Amott method, and the U.S. Bureau of Mines (USBM) method are considered conventional.
2.2. Wettability Measurement Techniques
Contact angle test: Wettability can be determined based on the angle from the solid surface to the point two fluids form interphase on the solid surface (measured via the denser fluid phase). The contact angle (θ) defines which of the two fluids wet the solid surface, as shown in Figure 3. Based on the θ value, the rock reservoir wettability is decided. There are several ways to measure the contact angle, such as the sessile drop method and high-resolution X-ray imaging. In the sessile drop method, a high-resolution camera is used to capture the droplet of one fluid on the surface of a solid surrounded by other fluid [32]. With image processing, the contact angle is measured. In X-ray imaging, the X-ray images of the droplet are used so the disturbance at the fluid interface is avoided to obtain accurate results. Table 2 shows the range of contact angles, characterizing the reservoir wettability [33,34].
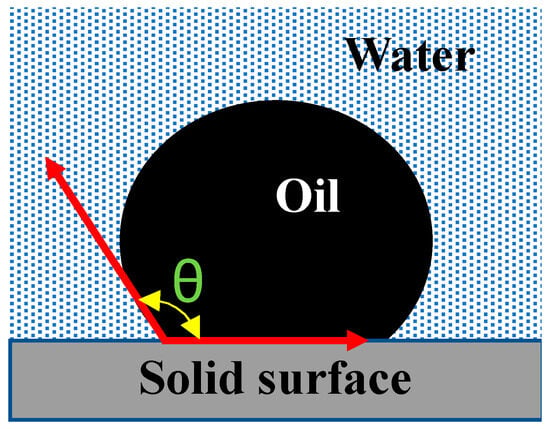
Figure 3.
Illustrative image of contact angle.

Table 2.
Wettability characteristics based on contact angle [28,29].
Amott–Harvey test: The Amott–Harvey test is an empirical measurement technique involving spontaneous and forced imbibition measurements (Figure 4) [35]. Spontaneous imbibition is a diffusion phenomenon that occurs when the wetting fluid displaces the nonwetting fluid in the pore without external forces. On the other hand, forced imbibition occurs when the wetting fluid displaces the nonwetting fluid with external forces. In this test, spontaneous and forced imbibition are performed consequently with water and oil in an oil-saturated core and water-saturated core, respectively. In all cases, the recovered oil is measured. The data are then used to create water and oil indices by the given equation, leading to water and oil index values ranging from +1 to −1. The index is called the Amott–Harvey index, which is used to assess the wettability of the reservoir (Table 3).
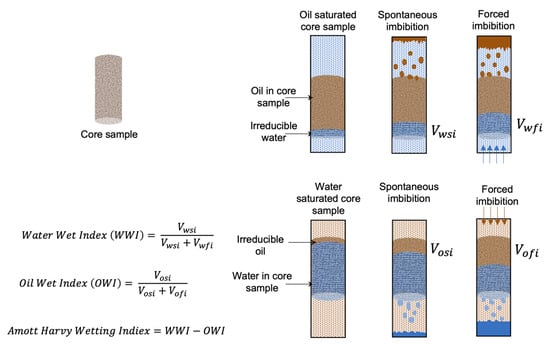
Figure 4.
Schematic of the Amott–Harvey test. (Here, Vosi and Vofi represent the volume of oil due to spontaneous and forced imbibition, respectively. Vwsi and Vwfi represent the volume of water in spontaneous and forced imbibition, respectively) [36].
U.S. Bureau of Mines (USBM): The USBM test is based on the Amott–Harvey test, but only forced imbibition is employed instead of spontaneous and forced imbibition (Figure 5). With the help of centrifuge spin, the gravitational forces are applied with water and oil in the oil- and water-saturated cores, respectively. As the Amott–Harvey test, the water and oil indices are created by the given equation to assess the wettability of the reservoir [37]. In this equation, A0 and Aw represent the area of the capillary pressure curve generated during the experiment in oil-wet and water-wet cores, respectively.
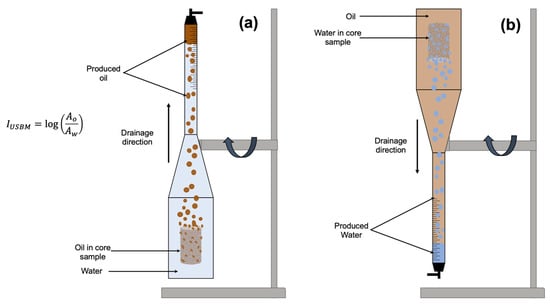
Figure 5.
Experimental apparatus for a USBM method. (a) Oil imbibition in the water-wet core sample. (b) Water imbibition in the oil-wet core sample [36].

Table 3.
Classification of the reservoir from Amott–Harvey and USBM indices [38,39].
Table 3.
Classification of the reservoir from Amott–Harvey and USBM indices [38,39].
| Reservoir Wettability | Amott–Harvey Index | USBM Index |
|---|---|---|
| Water-wet | (0.3)–(1) | >0 |
| Mixed-wet | (−0.3)–(0.3) | ~0 |
| Oil-wet | (−1)–(−0.3) | <0 |
These three methods have been considered pioneers in the field of wettability measurements, but they have some limitations [40]. The contact angle test comprises a range of values and provides contact angle hysteresis instead of a definite value. The actual condition cannot meet the requirements of having a completely isotropic, atomically flat, chemically inert, and rigid solid surface, leading to the phenomenon of oil drop spread [41,42]. The Amott–Harvey and USBM methods are relatively slow and expensive. Additionally, none of these tests can be performed in real time, where the fluid chemistry changes throughout the experiment. The limitations of these methods are out of the scope of this review, and we refer to the thorough review of the limitations of the conventional methods by Geffrey D. Thyne [43]. To overcome these limitations, several modern techniques have been developed along with technological advancements like nuclear magnetic resonance (NMR), scanning electron microscopy (SEM), micro-computed tomography (Micro-CT), chromatographic study, infrared spectroscopy (IR), atomic force microscopy (AFM), thermogravimetric analysis (TGA), and flotation test, which cover a wide range of reservoir condition with fast results, higher accuracy, and real-time measurements. Interested readers can find a comprehensive review of these techniques in Xiao et al. work [44].
Given the advancement in wettability measurement techniques, the operator can obtain more accurate information about the wetting condition of the reservoir. However, only knowing the wettability condition is insufficient to achieve improved oil recovery, as many parameters, primarily capillary pressure and relative permeability, perturb the wettability condition and therefore overall oil recovery. The following section describes how relative permeability and capillary pressure control the wettability condition, affecting the oil recovery.
2.3. Effect of Wettability Parameters on Oil Recovery
2.3.1. Relative Permeability
Permeability is a measure of the ability of a porous media to allow a single fluid to flow through it [45]. The permeability of one fluid in the matrix of multiple fluids is called the effective permeability of that fluid. Naturally, the porous media of the reservoir is saturated by fluid (most likely water), which cannot be removed from the pores due to the inherent complexity of the porous system. The volume of this fluid is termed irreducible saturation of the fluid. In the presence of this irreducible saturated fluid, the ability of other fluids to flow through porous media is called base (absolute) permeability (Figure 6). The relative permeability is the ratio of effective permeability to base permeability [46].
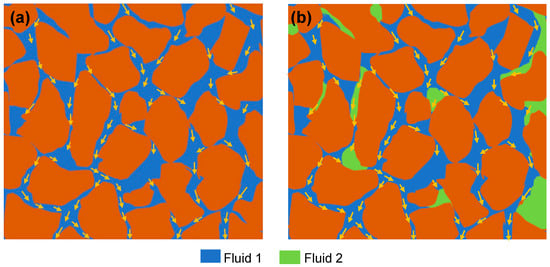
Figure 6.
Illustration of permeability. (a) Base permeability of fluid 1. (b) Relative permeability of fluid 1 (permeability of fluid 1 in the presence of fluid 2).
It is intuitively understood that if the relative permeability of oil is higher in the reservoir, the overall recovery will be higher. However, the relation between the wettability and the relative permeability of the reservoir is not clear from that statement. In a water-wet reservoir, water’s affinity toward the reservoir’s surface is higher. Hence, during the water flooding, the water invading the porous media will imbibe sufficiently into small pores by replacing oil in the main and large channels. In the channels and large pores, water will create a layer or film adjacent to the reservoir’s surface, and oil will be free to flow through the pores and channels. Water flooding also creates a “snap-off point” phenomenon, where after enough water flooding, water saturation becomes high enough to block the oil flow, so the relative permeability of oil is reduced drastically toward zero because of flooding-induced oil trapping into the pores. On the other hand, if the reservoir is oil-wet, the water’s affinity toward the reservoir surface is low. Hence, during the water flooding, the water will not be able to imbibe into small pores to replace oil. Additionally, the oil will create a film or layer adjacent to the reservoir surface, and water will flow freely into the main channel. In this case, the “snap-off point” arrives earlier during water flooding. Beyond the snap-off point, water flooding is not economically viable as the oil production is very low to none. This phenomenon was established based on many core flooding experiments under different phase saturation and wetting conditions [47,48,49,50]. By collecting these experimental data, Craig published the relation between phase saturation and its relative permeability for other wetting systems (Figure 7) [51], following many models that agree with Craig’s curves [51,52,53,54].
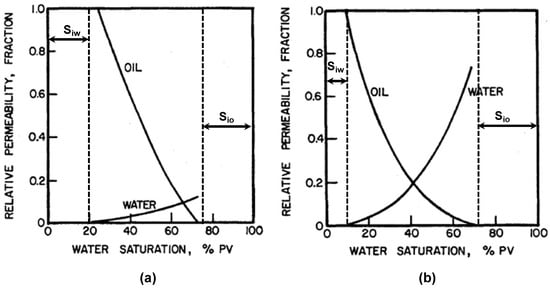
Figure 7.
Oil/water relative permeability curves. (a) Strongly water-wet rock; (b) strongly oil-wet rock [51].
Because of its importance in oil recovery, many experiments have been performed to determine the relative permeability of a steady-state multiphase core displacement [55,56,57,58]. Despite the quantitative outcomes of core experiments, there are some drawbacks to the accuracy and practicality of these approaches. Firstly, the core experiment is time-consuming and expensive to accomplish the flooding in given reservoir conditions, which requires significant time and costs to cover multiple environmental conditions [50]. Secondly, the experiment somewhat changes the core’s wetting condition and micropore structures. Hence, multiple experiments in a single core would raise the stochastic error [55]. Lastly, the invisibility of the internal flow in conventional core experiments leaves the effect of pore structure unattained [55].
Over the last few decades, two-phase, real-time experiments in micromodels have been incorporated into the core flooding experiments to widen the fundamental understanding of the relative permeability of oil recovery. In fact, various micromodels have shown a different interpretation of the role of wettability in oil recovery. For example, phase saturation in the pore network was considered as the significant parameter controlling relative permeability in the reservoirs, but with the microfluidic experimental studies; it is found that pore structure and flow patterns of the fluid can have a high impact on relative permeability and, to an extent, oil recovery. In one experiment, the investigation of the oil flooding by water with the microfluidic approach with the use of deep learning and an image recognition intelligent model was conducted (Figure 8) [55]. Based on the artificial intelligent models, it was found that the relative permeability or oil recovery is affected by phase saturation, wetting order, and pore structure with 36.23%, 33.20%, and 30.57%, respectively. In that study, different pore diversities with the co-efficient of 0.872, 3.248, and 6.965 with three different flow rates of 50, 100, and 150 µL/min were flooded by water to displace light cured oil (Figure 8a–i). The last three figures (Figure 8j–l) show the displacement of water by light crude oil at 100 µL/min. These many experiments were only feasible due to the microfluidic fabrication approach. In addition, relative permeability is considered a static function of saturation, which means that as saturation changes, the relative permeability instantaneously changes [59,60,61]. This assumption suggests that changes in oil mobility are instantaneous in the wettability alteration process. However, in the microfluidic study conducted by Du et al., the oil saturation changed over time, suggesting that relative permeability is also a function of time [62]. This sort of new information in these two micromodel studies shows that extensive research in micromodels would be beneficial to better understand the effect of relative permeability on oil recovery.
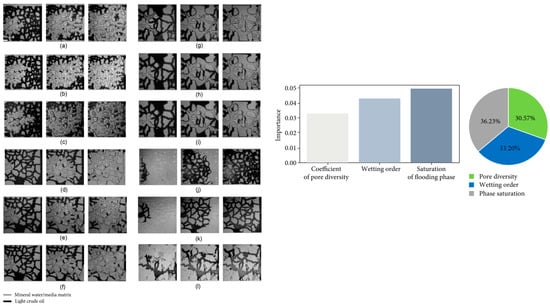
Figure 8.
Oil flooding by water in microfluidic platforms with different porosity. Each image set has three images showing the initial condition, during the flooding condition, and after the flooding condition, respectively. The graph shows the importance of pore diversity, wetting order, and phase saturation in oil displacement based on artificial intelligence’s assessment of all the flooding experimental results. Each image set from (a–l) consist of three images showing, initial injection, during injection and after the completion of injection. (a–i) show the flooding of light crude oil at 50, 100, and 150 μL/min, respectively, in each set and with wetting order of 0.872, 3.248, and 6.965 respectively. (j–l) show the same three different flow rates and wetting orders, respectively, with lighter crude oil [55].
2.3.2. Capillary Pressure
Capillary pressure is the pressure difference between two immiscible fluids at the contact interface when the curved surface forms between them (Figure 9). In the case of oil reservoirs, when the radius of curvature is on the oil side, it is considered positive and vice versa. When the interface is not curved, the capillary pressure is zero [63,64].
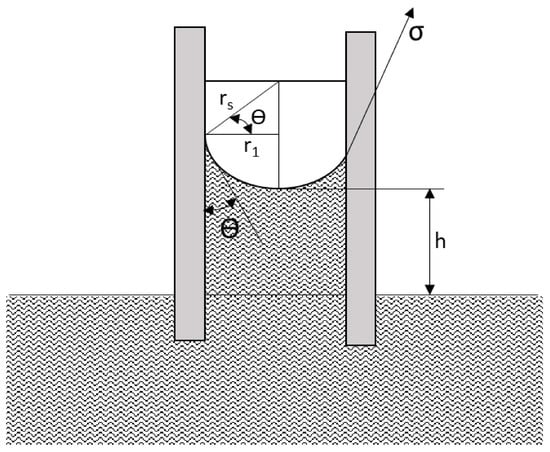
Figure 9.
Capillary pressure at the oil/water interface in a capillary tube; σ represents interfacial tension; θ represents contact angle [63,64].
Capillary pressure (Pc) is an explicit function of the wettability condition. Positive capillary pressure suggests the rock surface is strongly water-wet as the contact angle is small and vice versa. The static effect of capillary pressure on oil recovery has been known for a long time, and many core-based experiments have been conducted to explore the effect of different capillary pressures on oil recovery. Based on extensive core experiments, the capillary pressure curve was created, a simple way to understand the oil-water displacement process inside the pores while flooding. The capillary pressure vs. phase saturation graph helps assess the capillary pressure zones at which the oil recovery would be efficient. We have recommended some research publications in the literature for interested readers [65,66,67].
In the flooding process, the capillary pressure is responsible for the imbibition phenomena, contributing to oil recovery. When the capillary pressure is higher, the water imbibes the oil from small pores to the main channels, increasing the oil recovery. In contrast, when the capillary pressure is negative, the water drains from the small pores by oil, prohibiting oil recovery. In a water-wet reservoir, during the first and second stages of oil recovery, the capillary pressure is high, which causes spontaneous imbibition of oil from the small pores [68].
As we know, the pore networks are inconsistent in nature, which leads to different capillary pressures in different areas of the reservoir. Based on some core-based experimental analysis, it was found that the displacement fluid flows more dominantly from the areas where the capillary pressure is more favorable in heterogeneous pore structures due to different rates of imbibition phenomena. On the other hand, in places where the capillary pressure is less favorable, the meniscus between wetting and non-wetting fluid does not form prominently. It leads to less imbibition or no imbibition in that area. Hence, the flow of displacement fluid creates some streams of flow across the core, leaving a good portion of the core intact and resulting in less oil recovery. This phenomenon is called capillary fingering.
Additionally, there is another physical phenomenon called viscous fingering. During flooding, when the less viscous phase displaces the more viscous phase due to imbibition and drainage phenomena, it creates the flow velocity difference between invading fluid and recovering fluid (oil). Because of this difference, similar to capillary fingering, different flow streams across the core are created called viscous fingering [69,70]. Both phenomena are well documented, and we recommended some of the literature for interested readers as it is not in the scope of this review [71,72].
As more displacement fluid has been pushed into the core during the flooding, the capillary number changes and three flow regimes could be formed: stable regime, viscus fingering regime, and capillary fingering flow regime [73]. The stable regime is achieved when the flooding fluid moves forward without any fingering effect. The oil recovery is highest in the stable regime flooding as it does not leave any portion of the core intact. Graphically, these three different regions can be understood with the plot of two non-dimensional numbers called the capillary nu number and mobility ratio, where the capillary number (Ca) is the ratio of viscous drag force, and the interfacial tension, mobility ratio (M) is the ratio of the mobility of invading phase to receding phase (Figure 10).
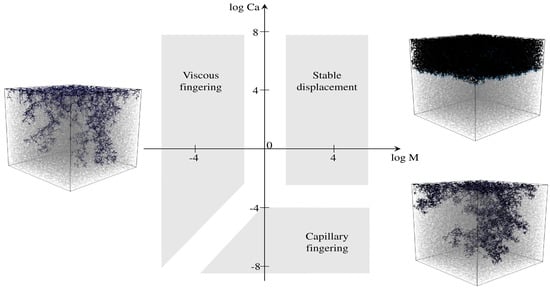
Figure 10.
Three regimes, viscous fingering, stable displacement, and capillary fingering, formed during flooding [71].
Despite many extensive core experiments, very little effort was given to understand the transition zone from viscus fingering to capillary fingering regimes due to limited dynamic analysis of the flooding in cores [74]. The understating of the (transition) crossover zone is important as the oil recovery is minimal in this zone as both viscous and capillary fingering coexist. To avoid these phenomena, its accurate characteristics should be known. The core experiments provide a wide range of these crossover zones. However, after implementing the microfluidics approaches on flooding experiments, analysis of the effect of dynamic capillary pressure on oil recovery is possible while allowing the real-time analysis of the fluid invasion to various pore structures to quantify the fluid invasion morphology and especially the accurate identification of crossover zones.
In one of the micromodel research projects, a micromodel surface was analyzed with various capillary and viscous forces to analyze the crossover zone, and it was found that the crossover zone was ted from 15% to 25% of a water saturation zone or an invading fluid saturation zone. This research gave insight into how capillary and viscous forces determine a crossover zone [75]. Figure 11 shows a phase diagram based on different core experimental, simulation, and microfluidic results. This microfluidic experiment found the narrower region of the crossover compared to other core and simulation-based results (Figure 11).
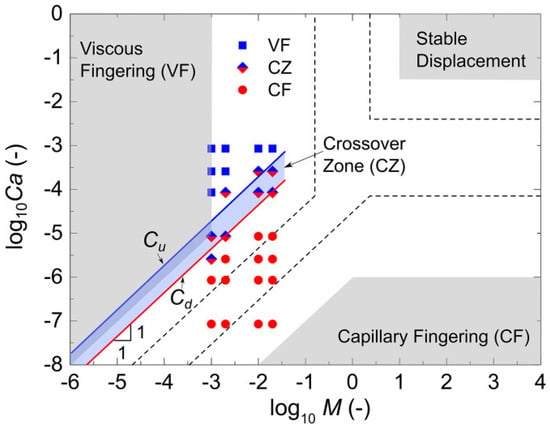
Figure 11.
A phase diagram in logarithmic capillary number (log10Ca) vs. mobility ration (log10M) plane showing the viscous fingering, stable displacement, and capillary fingering regimes. A gray area represents the results from Lenormand et al. [76]. The dash-lined area via simulation results from Zhang et al. [77] and the light blue zone represent a crossover based on microfluidic experiments conducted by Chen et al. [75].
Similarly, another micromodel experiment was conducted with significant variations in mobility ratio (M) and capillary numbers (Ca) to thoroughly analyze the transition or crossover zones from viscus fingering to capillary fingering regimes. It was found that the crossover regime found in the experimental results consists of a slightly larger portion of the total flow regime compared to other published reports (Figure 12) [78]. As mentioned earlier, the knowledge of this crossover zone is important as it is one of the deciding factors for selecting various surfactants and nanoparticles for flooding, which could maintain the desire Ca and M. The wider crossover zone estimation would be safe to avoid less oil recovery. However, it could also lead to a more costly EOR process. The accurate and narrow crossover zones would allow wider options for Ca and M and, to an extent, more options for surfactants and nanoparticles, which could be economically beneficial. The inconsistency in different experimental results shows the need for a more thorough analysis to provide an accurate regime diagram associated with capillary pressure.
These wettability parameters are often analyzed in computational studies to simulate the chemical floodings for EOR. The microfluidic experiments could be used to validate the new theoretical results. For example, an article was published related to the modeling and simulation of surfactant–polymer flooding to analyze a new hybrid method [79]. In this study, the effect on residual saturation of both (oil and flooding fluid) phase, relative permeability, and capillary pressure by IFT and wettability were analyzed. Similarly, in one of the modeling analyses, the simulations were performed to understand and predict the EOR as a function of wettability alteration [80]. The impact of uncertainties in the pores network, along with other wettability parameters on EOR, was simulated. These types of theoretical results can be future validated by micromodel experiments without economic challenges to test new theories.
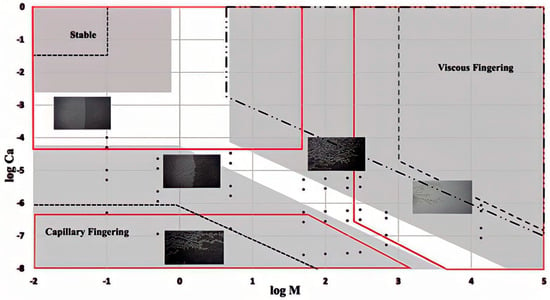
Figure 12.
A phase diagram in log10Ca vs. log10M plane showing the viscous fingering, stable displacement, and capillary fingering regimes. The solid red lines are by Guo and Aryana [78], the shaded zone by Zhang et al. [77], the dot-dashed line by Liu et al. [81], and the delineated dashed line by Lenormand et al. [76].
3. Wettability Alteration by Surfactants
More than 60% of the oil reservoirs in the world are classified as carbonate reservoirs, which are inherently oil-wet or mix-wet; therefore, the oil extraction process from these reservoirs is challenging [82,83]. This challenge arises due to the weak capillary driving force existing in the rock reservoirs, making the spontaneous imbibition process difficult. Furthermore, carbonate reservoirs are considered highly fractured, which makes the second stage recovery less efficient. Consequently, around 80% of OOIP remains in the reservoir after the second stage of recovery [84]. In this case, altering the reservoir wettability to strong water-wet is necessary. In the last few decades, extensive research has been conducted to alter the wettability by chemical flooding, especially with different surfactants and nanofluids. In this section, we have explained the different surfactants with their primary properties and comprehensively reviewed the wettability alteration mechanism using surfactants and their advancement with microfluidic techniques. The review of wettability alteration by nanofluid is given in Section 4.
3.1. Surfactants for Wettability Alteration
Surfactants are organic compounds composed of a long molecular chain with a hydrophilic head and a hydrophobic tail that allow them to be soluble in water and organic solvents [85]. These compounds can alter the rock wettability to more water-wet, especially in the carbonate reservoirs. Based on the charge type of hydrophobic head, it is commonly divided into four types: cationic, anionic, nonionic, and zwitterionic [86]. Recently, a new type of surfactant has been developed with two heads and two tails called Gemini surfactants [86].
3.1.1. Cationic Surfactants
In cationic surfactants, the head groups contain a positive charge (Figure 13) [85]. Ammonium salts, alkyl amines, and phosphonium salts are examples of mostly used cationic surfactants. The wettability alteration with the cationic surfactants is believed to be irreversible. At higher temperatures, the imbibition rate and oil recovery are higher with cationic surfactants. In most cationic surfactants, the oil recovery increases along the higher concentration. Cationic surfactants show great advantages in making the carbonate reservoirs more water-wet. However, at high salinity conditions, the performance becomes weak [85].

Figure 13.
Illustration of a cationic surfactant with an example of fatty amino salt [81].
3.1.2. Anionic Surfactants
In anionic surfactants, the hydrophilic head groups contain a negative charge (Figure 14) [85]. Carboxyl, sulfonate, sulfate, and phosphate are the most used anionic surfactants in the literature. Like cationic surfactants, anionic surfactants can achieve a smaller contact angle and higher imbibition rate. Unlike cationic surfactants, anionic surfactants show better oil recovery under brine salinity conditions. However, at a higher temperature, anionic surfactants show poor performance [85].

Figure 14.
Illustration of an anionic surfactant with an example of sodium dodecyl sulfate (SDS) [81].
3.1.3. Nonionic Surfactants
As the name suggests, the head group of nonionic surfactants contains no charge (Figure 15) [85]. Nonionic surfactants like polyglycidyl esters, polyols, sucrose esters, and polyoxyethylene are commonly used in chemical flooding. The mechanism of the wettability alteration by a nonionic surfactant is dependent on the structure of the surfactant itself.

Figure 15.
Illustration of a nonionic surfactant with an example of sucrose esters [81].
The most common wettability alteration mechanism of nonionic surfactants can be explained with the benzene ring structure (Figure 16) [87]. In the first step, the molecules adsorb on the rock surface via electrostatic forces induced by the polarization of π electrons in the benzene ring. During their adsorption, acid components from the reservoir are swept by surfactants and form a layer to alter wettability. However, the layer can be of different components depending on the structure of the surfactant. With the higher temperature, improvement in the wettability alteration performance of nonionic surfactants is found. But most of the surfactant bonds are not stable above 100 °C [88]. Overall, wettability alteration by nonionic surfactants is weak but reversible.
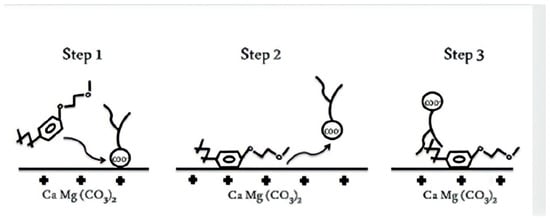
Figure 16.
Mechanisms of wettability alteration of oil-aged calcite surfaces after treatment with a non-ionic surfactant [88].
3.1.4. Zwitterionic Surfactants
Zwitterionic surfactants contain both positive and negative charged groups in the head part (Figure 17) [85]. Quaternary ammonium ion, idinium ion, phosphate, and carbonate constitute the most used among all zwitterionic surfactants. Due to their relatively high cost, zwitterionic surfactants are not widely used, and therefore, very few research analyses have been conducted on this surfactant. A complete understanding of the fundamental mechanism of wettability alteration has not been fully developed. Nevertheless, the zwitterionic surfactants provide great performance in a wide range of temperatures and salinity.

Figure 17.
Illustration of zwitterionic surfactant with an example of Cocamidopropyl betaine [81].
3.1.5. Gemini Surfactant
Gemini surfactants are relatively new surfactants, and their unique properties show great potential in EOR applications [33]. It contains more than one hydrophilic head and corresponding tails with a spacer between them near the head (Figure 18). Based on the head charge, it could be classified as cationic, anionic, nonionic, or zwitterionic Gemini surfactants. Pyrrolidinium, bis-quaternary ammonium–sodium sulfate, and alkyl o-glucoside surfactants are examples of Gemini surfactants. Like zwitterionic surfactants, the relatively high cost of Gemini surfactants has limited their exploration. Nevertheless, it has been found that Gemini surfactants have around 10 to 100 times less critical micelle concentration (CMC) value compared to other surfactant types [89]. Additionally, it is three times more efficient in lowering the surface tension of water than other surfactants, which shows great foaming properties [90]. Unfortunately, there are no flooding experiments to analyze its actual performance in oil recovery.
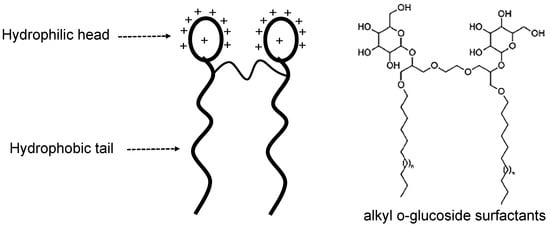
Figure 18.
Illustration of a Gemini surfactant with an example of alkyl o-glucoside surfactants [81].
3.2. Wettability Alteration Mechanism by Surfactants
Based on extensive research exploitation on surfactant-assisted EOR, three major phenomena have been commonly identified as wettability alteration mechanisms by surfactants, namely the ion pairing, adsorption, and micellar formation. In general, carbonate reservoirs are mostly composed of calcite, anhydrite, and dolomite, with a positively charged surface [91]. On the other hand, sandstone reservoirs are composed of quartz and feldspar, which makes their surface negatively charged. The oil contains acidic and basic polar organic compounds [92]. Therefore, based on the affinity of the reservoir surface charge, the carboxylate group (negatively charged acidic polar organic compound (POC)) or nitrogen-containing aromatic molecules (positively charged basic POC) of the oil become adsorbed to the reservoir surface and become oil-wet.
3.2.1. Ion Pairing Mechanism
In the ion pairing mechanism, the positively charged surfactant heads (cations) become attached to the negatively charged carboxylates from the crude oil due to electrostatic force and form an ionic pair (Figure 19). The pair is stabilized by hydrophobic interaction between a surfactant’s tail and oil components, as both tend to aggregate in a water solution. This pair can then easily be imbibed by water from the small pores and becomes stripped off from the rock surface, uncovering the original water-wet layer of rock [86]. In some literature, this mechanism is called the cleaning or surfactant desorption mechanism [93].
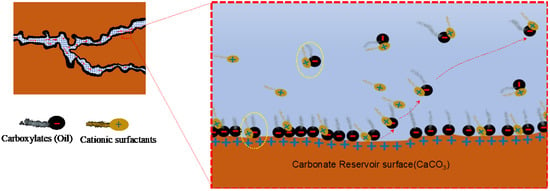
Figure 19.
Illustration of the ion pairing mechanism in a carbonate reservoir [89].
3.2.2. Surfactant Adsorption Mechanism
When the negatively charged surfactant heads (anions) are flooded into the reservoir, the surfactants do not form an ionic pair with the carboxylates of oil. Instead, they form a monolayer of surfactants, where the tail of anionic surfactants interacts with the absorbed carboxylates of oil due to van der Waals force (Figure 20). Meanwhile, the negatively charged heads extend in the opposite direction to the carboxylate layers due to the repulsion force revealing the original water-wet surface of the rock reservoirs. Since the surfactants coat the carboxylate layer, this mechanism is also known as the coating mechanism [86,93,94].
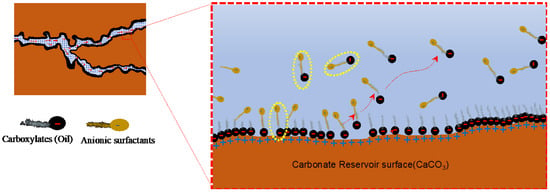
Figure 20.
Illustration of the surfactant adsorption mechanism in a carbonate reservoir [89].
Ion pairing and surfactant adsorption mechanisms were initially hypothesized by Austad et al. [86,94]. In their study of improving the spontaneous imbibition process, alkyl-propoxythoxy sulfate (anionic) and dodecyltrimethylammonium bromide (cationic) surfactants were used for oil recovery from cores with different wetting orders. These hypotheses were simply based on the oil recovery results from the flooding experiment. Later, one of the first mechanistic studies on these hypotheses was conducted [95]. Using synthetic polyethylene cores, the reservoir condition, like wetting order and preventing unwanted adsorbed compounds in the flooding experiment, was controlled. Then, to measure the performance of the surfactants, the core was flooded and aged with anionic (STEOL CS-330) and cationic (C12TAB) surfactants. Based on the adsorption isotherm results, cationic surfactants perform better than anionic surfactants, as the ionic interaction is much stronger. Consequent core-based experimental studies found similar results [96,97]. Many parameters were discovered during these core flooding experiments that provide insight into the effectiveness of these mechanisms in different conditions like salinity, pH, and concentration of surfactants or polymers. The discussion on these parameters is not in the scope of this review, but we have mentioned some comprehensive reviews in the literature for interested readers.
Even though core flooding experiments have served greatly in terms of enhancing our understanding of the wettability alteration mechanisms, the microscopic analysis with real-time quantitative measures was still a challenge with these experimental setups because the hypothesized wettability alteration mechanisms were still proven based on indirect measurements like adsorption isotherm on post-experiment core samples. The implementation of microfluidic techniques in flooding experiments has removed these challenges. For example, in the microfluidic experiment that measured the contact angle of the flooding liquid (surfactant) in a real-time experiment to assess the performance of different surfactants, it was found that anionic surfactant (SDS) was able to detach adsorbed octadecylamine from the pore surface by an ion pair mechanism (Figure 21) [74]. Additionally, the nonionic surfactant nonylphenol ethoxylated decyl ether (NP-10) showed comparatively less effectiveness for wettability alteration. These results were aligned with the first core flooding-based mechanistic study.
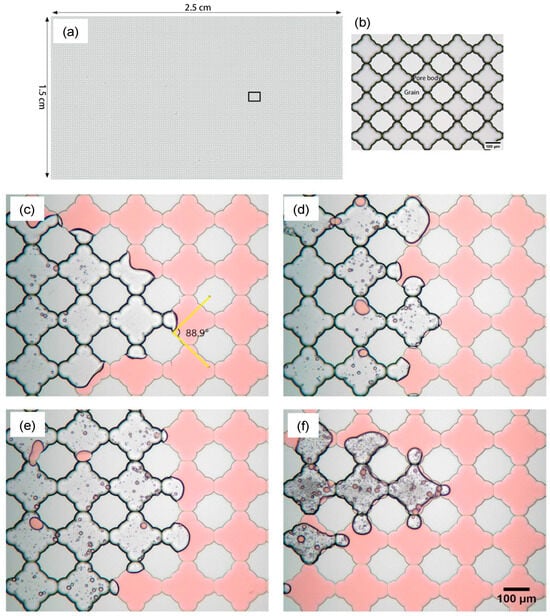
Figure 21.
(a) A pore network model of a reservoir. (b) A magnified view of the pore network. (c–f) The surfactant flooding at different mass flow rates shows different contact numbers (Ca): (c) v = 0.26 ft/day (Ca = 1.4 × 10⁻⁶); (d) v = 1.3 ft/day (Ca = 7.0 × 10⁻⁶); (e) v = 2.6 ft/day (Ca = 1.4 × 10⁻⁵); (f) v = 13 ft/day (Ca = 7.0 × 10⁻⁵) [61].
Similarly, the visualization of polymer adsorption on the Polydimethylsiloxane (PDMS) surface was shown in the experimental study [98]. A fluorescently labeled polymer poly(fluorescein isothiocyanate allylamine hydrochloride) solution was pumped into the PDMS microchannels, and the real-time video was recorded with the help of a fluorescence microscope (Figure 22). This study shows the instantaneous adsorption with a non-homogeneous adsorbed thickness of polymer on the PDMS surface, providing insights into polymer retention with static and flow-induced adsorption. We believe these studies have opened a new gateway for a more thorough analysis of molecule- and pore-scaled flooding mechanisms in EOR. It opens the scope of using closely mimicking reservoir surfaces in micromodels to analyze the adsorption behavior of different polymers and flooding fluids.
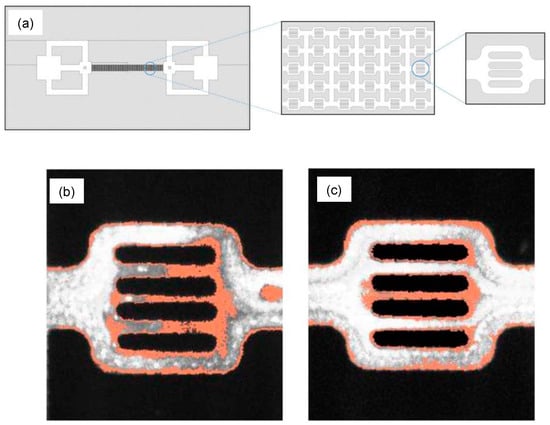
Figure 22.
(a) Schematic of a microfluidic model with a magnified pore network. The total size of the channel is 1 cm × 2 cm with 2 to 10 µm pore channels. (b,c) Two random flow units where polymer adsorption can be seen on the surface of the channel (in orange) with the fluid flow (in grey) [94].
In a microfluidic and core-based experiment to analyze the effect of salinity on a novel green surfactant (S-2-Dodecanamido-Aminobutanedioic acid), the flow pattern with different salinity was visualized. The experiment shows wettability alteration of 24.98% higher than salinity flooding due to the surfactant adsorption mechanism [99]. These results were further verified by the sandstone core flooding experiment (Figure 23).
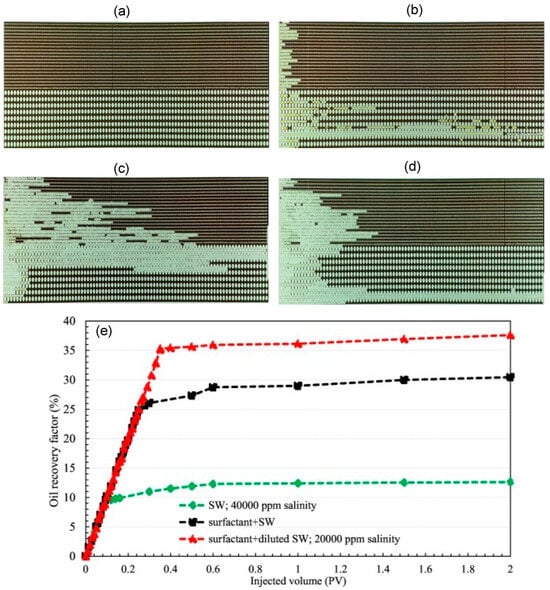
Figure 23.
The micromodel was 21 cm × 5 cm with the variable pore network. (a) Image of the microchannel saturated with oil. (b) After the flooding of seawater (SW) with 40,000 ppm salinity. (c) After the flooding of surfactant with SW (20,000 ppm salinity). (d) After injecting surfactant + SW. (e) Oil recovery with different solutions [95].
Apart from the direct visualization of fluid flows into the pore network, the microchannel also enables the spectroscopic analysis of the chemical condition of the surface without compromising the reservoir model. Spectroscopic analyses like Fourier-transform infrared spectroscopy (FTIR) and Raman spectroscopy can provide new insights into the chemical interactions of flooding solutions with the surface and a compound change in the surface after the experiment. For example, in a study for the surfactant-based brine solution on oil recovery, the low surface energy surfactant, iC18S (FO-180) based brine solution, increased the OOIP from 25% to 58% [100]. The Raman spectroscopy revealed that the improvement in oil recovery was caused by reduced asphaltene aggregation from 1.4 to 0.7 nm because the surfactant changed the asphaltene interaction with the surface during the adsorption. With this method, the absorption effectiveness of different surfactants and polymers could be analyzed, which is useful for selecting the best surfactant/polymers in the chemical EOR process.
3.2.3. Micelle Formation Mechanism (Micelle Layer Solubilization)
The micelle is a self-assembled colloidal structure made from surfactants, polymers, or ions (Figure 24). It forms when enough ions become concentrated together [101]. The minimum value of these concentrations to form the micelles is called critical micelle concentration (CMC). In the micelle layer solubilization, the layer of surfactants integrates with hydrocarbon molecules via van der Waal forces, becomes concentrated, forms micelle and is diffused into the flooding flow with the hydrocarbon droplets, exposing the reservoir rock surface, which is initially water-wet [102].
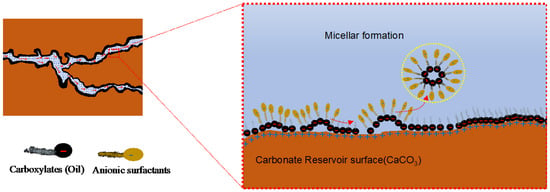
Figure 24.
Illustration of the micelle formation mechanism in a carbonate reservoir [97].
Oil recovery by the micelle formation mechanism was introduced in 1988, where the study explained the oil removal mechanisms from the solid surface in the presence of anionic micelle solutions [103]. The study showed that the contact line of oil and the solid surface was suppressed by the surfactant solution, and then surfactant molecules diffused along with the oil droplets into the stream. These phenomena were explained as the combination of rolling up and diffusion mechanisms. Many other studies that support the micelle formation mechanisms for enhanced oil recovery followed this pioneering work. About 20 years later, the crude oil interaction with the mineral plates mimicking the reservoir surface in the presence of anionic and cationic surfactants was examined [104]. Based on the force adhesion study, it was found that anionic surfactants were more efficient in achieving wettability alteration compared to cationic surfcasters. This is because micelle solubilization of adsorbed anionic oil molecules leads to wettability alteration. This observation was further supported by the recent study showing the spontaneous imbibition experiment for the wettability alteration [105]. Most researchers generally believed that micelle formation requires more surfactant to achieve ultra-low IFT. However, some reviews show that even reduced surfactants can produce a higher rate of oil through EOR via micellar formation. A microfluidic experiment was conducted to investigate the process further. This research revealed the role of micellar solubilization in wettability alteration [90]. It was found that the oil solubility was increased up to 2 times with the higher micellar formation, even with the 0.2%wt concentration of naphthenic arylsulfonate (NAS). In the dead end of the microchannel, the oil solubilization can be visually seen with fluorescence microscopy in Figure 25. Based on the visualization analysis, new phenomena were discovered that the formed emulsion could plug the pore throat to divert the driving fluid from going into the more permeable region, subsequently optimizing the sweep efficiency. This emulsification-entrainment effect can significantly reduce the residual oil saturation by 46% for the naphthenic arylsulfonate (NAS)/alkanes system.

Figure 25.
Water and oil emulsification process in the microchannel. (a–l) shows in normal light and fluorescence microscopic images at different time steps, respectively. The green color shows displacing fluid. The scale bar shows a 100 μm length [90].
Similarly, sodium 4-dodecyl benzenesulfonate (SDBS) and alcohol propoxy sulfate (APS) surfactants were employed in the micellar solubilization with the microfluidic experiment [106]. The micro-emulsification process was visualized by in situ fluorescent labeling and ex situ cryo-transmission electron microscopy (cryo-TEM) and small angle X-ray scattering (Figure 26). The results showed that low mobility microemulsion was initially formed due to micellar solubilization when surfactant solution was in contact with the trapped oil. Subsequently, it diluted into the new driving fluid, inducing ultra-low-IFT in trapped oil. With the core flooding experiment, only the ultimate results would be noticed; however, due to the real-time visualization, this synergic effect of micellar solubilization and trapped oil mobilization was first time observed in the micromodel experiment. We believe that more extensive micromodel reservoir studies can reveal new insights into the micelle solubilization mechanism for EOR and can be useful to gain a complete understanding of this EOR mechanism.
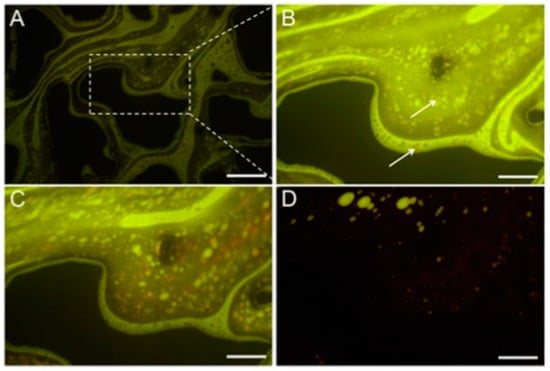
Figure 26.
(A) Fluorescent image of the microemulsion formation process in the microchannel (The scale bar shows 500 μm length). (B) Five min of flooding; (C) 30 min after flooding; (D) 60 min after the flooding. Around the time, microemulsion of oil forms, and eventually, as shown in image d, the oil is mainly mobilized. (The scale bar shows 200 μm length in (B–D) images) [102].
Many microfluidic experiments conducted in the last few years focused on various aspects of EOR, like wettability alteration mechanisms, the effect of reservoir conditions, the effect of different concentrations of surfactants, and a mixture of two or more types of surfactants. We summarized the most recent studies on surfactant-assisted EOR using microfluidics in Table 4.

Table 4.
Summary of recent microfluidic-based surfactant-assisted EOR studies.
4. Wettability Alteration by Nanofluids
Although surfactants have been favored in enhanced oil recovery (EOR) for many years due to their excellent wettability alteration and interfacial tension reduction abilities, their performance is substantially reduced in harsh reservoir conditions like high salinity and high temperature. Nanofluid has gained much attention from researchers because of its potential for EOR in harsh reservoir conditions. Many core-flooding experimental results have shown improved oil recovery with different types of nanoparticles, along with various parametric studies in high salinity and temperature conditions. With the micromodel experiments, the effect of nanofluid on the improvement in oil recovery was revealed with visualization of the flow patterns. For example, a pore network experiment showed that in a water flooding experiment, droplets remained in a large quantity in washed-up areas of pore networks, retained by capillary forces near the small pores, while the amount of trapped oil was significantly less in the case of nanofluid flooding (Figure 27) [116].
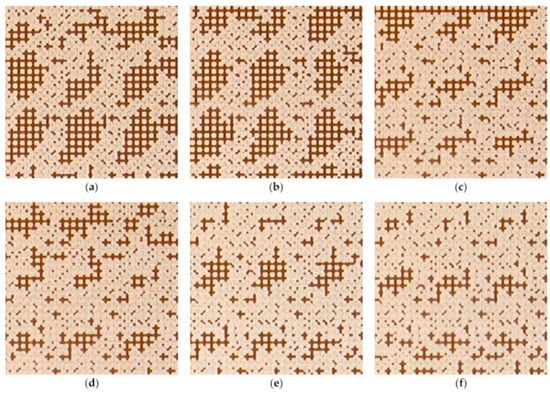
Figure 27.
The effect of nanoparticle concentration on the residual oil in the microchannel (6 × 6 mm). (a) water; (b) 0.1 w/v% SiO2; (c) 0.25 w/v% SiO2; (d) 0.5 w/v% SiO2; (e) 1 w/v% SiO2; (f) w/v% SiO2 [121].
These clear visual proofs of oil recovery improvement have been shown in plenty of experimental studies. However, relatively few studies have been conducted to understand its mechanism and performance-affecting parameters for EOR. In the literature, various mechanisms like wettability alteration, reduction in interfacial tension, increased viscosity of flooding solution, viscosity reduction in reservoir oil, and log jamming are found to be responsible for nanofluid-assisted EOR. Among these proposed mechanisms, wettability alteration was found to be the most accepted mechanism for EOR by nanofluid, while other mechanisms have inconsistent results and have not been fully proven [122,123].
4.1. Mechanisms for Wettability Alteration by Nanofluid
Nanofluids effectively transform the oil-wet reservoir into more water-wet. The experimental studies acknowledged that disjoining pressure is an underlying phenomenon for the alteration of wettability by nanofluids [122]. Disjoining pressure can be explained as the required pressure gradient to remove the fluid adhered to the reservoir surface due to the adhesion force between the fluid and the solid surface. During a disjoining process, nanoparticles in the fluid create a wedge film structure at the three-phase contact area, as shown in Figure 28. This wedge film spreads further on the rock surface and changes its wettability. Many experimental studies have demonstrated different responsible forces for creating the wedge film and removing the adhered fluid to the rock surface.
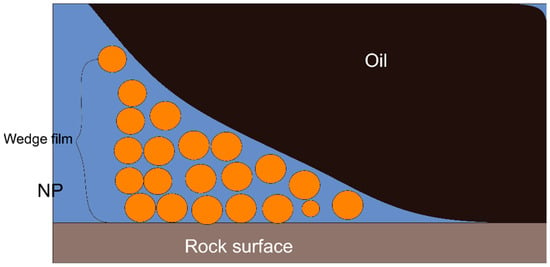
Figure 28.
Illustrative image of a disjoining pressure mechanism [15].
A van der Waal’s force seems responsible for the spreading of the wedge film, but there is another argument that van der Waal’s and electrostatic forces are responsible in combination for the wedge film spread [25,124]. The other concept has been suggested to explain the wedge film creating and spreading—the excess pressure on the film edge is caused by the layering and structuring arrangement of nanoparticles [125]. Another experiment confirmed that the detachment of oil was well correlated by structural disjoining pressure with layer formation [126]. Lastly, PDMS-based micro-reservoir patterns were used in one study, where with the help of three-dimensional confocal imaging, it was revealed that silica nanoparticles were thinning the wetting fluid with the wedge formation advancing between the surface and wetting phase (Figure 29) [127]. This microfluidic study showed one of the first visual proofs of the disjoining pressure mechanism during nanofluid-assisted EOR. Visual access to nanofluid performance during the oil recovery in this study weighs high importance as it could provide the easy optimization of concentration and size of nanoparticles.
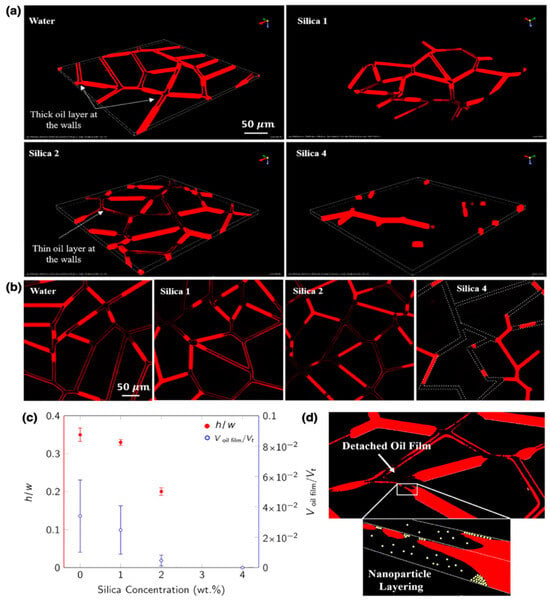
Figure 29.
(a,b) Two-dimensional and Three-dimensional images of the micromodel showing the detachment mechanism of the wetting film (in red) during nanofluid flooding, respectively. (c) h/w represents a dimensionless thickness of the channel (height/width), and the right axis shows the ratio of oil volume to the total volume. (d) Schematics of the wedge shape formation of nanoparticles [112].
We found that most literature acknowledges the disjoining pressure mechanism as the prominent mechanism for nanofluid-assisted EOR. We also found that interfacial tension (IFT) reduction has been receiving attention from many researchers, especially in fractured reservoirs, where the removal of trapped oil requires a reduction in the capillary pressure. The IFT reduction promotes lower capillary pressure to ease the spontaneous imbibition process [15]. There is a review article that comprehensively discusses the effect of nanoparticles on IFT with various proposed IFT reduction mechanisms for some interested readers [128].
Apart from disjoining pressure and IFT reduction, there is another phenomenon called adsorption/desorption responsible for the wettability alteration. Like the surfactant adsorption mechanism, nanoparticles become attracted to the reservoir surface while removing the wetting fluid particles (oil), which is known as the adsorption of nanoparticles. When the nanofluid is injected into a porous medium, van der Waals, the repulsion force of the electric double layer, acid-base interaction, and hydrodynamic forces govern the interaction between nanoparticles and reservoir surfaces [129,130]. The resultant negative force leads to the attraction between nanoparticles and reservoir surfaces, leading to the adsorption of nanoparticles. Conversely, when the resultant force is positive, desorption of nanoparticles from the reservoir surface will occur. In an experimental study, the hydrophilic nanoparticles were able to alter the wettability of the sandstone reservoir surface by a reduction of 10 degrees more the contact angle between oil and brine on the glass surface than hydrophobic nanoparticles [131]. The higher reduction in contact angle was achieved because of the adsorption of hydrophilic nanoparticles, where the hydrophobic nanoparticles experienced desorption [131]. Similar results, the adsorption of silica nanoparticles onto the glass substrate, were shown by some researchers (Figure 30) [132]. The surface roughness was found to be increased after the nanoparticle adsorption, which helps to detach the wetting fluid by altering the wettability.
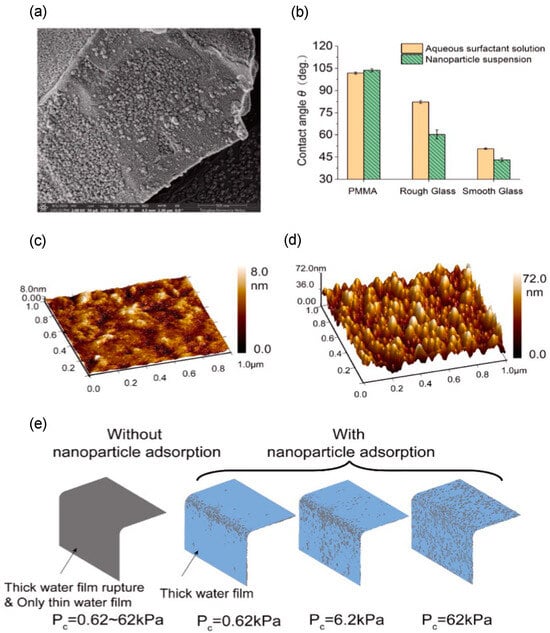
Figure 30.
(a) A scanning electron microscopic image of the glass surface with nanoparticle adsorption. (b) The comparison of the contact angle of surfactant solution and nanofluid in different surfaces with the same IFT and the presence of decane. (c) Surface roughness of the acid-etched glass. (d) Surface roughness of the glass after nanoparticle adsorption. (e) Water film thinness (in blue) onto the 100 nm convex glass surface at different capillary pressures (Pc) with and without nanoparticle adsorption [128].
4.2. Control Parameters for Wettability Alternation
Many factors like the stability of nanoparticles in the base fluid, the salinity of the base fluid, type of nanoparticle material, nanoparticle size, nanoparticle concentration, exposure time, and rock composition can affect the performance of nanofluid to alter the wettability of the reservoir surface. We have explained some prominent parameters in detail and provided the recent advancement in respective factors regarding their understanding.
4.2.1. Stability
The stability of the nanofluid is defined as the homogeneous dispersion of the nanoparticles in the base fluid. The overall electrostatic force can determine stability on the nanoparticle surface. When the repulsion forces become stronger, the suspension of the nanoparticles becomes stable. Parameters that manipulate a stable suspension of nanoparticles include the zeta potential (electrokinetic potential in colloidal and dispersions) and charge density [133]. With an increase in absolute zeta potential, the stability and the suspension of nanoparticles in the fluid increase due to a rise in electrostatic repulsion forces among the particles, which resists aggregation. A lower zeta potential allows attractive forces to potentially exceed repulsive forces; thus, coagulation or flocculation may occur. The zeta potential value typically specifies the stability of the nanoparticles dispersed into the base fluid, and the larger zeta potential values show exceptional stability [6]. The stability of the nanoparticles in the base fluid holds the utmost importance in any application of nanofluid, especially to alter the wettability of the rock reservoir.
The unstable nanofluid would lose its beneficial characteristics when injected into the reservoir with aggregated nanoparticles or agglomeration of nanoparticles. The agglomerated nanoparticles could block the small pores in the reservoir and adversely affect the recovery of oil [134]. In the reservoir, nanofluid stability relies on pH, temperature, and surfactants in the base fluid. There are different ways to adjust the zeta potential. pH value is correlated with the zeta potential value and charge density; the zeta potential can be changed via pH modification [135]. Salinity is found to be inversely proportional to the stability of the nanoparticles [136,137]. Similarly, nanoparticles tend to lose their colloidal stability under high-temperature conditions [138]. Another common way of improving the stability of nanoparticles is via a surface coating of nanoparticles by functional groups to enhance their surface properties. The surface coating of the nanoparticles not only modifies the zeta potential but also increases stability in highly saline environments and high temperatures [133].
4.2.2. Salinity
Salinity has an adverse effect on nanoparticle stability. The presence of the salt causes high ionic strength in the fluid, which lowers repulsion between particles. Thus, van der Waals attraction forces dominate, and zeta potential decreases, agglomerating the nanoparticles [139]. However, salinity in the nanofluids displays a pronounced positive effect of wettability alteration because of more adsorption of nanoparticles on the surface of the rock [140]. Salinity found in displacing fluids or reservoir fluids has a considerable effect on the dispersion of nanoparticles. However, the stability of the nanoparticles is reduced in high salinity environments for which well-suited salinity levels, as well as surface modifications, are critical features to avoid agglomeration of nanoparticles [141]. A similar statement can be found that having an optimum level of salinity would be the most beneficial in oil recovery by nanofluid [142].
4.2.3. Nanoparticle Concentration
Nanoparticle concentration affects the ability of nanofluid to alter the wettability in two different ways. On the one hand, higher nanoparticle concentration leads to higher repulsive forces, which increases the disjoining pressure; thus, the ability of nanofluid to alter the wettability increases. On the other hand, increasing nanoparticle concentration consequently results in the reservoir rock’s porosity and permeability declining due to the increased amount of nanoparticle accumulation on the rock surface. This two-way effect suggests that there is an optimum concentration where maximum wettability alteration is possible without creating a blockage of throats [143]. In many experiments, the noticeable blockage of throats was observed when the concentration of nanoparticles was beyond 3 wt.% [6,143,144]. The viscosity of the nanofluids increased with higher nanoparticle concentrations [145]. A similar observation was found, where Al2O3 and TiO2-based nanofluids achieved higher viscosity with higher nanoparticle concentrations [146]. Change in contact angle was also observed in a few research. At 0%, 1%, and 2% concentrations of nanoparticles, the contact angle values were found to be 120°, 60°, and 45°, changing the surface wettability to more water-wet [147]. There is a report that a contact angle is reduced as the nanoparticle concentration increases from 0 to 0.1 wt% [148]. Furthermore, a recent microfluidic study shows a detailed explanation of the positive effect of the concentration of nanoparticles on the mobilization of the trapped oil (Figure 31) [149]. Oil droplets were generated in the nanofluid and flown through the structure, which mimics a small pore throat. It was found that smaller oil droplets are more likely to become trapped in the small pore throat because of the increased capillary resistance generated by higher droplet curvature. Higher nanoparticle concentration shows the reduction in the size of the trapped droplet in small pore throats. The reason behind the phenomena could be hypnotized by the reduced IFT due to NP adsorption by the oil interphase. However, the confirmed reason behind these effects is yet to be found. Additionally, at higher concentrations, the stability of NPs can be compromised. Therefore, an optimum concentration of NPs based on the reservoir condition needs to be found.
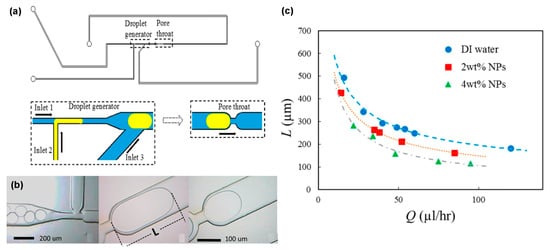
Figure 31.
(a) Schematic of the microchannel for droplet generation and pore throat. (b) Actual photos of the oil droplet generation and oil droplet entrapment. (c) A graph of the flow rate as a function of the length of the entrapped oil droplet [145].
4.2.4. Nanoparticle Size
Nanoparticle sizes are generally much smaller than rock pore channel sizes, allowing nanoparticles to penetrate the reservoir efficiently. Due to their small size, nanoparticles provide a higher area-to-volume ratio, a higher surface charge density, and higher electrostatic repulsion between them, which provides higher disjoining pressure [6]. In the throat of the porous media, where the flow area is smaller than the pores, the flow velocity is higher. In these areas, the solvent fluid flows at a much higher speed compared to nanoparticles due to their different densities. As a result, nanoparticles are prone to aggregate at the inlet of the throat and drive the nanofluid flooding to other channels. This mechanism is called the log jamming mechanism, as shown in Figure 32. Experimental studies show that the log jamming effect helps increase the wettability alteration mechanism by encouraging disjoining pressure in relatively big channels filled with oil [150,151].

Figure 32.
Illustrative images for (a) mechanical trapping and (b) log jamming mechanisms [15].
When the pore entrance or throat is smaller than the nanoparticle’s size, nanoparticles become stacked at the entrance, creating a phenomenon called mechanical trapping. In a trapping event, the flow is hindered, and oil cannot be displaced by flooding from those pores (Figure 32a). Mechanical trapping is considered a limitation of EOR [152].
4.2.5. Temperature
Oil recovery is challenging for most chemical methods, including nanofluids at high-temperature conditions. The stability of nanoparticles decreases with higher temperatures. Due to low stability, nanoparticles tend to agglomerate and cause a reduction in viscosity. Many studies have found the viscosity reduction in nanofluid at a higher temperature [153,154,155,156]. In the nanofluid flooding experiments, one study found a reduction in the contact angle from 145° to 38° at 50 °C and from 145° to 56° at 60 °C, showing a reduction in wettability alteration at a higher temperature [157]. However, with the modification of the nanoparticle surface, higher adsorption of nanoparticles can be achieved to favor the oil recovery at high temperatures. In a few experimental studies, it was found that modified nanoparticles are highly advantageous and efficient for wettability alteration at high temperatures [147,158,159]. Recently, many microfluidic-based nanofluid-assisted flooding experiments have been conducted. These studies were specifically focused on the effect of different reservoir conditions on the wettability alteration performance of nanofluid. We listed them in Table 5.

Table 5.
Summary of recent microfluidic-based nanofluid-assisted EOR experiments.
5. Discussion and Summary
Wettability is among the most significant attributes of the reservoir system for EOR [44,85,93]. Significant research has been performed within the decade to obtain insights into wettability alteration. However, an absolute understanding of the overall effect of all the underlying mechanisms is still required to achieve the optimum EOR method. With advanced technology, the pace of research has increased, especially after the incorporation of microfluidic technology. With access to real-time microscopic analysis, low cost, and higher accuracy experimental conditions, many challenges can be addressed, like parametric studies on the effect of various reservoir conditions on chemical flooding, especially with the new surfactants and polymers, which was expensive and time-consuming in the core flooding experiments. The tailored wetting order and mimicking of different geochemical conditions in microfluidic channels have been demonstrated. However, a combined approach of these fabrications to achieve as close as the real reservoir core-like condition has not been achieved. In the future, these types of microchips, with the available advanced microscopic and spectroscopic analysis, could provide the complete analysis of underlying mechanisms to achieve optimum EOR methods. When it comes to surfactant-based EOR methods, the adsorption of the surfactants onto the reservoir surface is considered the foremost challenge [171,172]. Because of the adsorption of the surfactants, a higher concentration of surfactant solution is required to maintain the high EOR efficiency, which makes the overall process expensive. To overcome this drawback, new methods must be developed where the adsorbed surfactants can be recovered for reuse after the oil recovery. Along with surfactant-based EOR, nanofluid-based EOR has shown great potential. The nanofluid-assisted EOR method has yet to be explored as it is relatively new [173]. Many literature reviews state the need to understand the mechanisms associated with the nanofluidic-based EOR [15,174,175]. In addition to the underlying mechanism of nanofluid EOR, preparing nanofluid and its operating conditions in different reservoir conditions requires extensive research. Especially, many parameters like size, concentration, and stability, with their different dependency on external parameters like temperature and salinity, make it challenging to find the optimized performance of the nanoparticles in EOR processes. There is a strong need for research required in that aspect. Lastly, to obtain full advantage of the chemical EOR process, the synergic effect of brine surfactant/polymers and nanoparticles needs to be extensively evaluated as there is a lack of research compared to their individual cases.
This review paper has provided an understanding of the wettability alteration mechanism with its recent developments under the special attention of microfluidic methods. Wettability-based classification of the reservoir and its measurement techniques have been described. The surfactant-based wettability alteration mechanisms are explained with the simple classification of surfactants. Based on the literature review, three main mechanisms, namely ion pairing, surfactant adsorption, and micellar solubilization, were identified as responsible for wettability alteration by surfactants. Each mechanism has been elaborated with the new development in their understanding of microfluidic experimental research example. The recent microfluidic experiment related to surfactant-based EOR research has been listed. Similarly, the wettability alteration mechanism in nanofluid-based EOR was discussed. Disjoining pressure, IFT reduction, and adsorption/desorption mechanisms are explained with much microfluidic-based experimental research. The parameters that affect nanofluidic EOR are reviewed, along with a list of recent nanoparticle-based micromodel EOR research.
Author Contributions
Conceptualization, A.R. and M.K.; methodology, A.R.; software, A.R.; validation, A.R. and M.K.; formal analysis, A.R. and M.K.; investigation, A.R.; resources, M.K.; data curation, A.R. and M.K.; writing—original draft preparation, A.R.; writing—review and editing, A.R. and M.K.; visualization, A.R.; supervision, M.K.; project administration, M.K. All authors have read and agreed to the published version of the manuscript.
Funding
This research received no external funding.
Data Availability Statement
Data are contained within the article.
Conflicts of Interest
The authors declare no conflict of interest.
References
- International Energy Outlook—2021—U.S. Energy Information Administration (EIA). Available online: https://www.eia.gov/outlooks/ieo/narrative/introduction/sub-topic-01.php (accessed on 3 December 2023).
- Perera, M.S.A.; Gamage, R.P.; Rathnaweera, T.D.; Ranathunga, A.S.; Koay, A.; Choi, X. A Review of CO2-Enhanced Oil Recovery with a Simulated Sensitivity Analysis. Energies 2016, 9, 481. [Google Scholar] [CrossRef]
- Wu, Y.-S. Multiphase Fluid Flow in Porous and Fractured Reservoirs; Gulf Professional Publishing: Houston, TX, USA, 2016; pp. 15–27. [Google Scholar] [CrossRef]
- Rackley, S.A. Other geological storage options. In Carbon Capture Storage, 2nd ed.; Butterworth-Heinemann: Oxford, UK, 2017; pp. 471–488. [Google Scholar] [CrossRef]
- Ahmed, T. Principles of Waterflooding. Reserv. Eng. Handb. 2010, 909–1095. [Google Scholar] [CrossRef]
- Sun, X.; Zhang, Y.; Chen, G.; Gai, Z. Application of Nanoparticles in Enhanced Oil Recovery: A Critical Review of Recent Progress. Energies 2017, 10, 345. [Google Scholar] [CrossRef]
- Whatever Happened to Enhanced Oil Recovery?—Analysis—IEA. Available online: https://www.iea.org/commentaries/whatever-happened-to-enhanced-oil-recovery (accessed on 3 December 2023).
- Kamath, K.I.; Comberiati, J.R.; Zammerilli, A.M.; Kyle, C.C.; Taylor, B.D. Tertiary Oil Recovery by Flooding with Aqueous Chemical Solutions. In Society of Petroleum Engineers of AIME; SPE: Bakersfield, CA, USA, 1981; pp. 473–482. [Google Scholar] [CrossRef]
- Sanni, M. Petroleum Engineering: Principles, Calculations, and Workflows; John Wiley & Sons: Hoboken, NJ, USA, 2018. [Google Scholar]
- Mokheimer, E.M.; Hamdy, M.; Abubakar, Z.; Shakeel, M.R.; Habib, M.A.; Mahmoud, M. A comprehensive review of thermal en-hanced oil recovery: Techniques evaluation. J. Energy Resour. Technol. 2019, 141, 030801. [Google Scholar] [CrossRef]
- Khalilinezhad, S.S.; Cheraghian, G.; Karambeigi, M.S.; Tabatabaee, H.; Roayaei, E. Characterizing the Role of Clay and Silica Nanoparticles in Enhanced Heavy Oil Recovery During Polymer Flooding. Arab. J. Sci. Eng. 2016, 41, 2731–2750. [Google Scholar] [CrossRef]
- Wang, Y.; Xu, H.; Yu, W.; Bai, B.; Song, X.; Zhang, J. Surfactant induced reservoir wettability alteration: Recent theoretical and experimental advances in enhanced oil recovery. Pet. Sci. 2011, 8, 463–476. [Google Scholar] [CrossRef]
- Mohammed, M.; Babadagli, T. Wettability alteration: A comprehensive review of materials/methods and testing the selected ones on heavy-oil containing oil-wet systems. Adv. Colloid Interface Sci. 2015, 220, 54–77. [Google Scholar] [CrossRef] [PubMed]
- Kamal, M.S.; Hussein, I.A.; Sultan, A.S. Review on Surfactant Flooding: Phase Behavior, Retention, IFT, and Field Applications. Energy Fuels 2017, 31, 7701–7720. [Google Scholar] [CrossRef]
- Eltoum, H.; Yang, Y.-L.; Hou, J.-R. The effect of nanoparticles on reservoir wettability alteration: A critical review. Pet. Sci. 2020, 18, 136–153. [Google Scholar] [CrossRef]
- Song, W.; de Haas, T.W.; Fadaei, H.; Sinton, D. Chip-off-the-old-rock: The study of reservoir-relevant geological processes with real-rock micromodels. Lab A Chip 2014, 14, 4382–4390. [Google Scholar] [CrossRef]
- Lee, S.G.; Lee, H.; Gupta, A.; Chang, S.; Doyle, P.S. Site-Selective In-Situ Grown Calcium Carbonate Micromodels with Tunable Geometry, Porosity, and Wettability. Adv. Funct. Mater. 2016, 26, 4896–4905. [Google Scholar] [CrossRef]
- Wang, W.; Chang, S.; Gizzatov, A. Toward Reservoir-on-a-Chip: Fabricating Reservoir Micromodels by in Situ Growing Calcium Carbonate Nanocrystals in Microfluidic Channels. ACS Appl. Mater. Interfaces 2017, 9, 29380–29386. [Google Scholar] [CrossRef] [PubMed]
- Lee, H.; Lee, S.G.; Doyle, P.S. Photopatterned oil-reservoir micromodels with tailored wetting properties. Lab A Chip 2015, 15, 3047–3055. [Google Scholar] [CrossRef] [PubMed]
- Wu, Y.-S. Multiphase Fluid Flow in Porous and Fractured Reservoirs; Elsevier BV: Amsterdam, The Netherlands, 2016; ISBN 9780128038482. [Google Scholar]
- Civan, F. Reservoir Formation Damage: Fundamentals, Modeling, Assessment, and Mitigation; Gulf Professional Publishing: Cambridges, MA, USA, 2023. [Google Scholar]
- Bobek, J.; Mattax, C.; Denekas, M. Reservoir Rock Wettability—Its Significance and Evaluation. Trans. AIME 1958, 213, 155–160. [Google Scholar] [CrossRef]
- Moulin, P.; Roques, H. Zeta potential measurement of calcium carbonate. J. Colloid Interface Sci. 2003, 261, 115–126. [Google Scholar] [CrossRef] [PubMed]
- Somasundaran, P.; Agar, G.E. The zero point of charge of calcite. J. Colloid Interface Sci. 1967, 24, 433–440. [Google Scholar] [CrossRef]
- Hirasaki, G.J. Wettability: Fundamentals and Surface Forces. SPE Form. Eval. 1991, 6, 217–226. [Google Scholar] [CrossRef]
- Kovscek, A.R.; Wong, H.; Radke, C.J. A pore-level scenario for the development of mixed wettability in oil reservoirs. AIChE J. 1993, 39, 1072–1085. [Google Scholar] [CrossRef]
- Kaminsky, R.; Radke, C.J. Water Films, Asphaltenes, and Wettability Alteration; Lawrence Berkeley National Lab.: Berkeley, CA, USA, 1998. [Google Scholar] [CrossRef]
- Alotaibi, M.B.; Nasralla, R.A.; Nasr-El-Din, H.A. Wettability Challenges in Carbonate Reservoirs. Proc. SPE Symp. Improv. Oil Recovery 2010, 2, 1420–1439. [Google Scholar]
- Ivanova, A.; Orekhov, A.; Markovic, S.; Iglauer, S.; Grishin, P.; Cheremisin, A. Live imaging of micro and macro wettability varia-tions of carbonate oil reservoirs for enhanced oil recovery and CO2 trapping/storage. Sci. Rep. 2022, 12, 1262. [Google Scholar] [CrossRef]
- Skauge, A.; Spildo, K.; Høiland, L.; Vik, B. Theoretical and experimental evidence of different wettability classes. J. Pet. Sci. Eng. 2007, 57, 321–333. [Google Scholar] [CrossRef]
- Abdallah, W.; Buckley, J.S.; Carnegie, A.; Edwards, J.; Herold, B.; Fordham, E.; Graue, A.; Habashy, T.; Seleznev, N.; Signer, C.; et al. Fundamentals of wettability. Technology 1986, 38, 268. [Google Scholar]
- Nowak, E.; Robbins, P.; Combes, G.; Stitt, E.H.; Pacek, A.W. Measurements of contact angle between fine, non-porous particles with varying hydrophobicity and water and non-polar liquids of different viscosities. Powder Technol. 2013, 250, 21–32. [Google Scholar] [CrossRef]
- Kamal, M.S. A Review of Gemini Surfactants: Potential Application in Enhanced Oil Recovery. J. Surfactants Deterg. 2015, 19, 223–236. [Google Scholar] [CrossRef]
- Yu, D.I.; Kwak, H.J.; Park, C.; Choi, C.; Sapkal, N.P.; Hong, J.; Kim, M.H. Wetting criteria of intrinsic contact angle to distinguish between hydrophilic and hydrophobic micro-/nanotextured surfaces: Experimental and theoretical analysis with synchrotron X-ray imaging. Langmuir 2019, 35, 3607–3614. [Google Scholar] [CrossRef]
- Amott, E. Observations Relating to the Wettability of Porous Rock. Trans. AIME 1959, 216, 156–162. [Google Scholar] [CrossRef]
- McPhee, C.; Reed, J.; Zubizarreta, I. Wettability and Wettability Tests. Dev. Pet. Sci. 2015, 64, 313–345. [Google Scholar]
- Donaldson Member Aime, E.C.; Thomas, R.D.; Lorenz, P.B. Wettability Determination and Its Effect on Recovery Efficiency. Soc. Pet. Eng. J. 1969, 9, 13–20. [Google Scholar] [CrossRef]
- Domínguez, A.; Pérez-Aguilar, H.; Rojas, F.; Kornhauser, I. Mixed wettability: A numerical study of the consequences of porous media morphology. Colloids Surf. A Physicochem. Eng. Asp. 2001, 187–188, 415–424. [Google Scholar] [CrossRef]
- Sharma, M.; Wunderlich, R. The alteration of rock properties due to interactions with drilling-fluid components. J. Pet. Sci. Eng. 1987, 1, 127–143. [Google Scholar] [CrossRef]
- Anderson, W. Wettability Literature Survey—Part 2: Wettability Measurement. J. Pet. Technol. 1986, 38, 1246–1262. [Google Scholar] [CrossRef]
- Marmur, A.; Della Volpe, C.; Siboni, S.; Amirfazli, A.; Drelich, J.W. Contact angles and wettability: Towards common and accurate terminology. Surf. Innov. 2017, 5, 3–8. [Google Scholar] [CrossRef]
- Heib, F.; Schmitt, M. Statistical Contact Angle Analyses with the High-Precision Drop Shape Analysis (HPDSA) Approach: Basic Principles and Applications. Coatings 2016, 6, 57. [Google Scholar] [CrossRef]
- Thyne, G.D. A Review of the Measurement of Wettability. Available online: https://www.researchgate.net/publication/283055682_A_review_of_the_measurement_of_wettability (accessed on 3 December 2023).
- Deng, X.; Kamal, M.S.; Patil, S.; Hussain, S.M.S.; Zhou, X. A Review on Wettability Alteration in Carbonate Rocks: Wettability Modifiers. Energy Fuels 2019, 34, 31–54. [Google Scholar] [CrossRef]
- Fidjestol, P.; Lewis, R. Microsilica as an Addition. In Lea’s Chemistry of Cement and Concrete; Butterworth-Heinemann: Oxford, UK, 1998; pp. 679–712. [Google Scholar] [CrossRef]
- Baker, R.O.; Yarranton, H.W.; Jensen, J.L. Special Core Analysis—Rock–Fluid Interactions. In Practical Reservoir Engineering and Characterization; Elsevier: Amsterdam, The Netherlands, 2015; pp. 239–295. [Google Scholar] [CrossRef]
- Marsden, S.S. Wettability-Its Measurement and Application to Waterflooding. J. Jpn. Assoc. Pet. Technol. 1965, 30, 1–10. [Google Scholar] [CrossRef]
- Marsden, S.S. Wettability: The elusive key to waterflooding. Pet. Eng. 1965, 37. Available online: https://www.osti.gov/biblio/6220287 (accessed on 3 December 2023).
- Chatenever, A.; Calhoun, J.C., Jr. Visual examinations of fluid behavior in porous media-part I. J. Pet. Technol. 1952, 4, 149–156. [Google Scholar] [CrossRef]
- Jennings, B.H.Y.; Member, J. Effect of Laboratory Core Cleaning on Water-Oil Relative Permeability. In Society of Petroleum Engineers—Fall Meeting of the Society of Petroleum Engineers of AIME, FM; SPE: Dallas, TX, USA, 1957. [Google Scholar] [CrossRef]
- Warner, H. The Reservoir Engineering Aspects of Waterflooding; Society of Petroleum Engineers (SPE): Richardson, TX, USA, 2015; ISBN 9781613994214. [Google Scholar]
- Donaldson, E.C.; Thomas, R.D. Microscopic Observations of Oil Displacement in Water-Wet and Oil-Wet Systems. In Proceedings of the SPE Annual Technical Conference and Exhibition, New Orleans, LA, USA, 3–7 October 1971; SPE: Dallas, TX, USA, 1971. [Google Scholar] [CrossRef]
- Owens, W.; Archer, D. The Effect of Rock Wettability on Oil-Water Relative Permeability Relationships. J. Pet. Technol. 1971, 23, 873–878. [Google Scholar] [CrossRef]
- Donaldson, E.C. Oil-water-rock wettability measurement. Am. Chem. Soc. Div. Pet. Chem. 1981, 26. Available online: https://www.osti.gov/biblio/6760521 (accessed on 3 December 2023).
- Song, H.; Liu, C.; Lao, J.; Wang, J.; Du, S.; Yu, M. Intelligent Microfluidics Research on Relative Permeability Measurement and Prediction of Two-Phase Flow in Micropores. Geofluids 2021, 2021, 1–12. [Google Scholar] [CrossRef]
- Purswani, P.; Karpyn, Z.T.; Enab, K.; Xue, Y.; Huang, X. Evaluation of image segmentation techniques for image-based rock property estimation. J. Pet. Sci. Eng. 2020, 195, 107890. [Google Scholar] [CrossRef]
- Gerami, A.; Armstrong, R.T.; Jing, Y.; Wahid, F.A.; Arandiyan, H.; Mostaghimi, P. Microscale insights into gas recovery from bright and dull bands in coal. J. Pet. Sci. Eng. 2018, 172, 373–382. [Google Scholar] [CrossRef]
- Arigbe, O.D.; Oyeneyin, M.B.; Arana, I.; Ghazi, M.D. Real-time relative permeability prediction using deep learning. J. Pet. Explor. Prod. Technol. 2018, 9, 1271–1284. [Google Scholar] [CrossRef]
- Gupta, R.; Smith, P.G.; Hu, L.; Willingham, T.W.; Cascio, M.L.; Shyeh, J.J.; Harris, C.R. Enhanced waterflood for middle east carbonate cores—Impact of injection water composition. In Proceedings of the SPE Middle East Oil and Gas Show and Conference, Manama, Bahrain, 25 September 2011; SPE: Dallas, TX, USA, 2011; p. SPE–142668. [Google Scholar]
- Masalmeh, S.K.; Sorop, T.G.; Suijkerbuijk, B.M.; Vermolen, E.C.; Douma, S.; Van Del Linde, H.A.; Pieterse, S.G. Low salinity flooding: Experimental evaluation and numerical interpretation. In Proceedings of the IPTC 2014: International Petroleum Technology Conference, Doha, Qatar, 19 January 2014; European Association of Geoscientists & Engineers: Bunnik, The Netherlands, 2014; p. cp-395. [Google Scholar]
- Suijkerbuijk, B.M.; Sorop, T.G.; Parker, A.R.; Masalmeh, S.K.; Chmuzh, I.V.; Karpan, V.M.; Volokitin, Y.E.; Skripkin, A.G. Low salinity waterflooding at West Salym: Laboratory experiments and field forecasts. In Proceedings of the SPE EOR Conference at Oil and Gas West Asia, Muscat, Oman, 31 March 2014; OnePetro: Richardson, TX, USA, 2014. [Google Scholar]
- Du, Y.; Xu, K.; Mejia, L.; Zhu, P.; Balhoff, M.T. Microfluidic Investigation of Low-Salinity Effects During Oil Recovery: A No-Clay and Time-Dependent Mechanism. SPE J. 2019, 24, 2841–2858. [Google Scholar] [CrossRef]
- Adamson, A.; Gast, A. Physical Chemistry of Surfaces; Interscience Publishers: New York, NY, USA, 1967. [Google Scholar]
- Dullien, F. Porous Media: Fluid Transport and Pore Structure; Academic Press: Cambridge, MA, USA, 2012. [Google Scholar]
- Albers, B. Modeling the hysteretic behavior of the capillary pressure in partially saturated porous media: A review. Acta Mech. 2014, 225, 2163–2189. [Google Scholar] [CrossRef]
- Vavra, C.L.; Kaldi, J.G.; Sneider, R.M. Geological Applications of Capillary Pressure: A Review. Am. Assoc. Pet. Geol. Bull. 1992, 76, 840–850. [Google Scholar]
- Andersen, P. Capillary Pressure Effects on Estimating the Enhanced-Oil-Recovery Potential During Low-Salinity and Smart Waterflooding. SPE J. 2019, 25, 481–496. [Google Scholar] [CrossRef]
- Anderson, W. Wettability Literature Survey—Part 4: Effects of Wettability on Capillary Pressure. J. Pet. Technol. 1987, 39, 1283–1300. [Google Scholar] [CrossRef]
- Kueper, B.H.; Frind, E.O. An overview of immiscible fingering in porous media. J. Contam. Hydrol. 1988, 2, 95–110. [Google Scholar] [CrossRef]
- Singh, A.; Singh, Y.; Pandey, K.M. Viscous fingering instabilities in radial Hele-Shaw cell: A review. Mater. Today Proc. 2020, 26, 760–762. [Google Scholar] [CrossRef]
- Homsy, G.M. Viscous fingering in porous media. Annu. Rev. Fluid Mech. 1987, 19, 271–311. [Google Scholar] [CrossRef]
- Lenormand, R.; Zarcone, C. Capillary fingering: Percolation and fractal dimension. Transp. Porous Media 1989, 4, 599–612. [Google Scholar] [CrossRef]
- An, S.; Erfani, H.; Godinez-Brizuela, O.E.; Niasar, V. Transition from Viscous Fingering to Capillary Fingering: Application of GPU-Based Fully Implicit Dynamic Pore Network Modeling. Water Resour. Res. 2020, 56, e2020WR028149. [Google Scholar] [CrossRef]
- Yang, W.; Brownlow, J.W.; Walker, D.L.; Lu, J. Effect of Surfactant-Assisted Wettability Alteration on Immiscible Displacement: A Microfluidic Study. Water Resour. Res. 2021, 57, e2020WR029522. [Google Scholar] [CrossRef]
- Chen, Y.F.; Fang, S.; Wu, D.S.; Hu, R. Visualizing and quantifying the crossover from capillary fingering to viscous fingering in a rough fracture. Water Resour. Res. 2017, 53, 7756–7772. [Google Scholar] [CrossRef]
- Lenormand, R.; Touboul, E.; Zarcone, C. Numerical models and experiments on immiscible displacements in porous media. J. Fluid Mech. 1988, 189, 165–187. [Google Scholar] [CrossRef]
- Zhang, C.; Oostrom, M.; Wietsma, T.W.; Grate, J.W.; Warner, M.G. Influence of Viscous and Capillary Forces on Immiscible Fluid Displacement: Pore-Scale Experimental Study in a Water-Wet Micromodel Demonstrating Viscous and Capillary Fingering. Energy Fuels 2011, 25, 3493–3505. [Google Scholar] [CrossRef]
- Guo, F.; Aryana, S.A. An Experimental Investigation of Flow Regimes in Imbibition and Drainage Using a Microfluidic Platform. Energies 2019, 12, 1390. [Google Scholar] [CrossRef]
- Daripa, P.; Dutta, S. Modeling and simulation of surfactant–polymer flooding using a new hybrid method. J. Comput. Phys. 2017, 335, 249–282. [Google Scholar] [CrossRef]
- Delshad, M.; Najafabadi, N.F.; Anderson, G.A.; Pope, G.A.; Sepehrnoori, K. Modeling Wettability Alteration by Surfactants in Naturally Fractured Reservoirs. SPE Reserv. Eval. Eng. 2009, 12, 361–370. [Google Scholar] [CrossRef]
- Liu, H.; Zhang, Y.; Valocchi, A.J. Lattice boltzmann simulation of immiscible fluid displacement in porous media: Ho-mogeneous versus heterogeneous pore network. Phys. Fluids 2015, 27. [Google Scholar] [CrossRef]
- Sheng, J.J. Surfactant Enhanced Oil Recovery in Carbonate Reservoirs. In Enhanced Oil Recovery Field Case Studies; Gulf Professional Publishing: Cambridges, MA, USA, 2013; pp. 281–299. [Google Scholar] [CrossRef]
- Chilingar, G.V.; Yen, T.F. Some Notes on Wettability and Relative Permeabilities of Carbonate Reservoir Rocks, II. Energy Sources 1983, 7, 67–75. [Google Scholar] [CrossRef]
- Chen, P.; Mohanty, K.K. Surfactant-Mediated Spontaneous Imbibition in Carbonate Rocks at Harsh Reservoir Conditions. SPE J. 2013, 18, 124–133. [Google Scholar] [CrossRef]
- Yao, Y.; Wei, M.; Kang, W. A review of wettability alteration using surfactants in carbonate reservoirs. Adv. Colloid Interface Sci. 2021, 294, 102477. [Google Scholar] [CrossRef] [PubMed]
- Standnes, D.C.; Austad, T. Wettability alteration in chalk 2. Mechanism for wettability alteration from oil-wet to water-wet using surfactants. J. Pet. Sci. Eng. 2000, 28, 123–143. [Google Scholar] [CrossRef]
- Jarrahian, K.; Seiedi, O.; Sheykhan, M.; Sefti, M.V.; Ayatollahi, S. Wettability alteration of carbonate rocks by surfactants: A mechanistic study. Colloids Surf. A Physicochem. Eng. Asp. 2012, 410, 1–10. [Google Scholar] [CrossRef]
- Souayeh, M.; Al-Maamari, R.S.; Aoudia, M.; Karimi, M.; Hadji, M. Experimental Investigation of Wettability Alteration of Oil-Wet Carbonates by a Non-ionic Surfactant. Energy Fuels 2018, 32, 11222–11233. [Google Scholar] [CrossRef]
- Cai, B.; Dong, J.; Cheng, L.; Jiang, Z.; Yang, Y.; Li, X. Adsorption and micellization of gemini surfactants with pyrrolidinium head groups: Effect of the spacer length. Soft Matter 2013, 9, 7637–7646. [Google Scholar] [CrossRef]
- Kumar, N.; Tyagi, R. Industrial Applications of Dimeric Surfactants: A Review. J. Dispers. Sci. Technol. 2014, 35, 205–214. [Google Scholar] [CrossRef]
- Hou, J.; Han, M.; Wang, J. Manipulation of surface charges of oil droplets and carbonate rocks to improve oil recovery. Sci. Rep. 2021, 11, 14518. [Google Scholar] [CrossRef]
- Hilner, E.; Andersson, M.P.; Hassenkam, T.; Matthiesen, J.; Salino, P.A.; Stipp, S.L.S. The effect of ionic strength on oil adhesion in sandstone—The search for the low salinity mechanism. Sci. Rep. 2015, 5, 9933. [Google Scholar] [CrossRef]
- Massarweh, O.; Abushaikha, A.S. The use of surfactants in enhanced oil recovery: A review of recent advances. Energy Rep. 2020, 6, 3150–3178. [Google Scholar] [CrossRef]
- Austad, T.; Milter, J. Spontaneous Imbibition of Water into Low Permeable Chalk at Different Wettabilities Using Surfactants. In Proceedings of the SPE International Symposium on Oilfield Chemistry, Houston, TX, USA, 18 February 1997; SPE: Dallas, TX, USA, 1997; pp. 257–266. [Google Scholar] [CrossRef]
- Salehi, M.; Johnson, S.J.; Liang, J.T. Mechanistic study of wettability alteration using surfactants with applications in naturally fractured reservoirs. Langmuir 2008, 24, 14099–14107. [Google Scholar] [CrossRef] [PubMed]
- Hammond, P.S.; Unsal, E. Spontaneous Imbibition of Surfactant Solution into an Oil-Wet Capillary: Wettability Restoration by Surfactant−Contaminant Complexation. Langmuir 2011, 27, 4412–4429. [Google Scholar] [CrossRef] [PubMed]
- Hou, B.; Wang, Y.; Cao, X.; Zhang, J.; Song, X.; Ding, M.; Chen, W. Surfactant-Induced Wettability Alteration of Oil-Wet Sandstone Surface: Mechanisms and Its Effect on Oil Recovery. J. Surfactants Deterg. 2015, 19, 315–324. [Google Scholar] [CrossRef]
- Sugar, A.; Serag, M.F.; Torrealba, V.A.; Buttner, U.; Habuchi, S.; Hoteit, H. Visualization of polymer retention mechanisms in porous media using microfluidics. In Proceedings of the SPE Europec featured at EAGE Conference and Exhibition, Virtual, 1–3 December 2020; SPE: Dallas, TX, USA, 2020; p. D021S010R004. [Google Scholar]
- Deljooei, M.; Zargar, G.; Nooripoor, V.; Takassi, M.A.; Esfandiarian, A. Novel green surfactant made from L-aspartic acid as enhancer of oil production from sandstone reservoirs: Wettability, IFT, microfluidic, and core flooding assessments. J. Mol. Liq. 2020, 323, 115037. [Google Scholar] [CrossRef]
- Kiani, S.; Jones, D.R.; Alexander, S.; Barron, A.R. New insights into the interactions between asphaltene and a low surface energy anionic surfactant under low and high brine salinity. J. Colloid Interface Sci. 2020, 571, 307–317. [Google Scholar] [CrossRef]
- Schick, M. Nonionic Surfactants: Physical Chemistry; CRC Press: Boca Raton, FL, USA, 1987. [Google Scholar]
- Cutler, W.G.; Davis, R.C. Detergency; Theory and Test Methods; Part 1; Marcel Dekker: New York, NY, USA, 1972; ISBN 9780824711139. Available online: https://books.google.co.in/books?id=z6L0xQEACAAJ (accessed on 3 December 2023).
- Kao, R.; Wasan, D.; Nikolov, A.; Edwards, D. Mechanisms of oil removal from a solid surface in the presence of anionic micellar solutions. Colloids Surf. 1989, 34, 389–398. [Google Scholar] [CrossRef]
- Kumar, K.; Dao, E.K.; Mohanty, K.K. Atomic Force Microscopy Study of Wettability Alteration by Surfactants. SPE J. 2008, 13, 137–145. [Google Scholar] [CrossRef]
- Alvarez, J.O.; Schechter, D.S. Wettability Alteration and Spontaneous Imbibition in Unconventional Liquid Reservoirs by Surfactant Additives. SPE Reserv. Eval. Eng. 2016, 20, 107–117. [Google Scholar] [CrossRef]
- Zhao, X.; Zhan, F.; Liao, G.; Liu, W.; Su, X.; Feng, Y. In situ micro-emulsification during surfactant enhanced oil recovery: A mi-crofluidic study. J. Colloid Interface Sci. 2022, 620, 465–477. [Google Scholar] [CrossRef] [PubMed]
- Seo, S.; Mastiani, M.; Mosavati, B.; Peters, D.M.; Mandin, P.; Kim, M. Performance evaluation of environmentally benign nonionic biosurfactant for enhanced oil recovery. Fuel 2018, 234, 48–55. [Google Scholar] [CrossRef]
- Liu, Z.; Li, Y.; Luan, H.; Gao, W.; Guo, Y.; Chen, Y. Pore scale and macroscopic visual displacement of oil-in-water emulsions for enhanced oil recovery. Chem. Eng. Sci. 2019, 197, 404–414. [Google Scholar] [CrossRef]
- Zhao, X.; Feng, Y.; Liao, G.; Liu, W. Visualizing in-situ emulsification in porous media during surfactant flooding: A microfluidic study. J. Colloid Interface Sci. 2020, 578, 629–640. [Google Scholar] [CrossRef] [PubMed]
- Guo, F.; Aryana, S.A. Improved sweep efficiency due to foam flooding in a heterogeneous microfluidic device. J. Pet. Sci. Eng. 2018, 164, 155–163. [Google Scholar] [CrossRef]
- Nilsson, M.A.; Kulkarni, R.; Gerberich, L.; Hammond, R.; Singh, R.; Baumhoff, E.; Rothstein, J.P. Effect of fluid rheology on enhanced oil recovery in a microfluidic sandstone device. J. Non-Newton. Fluid Mech. 2013, 202, 112–119. [Google Scholar] [CrossRef]
- He, K.; Xu, L.; Gao, Y.; Yin, X.; Neeves, K.B. Evaluation of surfactant performance in fracturing fluids for enhanced well productivity in unconventional reservoirs using Rock-on-a-Chip approach. J. Pet. Sci. Eng. 2015, 135, 531–541. [Google Scholar] [CrossRef]
- Saadat, M.; Yang, J.; Dudek, M.; Øye, G.; Tsai, P.A. Microfluidic investigation of enhanced oil recovery: The effect of aqueous floods and network wettability. J. Pet. Sci. Eng. 2021, 203, 108647. [Google Scholar] [CrossRef]
- Nandwani, S.K.; Malek, N.I.; Lad, V.N.; Chakraborty, M.; Gupta, S. Study on interfacial properties of Imidazolium ionic liquids as surfactant and their application in enhanced oil recovery. Colloids Surf. A Physicochem. Eng. Asp. 2017, 516, 383–393. [Google Scholar] [CrossRef]
- Zhao, X.-Z.; Liao, G.-Z.; Gong, L.-Y.; Luan, H.-X.; Chen, Q.-S.; Liu, W.-D.; Liu, D.; Feng, Y.-J. New insights into the mechanism of surfactant enhanced oil recovery: Micellar solubilization and in-situ emulsification. Pet. Sci. 2021, 19, 870–881. [Google Scholar] [CrossRef]
- Xu, F.; Chen, Q.; Ma, M.; Wang, Y.; Yu, F.; Li, J. Displacement mechanism of polymeric surfactant in chemical cold flooding for heavy oil based on microscopic visualization experiments. Adv. Geo-Energy Res. 2020, 4, 77–85. [Google Scholar] [CrossRef]
- Kiani, S.; Rogers, S.E.; Sagisaka, M.; Alexander, S.; Barron, A.R. A New Class of Low Surface Energy Anionic Surfactant for Enhanced Oil Recovery. Energy Fuels 2019, 33, 3162–3175. [Google Scholar] [CrossRef]
- Chávez-Miyauchi, T.E.; Firoozabadi, A.; Fuller, G.G. Nonmonotonic Elasticity of the Crude Oil–Brine Interface in Relation to Improved Oil Recovery. Langmuir 2016, 32, 2192–2198. [Google Scholar] [CrossRef] [PubMed]
- Yun, W.; Chang, S.; Cogswell, D.A.; Eichmann, S.L.; Gizzatov, A.; Thomas, G.; Al-Hazza, N.; Abdel-Fattah, A.; Wang, W. Toward res-ervoir-on-a-chip: Rapid performance evaluation of enhanced oil recovery surfactants for carbonate reservoirs using a cal-cite-coated micromodel. Sci. Rep. 2020, 10, 782. [Google Scholar] [CrossRef] [PubMed]
- Vavra, E.; Puerto, M.; Biswal, S.L.; Hirasaki, G.J. A systematic approach to alkaline-surfactant-foam flooding of heavy oil: Microfluidic assessment with a novel phase-behavior viscosity map. Sci. Rep. 2020, 10, 12930. [Google Scholar] [CrossRef] [PubMed]
- Pryazhnikov, M.I.; Minakov, A.V.; Pryazhnikov, A.I.; Denisov, I.A.; Yakimov, A.S. Microfluidic Study of the Effect of Nanosuspensions on Enhanced Oil Recovery. Nanomaterials 2022, 12, 520. [Google Scholar] [CrossRef]
- Lim, S.; Horiuchi, H.; Nikolov, A.D.; Wasan, D. Nanofluids Alter the Surface Wettability of Solids. Langmuir 2015, 31, 5827–5835. [Google Scholar] [CrossRef]
- Li, K.; Wang, D.; Jiang, S. Review on enhanced oil recovery by nanofluids. Oil Gas Sci. Technol. Rev. D’ifp Energ. Nouv. 2018, 73, 37. [Google Scholar] [CrossRef]
- De Gennes, P.G. Wetting: Statics and dynamics. Rev. Mod. Phys. 1985, 57, 827–863. [Google Scholar] [CrossRef]
- Wasan, D.; Nikolov, A.; Kondiparty, K. The wetting and spreading of nanofluids on solids: Role of the structural disjoining pressure. Curr. Opin. Colloid Interface Sci. 2011, 16, 344–349. [Google Scholar] [CrossRef]
- Lim, S.; Wasan, D. Structural disjoining pressure induced solid particle removal from solid substrates using nanofluids. J. Colloid Interface Sci. 2017, 500, 96–104. [Google Scholar] [CrossRef] [PubMed]
- Bazazi, P.; Sanati-Nezhad, A.; Hejazi, S.H. Wetting Phase Disintegration and Detachment: Three-Dimensional Confocal Imaging of Two-Phase Distributions. Phys. Rev. Appl. 2019, 11, 014042. [Google Scholar] [CrossRef]
- Cheraghian, G.; Hendraningrat, L. A review on applications of nanotechnology in the enhanced oil recovery part A: Effects of nanoparticles on interfacial tension. Int. Nano Lett. 2016, 6, 129–138. [Google Scholar] [CrossRef]
- Khilar, K.C.; Fogler, H.S. Migrations of Fines in Porous Media; Springer: Dordrecht, The Netherlands, 1998; ISBN 9783030018054. [Google Scholar]
- Zhang, T.; Murphy, M.; Yu, H.; GBagaria, H.; Yoon, K.Y.; Nielson, B.M.; Bielawski, C.W.; Johnston, K.P.; Huh, C.; Bryant, S.L. Investi-gation of nanoparticle adsorption during transport in porous media. In Proceedings of the SPE Annual Technical Conference and Exhibition, New Orleans, LA, USA, 30 September–2 October 2013; SPE: Dallas, TX, USA, 2013; p. D021S020R005. [Google Scholar]
- Li, S.; Torsæter, O.; Lau, H.C.; Hadia, N.J.; Stubbs, L.P. The Impact of Nanoparticle Adsorption on Transport and Wettability Alteration in Water-Wet Berea Sandstone: An Experimental Study. Front. Phys. 2019, 7, 74. [Google Scholar] [CrossRef]
- Lei, W.; Lu, X.; Wang, M. Multiphase displacement manipulated by micro/nanoparticle suspensions in porous media via microfluidic experiments: From interface science to multiphase flow patterns. Adv. Colloid Interface Sci. 2023, 311, 102826. [Google Scholar] [CrossRef]
- Kazemzadeh, Y.; Shojaei, S.; Riazi, M.; Sharifi, M. Review on application of nanoparticles for EOR purposes: A critical review of the opportunities and challenges. Chin. J. Chem. Eng. 2019, 27, 237–246. [Google Scholar] [CrossRef]
- Skauge, T.; Hetland, S.; Spildo, K.; Skauge, A. Nano-sized particles for EOR. In Proceedings of the SPE Improved Oil Recovery Symposium, Tulsa, OK, USA, 24–28 April 2010; OnePetro: Dallas, TX, USA, 2010. [Google Scholar]
- Chakraborty, S.; Panigrahi, P.K. Stability of nanofluid: A review. Appl. Therm. Eng. 2020, 174, 115259. [Google Scholar] [CrossRef]
- Shamsijazeyi, H.; Miller, C.A.; Wong, M.S.; Tour, J.M.; Verduzco, R. Polymer-coated nanoparticles for enhanced oil recovery. J. Appl. Polym. Sci. 2014, 131, 40576. [Google Scholar] [CrossRef]
- Olayiwola, S.O.; Dejam, M. A comprehensive review on interaction of nanoparticles with low salinity water and surfactant for enhanced oil recovery in sandstone and carbonate reservoirs. Fuel 2019, 241, 1045–1057. [Google Scholar] [CrossRef]
- Mahmoudi, S.; Jafari, A.; Javadian, S. Temperature effect on performance of nanoparticle/surfactant flooding in enhanced heavy oil recovery. Pet. Sci. 2019, 16, 1387–1402. [Google Scholar] [CrossRef]
- Nap, R.J.; Park, S.H.; Szleifer, I. On the stability of nanoparticles coated with polyelectrolytes in high salinity solutions. J. Polym. Sci. Part B Polym. Phys. 2014, 52, 1689–1699. [Google Scholar] [CrossRef]
- Rostami, P.; Sharifi, M.; Aminshahidy, B.; Fahimpour, J. Enhanced oil recovery using silica nanoparticles in the presence of salts for wettability alteration. J. Dispers. Sci. Technol. 2019, 41, 402–413. [Google Scholar] [CrossRef]
- Dehaghani, A.H.S.; Daneshfar, R. How much would silica nanoparticles enhance the performance of low-salinity water flooding? Pet. Sci. 2019, 16, 591–605. [Google Scholar] [CrossRef]
- Mohammad Salehi, M.; Omidvar, P.; Naeimi, F. Salinity of injection water and its impact on oil recovery absolute perme-ability, residual oil saturation, interfacial tension and capillary pressure. Egypt. J. Pet. 2017, 26, 301–312. [Google Scholar] [CrossRef]
- Maghzi, A.; Mohammadi, S.; Ghazanfari, M.H.; Kharrat, R.; Masihi, M. Monitoring wettability alteration by silica nano-particles during water flooding to heavy oils in five-spot systems: A pore-level investigation. Exp. Therm. Fluid Sci. 2012, 40, 168–176. [Google Scholar] [CrossRef]
- Bhuiyan, M.; Saidur, R.; Amalina, M.; Mostafizur, R.; Islam, A. Effect of Nanoparticles Concentration and Their Sizes on Surface Tension of Nanofluids. Procedia Eng. 2015, 105, 431–437. [Google Scholar] [CrossRef]
- Masoud Hosseini, S.; Vafajoo, L.; Ghasemi, E.; Salman, B.H. Experimental investigation the effect of nanoparticle con-centration on the rheological behavior of paraffin-based nickel ferrofluid. Int. J. Heat Mass Transf. 2016, 93, 228–234. [Google Scholar] [CrossRef]
- Hojjat, M.; Etemad, S.; Bagheri, R.; Thibault, J. Rheological characteristics of non-Newtonian nanofluids: Experimental investigation. Int. Commun. Heat Mass Transf. 2010, 38, 144–148. [Google Scholar] [CrossRef]
- Al-Anssari, S.; Barifcani, A.; Wang, S.; Maxim, L.; Iglauer, S. Wettability alteration of oil-wet carbonate by silica nanofluid. J. Colloid Interface Sci. 2015, 461, 435–442. [Google Scholar] [CrossRef]
- Hendraningrat, L.; Torsæter, O. Unlocking the Potential of Metal Oxides Nanoparticles to Enhance the Oil Recovery. Proc. Annu. Offshore Technol. Conf. 2014, 1, 211–222. [Google Scholar]
- Xu, K.; Zhu, P.; Huh, C.; Balhoff, M.T. Microfluidic Investigation of Nanoparticles’ Role in Mobilizing Trapped Oil Droplets in Porous Media. Langmuir 2015, 31, 13673–13679. [Google Scholar] [CrossRef]
- Bolandtaba, S.F.; Skauge, A. Network Modeling of EOR Processes: A Combined Invasion Percolation and Dynamic Model for Mobilization of Trapped Oil. Transp. Porous Media 2011, 89, 357–382. [Google Scholar] [CrossRef]
- Manzari Tavakoli, H.; Jamialahmadi, M.; Kord, S.; Daryasafar, A. Experimental investigation of the effect of silica nano-particles on the kinetics of barium sulfate scaling during water injection process. J. Pet. Sci. Eng. 2018, 169, 344–352. [Google Scholar] [CrossRef]
- Gbadamosi, A.O.; Junin, R.; Manan, M.A.; Agi, A.; Yusuff, A.S. An overview of chemical enhanced oil recovery: Recent advances and prospects. Int. Nano Lett. 2019, 9, 171–202. [Google Scholar] [CrossRef]
- Li, X.; Zhu, D.; Wang, X. Experimental investigation on viscosity of Cu-H2O nanofluids. J. Wuhan Univ. Technol. Sci. Ed. 2009, 24, 48–52. [Google Scholar] [CrossRef]
- Schmidt, A.J.; Chiesa, M.; Torchinsky, D.H.; Johnson, J.A.; Boustani, A.; McKinley, G.H.; Nelson, K.A.; Chen, G. Experimental investi-gation of nanofluid shear and longitudinal viscosities. Appl. Phys. Lett. 2008, 92. [Google Scholar] [CrossRef]
- Turgut, A.; Tavman, I.; Chirtoc, M.; Schuchmann, H.P.; Sauter, C.; Tavman, S. Thermal Conductivity and Viscosity Measurements of Water-Based TiO2 Nanofluids. Int. J. Thermophys. 2009, 30, 1213–1226. [Google Scholar] [CrossRef]
- Pak, B.C.; Cho, Y.I. Hydrodynamic and heat transfer study of dispersed fluids with submicron metallic oxide particles. Exp. Heat Transf. 1998, 11, 151–170. [Google Scholar] [CrossRef]
- Gupta, R.; Mohanty, K.K. Wettability Alteration Mechanism for Oil Recovery from Fractured Carbonate Rocks. Transp. Porous Media 2011, 87, 635–652. [Google Scholar] [CrossRef]
- Buonomo, B.; Manca, O.; Marinelli, L.; Nardini, S. Effect of temperature and sonication time on nanofluid thermal con-ductivity measurements by nano-flash method. Appl. Therm. Eng. 2015, 91, 181–190. [Google Scholar] [CrossRef]
- Al-Anssari, S.; Wang, S.; Barifcani, A.; Lebedev, M.; Iglauer, S. Effect of temperature and SiO2 nanoparticle size on wettability alteration of oil-wet calcite. Fuel 2017, 206, 34–42. [Google Scholar] [CrossRef]
- Bahraminejad, H.; Manshad, A.K.; Iglauer, S.; Keshavarz, A. NEOR mechanisms and performance analysis in car-bonate/sandstone rock coated microfluidic systems. Fuel 2022, 309, 122327. [Google Scholar] [CrossRef]
- Elyaderani, S.M.G.; Jafari, A. Microfluidics experimental study in porous media applied for nanosilica/alkaline flooding. J. Pet. Sci. Eng. 2018, 173, 1289–1303. [Google Scholar] [CrossRef]
- Betancur, S.; Olmos, C.M.; Pérez, M.; Lerner, B.; Franco, C.A.; Riazi, M.; Gallego, J.; Carrasco-Marín, F.; Cortés, F.B. A microfluidic study to investigate the effect of magnetic iron core-carbon shell nanoparticles on displacement mechanisms of crude oil for chemical enhanced oil recovery. J. Pet. Sci. Eng. 2020, 184, 106589. [Google Scholar] [CrossRef]
- Xu, K.; Agrawal, D.K.; Darugar, Q. Hydrophilic Nanoparticle-Based Enhanced Oil Recovery: Microfluidic Investigations on Mechanisms. Energy Fuels 2018, 32, 11243–11252. [Google Scholar] [CrossRef]
- Omran, M.; Akarri, S.; Torsaeter, O. The Effect of Wettability and Flow Rate on Oil Displacement Using Polymer-Coated Silica Nanoparticles: A Microfluidic Study. Processes 2020, 8, 991. [Google Scholar] [CrossRef]
- Hasani, M.; Jafari, A. Electromagnetic field’s effect on enhanced oil recovery using magnetic nanoparticles: Microfluidic experimental approach. Fuel 2021, 307, 121718. [Google Scholar] [CrossRef]
- Xu, K.; Zhu, P.; Colon, T.; Huh, C.; Balhoff, M. A Microfluidic Investigation of the Synergistic Effect of Nanoparticles and Surfactants in Macro-Emulsion-Based Enhanced Oil Recovery. SPE J. 2016, 22, 459–469. [Google Scholar] [CrossRef]
- Li, S.; Dan, D.; Lau, H.C.; Hadia, N.J.; Torsæter, O.; Stubbs, L.P. Investigation of wettability alteration by silica nanoparticles through advanced surface-wetting visualization techniques. In Proceedings of the SPE Annual Technical Conference and Exhibition, Calgary, AB, Canada, 30 September–2 October 2019; SPE: Dallas, TX, USA, 2019; p. D031S040R002. [Google Scholar]
- Omran, M.; Akarri, S.; Bila, A.; Torsæter, O. Screening of Nanoparticles with Considering the Pore Structure and Initial Oil Connectivity Effects. In Proceedings of the Society of Petroleum Engineers—SPE Norway Subsurface Conference, Virtual, 2–3 November 2020; OnePetro: Dallas, TX, USA, 2020. [Google Scholar] [CrossRef]
- Li, S.; Sng, A.; Daniel, D.; Lau, H.C.; Torsæter, O.; Stubbs, L.P. Visualizing and Quantifying Wettability Alteration by Silica Nanofluids. ACS Appl. Mater. Interfaces 2021, 13, 41182–41189. [Google Scholar] [CrossRef]
- Rostami, P.; Sharifi, M.; Aminshahidy, B.; Fahimpour, J. The effect of nanoparticles on wettability alteration for enhanced oil recovery: Micromodel experimental studies and CFD simulation. Pet. Sci. 2019, 16, 859–873. [Google Scholar] [CrossRef]
- Ahmadi, M.A.; Shadizadeh, S.R. Nano-surfactant flooding in carbonate reservoirs: A mechanistic study. Eur. Phys. J. Plus 2017, 132, 246. [Google Scholar] [CrossRef]
- Ahmadi, M.A.; Shadizadeh, S.R. Spotlight on the New Natural Surfactant Flooding in Carbonate Rock Samples in Low Salinity Condition. Sci. Rep. 2018, 8, 10985. [Google Scholar] [CrossRef] [PubMed]
- Emeka, O.J.; Chikwe, A.; Onyejekwe, I.; Oguamah, I.; Okoli, N.; Daniel, O.C. Metallic Oxides Nanoparticles: The New Frontier in EOR. Am. J. Appl. Sci. Res. 2020, 6, 61. [Google Scholar] [CrossRef]
- Negin, C.; Ali, S.; Xie, Q. Application of nanotechnology for enhancing oil recovery—A review. Petroleum 2016, 2, 324–333. [Google Scholar] [CrossRef]
- Peng, B.; Zhang, L.; Luo, J.; Wang, P.; Ding, B.; Zeng, M.; Cheng, Z. A review of nanomaterials for nanofluid enhanced oil recovery. RSC Adv. 2017, 7, 32246–32254. [Google Scholar] [CrossRef]
Disclaimer/Publisher’s Note: The statements, opinions and data contained in all publications are solely those of the individual author(s) and contributor(s) and not of MDPI and/or the editor(s). MDPI and/or the editor(s) disclaim responsibility for any injury to people or property resulting from any ideas, methods, instructions or products referred to in the content. |
© 2023 by the authors. Licensee MDPI, Basel, Switzerland. This article is an open access article distributed under the terms and conditions of the Creative Commons Attribution (CC BY) license (https://creativecommons.org/licenses/by/4.0/).