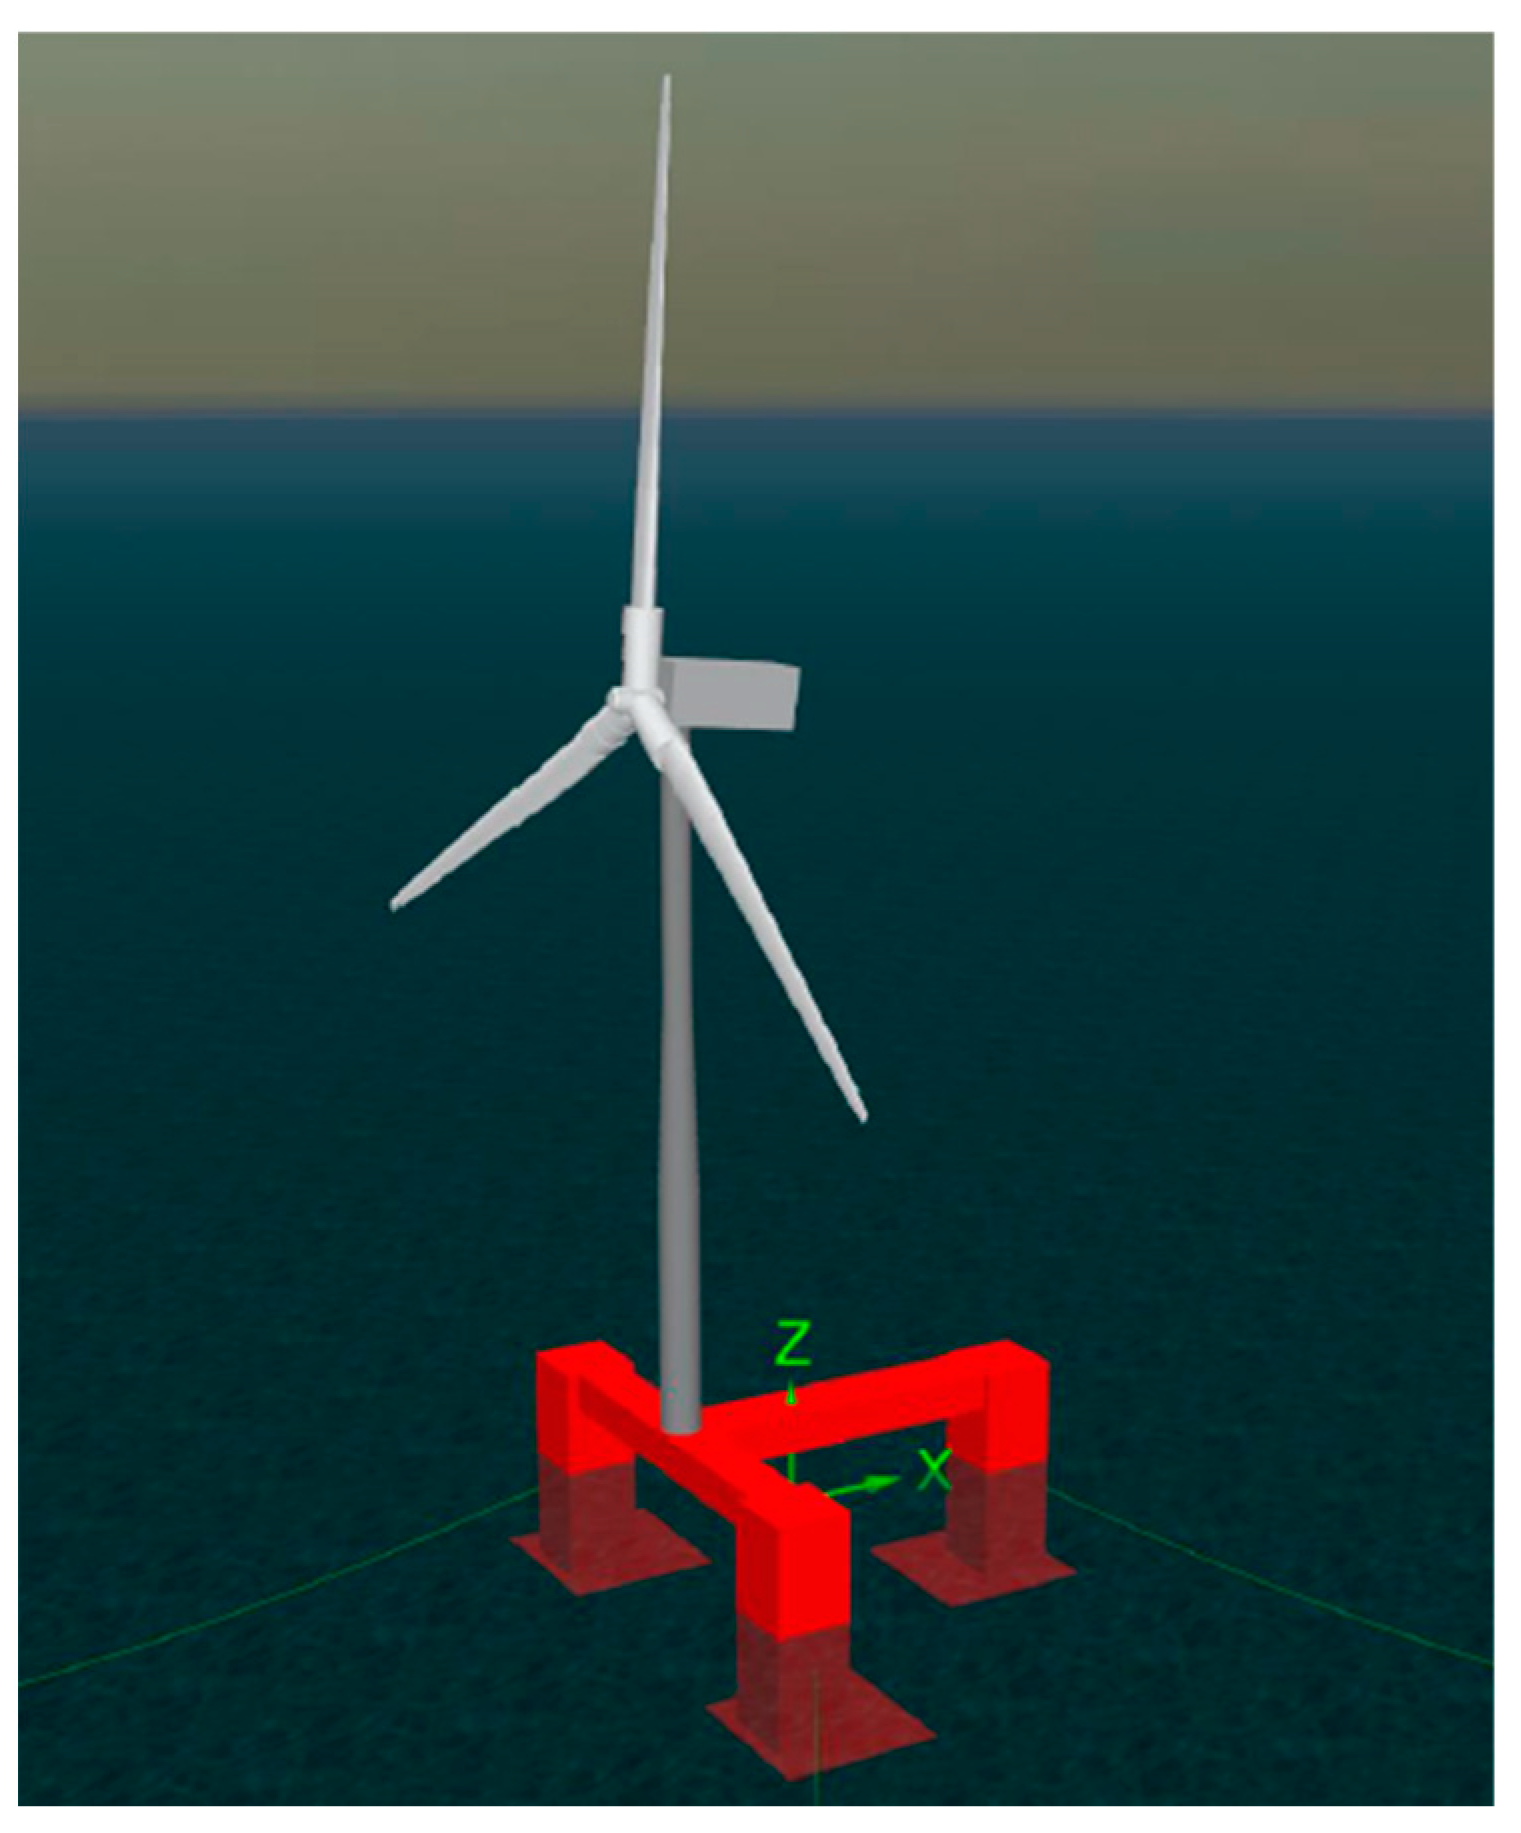
Figure 1.
A wind turbine generator.
Figure 1.
A wind turbine generator.
Figure 2.
Response amplitude operator (RAO) of a Tri-Star floater in head waves (with and without the effect of viscosity).
Figure 2.
Response amplitude operator (RAO) of a Tri-Star floater in head waves (with and without the effect of viscosity).
Figure 3.
Response amplitude operator (RAO) of a Tri-Star floater in beam waves (with and without the effect of viscosity).
Figure 3.
Response amplitude operator (RAO) of a Tri-Star floater in beam waves (with and without the effect of viscosity).
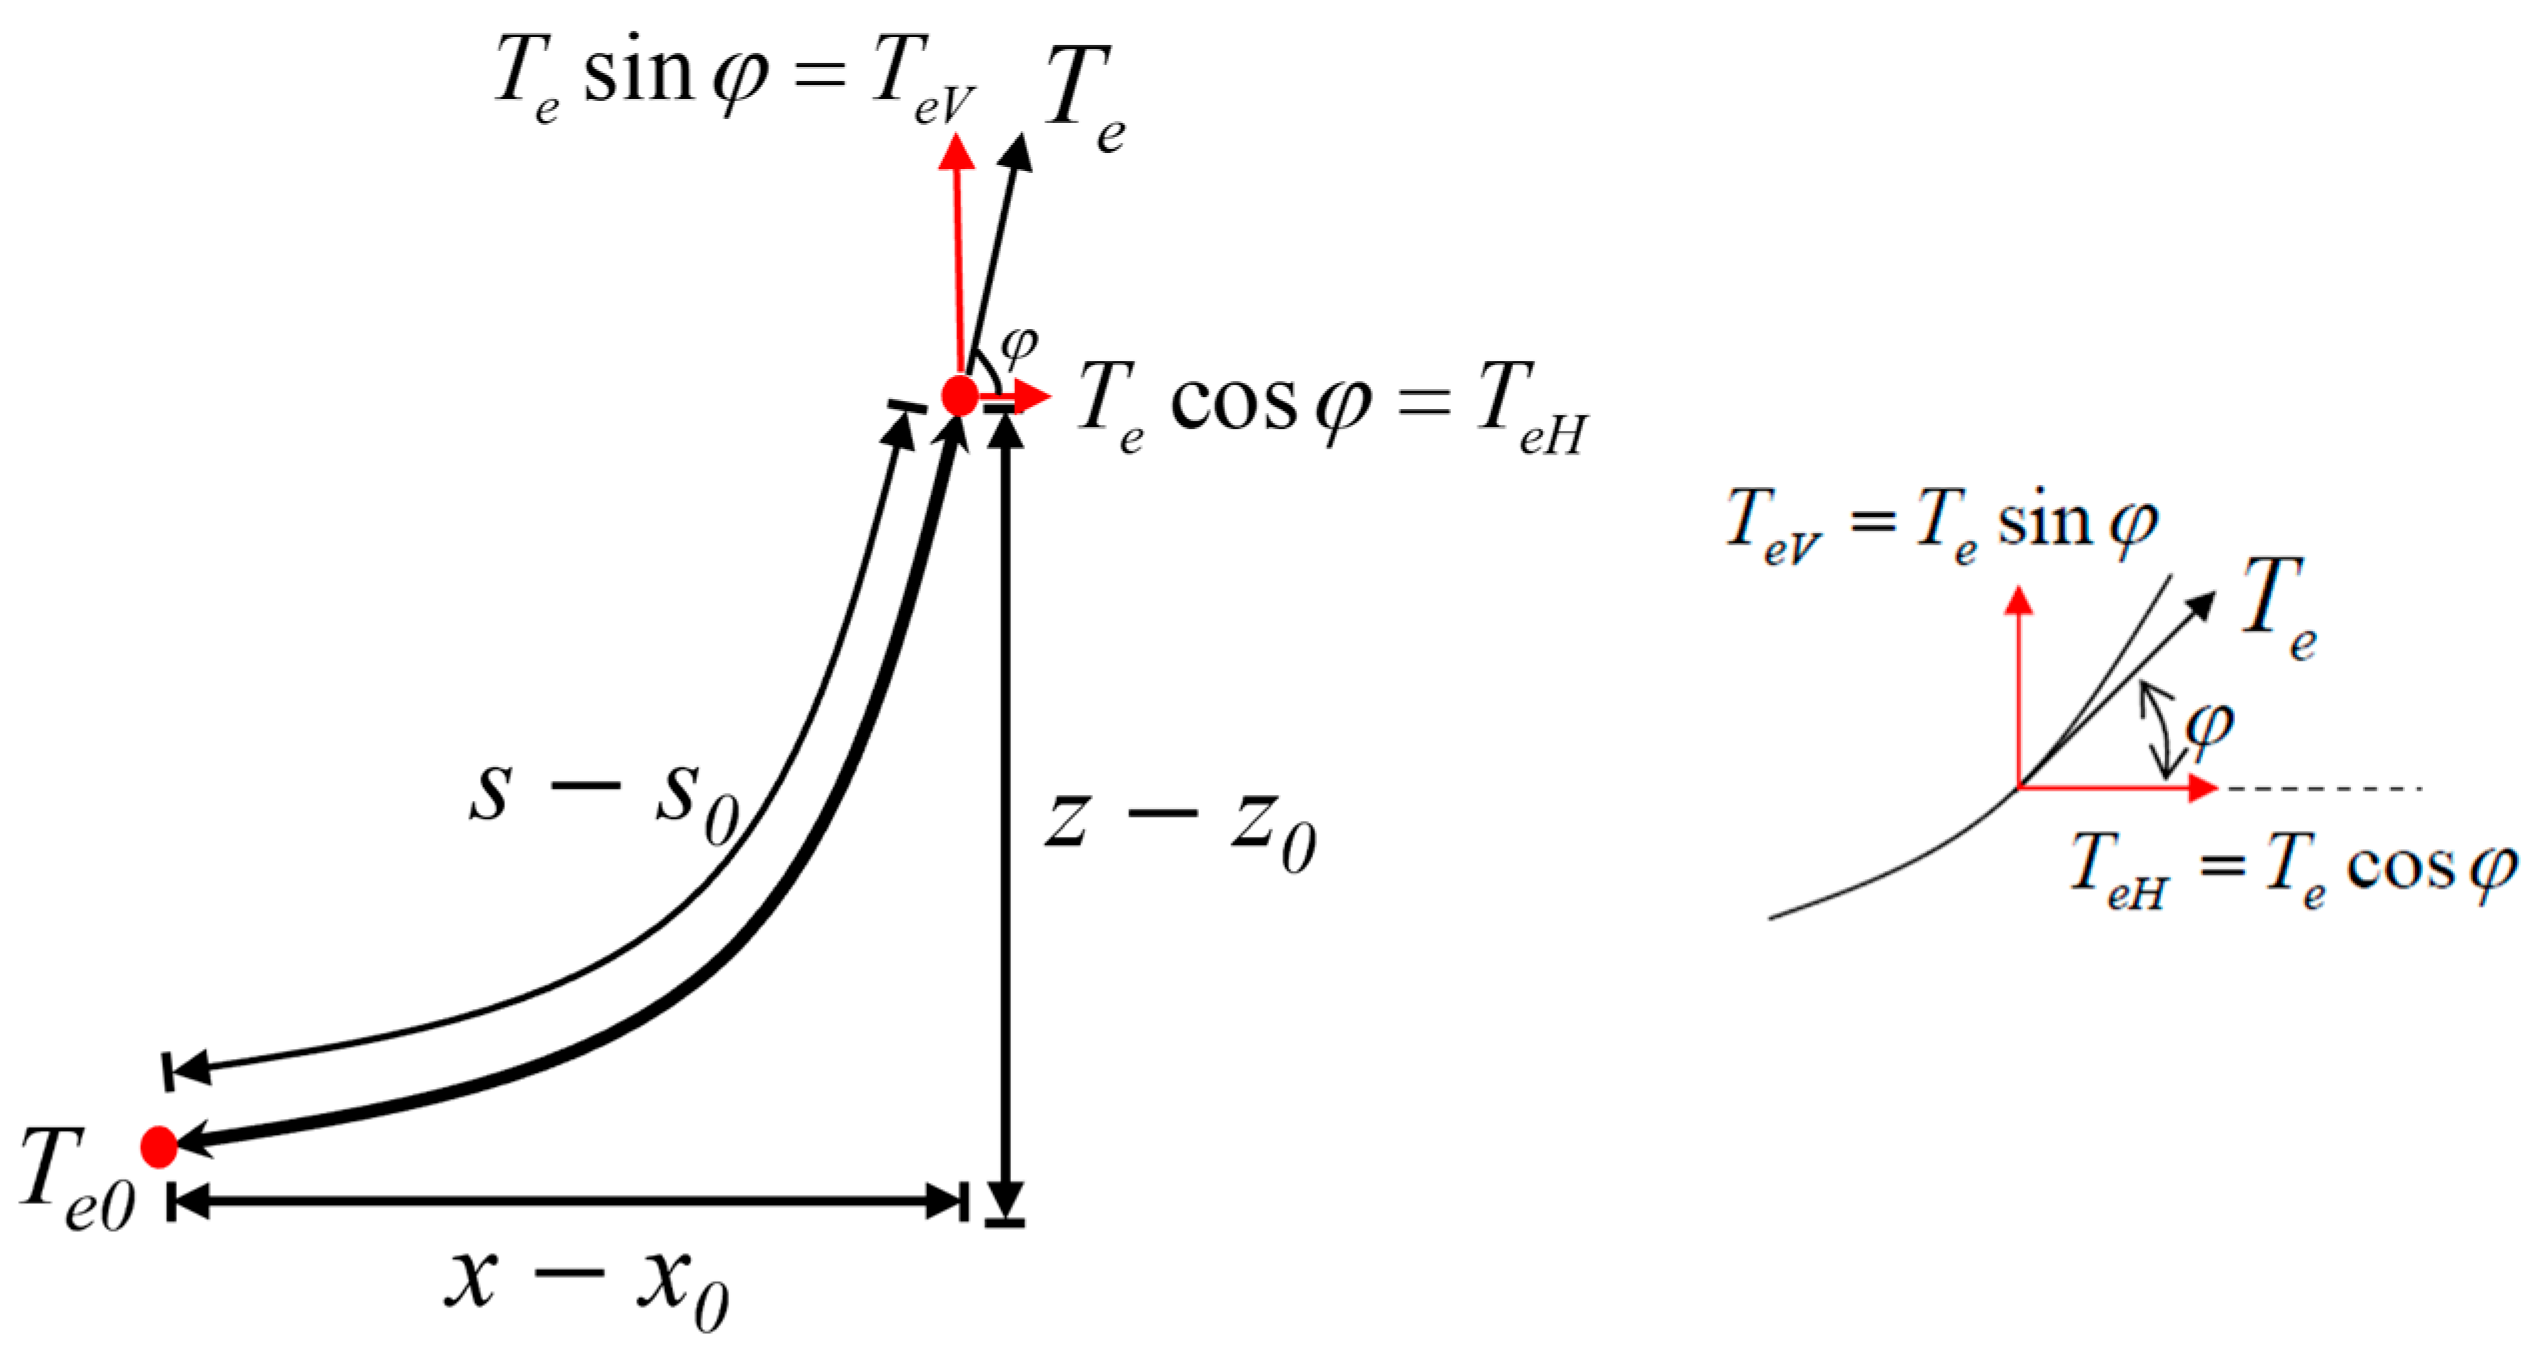
Figure 4.
Definition of the variables in a catenary mooring system.
Figure 4.
Definition of the variables in a catenary mooring system.
Figure 5.
The current profile (near-surface and subsurface currents).
Figure 5.
The current profile (near-surface and subsurface currents).
Figure 6.
Transformation of the current’s force.
Figure 6.
Transformation of the current’s force.
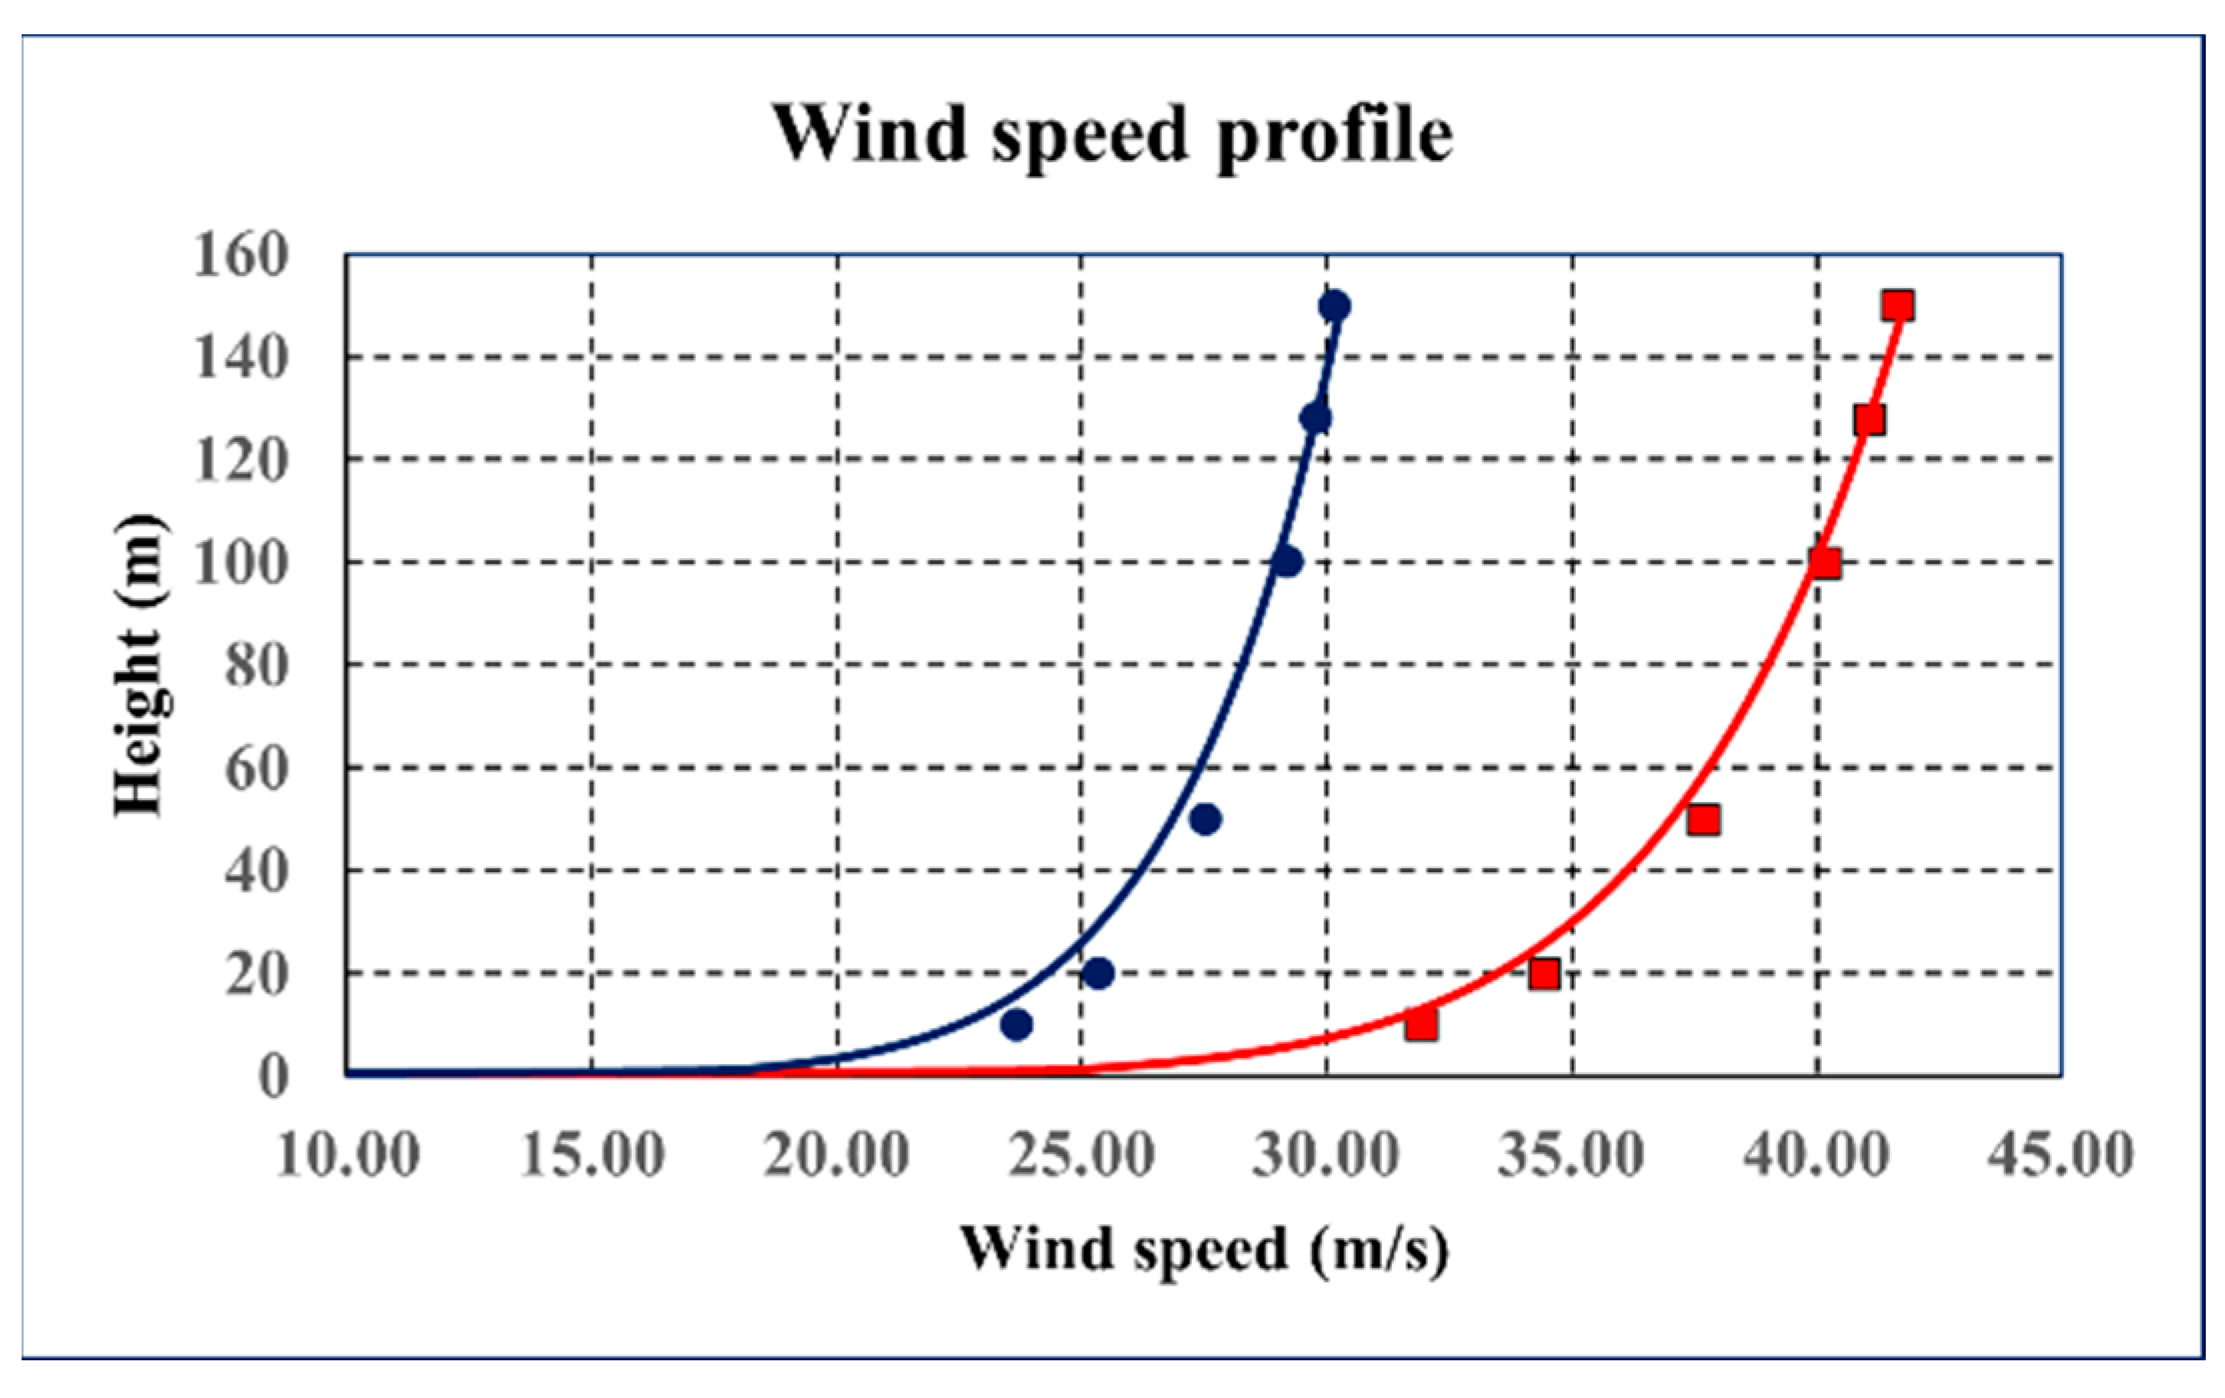
Figure 7.
Comparison of the measured wind speed profile and that of the power law equation (points, measured data; line, approximated data; blue and red color are wind speed profile of 1-year and 50-year return periods).
Figure 7.
Comparison of the measured wind speed profile and that of the power law equation (points, measured data; line, approximated data; blue and red color are wind speed profile of 1-year and 50-year return periods).
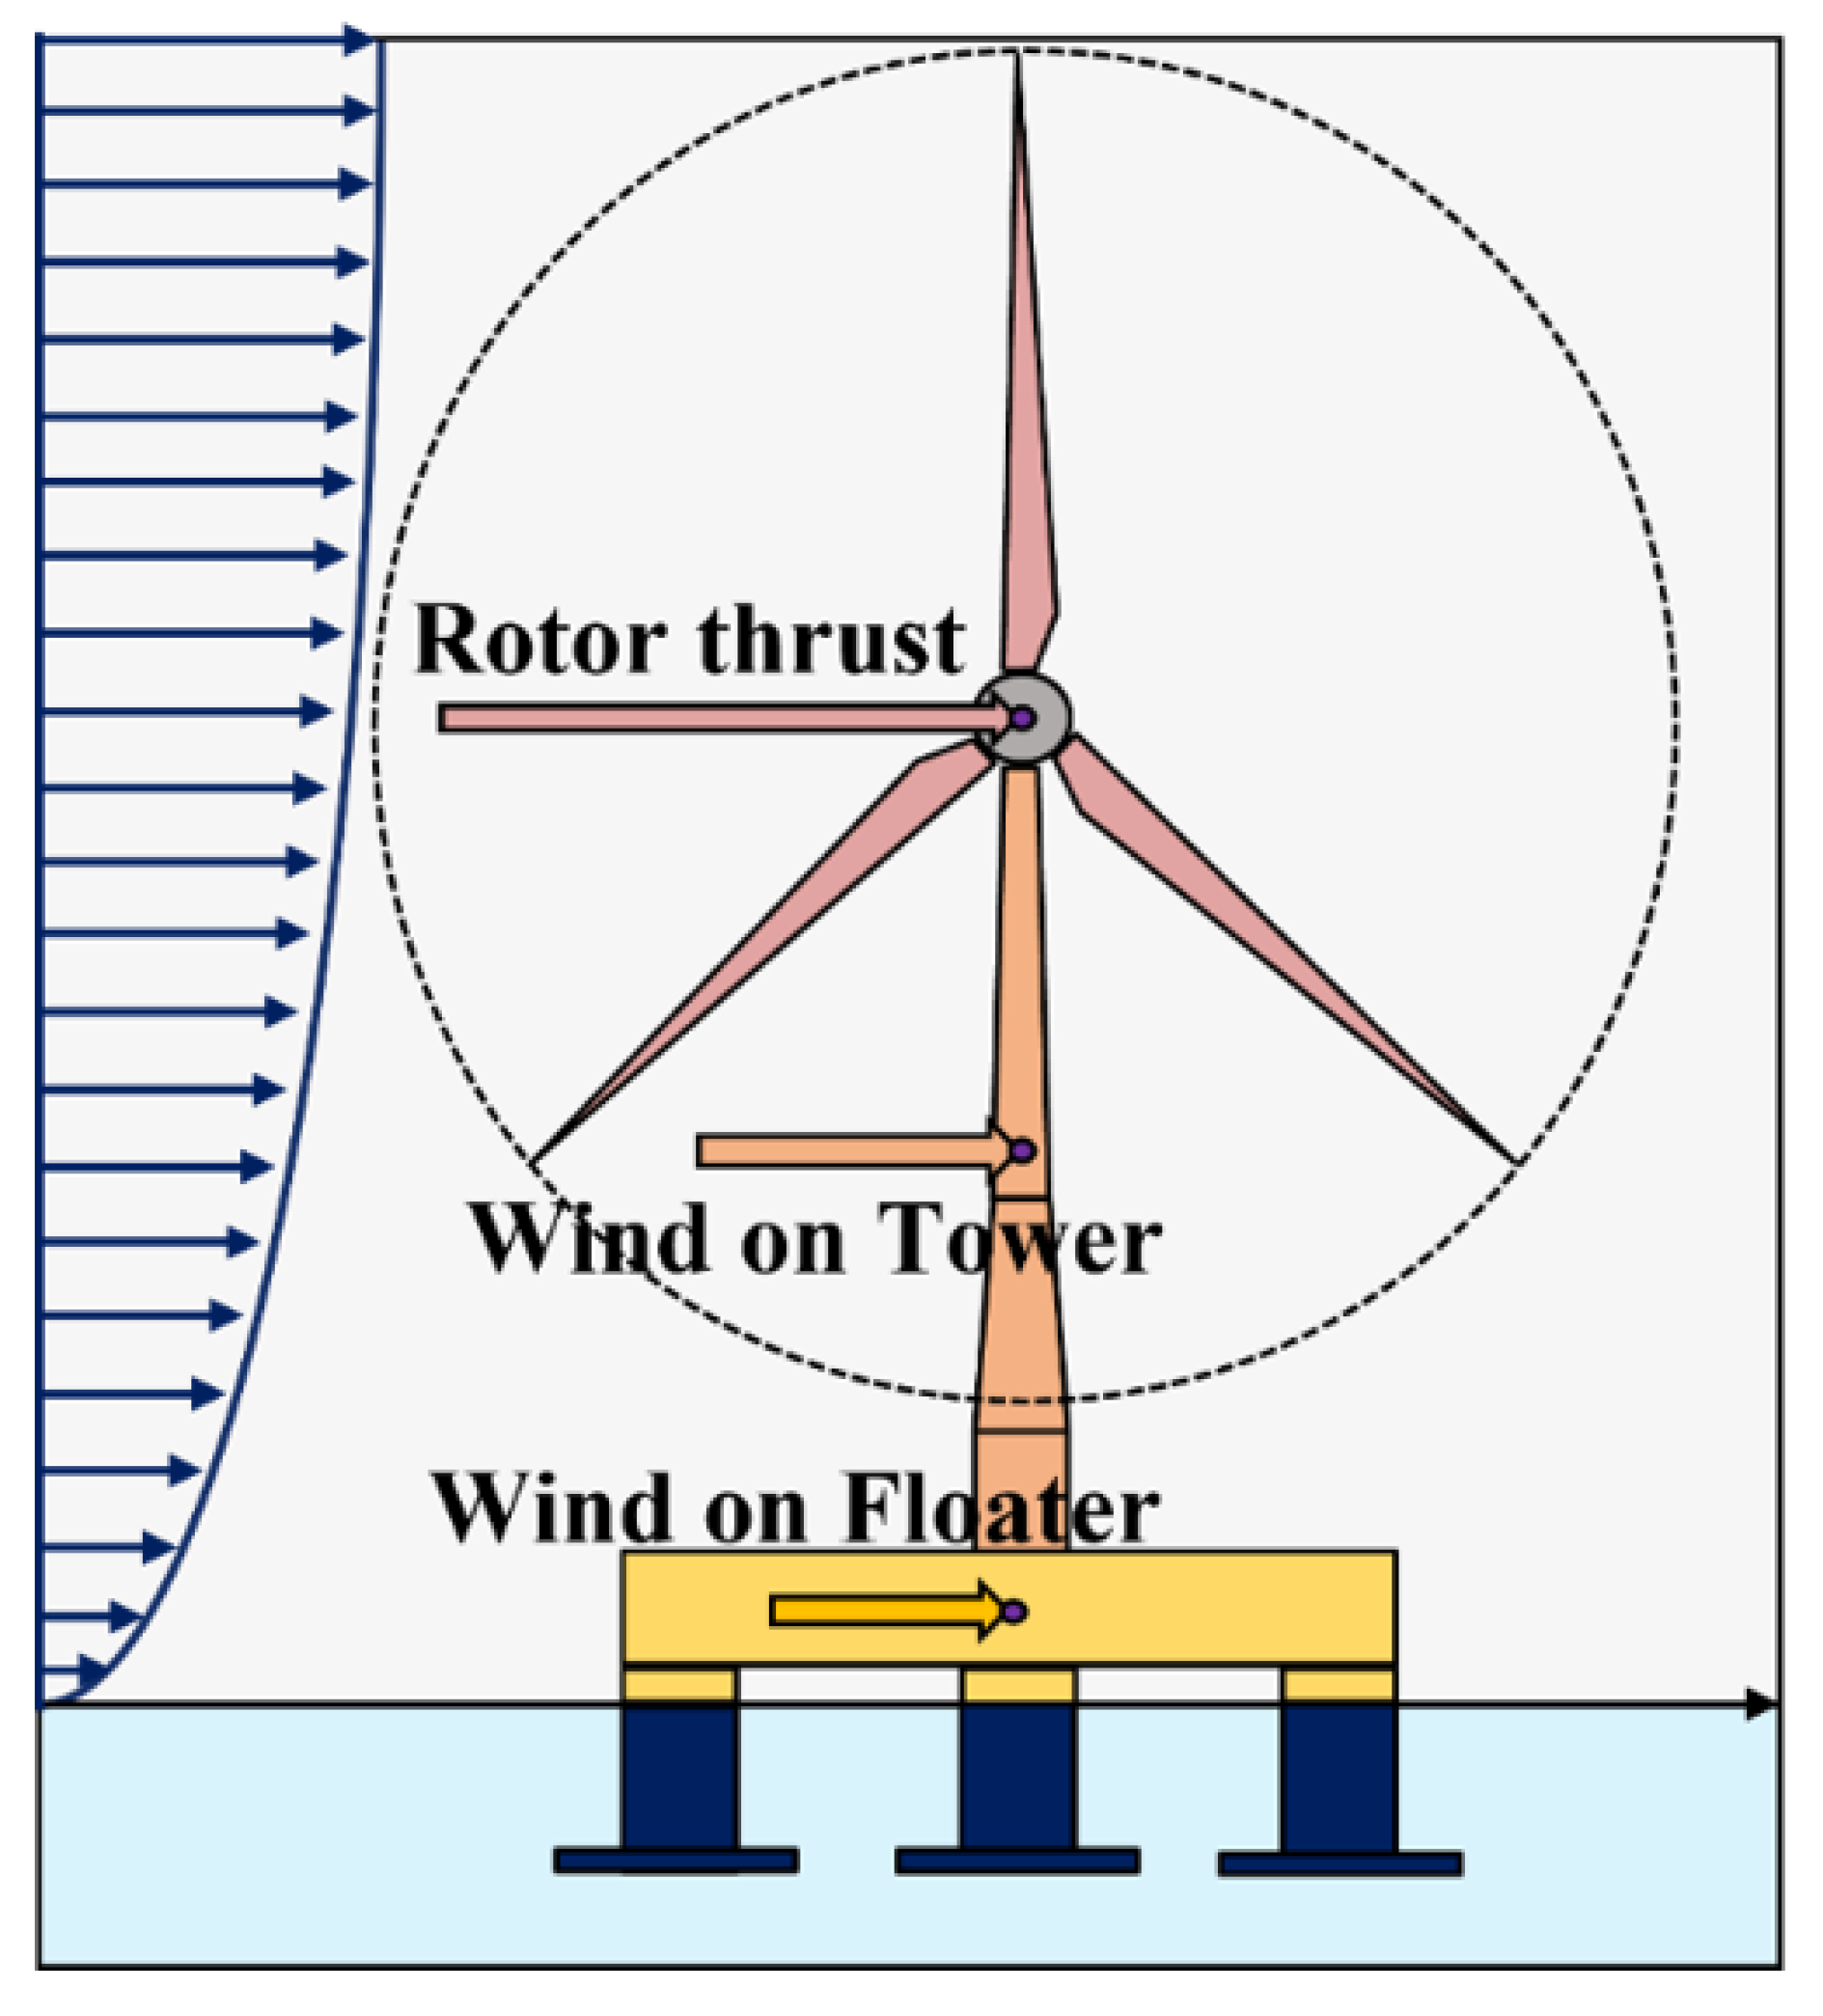
Figure 8.
Area of wind force in a wind turbine generator.
Figure 8.
Area of wind force in a wind turbine generator.
Figure 9.
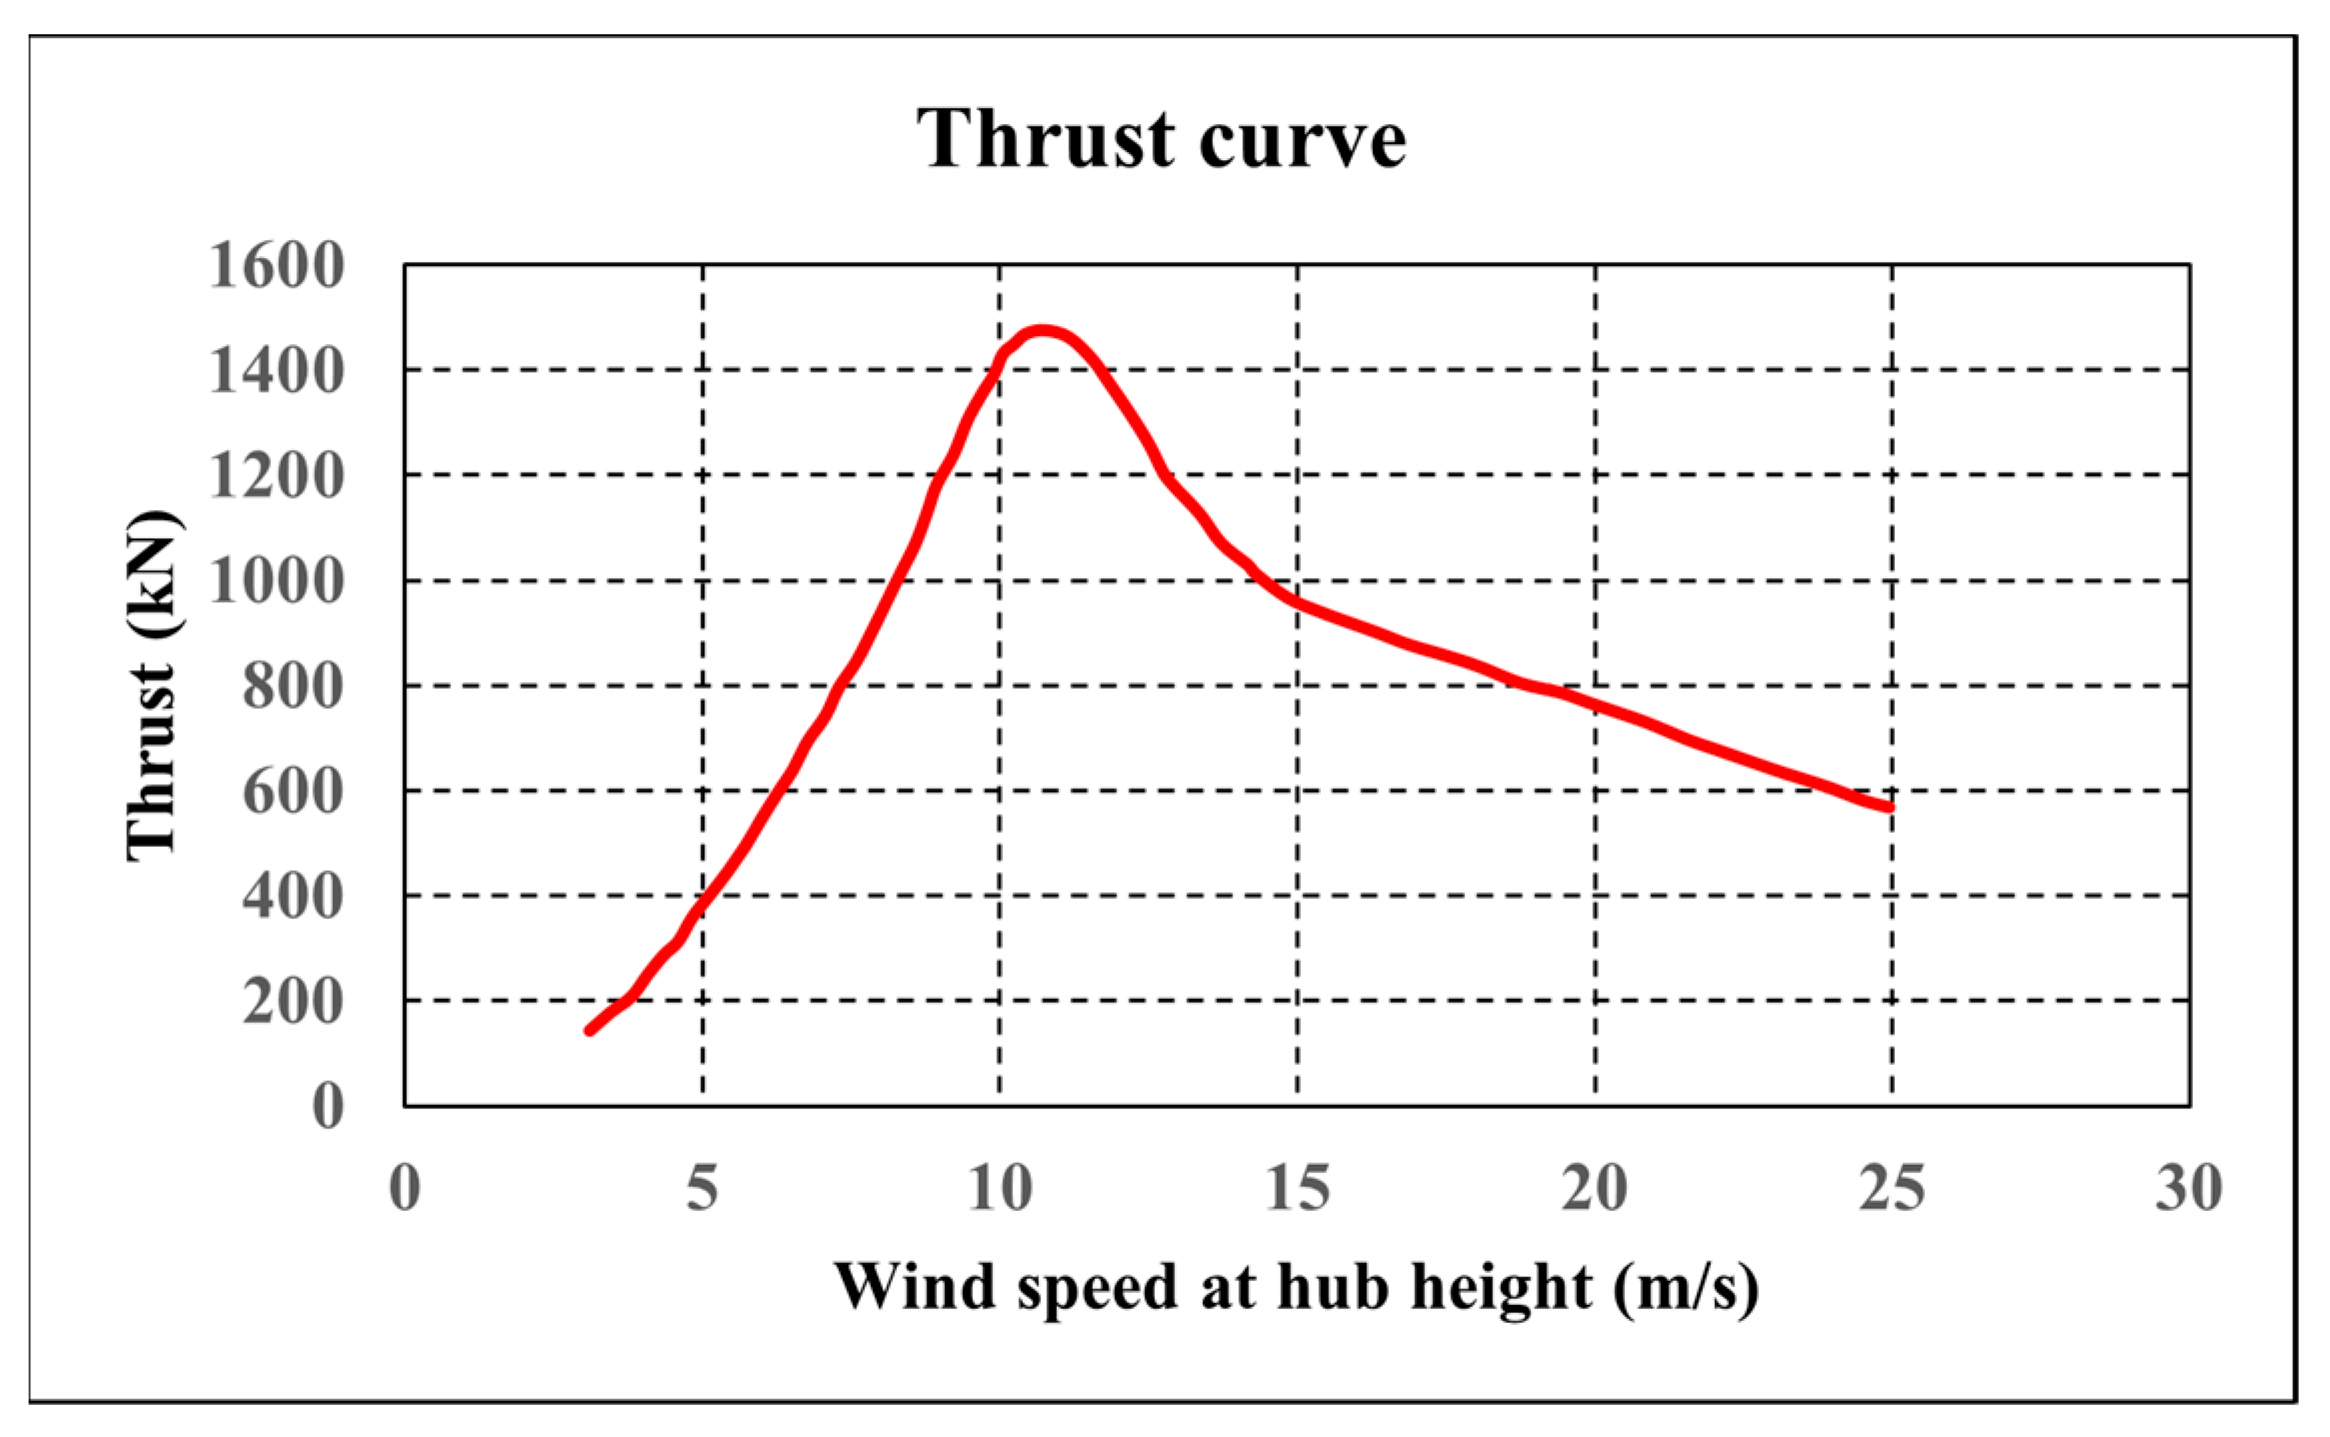
Thrust curve of the 9.5 MW VESTAS wind turbine.
Figure 9.
Thrust curve of the 9.5 MW VESTAS wind turbine.
Figure 10.
Main dimensions of the cylindrical wind tower.
Figure 10.
Main dimensions of the cylindrical wind tower.
Figure 11.
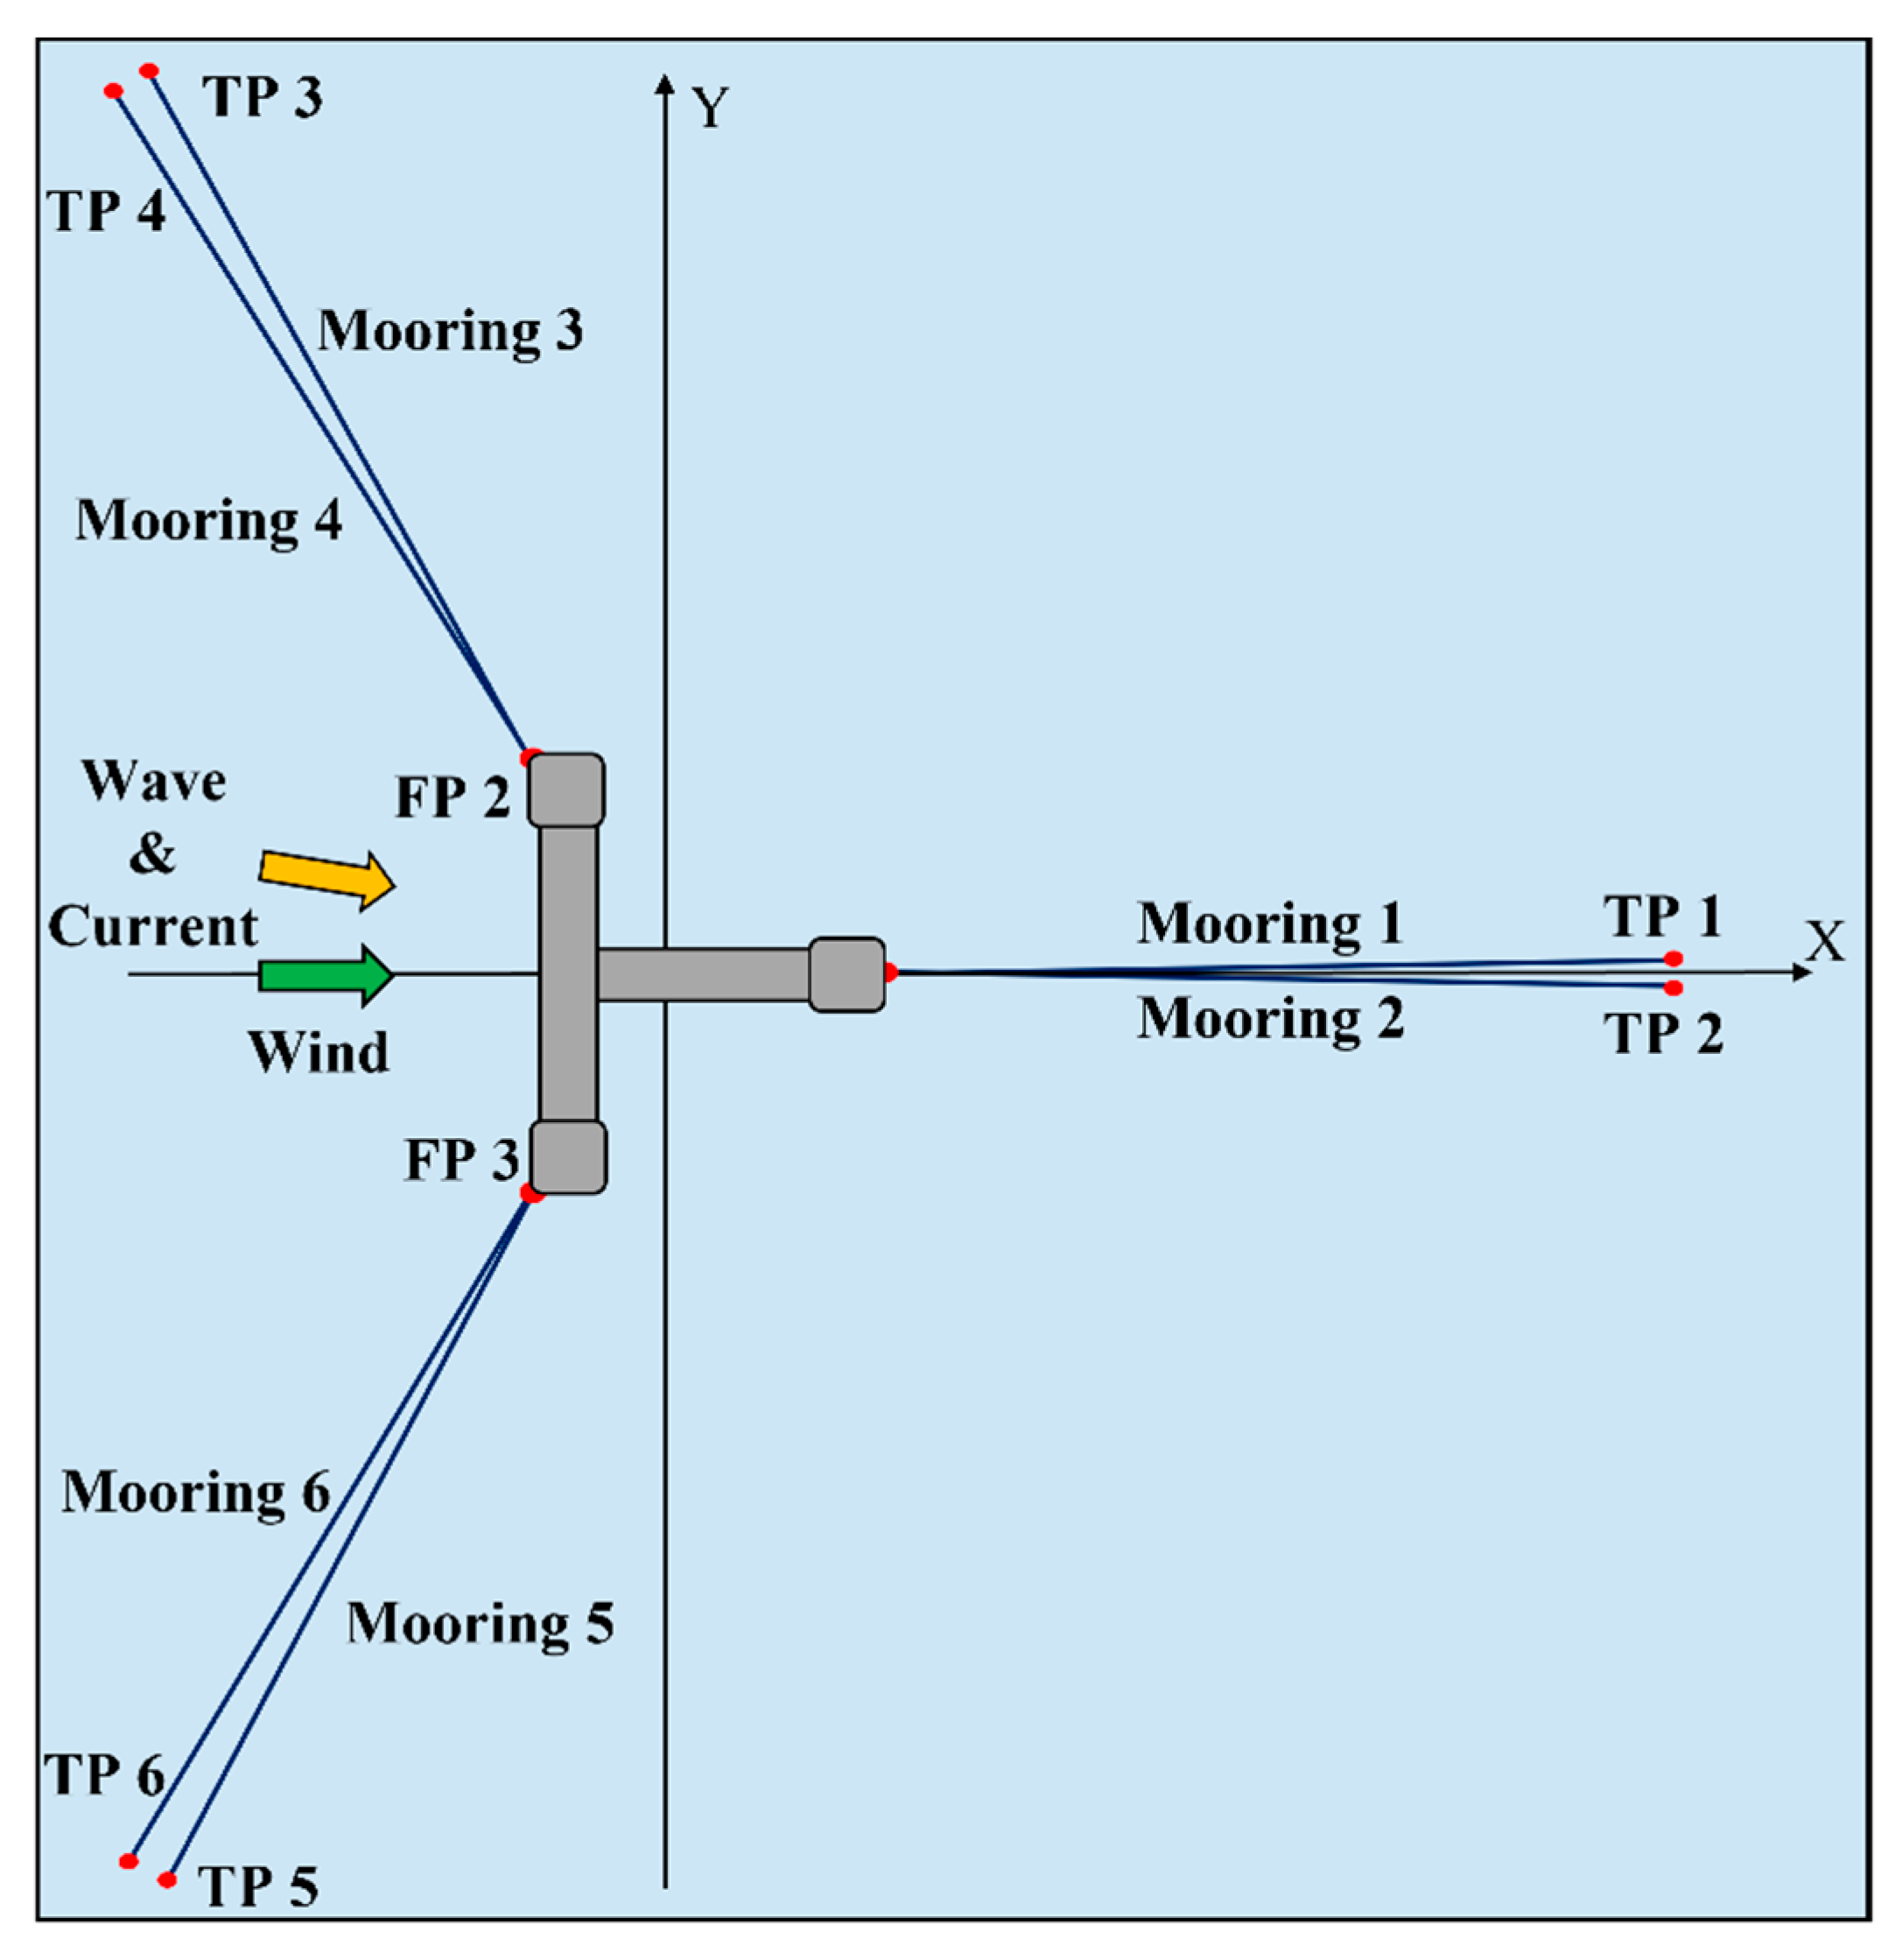
The floater with the mooring system. FP, fairlead points; TP, touchdown points (Yellow arrow means wave & current direction, Green arrow means wind direction).
Figure 11.
The floater with the mooring system. FP, fairlead points; TP, touchdown points (Yellow arrow means wave & current direction, Green arrow means wind direction).
Figure 12.
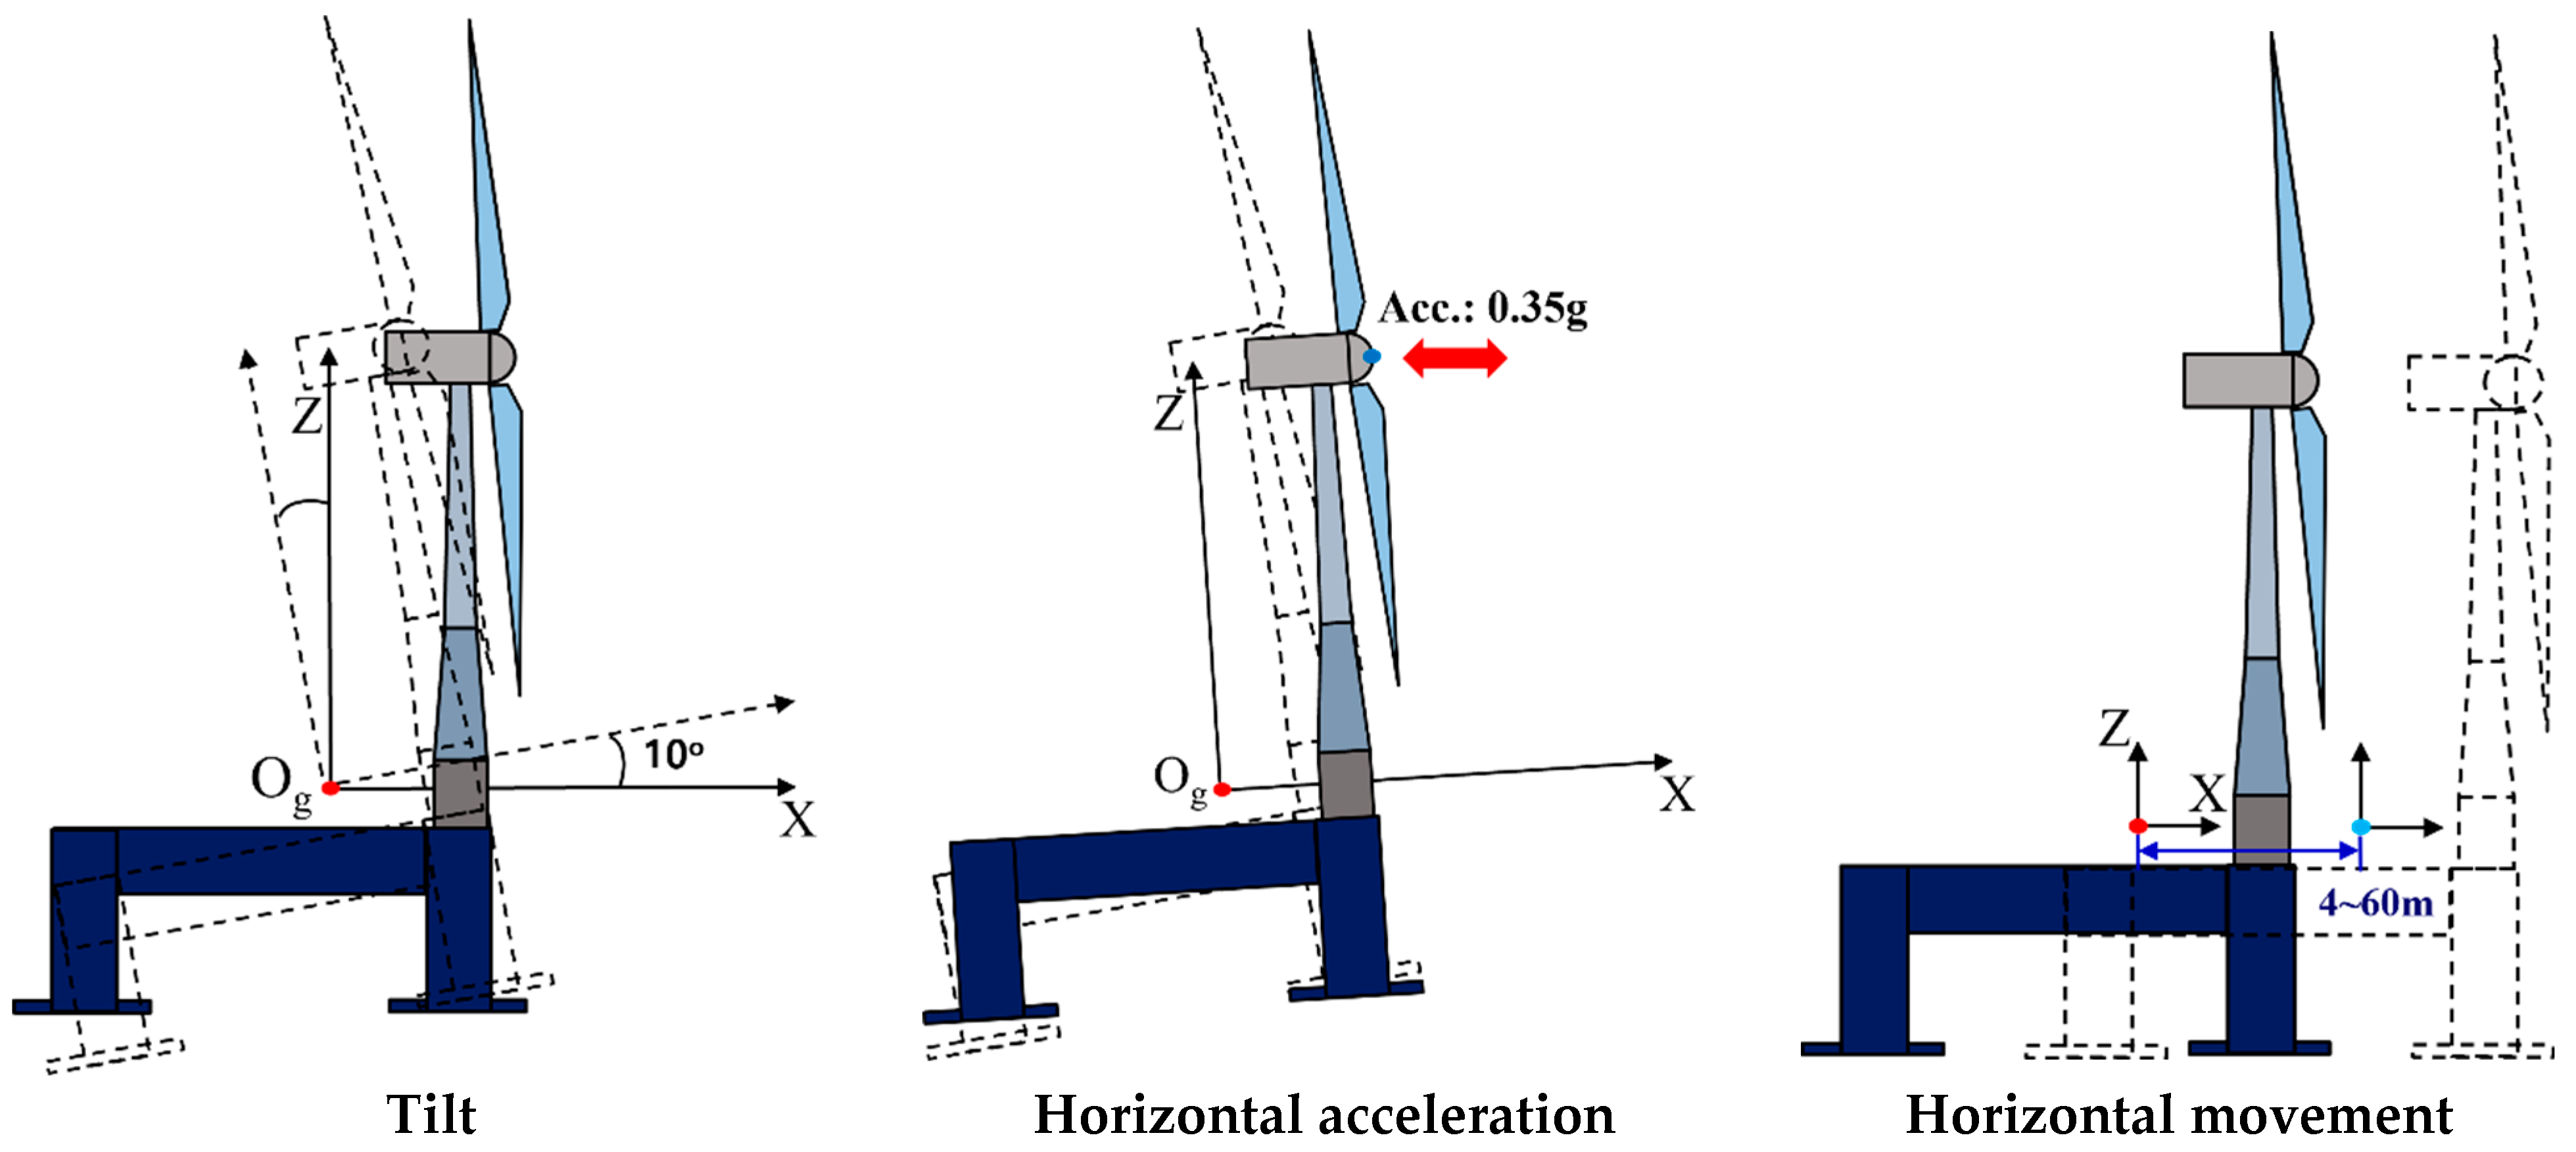
Criteria for floating substructures [
27].
Figure 12.
Criteria for floating substructures [
27].
Figure 13.
Comparison of movement in the x direction of a Tri-Star floater at different mooring positions (Case 2-1; blue, 840 m; gray, 850 m).
Figure 13.
Comparison of movement in the x direction of a Tri-Star floater at different mooring positions (Case 2-1; blue, 840 m; gray, 850 m).
Figure 14.
Comparison of the pitch angle of the Tri-Star floater at different mooring positions (Case 2-1).
Figure 14.
Comparison of the pitch angle of the Tri-Star floater at different mooring positions (Case 2-1).
Figure 15.
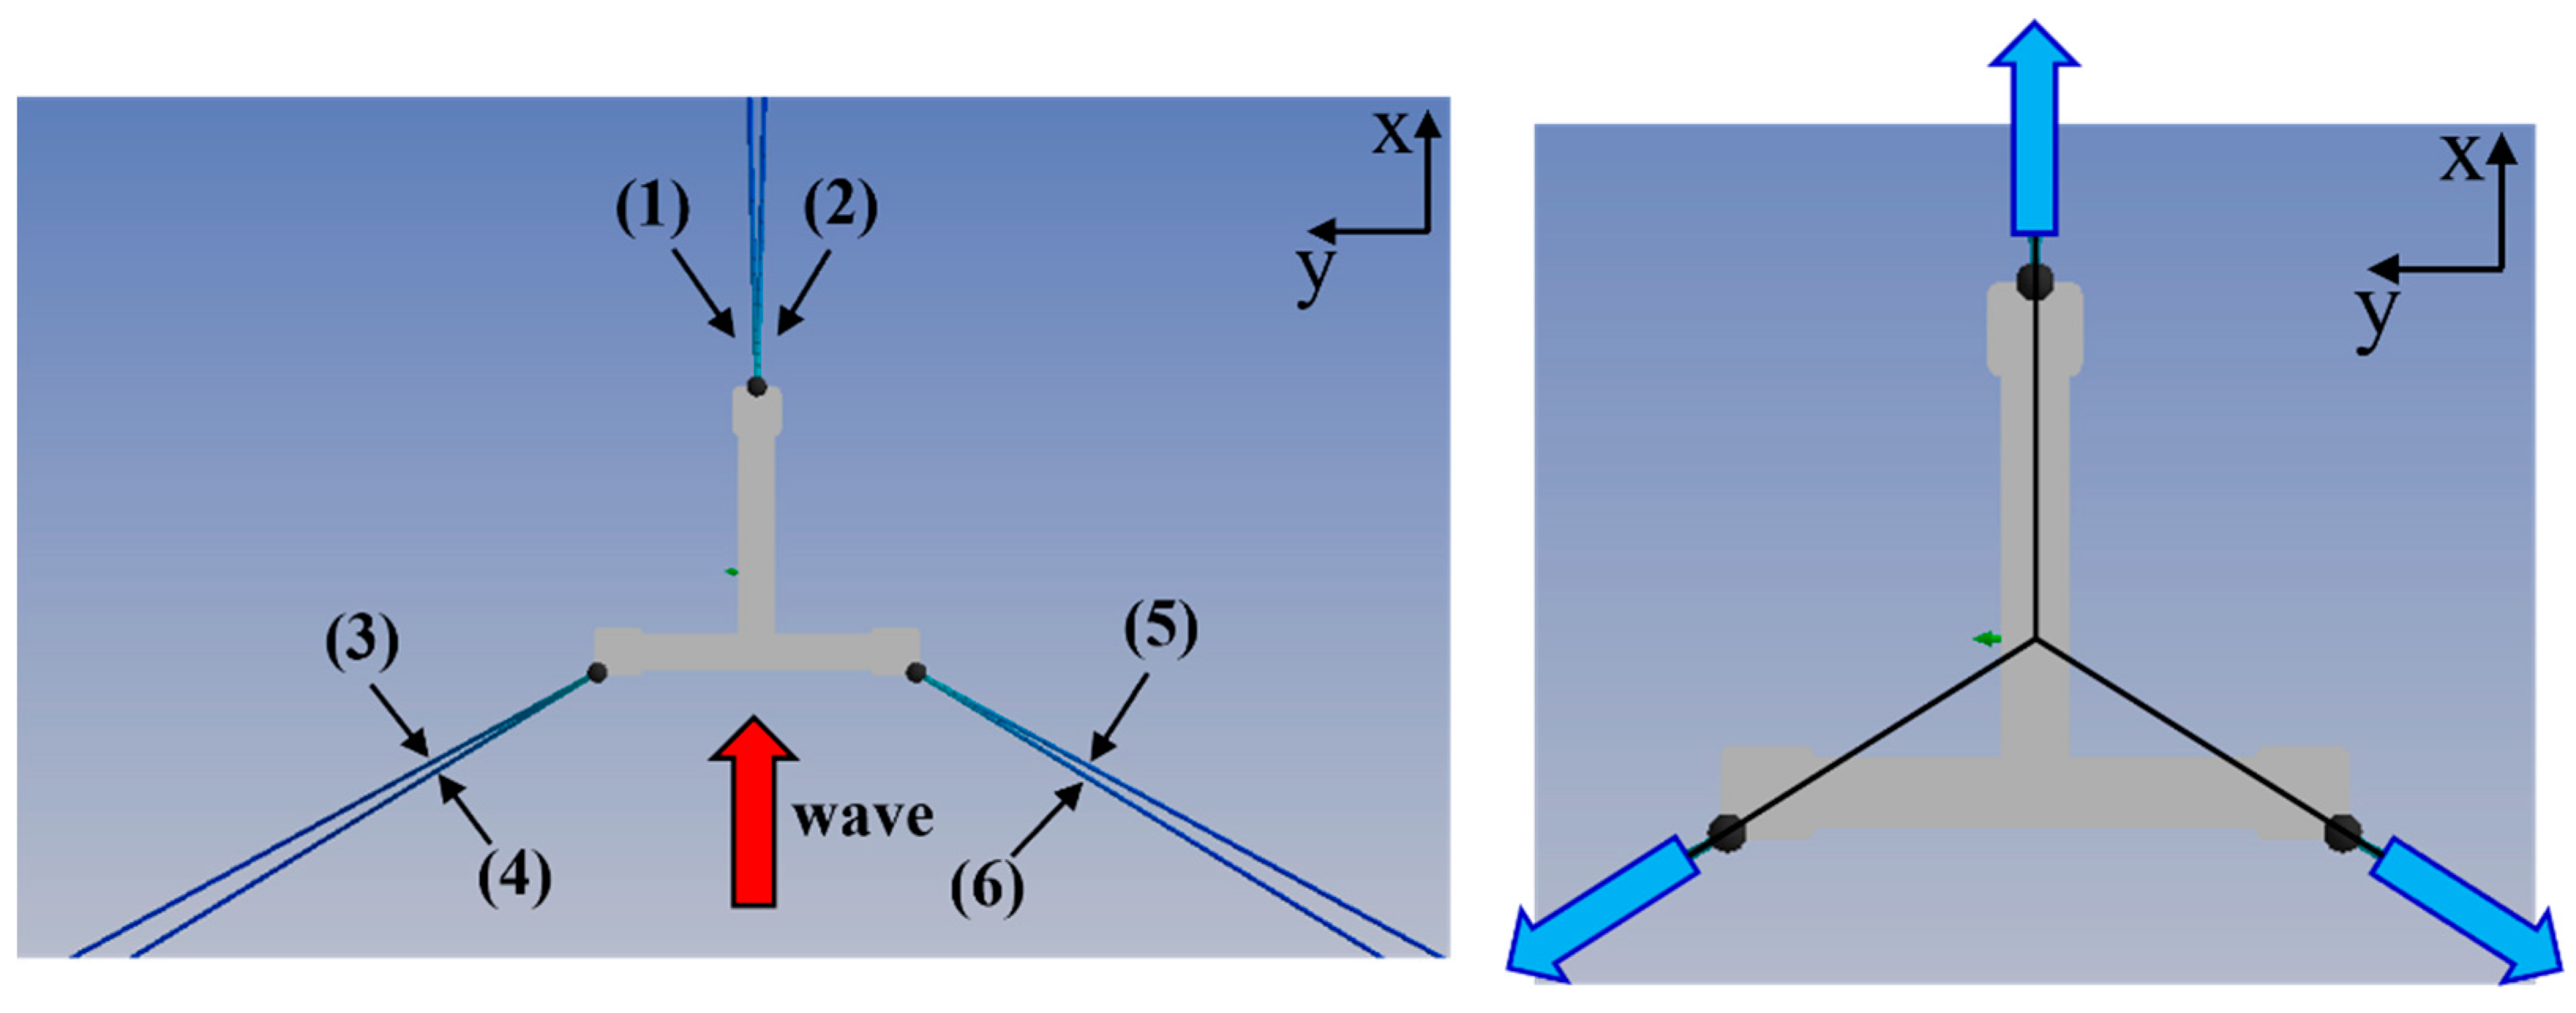
The number of mooring lines and the direction of mooring tension (Blue arrow).
Figure 15.
The number of mooring lines and the direction of mooring tension (Blue arrow).
Figure 16.
Comparison of mooring tension (Lines 1 and 3) at different mooring positions (Case 2-1; blue, 840 m; gray, 850 m; Yellow arrows mean direction of tension, Green arrow means direction of environmental loads).
Figure 16.
Comparison of mooring tension (Lines 1 and 3) at different mooring positions (Case 2-1; blue, 840 m; gray, 850 m; Yellow arrows mean direction of tension, Green arrow means direction of environmental loads).
Figure 17.
Comparison of movement in the x directional of a Tri-Star floater at different mooring positions (Case 6-1; blue, 840 m; gray, 850 m).
Figure 17.
Comparison of movement in the x directional of a Tri-Star floater at different mooring positions (Case 6-1; blue, 840 m; gray, 850 m).
Figure 18.
Comparison of the pitch angle of a Tri-Star floater at different mooring positions (Case 6-1).
Figure 18.
Comparison of the pitch angle of a Tri-Star floater at different mooring positions (Case 6-1).
Figure 19.
Comparison of mooring tension (Lines 1 and 3) at different mooring positions (Case 6-1; blue, 840 m; gray, 850 m; Yellow arrows mean direction of tension, Green arrow means direction of environmental loads).
Figure 19.
Comparison of mooring tension (Lines 1 and 3) at different mooring positions (Case 6-1; blue, 840 m; gray, 850 m; Yellow arrows mean direction of tension, Green arrow means direction of environmental loads).
Figure 20.
Comparison of the maximum and mean value of horizontal movement at different mooring positions.
Figure 20.
Comparison of the maximum and mean value of horizontal movement at different mooring positions.
Figure 21.
Comparison of the maximum and mean value of pitch angle at different mooring positions.
Figure 21.
Comparison of the maximum and mean value of pitch angle at different mooring positions.
Figure 22.
Comparison of the maximum and mean value of mooring tension for Line 1 at different mooring positions.
Figure 22.
Comparison of the maximum and mean value of mooring tension for Line 1 at different mooring positions.
Figure 23.
Comparison of the maximum and mean value of mooring tension for Line 3 at different mooring positions.
Figure 23.
Comparison of the maximum and mean value of mooring tension for Line 3 at different mooring positions.
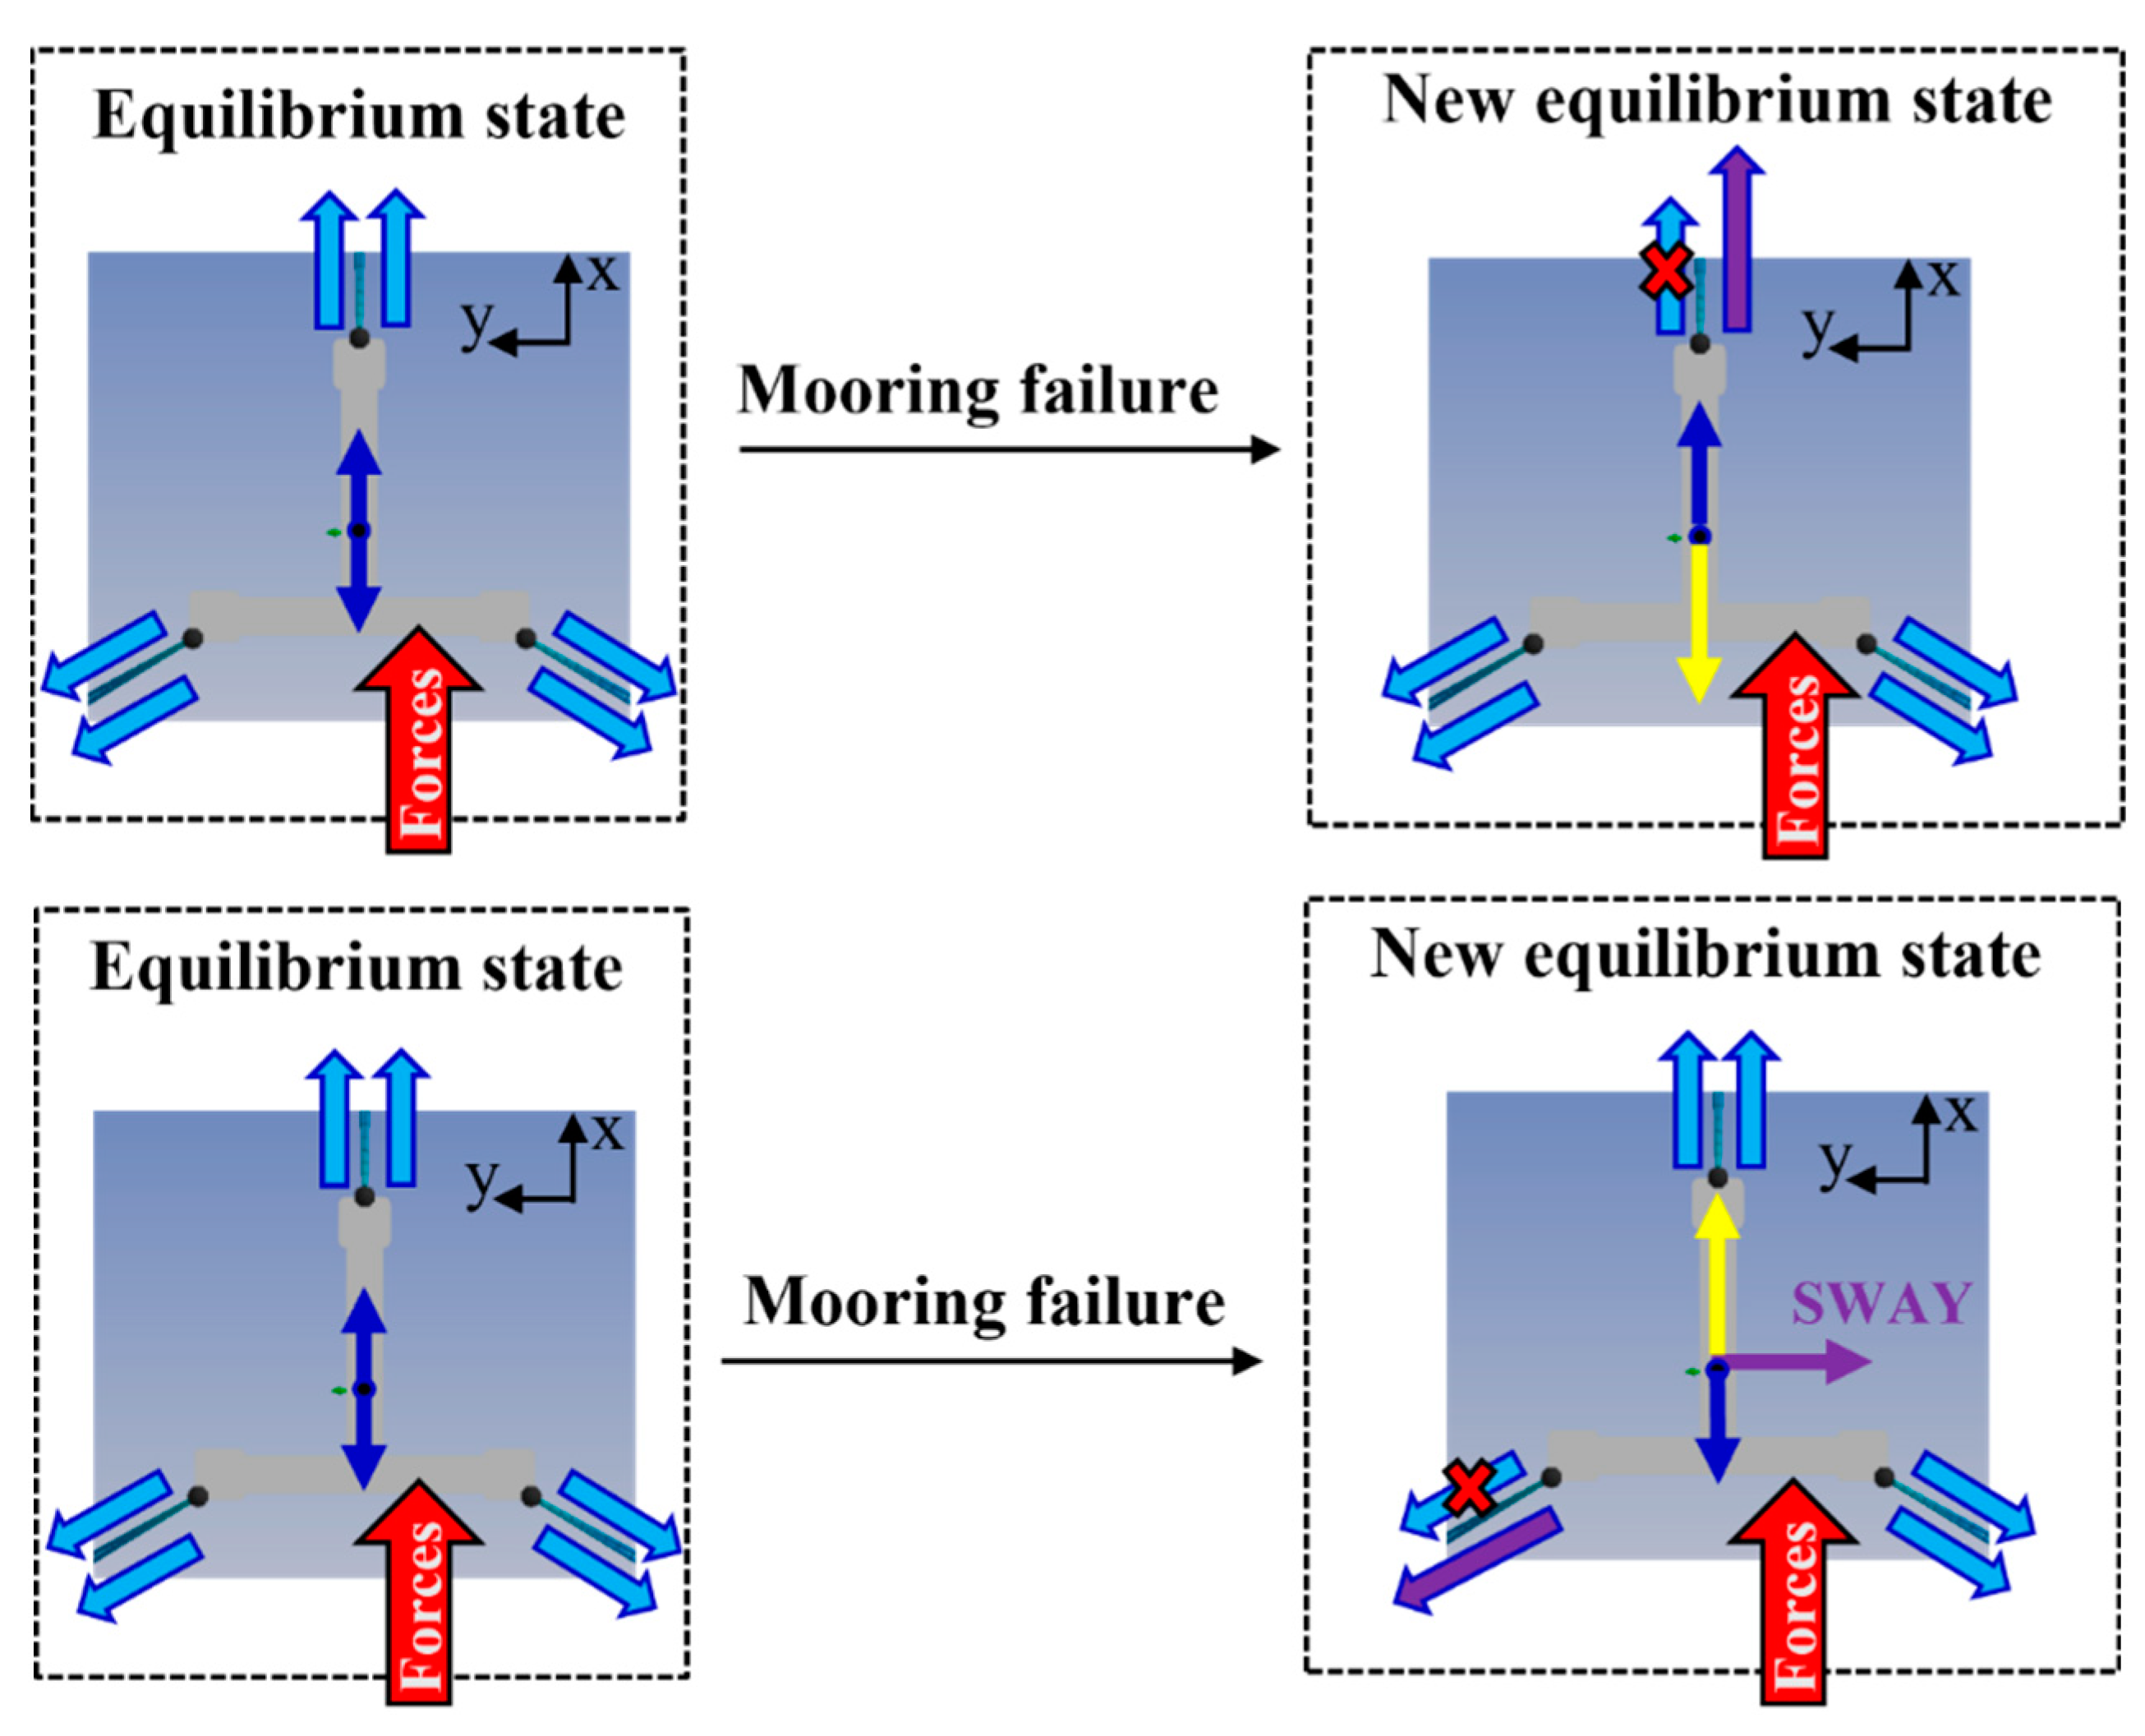
Figure 24.
Movement of the equilibrium state due to failure of the mooring.
Figure 24.
Movement of the equilibrium state due to failure of the mooring.
Figure 25.
Change in the horizontal movement for the failure of Mooring Line 1 (Case 6-1; blue, 840 m; gray, 850 m).
Figure 25.
Change in the horizontal movement for the failure of Mooring Line 1 (Case 6-1; blue, 840 m; gray, 850 m).
Figure 26.
Change in the pitch angle for the failure of Mooring Line 1 (Case 6-1).
Figure 26.
Change in the pitch angle for the failure of Mooring Line 1 (Case 6-1).
Figure 27.
Change in the sway motion for the failure of Mooring Line 1 (Case 6-1; blue, 840 m; gray, 830 m).
Figure 27.
Change in the sway motion for the failure of Mooring Line 1 (Case 6-1; blue, 840 m; gray, 830 m).
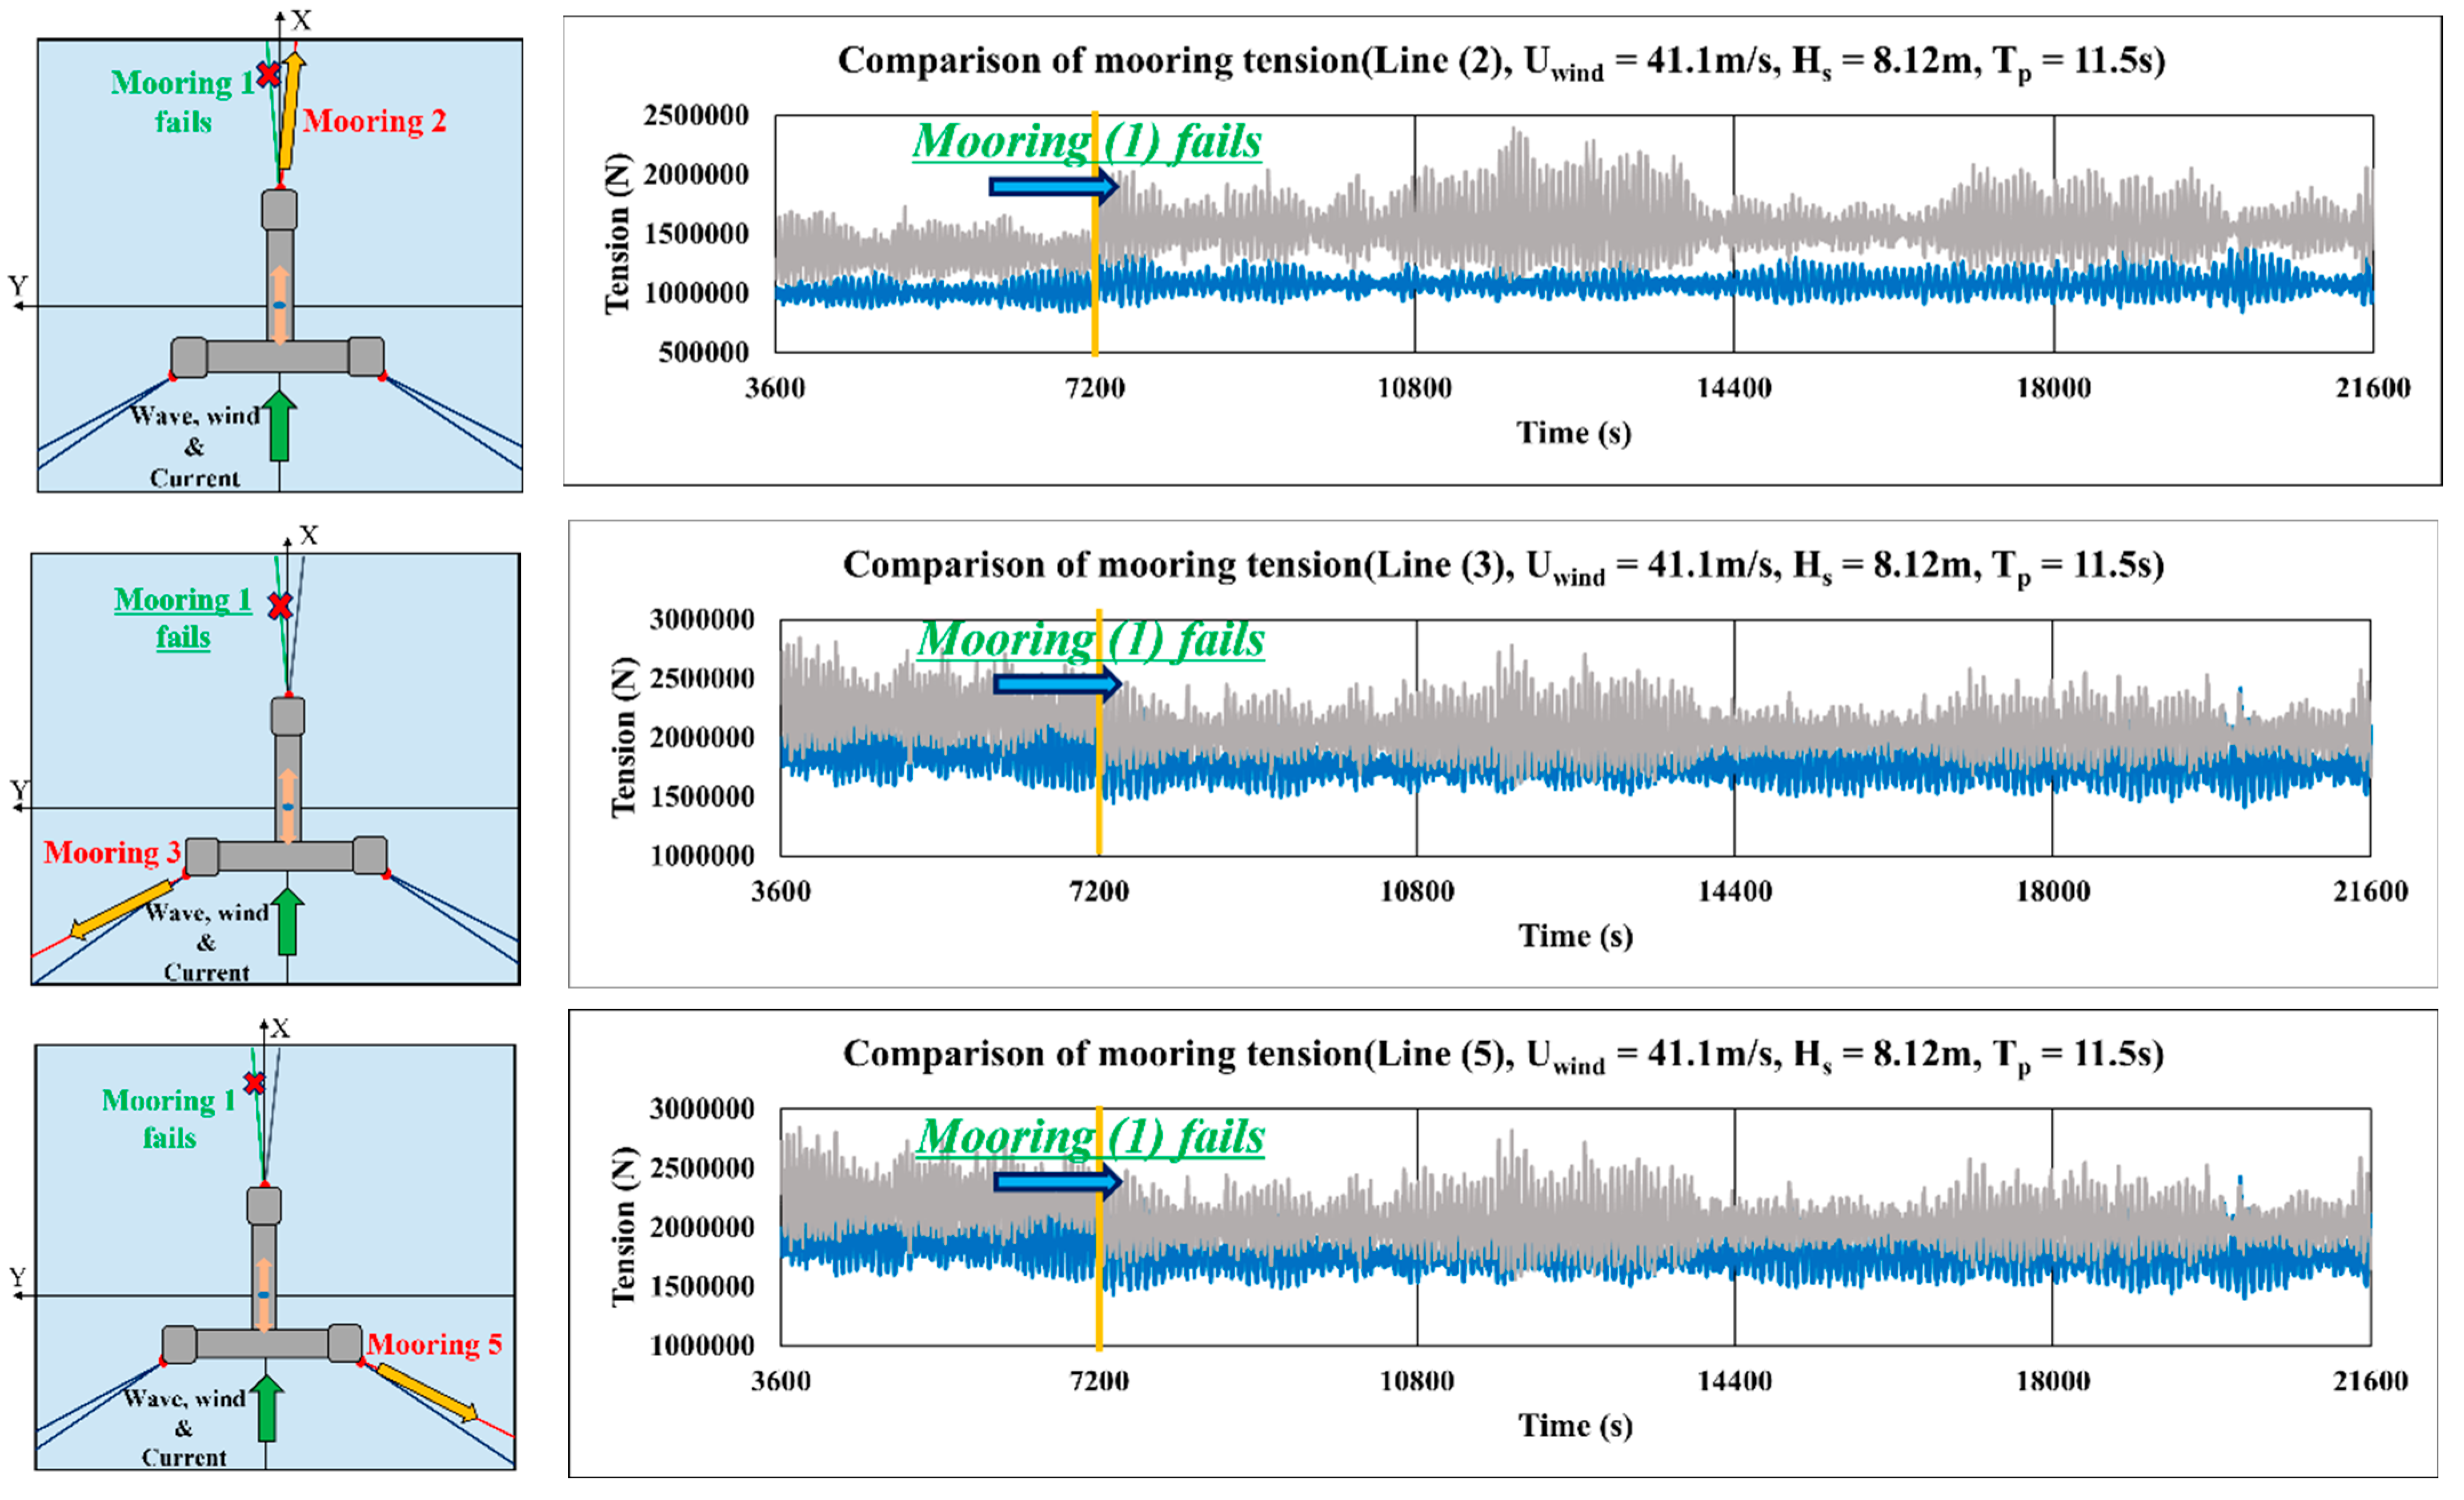
Figure 28.
Change in the mooring tension of Lines 2, 3, and 5 for the failure of Mooring Line 1 (Case 6-1; blue, 840 m; gray, 850 m; Yellow arrows mean direction of tension, Green arrow means direction of environmental loads).
Figure 28.
Change in the mooring tension of Lines 2, 3, and 5 for the failure of Mooring Line 1 (Case 6-1; blue, 840 m; gray, 850 m; Yellow arrows mean direction of tension, Green arrow means direction of environmental loads).
Figure 29.
Change in horizontal movement for the failure of Mooring Line 3 (Case 6-1; blue, 840 m; gray, 850 m).
Figure 29.
Change in horizontal movement for the failure of Mooring Line 3 (Case 6-1; blue, 840 m; gray, 850 m).
Figure 30.
Change in the pitch angle for the failure of Mooring Line 3 (Case 6-1).
Figure 30.
Change in the pitch angle for the failure of Mooring Line 3 (Case 6-1).
Figure 31.
Change in the sway motion for the failure of Mooring Line 3 (Case 6-1; blue, 840 m; gray, 850 m).
Figure 31.
Change in the sway motion for the failure of Mooring Line 3 (Case 6-1; blue, 840 m; gray, 850 m).
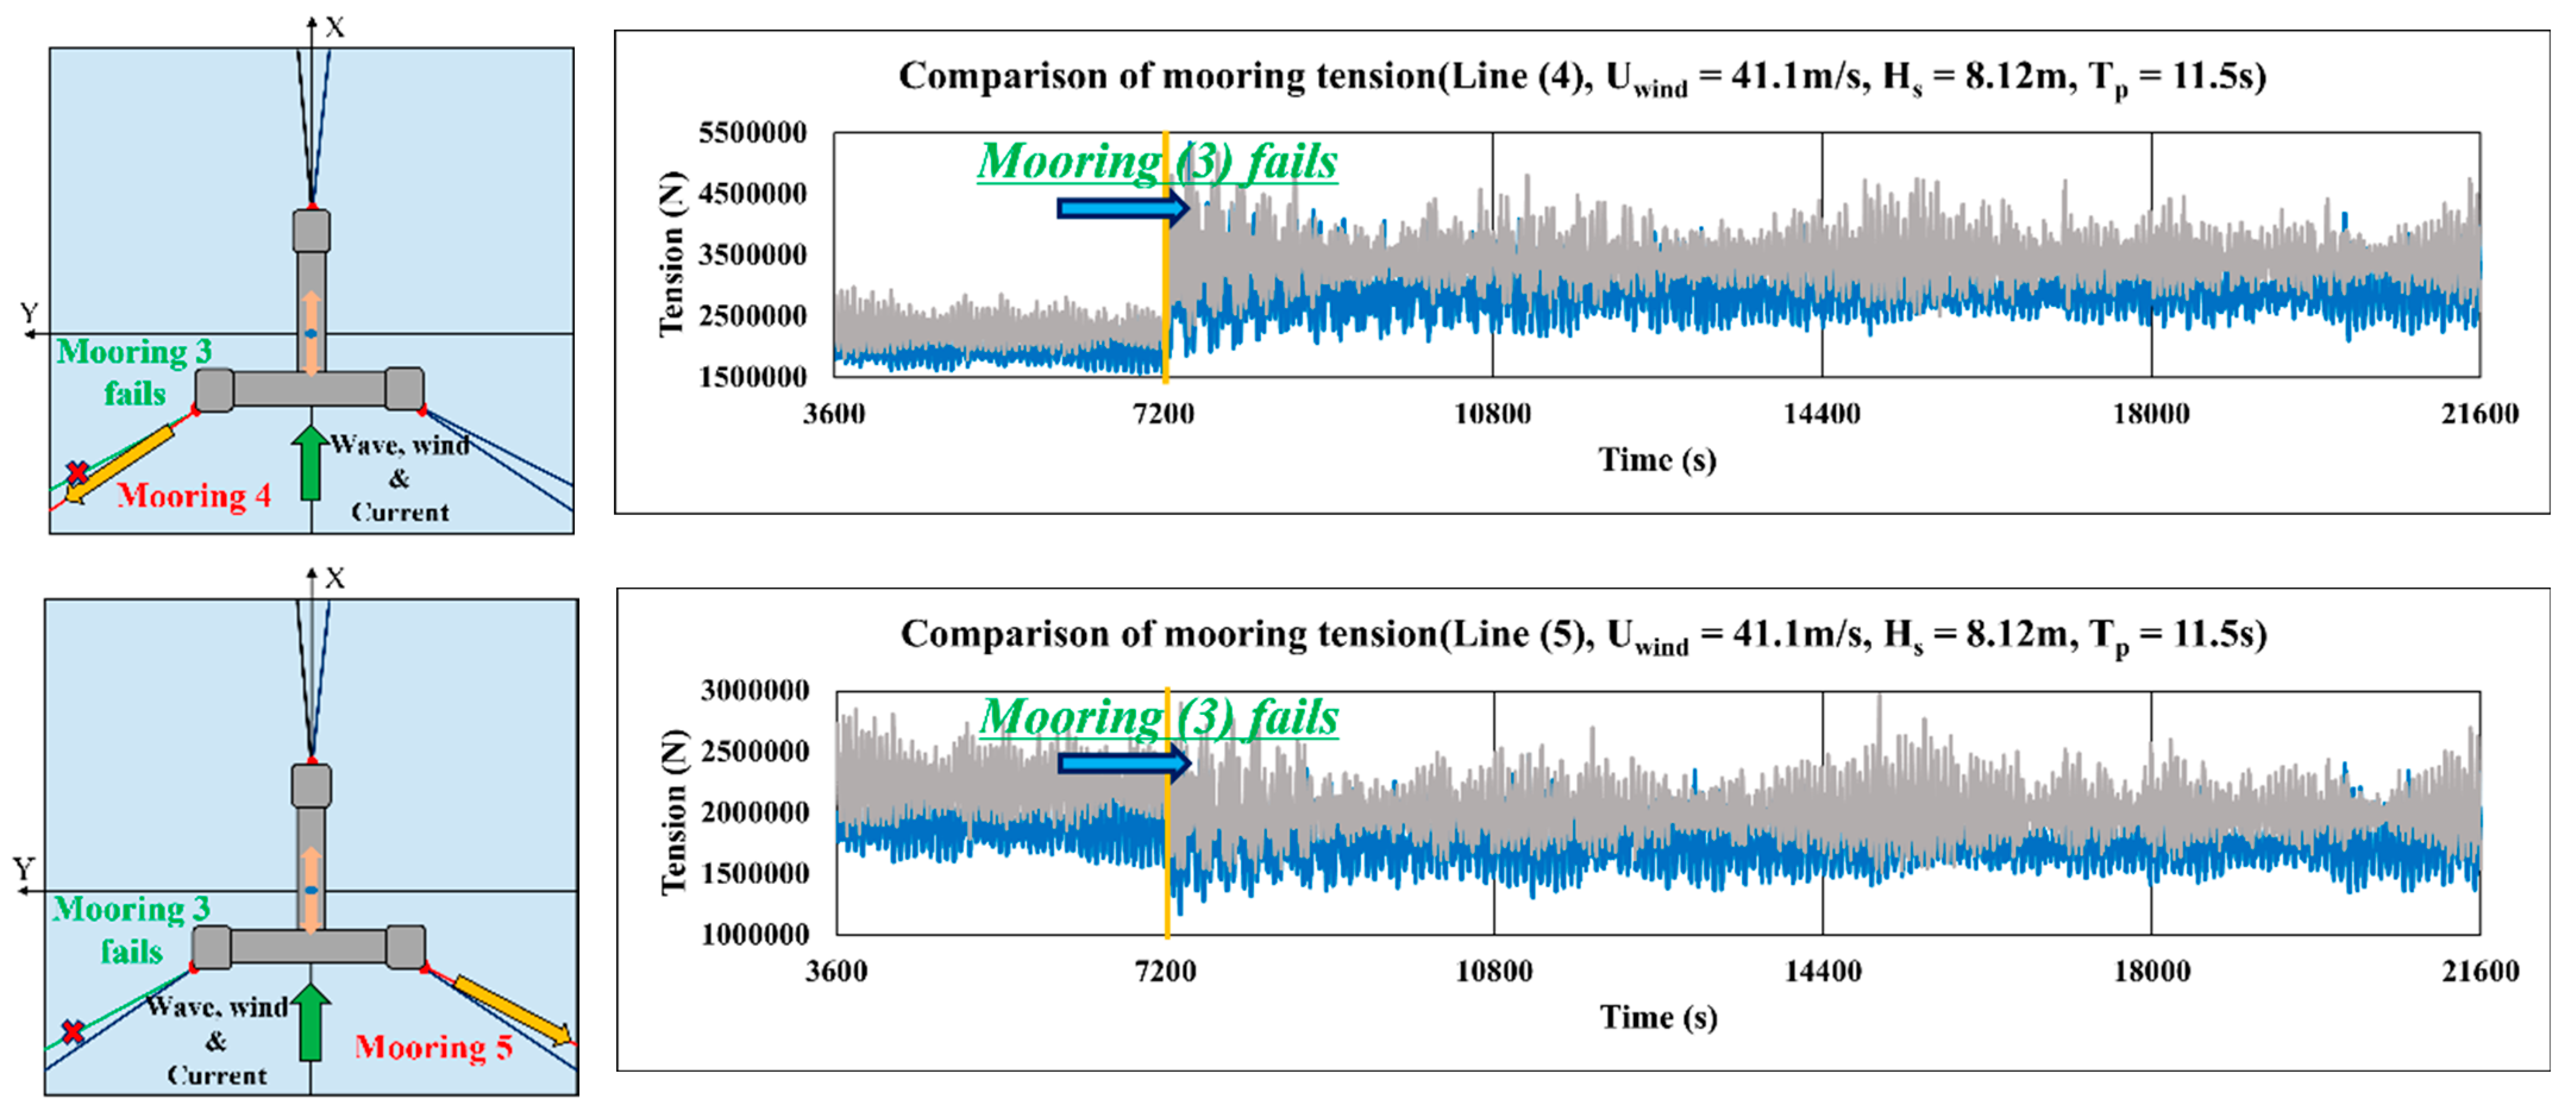
Figure 32.
Change in the mooring tension of Lines 2, 4, and 5 for the failure of Mooring Line 3 (Case 6-1; blue, 840 m; gray, 850 m; Yellow arrows mean direction of tension, Green arrow means direction of environmental loads).
Figure 32.
Change in the mooring tension of Lines 2, 4, and 5 for the failure of Mooring Line 3 (Case 6-1; blue, 840 m; gray, 850 m; Yellow arrows mean direction of tension, Green arrow means direction of environmental loads).
Figure 33.
Root mean square of mooring tension at each horizontal mooring length in Case 6.1. Left: 840 m; right: 850 m.
Figure 33.
Root mean square of mooring tension at each horizontal mooring length in Case 6.1. Left: 840 m; right: 850 m.
Table 1.
Significant wave heights and peak periods of 1-year and 50-year return periods.
Table 1.
Significant wave heights and peak periods of 1-year and 50-year return periods.
| Return Period | Hs (Significant Wave Height, m) | Tp (Peak Period, s) |
|---|
| 1 year | 5.89 | 10.06 ± 1.5 |
| 50 years | 8.14 | 11.50 ± 1.5 |
Table 2.
Speed of the current for 1-year and 50-year return periods at z = 0 and −60 m (Choi and Kim, 2021).
Table 2.
Speed of the current for 1-year and 50-year return periods at z = 0 and −60 m (Choi and Kim, 2021).
| Return Period | Vc (m/s) at 0 m | Vc (m/s) at −60 m |
|---|
| 1 year | 1.16 | 0.53 |
| 50 years | 1.69 | 0.62 |
Table 3.
Wind speed at each height.
Table 3.
Wind speed at each height.
| Height (m) | 1 Year (m/s) | 50 Years (m/s) |
|---|
| 10 | 23.67 | 31.92 |
| 20 | 25.33 | 34.41 |
| 50 | 27.52 | 37.69 |
| 100 | 29.19 | 40.17 |
| 128 | 29.78 | 41.06 |
Table 4.
Principal dimensions of the wind turbine.
Table 4.
Principal dimensions of the wind turbine.
| Parameter | Unit | Value |
|---|
| Output power | Megawatt | 9.5 |
| Rotor diameter | m | 174.0 |
| Hub diameter | m | 4.0 |
| Height of the hub from the bottom of tower | m | 112.0 |
| Nacelle mass | Megaton | 295.0 |
| Hub mass | Megaton | 80.0 |
| Blade mass | Megaton | 105.0 |
| Tower mass | Megaton | 622.0 |
| Rated wind speed | m/s | 12.0 |
| Rated rotor speed | rpm | 9.9 |
Table 5.
Dimensions of the Tri-Star floater.
Table 5.
Dimensions of the Tri-Star floater.
| Variable | Value |
|---|
| LOA (length overall) at draft level (m) | 70.9 |
| Breadth (m) | 80 |
| Column | Width (m) | 12.0 |
| Height (m) | 35.0 |
| Corner radius (m) | 1.5 |
| Column-to-column distance (m) | 68.0 |
| Heave plate breadth (m) | 25.0 |
| Top pontoon | Max. length (m) | 56.0 |
| Breadth (m) | 10.0 |
| Height (m) | 6.0 |
| Displacement (megaton) | 7863.3 |
| Draft (m) | 18.0 |
| Total KG (bottom to CoG) (m) | 27.26 |
Table 6.
Principal dimensions of the R3 studless chain mooring.
Table 6.
Principal dimensions of the R3 studless chain mooring.
| Parameter | Unit | Value |
|---|
| Type | - | R3 studless |
| Length | m | 900 |
| Diameter | mm | 153 |
| Corrosion allowance | mm | 8 |
| MBL(uncorroded) | kN | 16,579 |
| MBL(incl. corrosion) | kN | 14,483 |
| Mass per unit of length | kg/m | 465 |
| Submerged weight | kg/m | 407 |
| Elastic modulus | kN/m2 | 5.44 × 10⁷ |
Table 7.
Coordinates of the fairlead points.
Table 7.
Coordinates of the fairlead points.
| Points | Coordinates (X, Y, Z) |
|---|
| Fairlead point (FP) 1 | (45.4, 0.0, 6.0) |
| Fairlead point (FP) 2 | (−24.7, 39.1, 6.0) |
| Fairlead point (FP) 3 | (−24.7, −39.1, 6.0) |
Table 8.
Coordinates of the touchdown points.
Table 8.
Coordinates of the touchdown points.
| Points | Coordinates (X, Y, Z) |
|---|
| Horizontal Length: 840 m | Horizontal Length: 850 m |
|---|
| Touchdown point (TP) 1 | (885.1, 22.0, −150.0) | (895.1, 22.3, −150.0) |
| Touchdown point (TP) 2 | (885.1, −22.0, −150.0) | (895.1, −22.3, −150.0) |
| Touchdown point (TP) 3 | (−425.6, 777.3, −150.0) | (−430.3, 786.1, −150.0) |
| Touchdown point (TP) 4 | (−463.6, 755.3, −150.0) | (−468.9, 763.9, −150.0) |
| Touchdown point (TP) 5 | (−425.6, −777.3, −150.0) | (−430.3, −786.1, −150.0) |
| Touchdown point (TP) 6 | (−463.6, −755.3, −150.0) | (−468.9, −763.9, −150.0) |
Table 9.
Design load cases (DLCs).
Table 9.
Design load cases (DLCs).
| Cases | DLCs | Wind Speed (m/s) | Hs (m) | Tp (s) | Waves and Current—Wind Misalignment |
|---|
| 1-1 | 1.6 | 9.6 | 4.97 | 8.04 | 0 |
| 1-2 | 9.59 | 0 |
| 1-3 | 11.14 | 0 |
| 2-1 | 11.0 | 5.12 | 8.16 | 0 |
| 2-2 | 9.74 | 0 |
| 2-3 | 11.31 | 0 |
| 3-1 | 13.0 | 5.55 | 8.49 | 0 |
| 3-2 | 10.14 | 0 |
| 3-3 | 11.78 | 0 |
| 4-1 | 20.0 | 6.57 | 9.24 | 0 |
| 4-2 | 11.03 | 0 |
| 4-3 | 12.82 | 0 |
| 5-1 | 25.0 | 7.28 | 9.73 | 0 |
| 5-2 | 11.61 | 0 |
| 5-3 | 13.49 | 0 |
| 6-1 | 6.1 | 41.09 | 8.12 | 10 | 0 |
| 6-2 | 11.5 | 0 |
| 6-3 | 13 | 0 |
| 7-1 | 10 | 15 |
| 7-2 | 11.5 | 15 |
| 7-3 | 13 | 15 |
