Review

Durability and Damage Tolerance Analysis Approaches for Wind Turbine Blade Trailing Edge Life Prediction: A Technical Review

by
Patrick D. Moroney
and
Amrit Shankar Verma
*
Department of Mechanical Engineering, The University of Maine, Orono, ME 04473, USA
*
Author to whom correspondence should be addressed.
Energies 2023, 16(24), 7934; https://doi.org/10.3390/en16247934
Submission received: 28 October 2023 / Revised: 1 December 2023 / Accepted: 4 December 2023 / Published: 6 December 2023
(This article belongs to the Section A3: Wind, Wave and Tidal Energy)

Abstract

:
The size of wind turbine blades is increasing rapidly, and they are being installed in remote offshore locations. Consequently, it is essential to focus on improving the design and maintenance procedures in the blade industry to meet the growing demand. Of particular concern is the long-term operational performance of the wind turbine blade trailing edge. In this paper, we discuss the application of durability and damage tolerance analysis (DADTA) approaches to trailing edge service life prediction. DADTA is mandated in the aerospace sector to support airworthiness certification and to provide an updated life prediction of the structure based on the different stages of their service life. The DADTA framework has two main parts: durability and damage tolerance analysis. The durability part uses a structural fatigue approach based on a damage accumulation method during the initial design phase to predict the lifespan of a structure without defects. On the other hand, the damage tolerance analysis part uses a fracture mechanics approach and a damage growth method to update the lifespan prediction of a structure during the operation stages. This is achieved by utilizing sensors and inspection data as inputs while the structure is in service. Both these methods are comprehensive and have merits; however, their broad adoption in the wind turbine blade industry is still lacking. The current paper provides an extensive review of these methods and shows how these can be applied to the wind turbine blade industry, specifically for predicting the structural design life of the trailing edge of composite wind turbine blades. The review includes (a) defining wind turbine trailing edge failure modes, (b) trailing edge design procedures, and (c) a detailed discussion of the application of durability and damage tolerance analysis for trailing edge life prediction. Overall, this review paper would be of special interest to blade designers and would guide researchers and engineers interested in life prediction methodologies based on DADTA approaches for wind turbine blades.

1. Introduction

1.1. Background

The use of wind energy as a renewable resource for power generation is continuously growing. Specifically, the industry is growing rapidly in offshore locations where the wind is stronger and more consistent. This trend is driving the need for technological advancements, such as developing larger turbines with high power ratings with blade lengths exceeding hundreds of meters. While these upscaled systems provide the advantage of increased power production, they simultaneously introduce complexity in design, manufacturing, and installation. One general disadvantage associated with these larger and more complex systems is the potential for increased failures in their components, leading to decreased reliability [1,2,3]. Notably, a review of wind turbine damage reveals that blade failures account for approximately 12–19% of reported cases [4,5,6]. Consequently, focusing on improving the reliability of wind turbine blades is logical and necessary. In addition, as blade length increases, both aerodynamic and gravitational design loads also increase. Despite the growth in blade size, the wind turbine’s overall design life requirement of 20 years remains unchanged for wind turbine blades. This necessitates a more vigorous approach during design, operation and maintenance to mitigate the effects of fatigue and associated structural failures.
The International Electrotechnical Commission (IEC) requires structural design calculations to use “appropriate methods” [7] based on International Organization for Standardization (ISO) 2394 [8] or be substituted with physical testing. These methods could include a range of possibilities such as digital twins, material optimization, etc. and allow wind turbine blade manufacturers flexibility in satisfying the design requirements. However, an integrated approach that covers wind turbine blades’ design, operation, and maintenance stages that allow continuous updates to their life prediction while improving their reliability is lacking. Considering this, the durability and damage tolerance analysis (DADTA) approach, which is mandated in the aerospace sector, could be a great candidate methodology that can be applied to wind turbine blades that enable updated life prediction based on the different stages of their service life. The DADTA framework has two main parts: durability and damage tolerance analysis. The durability part uses a structural fatigue approach based on a damage accumulation method during the initial design phase to predict the lifespan of a structure without defects. On the other hand, the damage tolerance analysis part uses a fracture mechanics approach and a damage growth method to update the lifespan prediction of a structure during the operation stages. This is achieved by utilizing sensors and inspection data as inputs while the structure is in service. The use of DADTA has allowed the US Air Force A-10 aircraft [9] to exceed its original design life of 25 years demonstrating the opportunity to not only attain the system design life but offer the potential to improve reliability and extend the useful life of wind turbine blades. Given that aerospace structures and wind turbine blades have distinct sets of design processes, maintenance cycles, and logistic requirements, the current paper provides an extensive review of methods used as a part of DADTA and discusses how these methods can be applied to the wind turbine blade industry. The paper specifically focuses on applying these methods to predict the structural design life of the trailing edge of composite wind turbine blades, which have been found to be one of the critical areas of interest due to their high failure rates. The following subsection defines the scope of the review paper and elaborates on the concepts embodied in DADTA.

1.2. Scope of the Review Paper

For many years, the United States civil [10] and military aerospace communities [11,12] have relied on DADTA as part of the aircraft structural requirements. This dates back to the 1950s [13], and while most of the analysis experience is with metallic structures, great progress has been made with composite structures [14]. For instance, the US Air Force A-10 aircraft is a case study [9,15] that illustrates the effectiveness of DADTA in life prediction updates during different stages of service life. During the initial design phase, the durability analysis predicted that the wing structure of the aircraft would not meet the required service life. As a result, certain design changes were made in order to comply with the requirements. However, after 15 years of service, an updated damage tolerance analysis revealed that cracks on the wing structure were imminent. The predicted cracks started to appear, causing a reduction in the aircraft’s remaining useful life. Therefore, a service life extension effort was initiated to improve the critical components of the structure. An updated DADTA life prediction was conducted which extended the airframe’s service life to 2028, which is 50 years after it first entered service. Lin’s [16] technical review identifies examples of various civilian and military aircraft (e.g., 737, KC-135) structural issues related to DADTA.
There are distinct differences in terms of design requirements for wind turbine blades compared to aircraft structures. For durability analysis of a wind turbine blade, the key methodology is fatigue analysis against deterministic (e.g., gravitational) and stochastic (aerodynamic) loading, whereas on the other hand, damage tolerance analysis deals with allowable damage growth considering failures due to several reasons such as bondline cracks, blade erosion, lightning strikes, etc., among others. A key distinction between durability and damage tolerance approaches lies in their consideration of initial rogue flaws. Specifically, durability analysis assumes the absence of initial flaws, while damage tolerance includes them in its analysis. Both these approaches can be utilized in design life prediction, though they employ different methods and are applied at different stages of the asset service life. The durability analysis generally uses a damage accumulation method and can be applied during the design process, while damage tolerance analysis typically employs either a fracture mechanics or reliability-based method and can be applied after the asset has been manufactured as well as after they are put into service. It is to be noted that the portions of the DADTA have been included in the wind turbine standards and certification requirements. The IEC includes durability analysis as part of the wind turbine fatigue design requirements but does not address damage tolerance analysis [7]. On the other hand, the Det Norske Veritas (DNV) rotor blades design requirements from 2015 require durability analysis using fatigue concepts and allow for an optional damage tolerance analysis using fracture mechanics concepts [17]. While not mandated, the DNV inclusion of fracture mechanics is a step forward to full application and benefits of DADTA.
This paper provides an in-depth technical review of the DADTA approach and how it can be applied to the wind turbine industry, focusing specifically on its application to predict the lifespan of the trailing edge of composite wind turbine blades. The trailing edge was chosen since it is more susceptible to operational cyclic loading than the leading edge and spar cap adhesive joints [18], and there is a corresponding research gap in the literature. The review paper includes: (a) defining failure modes for the wind turbine trailing edge; (b) discussing design methods for the trailing edges; and (c) a detailed discussion on the application of DADTA for predicting the life of the trailing edge. Figure 1 illustrates how DADTA may fit within the overall life cycle of a wind turbine blade with durability analysis applied during the design phase and, for the most benefit, damage tolerance applied during the manufacturing and operations phases. Completion of the design activities and durability analysis results in the initial life prediction. Following the first blade fabrication and inspection, a damage tolerance analysis results in an updated life prediction. Once in operation, an updated damage tolerance analysis based on existing manufacturing defects and new damage discovered during inspections results in the remaining useful life prediction.

1.3. Structure of the Review Paper and Some Useful Definitions

Figure 2 shows the overall structure of this review paper. The review starts with Section 2, describing the trailing edge failures, and continues with Section 3, discussing the key design processes for the trailing edge. Section 4 reviews all aspects of durability analysis with emphasis on the “As designed” state of the wind turbine blade. Section 5 defines the processes involved in damage tolerance analysis with emphasis on the “As Built” state and “As Operated” state of the wind turbine blade. A definition is provided below for some terms specific to DADTA that will aid understanding of the discussion.
  • Durability: Harris et al. [14] defines durability as "the ability of the structure to retain adequate properties (strength, stiffness, and environmental resistance) throughout its service life to the extent that any deterioration can be controlled and repaired, if there is a need, by economically acceptable maintenance practices. Structural durability affects the frequency and cost of inspection, replacement, repair, or other maintenance”. Another term often used in conjunction with durability is safe-life, when a fatigue analysis has demonstrated the structure can withstand all design loads during the design life [19]. The safe-life approach is the most commonly used methodology for wind turbine blade design [20].
  • “As Designed” State: The “As designed” state refers to the state of a wind turbine blade design which is achieved after the completion of the detailed design phase. The process commences with the preliminary design, followed by a durability analysis, and an initial design life prediction. Once these steps are completed, the design moves forward with detailed designing, and eventually, the design is ready for manufacturing.
  • Damage Tolerance: Padmaja et al. [21] define damage tolerance as “the ability of an aircraft structure to sustain anticipated loads (e.g., limit load) in the presence of fatigue, corrosion, or accidental damage until such damage is detected through inspections (or malfunctions) and repaired”. Two terms are often associated with the damage tolerance analysis methodology: fail-safe design and damage-tolerant design. A fail-safe design ensures a damaged structure can continue to withstand the design loads but with reduced margins of safety [19]. A damage-tolerant design extends the concept of fail-safe to encompass damage growth and residual strength analysis necessary to allow continued system operation [20]. Damage tolerance analysis can be applied during all phases of the system life cycle. During initial design, damage tolerance analysis can use assumed initial flaw sizes to support an initial life prediction. After the manufacturing phase, the damage tolerance analysis is updated to account for actual defects and flaws with a revised life prediction. During wind turbine operations, a periodic damage tolerance analysis update accounts for damage growth and identification of new damage resulting in a remaining useful life prediction.
  • “As Built” State: The term “As built” refers to the state of a wind turbine blade, which is determined by inspecting its quality assurance results and documenting any manufacturing defects according to their location, type, and size. The process begins with the manufacturing of the first wind turbine blade and continues through a damage tolerance analysis that incorporates these defects in calculations and updates the design life prediction until the blade is tested and certified.
  • “As Operated” State: The term “As operated” refers to the state of a wind turbine blade that incorporates all known manufacturing defects and any additional damage discovered during scheduled periodic maintenance or through online structural health monitoring. The process starts during wind turbine operations with periodic or online remote maintenance inspections to provide feedback and inform the damage tolerance analysis update that determines the remaining useful life prediction.

1.4. Assumption and Limitations of the Current Review

The focus of this review is specifically on wind turbine trailing edge life prediction using durability and damage tolerance analysis (DADTA). Other aspects or components of the wind turbine blade (e.g., leading edge, spar caps) can also benefit from DADTA but have not been considered in this paper. The findings and conclusions are drawn from peer-reviewed published papers, each with its own limitations and assumptions. In addition, this work summarizes the application of DADTA throughout a wind turbine blade trailing edge service life and serves as a guide to researchers and engineers interested in life prediction methodologies but does not explicitly examine every step necessary (e.g., rainflow counting) in sufficient detail such that the focus of the review can remain on the critical concepts. Wherever applicable, suitable references have been identified for additional literature. Additionally, while alternate concepts or methodologies such as reliability-based life prediction (see Section 5.1.4 and Section 5.2.6) and remote structural health monitoring (see Section 5.2.4) are mentioned, they are not discussed in detail, as other subject reviews are available in the literature.

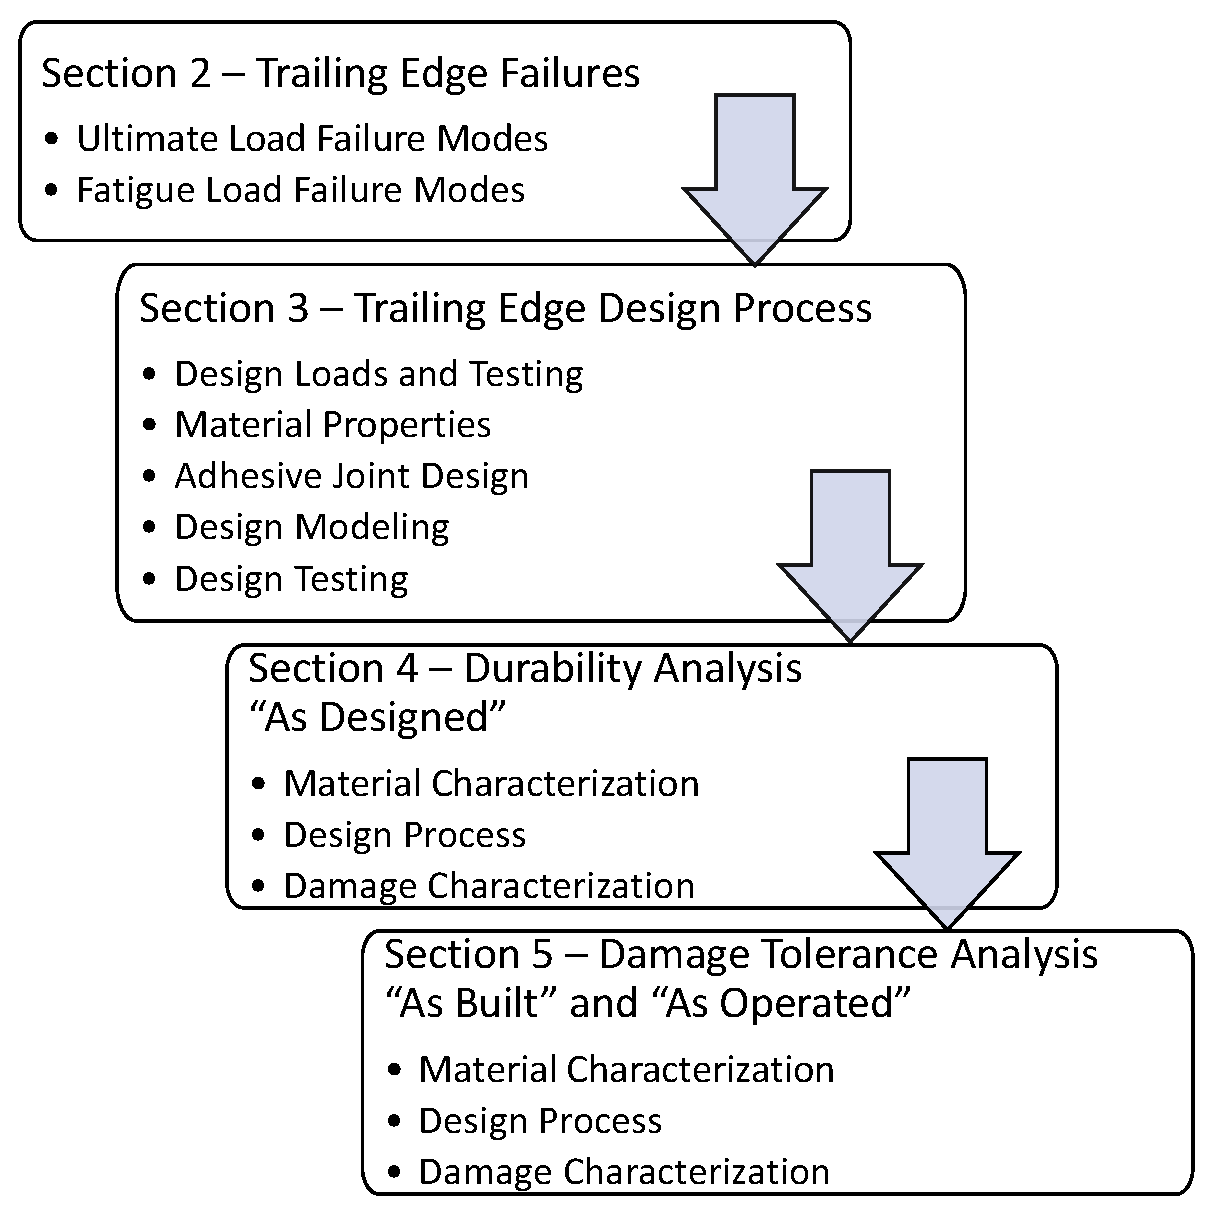
2. Problem Definition—Trailing Edge Failure

Trailing edge failures have been observed in wind turbine blades during both operational and testing phases. These failures are a result of structural overload due to either one-time extreme load or fatigue loads [22]. Both the IEC [7] and DNV [17] requirements specify a range of design loads that cover operations during normal and extreme wind profiles and required analyses for operational limit load, ultimate limit load, and fatigue load. As such, certification agencies require full-scale ultimate load and fatigue load testing to demonstrate compliance with the design requirements [23]. Generally, due to the proprietary data, blade manufacturers do not publish detailed reports of the certification tests, but some blades have been tested in the government and academic environment with published results [2,24,25,26,27].
Figure 3 shows a typical trailing edge adhesive joint. Trailing edge adhesive joint structural failures have been identified during blade testing along with the leading edge and spar cap failures [28,29]. More specifically, the failures include trailing edge adhesive joint debonding and cracking and local and global buckling (see Figure 4). Trailing edge failures have also been reported by Zhou et al. [25] as one of seven key damage areas, by Lusty and Cairns [20] as a common damage mode, and by Nielsen and Sørensen [30] as a common failure mode. Haselbach et al. [31]’s review of trailing edge damage found trailing edge failure due to both linear (e.g., linear elastic fracture) and nonlinear (e.g., local and global buckling) causes. The specific type of failure can be attributed to the loading condition, whether ultimate load or fatigue load. More specifically, Wu et al. [32] confirmed trailing edge buckling and joint debonding occur under compression due to either ultimate and fatigue-loading conditions.

2.1. Ultimate Load Failure Modes

Trailing edge failure is one of the key failure modes during ultimate load blade testing [25]. As the driving design requirement for overall blade strength, ultimate load tests are more prevalent in literature and have been conducted at full-scale, subcomponent, and coupon levels. The certification requirements [23] only dictate a full-scale single-axis bending test in the flapwise and edgewise directions, while real-world operational loading is often a combination of the two. For instance, full-scale ultimate load tests have been conducted on different length blades with the loads applied using a variety of approaches. Full-scale testing performed by Haselbach et al. [24] concluded that the trailing edge suffered a mixed-mode buckling failure that can begin at approximately 75% of the ultimate load level. Also, Haselbach et al. [2,3,31] specifically studied the full-scale multiaxial loading condition leading to the nonlinear trailing edge buckling wave and trailing edge adhesive joint failure, and confirmed the results with a numerical model. Branner et al. [34] tested a trailing edge panel subcomponent to assess the compressive strength of the trailing edge with similar buckling results. Reducing the testing scale further, Ghasemnejad et al. [35] tested coupons of wind turbine blade trailing edge composite material to failure to examine the structural response post-buckling and examined methods to arrest crack growth and improve fracture resistance.

2.2. Fatigue Load Failure Modes

Trailing edge failure is being reported on operational blades due to fatigue loads. Ataya and Ahmed [22] inspected 99 operational blades with various service lives (65–110 million cycles) and two lengths (9.5 m and 14.2 m) and found longitudinal and transverse cracks in numerous locations along the trailing edge of every blade and attributed the damage to fatigue loading. While trailing edge cracks have been found in operational systems, few full-scale trailing edge fatigue test results have been reported. Blade fatigue certification testing is generally performed using only single-axis load application, as required by the IEC [7]. To better represent operational load conditions, the IEC does allow biaxial or multiaxial fatigue testing to reduce issues associated with single-axis load application but still does not address the representation of gravitational fatigue loads during testing [18]. Zhou et al. [25] reviewed the full-scale fatigue testing of blades and reported that trailing edge cracks near the maximum chord are prevalent. Chen [36] conducted a full-scale fatigue test of a 47 m blade, and while only minor trailing edge damage was noted, the blade did suffer a degradation in stiffness. During a fatigue certification test of an 81.6 m blade, Rosemeir et al. [37] reported trailing edge transverse and longitudinal cracks initiation at both the inner and outer adhesive edges.

2.3. Other Failure Observations and Concerns

Blade fatigue testing does not adequately represent the dynamic gravitational fatigue loads observed in real operations. Rosemeier et al. [38] studied crack initiation in trailing edge bondlines and discussed the greater impact on fatigue from gravitational loads rather than aerodynamic loads. Kazacoks and Jamieson [39] discussed the need to isolate aerodynamic and gravitational loads to understand better the contribution of each to wind turbine fatigue loads. Burton et al. [18] discussed the effect of blade scaling and state the trailing edge become the critical fatigue design driver instead of the spar caps as the blade length and gravitational loads increase. As wind turbine blades increase in size to harness offshore wind resources, basic scaling laws indicate that blade mass (gravitational load) increases at a faster rate than power [40]. Typically, mass scales as a cubic function of length while power scales as a squared function, highlighting the significant impact of mass on blade length [41]. However, through blade design optimization (such as using carbon fiber instead of glass fiber), the mass scaling factor can be reduced, bringing it down from a factor of 3 to a range of 2.1–2.9 [28,42,43]. Even with this reduction, the increase in mass still outpaces the increase in power production.
From the above discussion, it is clear that the trailing edge can experience a critical failure under ultimate and fatigue loading. Therefore, the DADTA methodology can be applied for lifetime prediction. With the common trailing edge failure modes known, engineers can focus future design work to address these issues. Careful consideration must be paid to the blade trailing edge from the start of the design and throughout the blade life cycle.

3. Trailing Edge Design Process

As discussed in Figure 1, one of the first steps for DADTA is defining the initial trailing edge design considering the appropriate load cases and material characterization leading to engineering design activities such as design optimization, modeling and testing. The present work will not review all design steps in detail but will discuss key concepts shown in Figure 2 directly impacting the trailing edge design and its relevance to the DADTA approach.

3.1. Design Loads and Testing Requirements

Both the IEC and DNV provide design loads to consider for wind turbine systems. DNV specifies 4 broad wind turbine blade design loads: (1) extreme load envelopes, (2) fatigue loads, (3) serviceability limit state load envelopes, and (4) tower clearance load cases [17]. The IEC has outlined the necessary design load cases (DLCs) specified for different operational states and applied to the entire wind turbine system [7]. Each DLC requires either an ultimate load or fatigue load analysis to ensure compliance. Additionally, the analyses specify the appropriate partial safety factors for load, material, and consequence of failure. The ultimate load analysis defines the structural response in both normal and extreme wind conditions (e.g., normal turbulence model (NTM) or extreme operating gust (EOG)). The fatigue analysis uses a damage accumulation methodology such that the summation of all of the incremental damage caused by the fluctuating loads must be less than or equal to one [7]. As an example, Bak et al. [41] describes how the IEC DLCs were applied during the design of the DTU 10 MW reference wind turbine. Additionally, the IEC specifies the static load and fatigue test requirements in IEC 61400 Wind turbines—Part 23: Full-scale structural testing of rotor blades [23]. These full-scale tests are used to certify the blade meets the design requirements.

3.2. Materials and Properties

Wind turbine blades are designed using a variety of materials. The most common materials are composites with epoxy or polyester resin material reinforced with glass fibers and balsa wood used as a sandwich core. The fiber orientation in the composite layup varies to achieve specific effects such as flapwise bending resistance in the spar and buckling resistance along the trailing edge. Additionally, the pressure side and suction side aerodynamic shells are bonded together using epoxy-based structural adhesives. Figure 5 shows a detail image of a typical trailing edge and its constituents, including the balsa core, composite skins, and adhesive.
While some material properties are openly reported, design-specific material properties are process-dependent and must be determined for each intended application [44]. Material properties needed for design can be grouped into four categories: (a) elastic properties, (b) strength properties, (c) fatigue properties, and (d) fracture mechanics properties [45]. Determination of the material properties should follow established procedures established by the American Society for Testing and Materials (ASTM) or International Organization for Standardization (ISO). The specific test methods needed to determine material characteristic strengths values are beyond the scope of this effort. However, it is vitally important to understand the statistical basis for the values reported as mean values (50% survival probability) or some other tolerance, such as 95% survival probability with 95% confidence level. The statistical basis directly affects the required partial safety factors used in the design process [7]. Rolond and Echtermeyer [46,47], identified a simplified method of determining tolerance bounds from various-sized data sets of composite materials’ fatigue properties.
Wind turbine blades are designed to last at least 20 years, resulting in load cycles between 10 7 and 10 9 [45,48], making the blade very susceptible to fatigue. As such, the most common composite materials have been tested for fatigue properties and are reported in the Department of Energy/Montana State University (DOE/MSU) [49] and OptiDat [50] databases. The OptiDat database was developed under a European Union project and absorbed a previous, smaller database called FACT [51], and contains ∼3500 data points for glass–epoxy composite. The DOE/MSU database was developed under a United States project and contains ∼12,000 data points for ∼250 material systems including including glass–epoxy and carbon–epoxy composites. Mandell and Samborksy [49] provided guidance and cautions regarding direct use of the database for wind turbine blade design since the database results exhibit large variation in cycles to failure from 10 6 to 10 8 at the lower stress levels. Additionally, the two databases do not correlate well for similar materials [52]. Besides composite material properties, Zarouchasa and Nijssen [53] conducted material characterization tests of an epoxy adhesive with good correlation to numerical results.

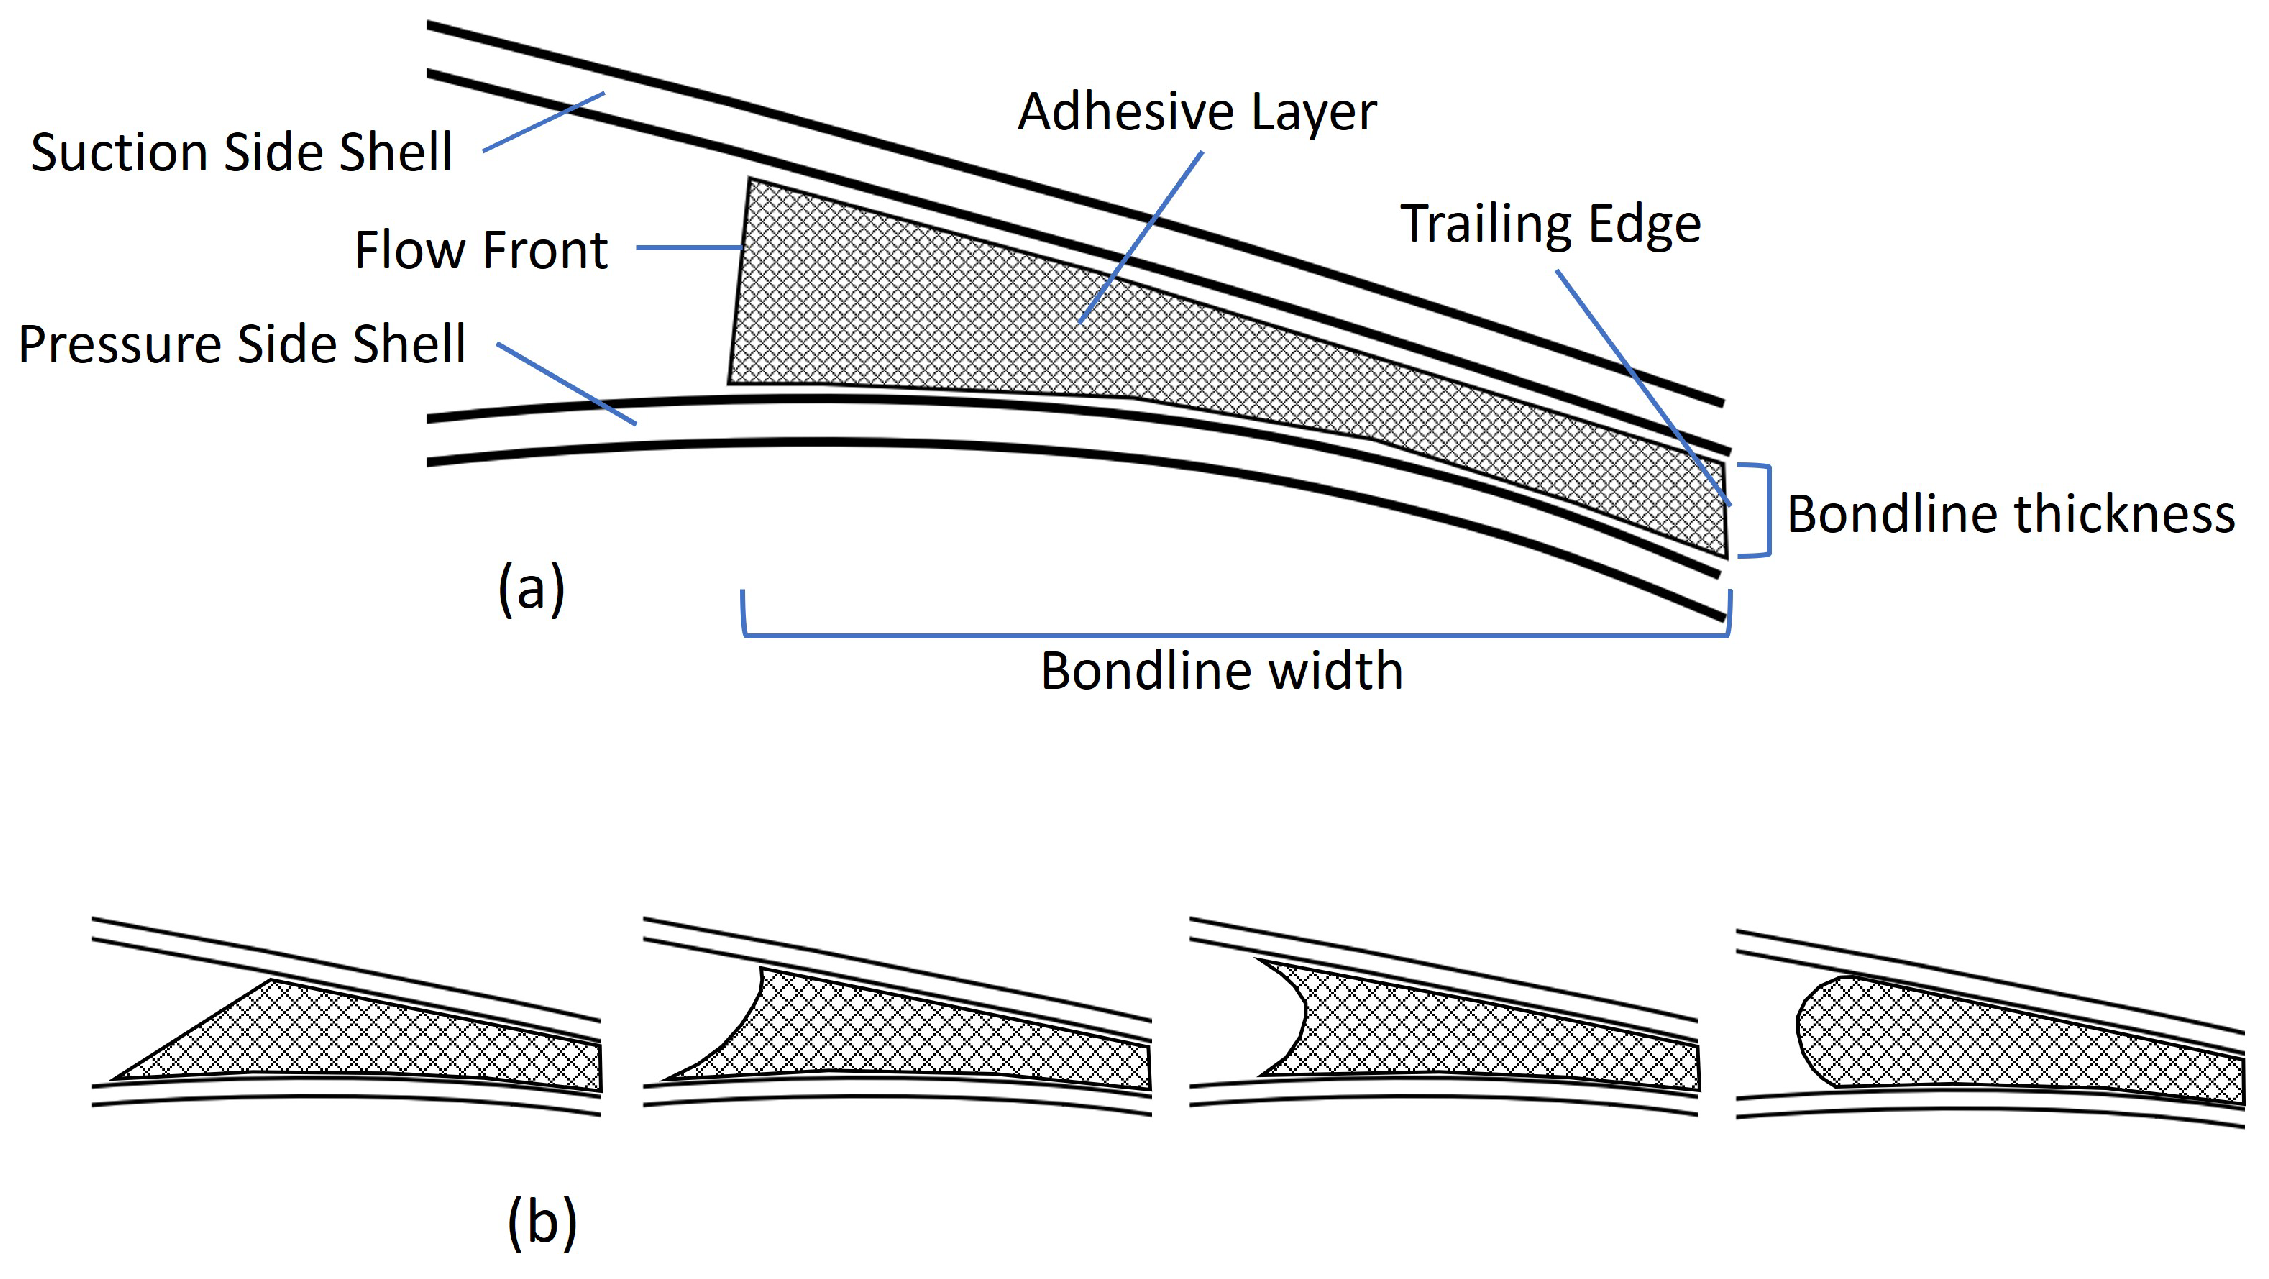
3.3. Trailing Edge Adhesive Joint Design

The trailing edge joint is comprised of the pressure side and suction side aerodynamic shells bonded together by an adhesive [54]. During the bonding process, it is difficult to maintain close tolerances for bondline thickness, width (or length), and flow front shape. Additionally, variations in manufacturing techniques (e.g., postcure temperatures) can also affect joint strength [55]. Figure 6 shows three types of trailing edge bondlines depending on the aerodynamic shell cross section. All three types still have the same basic concept of two composite shells held together with an adhesive. The most common type is Type A [48]. The DNV design standard requires all bonded joints including the trailing edge to be analyzed for both the extreme and fatigue load cases with all failure modes evaluated including adhesive, adherent and interface failures [17]. The American Society for Testing and Materials (ASTM) [56] identifies six test failure modes for any composite adhesive joint, including adhesive, cohesive, thin-layer cohesive, fiber-reinforced, fiber-tear, light-fiber-tear, and stock-break failures.
Due to either ultimate or fatigue loading, Jørgensen [28] identified 10 potential failure modes for wind turbine blade trailing edge, leading edge, and web adhesive joints, including the primary modes of cohesive failure in the adhesive, debond crack at the interface, and delamination in the laminate and crack modes, including transverse and oblique cracks due to Mode I, Mode II, or a mixed mode. During ultimate loading, Haselbach et al. [31] also identified trailing edge Mode III cracks due to local and global buckling. In additional research, Haselbach et al. [57] examined methods to improve trailing edge design using foam inserts, resulting in increased buckling resistance. During fatigue-loading failures, the trailing edge can experience cracking. The various cracks can initiate and grow by tunneling through the trailing edge joint until final failure when the adhesive joint can no longer withstand the design loads [38,58,59]. Cracks due to laminate adherent failure have been studied and correlated to failure theories, including Tsai–Hill or Hashin criteria that can be used in joint design [45]. The DNV design standard states that the adhesive joint Mode I failure dominates and will result in a conservative design [17]. For the trailing edge, Mode I failure is caused by the opening of the trailing edge panels.
Cyclic compression loads are known to cause fatigue damage on the trailing edge. However, there is another loading condition that can lead to joint fracture. Certain orientations of the blade loading, such as edgewise gravitational load or blade torsional load, can cause the trailing edge panels to open. This is referred to as “breathing”. Figure 7 highlights the breathing effect and associated trailing edge joint failures. Breathing eigenmodes have been identified in experimental modal analysis, but they have not been accurately predicted by numerical models [60,61]. Eder et al. [62] concluded that the breathing of the trailing edge joint is Mode I-dominated and a critical design concern primarily governed by its cross-sectional geometry. The curved trailing edge panels are susceptible to breathing due to a torsional load caused by the Brazier effect [63]. While most damage due to breathing results from fatigue of the adhesive joint are caused to cyclic opening, it should be noted that the breathing effect can also result in the closing of the trailing edge panel, which can affect the design of the panel due to possible internal contact [64,65].
The trailing edge adhesive joint has a few key design variables such as bondline thickness, bondline width (or length), and flow front shape, shown in Figure 8. The DNV standard [17] states that any bondline thickness should not exceed 10 mm. Investigation into bondline thickness effects demonstrated that fracture toughness decreases with thickness [27]. Sayer et al. [66] conducted spar cap adhesive joint subcomponent tests using a bondline thickness of 10 mm to correlate numerical and experimental data with good results. Verma et al. [67] tested leading edge joint coupons to simulate damage to a leading edge adhesive joint and results showed decreased failure loads with increased bondline thickness. Tomblin et al. [68] tested different adhesives with varying thicknesses and reported decreased shear strength with thicker bondlines. Other studies on thickness reported mixed results or no discernable effect [69]. The literature contains sparse results for the effect of bondline width. Rafiee and Hashemi-Tahero [6] conducted a finite element analysis on the trailing edge joint with various bondline widths and reported a change in failure mode from cohesive for short bondline widths to adherent delamination in large bondline widths.
Besides bondline thickness and bondline width, the shape of the flow front also plays a crucial role in determining the specific mode of joint failure [48,70]. Certain geometries can lead to specific failure modes, such as cohesive failure versus adhesive failure at the interface. To delay crack onset, flow front designs should encourage crack initiation at the interface since cohesive failures require lower energy release rates to initiate a crack. Encouraging crack initiation at the interface of the adhesive and laminate has the potential to increase the overall fracture toughness of the joint due to the possibility of fiber bridging [71]. However, the phenomenon of fiber bridging is complex and difficult to predict since it can significantly improve fracture toughness but is challenging to model [45]. Sørensen et al. [72] developed a model to predict mixed-mode bridging laws and noted that bridging’s toughening effect was much higher in Mode II than pure Mode I. Additional research by Sørensen et al. [73] compared experimentally derived bridging laws with analytical and numerical results, showing good correlation.

3.4. Trailing Edge Design Modeling

Finite element analysis is a useful tool for modeling the structural design of the trailing edge. There are several commercially available products such as Abaqus [74], ANSYS [75], and NuMAD [76] that provide highly accurate results. However, these tools often require extensive computational run times, which can be affected by various modeling assumptions, including the choice of element type. To achieve computational efficiency, full wind turbine blade models often use only shell elements. However, in cross section, a combination of shell elements for the blade panels and solid elements for the trailing edge adhesive is recommended based on comparison to experimental results, as noted by Haselbach [77]. In addition, other techniques such as shell-to-solid coupling or submodeling techniques have also been utilized. Other researchers have conducted modeling methodology comparisons or used a combination of shell and solid elements with similar results [37,78,79,80,81,82].
Another key aspect of computational efficiency is the model geometric size, whether to model the entire wind turbine blade, a given cross-section submodel, or a specific subcomponent, such as the trialing edge. Rafiee and Hashemi-Taheri [6] modeled the full blade to identify critical global regions, leading to a comprehensive trailing edge submodel. A tool developed at the Technical University of Denmark (DTU) [83], called BEam Cross section Analysis Software (BECAS) v2.0 [84], involves extracting a 2D cross section from an Abaqus 3D full blade model that can be used for detailed analysis. However, Haselbach [77] recommended a 3D full blade model, since a 2D cross-section analysis is insufficient for a detailed ultimate limit analysis needed to capture the nonlinear buckling failure of the trailing edge. A subcomponent model may be extracted from the full blade model for a region of interest, or may be as simple as a single panel or coupon. These small models are useful in the design process for parametric studies before running computationally expensive full blade model analyses [78].
For fatigue modeling, Shokrieh and Rafiee [85] used a full blade model to determine maximum stress for a given loading condition and used postprocessing tools to perform the damage accumulation analysis. Castro et al. [86] compared two fatigue modeling tools, called ALbert Blade Simulation (ALBdeS) and BECAS+Fatigue, both based on blade cross sections with similar analysis methodologies, but yielding significant fatigue life prediction differences.

3.5. Trailing Edge Design Testing

Static tests are most often used to determine characteristic material properties. Sayer et al. [87] reviewed testing of adhesive joints in the wind industry and reported a lack of fatigue testing and suggests a combination of static and cyclic testing to fully characterize any adhesive joint. In additional research, Sayer et al. [88] developed a new methodology to test and evaluate wind turbine adhesive bonds for both static and cyclic loading using a cantilever beam in a modified three-point flexural test apparatus. Beyond material characterization, a range of full-scale, subcomponent, and coupon testing can be used during the design process for both ultimate and fatigue-loading conditions to validate various aspects of the trailing edge design. As discussed in Section 2.1, ultimate load testing to determine failure modes has been conducted for all size ranges.
Chen et al. [26] conducted a fatigue test on a full 14.3 m blade with trailing edge adhesive joint artificial defects (e.g., debonds) to assess the trailing edge design, and more specifically, to investigate trailing edge damage growth. Freebury and Musial [89] created a methodology to convert design loads into an equivalent damage constant amplitude load condition that would simplify fatigue testing and verified the approach with full-scale fatigue tests using single-axis and two-axis loading conditions. Rosemeier et al. [37] used results from a full-scale blade fatigue certification test to validate a crack initiation model that can be used during trailing edge design. From a design perspective, the full-scale single-axis blade certification tests might be insufficient to validate a trailing edge design due to a lack of multiaxis loading conditions [31,62]. Rosemeier et al. [90] discussed the benefits of static and fatigue subcomponent scales versus full-scale testing to validate trailing edge bondline designs. Such benefits include a broader range and more realistic load conditions than can be achieved during full-scale tests.
Lahuerta et al. [91] conducted a static test of a trailing edge panel subcomponent extracted from a full-scale blade to assess the trailing edge buckling failure. Lahuerta et al. [91] also conducted a fatigue test of a trailing edge subcomponent using the same load orientation but at a reduced magnitude of the ultimate load test. Similarly, Chen et al. [64] used subcomponent testing to examine trailing edge buckling failure modes under an ultimate load condition. In additional research, Chen et al. [65] examined the internal contact that the trailing edge panels exhibited during testing, and using numerical models, they formulated possible design improvements to increase the buckling resistance of the trailing edge.
Before full-scale certification testing, design standards require coupon tests to verify the material fatigue damage model used to determine equivalent certification test loading conditions [17]. Additionally, coupon scale tests are used for material characterization. Rosemeier et al. [37] used coupon static and fatigue tests to determine trailing edge adhesive characteristic material properties.

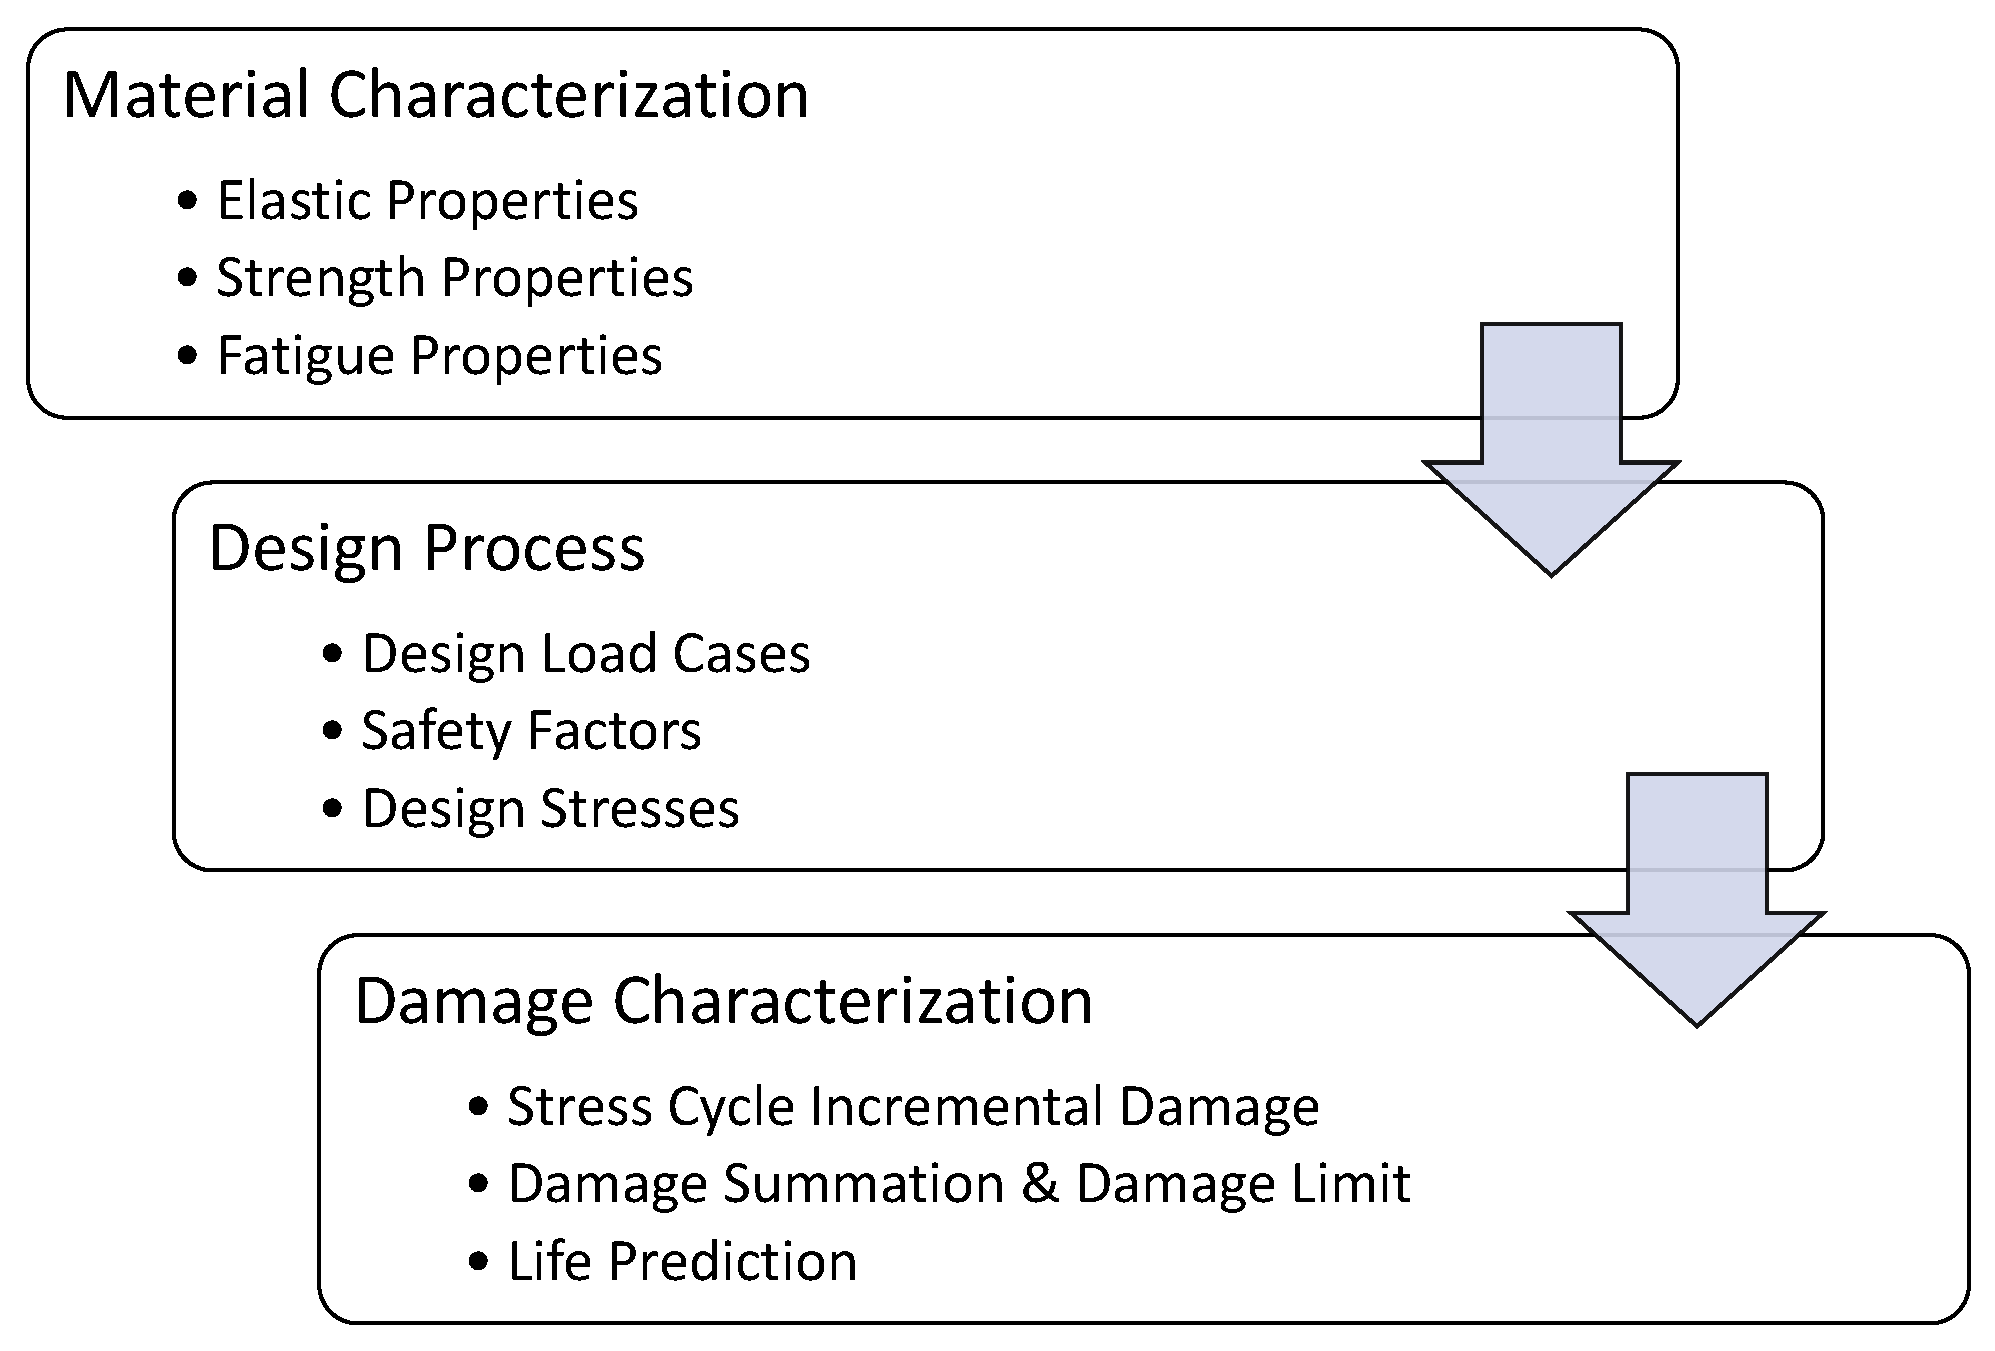
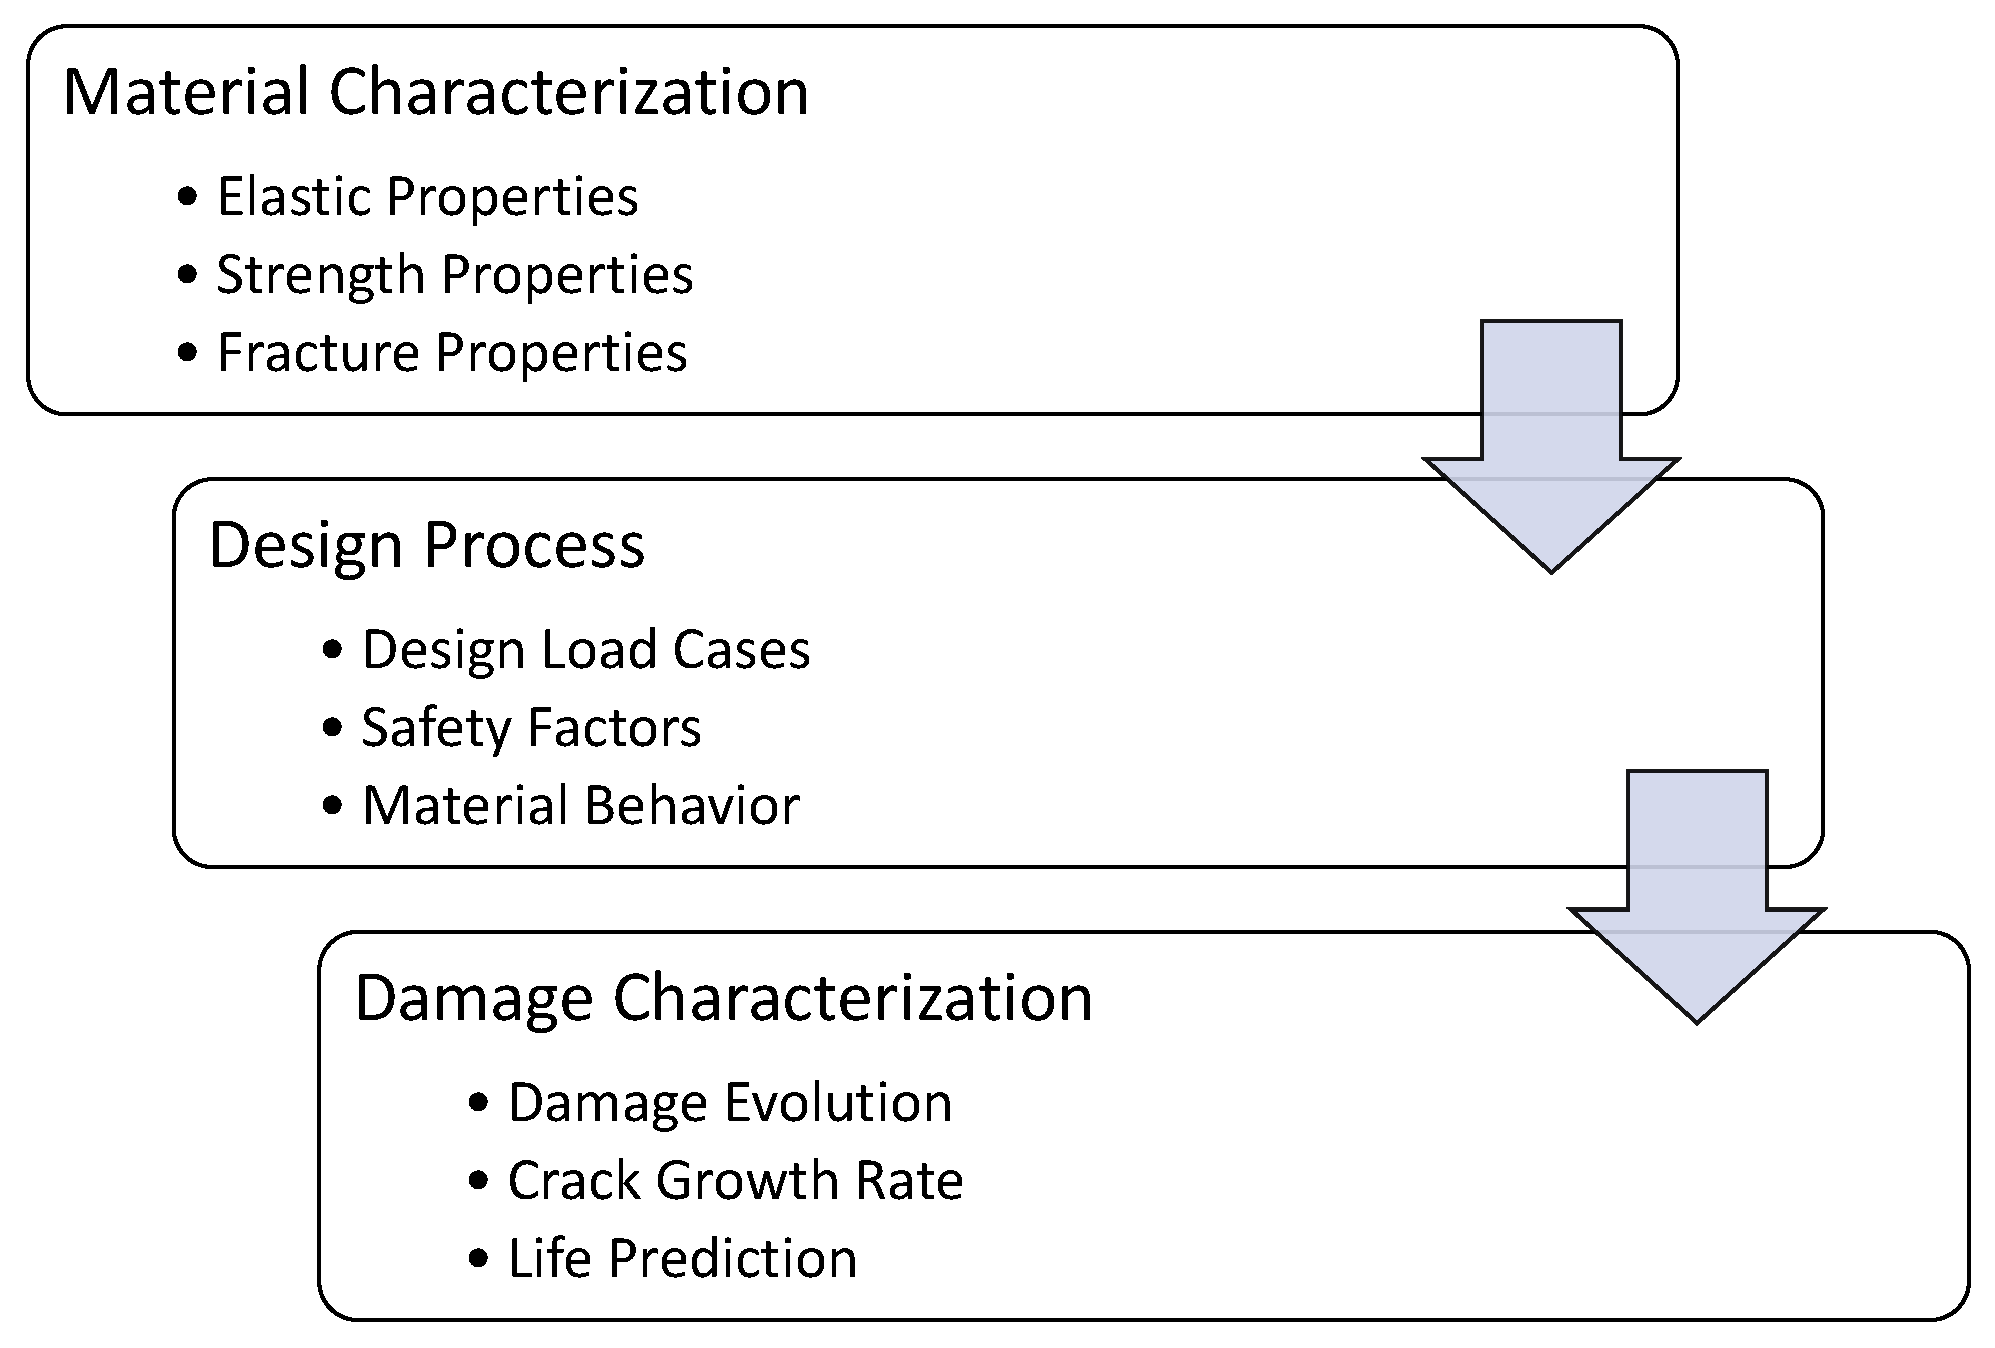
4. DADTA: Durability Analysis

Durability analysis examines the structural fatigue and the associated induced damage in a wind turbine blade. As wind turbines are subjected to both deterministic and stochastic loads, the analysis must evaluate the damage caused by each type of load cycle. The Miner’s rule damage accumulation method is used to calculate the incremental damage from the load cycles and compare it to an established damage limit. The durability analysis process is extensively described in the literature, including the IEC [7] and other authors [18,92,93,94]. Generally, the durability analysis process can be simplified and divided into three broad steps, as shown in Figure 9.
There are three key steps in durability analysis: (a) materials characterization; (b) design process; and (c) damage characterization. The first step of the durability analysis process is materials characterization. Each material used in the design must be fully characterized, including elastic properties such as Young’s modulus (E), shear modulus (G), and Poisson’s ratio ( ν ); strength properties in tension, compression, and shear such as ultimate strengths ( σ u ) and yield strengths ( σ y ); and fatigue properties for various stress ratios such as S-N curves and Goodman diagrams. The next step is the design process. The design load cases must be identified and appropriate safety factors must be applied to calculate design stresses. In some cases, it may be necessary to adjust the design stresses using Goodman or constant life diagrams to a known fatigue property due to differences in stress ratios. The last step is damage characterization. The design stresses and material fatigue properties are used to determine incremental damage caused by each stress cycle. Summing all the stress cycle incremental damages yields the total accumulated damage that can be compared to an acceptable damage limit and used to predict the design life. These three steps are discussed in detail below.

4.1. Materials Characterization

As discussed in Section 3.2, elastic and strength properties of the design materials are determined using accepted ASTM and ISO procedures. For fatigue properties, it is important to understand the fatigue cycle shown in Figure 10. The figure identifies the key terms used in the fatigue cycle, including the maximum stress, σ m a x ; minimum stress, σ m i n ; alternating stress, σ a ; and mean stress, σ m .
As a structure undergoes repeated stress cycles due to fatigue, the material’s fatigue strength decreases in proportion to the number of cycles. Tests of a material to failure at a given stress amplitude result in a plot of fatigue strength (S) versus the number of stress cycles (N), which is known as an S-N curve. While metallic materials have a fatigue strength limit, s n , composite materials do not, and their strength will continue to degrade with increased stress cycles [95]. To ensure the durability of adhesive joints, Curley et al. [96] recommended that the fatigue strength limit should be 30% of the static ultimate load strength. Accurately characterizing material fatigue properties requires extensive and time-consuming testing [92], but databases for wind turbine composite material fatigue properties do exist, though they should be used with caution [49,50].

4.2. Design Process

As part of the design process, the design stresses are determined from the design load cases, including wind condition with appropriate safety factors.

4.2.1. Design Load Cases

The IEC requires fatigue analyses for the design load cases (DLCs) shown in Table 1. The DLCs define the appropriate wind condition as well as the operational state of the wind turbine (power production, parked, shut down, etc.). The wind condition is the primary input to a structural stress analysis. Each design situation will contribute to the overall fatigue of a blade and needs to be accounted in the fatigue analysis using the appropriate wind condition and safety factors.

4.2.2. Wind Loading Condition

Since the wind condition is a stochastic load, a methodology must be employed to discretize the wind profile into usable elements or bins for fatigue analysis. Two common approaches for discretization are the load range-mean method and the rainflow cycle counting method, which use local maximum and minimum load cycles [7,17].
Sutherland [93] provides a comprehensive overview of the rainflow counting algorithm. In a nutshell, this algorithm converts time series data into bins of a cycle count matrix based on local minima/maxima cycles. The cycle count matrix can then be used in the fatigue analysis to determine the incremental damage caused by each bin range. On the other hand, Nijssen [95] discusses different counting methods and concludes that rainflow counting is generally more conservative in life prediction than range-mean counting since it does not preserve the cycle order. Hu et al. [97] used the range-mean method to characterize the variable wind condition and determine fatigue life, but warned that multiaxis fatigue stress analysis is needed to avoid overestimating fatigue life using single-axis analysis. With the wind condition determined and using counting methods to discretize the load, the appropriate safety factors need to be applied.

4.2.3. Safety Factors

The IEC [7] defines three partial safety factors for fatigue analysis, including load, material, and consequences. The partial safety factor for loads, γ f , shall be 1.0 for all design situations and is multiplied by the characteristic load. The partial safety factor of consequences, γ n , is dependent on the component class 1, 2, or 3, and can range from 0.9 to 1.3. The partial safety factor for material, γ m , is based on the fatigue material property given survival probability and level of confidence, and can range from 1.2 to 1.7. The characteristic material property value is divided by both the partial safety factor for consequence and material.
The DNV [17] fatigue analysis safety factors are similar with a load factor, γ f , multiplied by the characteristic load and the characteristic material design value divided by the material reduction factor, γ m . The material reduction factor is the product of the base factor, γ m 0 = 1.2 , with six other partial reduction factors ranging from 1.0 to 1.4 to account for various design, manufacturing, and operational concerns.
Providing similar results to the IEC and DNV, Ronold et al. [98] conducted a probabilistic reliability analysis of wind turbine fatigue to determine appropriate partial safety factors and concluded γ f γ m = 1.2 . The product of the partial safety factor for loads, γ f , and the partial safety factor for material, γ m , should be 1.2 and are site- and turbine-specific. McGugan et al. [99], Sayer et al. [87], and Holmes et al. [100] also applied a reliability methodology to determine appropriate partial safety factors.

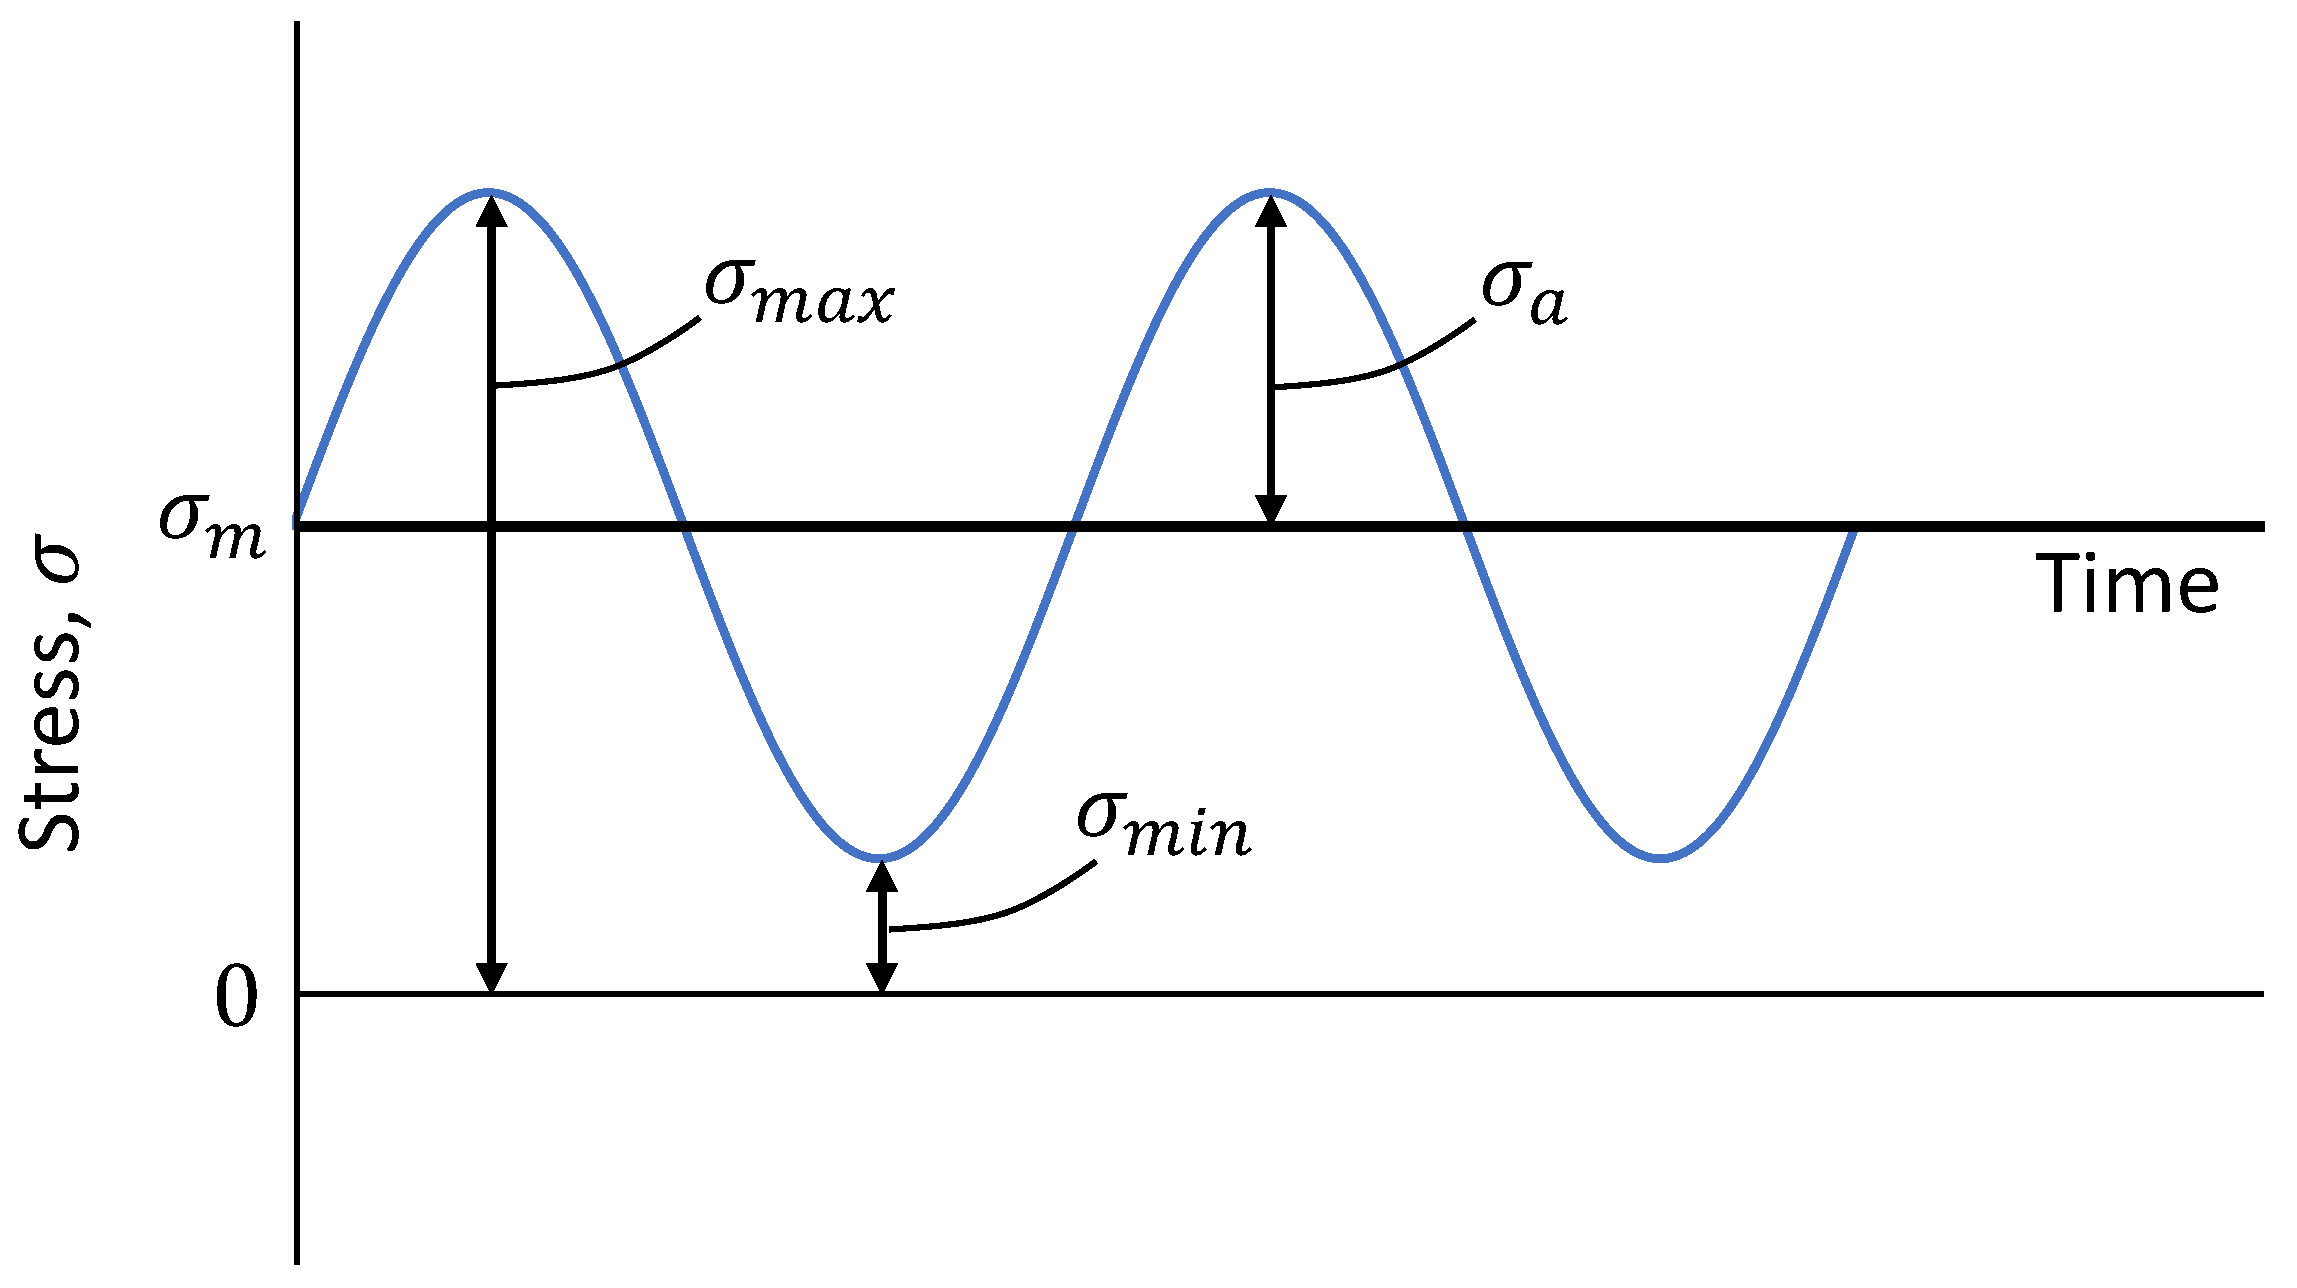
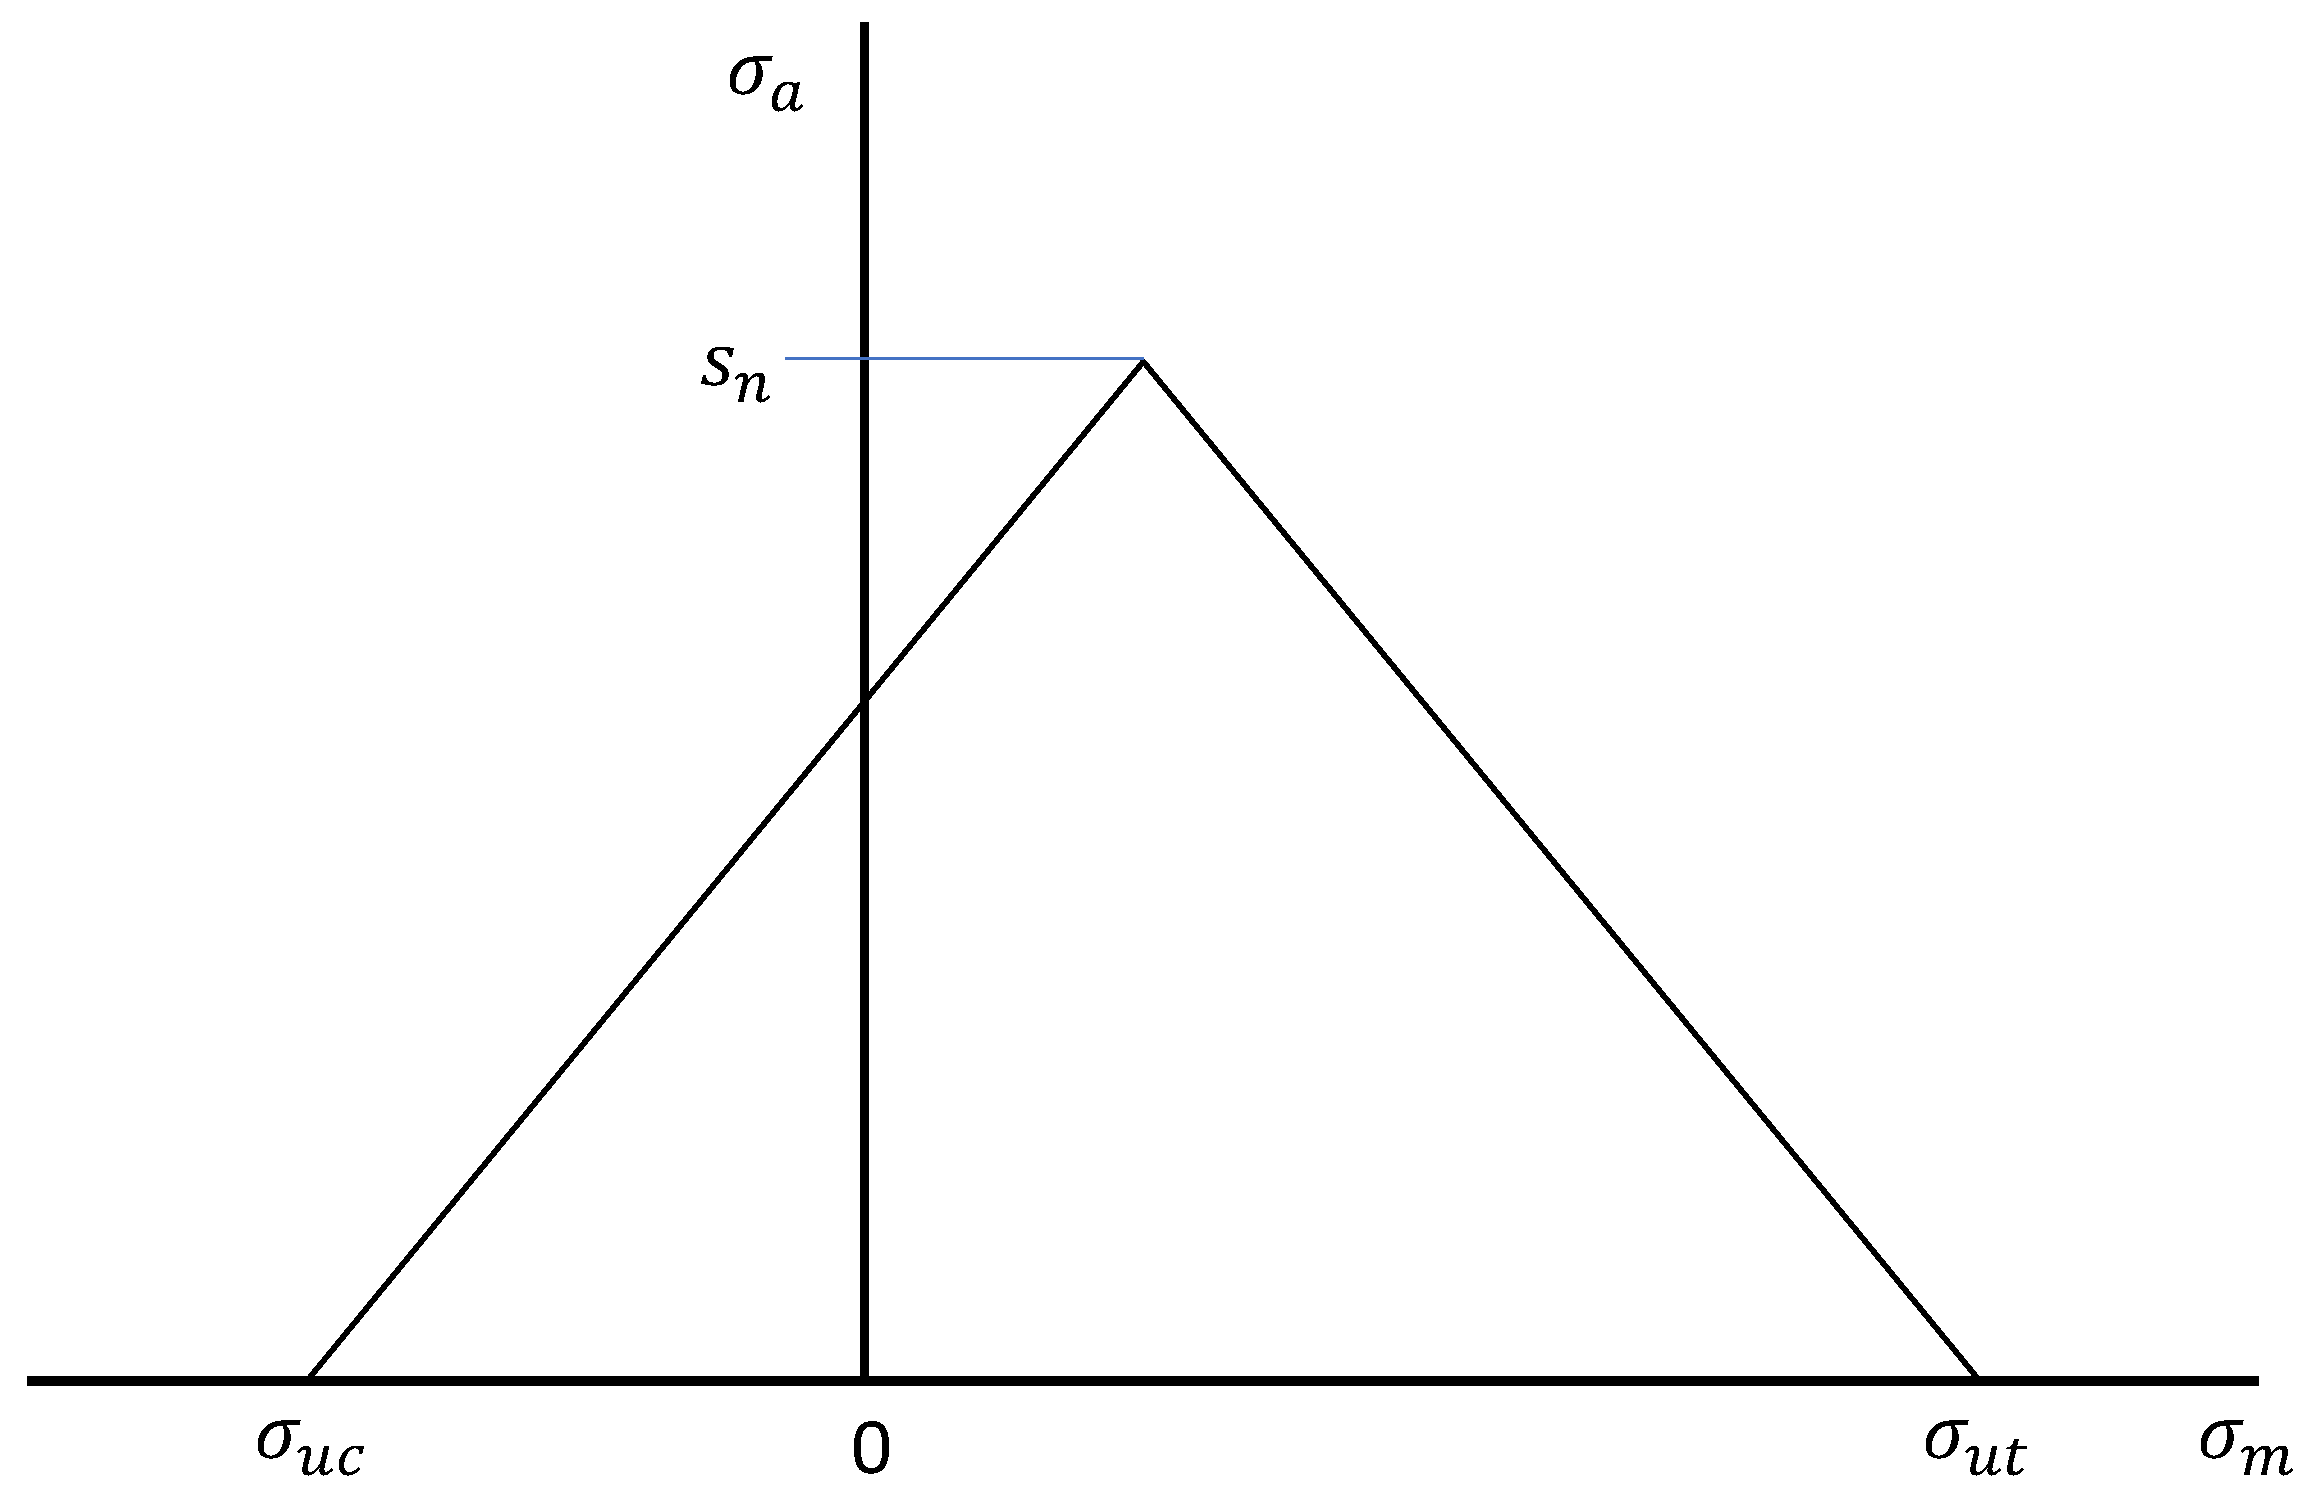
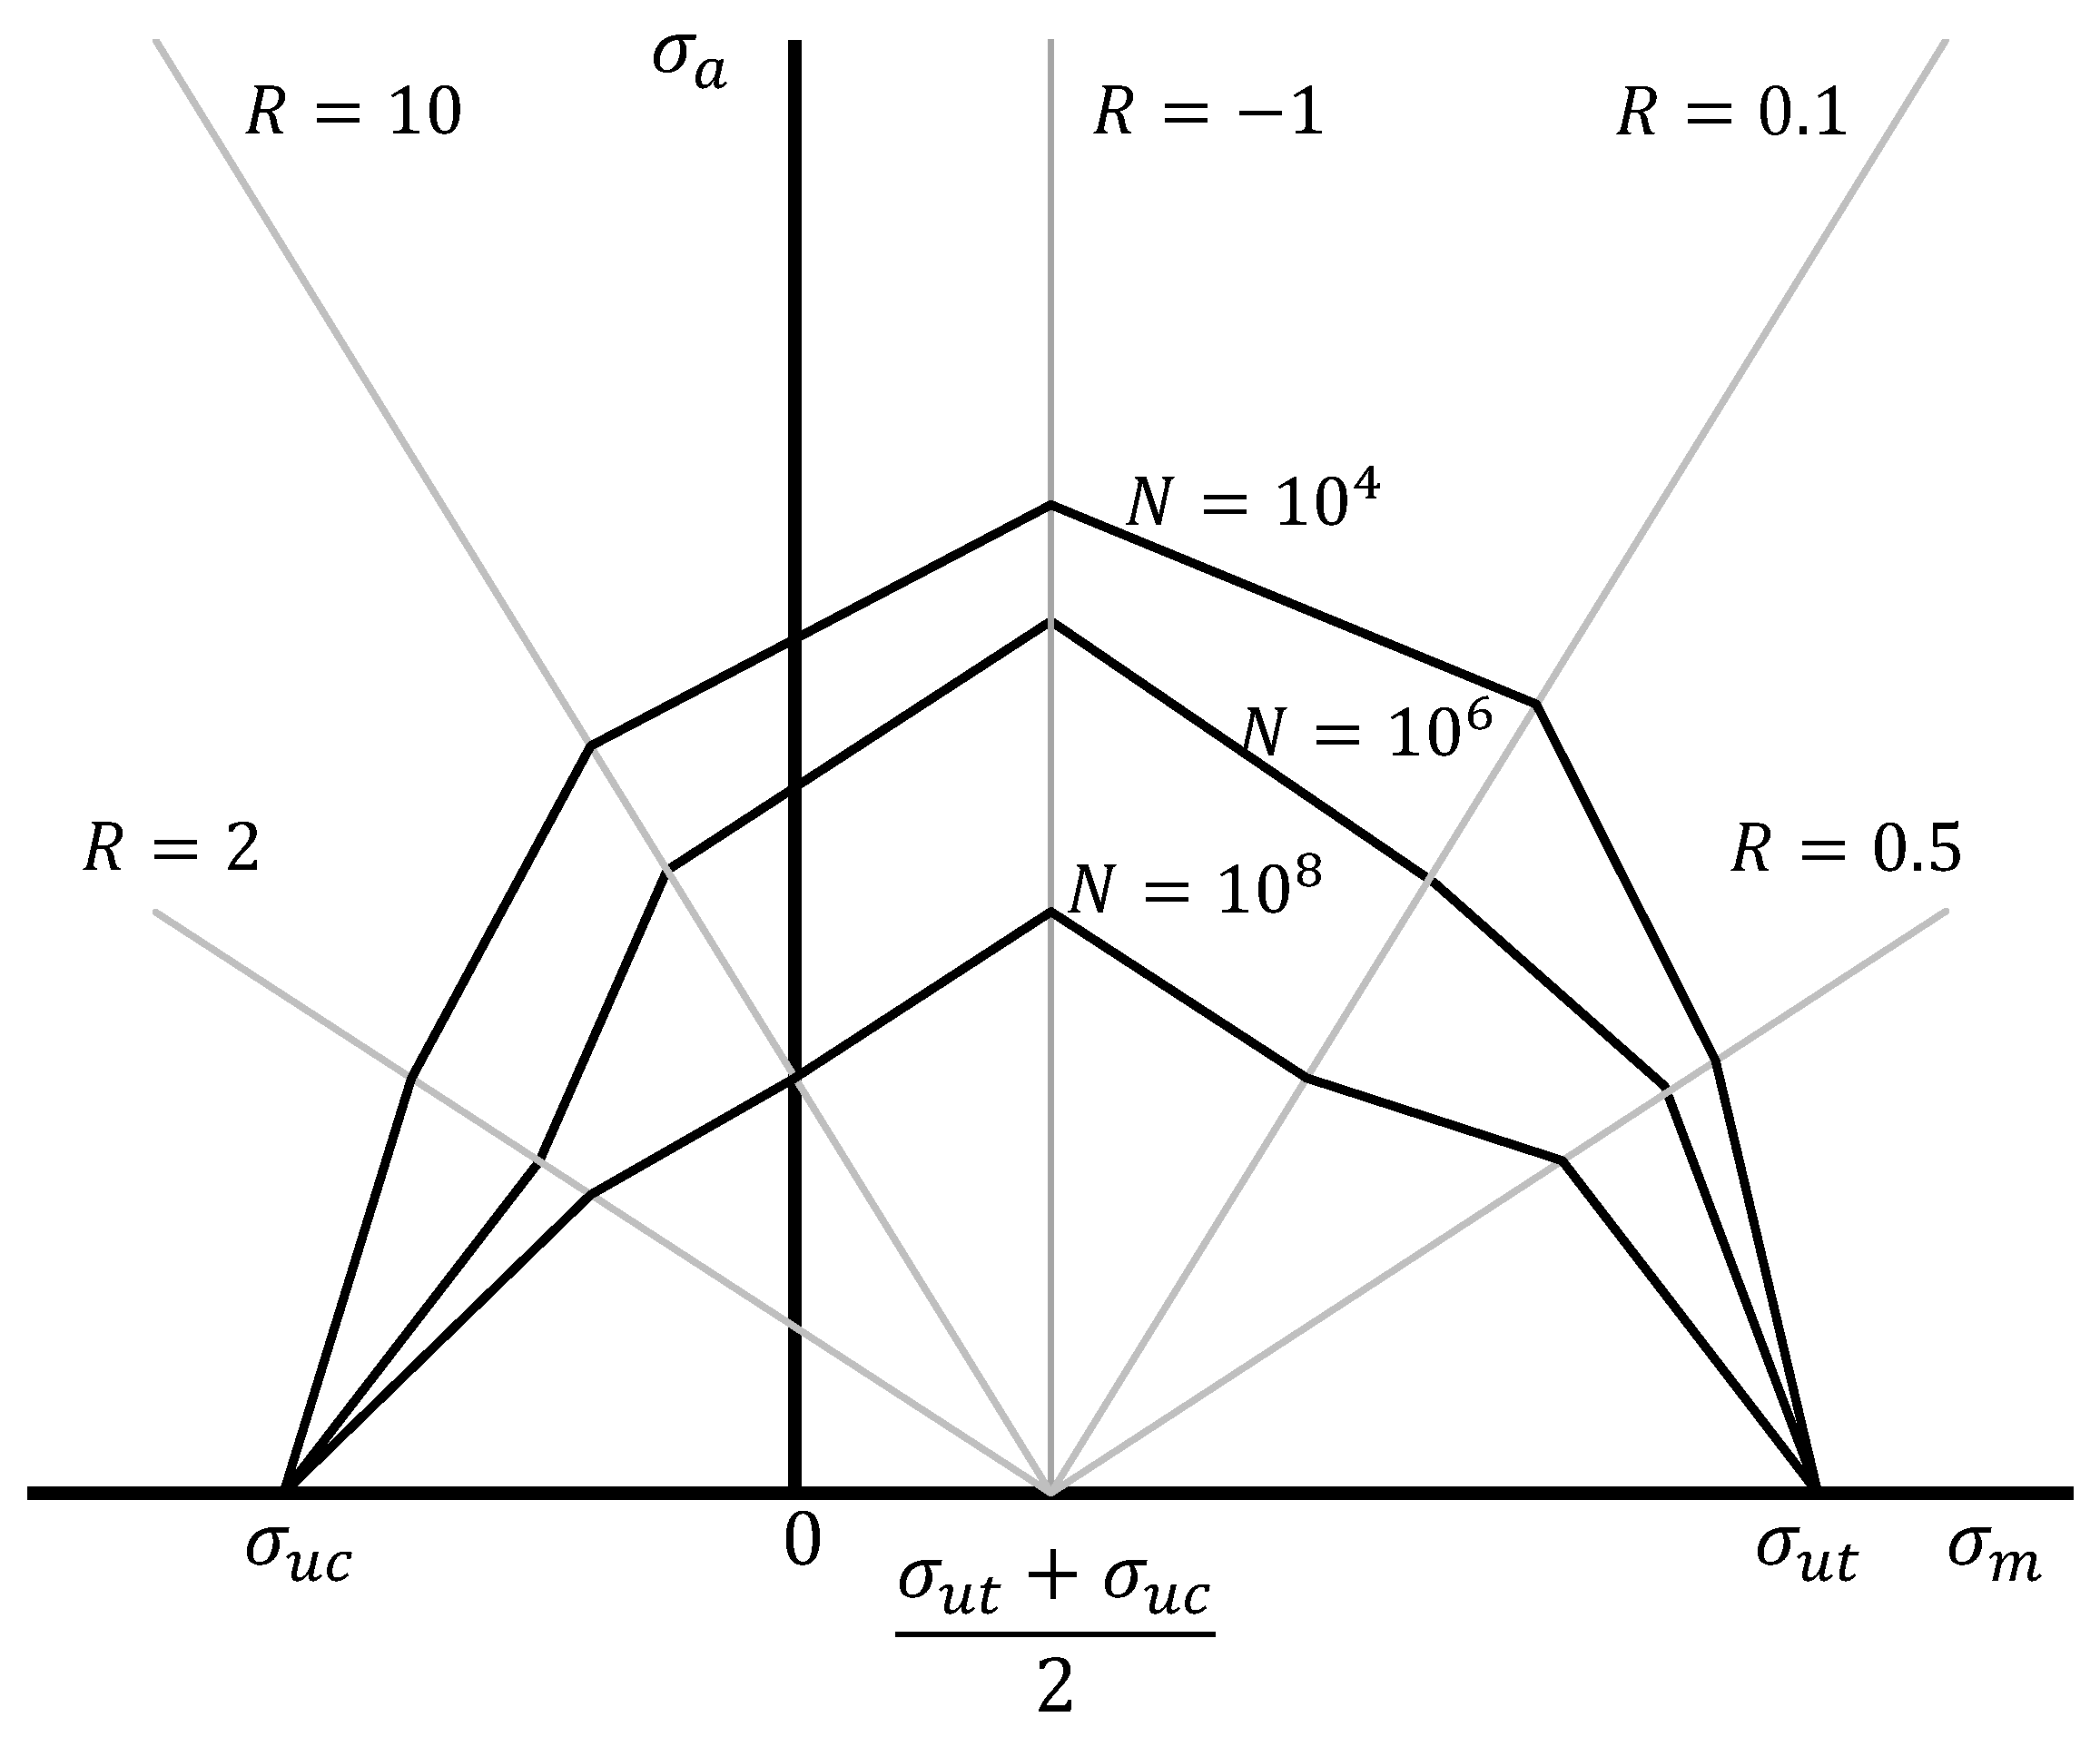
4.2.4. Design Stresses

Once the loads and safety factors of a design are determined, the design stress can be calculated. The blade design can be quite complex, so numerical modeling is commonly used in stress calculations. However, this approach does have its challenges, such as choosing the appropriate element types and time-consuming computations. It is crucial to perform stress analysis for each bin specified in the wind condition cycle count. While the specifics of stress analysis are beyond the scope of this review, the focus is on how to process the stress results.
The stress results are used to determine the corresponding number of cycles to failure using material S-N curves or Goodman diagrams. In both cases, for each stress analysis, the maximum stress, σ m a x ; minimum stress, σ m i n ; alternating stress, σ a ; and mean stress, σ m are identified, along with the corresponding stress ratio, R = σ m i n σ m a x . If an S-N curve exists for the specific stress ratio, then the number of cycles to failure can be directly determined. If not, Goodman diagrams can be used.
As with S-N curves, Goodman diagrams are developed from fatigue testing. Figure 11 is a simplified linear Goodman diagram. The simplified Goodman diagram plots three points: (1) characteristic material ultimate tensile strength, σ u t , (2) characteristic material ultimate compressive strength, σ u c , and (3) the material fatigue strength, s n . The first two serve as anchor points on the diagram along the positive and negative x-axis, respectively. The third point for fatigue strength is determined during a fully reversed stress (stress ratio R = 1 ) material fatigue test. These three points are joined to form a failure envelope for a given number of stress cycles to failure, N. A variation of the Goodman diagram to account for varying stress ratios is the constant life diagram (CLD) [95,97,101,102].
Figure 12 is a piecewise linear CLD. The CLD includes additional data points for fatigue test results at different stress ratios along with piecewise linear plots for different cycles to failure, N. With the stress results from the ith bin, the number of stress cycles to failure, N i , can be determined from the CLD and used in the incremental damage calculation.

4.3. Damage Characterization

With the stress cycles to failure, N i , for each bin, the incremental damage can be calculated using the Miner’s rule of damage accumulation.

4.3.1. Miner’s Rule

Miner’s rule is the penultimate step before conducting a life prediction. Miner’s rule is expressed as:
D c = n = 1 k n i N i
where D c is the cumulative damage for k bins, n i is the number of cycles in the ith bin, and N i is the number of cycles to failure for the ith bin stress range, as determined from the appropriate material S-N curve or CLD. Failure is predicted when D c ≥ 1.
It has been cautioned by Echtermeyer et al. [92] that the Miner’s accumulated damage value of 1.0 may need to be lowered to as low as 0.1, and is an important consideration for fatigue analysis. The analysis of the DOE/MSU database by Mandell and his team [103] supports Echtermeyer’s concerns when certain material combinations fail, even when the Miner’s sum is as low as 0.1, compared to 1.0. Nijssen [95] has also raised this concern and states that the accumulated damage limit should not be automatically accepted as 1.0; rather, it should be determined empirically.

4.3.2. Life Prediction

Life prediction is the follow-on step to the Miner’s summation. If the incremental damage from the ith bin is converted to a damage rate ( Δ D t i ) for the stress cycle time period, t i , Miner’s rule can determine an overall cumulative damage rate ( Δ D T ) for the total time period, T. The reciprocal of the cumulative damage rate is the design life.
D e s i g n   L i f e = 1 / Δ D T
Marin et al. [104] used this life prediction approach to compare results to fatigue failure in operational blades with reasonable results. Beyond predicting the design life of a trailing edge, fatigue analysis life prediction can be fully integrated into the overall blade design process to achieve an optimum design [105]. Tawade et al. [106] used fatigue life prediction in a design optimization effort, and concluded that blade life is (1) inversely proportional to length, (2) directly proportional to twist angle, and (3) directly proportional to chord length.
Trailing edge life predictions can be made for the adhesive joint, as well as its two constituents: the epoxy adhesive and the composite adherent. By conducting a joint life prediction using the fatigue properties of the trailing edge joint obtained through testing, the expected lifespan can be determined. Additionally, lifespan predictions of the adhesive and adherent can be determined separately. It is important to note that the trailing edge design life prediction is the smallest of the three predictions.

4.3.3. Alternate Methodology, Tools, and Issues

Durability analysis primary methodology uses Miner’s rule damage accumulation. However, other methods exist and use a reliability based approach [107], Spera’s empirical formula [101,108], a progressive damage model [109,110,111], or a residual stiffness and strength model [95,103,112]. Additionally, various tools have been created for fatigue analysis and life prediction. Tools for creating the load spectrum include WInd turbine reference SPEctRa (WISPER) [95] and PRObabilistic DEsign TOol (PRODETO) [95]. Tools for fatigue analysis and life prediction include GENOA [113], LIFE2 [93], ASYM [93], Fatigue And Reliability Of Wind turbines (FAROW) [107], ALbert Blade Simulation (ALBdeS) [86], and BEam Cross section Analysis Software + Fatigue (BECAS+F) [86]. Noda and Flay also created a simulation tool to automate the fatigue analysis and predict design life [114]. The various models and methodologies employed in the tools create differences in results that impact overall life predictions [86]. Additionally, the literature identifies other issues such as geometric nonlinearities in the trailing edge bondline stresses [82,115] and environmental extremes such as humidity that adversely impact the fatigue strength and life prediction [93,116].

5. DADTA: Damage Tolerance Analysis

Damage tolerance analysis examines the ability of the structure to sustain structural loading with damage and is primarily conducted using fracture mechanics. Fracture mechanics can be applied to determine the damage life cycle from initiation, through propagation until reaching an established limit that constitutes final structural failure. Experience from the aerospace industry has provided a wealth of knowledge regarding metallic structures; however, composite structures are becoming more common but remain a difficult challenge [117,118].
Damage tolerance analysis can be applied during most phases of the system life cycle with early design life prediction estimates in the design phases, resulting in the as-designed configuration, a major update after the manufacturing phase to account for identified defects and flaws resulting in the ‘as built’ configuration, and periodic updates during operations phases to account for damage growth and identification of new damage in the ‘as operated’ configuration. The focus of this section is the later two estimates for the ‘as-built’ and ‘as operated’ life predictions since they will yield the most benefit from a damage tolerance analysis.
Like durability analysis, the damage tolerance analysis can also be subdivided into three broad steps, as shown in Figure 13. The first step is material characterization, where material properties used in the design must be fully characterized, including elastic properties and strength properties, with a special focus on fracture properties, such as critical strain energy release rate (SERR), crack resistance, and fracture toughness. The next step is the design process, where design load cases are identified with appropriate safety factors together with an additional understanding of how each material reacts and behaves with damage, including linear and nonlinear material response and stable or unstable crack growth. The last step is damage characterization, which includes damage evolution that starts with initiation, progresses with damage growth, and concludes when either the damage reaches a prescribed limit state or structural failure occurs. The damage growth rate can be used for direct life prediction. However, monitoring an operational wind turbine blade for damage growth rate is challenging, requiring recurring inspection or remote health monitoring. Below are brief discussions of each step as a part of damage tolerance analysis, first for wind turbine blades in their ‘as built’ state, and then for wind turbine blades in their ‘as operated’ state.

5.1. As-Built Life Prediction

Before full-rate blade production begins, initial manufacturing processes will be examined during the final blade design process. Blade prototypes will be built to conduct initial quality assurance inspections of the prototype blades and identify any flaws and defects introduced during the manufacturing process. For instance, some manufacturing flaws in the trailing edge adhesive joint may include thickness variability, voids, bubbles, debonding, delamination, fiber misalignment, wrinkles, waviness, resin-rich or dry regions, and inclusions [29,70,119]. If the flaws and defects cannot be eliminated from the processes, then they must be reviewed as part of the final design damage tolerance analysis for impacts on the ‘as built’ life prediction [120].

5.1.1. Material Characterization

As discussed in Section 3.2, elastic and strength properties of the design materials are determined using accepted ASTM and ISO procedures. ASTM and ISO also have standards to determine material fracture properties such as critical strain energy release rate (SERR), crack resistance and fracture toughness. The critical strain energy release rate, G c or J c , is the energy available for crack growth and is balanced by crack resistance, R, or the energy required for crack growth. Fracture toughness can be represented by the stress intensity factor, K, and is the strength of the stress singularity at the tip of a crack within the fracture process zone [20]. In general, a crack will develop in one of three modes: Mode I—opening (e.g., tension), Mode II—in-plane shear, and Mode III—out-of-plane shear [121]. Figure 14 shows the three fracture modes. Material properties for each mode are needed to evaluate the trailing edge joint design and can be determined using ASTM standards. However, Sørensen et al. [122] developed a novel method for determining critical strain energy release rate and crack resistance properties using a unique test fixture, including in situ observation by a scanning electron microscope for a double-cantilever specimen loaded with pure bending moments. The in situ observation greatly enhanced the ability to examine both crack initiation and growth.

5.1.2. Design Process

When carrying out a damage tolerance analysis, the DLCs and safety factors remain unchanged. However, the analysis considers the material fracture properties to assess the behavior of the structure and materials of the as-built configuration. Trailing edge adhesive joint fracture is a complicated issue that can lead to failure in Modes I, II, and III under various loading conditions [70]. For edgewise gravitational and torsional loading, which causes the trailing edge to open, Mode I is usually dominant, as observed by Jørgensen et al. [123] and Eder et al. [62]. Design standards [17] confirm that Mode I generally prevails over Mode II. Mode II was found to be dominant for the blade spar cap joint but not the trailing edge under flapwise loading [113,124,125]. For edgewise loading of the trailing edge, fracture modes were studied, and in some flapwise locations, Mode III was dominant [126]. Eder et al. [80] reported that for flapwise shear and torsion loading conditions of the tailing edge, Mode III was dominant. Adhesive joint fracture is complex, and the fracture mode varies or is at least a mixed mode failure due to different loading conditions along the trailing edge. There are numerous adhesive joint mixed-mode fracture studies reported in the literature [127,128,129,130,131]. In addition to adhesive joints, damage tolerance has also been applied to fractures (e.g., matrix cracking or delamination) within composite materials for any location in the wind turbine blade. Determining trailing edge material behavior using damage tolerance is the first step to improving designs to mitigate the effect of damage resulting from operational loads or from the as built manufacturing process.

5.1.3. Damage Characterization

Fracture mechanics provides the theoretical framework for the behaviour of cracks within a structure. The basic premise is that crack initiation will occur when the energy release rate reaches a determined minimum critical value and the crack will exhibit stable growth until the energy release rate reaches the fracture toughness of the material constituting a material failure [30]. There are both linear and nonlinear models that examine and quantify this process. If the crack growth rate can be predicted or measured, then the material design life or remaining useful life can be computed.
Using linear elastic fracture mechanics (LEFM) for Mode I, the stress intensity factor (SIF), K I , is found using
K I = σ π a
where σ is the stress and a is the crack length. The failure envelope, defined by the critical fracture stress, σ f , is a function of crack size, a, and the critical stress intensity factor, K I C , and is found using [21]:
σ f = K I C π a
Therefore, any combination of stress intensity factor and crack length that yields a fracture stress greater than the critical value is beyond the failure envelope and demonstrates failure. Similar relationships can be derived for the two shear crack modes. Hua et al. [125] were successful in using a contour or J-integral method for determining the stress intensity factors for the three fracture modes ( K I , K I I , K I I I ) and a cohesive traction separation law to determine crack initiation. For wind turbine blade adhesive joints, Rosemeier et al. [37] achieved a strong correlation between numerical and experimental methods for material characterization needed to predict crack initiation and proved useful during bondline structural design.
For larger fracture process zones, a nonlinear method is required using other parameters such as the cohesive law or traction-separation law [132], J-Integral [133], the virtual crack closure technique (VCCT) [80], and crack tip opening displacement [13]. Researchers have used these fracture mechanics approaches for examining various adhesive joints [124], including wind turbine leading edge, spar cap, and trailing edge joints to examine the various Mode I, II, and III or mixed-mode failures [17,129].
A cohesive law relates the cohesive traction of the material to the local opening, δ . Upon reaching a critical opening value, the cohesive stress dissipates [132]. Sørensen [134] conducted in-depth research on cohesive laws and cohesive zone modeling (CZM) for engineering use, including the wind turbine blade industry. CZM has been proposed as a method to simulate delamination in composites under both quasi-static and fatigue DLCs [118]. However, Budhe et al. [69] stated that applying CZM remains a difficult challenge for composite adhesive joints. Sørensen and Jacobsen [135] developed a methodology to develop mixed-mode cohesive laws based on the determination of the J-integral. The J-integral is a path-independent method to estimate strain energy release rate around a crack [70,121]. Baharvand [121] determined the J-integral worked well to derive cohesive laws and provided a detailed comparison of the advantages of CZM versus VCCT. In the simplest terms, VCCT states that the energy required to close a crack is the same as the energy released when a crack propagates [117]. Krueger [136] provides an extensive review of VCCT, from initial history to current usage. Eder and Bitsche [70] used methodology based on VCCT to predict crack growth in the trailing edge. VCCT has proven useful, especially with finite element analysis, and Eder et al. [80] believe VCCT has some advantages over J-integral. In numerical modeling tools such as ANSYS and Abaqus, these various fracture mechanics methods can be used, including the virtual crack closure technique (VCCT) [70,80], strain energy release rate [62,137], contour J-integral [125], and cohesive elements [138,139].
Once crack initiation has occurred in either static load or cyclic load conditions, it is important to determine the crack propagation or growth rate, d a d N . Huang et al. [140] concluded the crack growth rate is higher for cyclic loading versus static loading. Samborsky et al. [129] examined the crack growth rate in three wind turbine adhesives and concluded the following: (1) material under tension–compression cyclic loads had faster crack growth than tension–tension cyclic loads, and (2) the adhesives followed similar trends but demonstrated a wide range of critical strain energy release rates, G I C . Additionally, the specific stress ratio has been found to affect the crack growth rate in typical blade adhesives in both linear and nonlinear fracture approaches [141]. Jørgensen et al. [142] was able to correlate experimental and finite element modeling efforts of stable crack growth rates in blade adhesive joints. Crack growth rate can also be affected by the phenomenon of fiber bridging. Fiber bridging occurs when composite fibers bridge across the developed crack and thereby increase the potential crack resistance, R. The increased resistance due to fiber bridging affects the material resistance curve or R-Curve and decreases the crack growth rate [140,143]. Sørensen and Jacobsen [71] found that the effect of fiber bridging is independent of the specimen geometry and can therefore be considered a material property. The use of the J-integral has been found to be particularly useful in situations involving fiber bridging [134,144]. The number of cycles to failure can be calculated from the crack growth rate using an initial flaw size ( a 0 ) and a known critical crack length ( a N ) [94]. The allowable number for load cycles can be simply converted to design life prediction.
If the crack growth rate is not specifically known, the structural design life can be determined using the Paris equation. Figure 15 shows the log–log plot of crack growth rate versus SIF. Region I depicts crack initiation starting once the threshold SIF, K t h , is reached; Region II depicts a crack growth area; and Region III depicts failure once the critical SIF, K c , is reached.
The Paris equation represents the linear relationship between crack growth rate and SIF in Region II as a power function, and can be stated as:
d a d N = C ( Δ K ) m
where C and m are empirically determined constants. Using Figure 15, one approach determines C as the intercept and m as the slope of the line in Region II. Substituting in the K I C from Equation (4) and solving for the number of cycles as a function of crack length yields
N = 1 C ( σ f π ) m a 0 a N a m / 2 d a
For an assumed trailing edge initial flaw size ( a 0 ) and a known critical crack length ( a N ), the safe number of cycles, N, can be determined. The safe number of cycles is easily converted to the trailing edge design life prediction and serves as a foundation for establishing structural inspection intervals during scheduled maintenance. Intervals should be established to ensure at least two inspections are performed during a trailing edge structural life.
Equation (5) is for LEFM, but similar formulations can be made for nonlinear methods based on critical SERR, G C [30,94]. Curley et al. [96] used the Paris equation based on G m a x for the service life prediction of adhesive joints and demonstrated good correlation to experimental results. Modifications to the Paris equation have been made to address initial assumptions, such as the Walker equation incorporation of stress ratio [145]. A more general formulation for crack growth rate is the NASGRO equation that includes all three regions from Figure 15, as well as stress ratio, R, and Newman crack closure function, f [146].

5.1.4. Alternate Methodology and Tools

Another damage tolerance life prediction method is the reliability-based approach using a probabilistic framework to (1) predict damage initiation, (2) predict damage growth from one damage state to another, and (3) predict design life. To predict the damage initiation requires in-depth knowledge of the material variables and relationships to possible failure modes along with probability of occurrence [37]. In lieu of predicting damage initiation, specific initial damage and damage occurrence rates can be determined from postproduction quality assurance inspections [147] of wind turbine blades. To predict damage growth, one possible method implements a progressive failure finite element analysis model [148]. To predict design life, this approach considers the design life as a random variable within either a stochastic or statistical design life model with a probability density function [30,149].
Several software tools have been adapted or created to assist in crack growth and life prediction analysis. Liu et al. [150] used ANSYS to confirm stress intensity factors for a variety of structural shapes and conditions. Early NASA space vehicle structural efforts created NASGRO [151], with later FAA efforts incorporating civilian aircraft requirements [152]. In 1994, the US Air Force’s Wright Laboratory created a variant called MODGRO [153], which in turn was improved, and later became AFGROW [152,154]. The US Air Force continues to improve its analysis tools, and currently uses both AFGROW and Cracks2000 [151].

5.2. As Operated Remaining Useful Life (RUL) Prediction

Damage tolerance analysis should not end with the deployment and operation of the wind turbine. Periodic updates of the damage tolerance analysis during operations based on inspection results can account for new damage identified and the growth of existing damage in the as operated configuration. The usefulness of the analysis updates lies in the ability to predict the remaining useful life of the blade, or more specifically, the trailing edge. McGugan et al. [99] developed a methodology that specifically combines damage tolerance and condition monitoring for life cycle management of offshore wind turbine blades.
The damage tolerance analysis process steps Material Characterization (see Section 5.1.1) and Design Process (see Section 5.1.2) do not change for the as-operated configuration, but the Damage Characterization step adds discussion of how damage is considered during operations.

5.2.1. Damage Characterization

Fracture mechanics remains the foundation for damage characterization during operations, and shifts from attempting to predict damage to focusing on the growth of pre-existing damage and new damage identification.

5.2.2. Damage Identification

To properly identify and characterize trailing edge blade damage, four basic information elements must be known. First, some indication that the damage exists is needed. This indication could be from previous postproduction inspections, from new inspections during scheduled maintenance or from a condition monitoring system. Second, the general location must be known to inform a technician to conduct further investigation. Third, once located, the damage needs to be identified by type (composite delamination, transverse or longitudinal adhesive debond or crack, etc). Fourth, the severity of the damage needs to be quantified. Nielsen and Sørensen [30] proposed six categories of severity based on crack length, from cosmetic to critical damage. According to Katnam et al. [155], once damage has reached a critical state, in situ repair of wind turbine blades is a very challenging endeavor. To avoid costly repairs, Shohag et al. [156] reviewed a wide range of damage mitigation techniques for wind turbine blades, including better damage modeling to optimize the as designed configuration, enhanced manufacturing techniques to reduce flaws and defects in the as built configuration, and damage monitoring of the as-operated configuration.

5.2.3. Scheduled Maintenance Inspections

Based on design life predictions, scheduled maintenance inspections of critical wind turbine blade structural components, including the trailing edge, should occur at least twice during the predicted life. Installed blade inspection can be quite challenging, and techniques used for postproduction, such as ultrasonic or x-ray nondestructive inspection (NDI), are difficult to use in the field [147,157]. The literature contains numerous discussions of in-service blade inspection methods, including visual inspection via rope access or crane, and now more commonly via cameras mounted on work platforms or drones [119,158]. These visual systems can accomplish the first two elements of damage identification: existence and location. The initial results provide locations for follow-up detailed inspections by a technician to assess the last two elements: damage type and severity [99]. Once damage is identified, characterized, and documented, it can be monitored for growth during subsequent scheduled maintenance events. Besides aiding in repair decisions, the damage growth rate from one inspection to another can be used to determine the structural remaining useful life.

5.2.4. Remote Structural Health Monitoring

While not yet widely used in operational systems due to low technology readiness levels (TRLs) [159], the use of embedded sensors for monitoring the condition of the blade structure is being investigated and used in blade research and testing environments. Such systems are called condition monitoring (CM) [160,161] or remote structural health monitoring (SHM) [162]. Embedding sensors during manufacturing increases the overall blade cost, but will provide remote access to a blade’s structural condition, allowing for the possibility to reduce scheduled maintenance events and costs, particularly for offshore systems, over the operational lifetime [45,119,163]. Groves [147] has defined five levels of SHM: (0) postproduction damage assessment, (1) remote load monitoring, (2) damage detection and localization, (3) damage type and size quantification, and (4) RUL prediction. These five levels encapsulate the essence of using a damage tolerance approach during operations.
In the literature, there is a wide range of sensors being proposed and investigated for wind turbine blade remote SHM, including strain gauges [162,164], accelerometers [162,165,166], acoustic emission (AE) [26,119,133,147,156,162,167], fiber optic sensors (FOS) [162,164,168,169], fiber optic strain sensors (FOSS) [147,156,170], fiber Bragg grating (FBG) [119,171,172,173], optical backscatter reflectometers (OBR) [164], ultrasonic guided waves (UGW) [158,174], and in situ triboluminescent optical fiber (ITOF) sensors [175]. Sørensen et al. [162] conducted a detailed wind turbine blade test and cost analysis of three sensor types: AE, FOS, and accelerometers, with satisfactory results, and determined that fiber optics were the best sensor for trailing edge adhesive joint damage detection. However, a single sensor may not accomplish all four elements of damage identification but may require a combination of sensors [162], making appropriate sensor choice difficult but vitally important [176].

5.2.5. Remaining Useful Life Prediction

The trailing edge RUL can be predicted from either the observed damage growth rate or using the observed damage size and the Paris equation. The observed crack growth rate can be determined from periodic inspection or remote SHM of the damaged area to determine growth over time. Pereira et al. [160,171] used multiple FBGs in a remote SHM system and successfully modeled and experimentally measured the damage growth rate in a composite adhesive joint. The trailing edge remaining allowable load cycles can be calculated from the crack growth rate using the current observed flaw size and a known critical crack length. If the crack growth rate is unknown, the trailing edge RUL can be determined using the Paris equation (see Equation (5)). If new damage is identified, the current observed flaw size and the known critical crack length are used in the Paris equation to calculate the safe number of trailing edge remaining cycles. In both cases, the allowable number of trailing edge load cycles can be simply converted to the trailing edge RUL.
The literature has examples of the usefulness of remote SHM for RUL. Beganovic and Söffker [158] developed a concept to use the remote SHM data as input into a prognostic RUL model to extend the blade lifetime beyond the original design life. Griffith et al. [177,178] developed a numerical SHM simulation for a trailing edge debond to examine damage mitigation methodologies, and found that derating the wind turbine power by 5% reduced the fatigue loading and damage growth while extending the trailing edge RUL by 300%. Also, examining trailing edge damage and damage growth rates of as-operated wind turbine blades will allow the trailing edge remaining useful life to be determined by the current damage state, with a possible life extension beyond the original trailing edge design life for healthy blades that do not possess significant damage [99].

5.2.6. Alternate Methodology

A reliability-based approach can also be used on the as-operated blade configuration. The reliability-based approach uses a probabilistic framework to (1) predict damage initiation, (2) predict damage detection and inspection reliability, (3) predict damage growth from one damage state to another, and (4) predict remaining useful life [30]. In general, probabilities for each step in the approach can be developed based on data analysis of scheduled inspections or remote SHM results or determined by similarity to other operational wind turbine blades. For the United States wind turbine fleet, the Sandia National Laboratory maintains a blade reliability database [1]. In one example, damage initiation is determined with a combination of remote SHM as an indicator of possible damage along with the probability of damage constituting the first two steps of damage identification (existence and location) and can be used to notify the operator for the need to assess the last two steps of damage identification (type and severity) [158]. As with damage initiation, the probability of damage detection can be developed similarly. Myrent et al. [163] discuss the use of a stochastic versus a deterministic strategy to derive probabilities of detection. Valeti and Pakzad [149] examined both damage growth and RUL predictions by defining damage growth probabilities from one state to another based on a nonlinear state equation and RUL probabilities based on initial crack lengths. Using damage state probabilities, one straightforward method to estimate trailing edge RUL is determining the cumulative time a particular damage takes to transition from the current damage state to the critical damage state [30]. Eleftheroglou et al. [179]’s probabilistic approach used stochastic modeling combined with SHM strain data for RUL prognosis with good correlation to actual RUL values.

6. Conclusions

The aerospace community has used durability and damage tolerance analysis for more than 50 years, but it is not widely used in the wind turbine blade industry. This paper provided an in-depth review of the application of durability and damage tolerance analysis for life prediction of a wind turbine blade trailing edge to address the gap in the research and literature regarding the trailing edge operational performance and service life. Based on the literature review, concluding remarks include the following:
  • Trailing edge failure is common in both operational and test wind turbine blades, and occurs due to both structural overload and fatigue. Inspection of a limited set of operational blades indicates a variety of trailing edge cracks associated with fatigue. Various laboratory tests have confirmed trailing edge cracking and buckling failure due to ultimate and fatigue-loading conditions.
  • Blade fatigue testing does not properly represent cyclic gravitational loads. Design standards only require single-axis fatigue testing to address flapwise loading. With dual-axis fatigue testing, edgewise loads attempt to include cyclic gravitational loads but fail to address the full impact of the breathing effect on the trailing edge.
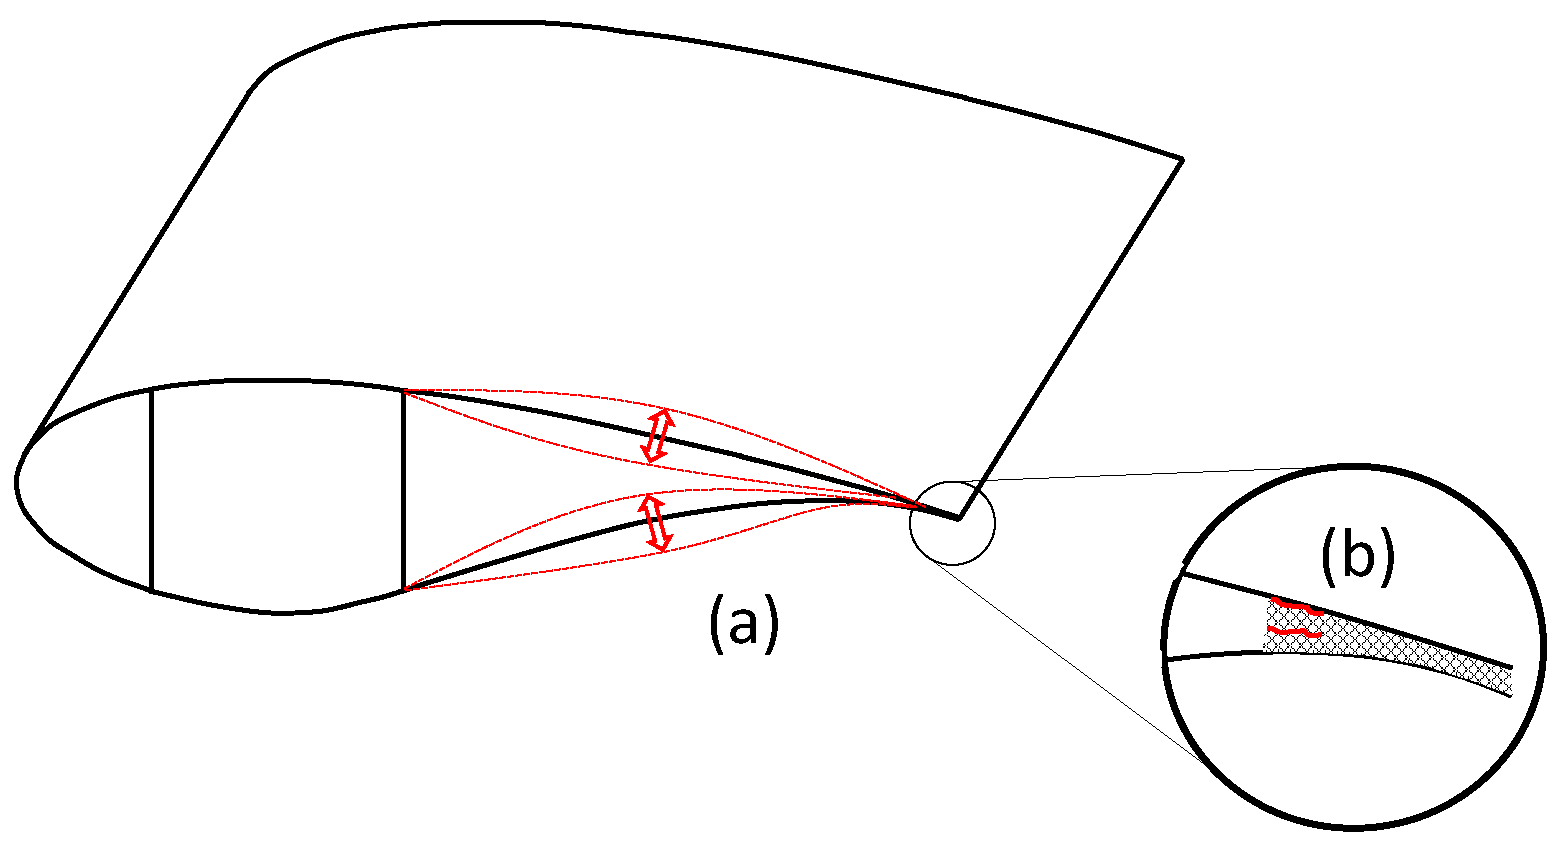
  • Gravitational loads cause trailing edge panel breathing. Wind turbine blade breathing eigenmodes have been reported in modal testing but have not correlated well to numerical simulations. Additionally, opening or breathing of trailing edge panels has clearly been reported and attributed to gravitational and torsional loading in various full-scale and subcomponent tests.
  • Gravitational loads increase faster than aerodynamic loads with larger blade lengths, possibly leading to higher trailing edge failure rates. Basic scaling laws indicate that gravitational loads increase proportionally with the cube of the blade length, while aerodynamic loads increase with the square of the blade length. While the impact of gravitational loads can be reduced by optimizing the blade design to include carbon fiber in place of glass fiber, gravitational loads still increase more rapidly than aerodynamic loads and thereby will contribute to more trailing edge failures.
  • Composite material properties are process-specific and must be determined for each intended design application. There are two major databases reporting composite fatigue material properties, but the results show differences. Design-specific material properties are dependent on the manufacturing process and sensitive to items such as postcure temperature.
  • Three-dimensional modeling of full wind turbine blades is necessary to capture trailing edge buckling but two-dimensional cross-sectional modeling may be sufficient for trailing edge DADTA life prediction. Research has shown that the buckling of the trailing edge due to edgewise compressive loads can only be predicted using a 3D blade model but can be computationally expensive. A 2D subcomponent model can be used to properly represent the trailing edge constituents and obtain realistic responses, including the breathing effect. Therefore, the 2D model can examine the cyclic loading of the trailing edge joint and the resulting peel stresses necessary for a life prediction using DADTA.
  • Durability analysis of Miner’s cumulative damage summation to unity should be used with caution for composite structures. Miner’s summation traditionally uses 1.0 as the cumulative damage limit, but research shows variance between composite blade materials that may lead to overly optimistic life predictions.
  • The IEC wind turbine design standard relies on durability analysis life prediction and does not address the use of damage tolerance life prediction. While also including durability analysis, the DNV blade design standard additionally discusses, but does not mandate, use of damage tolerance analysis for life prediction.
  • Damage tolerance analysis numerical modeling of composite structures using linear and nonlinear fracture mechanics is challenging due to complexities in composite material structures. The aerospace community has a long history of using damage tolerance analysis and has developed a deep understanding of metallic structures, but composite materials are more complex, with additional concerns at both the micro- and macrostructural levels.
In summary, proper representation of all design loads, including gravitational loads in a thorough DADTA, holds the promise to improve life prediction methodologies and the potential to ensure that wind turbine blade trailing edges meet or even exceed the required design life.

7. Future Work

While the literature contains significant research in both breadth and depth for various aspects of composite materials, wind turbine blades, and, more specifically, trailing edges, more work is needed. Most literature focuses on flapwise extreme loading as the design driver for the wind turbine blade trailing edge, with little specific discussion on the contribution of the edgewise cyclic gravitational fatigue loading to design life prediction. Specific recommendations for future work include:
  • Conducting a case study of DATDA effectiveness for an operational wind turbine blade. While case studies exist for the application of DADTA in the aerospace community, the literature does not include any DADTA case studies involving an operational wind turbine blade. Such a case study of an operational wind turbine blade will require participation from a wind turbine blade manufacturer and a wind turbine operator.
  • Investigating the variance within the use of Miner’s accumulated damage value. The generally accepted use of a Miner’s accumulated damage value of 1.0 needs to be examined for wind turbine blade materials. An analysis of coupon tests has shown that using the value of 1.0 may be overly optimistic for some blade materials but not for others. Additional research is needed to examine the inconsistencies between materials and recommend appropriate accumulated damage values for use in the wind turbine blade industry.
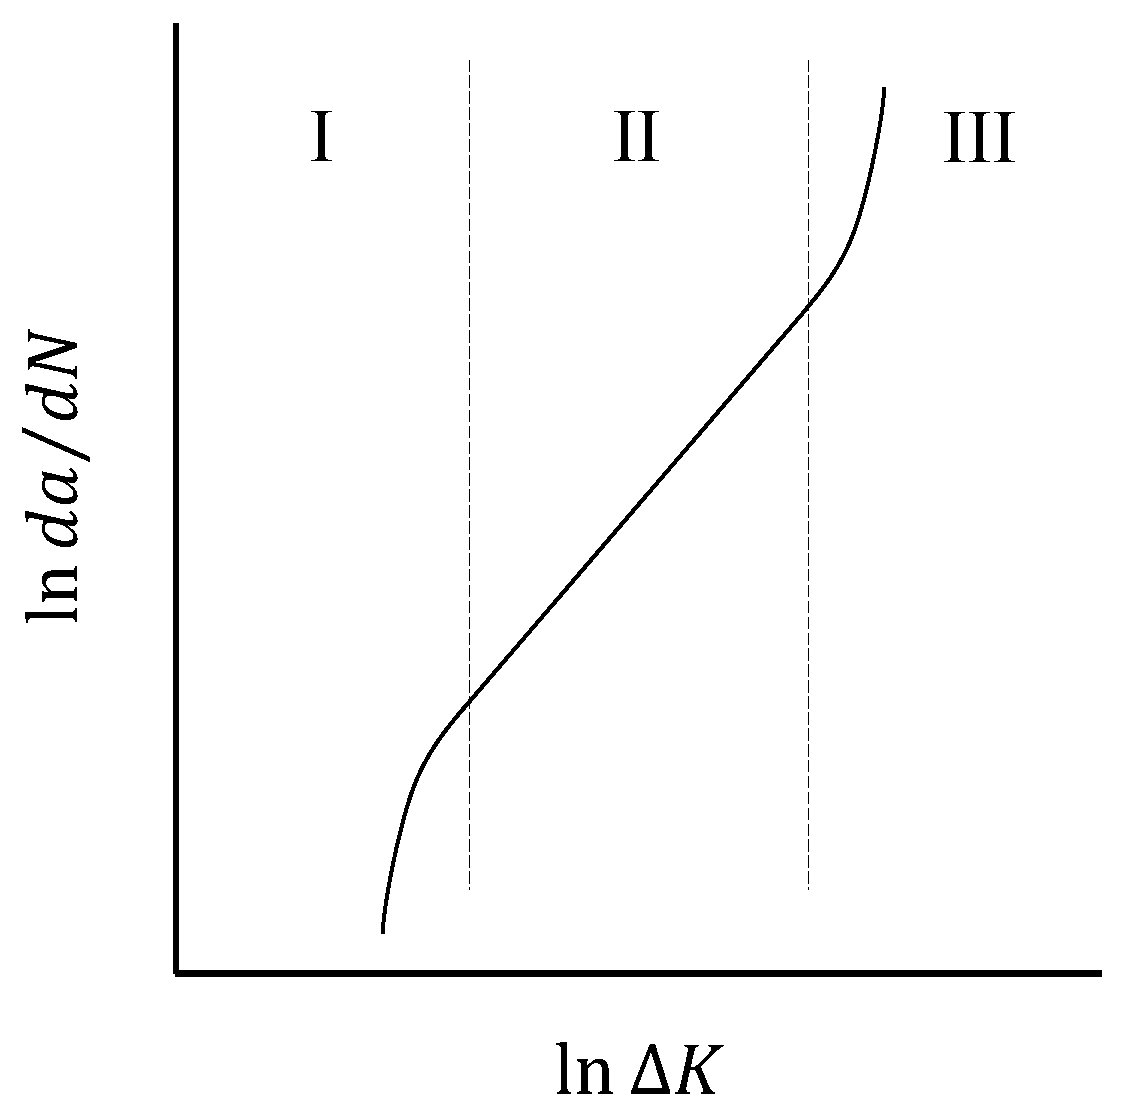
  • Increasing basic knowledge of fracture mechanics properties for wind turbine blade materials. The use of damage tolerance analysis for wind turbine blades is still considered a novel approach and requires additional foundational material characterization. Early investigations have focused on possible numerical approaches such as cohesive zone modeling and virtual crack closing techniques to predict properties but additional experimental research is needed for fracture mechanics material characterization of all blade materials to increase basic knowledge of properties such as SERR, crack resistance, and fracture toughness for a range of blade loading conditions, including various stress ratios.
  • Improving the overall technology readiness level of CM and remote SHM systems. Research has been conducted for a wide range of possible sensors and has been investigated in the laboratory environment, achieving TRL 4. While successful for the initial two steps of determining the existence and location of the damage, most sensors cannot reliably conduct the last two steps to quantify the damage by type and severity fully. Therefore, the choice of sensors is difficult but can be tailored for different blade components, such as trailing edge joints and spar caps. Additional research is required to demonstrate CM and SHM concepts in the operational environment (TRL 7) with the goal of developing and qualifying commercial CM and SHM systems (TRL 8).
  • Investigating the manufacturing and operational impact of embedded sensor systems for trailing edge adhesive joint damage identification and quantification. While CM and SHM concepts are promising to reduce overall wind turbine blade operations and maintenance costs, specific impacts to blade manufacturing processes and operational procedures have not been addressed. Additional research is needed to quantify and qualify the manufacturing and operational impact of embedded blade sensors.
  • Reporting operational blade damage to inform research plans. Due to proprietary concerns, most operational wind turbine blade damage is not openly reported by manufacturers and system operators. This lack of reporting directly hinders the ability of the scientific community to address potential blade industry research needs adequately. Researchers must encourage wind turbine manufacturers and operators to publish blade damage inspection results.
  • Modeling, predicting, and validating the breathing effect on the wind turbine blade trailing edge during design loading conditions (DLCs), including power production, start-up, shutdown, and parked (idling) operations. To date, wind turbine blade modal test results have not correlated well with numerical analysis. Additional research is needed to investigate this discrepancy using numerical analysis and experimental testing to validate the breathing effect on the trailing edge.
  • Investigating the wind turbine blade trailing edge breathing effect on durability and damage tolerance life prediction. Current wind turbine blade fatigue testing does not account for dynamic cyclic gravitational loads, and therefore provides a possibly overly optimistic life prediction. Existing durability analysis has included gravitational loads but only in combined load cases. While some efforts have been made to examine damage tolerance remaining useful life prediction, more work is needed. Additional research is needed to isolate the breathing effect on the trailing edge durability and damage tolerance life prediction due to gravitational versus aerodynamic loads.
  • Investigating mitigation techniques to minimize adverse impacts of the wind turbine trailing edge breathing effect. Research has been conducted to examine design improvements to mitigate trailing edge cyclic compressive load failures, but has not included trailing edge breathing due to cyclic gravitational loads. Additional research is needed to examine structural failures due to the breathing effect and to determine possible trailing edge design mitigation techniques.

Author Contributions

Conceptualization, P.D.M. and A.S.V.; formal analysis, P.D.M.; funding acquisition, A.S.V.; methodology, P.D.M. and A.S.V.; project administration, P.D.M. and A.S.V.; supervision, A.S.V.; writing—original draft, P.D.M.; writing—review and editing, P.D.M. and A.S.V. All authors have read and agreed to the published version of the manuscript.

Funding

This research received no external funding.

Data Availability Statement

Data are contained within the article.

Acknowledgments

This work is mainly supported by start-up funds from the Office of the Vice President for Research and Dean of the Graduate School, University of Maine. This research received no specific grant from funding agencies in the public, commercial, or not-for-profit sectors.

Conflicts of Interest

The authors declare no conflict of interest.

References

  1. Sheng, S. Report on Wind Turbine Subsystem Reliability—A Survey of Various Databases (Presentation); Technical Report NREL/PR-5000-59111; National Renewable Energy Laboratory: Golden, CO, USA, 2013. [Google Scholar]
  2. Haselbach, P.U. Ultimate Strength of Wind Turbine Blades under Multiaxial Loading. Ph.D. Thesis, Technical University of Denmark, Department of Wind Energy, Roskilde, Denmark, 2015. [Google Scholar]
  3. Haselbach, P.U.; Branner, K. Initiation of trailing edge failure in full-scale wind turbine blade test. Eng. Fract. Mech. 2016, 162, 136–154. [Google Scholar] [CrossRef]
  4. Chou, J.S.; Chiu, C.K.; Huang, I.K.; Chi, K.N. Failure analysis of wind turbine blade under critical wind loads. Eng. Fail. Anal. 2013, 27, 99–118. [Google Scholar] [CrossRef]
  5. Reder, M.D.; Gonzalez, E.; Melero, J.J. Wind turbine failures-tackling current problems in failure data analysis. J. Phys. Conf. Ser. 2016, 753, 072027. [Google Scholar] [CrossRef]
  6. Rafiee, R.; Hashemi-Taheri, M.R. Failure analysis of a composite wind turbine blade at the adhesive joint of the trailing edge. Eng. Fail. Anal. 2021, 121, 105148. [Google Scholar] [CrossRef]
  7. IEC. Wind Turbines—Part 1: Design Requirements; Technical Report IEC 61400-1; International Electrotechnical Commission: Geneva, Switzerland, 2005. [Google Scholar]
  8. ISO 2394:2015; General Principles on Reliability for Structures. International Standard: Geneva, Switzerland, 2015.
  9. Jacques, D. Sustaining Systems Engineering: The A-10 Example; Center for Systems Engineering Case Studies, Air Force Institute of Technology: Wright-Patterson AFB, OH, USA, 2008; pp. 1–20. [Google Scholar]
  10. Transport Airplane Directorate. Damage Tolerance and Fatigue Evaluation of Structure; Technical Report AC-25.571-1D; Federal Aviation Administration: Washington, DC, USA, 2011. [Google Scholar]
  11. Engineering & Force Management Division. Aircraft Structural Integrity Program and Air And Space Equipment Structural Management; Technical Report DAFI 63-140; Department of the Air Force: Washington, DC, USA, 2020. [Google Scholar]
  12. Engineering Directorate. Aircraft Structural Integrity Program (ASIP); Technical Report MIL-STD-1530D; Air Force Life Cycle Management Center: Wright-Patterson AFB, OH, USA, 2016. [Google Scholar]
  13. Ransom, J.; Glaessgen, E.; Raju, I.; Harris, C. Recent advances in durability and damage tolerance methodology at NASA Langley Research Center. In Proceedings of the 48th AIAA/ASME/ASCE/AHS/ASC Structures, Structural Dynamics and Materials Conference, Honolulu, HI, USA, 23–26 April 2007; p. 2377. [Google Scholar]
  14. Harris, C.E. Advanced Durability and Damage Tolerance Design and Analysis Methods for Composite Structures: Lessons Learned from NASA Technology Development Programs; Technical Report NASA/TM-2003-212420; Langley Research Center, National Aeronautics and Space Administration: Hampton, VA, USA, 2003. [Google Scholar]
  15. Jacques, D.; Strouble, D. A-10 Thunderbolt II (Warthog) Systems Engineering Case Study; Technical Report AFIT/SY; Center for Systems Engineering Case Studies, Air Force Institute of Technology: Wright-Patterson AFB, OH, USA, 2008. [Google Scholar]
  16. Lin, J. Durability and damage tolerance analysis methods for lightweight aircraft structures: Review and prospects. Int. J. Lightweight Mater. Manuf. 2022, 5, 224–250. [Google Scholar] [CrossRef]
  17. DVN. Rotor Blades for Wind Turbines; Technical Report DNVGL-ST-0376; Det Norske Veritas (DVN): Oslo, Norway, 2015. [Google Scholar]
  18. Burton, T.L.; Jenkins, N.; Bossanyi, E.; Sharpe, D.; Graham, M. Wind Energy Handbook; John Wiley & Sons: Hoboken, NJ, USA, 2021. [Google Scholar]
  19. Hayman, B. Approaches to damage assessment and damage tolerance for FRP sandwich structures. J. Sandw. Struct. Mater. 2007, 9, 571–596. [Google Scholar] [CrossRef]
  20. Lusty, A.F.; Cairns, D.A. Alternative Damage Tolerant Materials for Wind Turbine Blades: An Overview; Technical Report SAND2021-12461; Montana State University, Sandia National Lab: Albuquerque, NM, USA, 2021. [Google Scholar]
  21. Padmaja, R.K.; Bhargav, Y.; Subramanya, S. Fatigue and Damage Tolerance Analysis of Aircraft Structural Components; Technical Report; Cyient: East Hartford, CT, USA, 2017. [Google Scholar]
  22. Ataya, S.; Ahmed, M.M. Damages of wind turbine blade trailing edge: Forms, location, and root causes. Eng. Fail. Anal. 2013, 35, 480–488. [Google Scholar] [CrossRef]
  23. IEC. Wind Turbines—Part 23: Full-Scale Structural Testing of Rotor Blades; Technical Report IEC 61400-23; International Electrotechnical Commission: Geneva, Switzerland, 2014. [Google Scholar]
  24. Haselbach, P.U.; Branner, K. Effect of trailing edge damage on full-scale wind turbine blade failure. In Proceedings of the 20th International Conference on Composite Materials, Copenhagen, Danemark, 19–24 July 2015; pp. 19–24. [Google Scholar]
  25. Zhou, H.; Dou, H.; Qin, L.; Chen, Y.; Ni, Y.; Ko, J. A review of full-scale structural testing of wind turbine blades. Renew. Sustain. Energy Rev. 2014, 33, 177–187. [Google Scholar] [CrossRef]
  26. Chen, X.; Semenov, S.; McGugan, M.; Madsen, S.H.; Yeniceli, S.C.; Berring, P.; Branner, K. Fatigue testing of a 14.3 m composite blade embedded with artificial defects–damage growth and structural health monitoring. Compos. Part Appl. Sci. Manuf. 2021, 140, 106189. [Google Scholar] [CrossRef]
  27. Eder, M.A.; Branner, K.; Berring, P.; Belloni, F.; Toft, H.S.; Sørensen, J.D.; Corre, A.; Lindby, T.; Quispitupa, A.; Petersen, T.K. Experimental Blade Research: Phase 2; Technical Report E-0083; DTU Wind Energy, Technical University of Denmark: Roskilde, Denmark, 2015. [Google Scholar]
  28. Jørgensen, J. Adhesive Joints in Wind Turbine Blades. Ph.D. Thesis, Technical University of Denmark, Department of Wind Energy, Roskilde, Denmark, 2017. [Google Scholar]
  29. Mishnaevsky, L., Jr. Root causes and mechanisms of failure of wind turbine blades: Overview. Materials 2022, 15, 2959. [Google Scholar] [CrossRef]
  30. Nielsen, J.S.; Sørensen, J.D. Bayesian estimation of remaining useful life for wind turbine blades. Energies 2017, 10, 664. [Google Scholar] [CrossRef]
  31. Haselbach, P.U.; Eder, M.A.; Belloni, F. A comprehensive investigation of trailing edge damage in a wind turbine rotor blade. Wind Energy 2016, 19, 1871–1888. [Google Scholar] [CrossRef]
  32. Wu, H.; Qi, L.; Qian, J.; Cao, H.; Shi, K.; Xu, J. Experimental research on the compression failure of wind turbine blade trailing edge structure. J. Adhes. 2023, 99, 1488–1507. [Google Scholar] [CrossRef]
  33. Miao, X.Y.; Chen, X.; Lu, R.; Eder, M.A. Multi-site crack initiation in local details of composite adhesive joints. Compos. Part B Eng. 2022, 242, 110055. [Google Scholar] [CrossRef]
  34. Branner, K.; Berring, P.; Haselbach, P.U. Subcomponent testing of trailing edge panels in wind turbine blades. In Proceedings of the 17th European Conference on Composite Materials, Munich, Germany, 26–30 June 2016; pp. 26–30. [Google Scholar]
  35. Ghasemnejad, H.; Occhineri, L.; Swift-Hook, D. Post-buckling failure in multi-delaminated composite wind turbine blade materials. Mater. Des. 2011, 32, 5106–5112. [Google Scholar] [CrossRef]
  36. Chen, X. Experimental observation of fatigue degradation in a composite wind turbine blade. Compos. Struct. 2019, 212, 547–551. [Google Scholar] [CrossRef]
  37. Rosemeier, M.; Melcher, D.; Krimmer, A.; Wroblewski, W.; Antoniou, A. Validation of crack initiation model by means of cyclic full-scale blade test. J. Phys. Conf. Ser. 2022, 2265, 032045. [Google Scholar] [CrossRef]
  38. Rosemeier, M.; Krimmer, A.; Bardenhagen, A.; Antoniou, A. Tunneling crack initiation in trailing-edge bond lines of wind-turbine blades. AIAA J. 2019, 57, 5462–5474. [Google Scholar] [CrossRef]
  39. Kazacoks, R.; Jamieson, P. Evaluation of fatigue loads of horizontal up-scaled wind turbines. Energy Procedia 2015, 80, 13–20. [Google Scholar] [CrossRef]
  40. Cox, K.; Echtermeyer, A. Effects of composite fiber orientation on wind turbine blade buckling resistance. Wind Energy 2014, 17, 1925–1943. [Google Scholar] [CrossRef]
  41. Bak, C.; Zahle, F.; Bitsche, R.; Kim, T.; Yde, A.; Henriksen, L.C.; Natarajan, A.; Hansen, M.H. Description of the DTU 10 MW Reference Wind Turbine; Technical Report I-0092; DTU Wind Energy, Technical University of Denmark: Roskilde, Denmark, 2013. [Google Scholar]
  42. Fingersh, L.; Hand, M.; Laxson, A. Wind Turbine Design Cost and Scaling Model; Technical Report NREL/TP-500-40566; National Renewable Energy Laboratory: Golden, CO, USA, 2006. [Google Scholar]
  43. Loth, E.; Griffith, D.; Kaminski, M.; Qin, C.; Fingersh, L.J. Gravo-Aeroelastic Scaling for Extreme-Scale Wind Turbines; Technical Report SAND2017-5555C; Sandia National Laboratory: Albuquerque, NM, USA, 2017. [Google Scholar]
  44. Nettles, A.T. Allowables for structural composites. In Proceedings of the International Conference on Composites Engineering, Hilton Head, SC, USA, 8 August 2004; pp. 1–2. [Google Scholar]
  45. Sørensen, B.F.; Holmes, J.W.; Brøndsted, P.; Branner, K. Blade materials, testing methods and structural design. In Wind Power Generation and Wind Turbine Design; WIT Press: Southampton, UK, 2010; pp. 417–466. [Google Scholar]
  46. Ronold, K.O.; Echtermeyer, A.T. Estimation of fatigue curves for design of composite laminates. Compos. Part Appl. Sci. Manuf. 1996, 27, 485–491. [Google Scholar] [CrossRef]
  47. Ronold, K.O.; Echtermeyer, A.T. Using Tolerance Bounds for Estimation of Characteristic Fatigue Curves for Composites with Confidence. Safety 2021, 8, 1. [Google Scholar] [CrossRef]
  48. Chen, C.; Li, H.; Wang, T.; Wang, L. Influence of Structural Configurations on the Shear Fatigue Damage of the Blade Trailing-Edge Adhesive Joint. Appl. Sci. 2020, 10, 2715. [Google Scholar] [CrossRef]
  49. Mandell, J.F.; Samborsky, D.D. DOE/MSU Composite Material Fatigue Database: Test Methods, Materials, and Analysis; Technical Report SAND97-3002; Montana State University, Sandia National Lab: Albuquerque, NM, USA, 1997. [Google Scholar]
  50. Vallons, K. Databases for fatigue analysis in composite materials. In Fatigue of Textile Composites; Elsevier: Amsterdam, The Netherlands, 2015; pp. 75–82. [Google Scholar]
  51. De Smet, B.; Bach, P.W. Database FACT: Fatigue of Composites for Wind Turbines; Technical Report ECN-C-94-045; Energy Research Centre of the Netherlands: Petten, The Netherlands, 1994. [Google Scholar]
  52. Mandell, J.F.; Samborsky, D.D.; Sutherland, H.J. Effects of Materials Parameters and Design Details on the Fatigue of Composite Materials for Wind Turbine Blades; Technical Report SAND98-1997C; Sandia National Lab: Albuquerque, NM, USA, 1999. [Google Scholar]
  53. Zarouchas, D.; Nijssen, R. Mechanical behaviour of thick structural adhesives in wind turbine blades under multi-axial loading. J. Adhes. Sci. Technol. 2016, 30, 1413–1429. [Google Scholar] [CrossRef]
  54. Chen, X.; Eder, M.A. A critical review of damage and failure of composite wind turbine blade structures. In Proceedings of the IOP Conference Series: Materials Science and Engineering, 41st Risø International Symposium on Materials Science, Roskilde, Denmark, 7–10 September 2020; IOP Publishing: Bristol, UK, 2020; Volume 942, p. 012001. [Google Scholar]
  55. Jørgensen, J.B.; Sørensen, B.F.; Kildegaard, C. The effect of residual stresses on the formation of transverse cracks in adhesive joints for wind turbine blades. Int. J. Solids Struct. 2019, 163, 139–156. [Google Scholar] [CrossRef]
  56. ASTM. Standard Practice for Classifying Failure Modes in Fiber-Reinforced-Plastic (FRP) Joints; Technical Report D5573-99; American Society for Testing and Materials (ASTM): West Conshohocken, PA, USA, 2012. [Google Scholar]
  57. Haselbach, P.U.; Chen, X.; Berring, P. Place smart, load hard-structural reinforcement of the trailing edge regions of a wind turbine blade strengthening the buckling resistance. Compos. Struct. 2022, 300, 116068. [Google Scholar] [CrossRef]
  58. Wang, J.; Zhang, L.; Huang, X.; Zhang, J.; Yuan, C. Initiation mechanism of transverse cracks in wind turbine blade trailing edge. Energy Eng. 2022, 119, 407–418. [Google Scholar] [CrossRef]
  59. Jørgensen, J.B.; Sørensen, B.F.; Kildegaard, C. Tunneling cracks in full scale wind turbine blade joints. Eng. Fract. Mech. 2018, 189, 361–376. [Google Scholar] [CrossRef]
  60. Gundlach, J.; Govers, Y. Experimental modal analysis of aeroelastic tailored rotor blades in different boundary conditions. J. Phys. Conf. Ser. 2019, 1356, 012023. [Google Scholar] [CrossRef]
  61. Foulds, D. Validation of Breathing Modes in Wind Turbine Blade Finite Element Models. Master’s Thesis, Delft University of Technology, Delft, The Netherlands, 2021. [Google Scholar]
  62. Eder, M.A.; Bitsche, R.; Belloni, F. Effects of geometric non-linearity on energy release rates in a realistic wind turbine blade cross section. Compos. Struct. 2015, 132, 1075–1084. [Google Scholar] [CrossRef]
  63. Eder, M.A.; Bitsche, R. A qualitative analytical investigation of geometrically nonlinear effects in wind turbine blade cross sections. Thin-Walled Struct. 2015, 93, 1–9. [Google Scholar] [CrossRef]
  64. Chen, X.; Berring, P.; Madsen, S.H.; Branner, K.; Semenov, S. Understanding progressive failure mechanisms of a wind turbine blade trailing edge section through subcomponent tests and nonlinear FE analysis. Compos. Struct. 2019, 214, 422–438. [Google Scholar] [CrossRef]
  65. Chen, X.; Haselbach, P.U.; Branner, K.; Madsen, S.H. Effects of different material failures and surface contact on structural response of trailing edge sections in composite wind turbine blades. Compos. Struct. 2019, 226, 111306. [Google Scholar] [CrossRef]
  66. Sayer, F.; Antoniou, A.; van Wingerde, A. Investigation of structural bond lines in wind turbine blades by sub-component tests. Int. J. Adhes. Adhes. 2012, 37, 129–135. [Google Scholar] [CrossRef]
  67. Verma, A.S.; Vedvik, N.P.; Gao, Z.; Castro, S.G.; Teuwen, J.J. Bondline thickness effects on damage tolerance of adhesive joints subjected to localized impact damages: Application to leading edge of wind turbine blades. Materials 2021, 14, 7526. [Google Scholar] [CrossRef]
  68. Tomblin, J.S.; Yang, C.C.; Harter, P. Investigation of Thick Bondline Adhesive Joints; Technical Report DOT/FAA/AR-01/33; Wichita State University, Federal Aviation Administration, Office of Aviation Research: Washington, DC, USA, 2001. [Google Scholar]
  69. Budhe, S.; Banea, M.; De Barros, S.; Da Silva, L. An updated review of adhesively bonded joints in composite materials. Int. J. Adhes. Adhes. 2017, 72, 30–42. [Google Scholar] [CrossRef]
  70. Eder, M.A.; Bitsche, R.D. Fracture analysis of adhesive joints in wind turbine blades. Wind. Energy 2015, 18, 6. [Google Scholar] [CrossRef]
  71. Sørensen, B.F.; Jacobsen, T.K. Large-scale bridging in composites: R-curves and bridging laws. Compos. Part Appl. Sci. Manuf. 1998, 29, 1443–1451. [Google Scholar] [CrossRef]
  72. Sørensen, B.F.; Gamstedt, E.K.; Østergaard, R.C.; Goutianos, S. Micromechanical model of cross-over fibre bridging–Prediction of mixed mode bridging laws. Mech. Mater. 2008, 40, 220–234. [Google Scholar] [CrossRef]
  73. Sørensen, B.F.; Goutianos, S.; Jacobsen, T.K. Strength scaling of adhesive joints in polymer–matrix composites. Int. J. Solids Struct. 2009, 46, 741–761. [Google Scholar] [CrossRef]
  74. Dassault Systemes. ABAQUS Finite Element Analysis Software. 2023. Available online: https://www.3ds.com/products-services/simulia/products/abaqus/ (accessed on 18 July 2023).
  75. ANSYS Inc. ANSYS Structural Analysis Software. 2023. Available online: https://www.ansys.com/ (accessed on 18 July 2023).
  76. Berg, J.C.; Resor, B.R. Numerical Manufacturing and Design Tool (NuMAD v2.0) for Wind Turbine Blades: User’s Guide; Technical Report SAND2012-7028; Sandia National Lab: Albuquerque, NM, USA, 2012. [Google Scholar]
  77. Haselbach, P.U. An advanced structural trailing edge modelling method for wind turbine blades. Compos. Struct. 2017, 180, 521–530. [Google Scholar] [CrossRef]
  78. Haselbach, P. Nonlinear Finite Element Analysis of Delamination Growth in Composite Wind Turbine Blades. Master’s Thesis, University Bremen, Bremen, Germany, 2013. [Google Scholar]
  79. Verma, A.S.; Vedvik, N.P.; Haselbach, P.U.; Gao, Z.; Jiang, Z. Comparison of numerical modelling techniques for impact investigation on a wind turbine blade. Compos. Struct. 2019, 209, 856–878. [Google Scholar] [CrossRef]
  80. Eder, M.A.; Bitsche, R.; Nielsen, M.; Branner, K. A practical approach to fracture analysis at the trailing edge of wind turbine rotor blades. Wind Energy 2014, 17, 483–497. [Google Scholar] [CrossRef]
  81. Rosemeier, M.; Gebauer, T.; Antoniou, A. A practical approach for the peel stress prediction in the trailing-edge adhesive joint of wind turbine blades. IOP Conf. Ser. Mater. Sci. Eng. 2020, 942, 012026. [Google Scholar] [CrossRef]
  82. Balzani, C.; Noever-Castelos, P.; Wentingmann, M. Finite Element Analysis and Failure Prediction of Adhesive Joints in Wind Turbine Rotor Blades. In Proceedings of the 6th European Conference on Computational Mechanics, Glasgow, UK, 11–15 June 2018; pp. 1–12. [Google Scholar]
  83. Bitsche, R. Modelling of Wind Turbine Blades with ABAQUS; Composites Seminar; Department of Wind Energy, Technical University of Denmark, DTU Risø Campus: Roskilde, Denmark, 2015; pp. 1–14. [Google Scholar]
  84. Blasques, J.P. User’s Manual for BECAS: A Cross Section Analysis Tool for Anisotropic and Inhomogeneous Beam Sections of Arbitrary Geometry; Technical Report RISØ-R 1785; Risø DTU—National Laboratory for Sustainable Energy, Technical University of Denmark: Roskilde, Denmark, 2012. [Google Scholar]
  85. Shokrieh, M.M.; Rafiee, R. Simulation of fatigue failure in a full composite wind turbine blade. Compos. Struct. 2006, 74, 332–342. [Google Scholar] [CrossRef]
  86. Castro, O.; Lennie, M.; Branner, K.; Pechlivanoglou, G.; Brøndsted, P.; Nayeri, C.N.; Paschereit, C.O. Comparing fatigue life estimations of composite wind turbine blades using different fatigue analysis tools. In Proceedings of the 20th International Conference on Composite Materials, Copenhagen, Danemark, 19–24 July 2015; pp. 19–24. [Google Scholar]
  87. Sayer, F.; Post, N.; Van Wingerde, A.; Busmann, H.; Kleiner, F.; Fleischmann, W.; Gansow, M. Testing of adhesive joints in the wind industry. In Proceedings of the European Wind Energy Conference and Exhibition, Marseille, France, 16–19 March 2009; Volume 2009, pp. 288–315. [Google Scholar]
  88. Sayer, F.; van Wingerde, A.; Busmann, H.; Knops, M.; Windbichler, R.; Kleiner, F.; Trusheim, M.; Henkel, A.; KGaA, C. Development of a new test methodology for adhesive joints in the wind industry. In Proceedings of the European Wind Energy Conference and Exhibition, Warsaw, Poland, 20–23 April 2010; pp. 20–23. [Google Scholar]
  89. Freebury, G.; Musial, W. Determining equivalent damage loading for full-scale wind turbine blade fatigue tests. In Proceedings of the 2000 ASME Wind Energy Symposium, Reno, NV, USA, 10–13 January 2000; p. 50. [Google Scholar]
  90. Rosemeier, M.; Basters, G.; Antoniou, A. Benefits of subcomponent over full-scale blade testing elaborated on a trailing-edge bond line design validation. Wind. Energy Sci. 2018, 3, 163–172. [Google Scholar] [CrossRef]
  91. Lahuerta, F.; Koorn, N.; Smissaert, D. Wind turbine blade trailing edge failure assessment with sub-component test on static and fatigue load conditions. Compos. Struct. 2018, 204, 755–766. [Google Scholar] [CrossRef]
  92. Echtermeyer, A.; Kensche, C.; Bach, P.; Poppen, M.; Lilholt, H.; Andersen, S.; Brøndsted, P. Method to predict fatigue lifetimes of GRP wind turbine blades and comparison with experiments. In Proceedings of the European Union Wind Energy Conference EUWEC’96, Göteborg, Sweden, 20–24 May 1996; FFA TN 1996-36. pp. 72–79. [Google Scholar]
  93. Sutherland, H.J. On the Fatigue Analysis of Wind Turbines; Technical Report SAND99-0089; Sandia National Lab: Albuquerque, NM, USA, 1999. [Google Scholar]
  94. Vassilopoulos, A.P.; Brondsted, P.; Nijssen, R.P. Chapter 8—Fatigue Life Prediction of Wind Turbine Blade Composite Materials. In Advances in Wind Turbine Blade Design and Materials; Woodhead Publishing Limited: Cambridge, UK, 2013; pp. 251–297. [Google Scholar]
  95. Nijssen, R.P.L. Fatigue Life Prediction and Strength Degradation of Wind Turbine Rotor Blade Composites; Technical Report SAND2006-7810P; Delft University of Technology, Sandia National Lab: Albuquerque, NM, USA, 2006. [Google Scholar]
  96. Curley, A.; Hadavinia, H.; Kinloch, A.; Taylor, A. Predicting the service-life of adhesively-bonded joints. Int. J. Fract. 2000, 103, 41–69. [Google Scholar] [CrossRef]
  97. Hu, W.; Choi, K.; Zhupanska, O.; Buchholz, J.H. Integrating variable wind load, aerodynamic, and structural analyses towards accurate fatigue life prediction in composite wind turbine blades. Struct. Multidiscip. Optim. 2016, 53, 375–394. [Google Scholar] [CrossRef]
  98. Ronold, K.O.; Wedel-Heinen, J.; Christensen, C.J. Calibration of partial safety factors for design of wind-turbine rotor blades against fatigue failure in flapwise bending. In Proceedings of the European Union Wind Energy Conference Göteborg, Göteborg, Sweden, 20–24 May 1996; pp. 129–136. [Google Scholar]
  99. McGugan, M.; Pereira, G.; Sørensen, B.F.; Toftegaard, H.; Branner, K. Damage tolerance and structural monitoring for wind turbine blades. Philos. Trans. R. Soc. Math. Phys. Eng. Sci. 2015, 373, 20140077. [Google Scholar] [CrossRef]
  100. Holmes, J.W.; Sørensen, B.F.; Brøndsted, P. Reliability of wind turbine blades: An overview of materials testing. Proc. Wind Power Shanghai 2007, 35, 36. [Google Scholar]
  101. Kong, C.; Kim, T.; Han, D.; Sugiyama, Y. Investigation of fatigue life for a medium scale composite wind turbine blade. Int. J. Fatigue 2006, 28, 1382–1388. [Google Scholar] [CrossRef]
  102. Sutherland, H.; Mandell, J. Optimized Goodman Diagram for the Analysis of Fiberglass Composites Used in Wind Turbine Blades. In Proceedings of the 43rd AIAA Aerospace Sciences Meeting and Exhibit. American Institute of Aeronautics and Astronautics, Reno, NV, USA, 10–13 January 2005; p. 196. [Google Scholar]
  103. Mandell, J.F.; Samborsky, D.D.; Cairns, D. Fatigue of Composite Materials and Substructures for Wind Turbine Blades; Technical Report SAND2002-0771; Montana State University, Sandia National Lab: Albuquerque, NM, USA, 2002. [Google Scholar]
  104. Marin, J.; Barroso, A.; Paris, F.; Canas, J. Study of fatigue damage in wind turbine blades. Eng. Fail. Anal. 2009, 16, 656–668. [Google Scholar] [CrossRef]
  105. Richards, P.W.; Griffith, D.T.; Hodges, D.H. Aeroelastic design of large wind turbine blades considering damage tolerance. Wind Energy 2017, 20, 159–170. [Google Scholar] [CrossRef]
  106. Tawade, S.V.; Todkar, S.B.; Hade, A.S. Fatigue life optimization of wind turbine blade. Int. J. Res. Eng. Technol. 2014, 3, 843–850. [Google Scholar]
  107. Veers, P.; Lange, C.; Winterstein, S. FAROW: A Tool for Fatigue and Reliability of Wind Turbines; Technical Report 930726-3; Sandia National Lab: Albuquerque, NM, USA, 1993. [Google Scholar]
  108. Kong, C.; Bang, J.; Sugiyama, Y. Structural investigation of composite wind turbine blade considering various load cases and fatigue life. Energy 2005, 30, 2101–2114. [Google Scholar] [CrossRef]
  109. Montesano, J.; Chu, H.; Singh, C.V. Development of a physics-based multi-scale progressive damage model for assessing the durability of wind turbine blades. Compos. Struct. 2016, 141, 50–62. [Google Scholar] [CrossRef]
  110. Shokrieh, M.M.; Lessard, L.B. Progressive fatigue damage modeling of composite materials, Part I: Modeling. J. Compos. Mater. 2000, 34, 1056–1080. [Google Scholar] [CrossRef]
  111. Shokrieh, M.M.; Lessard, L.B. Progressive fatigue damage modeling of composite materials, Part II: Material characterization and model verification. J. Compos. Mater. 2000, 34, 1081–1116. [Google Scholar] [CrossRef]
  112. Wahl, N.; Samborsky, D.; Mandell, J.; Cairns, D. Spectrum fatigue lifetime and residual strength for fiberglass laminates in tension. In Proceedings of the 20th 2001 ASME Wind Energy Symposium, Reno, NV, USA, 11–14 January 2001; p. 25. [Google Scholar]
  113. Abumeri, G.; Abdi, F. Advanced Composite Wind Turbine Blade Design Based on Durability and Damage Tolerance; Technical Report; AlphaSTAR Corporation: Long Beach, CA, USA, 2012. [Google Scholar]
  114. Noda, M.; Flay, R. A simulation model for wind turbine blade fatigue loads. J. Wind Eng. Ind. Aerodyn. 1999, 83, 527–540. [Google Scholar] [CrossRef]
  115. Castelos, P.N.; Balzani, C. The impact of geometric non-linearities on the fatigue analysis of trailing edge bond lines in wind turbine rotor blades. J. Phys. Conf. Ser. 2016, 749, 012009. [Google Scholar] [CrossRef]
  116. Kensche, C.W. Fatigue of composites for wind turbines. Int. J. Fatigue 2006, 28, 1363–1374. [Google Scholar] [CrossRef]
  117. Fan, X.; Sun, Q.; Kikuchi, M. Review of damage tolerant analysis of laminated composites. J. Solid Mech. 2010, 2, 275–289. [Google Scholar]
  118. Turon Travesa, A. Simulation of Delamination in Composites under Quasi-Static and Fatigue Loading Using Cohesive Zone Models. Ph.D. Thesis, Universitat de Girona, Girona, Spain, 2006. [Google Scholar]
  119. Mishnaevsky, L., Jr.; Branner, K.; Petersen, H.N.; Beauson, J.; McGugan, M.; Sørensen, B.F. Materials for wind turbine blades: An overview. Materials 2017, 10, 1285. [Google Scholar] [CrossRef]
  120. Höyland, J. Challenges for Large Wind Turbine Blades. Ph.D. Thesis, Norwegian University of Science and Technology, Department of Engineering Design and Materials, Trondheim, Norway, 2010. [Google Scholar]
  121. Baharvand, A. FEM Analysis of a Mode III Fracture Mechanics Test Specimens for Cohesive Law Determination of Fibre Composite. Master’s Thesis, Delft University of Technology, Delft, The Netherlands, 2018. [Google Scholar]
  122. Sørensen, B.F.; Horsewell, A.; Jørgensen, O.; Kumar, A.N.; Engbæk, P. Fracture resistance measurement method for in situ observation of crack mechanisms. J. Am. Ceram. Soc. 1998, 81, 661–669. [Google Scholar] [CrossRef]
  123. Jørgensen, J.; Thouless, M.; Sørensen, B.F.; Kildegaard, C. Determination of mode-I cohesive strength for interfaces. IOP Conf. Ser. Mater. Sci. Eng. 2016, 139, 012025. [Google Scholar] [CrossRef]
  124. Ji, Y.M.; Han, K. Fracture mechanics approach for failure of adhesive joints in wind turbine blades. Renew. Energy 2014, 65, 23–28. [Google Scholar] [CrossRef]
  125. Hua, Y.; Kasavajhala, A.R.M.; Gu, L. Elastic–plastic analysis and strength evaluation of adhesive joints in wind turbine blades. Compos. Part B Eng. 2013, 44, 650–656. [Google Scholar] [CrossRef]
  126. Richards, P.W.; Griffith, D.; Hodges, D.H. Operating Strategies and Design Recommendations for Mitigating Local Damage Effects in Offshore Turbine Blades; Technical Report; Sandia National Lab. (SNL-NM): Albuquerque, NM, USA, 2014. [Google Scholar]
  127. Sørensen, B.F.; Kirkegaard, P. Determination of mixed mode cohesive laws. Eng. Fract. Mech. 2006, 73, 2642–2661. [Google Scholar] [CrossRef]
  128. Sørensen, B.F.; Jørgensen, K.; Jacobsen, T.K.; Østergaard, R.C. DCB-specimen loaded with uneven bending moments. Int. J. Fract. 2006, 141, 163–176. [Google Scholar] [CrossRef]
  129. Samborsky, D.; Sears, A.; Mandell, J.; Agastra, P. Mixed mode static and fatigue crack growth in wind blade paste adhesives. In Proceedings of the 52nd AIAA/ASME/ASCE/AHS/ASC Structures, Structural Dynamics and Materials Conference 19th AIAA/ASME/AHS Adaptive Structures Conference, Denver, CO, USA, 4–7 April 2011; p. 1755. [Google Scholar]
  130. Azari, S.; Papini, M.; Schroeder, J.; Spelt, J. Fatigue threshold behavior of adhesive joints. Int. J. Adhes. Adhes. 2010, 30, 145–159. [Google Scholar] [CrossRef]
  131. Kanchanomai, C.; Rattananon, S. Effects of loading rate and thickness on mixed-mode I/II fracture toughness of thermoset epoxy resin. J. Appl. Polym. Sci. 2008, 109, 2408–2416. [Google Scholar] [CrossRef]
  132. Sørensen, B.F. Cohesive law and notch sensitivity of adhesive joints. Acta Mater. 2002, 50, 1053–1061. [Google Scholar] [CrossRef]
  133. Sørensen, B.F.; Jacobsen, T.K. Joining structural parts of composite materials for large rotorblades. In Proceedings of the 27th Risø International Symposium on Materials Science, Polymer Composite Materials for Wind Power Turbines; Lilholt, H., Madsen, B., Andersen, T.L., Mikkelsen, L.P., Thygesen, A., Eds.; Risø National Laboratory: Roskilde, Denmark, 2006; pp. 69–82. [Google Scholar]
  134. Sørensen, B.F. Cohesive Laws for Assessment of Materials Failure: Theory, Experimental Methods and Application. Ph.D. Thesis, Technical University of Denmark, Risø DTU-National Laboratory for Sustainable Energy, Roskilde, Denmark, 2010. [Google Scholar]
  135. Sørensen, B.F.; Jacobsen, T.K. Characterizing delamination of fibre composites by mixed mode cohesive laws. Compos. Sci. Technol. 2009, 69, 445–456. [Google Scholar] [CrossRef]
  136. Krueger, R. Virtual crack closure technique: History, approach, and applications. Appl. Mech. Rev. 2004, 57, 109–143. [Google Scholar] [CrossRef]
  137. Jørgensen, J.B.; Sørensen, B.F.; Kildegaard, C. The effect of buffer-layer on the steady-state energy release rate of a tunneling crack in a wind turbine blade joint. Compos. Struct. 2018, 188, 64–71. [Google Scholar] [CrossRef]
  138. Álvarez, D.; Blackman, B.; Guild, F.; Kinloch, A. Mode I fracture in adhesively-bonded joints: A mesh-size independent modelling approach using cohesive elements. Eng. Fract. Mech. 2014, 115, 73–95. [Google Scholar] [CrossRef]
  139. Lee, M.; Yeo, E.; Blacklock, M.; Janardhana, M.; Feih, S.; Wang, C.H. Predicting the strength of adhesively bonded joints of variable thickness using a cohesive element approach. Int. J. Adhes. Adhes. 2015, 58, 44–52. [Google Scholar] [CrossRef]
  140. Huang, Y.; Bu, Y.; Zhou, L.; Zhu, J.; Shi, H.; Xie, H.; Feng, X. Fatigue crack growth and propagation along the adhesive interface between fiber-reinforced composites. Eng. Fract. Mech. 2013, 110, 290–299. [Google Scholar] [CrossRef]
  141. Kanchanomai, C.; Thammaruechuc, A. Effects of stress ratio on fatigue crack growth of thermoset epoxy resin. Polym. Degrad. Stab. 2009, 94, 1772–1778. [Google Scholar] [CrossRef]
  142. Jørgensen, J.B.; Kildegaard, C.; Sørensen, B.F. Design of four-point SENB specimens with stable crack growth. Eng. Fract. Mech. 2018, 191, 168–186. [Google Scholar] [CrossRef]
  143. Jacobsen, T.; Sørensen, B.F. Mode I intra-laminar crack growth in composites—modelling of R-curves from measured bridging laws. Compos. Part Appl. Sci. Manuf. 2001, 32, 1–11. [Google Scholar] [CrossRef]
  144. Sørensen, B.F.; Gamstedt, E.K.; Jacobsen, T.K. Equivalence of J integral and stress intensity factor approaches for large scale bridging problems. Int. J. Fract. 2000, 104, 31–36. [Google Scholar] [CrossRef]
  145. Federal Aviation Administration. Volume I: Introduction Fracture Mechanics. Fatigue Crack Propagation; Technical Report CT-93/69.I; US Department of Transportation, Research and Special Programs Administration, Volpe National Transportation System Center: Cambridge, MA, USA, 1993. [Google Scholar]
  146. Forman, R.; Shivakumar, V.; Cardinal, J.; Williams, L.; McKeighan, P. Fatigue Crack Growth Database for Damage Tolerance Analysis; Technical Report DOT/FAA/AR-05/15; US Department of Transportation, Federal Aviation Administration, Office of Aviation Research: Washington, DC, USA, 2005. [Google Scholar]
  147. Groves, R. 3.12 Inspection and Monitoring of Composite Aircraft Structures. In Reference Module in Materials Science and Materials Engineering: Comprehensive Composite Materials II; Elservier: Amsterdam, The Netherlands, 2018; pp. 300–311. [Google Scholar]
  148. Paquette, J.A.; Abnumeri, G.; Abdi, F. Durability and Reliability of Wind Turbine Composite Blades Using Robust Design Approach; Technical Report SAND2011-1916C; Sandia National Lab: Albuquerque, NM, USA, 2011. [Google Scholar]
  149. Valeti, B.; Pakzad, S.N. Estimation of remaining useful life of a fatigue damaged wind turbine blade with particle filters. In Dynamics of Civil Structures, Volume 2: Proceedings of the 36th IMAC, A Conference and Exposition on Structural Dynamics 2018; Springer International Publishing: Cham, Switzerland, 2019; pp. 319–328. [Google Scholar]
  150. Liu, M.; Gan, Y.; Hanaor, D.A.; Liu, B.; Chen, C. An improved semi-analytical solution for stress at round-tip notches. Eng. Fract. Mech. 2015, 149, 134–143. [Google Scholar] [CrossRef]
  151. Skinn, D.; Gallagher, J.P.; Berens, A.P.; Huber, P.; Smith, J. Damage Tolerant Design Handbook; Technical Report WL-TR-94-4054; Wright Laboratory, University of Dayton Research Institute: Dayton, OH, USA, 1994; Volume 3, Chapter 7. [Google Scholar]
  152. Anderson, B.; Hsu, C.; Carr, P.; Lo, J.; Yu, J.; Duong, C. Evaluation and Verification of Advanced Methods to Assess Multiple-Site Damage of Aircraft Structure; Technical Report DOT/FAA/AR-04/42 I; US Department of Transportation, Federal Aviation Administration, Office of Aviation Research: Washington, DC, USA, 2004. [Google Scholar]
  153. Boyd, K.; Jansen, D.; Krishnan, S.; Harter, J. Structural Integrity Analysis and Verification for Aircraft Structures. Volume 1; Technical Report WL-TR-95-3090; Wright Laboratory, Analytical Services and Materials: Hampton, VA, USA, 1996. [Google Scholar]
  154. King, C. Damage Tolerance vs Durability: Analysis for Sustainment of T-38 Aircraft; Technical Report HAFB 2014-09-04-WLD-100; Air Force Life Cycle Management Center, T-38 Structural Integrity and Analysis Section: Hill AFB, UT, USA, 2014. [Google Scholar]
  155. Katnam, K.; Comer, A.; Roy, D.; Da Silva, L.; Young, T. Composite repair in wind turbine blades: An overview. J. Adhes. 2015, 91, 113–139. [Google Scholar] [CrossRef]
  156. Shohag, M.A.S.; Hammel, E.C.; Olawale, D.O.; Okoli, O.I. Damage mitigation techniques in wind turbine blades: A review. Wind Eng. 2017, 41, 185–210. [Google Scholar] [CrossRef]
  157. Yang, B.; Sun, D. Testing, inspecting and monitoring technologies for wind turbine blades: A survey. Renew. Sustain. Energy Rev. 2013, 22, 515–526. [Google Scholar] [CrossRef]
  158. Beganovic, N.; Söffker, D. Structural health management utilization for lifetime prognosis and advanced control strategy deployment of wind turbines: An overview and outlook concerning actual methods, tools, and obtained results. Renew. Sustain. Energy Rev. 2016, 64, 68–83. [Google Scholar] [CrossRef]
  159. McGugan, M.; Mishnaevsky, L., Jr. Damage mechanism based approach to the structural health monitoring of wind turbine blades. Coatings 2020, 10, 1223. [Google Scholar] [CrossRef]
  160. Pereira, G.; Mikkelsen, L.P.; McGugan, M. Damage tolerant design and condition monitoring of composite material and bondlines in wind turbine blades: Failure and crack propagation. In Proceedings of the EWEA Offshore 2015 Conference. European Wind Energy Association (EWEA), Copenhagen, Denmark, 1–3 December 2015; pp. 1–9. [Google Scholar]
  161. Artigao, E.; Martín-Martínez, S.; Honrubia-Escribano, A.; Gómez-Lázaro, E. Wind turbine reliability: A comprehensive review towards effective condition monitoring development. Appl. Energy 2018, 228, 1569–1583. [Google Scholar] [CrossRef]
  162. Sørensen, B.F.; Lading, L.; Sendrup, P. Fundamentals for Remote Structural Health Monitoring of Wind Turbine Blades—A Preproject; Technical Report Risø-R-1336; Risø National Laboratory: Roskilde, Denmark, 2002. [Google Scholar]
  163. Myrent, N.J.; Barrett, N.C.; Adams, D.E.; Griffith, D.T. Structural Health and Prognostics Management for Offshore Wind Turbines: Sensitivity Analysis of Rotor Fault and Blade Damage with O&M Cost Modeling; Technical Report SAND2014-15588; Vanderbilt Laboratory for Systems Integrity and Reliability, Sandia National Lab: Albuquerque, NM, USA, 2014. [Google Scholar]
  164. Sierra-Pérez, J.; Torres-Arredondo, M.A.; Güemes, A. Damage and nonlinearities detection in wind turbine blades based on strain field pattern recognition. FBGs, OBR and strain gauges comparison. Compos. Struct. 2016, 135, 156–166. [Google Scholar] [CrossRef]
  165. Du, Y.; Zhou, S.; Jing, X.; Peng, Y.; Wu, H.; Kwok, N. Damage detection techniques for wind turbine blades: A review. Mech. Syst. Signal Process. 2020, 141, 106445. [Google Scholar] [CrossRef]
  166. Ciang, C.C.; Lee, J.R.; Bang, H.J. Structural health monitoring for a wind turbine system: A review of damage detection methods. Meas. Sci. Technol. 2008, 19, 122001. [Google Scholar] [CrossRef]
  167. Rumsey, M.A.; Paquette, J.A. Structural health monitoring of wind turbine blades. In Proceedings of the Smart Sensor Phenomena, Technology, Networks, and Systems 2008, San Diego, CA, USA, 10–12 March 2008; Volume 6933, pp. 104–118. [Google Scholar]
  168. Schubel, P.; Crossley, R.; Boateng, E.; Hutchinson, J. Review of structural health and cure monitoring techniques for large wind turbine blades. Renew. Energy 2013, 51, 113–123. [Google Scholar] [CrossRef]
  169. Di Sante, R. Fibre optic sensors for structural health monitoring of aircraft composite structures: Recent advances and applications. Sensors 2015, 15, 18666–18713. [Google Scholar] [CrossRef]
  170. Solbes Ferri, I. Dynamic Continuous Fiber Optical Strain Sensing for Damage Diagnosis on Beam-Like Composite Structures. Master’s Thesis, Delft University of Technology, Delft, The Netherlands, 2022. [Google Scholar]
  171. Pereira, G.F.; Mikkelsen, L.P.; McGugan, M. Crack detection in fibre reinforced plastic structures using embedded fibre bragg grating sensors: Theory, model development and experimental validation. PLoS ONE 2015, 10, e0141495. [Google Scholar] [CrossRef]
  172. Schroeder, K.; Ecke, W.; Apitz, J.; Lembke, E.; Lenschow, G. A fibre Bragg grating sensor system monitors operational load in a wind turbine rotor blade. Meas. Sci. Technol. 2006, 17, 1167. [Google Scholar] [CrossRef]
  173. Hill, K.O.; Meltz, G. Fiber Bragg grating technology fundamentals and overview. J. Light. Technol. 1997, 15, 1263–1276. [Google Scholar] [CrossRef]
  174. Taylor, S.G.; Farinholt, K.; Choi, M.; Jeong, H.; Jang, J.; Park, G.; Lee, J.R.; Todd, M.D. Incipient crack detection in a composite wind turbine rotor blade. J. Intell. Mater. Syst. Struct. 2014, 25, 613–620. [Google Scholar] [CrossRef]
  175. Shohag, M.A.; Ndebele, T.; Okoli, O. Real-time damage monitoring in trailing edge bondlines of wind turbine blades with triboluminescent sensors. Struct. Health Monit. 2019, 18, 1129–1140. [Google Scholar] [CrossRef]
  176. Antoniadou, I.; Dervilis, N.; Papatheou, E.; Maguire, A.; Worden, K. Aspects of structural health and condition monitoring of offshore wind turbines. Philos. Trans. R. Soc. A Math. Phys. Eng. Sci. 2015, 373, 20140075. [Google Scholar] [CrossRef]
  177. Griffith, D.T.; Yoder, N.C.; Resor, B.; White, J.; Paquette, J. Structural health and prognostics management for the enhancement of offshore wind turbine operations and maintenance strategies. Wind Energy 2014, 17, 1737–1751. [Google Scholar] [CrossRef]
  178. Griffith, D.T.; Yoder, N.; Resor, B.; White, J.; Paquette, J. Structural Health and Prognostics Management for Offshore Wind Turbines: An Initial Roadmap; Technical Report SAND2012-10109; Sandia National Lab: Albuquerque, NM, USA, 2012. [Google Scholar]
  179. Eleftheroglou, N.; Zarouchas, D.; Loutas, T.; Alderliesten, R.C.; Benedictus, R. Online remaining fatigue life prognosis for composite materials based on strain data and stochastic modeling. Key Eng. Mater. 2016, 713, 34–37. [Google Scholar] [CrossRef]
Figure 1. Flow chart for use of durability and damage tolerance analysis for wind turbine blade design life prediction.
Energies 16 07934 g001
Figure 2. Overview of the structure of this paper.
Energies 16 07934 g002
Figure 3. Typical trailing edge adhesive joint showing suction side and pressure side shells bonded by an adhesive reproduced from [33].
Energies 16 07934 g003
Figure 4. Trailing edge failures: (a) buckling and (b) debond and cracking.
Energies 16 07934 g004
Figure 5. Trailing edge components: (a) balsa cores; (b) composite skins; (c) adhesive.
Energies 16 07934 g005
Figure 6. Three types of tailing edge bonding: (a) profile of blade sections; (b) type A: blind bonding; (c) type B: prefabricated filler; (d) type C: prefabricated flange, adapted from [48].
Energies 16 07934 g006
Figure 7. Trailing edge components: (a) breathing effect of trailing edge panels and (b) cohesive failure in the adhesive and debond crack at the interface.
Energies 16 07934 g007
Figure 8. Trailing edge bondline: (a) design variables, including bondline thickness, bondline width, and flow front and (b) flow front shape variations.
Energies 16 07934 g008
Figure 9. Durability analysis process.
Energies 16 07934 g009
Figure 10. The fatigue cycle, including maximum stress, σ m a x , minimum stress, σ m i n , alternating stress, σ a , and mean stress, σ m .
Energies 16 07934 g010
Figure 11. Simplified linear Goodman diagram.
Energies 16 07934 g011
Figure 12. Piecewise linear constant life diagram.
Energies 16 07934 g012
Figure 13. Damage tolerance analysis process.
Energies 16 07934 g013
Figure 14. Fracture modes: Mode I—opening, Mode II—in-plane shear, and Mode III—out-of-plane shear.
Energies 16 07934 g014
Figure 15. Crack growth rate ( d a d N ) versus stress intensity factor ( Δ K ).
Energies 16 07934 g015
Table 1. IEC required fatigue design load cases [7].
Design SituationWind ConditionDesign Load Case
Power productionNormal turbulence model (NTM)1.2
Power production plus occurrence of faultNormal turbulence model (NTM)2.4
Start UpNormal wind profile (NWP) model3.1
Normal shut downNormal wind profile (NWP) model4.1
ParkedNormal turbulence model (NTM)6.4
Disclaimer/Publisher’s Note: The statements, opinions and data contained in all publications are solely those of the individual author(s) and contributor(s) and not of MDPI and/or the editor(s). MDPI and/or the editor(s) disclaim responsibility for any injury to people or property resulting from any ideas, methods, instructions or products referred to in the content.

