Article

Techno-Economic Comparative Analysis of Two Hybrid Renewable Energy Systems for Powering a Simulated House, including a Hydrogen Vehicle Load at Jeju Island

by
Christelle Arielle Mbouteu Megaptche
1,2,
Hanki Kim
2,*,
Peter Moses Musau
3,
Sebastian Waita
1 and
Bernard Aduda
1
1
Department of Physics, University of Nairobi, Nairobi P.O. Box 30197-00100, Kenya
2
Distributed Energy Team, Jeju Global Research Center, Korea Institute of Energy Research, 200 Haemajihaean-ro, Gujwa-eup, Jeju-si 63357, Republic of Korea
3
Department of Electrical Electronic and Information Engineering, South Eastern Kenya University, Kitui P.O. Box 170-90200, Kenya
*
Author to whom correspondence should be addressed.
Energies 2023, 16(23), 7836; https://doi.org/10.3390/en16237836
Submission received: 30 October 2023 / Revised: 24 November 2023 / Accepted: 27 November 2023 / Published: 29 November 2023

Abstract

:
This work undertakes a techno-economic comparative analysis of the design of photovoltaic panel/wind turbine/electrolyzer-H2 tank–fuel cell/electrolyzer-H2 tank (configuration 1) and photovoltaic panel/wind turbine/battery/electrolyzer-H2 tank (configuration 2) to supply electricity to a simulated house and a hydrogen-powered vehicle on Jeju Island. The aim is to find a system that will make optimum use of the excess energy produced by renewable energies to power the hydrogen vehicle while guaranteeing the reliability and cost-effectiveness of the entire system. In addition to evaluating the Loss of Power Supply Probability (LPSP) and the Levelized Cost of Energy (LCOE), the search for achieving that objective leads to the evaluation of two new performance indicators: Loss of Hydrogen Supply Probability (LHSP) and Levelized Cost of Hydrogen (LCOH). After analysis, for 0 < LPSP < 1 and 0 < LHSP < 1 used as the constraints in a multi-objective genetic algorithm, configuration 1 turns out to be the most efficient loads feeder with an LCOE of 0.3322 USD/kWh, an LPSP of 0% concerning the simulated house load, an LCOH of 11.5671 USD/kg for a 5 kg hydrogen storage, and an LHSP of 0.0043% regarding the hydrogen vehicle load.

1. Introduction

The 2022 Conference of the Parties was held in response to the urgent need to limit the rise of the global temperature to 1.5 °C [1]. For this file, it will be necessary to achieve a carbon-neutral energy supply by 2050 [2]. Renewable energy sources (wind, solar) are promising for achieving this goal [3]. Jeju Island, South Korea, is well advanced in this energy transition, with an installed renewable energy capacity of 66.8% in 2021 [4] and a target of 100% electricity supply by 2030, as announced by the Jeju Special Self-Governing Province in the “CFI 2030 (Carbon Free Island 2030)” policy [5]. Achieving carbon neutrality is not just a question of electricity supply but also concerns other sectors (transport, industry, etc.). The transport sector, for example, accounts for almost 20% of greenhouse gas emissions [6]. To address this issue, South Korea, especially Jeju Island, has resorted to purchasing electric vehicles, with a 4.8% share of EVs among all registered vehicles on the island in 2022 [7]. Moving towards decarbonizing all end-consumption sectors using renewable energy sources alludes to sector coupling [8]. Given their variable nature, using renewable energy sources to carry out sector coupling efficiently requires energy storage. Hydrogen’s high specific energy makes it a valuable energy carrier and an efficient storage medium [9]. It favors decarbonizing the individual passenger transport sector through sector coupling via H2-powered FCEVs [8].
With this in mind, Park et al. [10] used hydrogen storage to overcome the intermittent nature of wind and solar power sources. The authors found a Levelized Cost of Hydrogen of 5.9 USD/kg with a capacity factor of 25% for a case of a 100 MW capacity renewable energy source coupled with 20 MW hydrogen production and 20 MW grid transmission. In the Kingdom of Saudi Arabia, Al-Buraiki and Al-Sharafi [11] designed an off-grid solar/wind hybrid system, with batteries whose excess production was used to produce hydrogen via water electrolysis to power a hydrogen vehicle. The design was based on an assessment of the Levelized Cost of Electricity (LCOE), the Levelized Cost of Hydrogen (LCOH), the deficiency in hydrogen supply, and the Loss of Hydrogen Supply Probability (LHSP). The authors found for a fully satisfied demand (LPSP = 0%), a configuration of 18 kW PV, 02 wind turbines, and 14 batteries, with an LCOE of 0.593 USD/kWh, an LCOH of 36.32 USD/kg, and 0% LHSP with 14 kg hydrogen storage. With a net present cost of USD 104,756 and a 25% or less renewable energy fraction, Ihm et al. [12] found photovoltaic panels and energy storage systems to be the optimal configuration for an EV charging station based on renewable energy generation in Korea. Siyal et al. [13] used HOMER to carry out an economic analysis of stand-alone wind-powered hydrogen refueling stations at three selected sites in Sweden. They demonstrated that the road transport sector can make huge revenues by replacing gasoline with indigenous renewable hydrogen. Based on the existing literature, Viktorsson et al. [14] evaluated the Levelized Cost of Hydrogen (LCOH) for a decentralized hydrogen refueling station (HRS) in Halle, Belgium. According to the authors, if an average electricity cost of 0.04 EUR/kWh could be achieved, there could be a Levelized Cost of Hydrogen of 10.3 EUR/kg over a lifetime of 20 years. For Gökçek and Kale [15], using green hydrogen as a transportation fuel is an interesting alternative to fossil fuels. With this in mind, the authors used HOMER for a techno-economic analysis of a hydrogen refueling station powered by wind–photovoltaic–battery and wind–battery systems on the island of Gökçeada, Turkey. The results showed a minimal Levelized Cost of Hydrogen (8.92 USD/kg) for the wind–photovoltaic–battery system. According to Allouhi and Rehman [16], the coupling of energy and transport is interesting for the optimal use of renewable energy sources. With this in mind, they used HOMER grid software to simulate a grid-connected photovoltaic/wind/battery hybrid power system to generate electricity for supermarkets in three cities in Morocco, integrating electric vehicle charging stations in their parking areas. Li et al. [17] conducted a techno-economic comparison of a stand-alone hybrid renewable energy system and utilized a grid extension to supply electrical and hydrogen loads. The results showed that the most economical configuration, with a net present cost of USD 1.26 M, a cost of energy of 0.162 USD/kWh, and a cost of hydrogen of 12.5 USD/kg, was more profitable than using a grid extension. While some publications in the literature deal with modeling hybrid systems, very few concentrate on using excess energy to integrate an electrolyzer-H2 tank system into the overall system for transport decarbonization, let alone compare various storage methods within this entire system. While the global discourse recognizes the pivotal role of renewable sources such as wind and solar in meeting the energy transition goals, our work significantly advances beyond the conventional. The uniqueness of our approach lies in a meticulous exploration and comparative analysis of two hybrid renewable energy systems (photovoltaic panel/wind turbine/electrolyzer-H2 tank–fuel cell/electrolyzer-H2 tank and photovoltaic panel/wind turbine/battery/electrolyzer-H2 tank) tailored for a simulated house on Jeju Island. This simulation intricately intertwines photovoltaic panels, wind turbines, an electrolyzer-H2 tank–fuel cell, and battery systems to not only ensure a sustainable and resilient electricity supply but also to provide hydrogen for a hydrogen-powered vehicle through an electrolyzer-H2 tank system. This comprehensive integration addresses the broader spectrum of energy needs, extending beyond mere electricity supply to encompass the vital transport sector.
The distinctiveness of our study further emerges through a multi-faceted evaluation employing four key performance indicators—Loss of Power Supply Probability (LPSP), Levelized Cost of Energy (LCOE), Loss of Hydrogen Supply Probability (LHSP), and Levelized Cost of Hydrogen (LCOH). Employing a cutting-edge multi-objective genetic algorithm method, we delve into uncharted territories of techno-economic analysis, seeking to optimize the delicate balance between renewable energy generation, storage, and end-use application. In doing so, our work not only contributes to the ongoing narrative of sector coupling and decarbonization but also pioneers novel insights into the holistic and efficient integration of excess energy through advanced storage systems.
Our work emerges as a trailblazer in a research landscape where few studies venture into the intricate relationship between excess energy, electrolyzer-H2 tank systems, and transport decarbonization. By exploring the untapped potential of these intricate connections, we propel the discourse forward, offering a paradigm shift in our understanding of sustainable energy systems. As global efforts intensify to combat climate change, our study stands as a beacon of innovation, offering a roadmap for communities, regions, and nations to navigate the complex terrain of renewable energy integration and achieve a sustainable, carbon-neutral future.

2. Materials and Methods
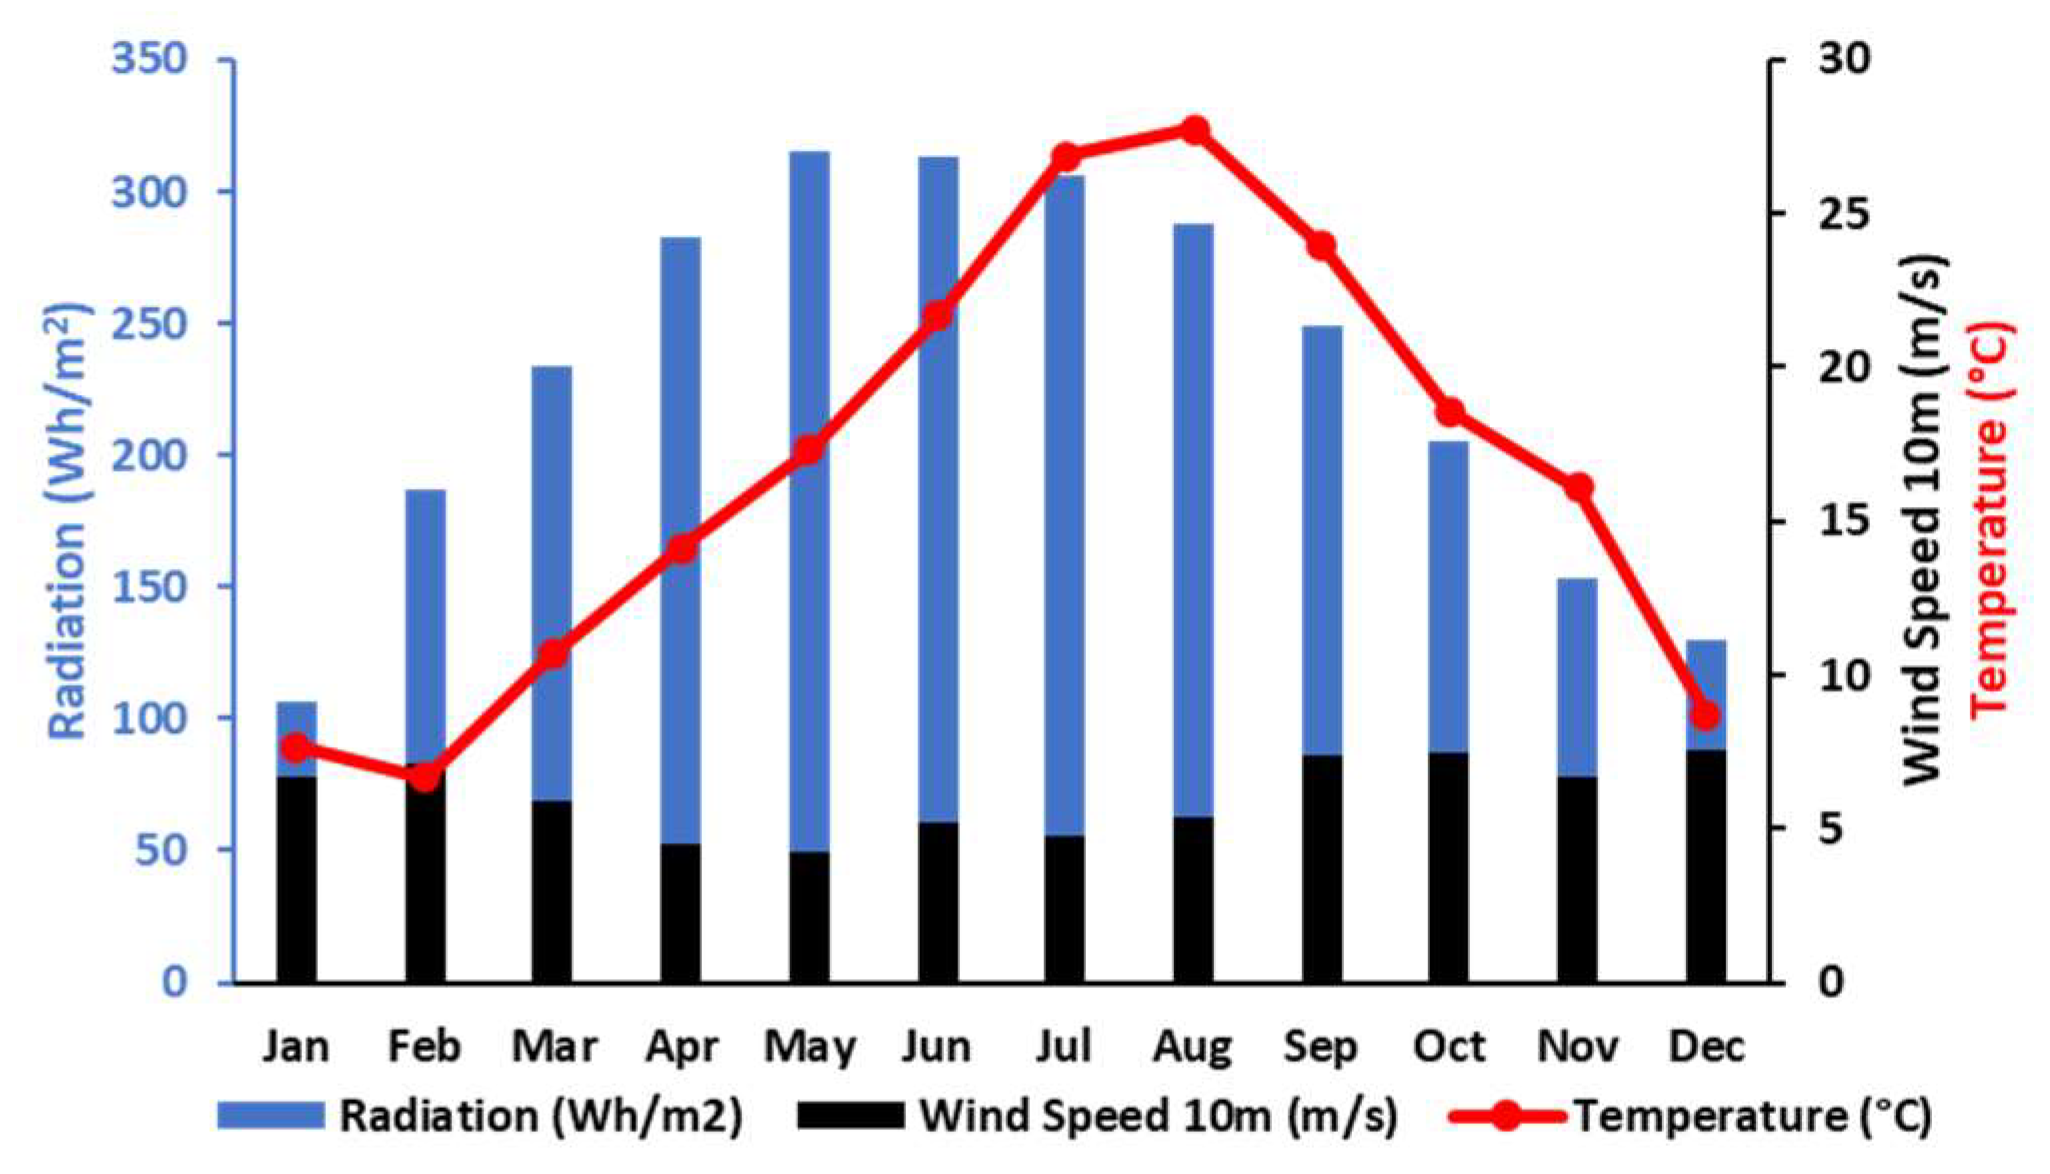
In this study, two hybrid renewable energy systems (photovoltaic/wind/hydrogen and photovoltaic/wind/battery) are modeled for one year (year 2022) to meet two different demands: the first referring to the loads of a simulated house and the second to the hydrogen load of the house’s vehicle. Excess energy from both hybrid systems is fed into the hydrogen tanks via the electrolyzer, which the hydrogen vehicle uses when needed.

2.1. Study Location

This work was carried out on Jeju Island, whose geographical data are 33°26′34″ north and 126°31′16″ east, with an altitude of 333 m. These data provide this location with interesting meteorological characteristics for renewable installations. Figure 1 shows meteorological data for Jeju Island for the year 2022 obtained from the National Aeronautics and Space Administration (NASA) website [18]. This figure represents the different weather patterns on the island, with high temperatures and solar irradiance in summer and low temperatures in winter. As for wind speeds, they are low during the summer months and higher at other times of the year.

2.2. Load Profile

For this work, the first load is a simulated house comprising lighting and equipment such as a refrigerator, microwave, television, laptop, phone chargers, blender, water heater, iron, etc. The functioning of these types of equipment depends on the days of the week, the weekend, and the weeks or months when there are vacations. The data processing allowed us to highlight the load profile of the studied house, which is represented in Figure 2 below. This figure shows average monthly electricity consumption over one year, with peaks in July and August.
The second load refers to the hydrogen-powered vehicle owned by the house’s occupants. The Toyota Mirai contains 5 kg hydrogen storage tanks that store hydrogen at a pressure of 70 MPa [19]. The average consumption of the vehicle is 0.0076 kg/km, which means a distance of 658 km for the 5 kg of storage. For this work, it has been assumed that this distance is covered over seven days, with the following breakdown: 0.375 kg on Monday, 0.5 kg on Tuesday, 0.7 kg on Wednesday, 0.8 kg on Thursday, 0.9 kg on Friday, 1 kg on Saturday, and 0.725 kg on Sunday. It has been assumed that the owners charge the vehicle for 10 h daily, i.e., from 09:00 p.m. to 06:00 a.m. Figure 3 shows the vehicle’s hydrogen demand.

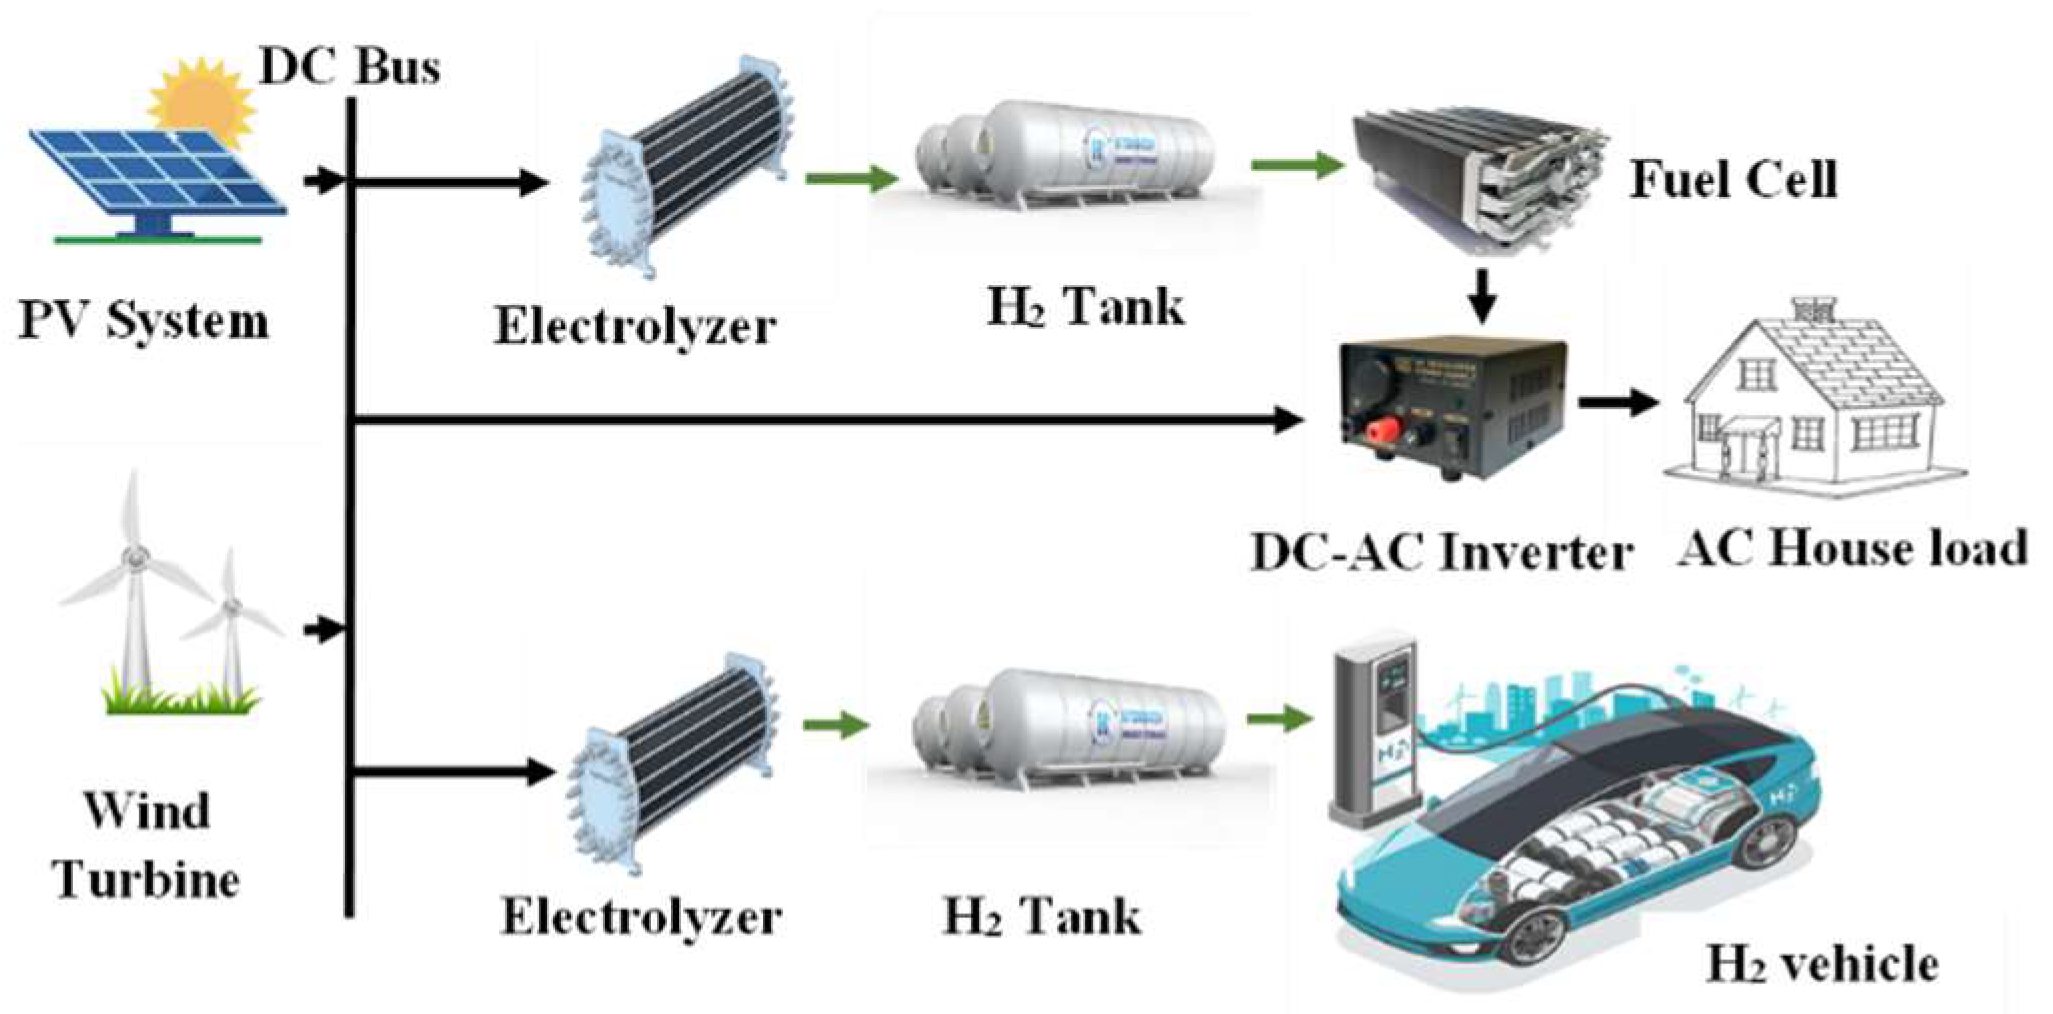
2.3. Modeling and System Description

Figure 4 and Figure 5 show the configurations studied and compared technically and economically in this study.
The modeling of each component of the different configurations is presented below.

2.3.1. Photovoltaic Panel

The power production from the photovoltaic panels in kW can be estimated using the mathematical model of Equation (1) [20]:
P P V = t = 1 8760 P p v r N p v P V d f G t G b a s e 1 + K T T a m b t + G t × N O C T 20 800 × 1000 T b a s e
Ppvr is the rated power (kW), Npv is the number of photovoltaic panels, and PVdf is the photovoltaic panel derating factor. G represents the entire irradiation situation on the tilted plane (kW/m2), Gbase is the solar irradiance in kW/m2 at standard condition (25 °C), and the full power temperature coefficient is KT = −3.7 × 10⁻³ °C. Tamb represents the ambient air temperature (°C), Tbase is the temperature at reference condition (25 °C), and NOCT is the standard operating cell temperature (°C).

2.3.2. Wind Turbine

The output power of the wind generator in kW is estimated in Equation (2) [20]:
P W T = N W T × η W × P W T r × t = 1 8760 V ( t ) 3 V c i 3 V r 3 V c i 3 , V V r N W T × η W × P W T r ,       V r V V c o 0 ,       V c o V   or   V V c i
where V is the recorded wind speed at hub height in meters per second (m/s) and may be calculated using Equation (3).
V t = V r e f H W T H r α
For surfaces with negligible roughness and a wide-open site, the friction parameter α is (1/7). HWT is the wind turbine hub height (m), and Hr is the base altitude (m). NWT is the number of wind turbines, ηW is the wind turbine efficiency, and PWTr is the wind turbine rated power (kW). Vci is the cut-in wind speed (m/s), Vco is the wind speed cut-out (m/s), Vr is the rated wind speed (m/s), and Vref is the estimated wind speed (m/s).

2.3.3. Battery Energy Storage

The battery bank stores excess energy from renewable resources when their production exceeds the energy demand. This stored energy supplies the load when renewable energy sources cannot meet the energy demand.
The battery state of charge (SOC) is described below [21]:
S O C ( t ) = S O C t 1 . 1 σ B T + P B T , c h t 1 . t . η B T , c h . η r e c t E b a t t , c a p P B T , d c t 1 . t η i n v . η B T , d c . E b a t t , c a p
where  σ B T  is the hourly self-discharge rate of the battery,  P B T , c h / d c  (in kW) is the battery charging/discharging power,  η B T , c h / d c  is the battery charging/discharging efficiency,  η i n v  is the inverter efficiency, and  η r e c t  is the rectifier. The following limits apply to battery storage [20]:
S O C m i n S O C t S O C m a x
S O C m a x = N B a t t . E b a t t , c a p
S O C m i n = S O C m a x ( 1 D O D )
where Ebatt,cap denotes the nominal capacity of the battery bank (kWh), SOCmin denotes the least permissible storage battery, SOCmax indicates the maximum allowable storage battery, and NBatt is the number of batteries. DOD is the depth of discharge.

2.3.4. Electrolyzer

The electrolyzer is a device that uses an electrochemical process to produce hydrogen by breaking up water molecules. The mass of hydrogen in kg/hr stored at any time t taken in this study, i.e., 1 h, can be expressed by the following equation [22]:
m H 2 = η E L P E L H H V H 2
PEL is the electrolyzer operating power, ηEL the efficiency of the electrolyzer, and  H H V H 2  is the higher heating value of hydrogen, equal to 39.4 kWh/kg.
This study was based on the work of Falama et al. to size the electrolyzer [23]:
P E L . n = m a x { P s u r p } η i n v
Psurp is the excess energy produced by renewable energies.

2.3.5. Fuel Cell

This work uses this equipment to convert stored hydrogen into electricity when renewable energy production is insufficient to meet demand. Fuel cell sizing in this work is conducted using Equation (10) [23]:
P F C . n = m a x { P d e f i c i t } η i n v . η F C
With Pdeficit, the power load deficit that results from renewable energies not being able to satisfy the demand, and ηFC, the efficiency of the fuel cell.

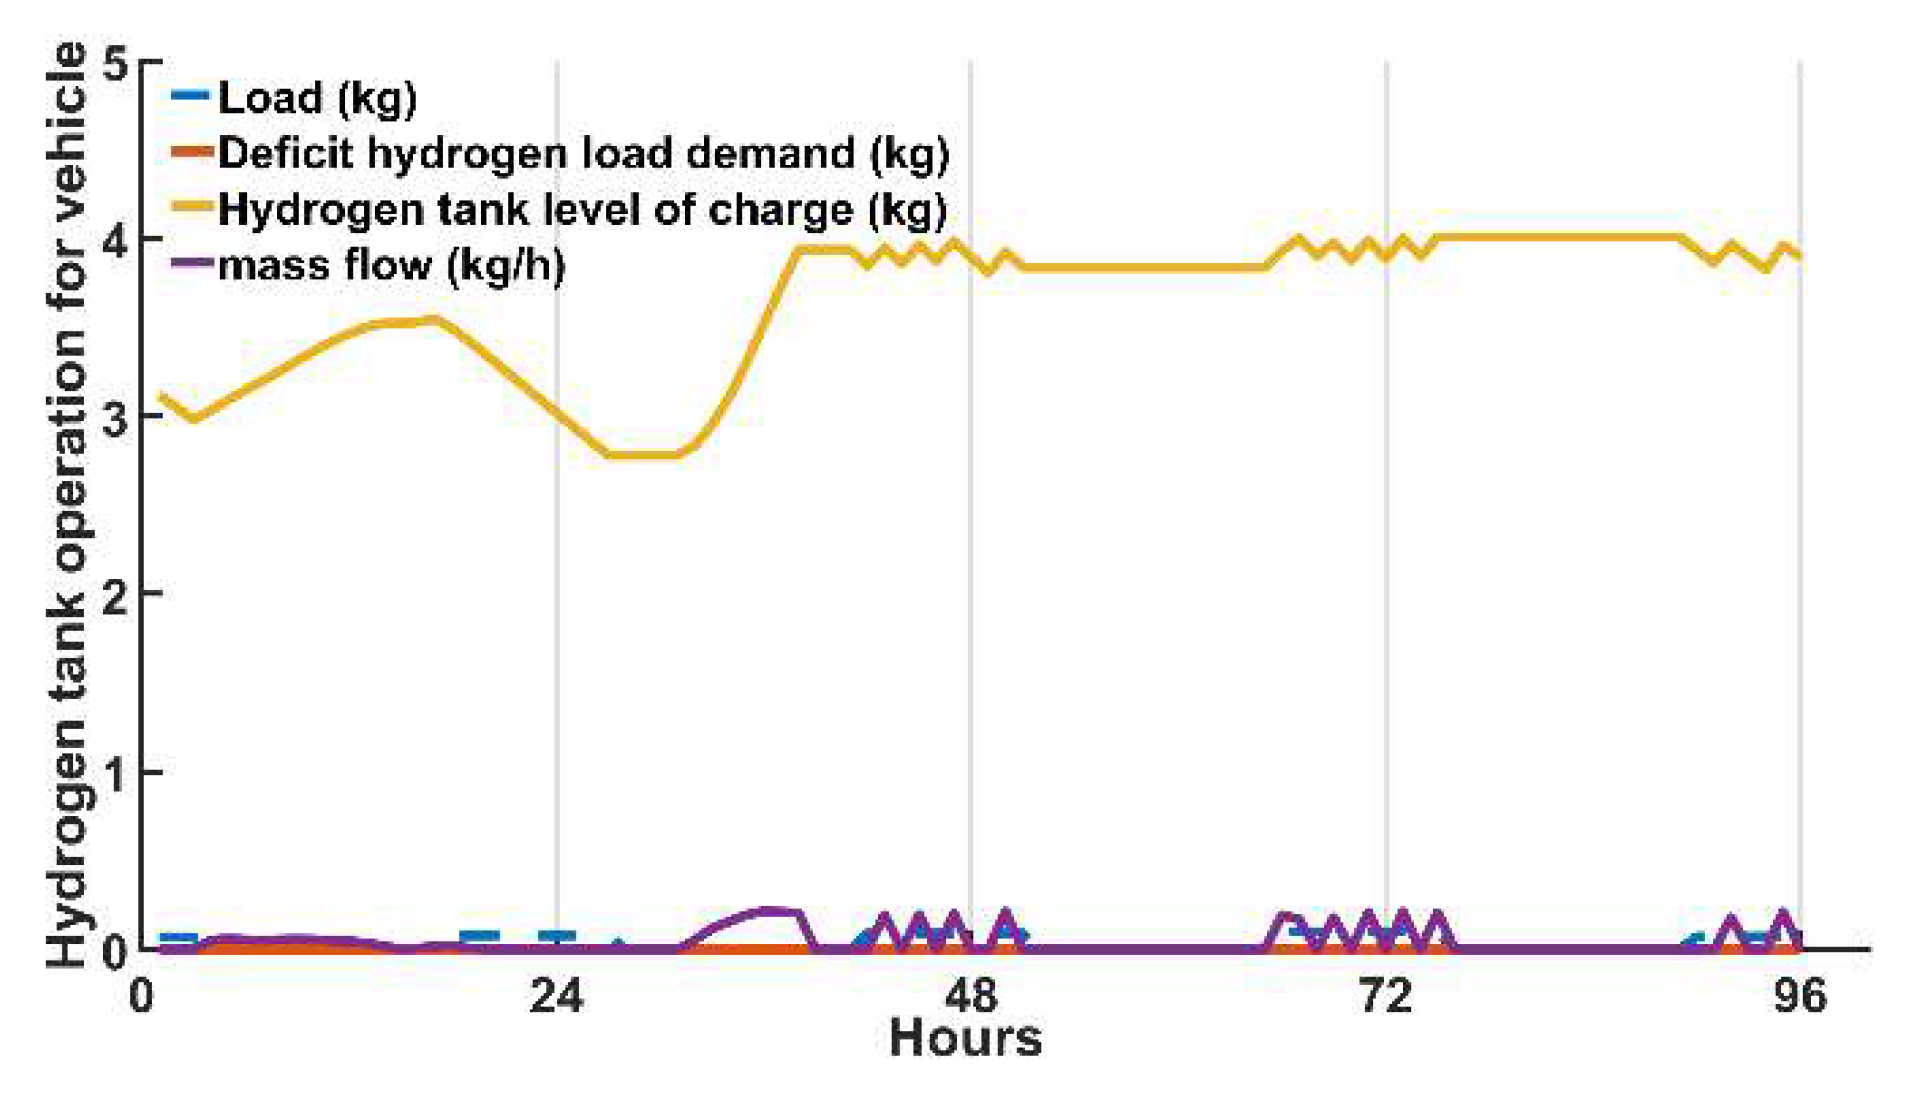
2.3.6. Hydrogen (H2) Tank

The compressed hydrogen generated by the EL (often up to 30 bar) is stored in the hydrogen storage tank as a gaseous storage tank [24]. High-pressure tanks (equal to 30 bar), which are how tanks function, store compressed hydrogen under pressure [25].
The level of hydrogen (LOH) in the tank is determined as follows [21]:
L O H ( t ) = L O H t 1 + P E L t 1 . t . η E L E H 2 P F C t 1 . t η F C . E H 2
where PEL/FC (kW) is the electrolyzer/fuel cell operating power, ηEL/FC is the efficiency of the electrolyzer/fuel cell system, and  E H 2  (kWh) is the rated capacity of the hydrogen tank (in terms of the energy content).
As for the hydrogen tank used to fuel the car, its capacity depends on demand, so each time it is needed, the demand is subtracted from the current capacity. Equation (12) materializes its hydrogen level [11]:
L O H t = L O H t 1 + m H 2 H 2 l o a d ( t )
H 2 l o a d  is the hydrogen load.
The following constraints must be respected at each time step:
L O H m i n L O H t L O H m a x
L O H m a x = N H 2 . E H 2
LOHmin denotes the least permissible storage hydrogen, LOHmax represents the maximum allowable storage hydrogen capacity, and  N H 2  is the number of hydrogen tanks.

2.3.7. Inverter

Inverters are necessary for HRES to achieve energy flow balance between DC and AC devices. Various design techniques for power converters are used in the literature. In this proposed study, the peak load technique will be employed for converter design, which can be expressed as [26]:
P i n v = P p e a k η i n v
Ppeak denotes peak load demand.
The techno-economic parameters used in this study to model photovoltaic panels and wind turbines come from Ma and Javed [26], those for batteries from Kotb et al. [27], and those for inverters from Ghenai et al. [28]. Hydrogen tank parameters (house load supply), generic electrolyzer, and proton-exchange membrane—fuel cell are from Zhang et al. [29], while the technical and economic parameters for hydrogen tank parameters (hydrogen vehicle supply) are from the work of Al-buraiki and Al-sharafi [11].

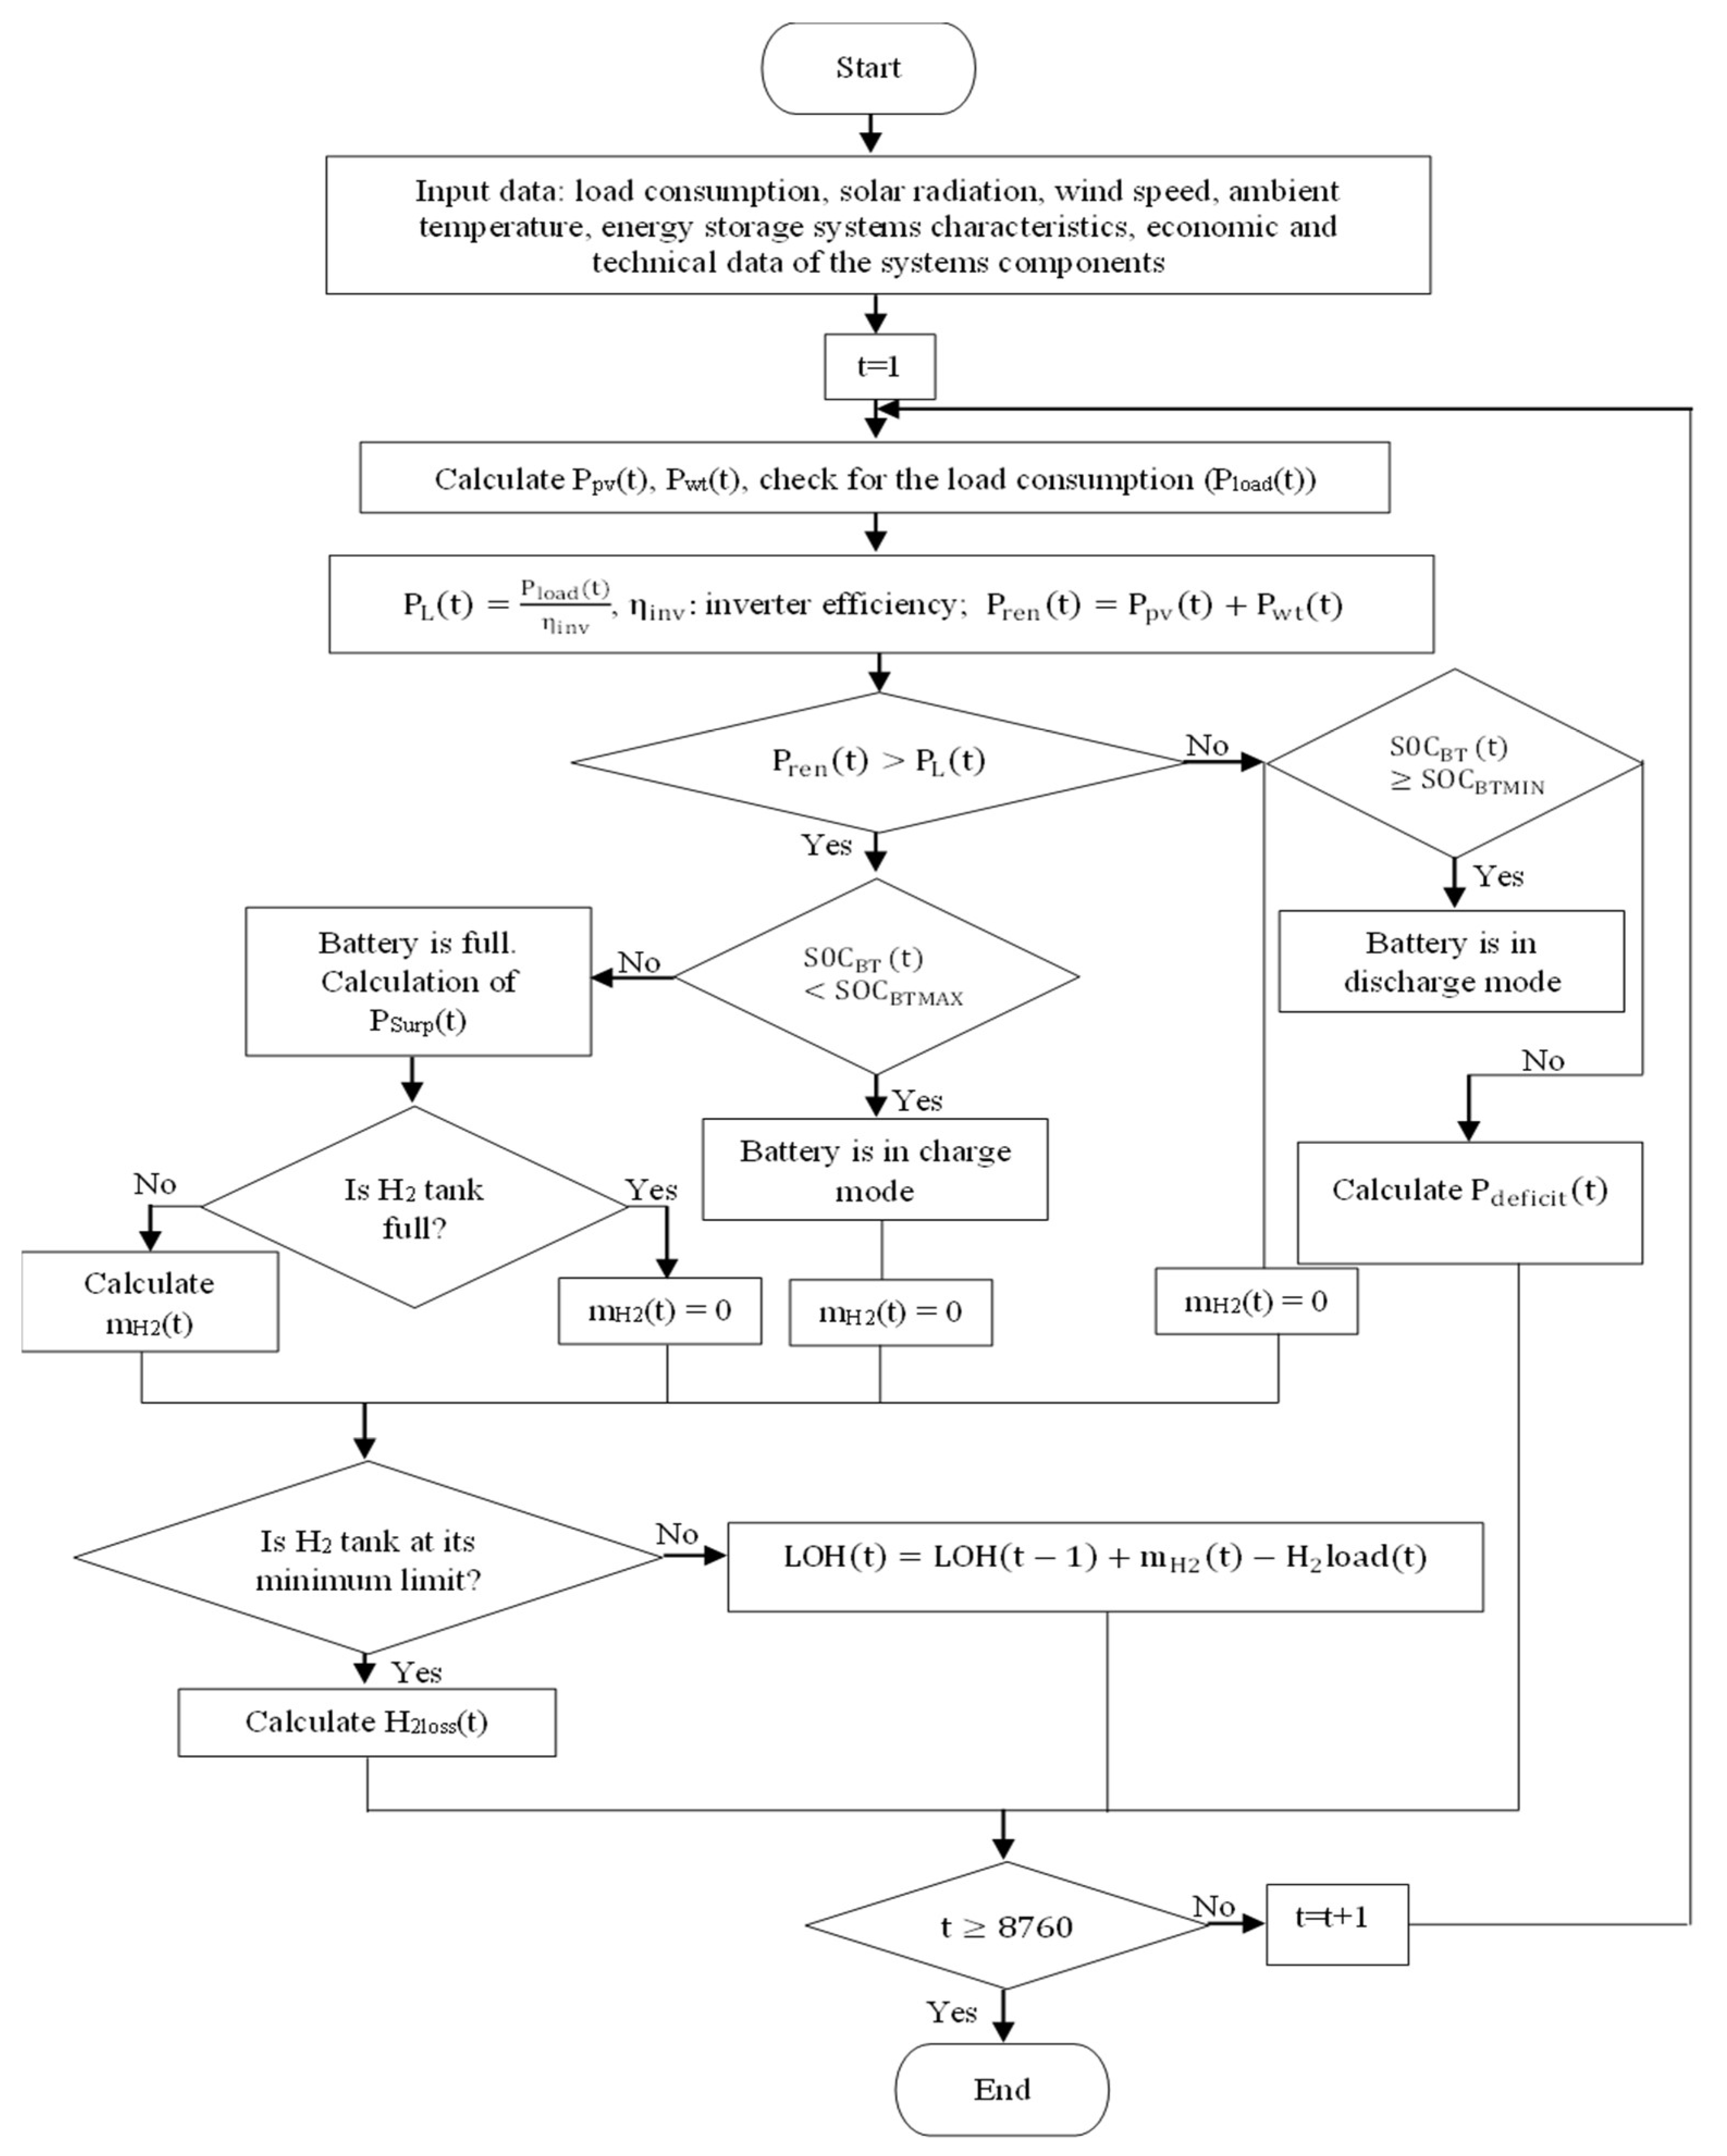
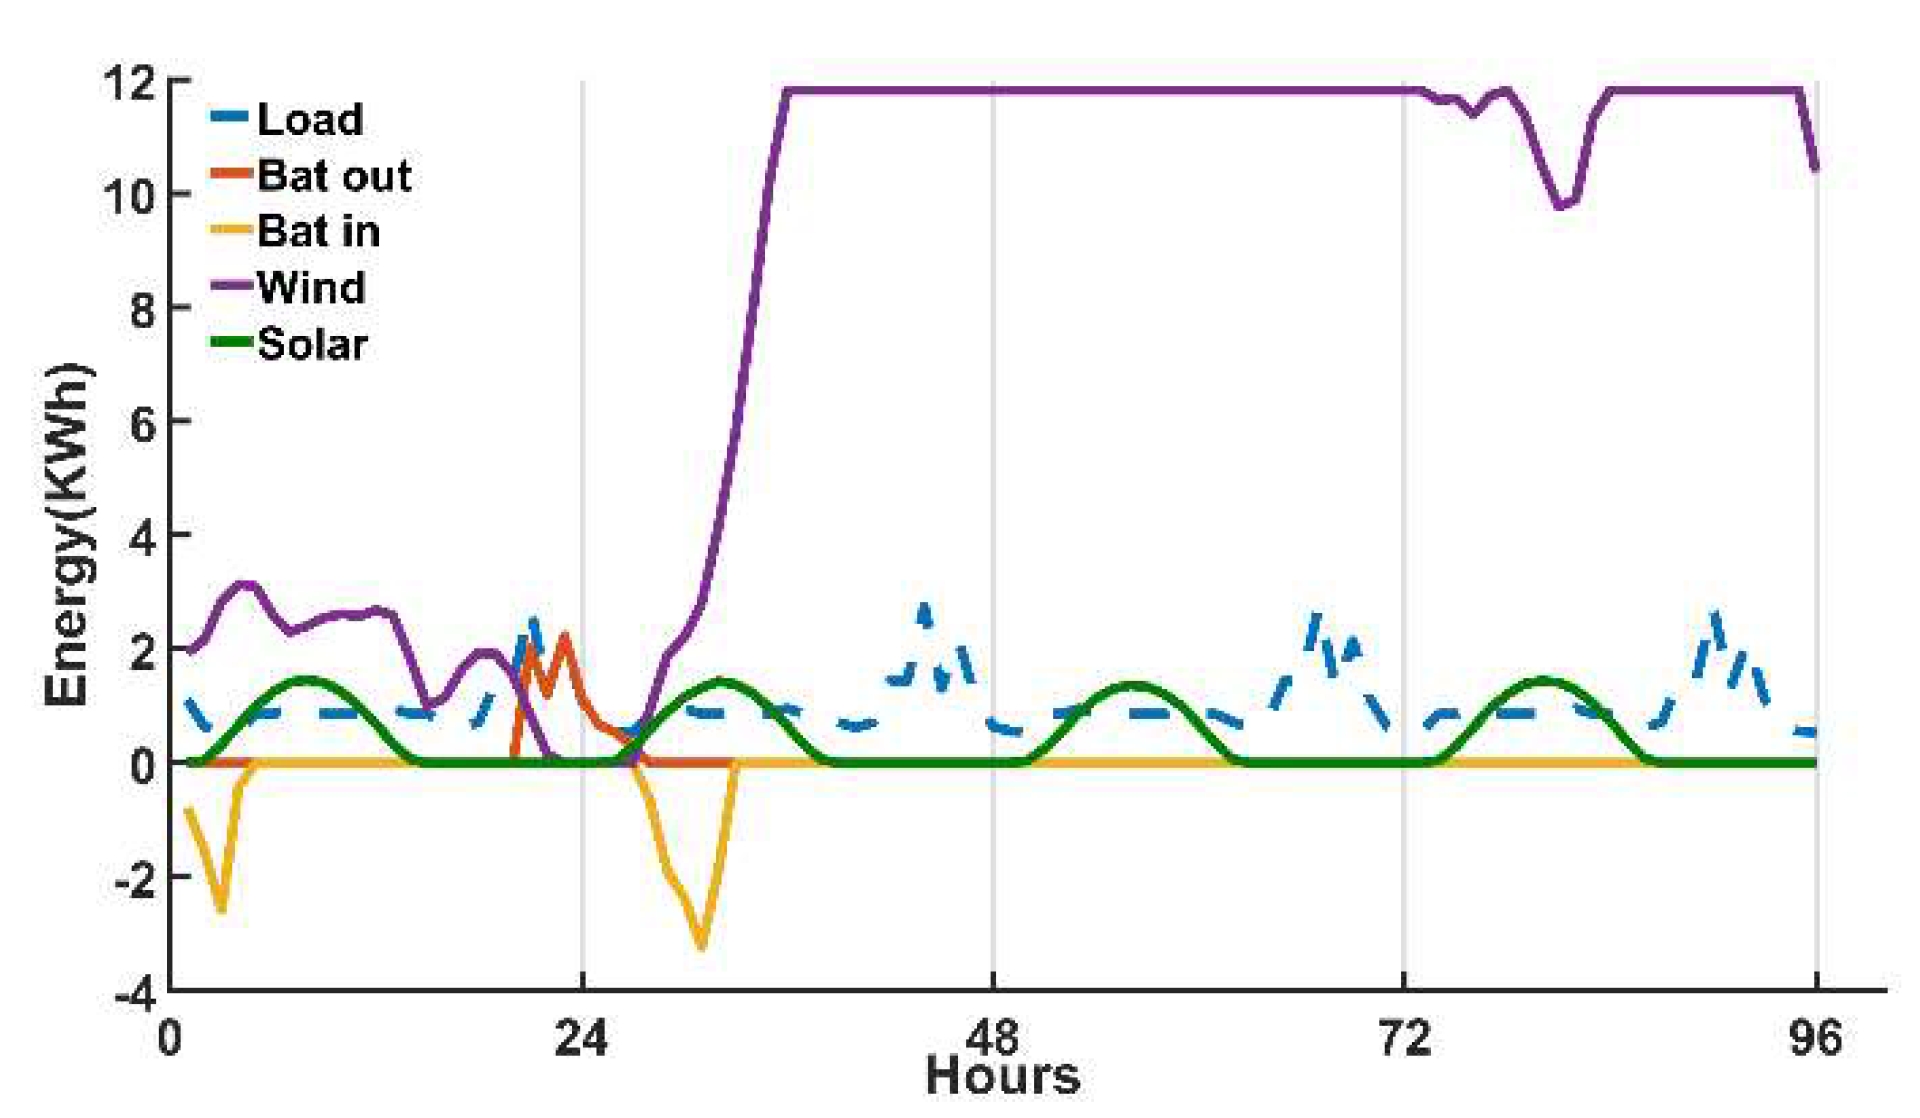
2.4. Energy Management Strategy

The energy management approach is highly significant in optimizing the sizing of a HRES as it assures the system’s reliability while having optimal impacts on the system’s assessment criteria [30].
The photovoltaic panel/wind turbine/battery/electrolyzer-H2 tank configuration operating period is managed as follows:
(a)
Excess production is stored in the batteries when renewable energy is sufficient to supply the house load;  m H 2  = 0. If the hydrogen tank has not reached its minimum limit, the level of hydrogen in the tank is calculated; otherwise, the hydrogen loss supply is estimated. Once the batteries are full, surplus energy is stored in the hydrogen tanks through water electrolysis (the mass flow of hydrogen is then calculated) until the maximum hydrogen level is reached. If the hydrogen tank is full,  m H 2  = 0, the level of hydrogen is calculated whenever the car needs to be refueled.
(b)
When the total renewable energy is insufficient to supply the house load, the energy stored in the batteries provides the load. The system is in deficit once the batteries have reached their maximum discharge limit. It is, therefore, necessary to calculate the loss of power supply. Note that there is no excess energy. The electrolyzer is, therefore, off ( m H 2  = 0). However, the hydrogen load can be demanded if the minimum limit of the hydrogen tank is not reached. If it is reached, an estimation of the hydrogen loss supply is required.
Figure 6 shows the energy management system for the configuration described above.
The energy management system of the photovoltaic panel/wind turbine/electrolyzer-H2 tank–fuel cell/electrolyzer-H2 tank configuration resembles the one described above. However, in this configuration, the electrolyzer-H2 tank–fuel cell represents energy storage for the home supply.

2.5. Optimization Strategy and System Evaluation Criteria

The main objective of this work is to ensure the electricity supply of a house in Jeju Island with an optimal hybrid renewable energy system found during the techno-economic comparison of photovoltaic panel/wind turbine/battery and photovoltaic panel–ectrolyzer-H2 tank–fuel cell systems. A storage unit (electrolyzer-H2 tank) is associated with these systems to supply the home’s vehicle with hydrogen when needed. To perfect the optimization of these two systems, the multi-objective genetic algorithm method was used to minimize the overall system cost (Levelized Cost of Energy (LCOE)) and assure the system reliability (Loss of Power Supply Probability (LPSP)). Due to the hydrogen load, two new criteria were associated with this minimization for evaluation: Loss of Hydrogen Supply Probability (LHSP) and Levelized Cost of Hydrogen (LCOH). Minimizing these evaluation criteria means finding the optimum number of each component in the various systems, subject to certain constraints. Equation (16) shows the objective function of the photovoltaic panel/wind turbine/battery/electrolyzer-H2 tank configuration.
O F = M i n L C O E , L P S P
Subject to:
N x m i n N x N x m a x , x = P V , W T , B T , H 2 t a n k   V e h i c l e   f e e d e r
0 L P S P 1 %
0 L H S P 1 %
Nx is the number of components that constitute hybrid renewable energy systems. LHSP and LCOH are secondary functions of system optimization.

2.5.1. Loss of Power Supply Probability (LPSP)

It is a function designed to assess the system’s reliability. It represents the load percentage that cannot be met throughout the HRES’s operational period. The load is entirely fulfilled during the system’s operation time if the LPSP value is 0%. Equation (17) provides the LPSP formulation [31].
L P S P = 1 8760 P d e f i c i t ( t ) × t 1 8760 P l o a d ( t ) × t , t = 1   h o u r
P d e f i c i t t P V W T H 2 = ( P l o a d t P r e n t ( L O H t 1 L O H m i n ) ) × η i n v
P d e f i c i t t P V W T B T = ( P l o a d t P r e n t ( S O C t 1 S O C m i n ) ) × η i n v

2.5.2. Loss of Hydrogen Supply Probability (LHSP)

This stands for the reliable supply of hydrogen load. LHSP stands for the percentage of hydrogen load that has not been met. This is calculated through Equation (20):
L H S P = 1 8760 H 2 l o s s ( t ) × t 1 8760 H 2 l o a d ( t ) × t , t = 1   h o u r
H 2 l o s s ( t ) = H 2 l o a d t ( m H 2 t L O H t 1 L O H m i n )
With H2loss, the hydrogen losses per hour for a year.

2.5.3. Levelized Cost of Energy (LCOE) and Levelized Cost of Hydrogen (LCOH)

The net present cost (NPC) denotes the cost of installing the HRES over the project lifecycle, which, in this case, is 20 years. The Capacity Recovery Factor (CRF) is used to determine the present value of money and increase the precision of economic computations; it aids in calculating the economic functions (LCOE and LCOH) as a function of NPC. The calculation of these functions is represented by the following equations [32]:
T o t a l   c o s t P V W T H 2 = C P V + C W T + C i n v + C H 2 ( h o u s e   l o a d ) + C E L ( h o u s e   l o a d ) + C F C + C H 2 ( H 2   l o a d ) + C E L ( H 2   l o a d )
T o t a l   c o s t P V W T B T = C P V + C W T + C B T + C i n v + C H 2 ( H 2   l o a d ) + C E L ( H 2   l o a d )
N P C = T o t a l   c o s t × C R F ( a , n )
C R F ( a , n ) = a ( 1 + a ) n ( 1 + a ) n 1
where CPV is the cost of a photovoltaic panel, CWT is the cost of a wind turbine, CBT is the cost of a battery, Cinv is the cost of an inverter,  C H 2  is the price of a hydrogen tank, CEL is the cost of an electrolyzer, and CFC is the cost of a fuel cell. a is the interest rate, and n is the project’s lifetime.
The cost of each component of the hybrid system can be given as follows:
C i = N i × C a p C i + R e C i + N R i + O M C i
i = component of the system (PV, WT, BT, INV, H2 Tank, EL, FC), N = number of each component, CapC = capital cost of each component, ReC = replacement cost of each component, NR = number of replacements, and OMC = operation and maintenance cost of each component.
After calculating the net present cost, the Levelized Cost of Energy (LCOE) is calculated as follows [26]:
L C O E = N P C 1 8760 P l o a d ( t ) × t , t = 1   h o u r
The Levelized Cost of Hydrogen (LCOH) can be calculated as follows [11]:
L C O H = N P C 1 8760 H 2 l o a d ( t ) × t , t = 1   h o u r

2.5.4. Multi-Objective Genetic Algorithm (MOGA)

A framework for genetic algorithms was put out by Ishibuchi [33] for multi-objective optimization problems. This work uses the same parameters as Mbouteu et al., who, in their recent work [34], found that this algorithm performs better with optimal results than the multi-objective particle swarm optimization algorithm. Balakrishnan and Geetha [35] present MOGA as simple to comprehend and supports optimizations with several objectives. It is an algorithm used for a fast response.

3. Results and Discussion

The optimization process facilitated through MATLAB and a multi-objective genetic algorithm delineated two distinctive hybrid renewable energy configurations (photovoltaic panel/wind turbine/electrolyzer-H2 tank–fuel cell/electrolyzer-H2 tank and photovoltaic panel/wind turbine/battery/electrolyzer-H2 tank) designed to fulfill the dual objectives of supplying electricity to a simulated house and facilitating the energy requirements of a hydrogen-powered vehicle on Jeju Island. The aim is to identify the most efficient system that optimally utilizes excess energy for hydrogen vehicle charging while ensuring the reliability and cost-effectiveness of the entire system.

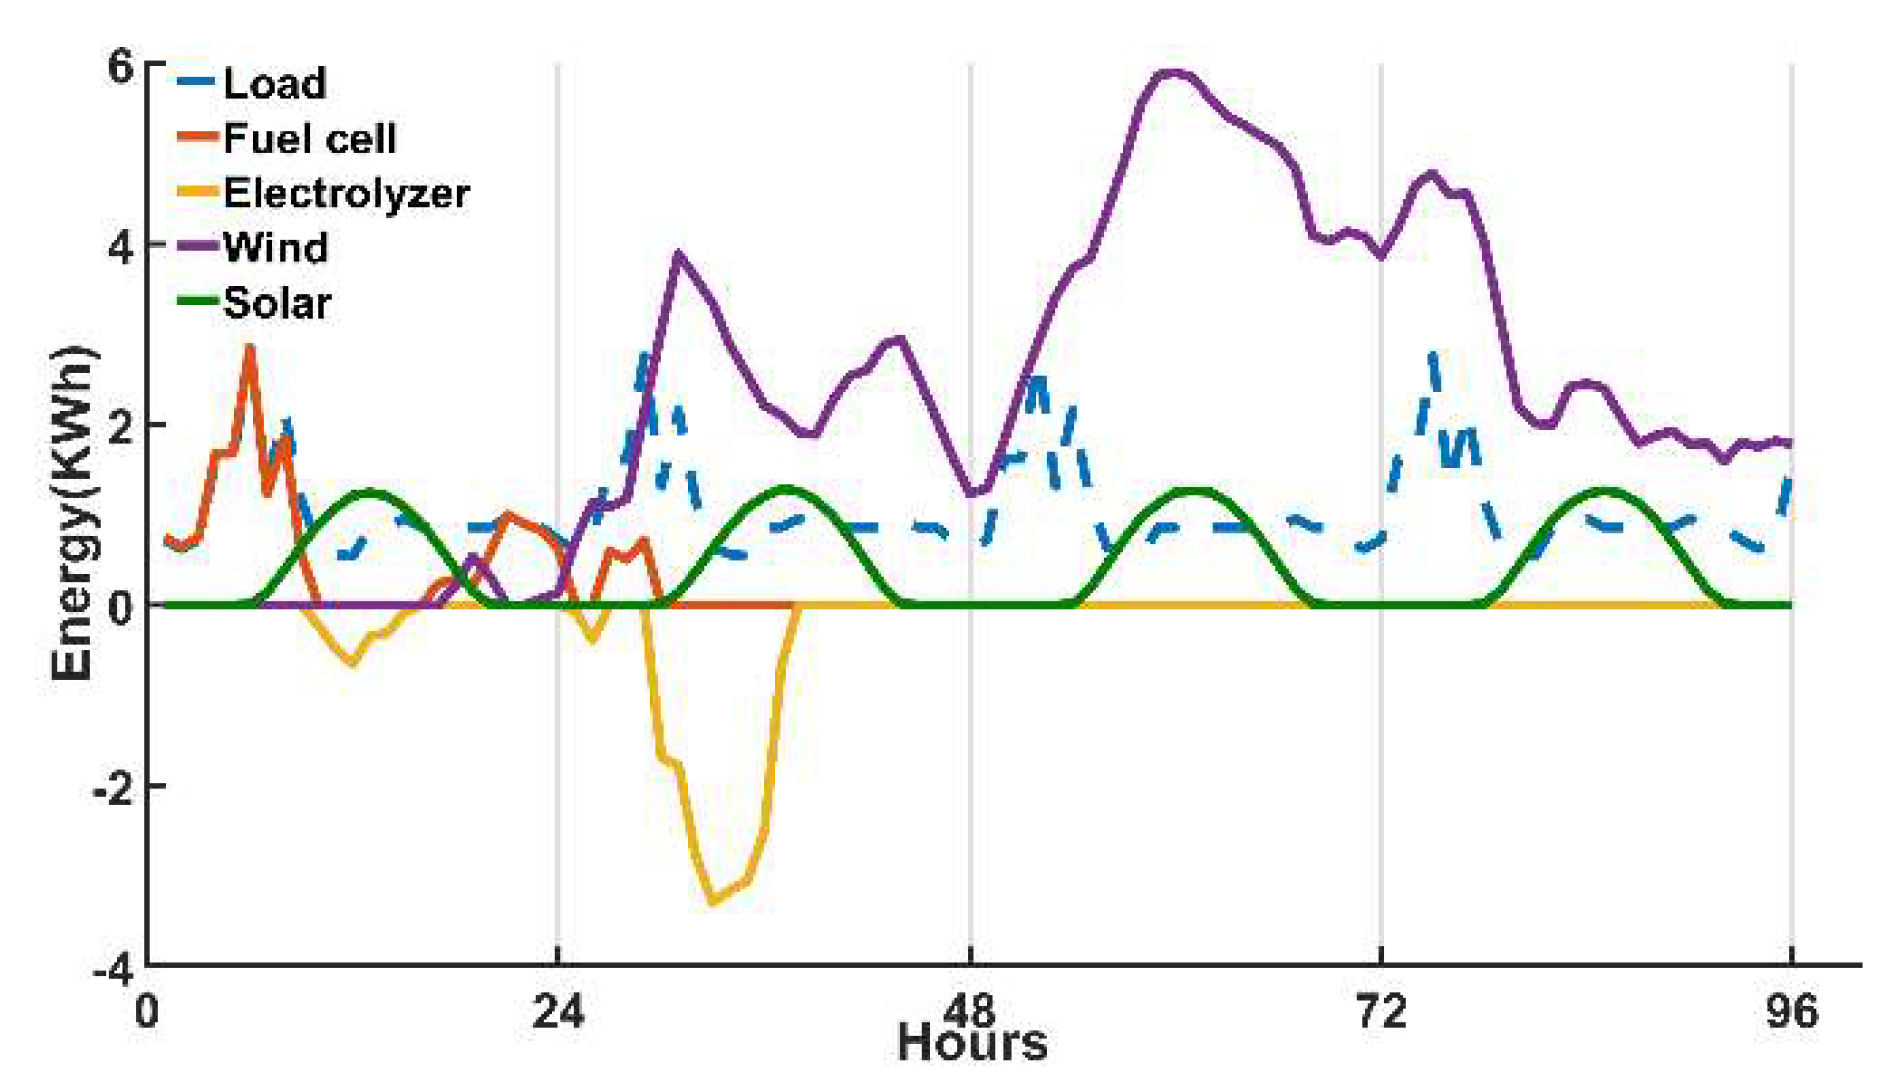
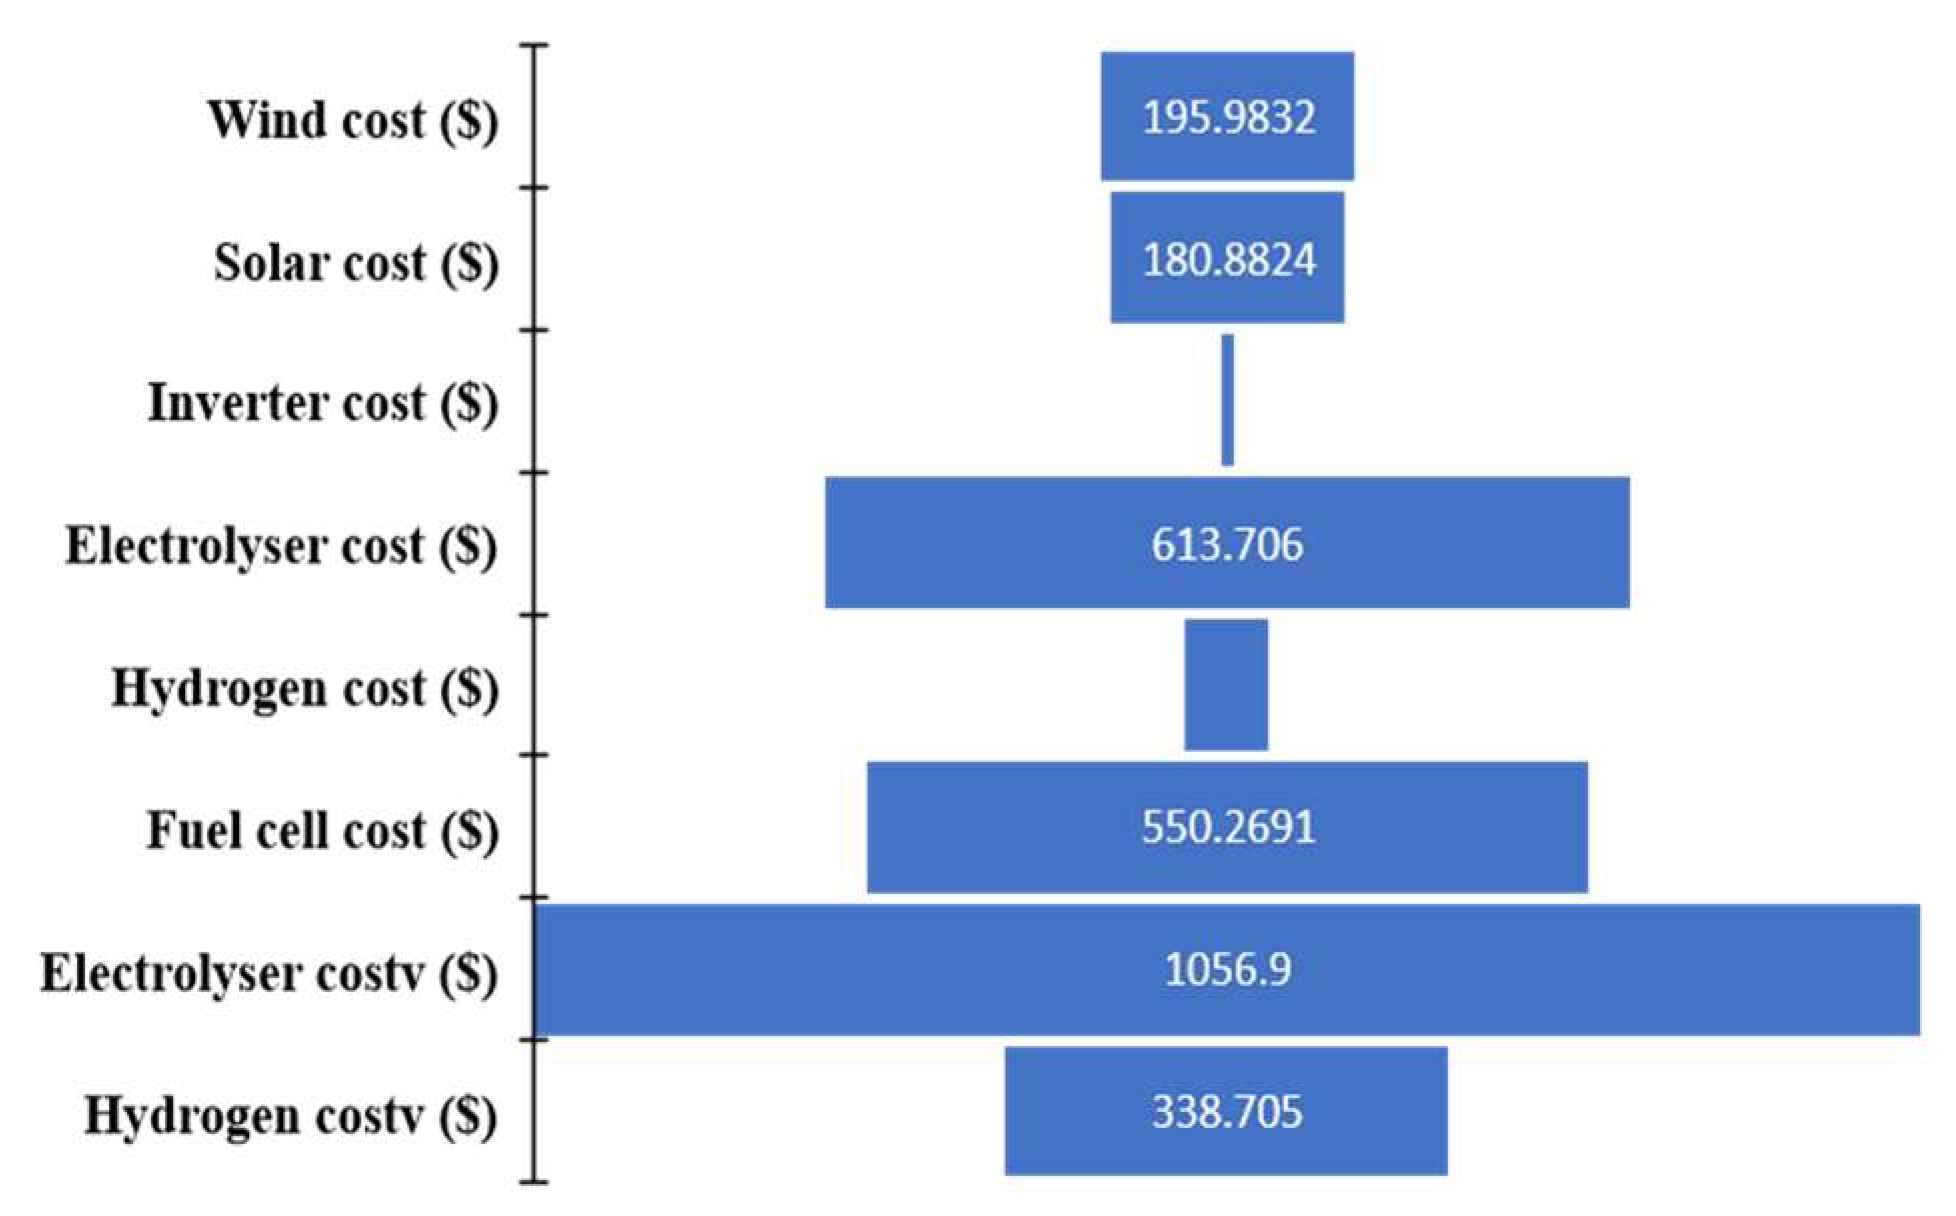
3.1. Photovoltaic Panel/Wind Turbine/Electrolyzer-H2 Tank–Fuel Cell/Electrolyzer-H2 Tank (Configuration 1) Optimization

A multi-objective genetic algorithm with constraint 0 < LPSP < 1 proposes for optimally electrifying the simulated house with an annual load of 9.0660 × 10³ kWh, 1.59 kW solar panels, 8 kW wind turbines, and 43.2 kWh hydrogen tanks (the capacity of the hydrogen tank responsible for storage for the house is considered in terms of energy (kWh) [29]). It also requires a 6 kW electrolyzer, a 6 kW fuel cell, and a 3 kW inverter. This configuration achieved a 0% Loss of Power Supply Probability (LPSP) for the simulated house load, confirming the complete satisfaction of energy demands. With over 93% of energy production attributed to wind turbines (3.73 × 10⁴ kWh of the total renewable energy production), configuration 1 demonstrated robust performance, validated through a comprehensive analysis of hourly energy production over 4 days (3456–3551 h), as presented in Figure 7. The excess energy generated by configuration 1 over the study year, calculated at 3.0763 × 10⁴ kWh, was efficiently utilized to run the electrolyzer, recharging the hydrogen tanks for the hydrogen-powered vehicle.
The hydrogen storage operation and mass flow were meticulously analyzed, showcasing the dynamic utilization of excess energy for hydrogen charging during periods of availability. The hydrogen tank will discharge whenever the car needs charging. The electrolyzer, operating under the constraint presented in Equation (13), allows only 45.63% of the excess energy to be used, i.e., 1.4035 × 10⁴ kWh. The optimum sizing for a 5 kg hydrogen load spread over one week for one year (8760 h) is five hydrogen tanks (1 kg/tank) and a 10 kW electrolyzer. However, the annual load of 260 kg was not fully met, with a Loss of Hydrogen Supply Probability (LHSP) of 0.0043% using Equation (20).
Figure 8 shows, for the same period as Figure 7, the hydrogen tank charging and discharging system as a function of demand and mass flow. From the beginning of day 1 to more than halfway through day 2, there is no excess energy, so mass flow equals 0. The hydrogen tanks discharge when there is a demand for meeting the load and remain stable when there is no demand. When there is excess energy, the electrolyzer is ON, and the mass flow is calculated, enabling the hydrogen to charge.
Concerning the economic evaluation of the photovoltaic panel/wind turbine/electrolyzer-H2 tank–fuel cell/electrolyzer-H2 tank configuration, Figure 9 shows the costs of each system element over the 20-year project lifetime. The electrolyzer in charge of supplying hydrogen to the tanks for powering the house vehicle has the system’s highest cost and the inverter’s lowest. The cost of energy storage (electrolyzer-H2 tank–fuel cell) is far greater than the cost of renewable energy sources. These costs resulted in a net present cost of USD 3.0118 × 10³ for a Levelized Cost of Energy of 0.3322 USD/kWh and a Levelized Cost of Hydrogen of 11.5671 USD/kg.

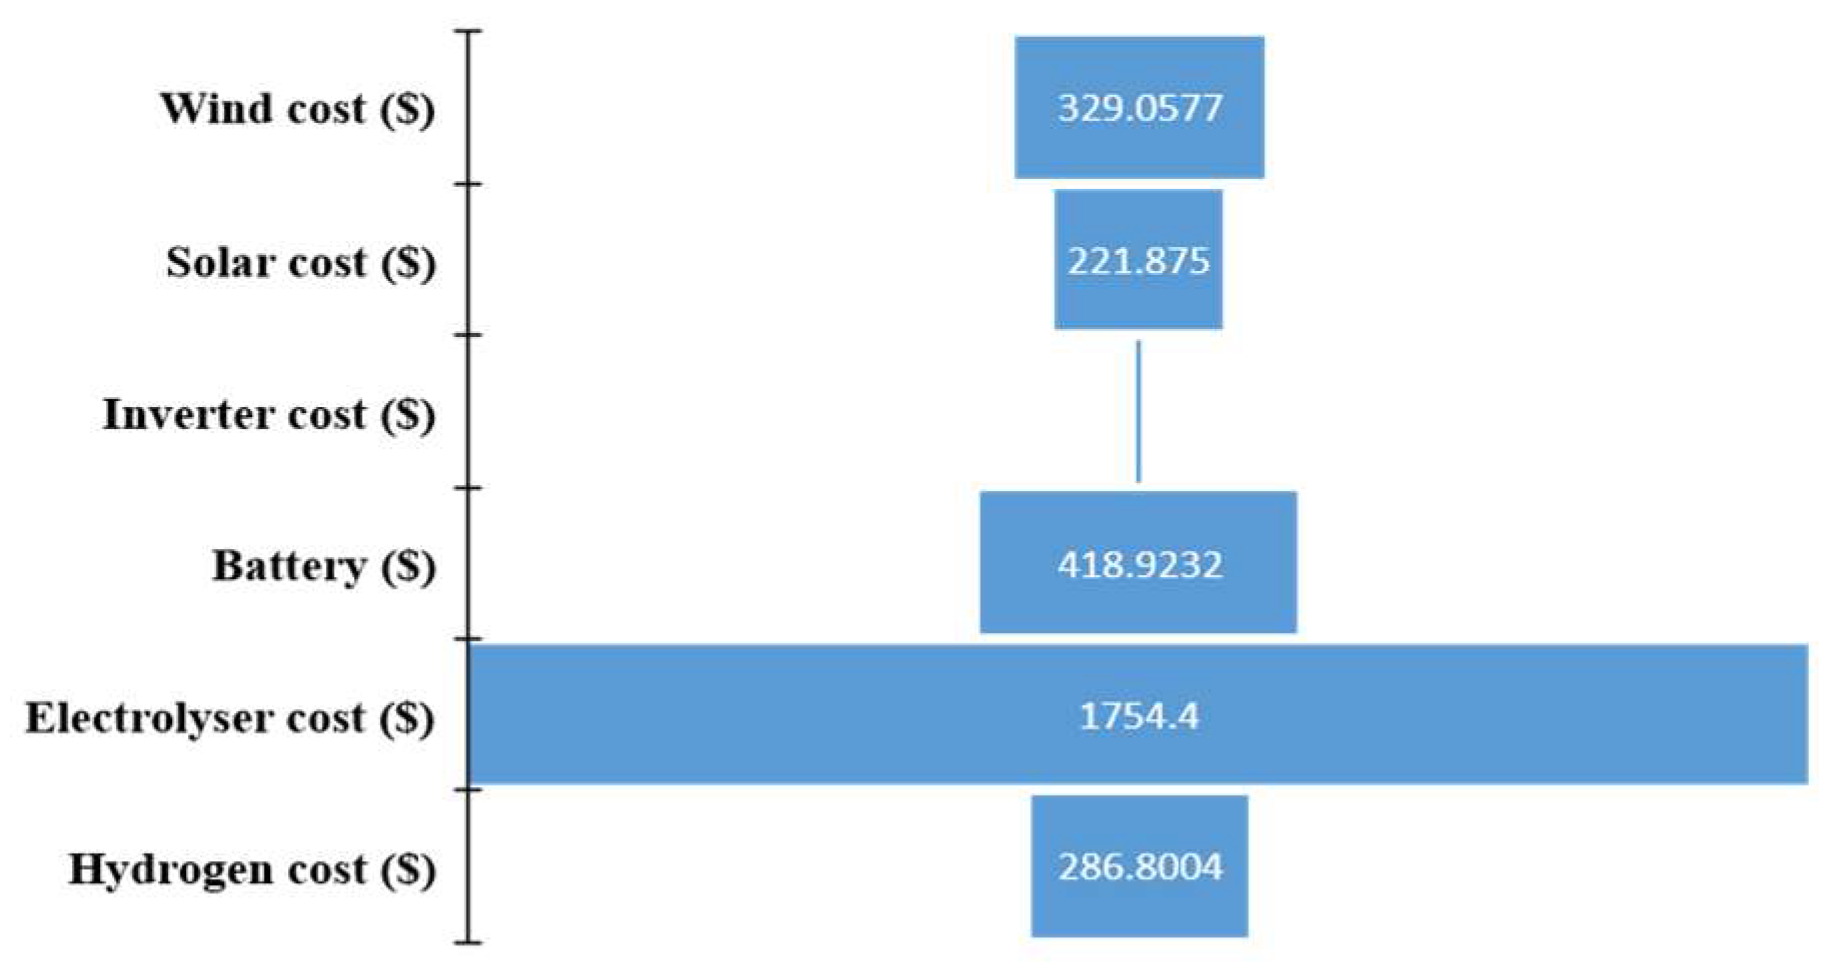
3.2. Photovoltaic Panel/Wind Turbine/Battery/Electrolyzer-H2 Tank (Configuration 2) Optimization

In total, 2.65 kW solar panels, 12 kW wind turbines, 31.2 kWh batteries, and 3 kW of inverter constitute the optimal configuration for supplying electricity to the simulated house, with a constraint of 0 < LPSP < 1. This optimal configuration failed to fully satisfy the load with an LPSP of 0.2333%. Figure 10 shows the energy status of configuration 2 over 4 days. From about halfway through the second day, a significant amount of excess energy is noticed, reflected in the total annual excess of 5.6223 × 10⁴ kWh.
As presented in the evaluation of configuration 1, this excess energy was used to start the electrolyzer to charge the hydrogen tanks, which will be discharged when the vehicle is powered. For the hydrogen load (260 kg a year), almost the same excess energy as in configuration 1 was used to power the electrolyzer, i.e., 1.4037 × 10⁴ kWh, representing 25% of the total excess energy. For this load, which is completely satisfied on this configuration (LHSP = 0%), the optimum sizing is four hydrogen tanks (1 kg/tank) and a 17 kW electrolyzer.
Figure 11 shows, for the same period as Figure 10 (2429–2524 h), the variation in hydrogen storage as a function of mass flow and demand. The same operation is applicable as in configuration 1. However, after more than half of the 2nd day until the end of the 4th, in Figure 10, there is excess energy, but in Figure 11, at specific periods, mass flow = 0. This is justified by the fact that the electrolyzer is off (mass flow = 0) if, at time t, adding mass flow to the hydrogen capacity at time t-1 exceeds the maximum capacity of the hydrogen tank.
In terms of system cost, the electrolyzer accounts for a significant 58% of the total system cost due to the very high maximum excess energy. Figure 12 shows the cost of each element in the photovoltaic panel/wind turbine/battery/electrolyzer-H2 tank configuration. The sum of all these elements provides the net present cost of the system, which is USD 3.0212 × 10³, leading to a Levelized Cost of Energy of 0.3332 USD/kWh and a levelized hydrogen cost of 11.6034 USD/kg.

3.3. Environmental Impact of the Utilization of Hydrogen Vehicles Compared to the Gasoline Vehicle

Although the systems evaluated are 100% renewable, they are not zero-emission [20], which means that hydrogen-powered cars from renewable sources emit minimal particulate pollutants. Accordingly, Teimouri et al. [36] presented the total particles emitted per 100 km by gasoline and hydrogen vehicles as 32.964 kg of CO2, 35.012 kg of GHG, 0.097 kg of CO, 0.018 kg of NOx, and 0.007 kg of SOx for gasoline vehicles and 7.953 kg of CO2, 8.542 kg of GHG, 0.002 kg of CO, 0.003 kg of NOx, and 0.003 kg of SOx for hydrogen vehicles. For this work, it was assumed that the vehicle travels 658 km per week, equivalent to 34,216 km per year. If the home users had had a gasoline vehicle, particulate emissions would be of the order of (((32.964 + 35.012 + 0.097 + 0.018 + 0.007)/100) * 34,216) = 23,300.41168 kg compared with 5646.66648 kg of particulate emissions for the hydrogen vehicle. Using a hydrogen vehicle compared with a gasoline vehicle results in an annual reduction in particulate pollutants of 17,653.75 kg.

3.4. Results Validation

The use of MATLAB R2023b and a multi-objective genetic algorithm to optimize the configurations reflects a robust and widely accepted approach in the field. The systematic optimization process enhances the credibility of the results, ensuring that the proposed configurations are finely tuned for efficiency.
The economic evaluations of configurations 1 and 2 align closely with the reported results in the existing literature, providing a consistent benchmark for validation. The achieved metrics, including the Levelized Cost of Energy (LCOE) and Levelized Cost of Hydrogen (LCOH), fall within the optimal values reported by prior studies. This consistency reinforces the study’s reliability and relevance within the broader context of renewable energy research.
The focus on Jeju Island as a real-world case study lends practicality and applicability to the study’s findings. Jeju Island’s ambitious renewable energy targets and existing infrastructure make it an ideal testing ground, providing a tangible context for the proposed hybrid renewable energy systems.
The study’s acknowledgment of the environmental impact, even in 100% renewable systems, adds a layer of realism. The quantification of the annual reduction in particulate pollutants through the adoption of hydrogen-powered vehicles, compared to gasoline vehicles, further substantiates the eco-friendly aspects of the proposed systems.
The breakdown of costs over the 20-year project lifetime for configurations 1 and 2, with a detailed analysis of each system element, contributes to the study’s transparency and allows for a nuanced economic evaluation. The proportional cost distribution aligns with our expectations, with the electrolyzer identified as the highest-cost component, emphasizing its critical role in the overall system.
As the introduction underscores, this study’s alignment with global climate goals adds a layer to its validation. The proposed configurations directly address the urgent need for carbon-neutral energy solutions, particularly in the context of the worldwide commitment to limit rising temperatures.
The validation of the study’s outcomes is multifaceted, encompassing a robust optimization methodology, consistency with the existing literature, real-world applicability on Jeju Island, a comprehensive assessment of environmental impact, detailed economic distribution analysis, and alignment with global climate goals. These factors collectively bolster the credibility of the study’s findings, positioning it as a valuable contribution to the discourse on renewable energy optimization and sustainable solutions.

4. Conclusions

In alignment with South Korea’s commitment to achieving carbon neutrality, this study intricately examined and compared the techno-economic optimization of two hybrid renewable energy systems. Specifically designed to power a residence equipped with a hydrogen vehicle, the systems under scrutiny are photovoltaic panel/wind turbine/electrolyzer-H2 tank–fuel cell/electrolyzer-H2 tank (configuration 1) and photovoltaic panel/wind turbine/battery/electrolyzer-H2 tank (configuration 2). For 0 < LPSP < 1 and 0 < LHSP < 1 used as the constraints in a multi-objective genetic algorithm method, configuration 1 emerges as the most efficient for supplying electricity to a simulated house and powering a hydrogen vehicle on Jeju Island. Configuration 2 presents an alternative but with a slightly higher Loss of Power Supply Probability (LPSP). Configuration 1 demonstrates robust energy production, with over 93% from wind turbines, capitalizing on Jeju Island’s favorable wind potential. The excess energy generated is effectively harnessed to charge hydrogen tanks for the hydrogen vehicle. Both configurations undergo a detailed economic assessment. Configuration 1 exhibits a net present cost of USD 3.0118 × 10³, a Levelized Cost of Energy (LCOE) of 0.3322 USD/kWh, and a Levelized Cost of Hydrogen (LCOH) of 11.5671 USD/kg. Configuration 2, although slightly less efficient, maintains competitive economic metrics with a net present cost of USD 3.0212 × 10³, LCOE of 0.3332 USD/kWh, and LCOH of 11.6034 USD/kg. While the systems are 100% renewable, they are not zero-emission. This study highlights the minimal pollutant emissions from hydrogen-powered vehicles compared to gasoline vehicles, contributing to a substantial annual reduction in particulate pollutants of 17,653.75 kg. Configuration 1, emphasizing electrolyzer-H2 tank–fuel cell storage technology, proves to be the more efficient and cost-effective solution, achieving a 0% LPSP for the simulated house and demonstrating a judicious use of excess energy for hydrogen vehicle charging. Configuration 2, integrating batteries, offers a viable alternative with competitive economic metrics. Crucially contributing to Jeju Island’s Carbon-Free Island 2030 initiative, this study lays the groundwork for future investigations. Acknowledging its current limitations, such as the absence of experimental validation and higher costs compared to Jeju Island’s current expenditure, the study sets the stage for forthcoming research. Future endeavors will delve into the experimental feasibility of these configurations and propose a resilient energy management system to enhance both cost efficiency and reliability. This ongoing pursuit promises to refine and elevate the practical applicability of the proposed renewable energy solutions for a sustainable and carbon-neutral future on Jeju Island.

Author Contributions

Conceptualization and methodology, C.A.M.M. and H.K.; writing—review and supervision, H.K., S.W., P.M.M. and B.A.; investigation, software, data curation, writing—original draft, review, and editing, C.A.M.M. All authors have read and agreed to the published version of the manuscript.

Funding

This work was supported by the National Research Foundation of Korea (NRF) grant funded by the Korea Government (MSIT) (No. 2022M3C1A3081432).

Data Availability Statement

The data presented in this study are available on request from the first or corresponding author.

Acknowledgments

The authors are grateful to the Partnership for Applied Sciences, Engineering, and Technology (PASET)—Regional Scholarship and Innovation Fund (RSIF), which also supported this work.

Conflicts of Interest

The authors declare no conflict of interest.

References

  1. UN Climate Change Conference 2022 (COP27) in Egypt|Internationale Klimaschutzinitiative (IKI). Available online: https://www.international-climate-initiative.com/en/topics/un-climate-change-conference-2022-cop-27-in-egypt/ (accessed on 13 November 2023).
  2. Gea-Bermúdez, J.; Jensen, I.G.; Münster, M.; Koivisto, M.; Kirkerud, J.G.; Chen, Y.K.; Ravn, H. The role of sector coupling in the green transition: A least-cost energy system development in Northern-central Europe towards 2050. Appl. Energy 2021, 289, 116685. [Google Scholar] [CrossRef]
  3. Sagaria, S.; Duarte, G.; Neves, D.; Baptista, P. Photovoltaic integrated electric vehicles: Assessment of synergies between solar energy, vehicle types and usage patterns. J. Clean. Prod. 2022, 348, 131402. [Google Scholar] [CrossRef]
  4. 발전설비현황 > 국가승인통계 > 자료실 > HOME. Available online: https://epsis.kpx.or.kr/epsisnew/selectEkifBoardList.do?menuId=080402&boardId=040200 (accessed on 20 September 2023).
  5. 목표-CFI제주. Available online: https://www.jeju.go.kr/cfi/intro/purpose.htm (accessed on 20 September 2023).
  6. Mohideen, M.M.; Subramanian, B.; Sun, J.; Ge, J.; Guo, H.; Radhamani, A.V.; Ramakrishna, S.; Liu, Y. Techno-economic analysis of different shades of renewable and non-renewable energy-based hydrogen for fuel cell electric vehicles. Renew. Sustain. Energy Rev. 2023, 174, 113153. [Google Scholar] [CrossRef]
  7. Park, K.; Jang, D.; Kim, S.; Lim, Y.; Lee, J. A Grid-Friendly Electric Vehicle Infrastructure: The Korean Approach. IEEE Power Energy Mag. 2023, 21, 28–37. [Google Scholar] [CrossRef]
  8. Ramsebner, J.; Haas, R.; Ajanovic, A.; Wietschel, M. The sector coupling concept: A critical review. Wiley Interdiscip. Rev. Energy Environ. 2021, 10, e396. [Google Scholar] [CrossRef]
  9. Sinigaglia, T.; Lewiski, F.; Martins, M.E.S.; Siluk, J.C.M. Production, storage, fuel stations of hydrogen and its utilization in automotive applications-a review. Int. J. Hydrogen Energy 2017, 42, 24597–24611. [Google Scholar] [CrossRef]
  10. Park, J.; Ryu, K.-H.; Kim, C.-H.; Cho, W.-C.; Kim, M.; Lee, J.-H.; Cho, H.-S.; Lee, J.-H. Green hydrogen to tackle the power curtailment: Meteorological data-based capacity factor and techno-economic analysis. Appl. Energy 2023, 340, 121016. [Google Scholar] [CrossRef]
  11. Al-buraiki, A.S.; Al-sharafi, A. Hydrogen production via using excess electric energy of an off-grid hybrid solar/wind system based on a novel performance indicator. Energy Convers. Manag. 2022, 254, 115270. [Google Scholar] [CrossRef]
  12. Ihm, J.; Amghar, B.; Chun, S.; Park, H. Optimum Design of an Electric Vehicle Charging Station Using a Renewable Power Generation System in South Korea. Sustainability 2023, 15, 9931. [Google Scholar] [CrossRef]
  13. Siyal, S.H.; Mentis, D.; Howells, M. Economic analysis of standalone wind-powered hydrogen refueling stations for road transport at selected sites in Sweden. Int. J. Hydrogen Energy 2015, 40, 9855–9865. [Google Scholar] [CrossRef]
  14. Viktorsson, L.; Heinonen, J.T.; Skulason, J.B.; Unnthorsson, R. A step towards the hydrogen economy—A life cycle cost analysis of a hydrogen refueling station. Energies 2017, 10, 763. [Google Scholar] [CrossRef]
  15. Gökçek, M.; Kale, C. Optimal design of a Hydrogen Refuelling Station (HRFS) powered by Hybrid Power System. Energy Convers. Manag. 2018, 161, 215–224. [Google Scholar] [CrossRef]
  16. Allouhi, A.; Rehman, S. Grid-connected hybrid renewable energy systems for supermarkets with electric vehicle charging platforms: Optimization and sensitivity analyses. Energy Rep. 2023, 9, 3305–3318. [Google Scholar] [CrossRef]
  17. Li, J.; Liu, P.; Li, Z. Optimal design and techno-economic analysis of a hybrid renewable energy system for off-grid power supply and hydrogen production: A case study of West China. Chem. Eng. Res. Des. 2022, 177, 604–614. [Google Scholar] [CrossRef]
  18. POWER|Data Access Viewer. Available online: https://power.larc.nasa.gov/data-access-viewer/ (accessed on 26 June 2023).
  19. Wang, Y.; Yuan, H.; Martinez, A.; Hong, P.; Xu, H.; Bockmiller, F.R. Polymer electrolyte membrane fuel cell and hydrogen station networks for automobiles: Status, technology, and perspectives. Adv. Appl. Energy 2021, 2, 100011. [Google Scholar] [CrossRef]
  20. Alshammari, N.; Asumadu, J. Optimum unit sizing of hybrid renewable energy system utilizing harmony search, Jaya and particle swarm optimization algorithms. Sustain. Cities Soc. 2019, 60, 102255. [Google Scholar] [CrossRef]
  21. Marocco, P.; Ferrero, D.; Lanzini, A.; Santarelli, M. The role of hydrogen in the optimal design of off-grid hybrid renewable energy systems. J. Energy Storage 2022, 46, 103893. [Google Scholar] [CrossRef]
  22. Baghaee, H.R.; Mirsalim, M.; Gharehpetian, G.B.; Talebi, H.A. Reliability/cost-based multi-objective Pareto optimal design of stand-alone wind/PV/FC generation microgrid system. Energy 2016, 115, 1022–1041. [Google Scholar] [CrossRef]
  23. Falama, R.Z.; Salah, A.; Hamda, M.; Ben, C. A techno-economic comparative study of renewable energy systems based different storage devices. Energy 2023, 266, 126411. [Google Scholar] [CrossRef]
  24. Wang, R.; Zhang, R. Techno-economic analysis and optimization of hybrid energy systems based on hydrogen storage for sustainable energy utilization by a biological-inspired optimization algorithm. J. Energy Storage 2023, 66, 107469. [Google Scholar] [CrossRef]
  25. Ayodele, T.R.; Munda, J.L. Potential and economic viability of green hydrogen production by water electrolysis using wind energy resources in South Africa. Int. J. Hydrogen Energy 2019, 44, 17669–17687. [Google Scholar] [CrossRef]
  26. Ma, T.; Javed, M.S. Integrated sizing of hybrid PV-wind-battery system for remote island considering the saturation of each renewable energy resource. Energy Convers. Manag. 2019, 182, 178–190. [Google Scholar] [CrossRef]
  27. Kotb, K.M.; Elkadeem, M.R.; Elmorshedy, M.F.; Dán, A. Coordinated power management and optimized techno-enviro-economic design of an autonomous hybrid renewable microgrid: A case study in Egypt. Energy Convers. Manag. 2020, 221, 113185. [Google Scholar] [CrossRef]
  28. Ghenai, C.; Salameh, T.; Merabet, A. ScienceDirect Technico-economic analysis of off grid solar PV / Fuel cell energy system for residential community in desert region. Int. J. Hydrogen Energy 2018, 45, 11460–11470. [Google Scholar] [CrossRef]
  29. Zhang, Y.; Hua, Q.S.; Sun, L.; Liu, Q. Life Cycle Optimization of Renewable Energy Systems Configuration with Hybrid Battery/Hydrogen Storage: A Comparative Study. J. Energy Storage 2020, 30, 101470. [Google Scholar] [CrossRef]
  30. Das, B.K.; Hassan, R.; Tushar, M.S.H.K.; Zaman, F.; Hasan, M.; Das, P. Techno-economic and environmental assessment of a hybrid renewable energy system using multi-objective genetic algorithm: A case study for remote Island in Bangladesh. Energy Convers. Manag. 2021, 230, 113823. [Google Scholar] [CrossRef]
  31. Javed, M.S.; Song, A.; Ma, T. Techno-economic assessment of a stand-alone hybrid solar-wind-battery system for a remote island using genetic algorithm. Energy 2019, 176, 704–717. [Google Scholar] [CrossRef]
  32. Singh, A.; Baredar, P.; Gupta, B. Computational Simulation & Optimization of a Solar, Fuel Cell and Biomass Hybrid Energy System Using HOMER Pro Software. Procedia Eng. 2015, 127, 743–750. [Google Scholar] [CrossRef]
  33. Ishibuchi, H. MOGA: Multi-objective genetic algorithms. In Proceedings of the 1995 IEEE International Conference on Evolutionary Computation, Perth, Australia, 29 November–1 December 1995. [Google Scholar]
  34. Mbouteu Megaptche, C.A.; Musau, P.M.; Tjahè, A.V.; Kim, H.; Waita, S.; Aduda, B.O. Demand response-fuzzy inference system controller in the multi-objective optimization design of a photovoltaic/wind turbine/battery/supercapacitor and diesel system: Case of healthcare facility. Energy Convers. Manag. 2023, 291, 117245. [Google Scholar] [CrossRef]
  35. Balakrishnan, R.; Geetha, V. Review on home energy management system. Mater. Today Proc. 2021, 47, 144–150. [Google Scholar] [CrossRef]
  36. Teimouri, A.; Kabeh, K.Z.; Changizian, S.; Ahmadi, P.; Mortazavi, M. Comparative lifecycle assessment of hydrogen fuel cell, electric, CNG, and gasoline-powered vehicles under real driving conditions. Int. J. Hydrogen Energy 2022, 47, 37990–38002. [Google Scholar] [CrossRef]
Figure 1. Meteorological data of Jeju Island, South Korea [18].
Energies 16 07836 g001
Figure 2. Monthly simulated house electricity load profile.
Energies 16 07836 g002
Figure 3. Hourly vehicle hydrogen’s load profile.
Energies 16 07836 g003
Figure 4. Photovoltaic panel/wind turbine/electrolyzer-H2 tank–fuel cell/electrolyzer-H2 tank system (configuration 1).
Energies 16 07836 g004
Figure 5. Photovoltaic panel/wind turbine/battery/electrolyzer-H2 tank system (configuration 2).
Energies 16 07836 g005
Figure 6. Photovoltaic panel/wind turbine/battery/electrolyzer-H2 tank energy management strategy.
Energies 16 07836 g006
Figure 7. Hourly energy production of system components (configuration 1).
Energies 16 07836 g007
Figure 8. Hourly hydrogen storage operation (configuration 1).
Energies 16 07836 g008
Figure 9. The net present cost of configuration 1.
Energies 16 07836 g009
Figure 10. Hourly energy production of system components (configuration 2).
Energies 16 07836 g010
Figure 11. Hourly hydrogen storage operation (configuration 2).
Energies 16 07836 g011
Figure 12. The net present cost of configuration 2.
Energies 16 07836 g012
Disclaimer/Publisher’s Note: The statements, opinions and data contained in all publications are solely those of the individual author(s) and contributor(s) and not of MDPI and/or the editor(s). MDPI and/or the editor(s) disclaim responsibility for any injury to people or property resulting from any ideas, methods, instructions or products referred to in the content.

