Article

Study of Impact of Sediment on the Stability of Salt Cavern Underground Gas Storage

1
State Key Laboratory of Geomechanics and Geotechnical Engineering, Institute of Rock and Soil Mechanics, Chinese Academy of Sciences, Wuhan 430071, China
2
University of Chinese Academy of Sciences, Beijing 100049, China
*
Author to whom correspondence should be addressed.
Energies 2023, 16(23), 7825; https://doi.org/10.3390/en16237825
Submission received: 17 October 2023 / Revised: 20 November 2023 / Accepted: 22 November 2023 / Published: 28 November 2023
(This article belongs to the Topic Energy Storage Using Underground Mine Space)

Abstract

:
The utilization of sediment voids for natural gas storage represents the future direction of salt cavern underground gas storage (UGS) in China. In this study, we first analyzed the way in which the sediment interacts with the salt caverns and the equilibrium state of the process. Subsequently, a novel approach employing the Discrete Element Method (DEM) for simulating sediment-filled salt cavern UGS was introduced, successfully modeling the operational process of sediment-filled salt cavern UGS. Moreover, deformation, plastic zone behavior, effective volume shrinkage rate, equivalent strain, and safety factor were employed to assess the impact of sediment on salt cavern stability. The findings indicate a positive influence of sediment on salt cavern stability, particularly in regions directly contacting the sediment. Deformation and effective volume shrinkage of the cavern were effectively mitigated, significantly improving the stress state of rock salt. This effect is more pronounced at lower internal gas pressures. In summary, sediment enhances the stability of salt caverns, providing a long-term and stable environment for natural gas storage within sediment voids.

1. Introduction

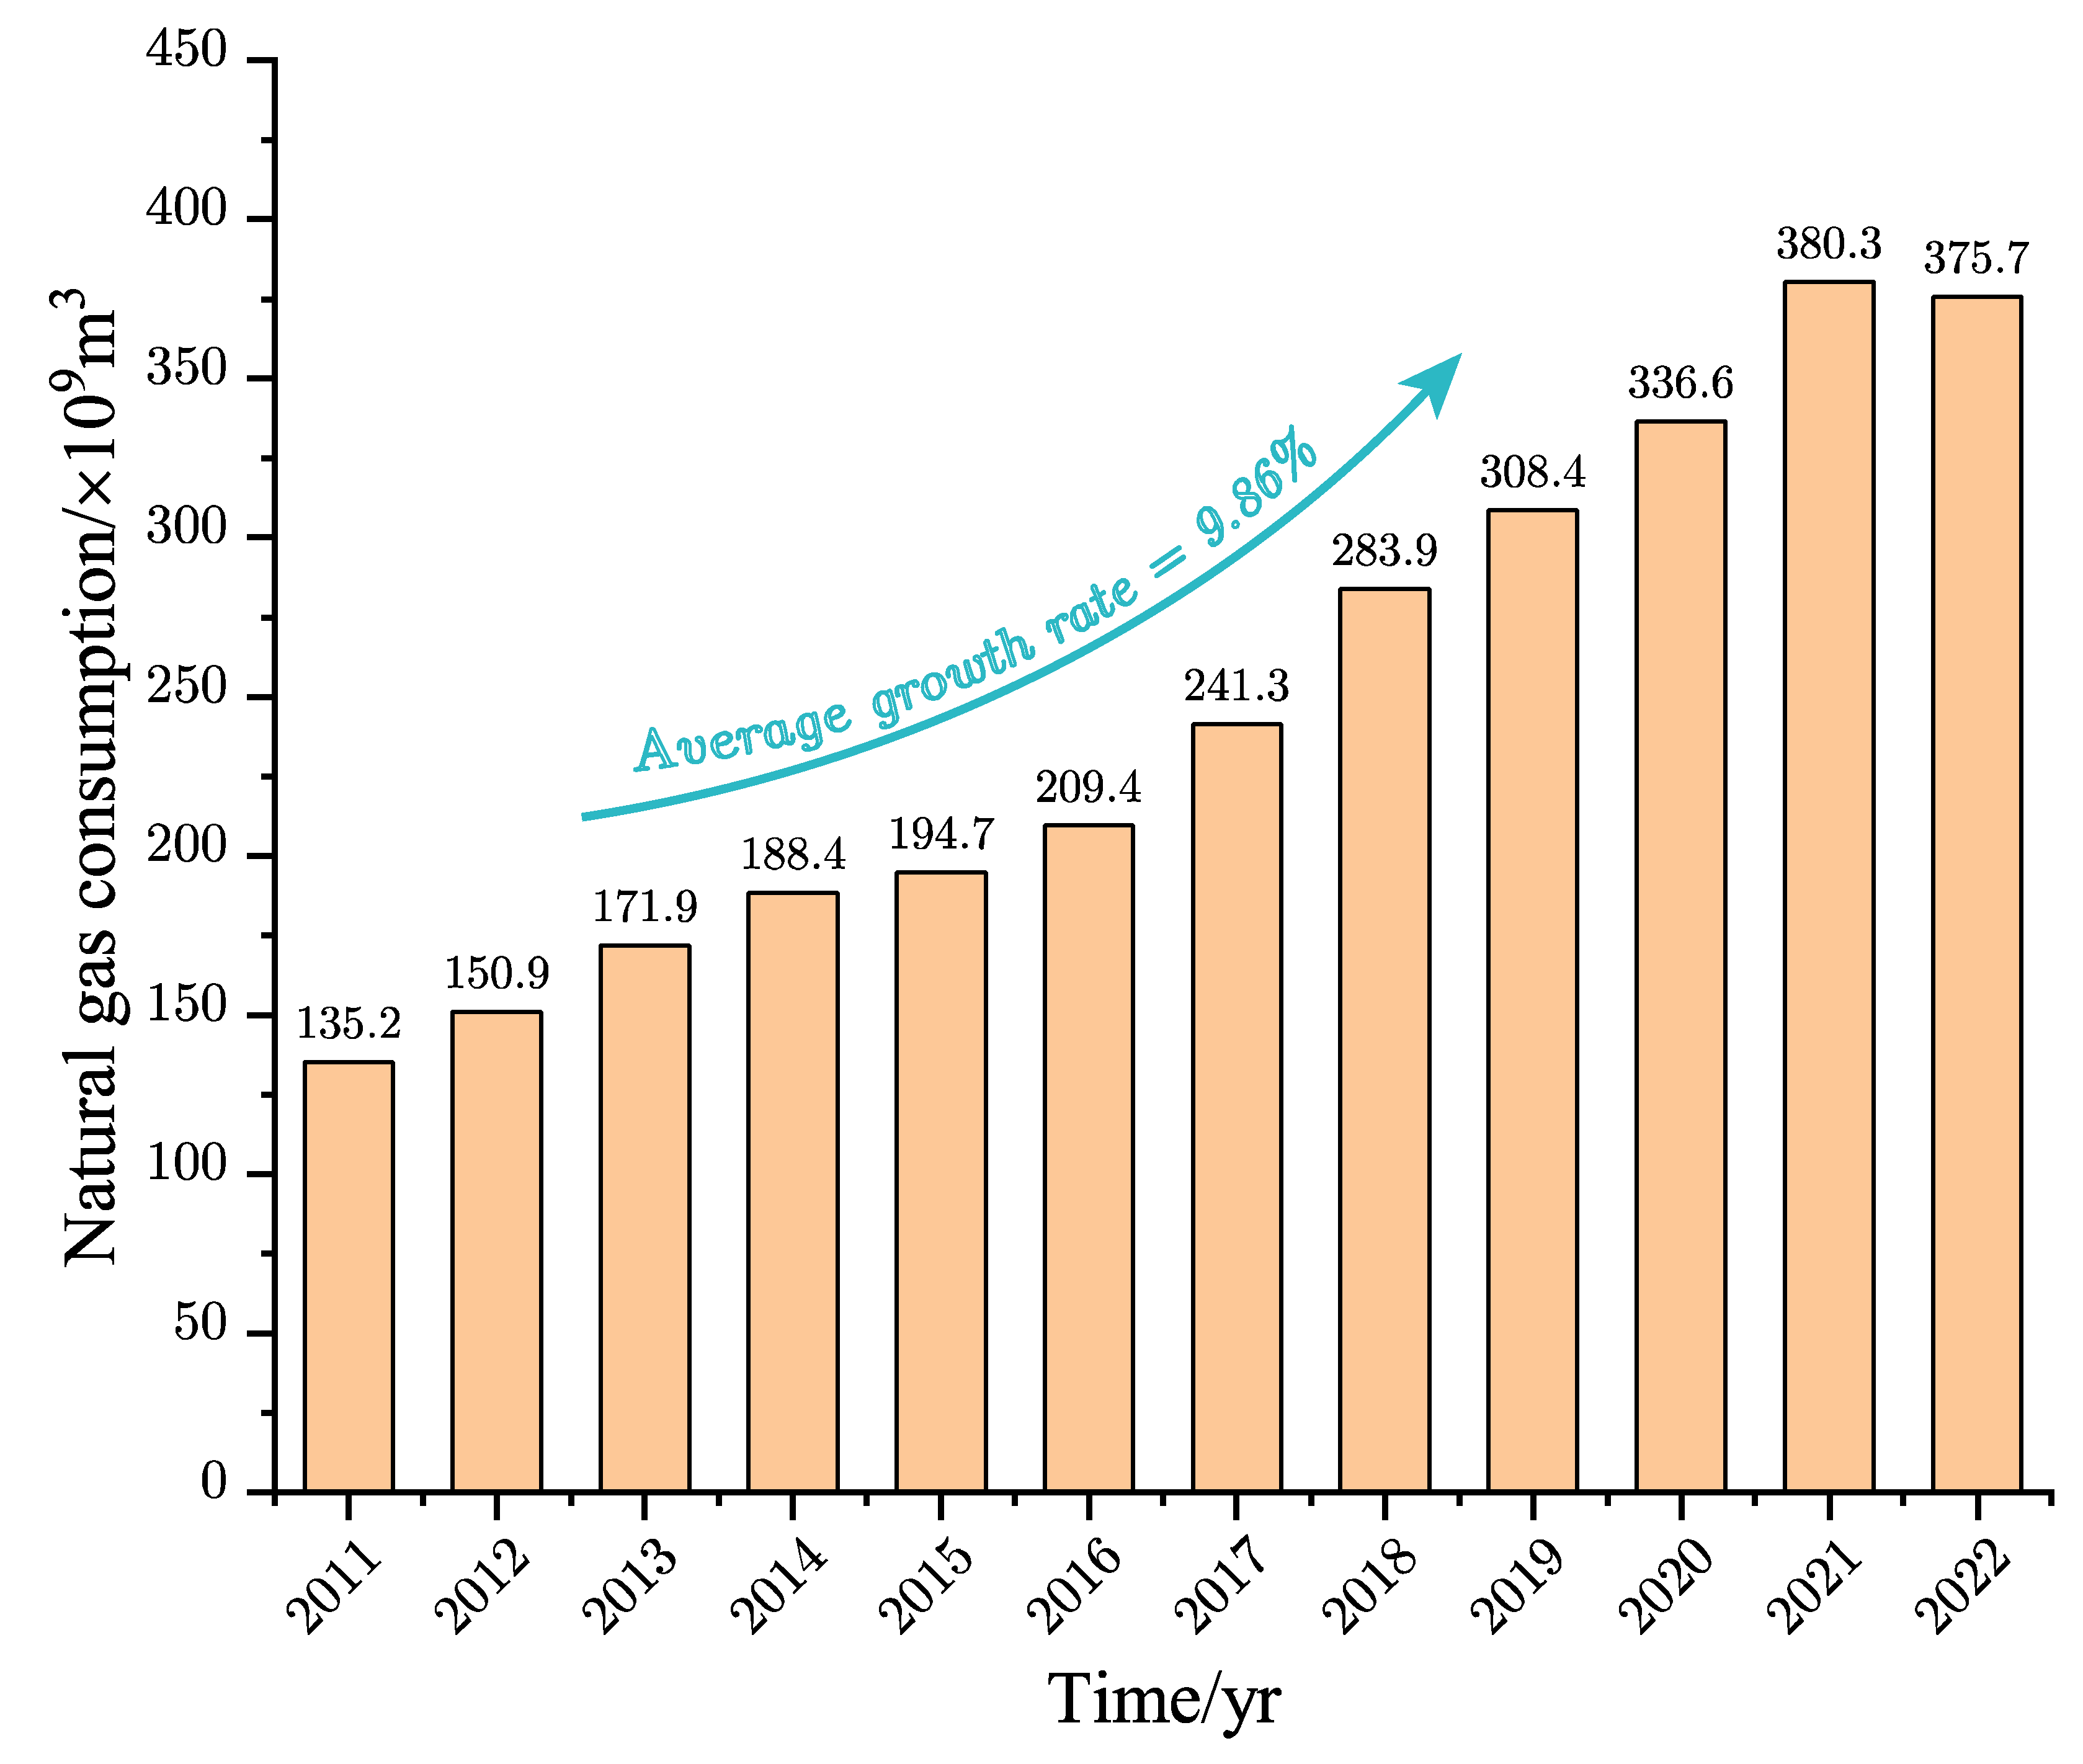
The transition towards carbon neutrality and peak carbon emissions has emerged as the pivotal trajectory guiding global energy development. Among the array of primary energy sources, natural gas, lauded for its environmentally friendly attributes, has garnered significant attention and promotion in China’s energy matrix. Over the past two decades, China has witnessed an exponential surge in natural gas consumption. In 2005, the consumption stood at 46.8 billion cubic meters, soaring to 194.7 billion cubic meters in 2015, and further reaching 375.7 billion cubic meters in 2022. During this period, the contribution of natural gas to China’s primary energy consumption burgeoned from 2.4% in 2005 to 8.4% in 2022 [1]. Figure 1 shows the consumption of natural gas in China from 2011 to 2022, with an average growth rate of 9.86%. The trend underscores the tremendous potential natural gas holds in China’s energy market. However, this promising outlook is accompanied by intricacies stemming from regional disparities in production and consumption. While the primary natural gas reserves are concentrated in the southwestern regions of China, the major centers of consumption are dispersed across the southeastern provinces. Furthermore, pronounced seasonality characterizes natural gas consumption, with demand surging during winter, sometimes exceeding summer usage by ratios exceeding 10:1, as observed in Beijing. Large-scale natural gas storage facilities emerge as a crucial element in maintaining a stable supply of natural gas [2].
Rock salt, characterized by favorable rheology [4,5], ultra-low permeability [6,7], and self-healing property [8], have gained attention as ideal reservoirs for CO2 geologic storage, hydrocarbon underground reserves, and underground waste disposal [9,10,
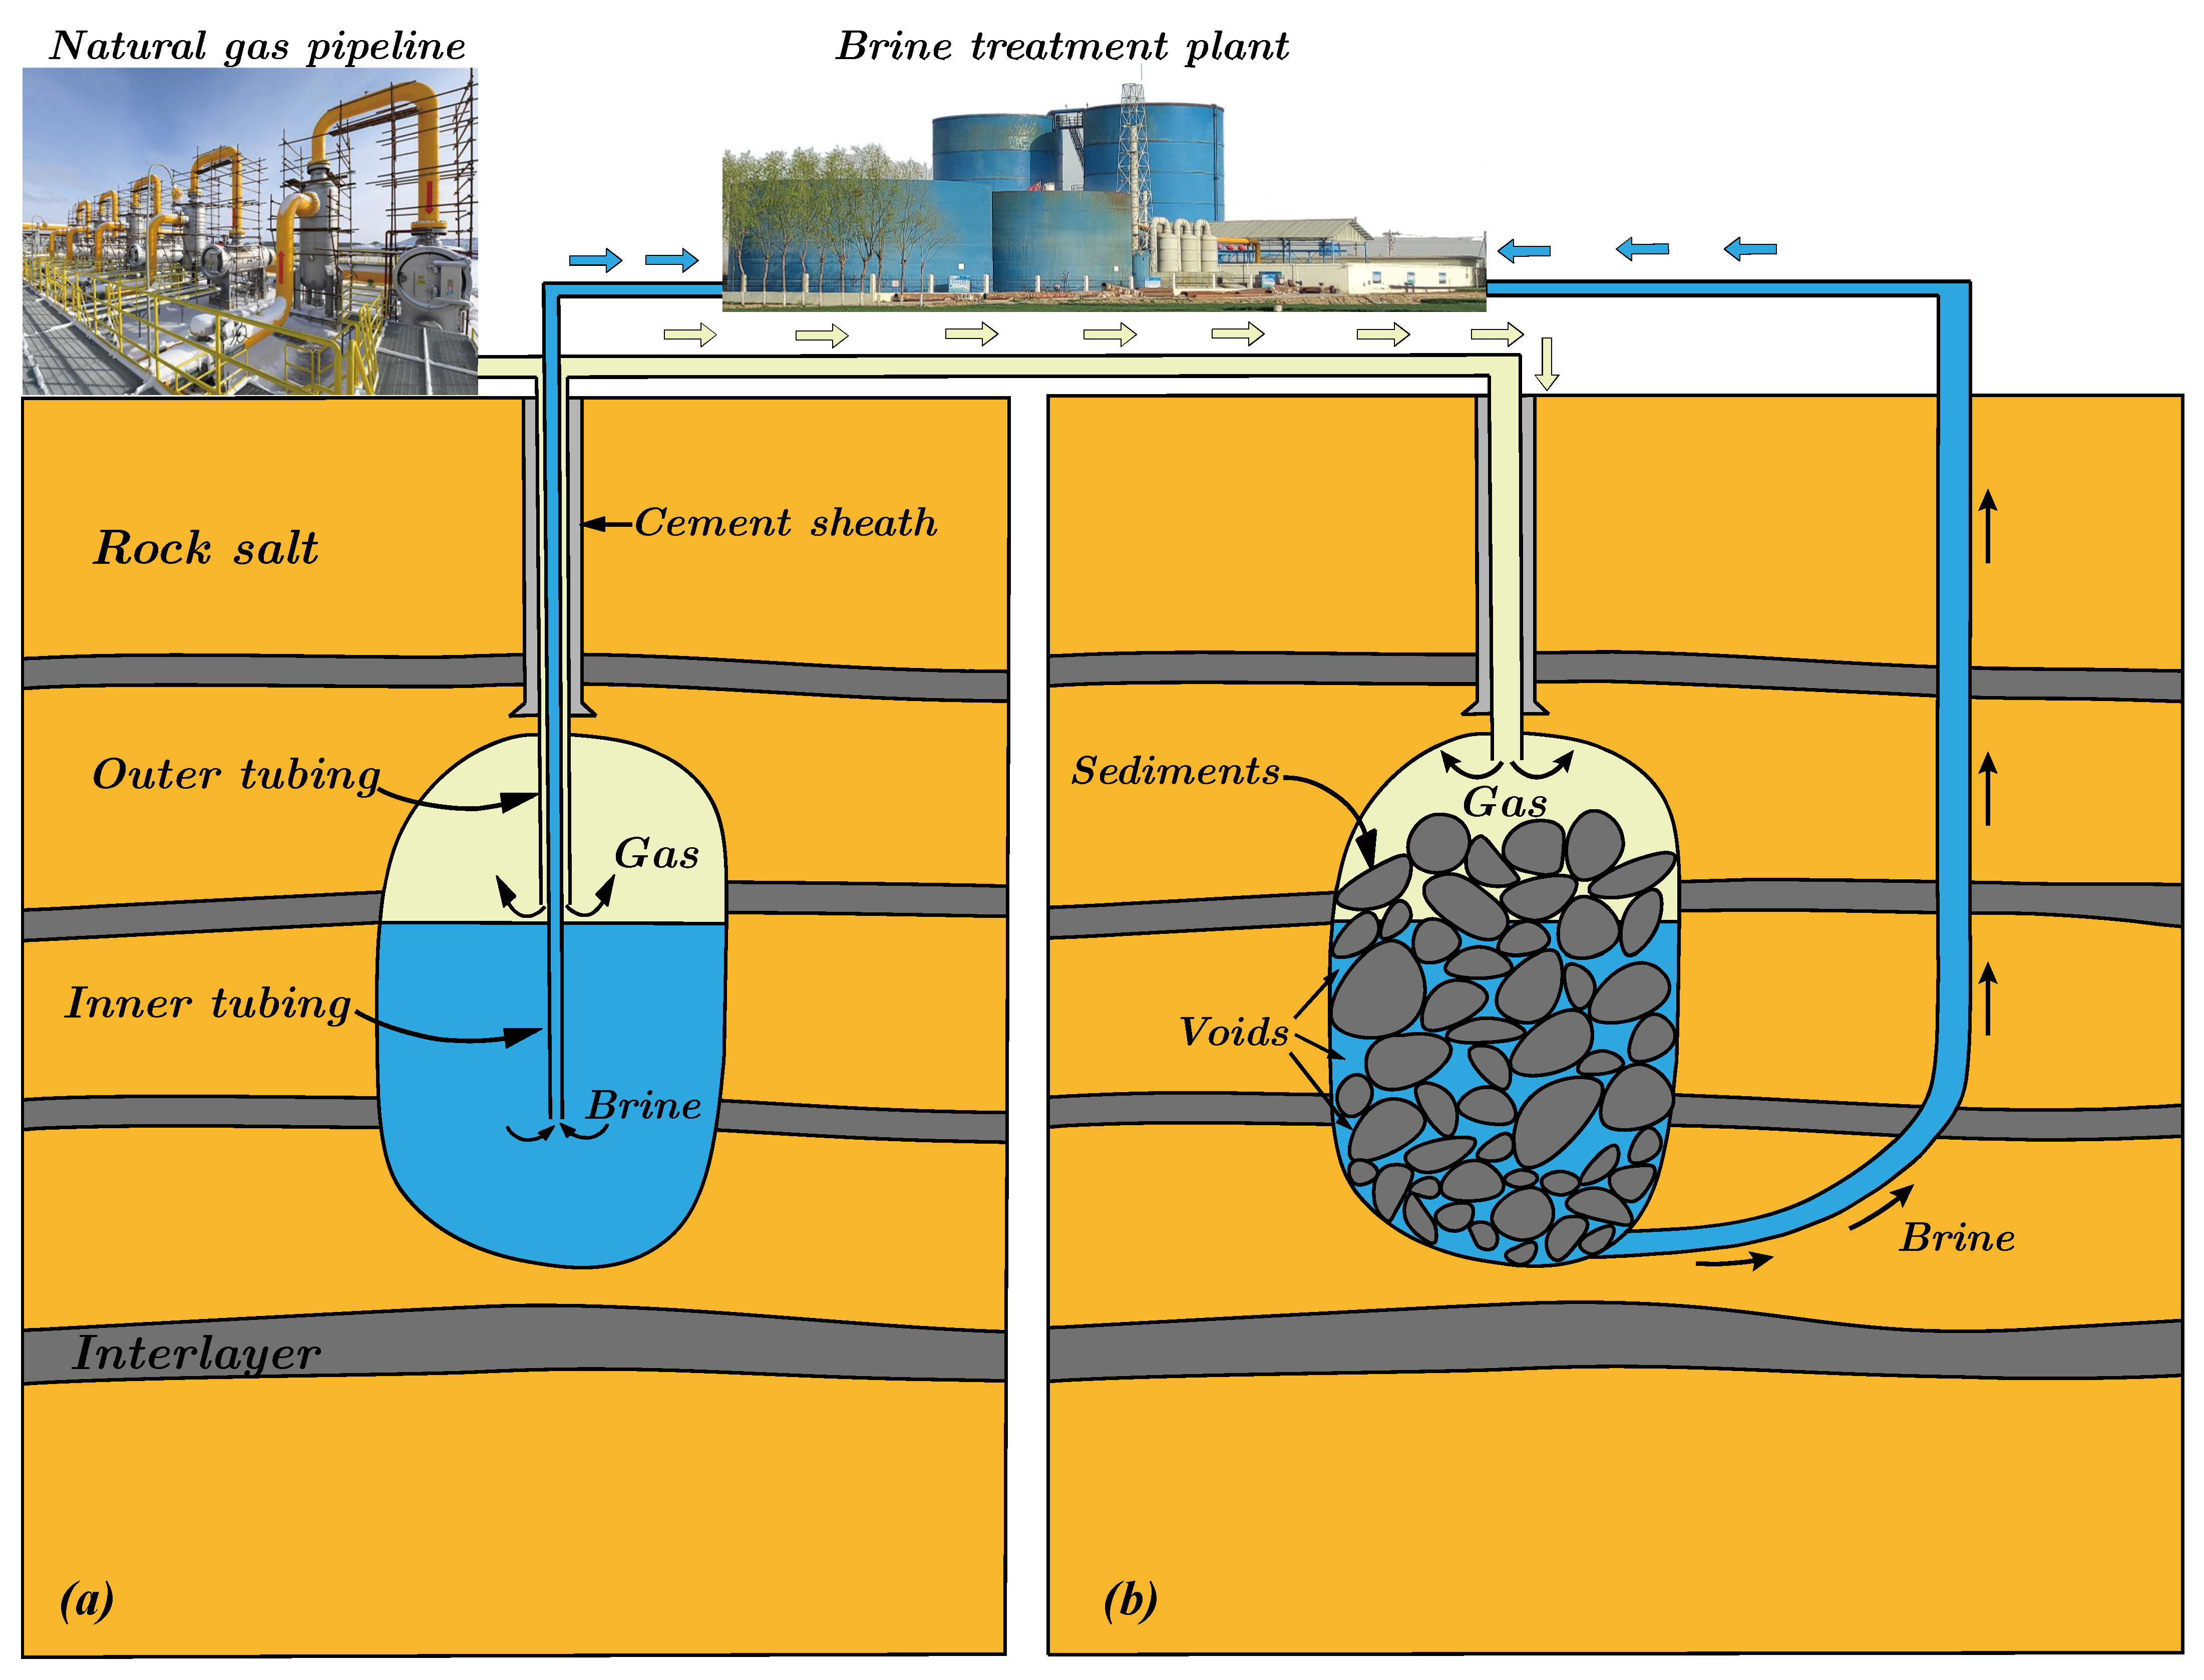
11]. Salt cavern UGS employs water solution mining techniques to create caverns within deep geological formations of salt rock. Freshwater is injected into the salt layer through wells, dissolving the salt rock in the process, and brine is subsequently extracted. This cyclic process continues, leading to the gradual dissolution of the underground salt layer and the formation of a cavern. Finally, a debring process is carried out through gas injection and brine removal to store natural gas within the salt cavern [12], as shown in Figure 2a. However, layered salt rock formations are prevalent in China, often exhibiting a typical interlayered structure with rock layers such as mudstone, dolomite, and anhydrite [13]. During the construction of salt caverns, exceeding a certain threshold of exposed interlayer surface area can result in collapse [14]. Fragments of these interlayers accumulate at the cavern base, forming what is referred to as sediment. In the case of the Dawenkou salt mine in China, for example, the cumulative thickness of the interlayers can account for up to 50% of the thickness of the salt-bearing strata, and when the bulking-expansion effect is taken into account [15], the accumulation volume of the sediment can even exceed 80% of the volume of the salt cavern. From the experience of traditional salt cavern UGSs, the volume filled with sediment is rendered unusable. Consequently, to minimize the volume occupied by sediment, it is generally recommended to establish salt cavern UGSs within salt-bearing formations with as low an interlayer proportion as possible. In order to overcome the limitations imposed by geological conditions on salt cavern UGS construction, the concept of utilizing the voids within the sediment for natural gas storage has been proposed. In this approach, the debring process still involves injecting gas and removing brine, but due to the hindrance posed by the sediment, the brine removal process must rely on a well directly connected to the base of the salt cavern, as depicted in Figure 2b.
A large number of scholars have carried out studies on the stability of underground caves under various conditions [16,17,18]. Studies on the effect of filled bulk on the stability of the surrounding rock are common in the field of mining [19,20]. It is generally accepted that force transfer between the filled bulk and the surrounding rock is achieved through point contact and that the bulk increases the stability of the surrounding rock. Similarly, sediment is generally believed to suppress the creep contraction of salt caverns due to the support it provides to the surrounding rock. Similarly, it is this aspect that suggests sediment-filled salt cavern UGS could potentially reduce the minimum internal gas pressure of salt cavern, thus enhancing UGS operational capabilities. In summary, sediment is thought to influence the stability of salt cavern, yet targeted research in this area is lacking. Presently, research on sediment within salt caverns primarily focuses on characterizing the physical state of sediment. For instance, Li et al. [21] employed fractal theory to predict the porosity of insoluble materials, observing that porosity decreases with an increase in fractal dimension. Zheng et al. [22] found that the porosity of accumulated insoluble materials was approximately 50% and conducted simulation experiments to demonstrate the drainage of brine from sediment voids. Li et al. [23] employed a coupled model to analyze interlayer failure patterns and sediment accumulation forms. Liang et al. [24] proposed a method for predicting sediment void volume based on brine compression and salt cavern deformation. However, research on the stability of sediment-filled salt caverns remains limited. In previous stability assessments of salt cavern UGS, the effect of sediment on caverns was often simplified as fluid pressure applied to the interior walls of the salt cavern or the shape and size of sediment were entirely neglected and simplified as spheres [25]. These simplifications hinder a realistic portrayal of the interaction between sediment and salt cavern, thus preventing an accurate assessment of sediment’s impact on cavern stability.
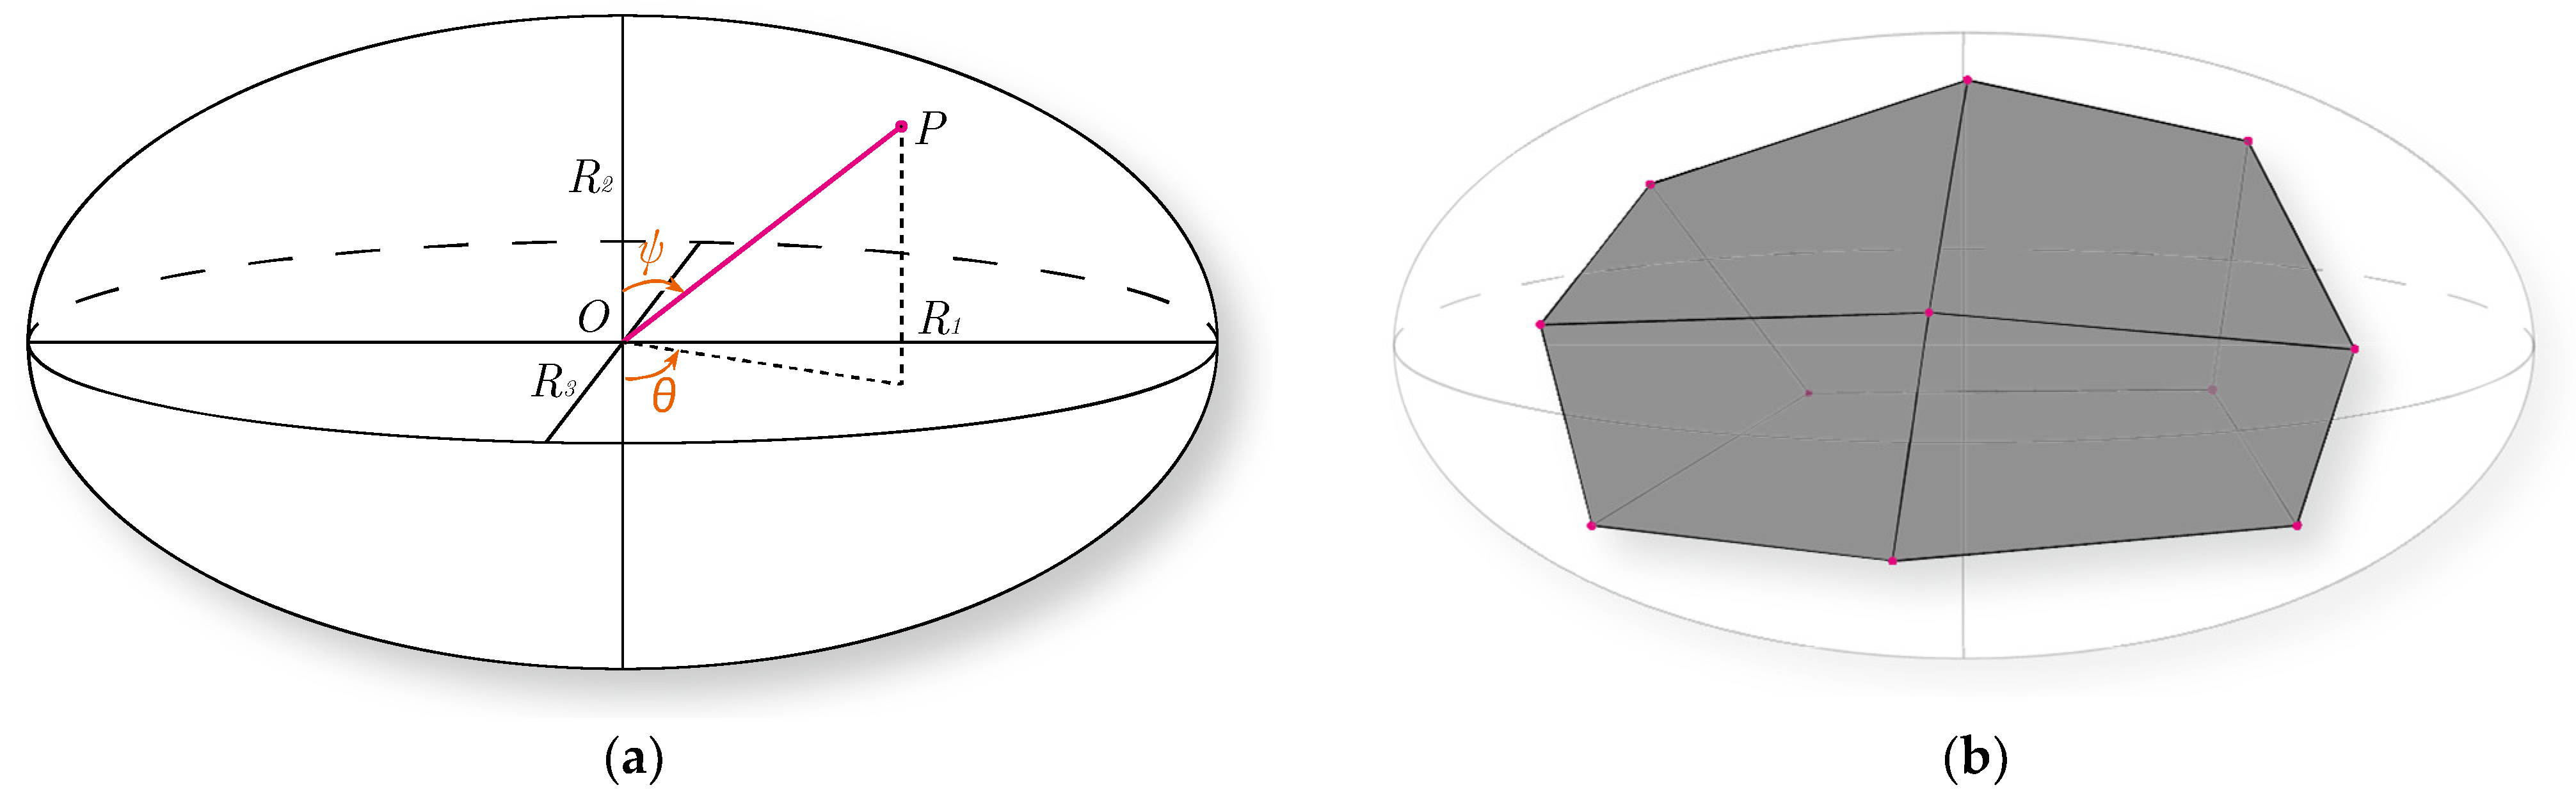
To investigate the influence of sediment on salt cavern stability, we first examined the interaction process between sediment and salt cavern, identifying the conditions for equilibrium in this process. Furthermore, a new method for modeling sediment-filled salt caverns using the discrete element software 3DEC 5.0 is presented. The sediment and salt caverns are modeled as rigid and deformable blocks, respectively. We utilized an ellipsoidal elemental framework to simulate sediment blocks, meeting the desired requirements for simulation. We separately simulated the 30-year operation of salt cavern UGS without sediment and sediment-filled salt cavern UGS at various internal gas pressures using 3DEC. We compared and analyzed the impact of sediment on salt cavern stability using five indicators: deformation, effective volume contraction rate, plastic zone, equivalent strain, and safety factor. The results demonstrate that sediment can effectively inhibit cavern volume contraction, reduce the cavern’s plastic zone, and improve the creep damage and expansion failure phenomena in salt rock during operation. In conclusion, sediment-filled salt cavern UGS offers a more stable and secure gas storage condition compared to salt cavern UGS without sediment. This study contributes as a reference for the stability assessment of sediment-filled salt cavern UGS.

2. Interaction between Sediment and Salt Cavern

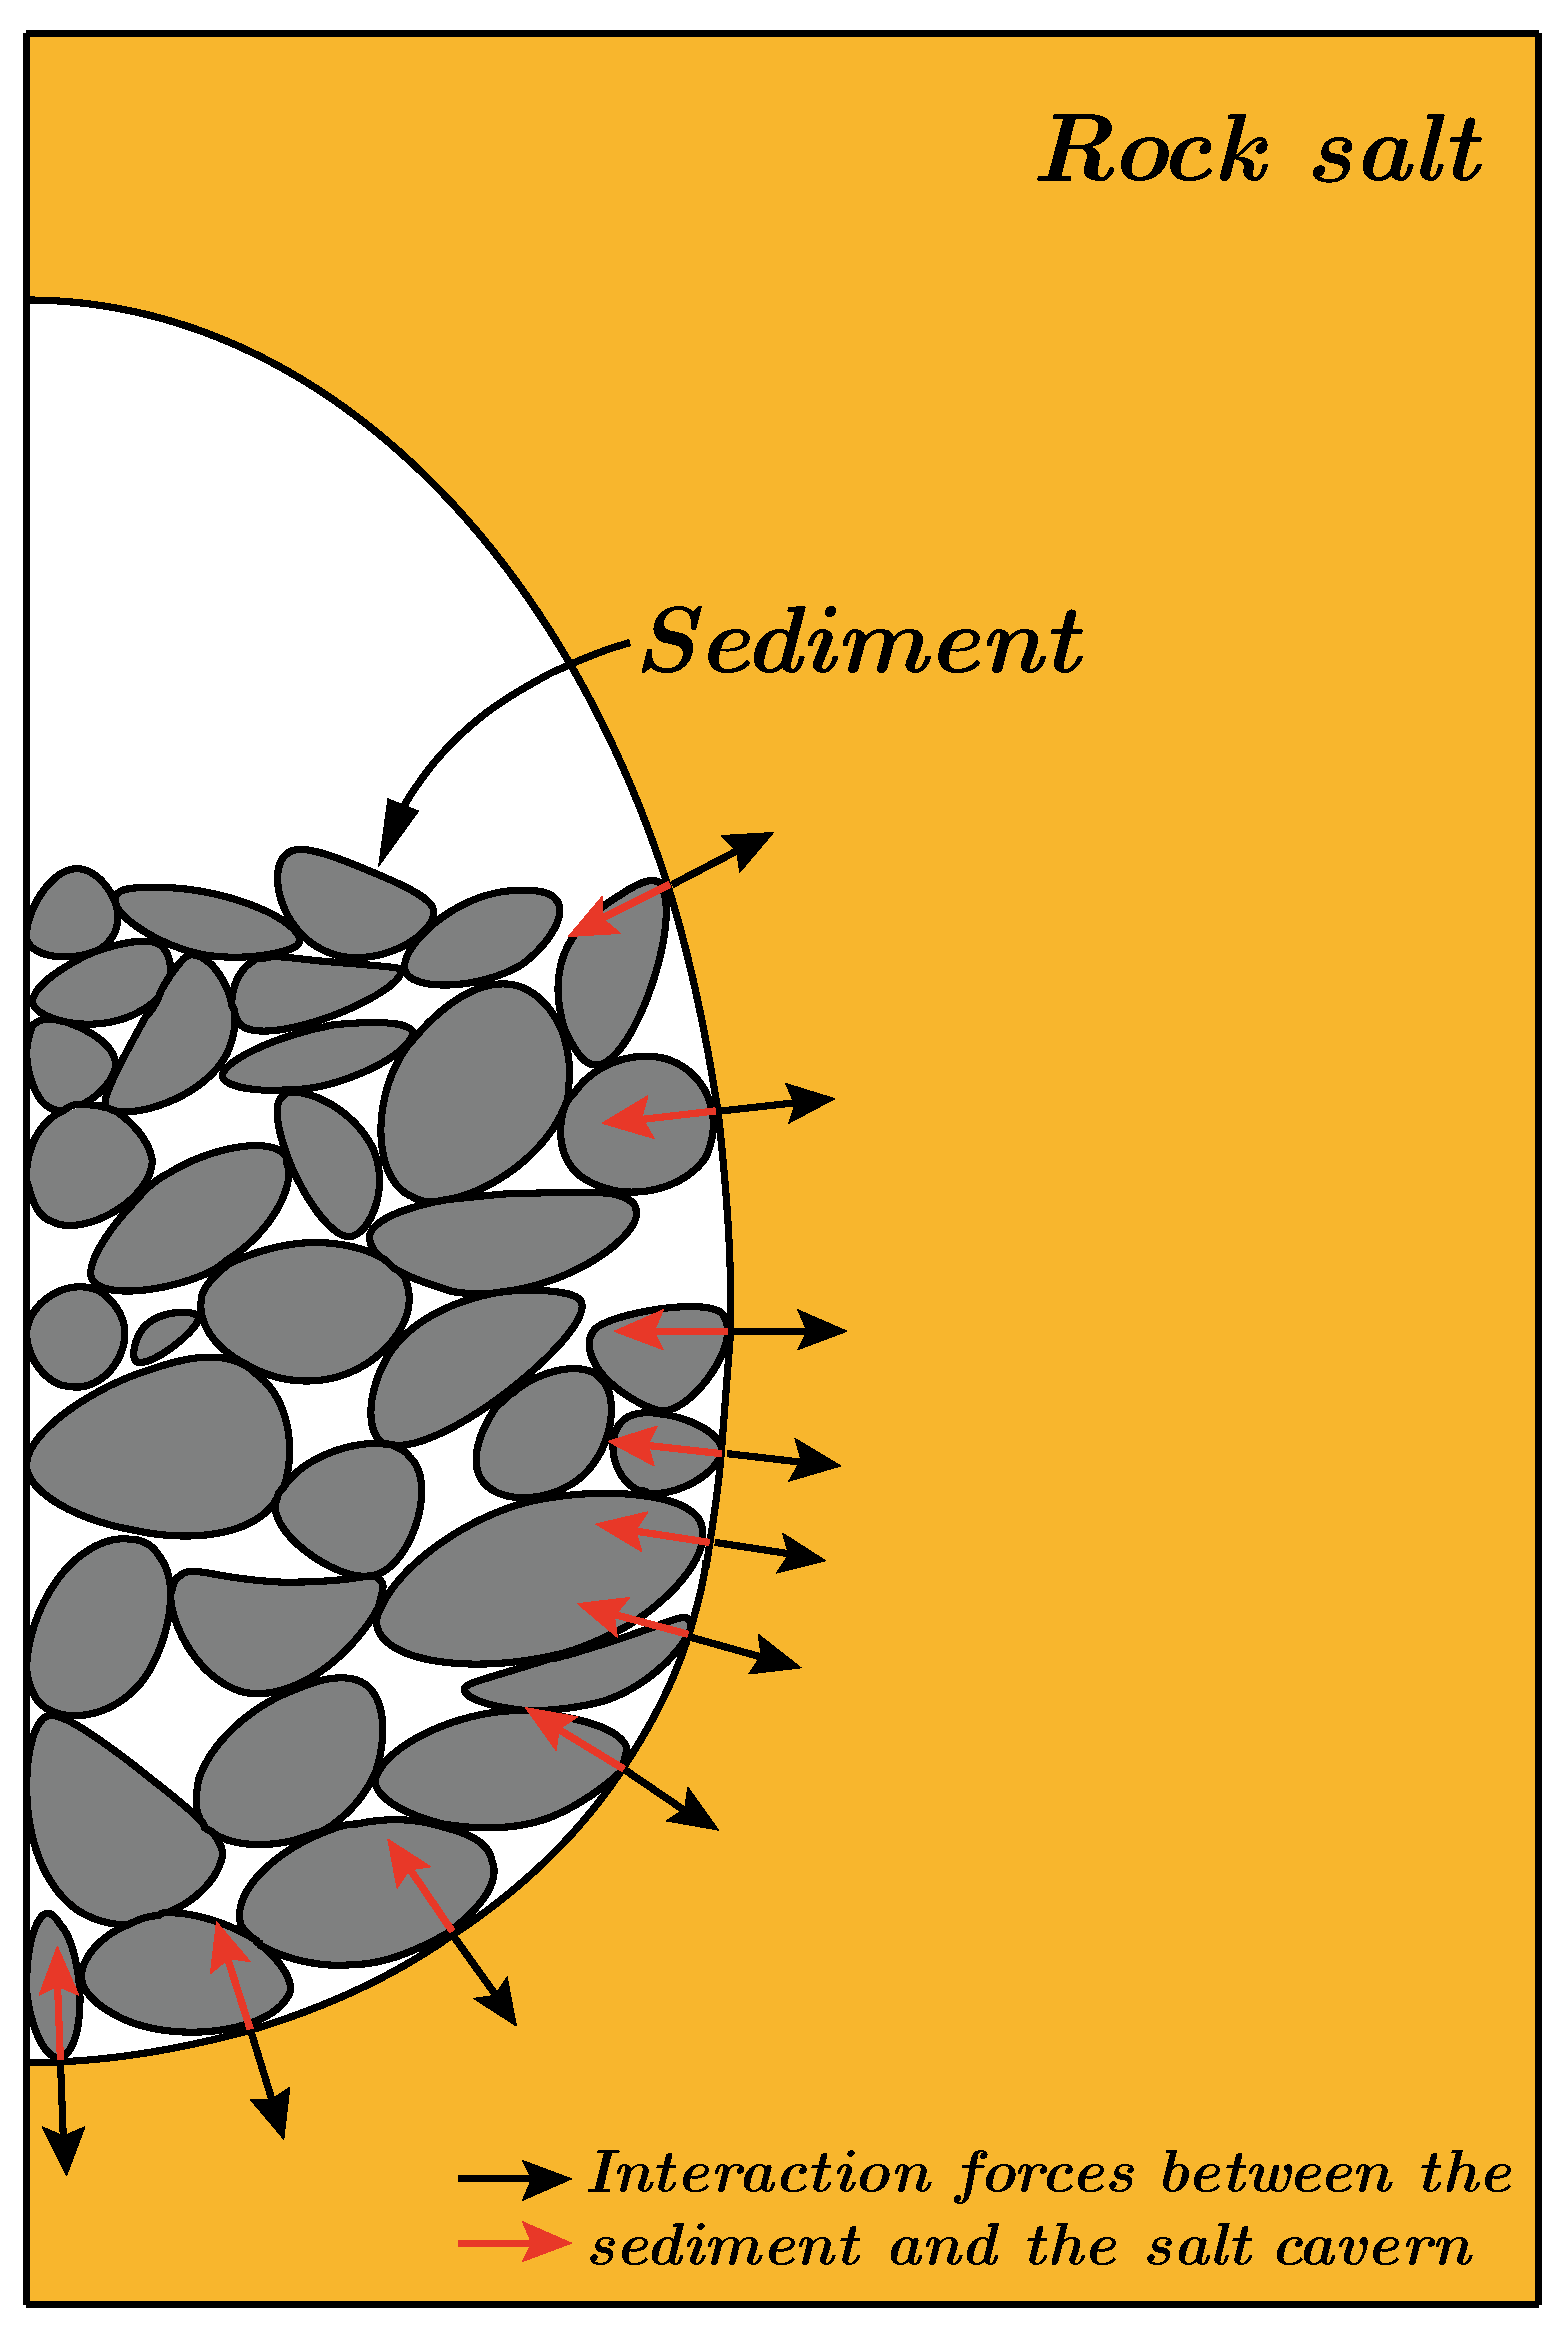
Salt rock exhibits remarkable rheological behavior, manifesting creep phenomena when there is non-zero deviatoric stress within the salt rock. Traditional salt cavern UGS relies on adjusting internal gas pressure to control the ultimate deformation of caverns during their design service life. The internal gas pressure diminishes the deviatoric stress within the cavern rock, resulting in smaller creep deformation over the specified time period. Internal gas pressure merely imparts a fixed force to the surrounding rock, rendering it a flexible constraint on cavern deformation. In contrast, sediment within the cavern can be considered a rigid constraint. Sediment transmits force to the cavern rock through contact (as depicted in Figure 3), and the interaction between sediment and the salt cavern changes as both entities deform. Moreover, as an actual entity within the cavern, sediment establishes a definitive boundary for cavern deformation. This boundary is reached when the cavern contracts to a point where further compression of sediment is not feasible. At this juncture, both the force and displacement between sediment and the cavern achieve a stable state. These are the primary characteristics of deformation in sediment-filled salt caverns.
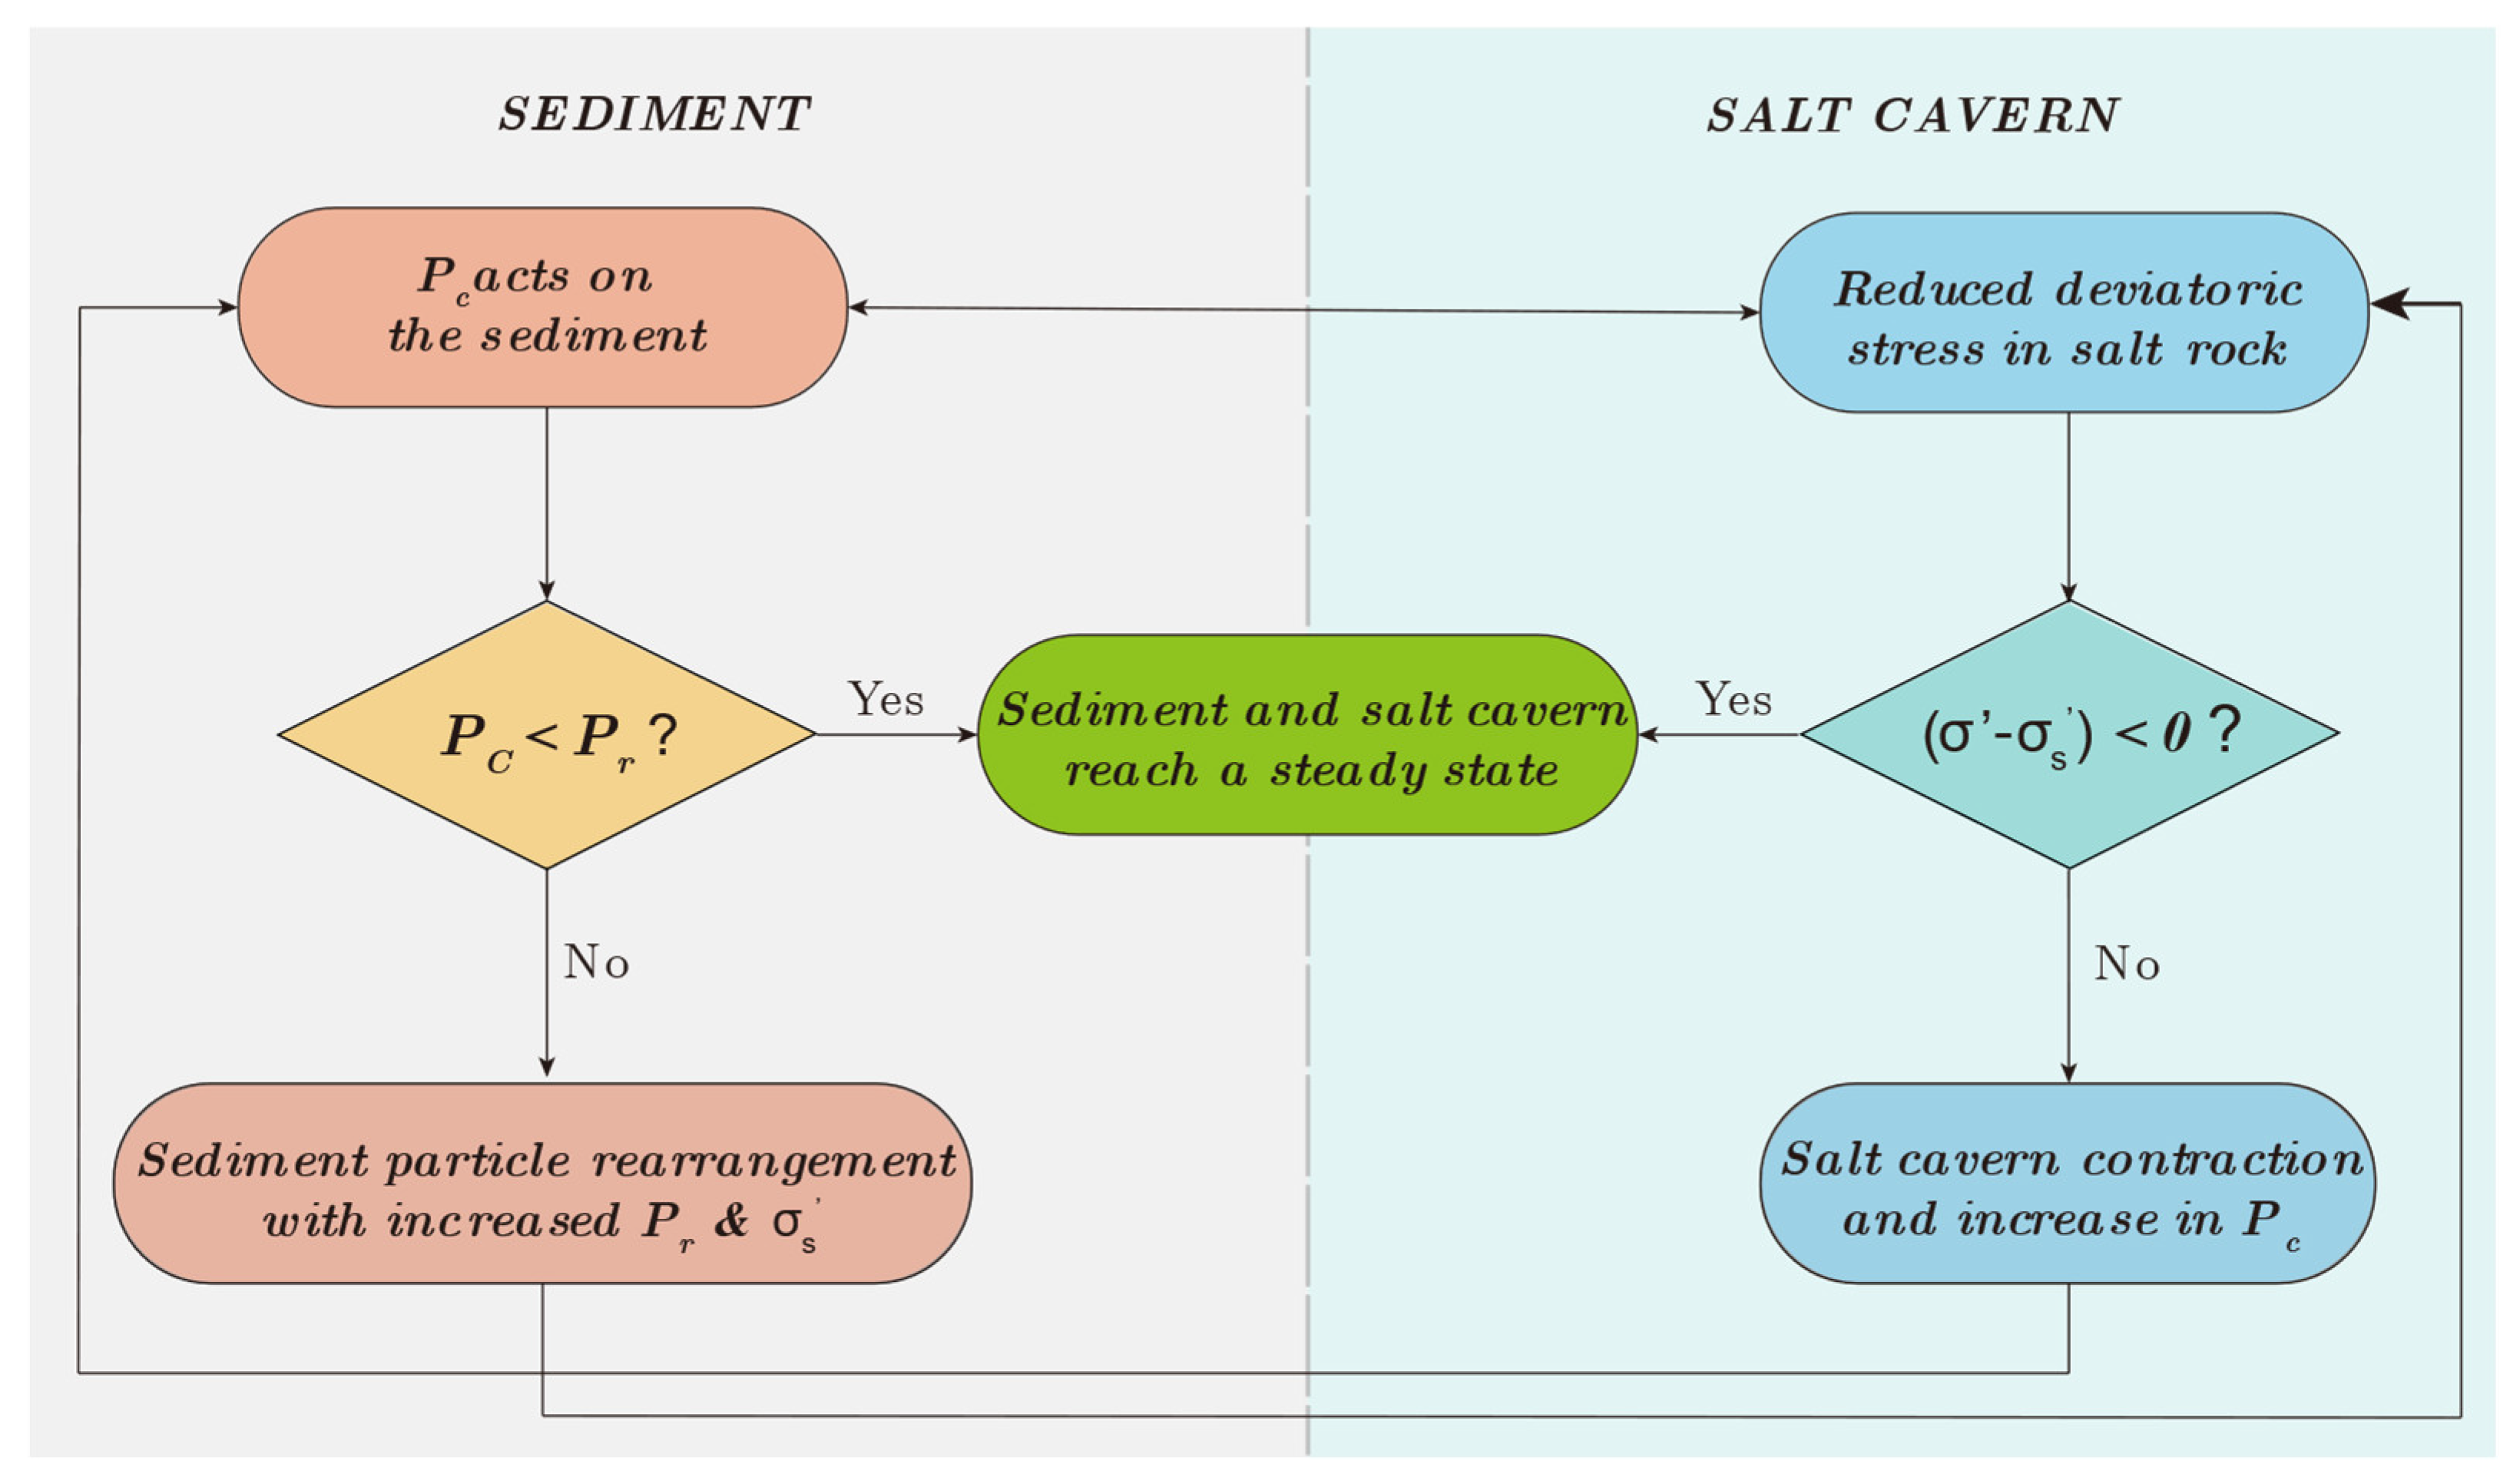
The spatial arrangement of sediment particles dictates the upper limit of external pressure it can withstand, termed the system resistance of sediment. We denote the existing system resistance of sediment as P r . This is due to the overall compressive force exerted on sediment resulting from cavern contraction, denoted as P c . Rock salt creep is governed by deviatoric stress, represented by σ , the in-situ stress of salt rock. Given the reduction in deviatoric stress within the salt rock due to sediment support, represented by σ s , the interplay between sediment and the cavern can be visually illustrated through a process diagram, as depicted in Figure 4.

3. Computational Principles

In this paper, the simulation of sediment-filled salt caverns is carried out using 3DEC, a 3-dimensional discrete element method software. 3DEC is widely used in the analysis of rock engineering projects and is particularly suited to the study of potential damage patterns directly related to discontinuity features. The basic unit in 3DEC is the block, which can be either rigid or deformable (by subdivision into elements). There are 20 built-in material models available for deformable blocks, including creep models, shear yield models, etc. 3DEC is based on a dynamic (time-domain) algorithm that solves the equations of motion of the block system by an explicit finite difference method.
In this paper, we simulate the sediment using rigid blocks, and the surrounding rock of the salt cavern is simulated with deformable blocks, whose deformation is controlled by the creep constitutive equations, which mainly take into account the remarkable rheological property of the rock salt. The basic logic of 3DEC for computing the motion of rigid blocks, deformable blocks and the interaction between different blocks through contact is briefly described, which references the manuscript of 3DEC [26].

3.1. Motion of a Rigid Block

The translational and rotational equations of motion for a single block can be expressed as Equation (1) and Equation (2), respectively.
x ¨ i + α x ˙ i = F i m + g i
ω ˙ i + α ω i = M i I
where x ¨ i the acceleration of the block centroid, i take the values 1 to 3, and denote components of a vector or tensor in the global coordinate system; x ˙ i the velocity of the block centroid; α the viscous (mass-proportional) damping constant; F i sum of forces acting on the block (from block contacts and applied external forces); m is the block mass; and g i is the gravity acceleration vector, ω i is the angular velocity of the i -axis, ω ˙ i is the angular accelerations of the i -axis, M i is a component of torque of the i -axis applied to the block, I is the moment of inertia of the block.
A central finite-difference procedure is used to integrate the equations of motion. Then the translational and rotational velocities of the block at time t can be expressed by Equation (3):
x ˙ i ( t ) = 1 2 x ˙ i t Δ t 2 + x ˙ i t + Δ t 2 ω i ( t ) = 1 2 ω i t Δ t 2 + ω i t + Δ t 2
Equation (4) represents the translational and angular acceleration of the block:
x ¨ i ( t ) = 1 Δ t x ˙ i t + Δ t 2 x ˙ i t Δ t 2 ω ˙ i ( t ) = 1 Δ t ω i t + Δ t 2 ω i t Δ t 2
The velocities at time t + ( Δ t / 2 ) can be obtained via Equations (1)–(4). Further, the increment of translation Δ x i and increment of rotation Δ θ i are given by Equation (5):
Δ x i = x ˙ i t + Δ t 2 Δ t Δ θ i = ω i t + Δ t 2 Δ t
The position of the block centroid is updated as Equation (6):
x i ( t + Δ t ) = x i ( t ) + Δ x i
The new locations of the block vertices are given by Equation (7):
x i v ( t + Δ t ) = x i v ( t ) + Δ x i + e i j k Δ θ j x k v ( t + Δ t / 2 ) x k ( t + Δ t / 2 )
where, x i v ( t ) is the value of the coordinates of the vertex v at moment t , e i j k is the permutation matrix, x k are the coordinates of the centroid of the block, j , k take the values 1 to 3, and denote components of a vector or tensor.

3.2. Motion of a Deformable Block

The vertices of the tetrahedral elements are gridpoints, and the equations of motion for each gridpoint are formulated as:
u ¨ i = s σ i j n j d s + F i m + g i
where S is the surface enclosing the mass m , lumped at the gridpoint; n j is the unit normal to S ; F i is the resultant of all external forces applied to the gridpoint (from block sub-contacts or otherwise); and g i is the gravitational acceleration.
F i = F i z + F i c + F i l
where F i l is the externally applied force and F i c is the sub-contact force, which exists only at the gridpoints along the block boundary, F i z results from the contribution of the internal stresses in the zones adjacent to the gridpoint.
When the force at the node is not zero, the acceleration of the gridpoint is denoted by Equation (10):
u ˙ i ( t + Δ t / 2 ) = u ˙ i ( t Δ t / 2 ) + F i ( t ) Δ t m
within each timestep, the strains and rotations are expressed in terms of the nodal displacement as Equation (11):
ε ˙ i j = 1 2 ( u ˙ i , j + u ˙ j , i ) θ ˙ i j = 1 2 ( u ˙ i , j u ˙ j , i )
The constitutive relations for deformable blocks are used in an incremental form so that implementation on nonlinear problems can be accomplished easily. The actual form of the equations is expressed as Equation (12).
Δ σ i j e = λ Δ ε v δ i j + 2 μ Δ ε i j
where λ and μ are the lame constants; Δ σ i j e are the elastic increments of the stress tensor; Δ ε i j are the incremental strains; Δ ε v is the increment of volumetric strain; and δ i j is the Kronecker delta function.

3.3. Interaction between Blocks

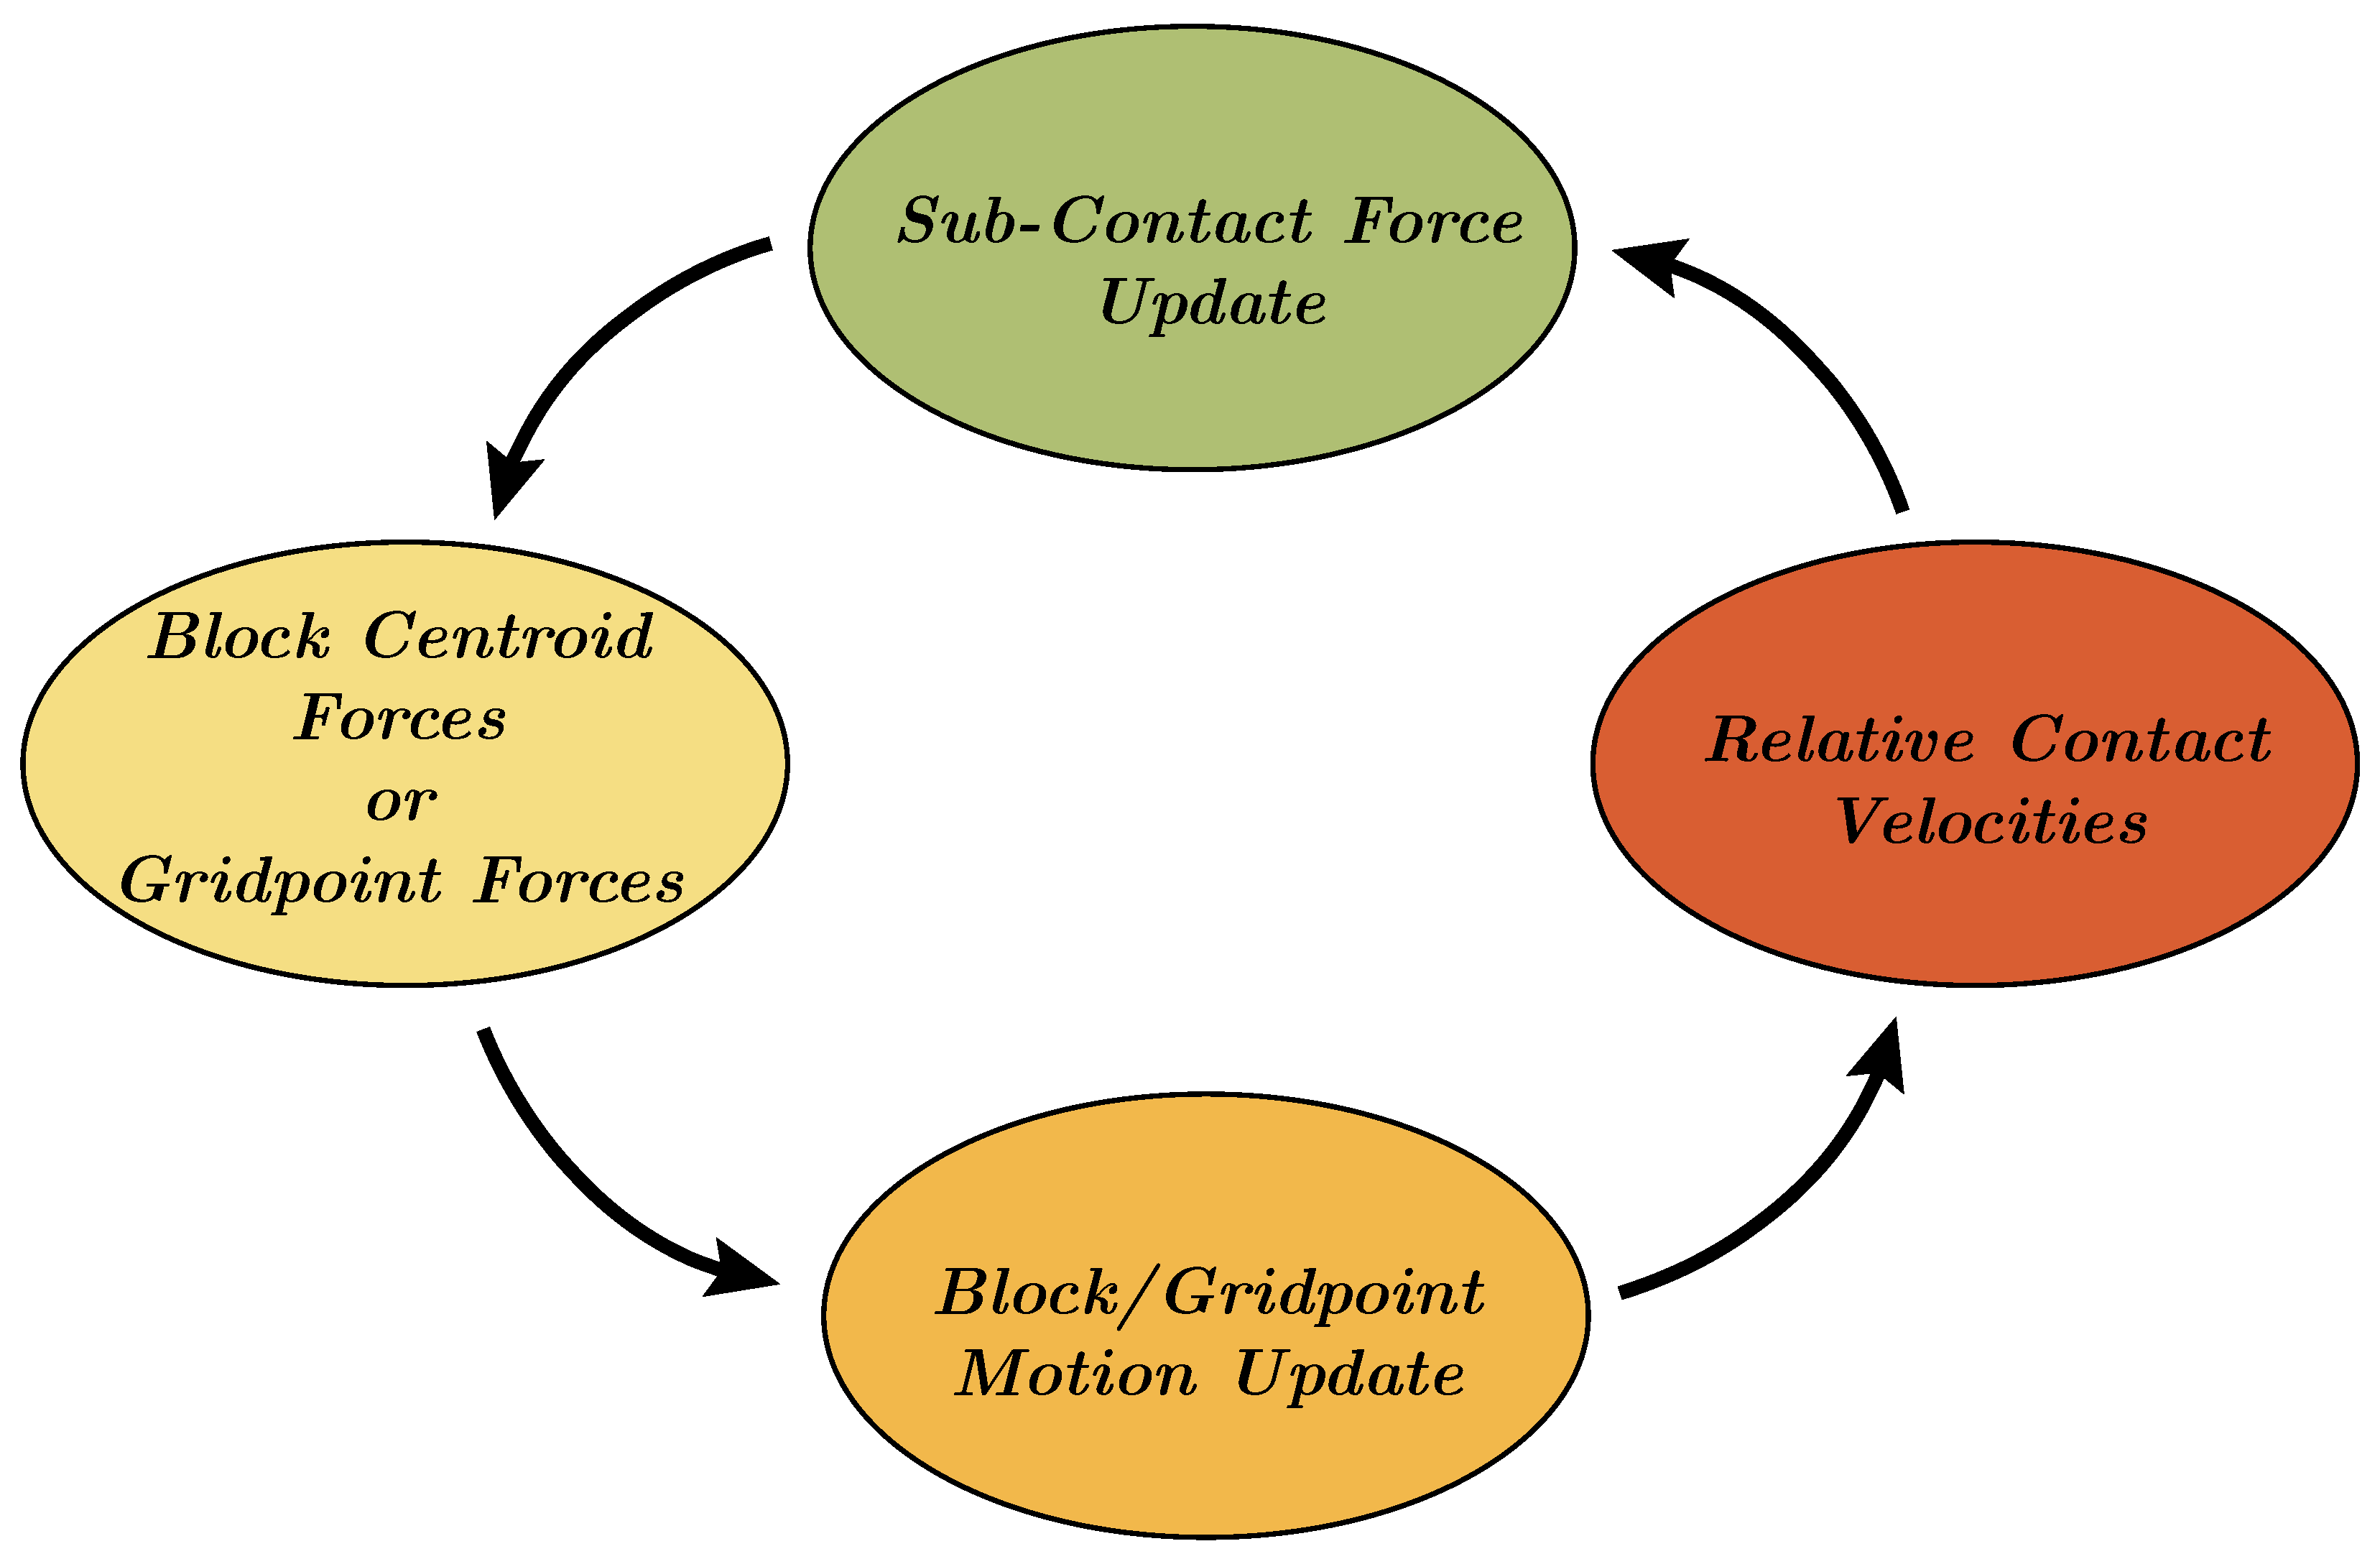
At each time step, the laws of motion and constitutive equations are applied. Sub-contact force-displacement relationships are specified for both rigid and deformable blocks. Integration of the laws of motion provides the new block position and, therefore, the contact displacement increment (or velocity). The new sub-contact force is then obtained using the sub-contact force-displacement law and applied to the block in the next timestep. The mechanical calculation cycle is shown in Figure 5.
The interaction between blocks relies on contact. The first thing that needs to be known is the relative velocity of the motions of block A and block B when contact occurs, i.e., the relative contact velocity, which determines the relative displacement increment at the sub-contact in the next time step. For a rigid block, the relative contact velocity can be expressed as Equation (13):
V i = x ˙ i B + e i j k ω j B ( C k B k ) x ˙ i A e i j k ω j A ( C k A k )
where A k , B k , are the position vectors of the centers of blocks A and B , respectively, and C k is the reference point of the common plane, which is determined by the relative positions of blocks A and B , and is used to judge the contact relationship between A and B .
For deformable blocks, it is necessary to calculate the velocity at the contact using linear interpolation, as shown in Equation (14). To compute the weight factor, the coordinates of the three points on the face need to be transformed into a local reference system, which is located in the face plane. The coordinates of vertex a can be expressed within this coordinate system as X a and Y b .
V i F = W a V i a + W b V i b + W c V i c
where, W a = ( Y c X b Y b X c ) / ( X a X c ) ( Y b Y c ) ( X b X c ) ( Y a Y c ) , The other two factors can be obtained by circular permutation of the superscripts a , b , and c .
The relative velocity of the contact involving the deformable block is expressed as Equation (15):
V i = V i V V i F
The contact displacement Δ U i can be expressed as Equation (16):
Δ U i = V i Δ t
Using the constitutive equations of contact (the elastic constitutive equations are used here as an example), it is possible to calculate the normal and shear force increments at the contact by Equation (17):
Δ F n = K n Δ U n A c Δ F i s = K s Δ U i s A c
The updated normal and shear forces at the sub-contact are expressed as Equation (18):
F n : = F n + Δ F n F i s : = F i s + Δ F i s
For a rigid block, the sum of forces and moments is updated, as shown in Equation (19):
F i A : = F i A F i M i A : = M i A e i j k ( c j A j ) F k
For deformable blocks, on the vertex side of the sub-contact, this force is added to the other gridpoint forces. On the face side, the force is distributed among the three vertices ( a , b , c ), using the interpolation factors defined as Equation (20):
F i a : = F i a ± F i W a F i b : = F i b ± F i W b F i c : = F i c ± F i W c

4. 3D Geomechanical Model

4.1. Modeling of Sediment

The model of sediment blocky particles is developed using an ellipsoidal elemental framework. On the specified elemental surface, a defined number of points are randomly selected to serve as vertices for the sediment blocky particle. Leveraging the topological associations between points and faces within a polyhedron, the chosen points are interconnected through triangular faces to form a self-contained blocky structure. The precise process can be elucidated as follows [27]:

4.1.1. Selection of Random Vertices for Blocky Particles

For a given ellipsoidal elemental framework, as shown in Figure 6a, the position of any point on the ellipsoid surface in a spherical coordinate system can be defined by five parameters (R1, R2, R3, θ, φ), where R1, R2, and R3 correspond to the semi-axes lengths of the ellipsoid’s first, second, and third principal axes, respectively.
When employing an ellipsoidal elemental framework to construct a polyhedron with N vertices, the ellipsoid is initially partitioned into upper and lower portions. Subsequently, distinct random points are independently selected from the surfaces of these two partitions to serve as vertices of the polyhedron, as shown in Figure 6b. The Ni vertices are positioned on the upper surface of the ellipsoidal elemental framework. The values of θ and φ for these random vertices can be determined through the following equations:
θ i = 2 π N i + δ 2 π N i ( 2 η 1 1 ) φ i = η 2 π 2 i = 1 , 2 , 3 , N i
where η 1 and η 2 are two independent random variables that take values within the interval [0, 1], and δ is a coefficient, set to 0.3 in this context. The remaining (NNi) vertices will be obtained from the lower surface of the ellipsoidal elemental framework, and the positions of these vertices can likewise be determined using Equation (21).

4.1.2. Connecting Random Vertices of Polyhedra

For any given convex polyhedron, there exists a distinct topological relationship between the vertices and faces in space: each face connects three vertices, with all other vertices positioned on the same side of the face. Leveraging this topological arrangement, we establish a convex polyhedron by interconnecting the random vertices on the ellipsoidal elemental framework using triangular faces.
Initially, each vertex p i is traversed to identify the vertex p j closest to it. Subsequently, from the remaining vertices, a vertex p k is selected such that the (N − 3) remaining vertices lie on the same side of the triangular plane formed by the points p i , p j and p k . Upon systematically iterating through all vertices, duplicate triangular faces are eliminated, leaving behind the remaining faces that constitute the external surface of the polyhedron.

4.2. 3D Geomechanical and Boundary Conditions

To investigate the influence of sediment on salt cavern stability, we constructed a 3D geomechanical model of a salt cavern filled with sediment, as shown in Figure 7. The surrounding rock of the salt cavern was set up as a deformable block and the sediment was considered as a rigid block and built up by the method described in Section 4.1. The model took the form of a cube measuring 500 m in length, 500 m in width, and 500 m in height, with a top depth of 1000 m. The four vertical faces of the model were constrained by displacement boundaries to prevent horizontal movement, while the model’s base was constrained to prevent vertical displacement. No displacement constraints were applied to the top surface of the model. The displacement constraints imposed on the model allowed for free movement along the vertical direction. Given the rheological behavior of salt rock and the assumption that tectonic stress has been fully released during diagenesis, the initial state of the rock salt strata was considered to be under hydrostatic pressure, with equal principal stresses in all three directions. A stress gradient equivalent to the gravitational gradient of the rock salt, specifically 2.3 MPa/100 m, was applied to the model. Additionally, we assumed instantaneous excavation of the salt cavern, with sediment generated immediately after excavation completion. During sediment deposition under gravity, the nodes of the mesh on the internal surface of the cavern were fixed to maintain the integrity of the geological model. Following sediment deposition, the fixed nodes were released. Considering the progressive nature of salt cavern formation, stress redistribution within the model was first computed to align with the actual strata state before embarking on creep calculations. Acknowledging the model’s substantial size and the primary deformation occurring in the vicinity of the cavern, we enhanced mesh density near the cavern while gradually enlarging the mesh size in regions distant from the cavern. This approach ensured computational precision while enhancing efficiency, given the scale of the model. Furthermore, the sediment size distribution in this model is based on the results of indoor experiments, incorporating a total of 762 sediment particles. The simulated sediment size distribution comprises four ranges: 2–5 m, 2–10 m, 0–20 m, and 20–40 m, with respective volume percentages of 53.8%, 30.8%, 13.8%, and 1.6%. The total volume of sediment particles amounts to 107,000 cubic meters. Additional parameters employed in the simulation are detailed in Table 1.

4.3. Simulation of Working Conditions

The operation of salt cavern UGS entails both a maximum internal pressure and a minimum internal pressure. The maximum internal pressure significantly impacts the operational capacity of the salt cavern UGS, whereas the establishment of a minimum internal pressure is crucial to ensure cavern safety. Regarding the maximum internal gas pressure within the salt cavern UGS, researchers have reached a relatively unified consensus that it should not exceed 80% of the overlying rock pressure or the formation pressure at the casing shoe depth. The determination of the minimum internal gas pressure within the salt cavern UGS is generally associated with creep failure; however, there is currently no consensus on the determination of this minimum pressure. Since this study focuses on the impact of sediment on salt cavern stability, we have adopted an extreme approach by maintaining a fixed internal gas pressure within the salt caverns throughout the investigation. We established two distinct salt cavern models: one characterized by sediment fill and the other devoid of sediment. In light of the caverns’ established depths, ranging from 1200 to 1300 m, we incorporated a range of internal gas pressures (2, 6, 10, 14, 18, and 22 MPa) to simulate the variations in the salt cavern UGS over its designed operational lifespan.

5. Stability Assessment Criterion

5.1. Stability Assessment Criterion

Salt rock exhibits pronounced rheological behavior, self-healing capabilities, and extraordinary plastic deformability. Consequently, a unified criterion for assessing the stability of salt cavern UGS remains elusive. In light of this, we have synthesized engineering requirements and leveraged the experiences from salt cavern UGS projects in China to employ an evaluation framework encompassing multiple criteria.

5.1.1. Deformation

Deformation serves as an intuitive assessment metric extensively employed in safety evaluations of subsurface engineering structures. When considering the stability of sediment-filled salt caverns, sediment is generally assumed to confer supportive strength to the cavity. Consequently, the presence of sediment is commonly believed to curtail the deformation of the salt cavern. However, the deformation of the surrounding rock beyond the interface of these two entities necessitates dedicated investigation. During the simulation of the salt cavern operation, we also automated the recording of deformation at specified points on the cavern’s surface.

5.1.2. Plastic Zone

The plastic zone is a pivotal indicator for predicting brittle failure in salt caverns, and its minimization is imperative in the design of salt cavern UGS. Particularly, the occurrence of plastic zones, especially in the cavern roof, must be avoided. This is crucial as it mitigates the risk of cement sheath failure around the production casing, which could lead to gas leakage. To assess the formation of plastic zones within the surrounding rock of the salt cavern, we employ the Mohr–Coulomb criterion. The mathematical formulation of the Mohr–Coulomb criterion is provided as follows:
σ 1 σ 3 = σ 1 + σ 3 sin ϕ + 2 C cos ϕ
where σ 1 and σ 3 represent the first and third principal stresses, Pa. ϕ is the internal friction angle, degrees. C denotes the cohesion, Pa.

5.1.3. Shrinkage of Effective Volume

In conventional salt cavern UGS operations, the volume of the cavern space buried by sediment is disregarded, and only the net space above the sediment is considered the effective volume for natural gas storage. However, within sediment-filled salt caverns, the sediment deposit occupies a significant portion of the cavern’s volume. When considering the construction of UGS facilities within such sediment-filled caverns, the void spaces within the sediment become the effective volume for gas storage. The variation of these sediment void volumes directly impacts the operational capacity of the salt cavern UGS. Therefore, we incorporate this indicator to assess the stability of the sediment-filled salt cavern.

5.1.4. Equivalent Strain

Within the salt formation, the salt rock experiences in-situ stresses from three directions, allowing it to possess considerable deformability under such stress conditions. The failure process of salt rock exhibits distinct plastic deformation characteristics. Thus, we employ equivalent strain to characterize the safety of salt cavern UGS during its operational period. According to earlier investigations, the equivalent strain of salt rock within one operational cycle of a salt cavern UGS should not exceed 3% [28]. The definition of equivalent strain is as follows:
ε ¯ = 2 3 e i j e i j
where ε ¯ represents the equivalent strain, and e i j signifies the deviatoric strain tensor.

5.1.5. Safety Factor

Salt rock failure is accompanied by significant dilatant behavior [29]. During dilatancy, fractures within the salt rock increase, leading to an enhancement in permeability and an increased risk of gas leakage in salt cavern UGS. Several scholars have investigated the dilatant behavior of salt rock and proposed various dilatancy criteria [29,30,31]. Among these, the criterion introduced by Van Sambeek et al. [32] is regarded as consistent with the mechanical properties of Chinese rock salt. This criterion establishes a linear relationship between I 1 and J 2 . Based on triaxial compression test results from the Dawenkou rock salt, we have derived the dilatancy criterion for salt rock in this region as:
S F = 0.08 I 1 J 2
I 1 = σ 1 + σ 2 + σ 3
J 2 = 1 6 σ 1 σ 2 2 + σ 2 σ 3 2 + σ 3 σ 1 2
where I 1 represents the first invariant of the stress tensor, σ 1 , σ 2 and σ 3 denote the maximum, intermediate, and minimum principal stresses, respectively. J 2 signifies the second invariant of the deviatoric stress tensor. The rock mass undergoes collapse, failure, and damage when the safety factors drop below 0.6, 1.0, and 1.5, respectively [33,34].

6. Results and Analysis

6.1. Deformation

Controlling deformation is crucial for the safety and gas storage capacity of salt cavern UGS facilities. At present, a common approach to control deformation is by setting an appropriate internal gas pressure for the salt cavern UGS, and it is generally observed that higher gas pressure leads to reduced deformation [25]. Hence, various internal gas pressures were applied in our study to investigate the influence of sediment on salt cavern deformation. 
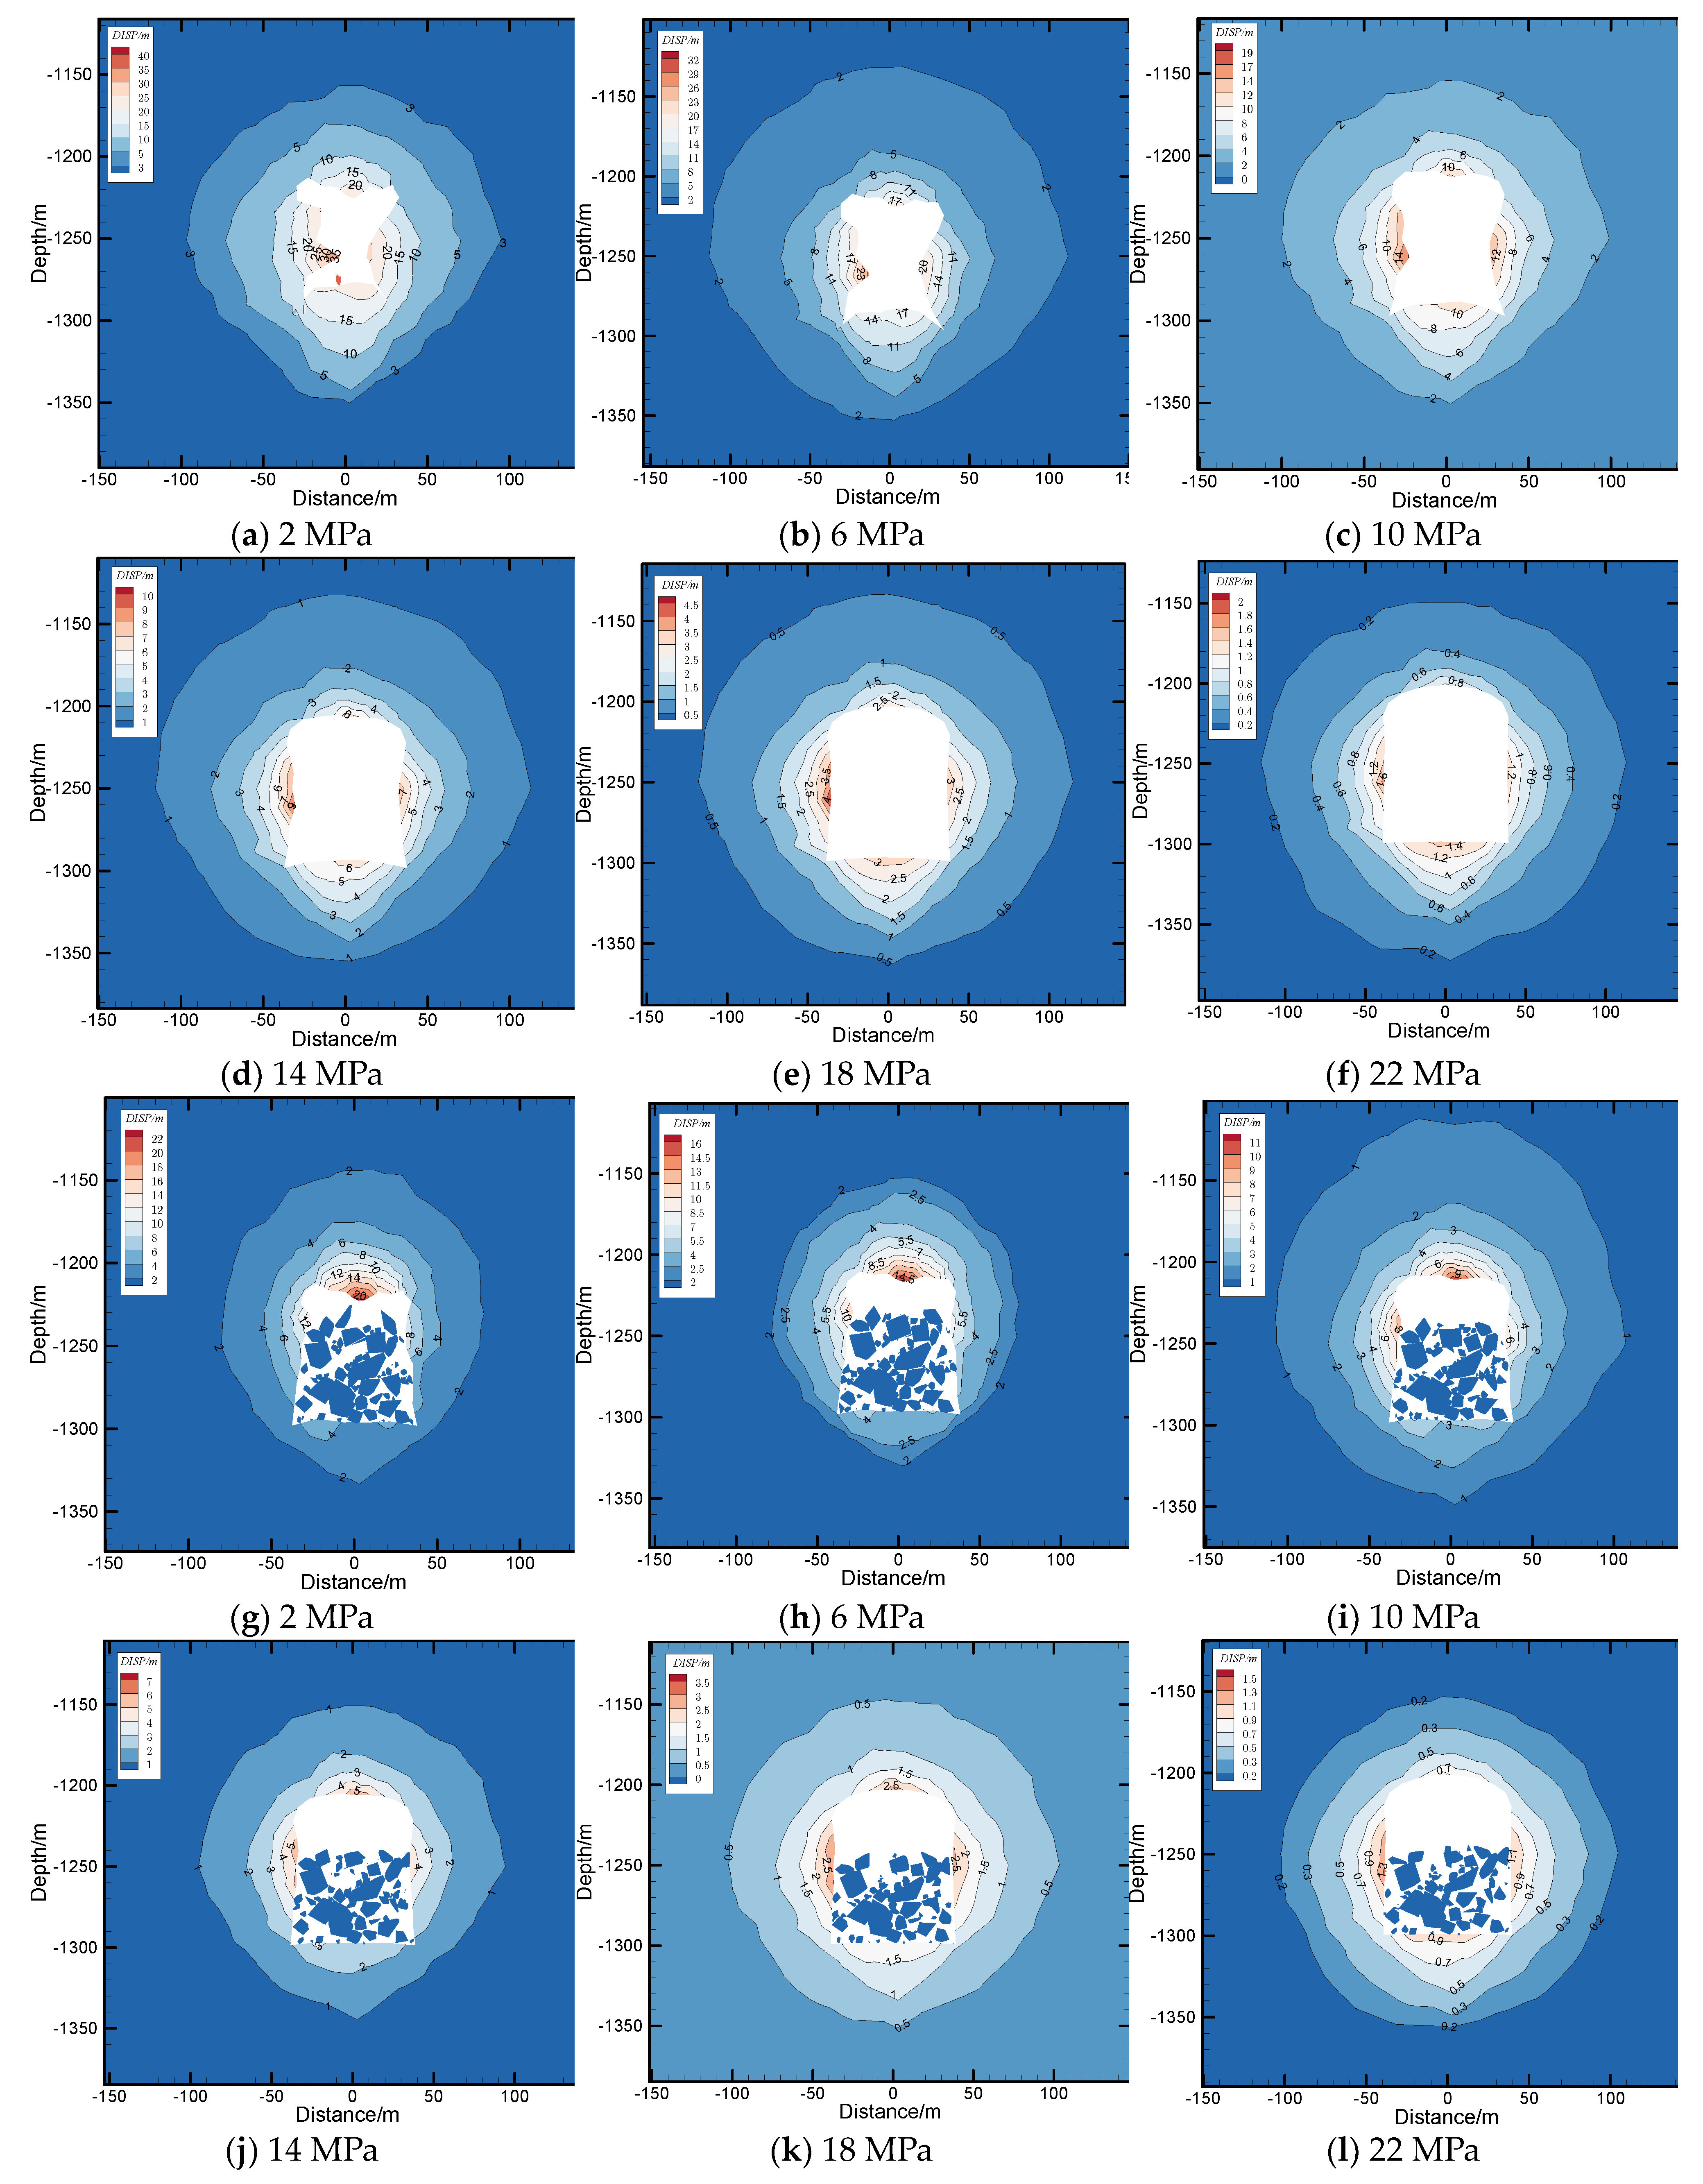
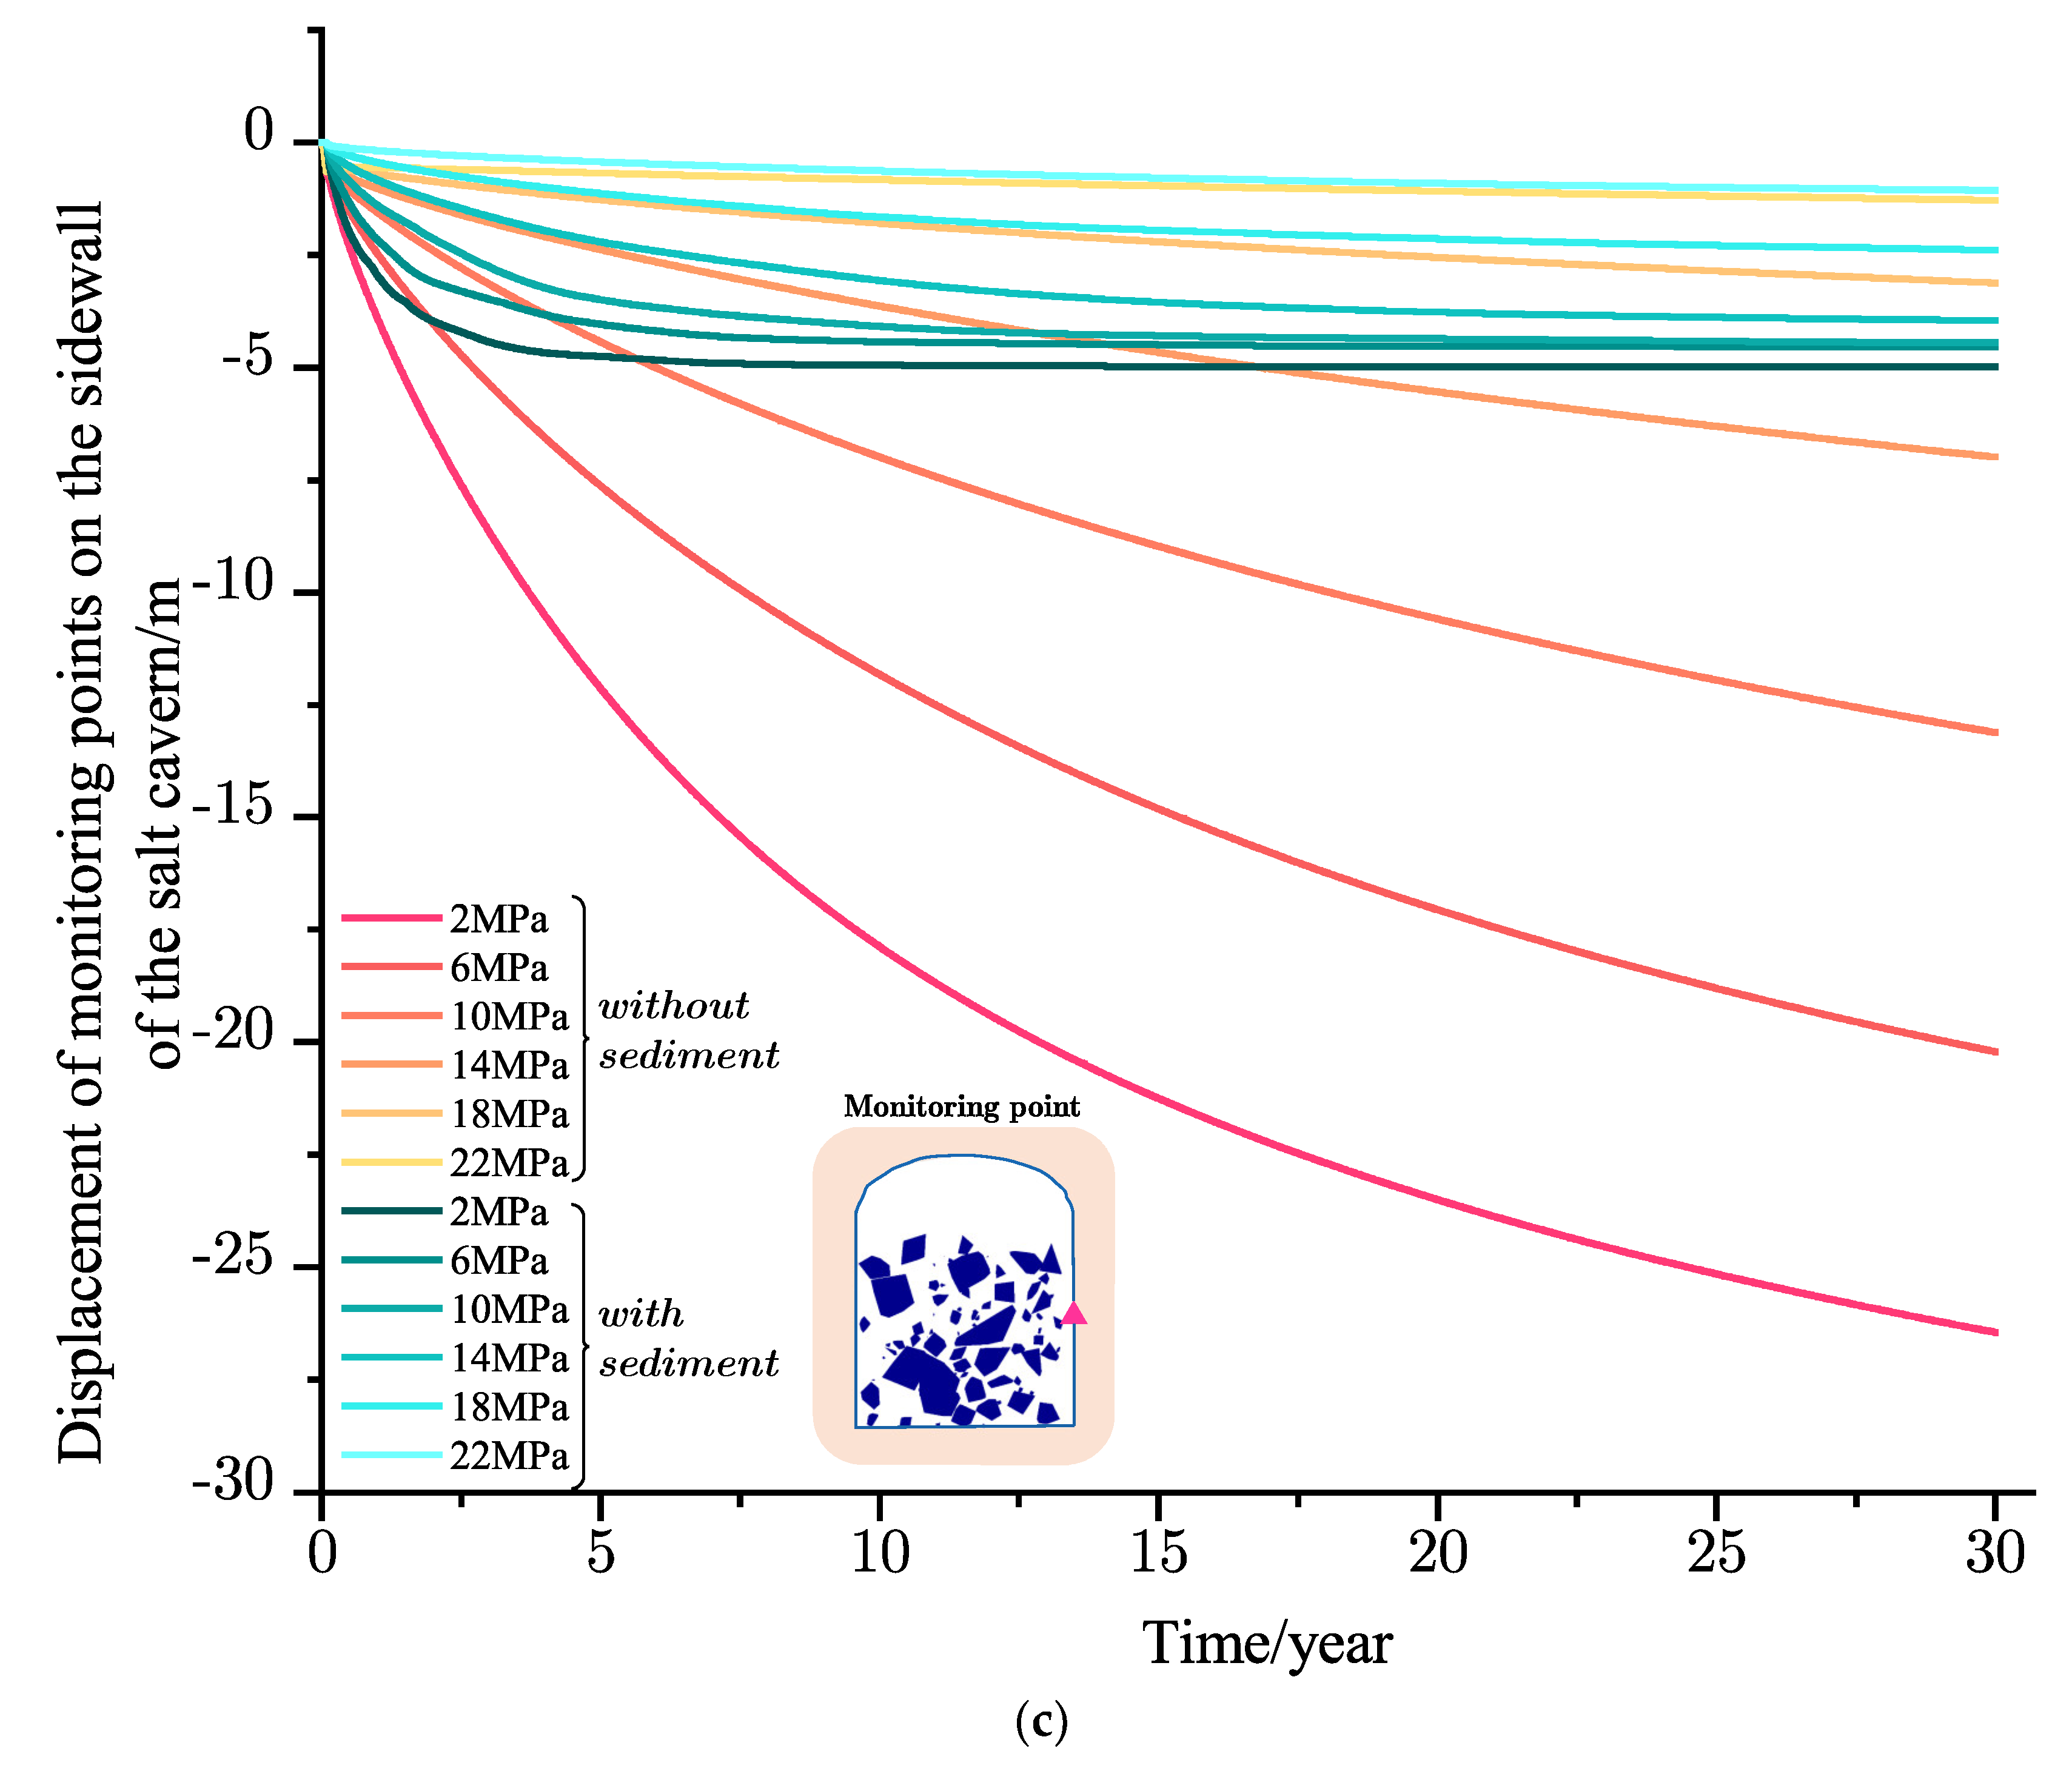
Figure 8 illustrates the deformation contours of sediment-filled salt cavern UGS and salt cavern UGS without sediment after 30 years of operation under different internal gas pressures. From the simulated results, it is evident that sediment significantly diminishes cavern deformation, particularly at lower internal gas pressures. Monitoring points were placed at the midpoint of the top, bottom, and side walls of the salt cavern, as depicted in Figure 9.
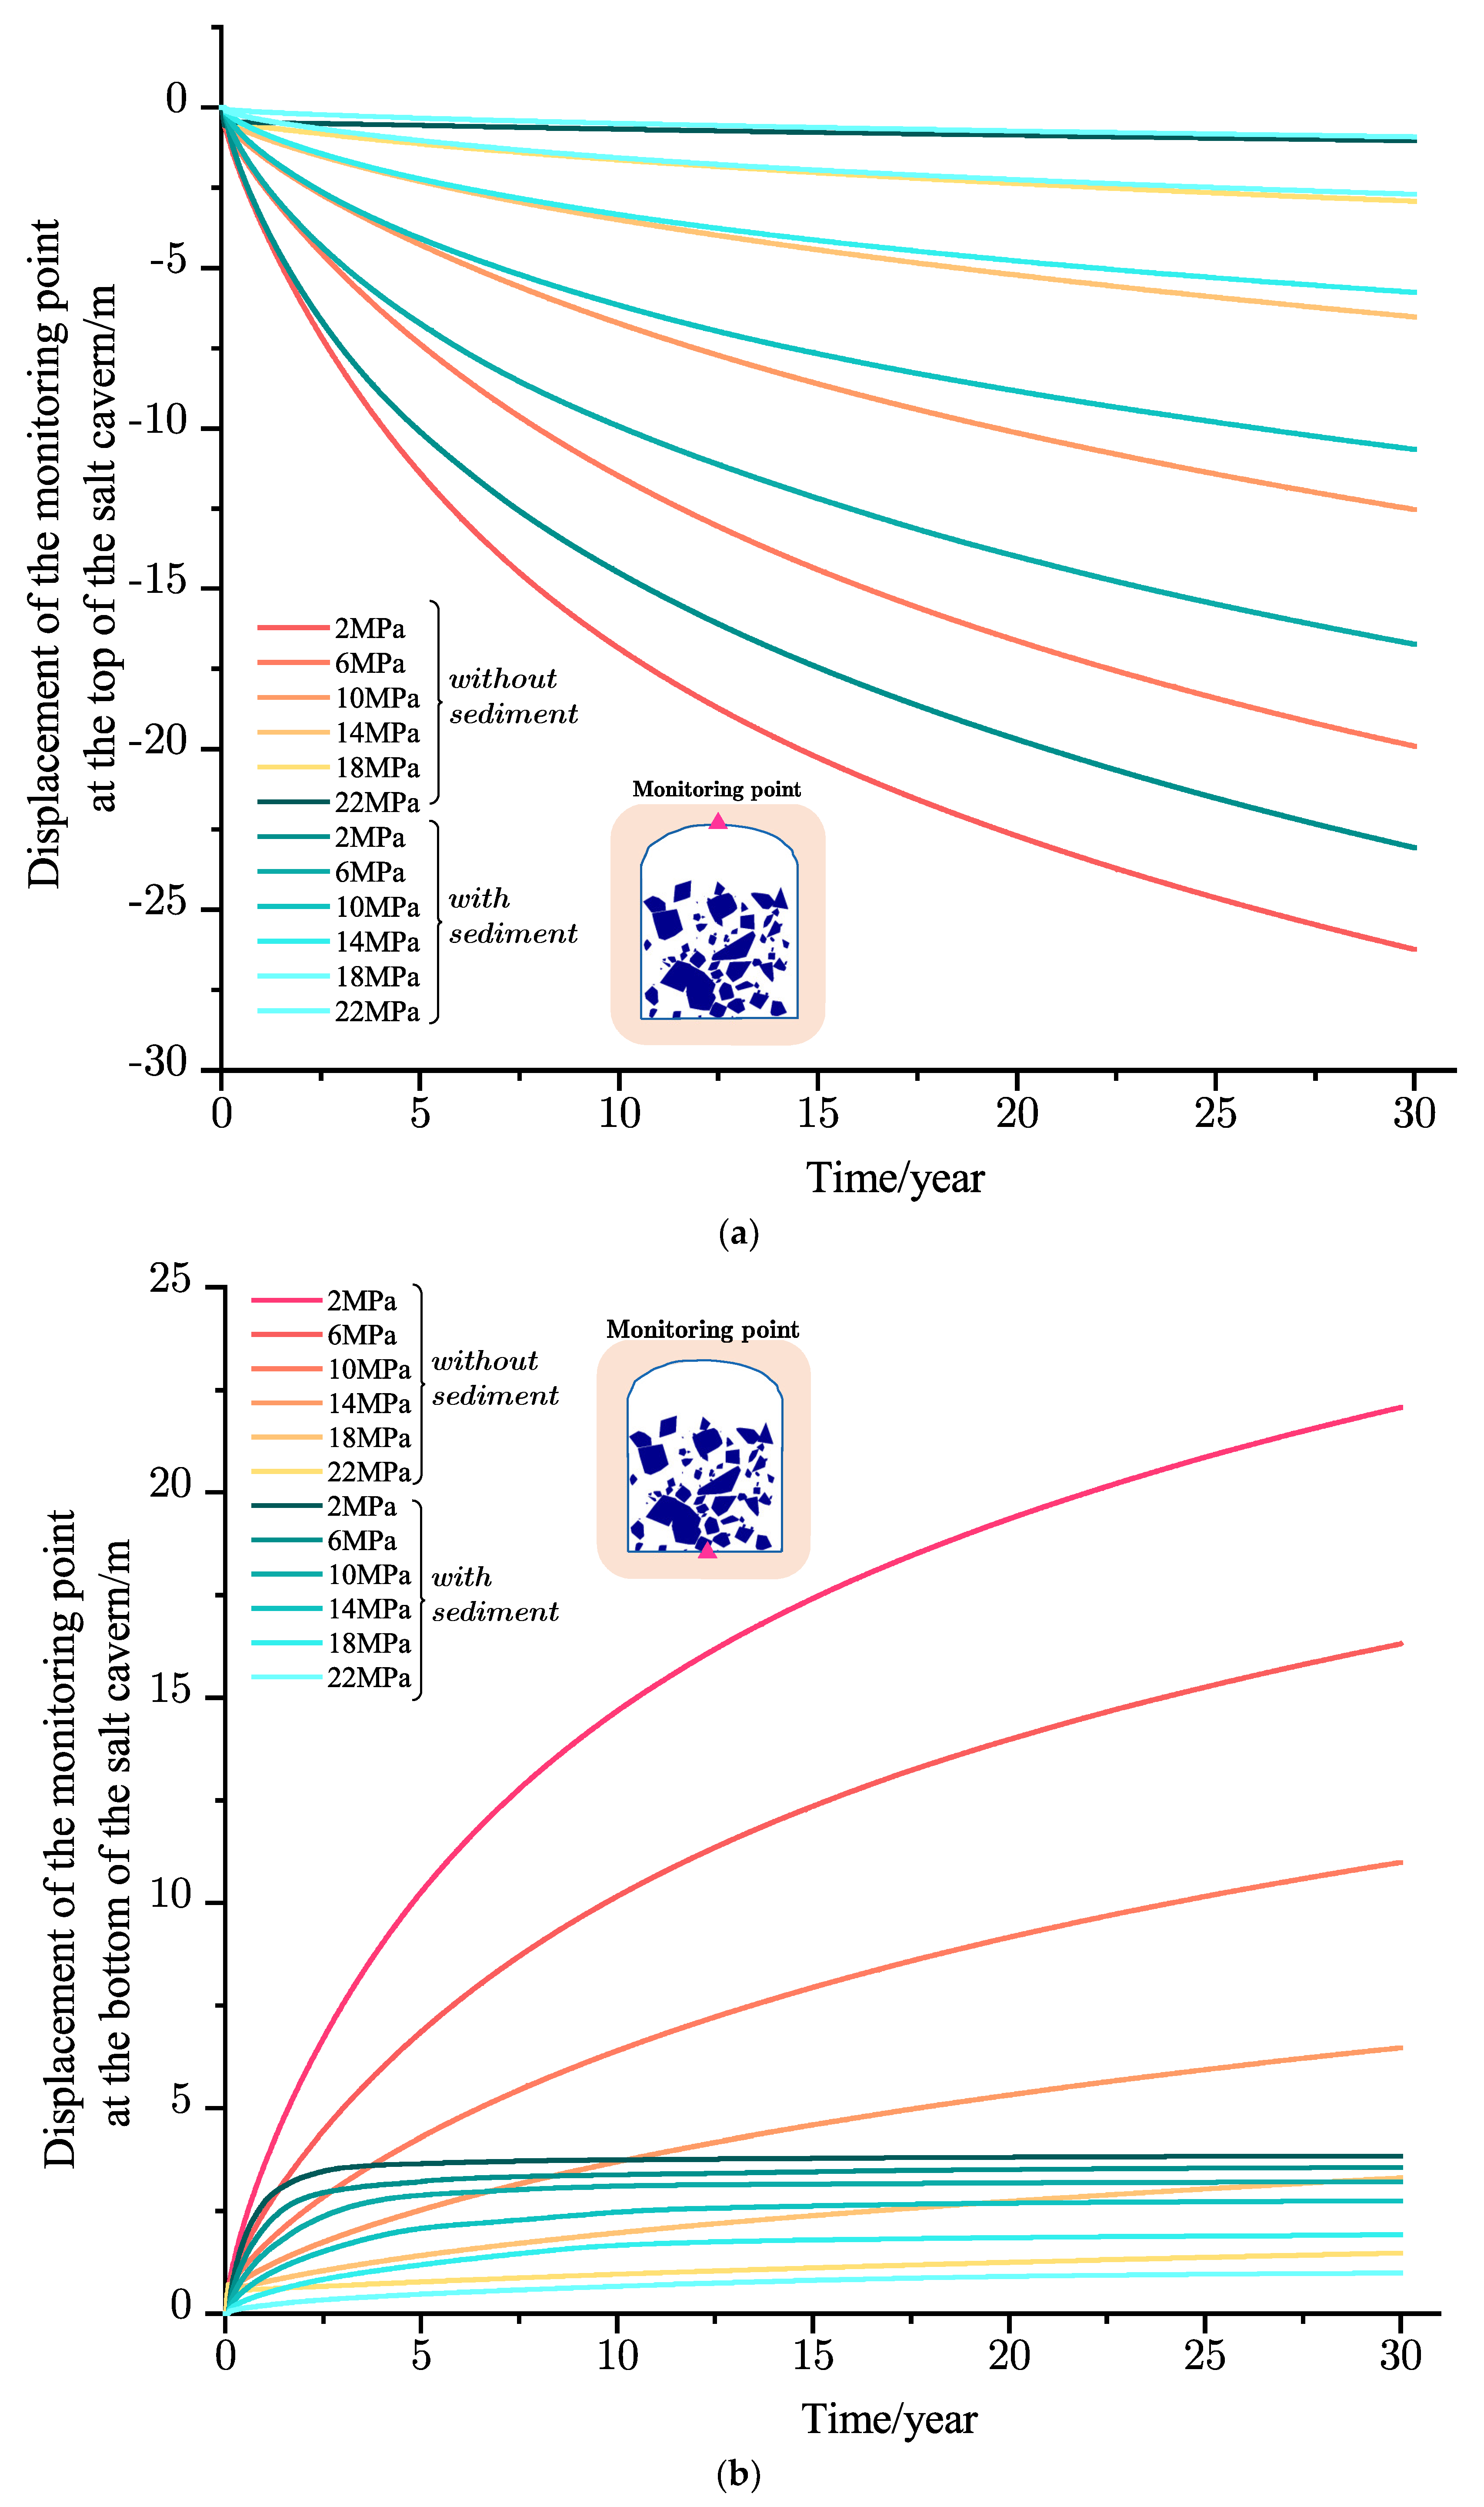
The restraining effect of sediment on deformation is most prominent at the bottom and side walls of the salt cavern. Under internal pressures of 2 MPa, 6 MPa, 10 MPa, and 14 MPa, the deformation of the bottom center point of the salt cavern without sediment was 22.1 m, 16.3 m, 11 m, and 6.5 m, respectively. In contrast, for the sediment-filled salt cavern under corresponding internal gas pressure conditions, the displacement at the bottom center was 3.8 m, 3.6 m, 3.2 m, and 2.8 m. Thus, the presence of sediment reduced the displacement by 82.8%, 77.9%, 70.9%, and 56.9%, respectively. Similar trends were observed for the side wall center point. For instance, in a salt cavern without sediment, the displacement of the side wall center point at internal gas pressures of 2 MPa, 6 MPa, 10 MPa, and 14 MPa was −26.4 m, −20.2 m, −13.1 m, and −7 m. However, in the sediment-filled cavern, the displacement ranged from −5 m to 4 m, resulting in reductions of 81.1%, 77.7%, 66.4%, and 42.9% compared to the salt cavern without sediment. Moreover, smaller internal gas pressures accentuated the creep phenomenon of the salt cavern, leading to the compression of the sediment, and the increase in the height of the sediment top surface. However, the location of maximum deformation on the side wall of the sediment-filled cavern remained near the height of the sediment top surface. Notably, in the model including sediment, the salt cavern’s top was not filled with sediment. Contrary to the model without sediment, the displacement at the top monitoring point showed no significant reduction. This observation underscores the importance of considering the stability of the unfilled portion in the salt cavern when determining operational pressures for sediment-filled salt cavern UGS. In conclusion, sediment fill effectively mitigates deformation in the sediment-filled portion of the salt cavern, with a more pronounced effect at lower internal gas pressures. This stands as an advantage of sediment-filled salt cavern UGS compared to the conventional salt cavern UGS without sediment.

6.2. Plastic Zone

In the simulation of the two types of salt cavern UGS facilities, we employed the Mohr–Coulomb criterion to assess the development of plastic zones. 
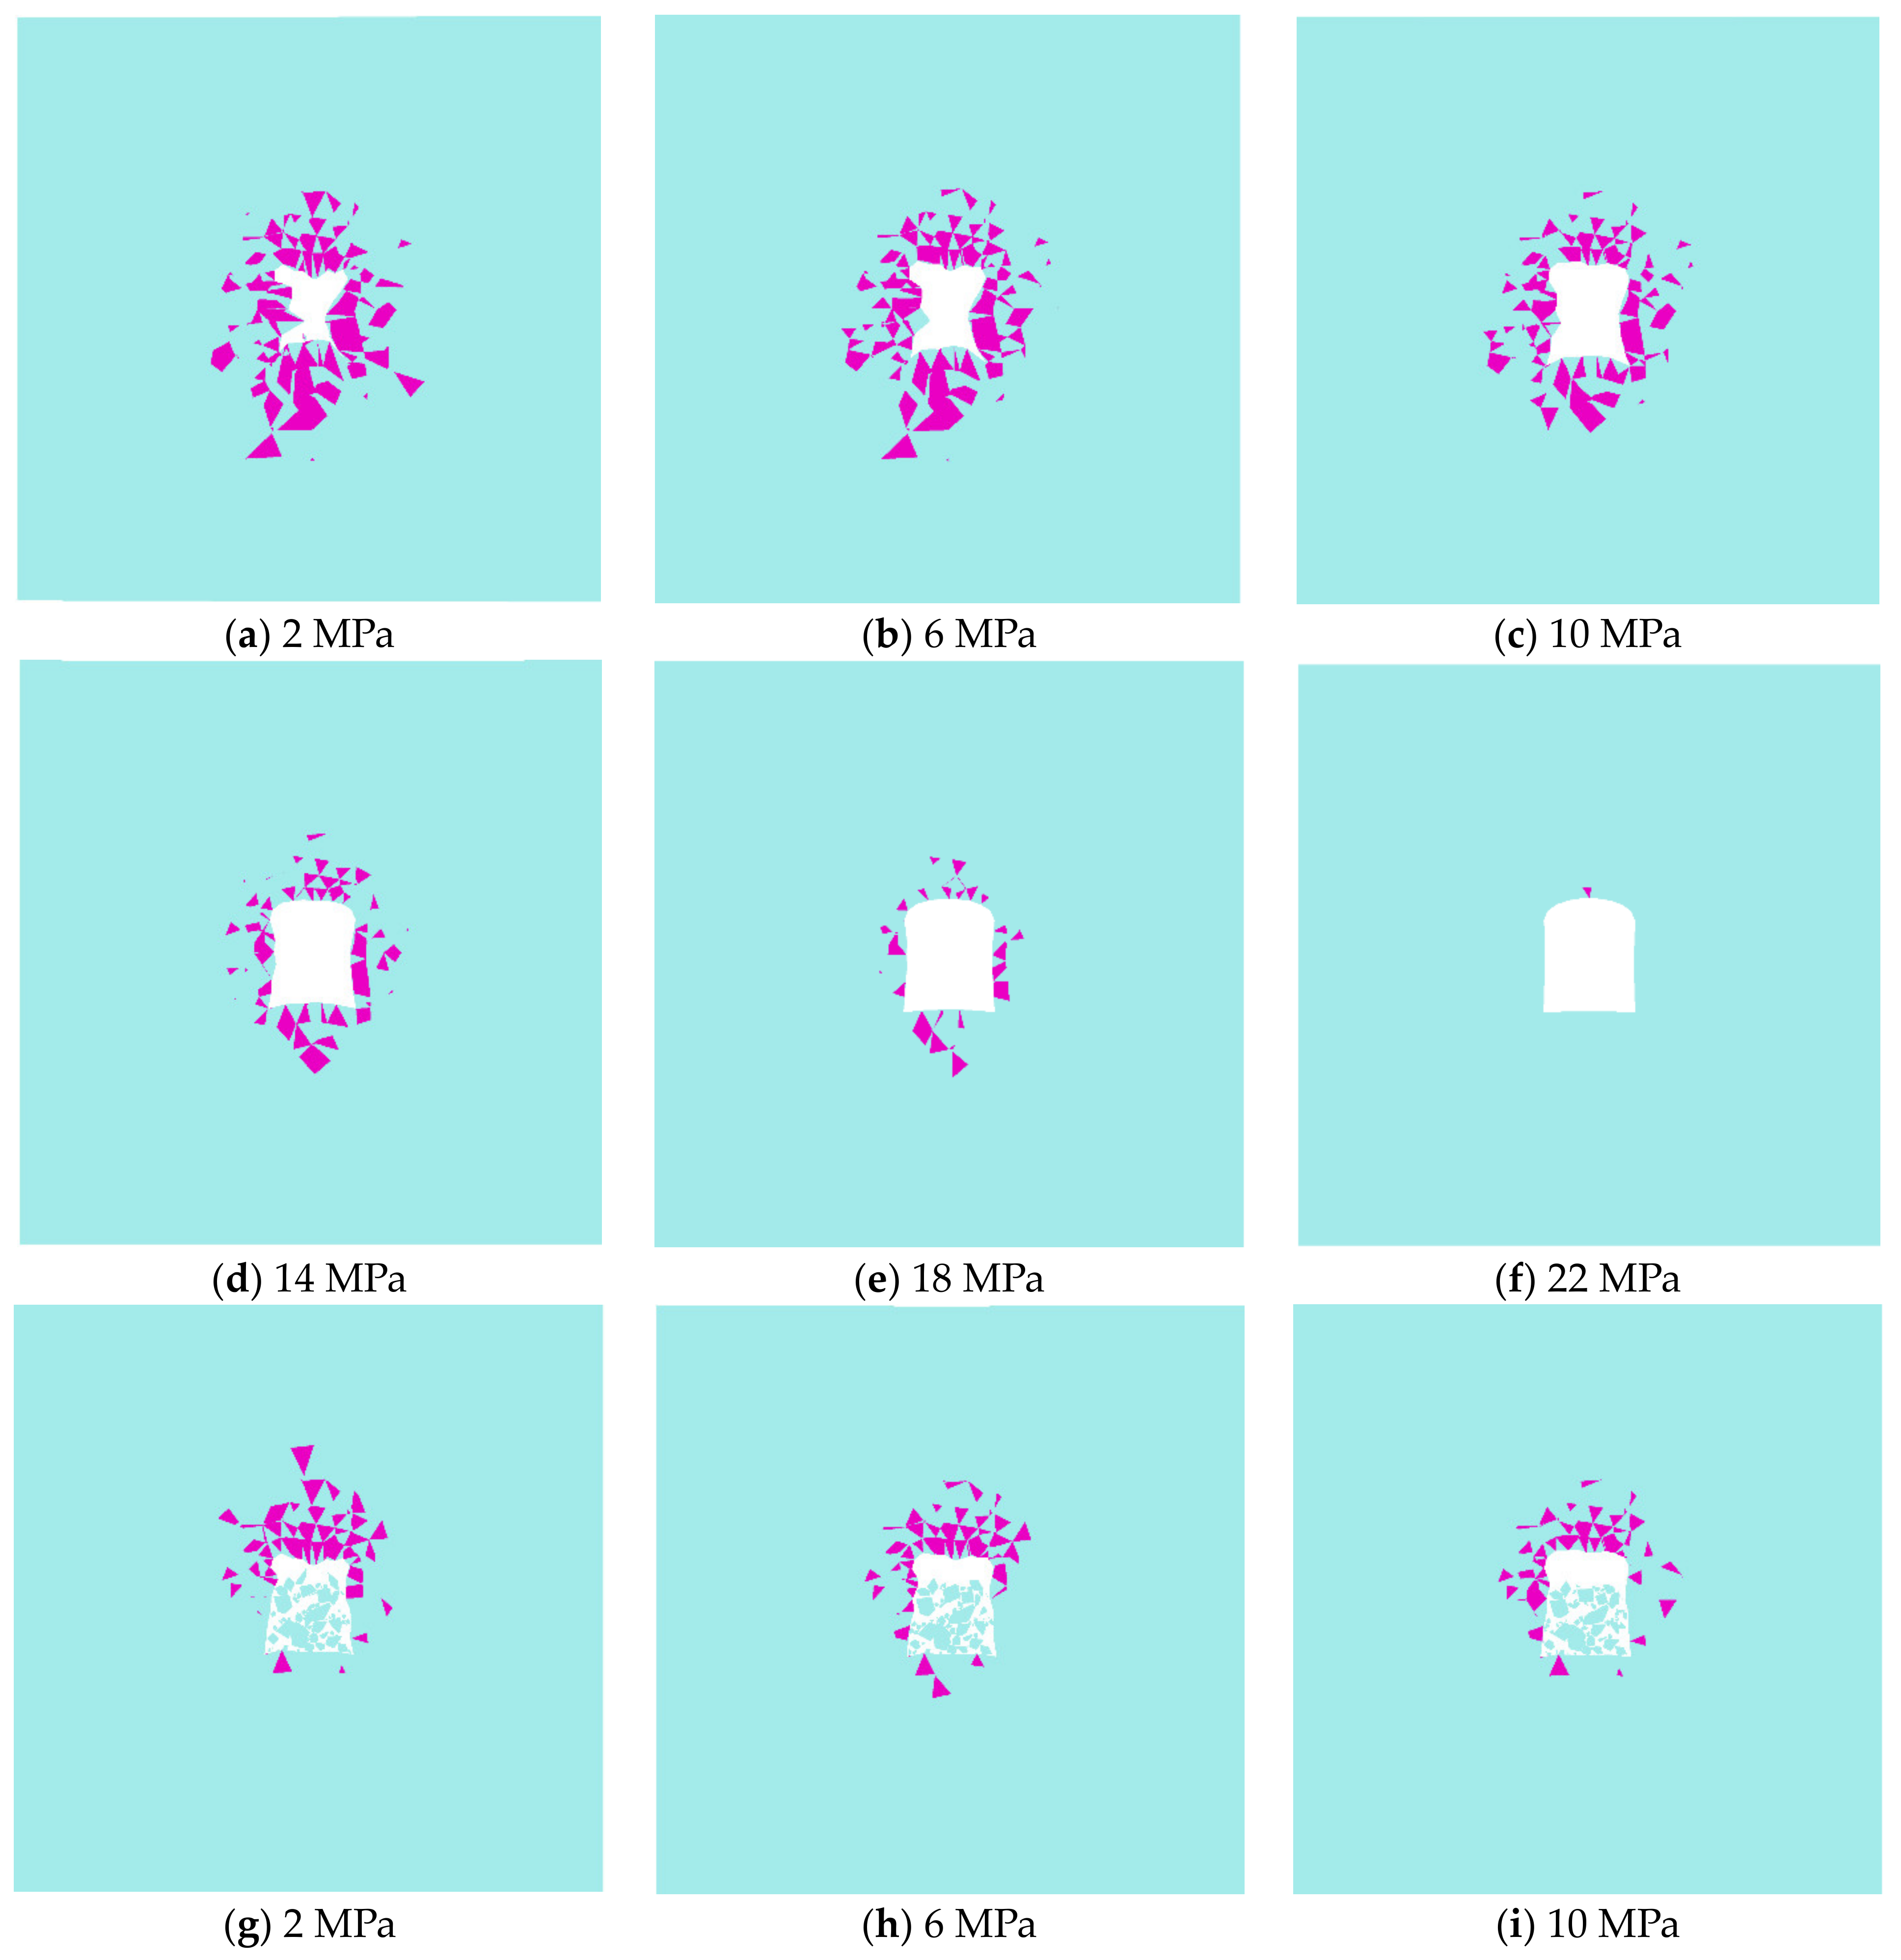
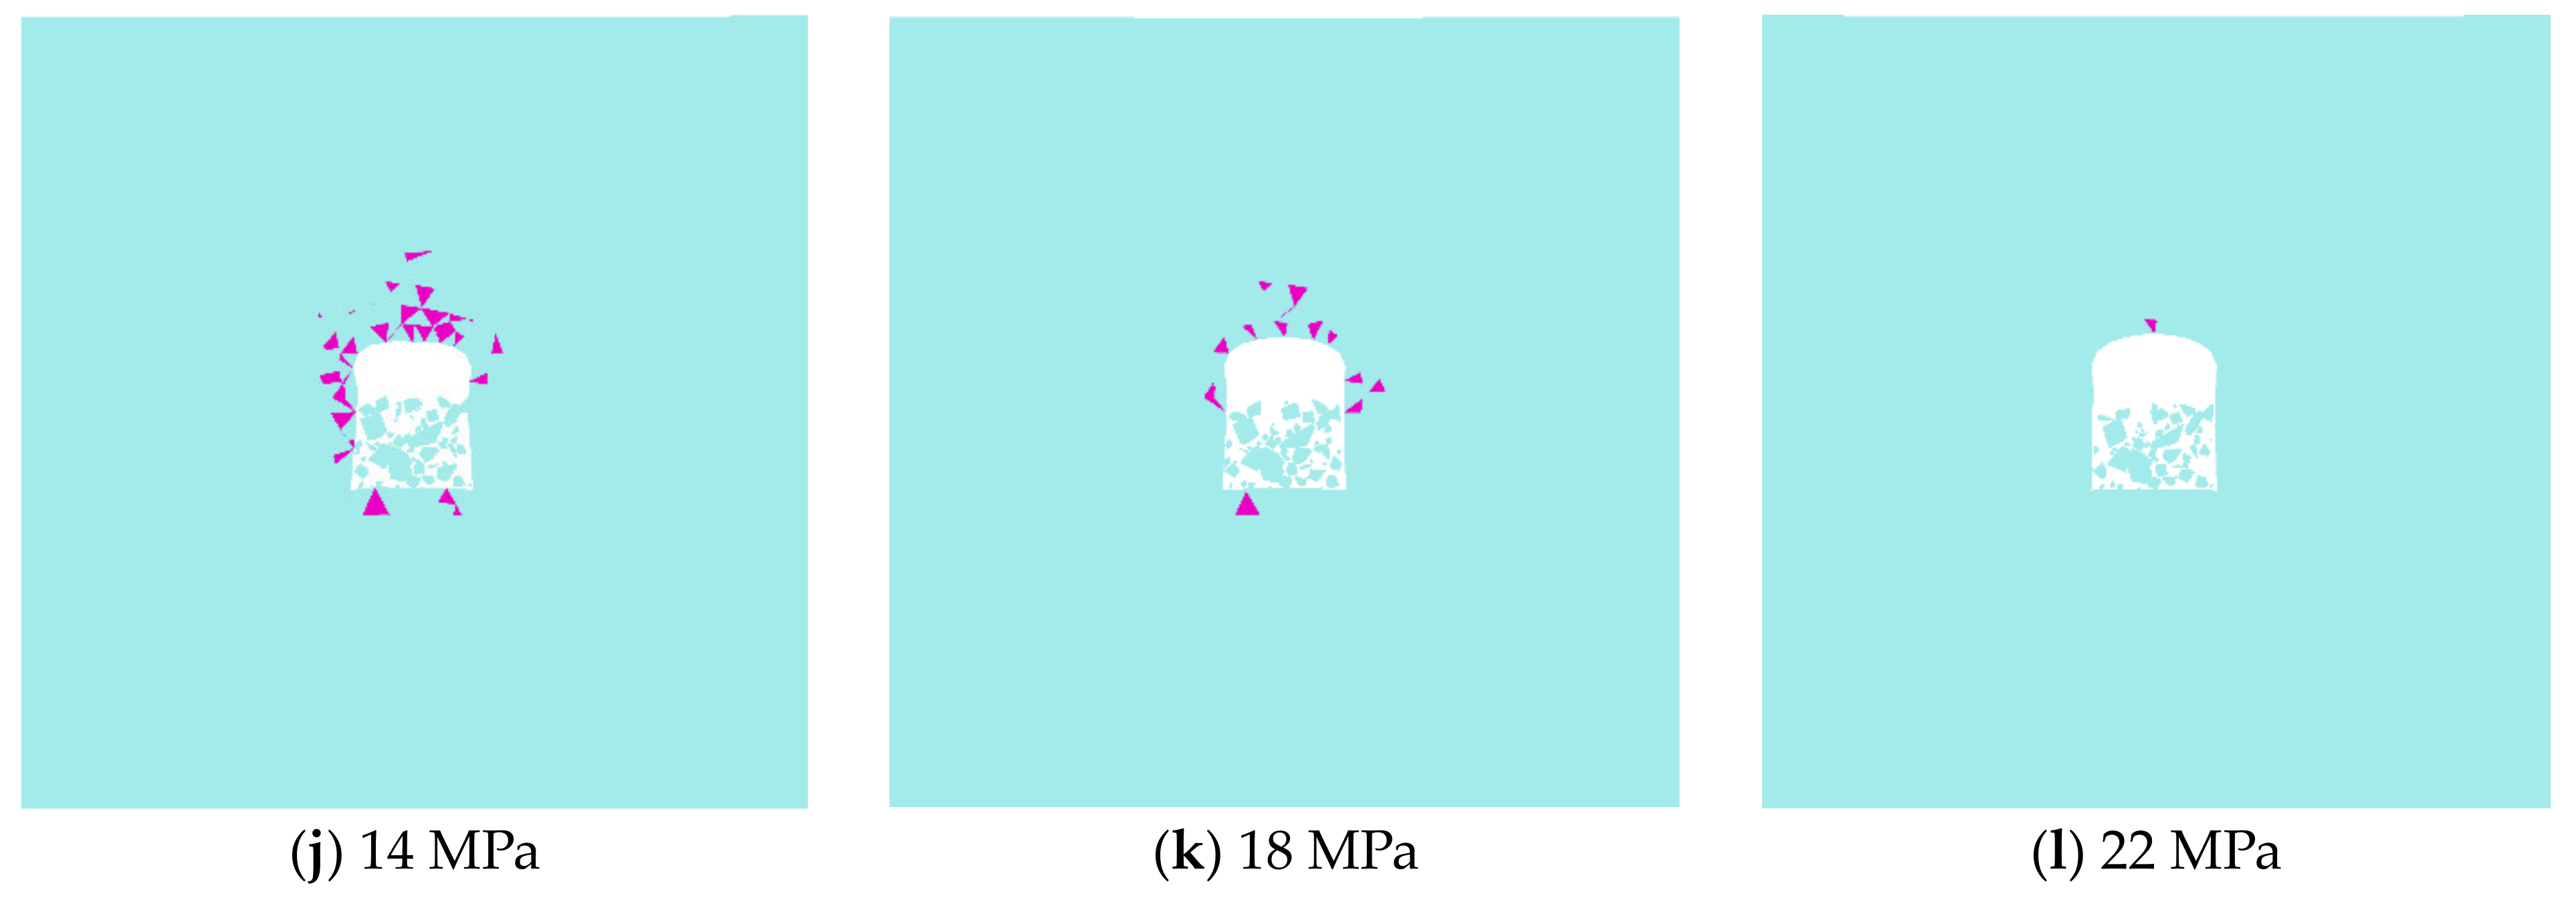
Figure 10 illustrates the distribution of plastic zones in the two types of salt cavern UGS facilities after 30 years of operation under different internal pressure conditions. Regardless of the type of salt cavern UGS, the plastic zones decreased as the internal gas pressure increased. However, there is a significant distinction between the distribution of plastic zones between the two types of salt cavern UGS. As evident from 
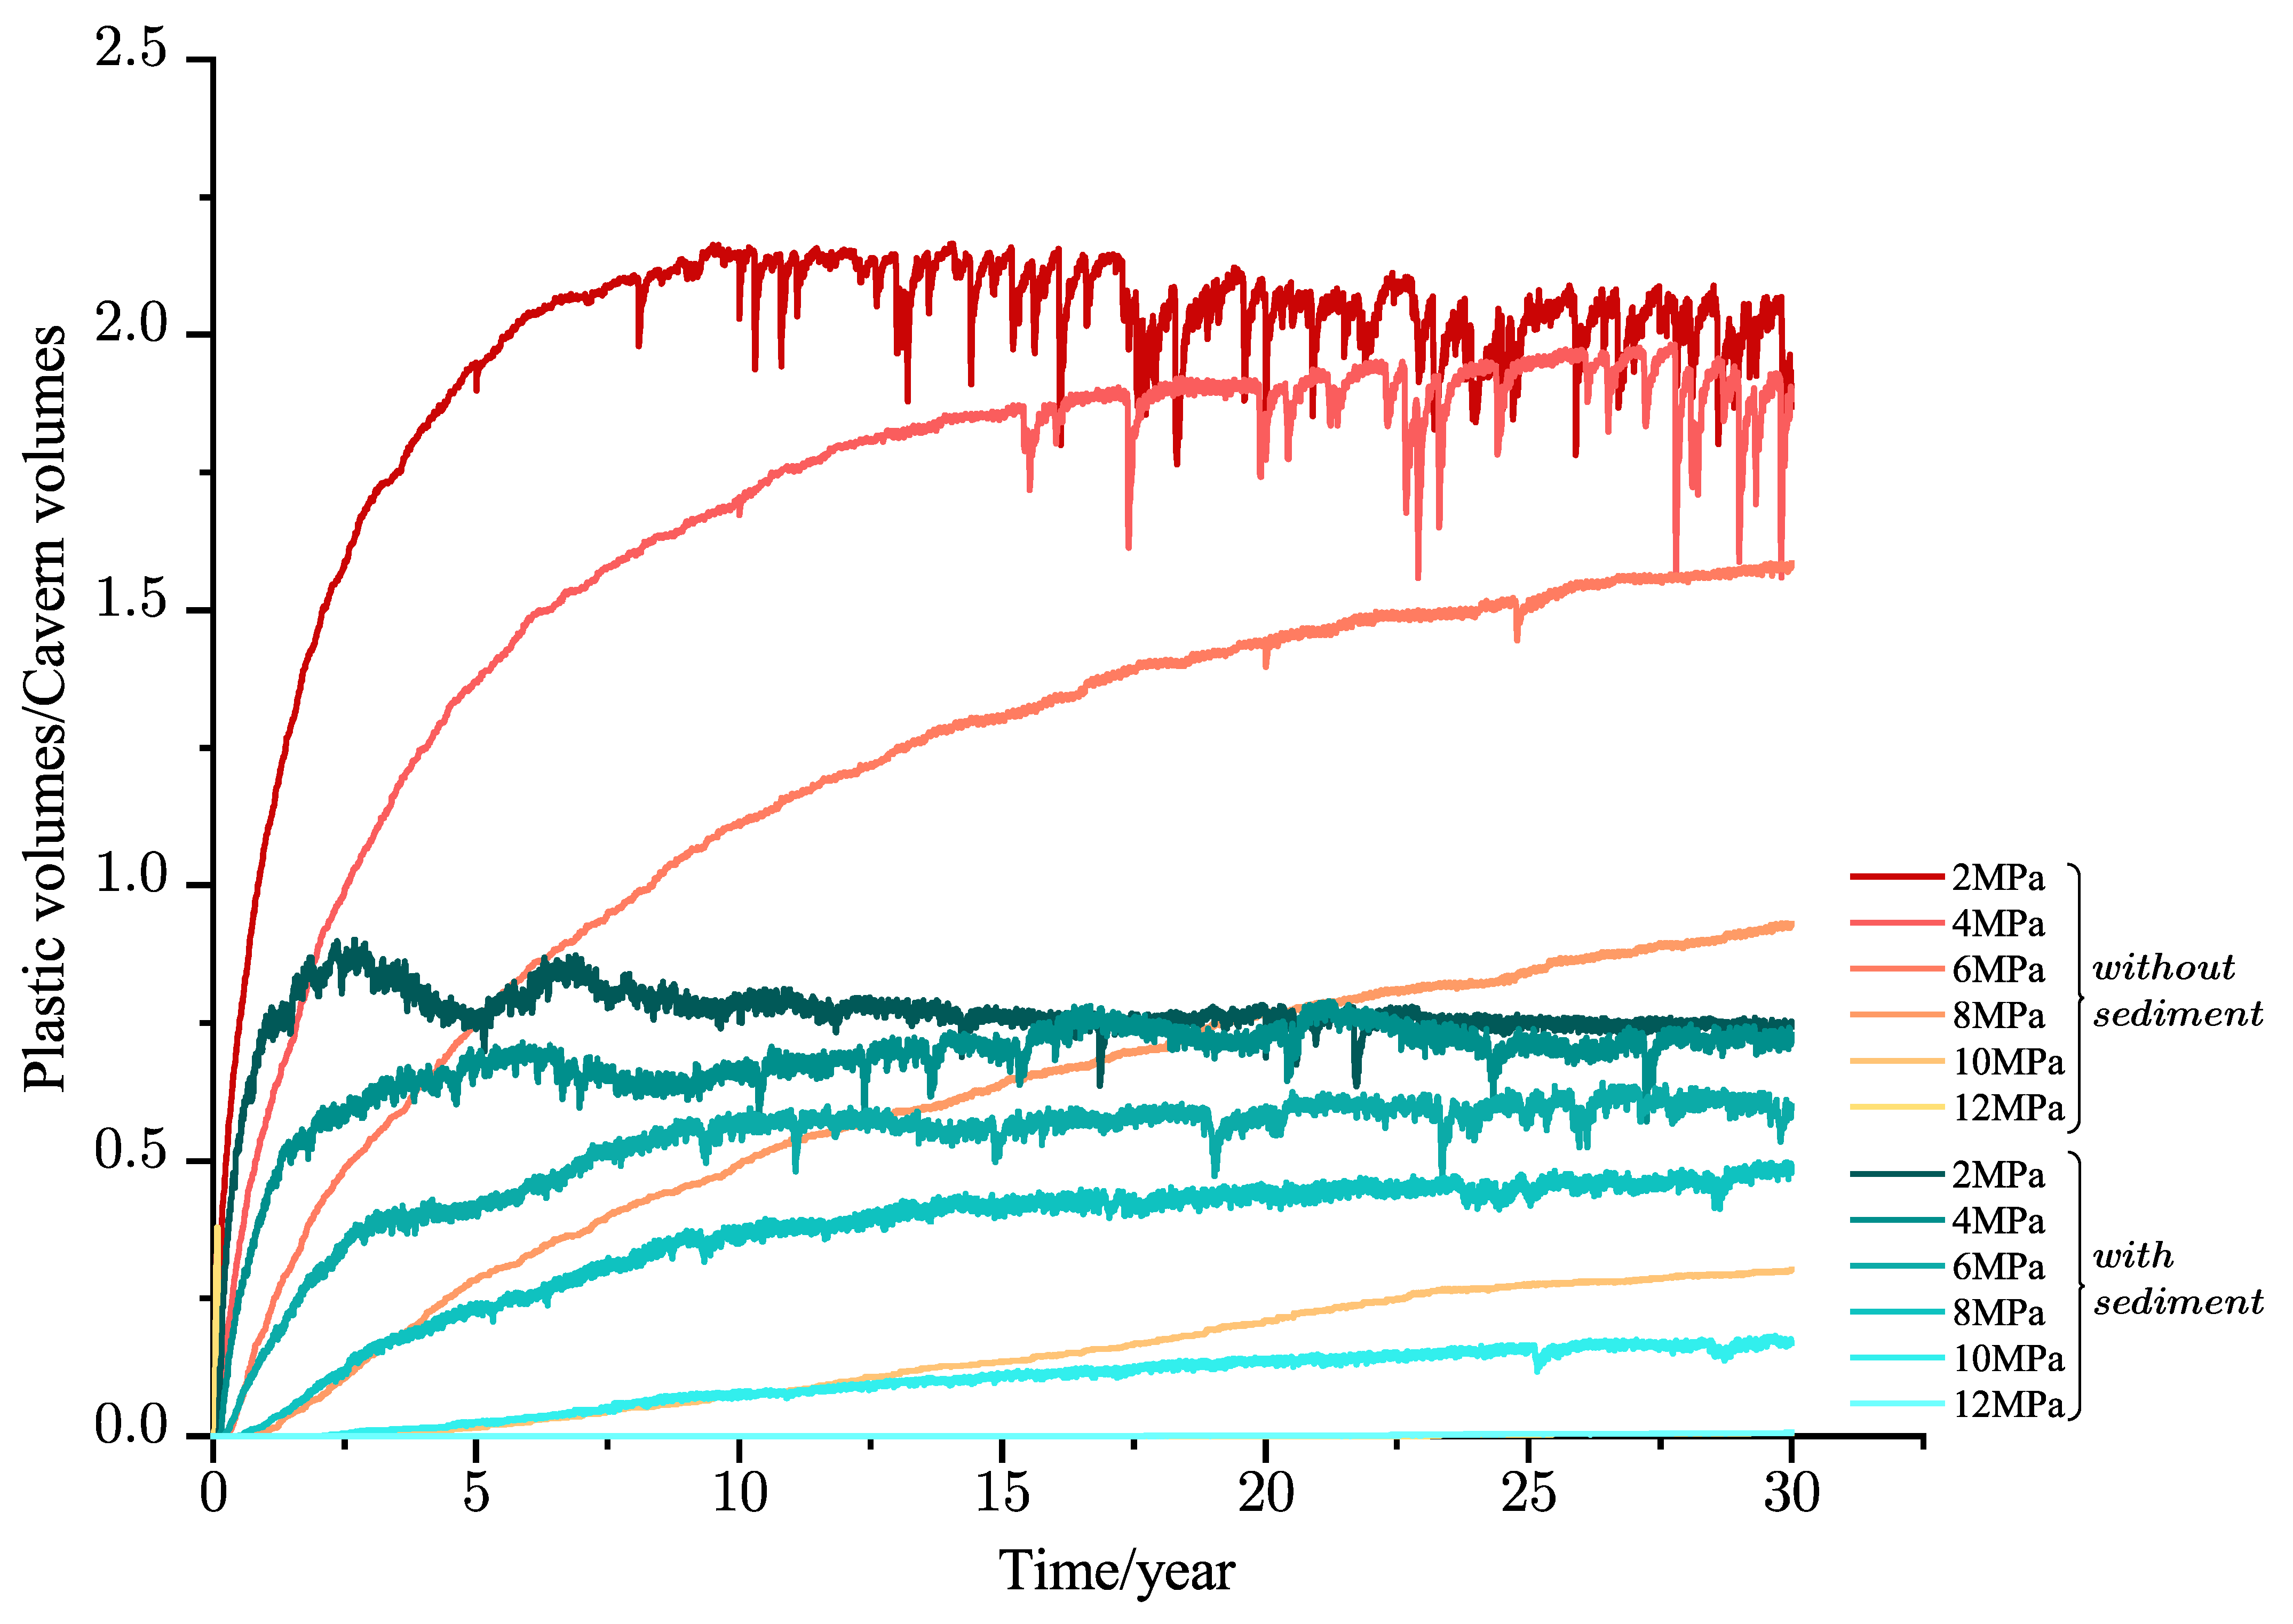
Figure 10g–l, plastic zones are mainly concentrated in the areas that are not filled with sediment. This distinctly indicates that sediment assists in reducing the plastic zones around the salt cavern. To provide a clearer comparison of the impact of sediment on the development of plastic zones in salt cavern UGS, we plotted the ratio of plastic zone volume to salt cavern volume (RPC), as shown in Figure 11.
The trend in the development of the RPC is consistent for both types of salt cavern UGS facilities. It experiences an initial rapid growth phase, followed by a gradual slowdown in the growth rate, eventually reaching a relatively stable RPC level. Evidently, under different internal gas pressure conditions, particularly lower internal gas pressures, the sediment-filled cavern UGS exhibits a significantly lower final RPC compared to the unfilled salt cavern UGS. At internal gas pressures of 2 MPa, 6 MPa, 10 MPa, and 14 MPa after 30 years of operation, the RPC for the unfilled salt cavern UGS is 2.07, 1.88, 1.58, and 0.93, respectively. In contrast, under the same conditions, the RPC for the sediment-filled cavern UGS is 0.74, 0.71, 0.59, and 0.48. The percentage reduction in RPC is 64.3%, 62.2%, 62.7%, and 48.4%, respectively. Furthermore, for the established sediment-filled cavern UGS, the time taken to reach a stable RPC is notably shorter. As indicated in Figure 11, under various simulated internal gas pressure conditions, the sediment-filled cavern UGS takes approximately 5 years to achieve a stable RPC, while the unfilled cavern UGS requires around 10 years.
In summary, sediment fill aids in controlling the development of plastic zones in the surrounding rock of salt cavern. This not only significantly reduces the volume of plastic zones but also accelerates the sediment-filled cavern UGS toward a stable development stage of plastic zones compared to the unfilled cavern UGS.

6.3. Shrinkage of Effective Volume

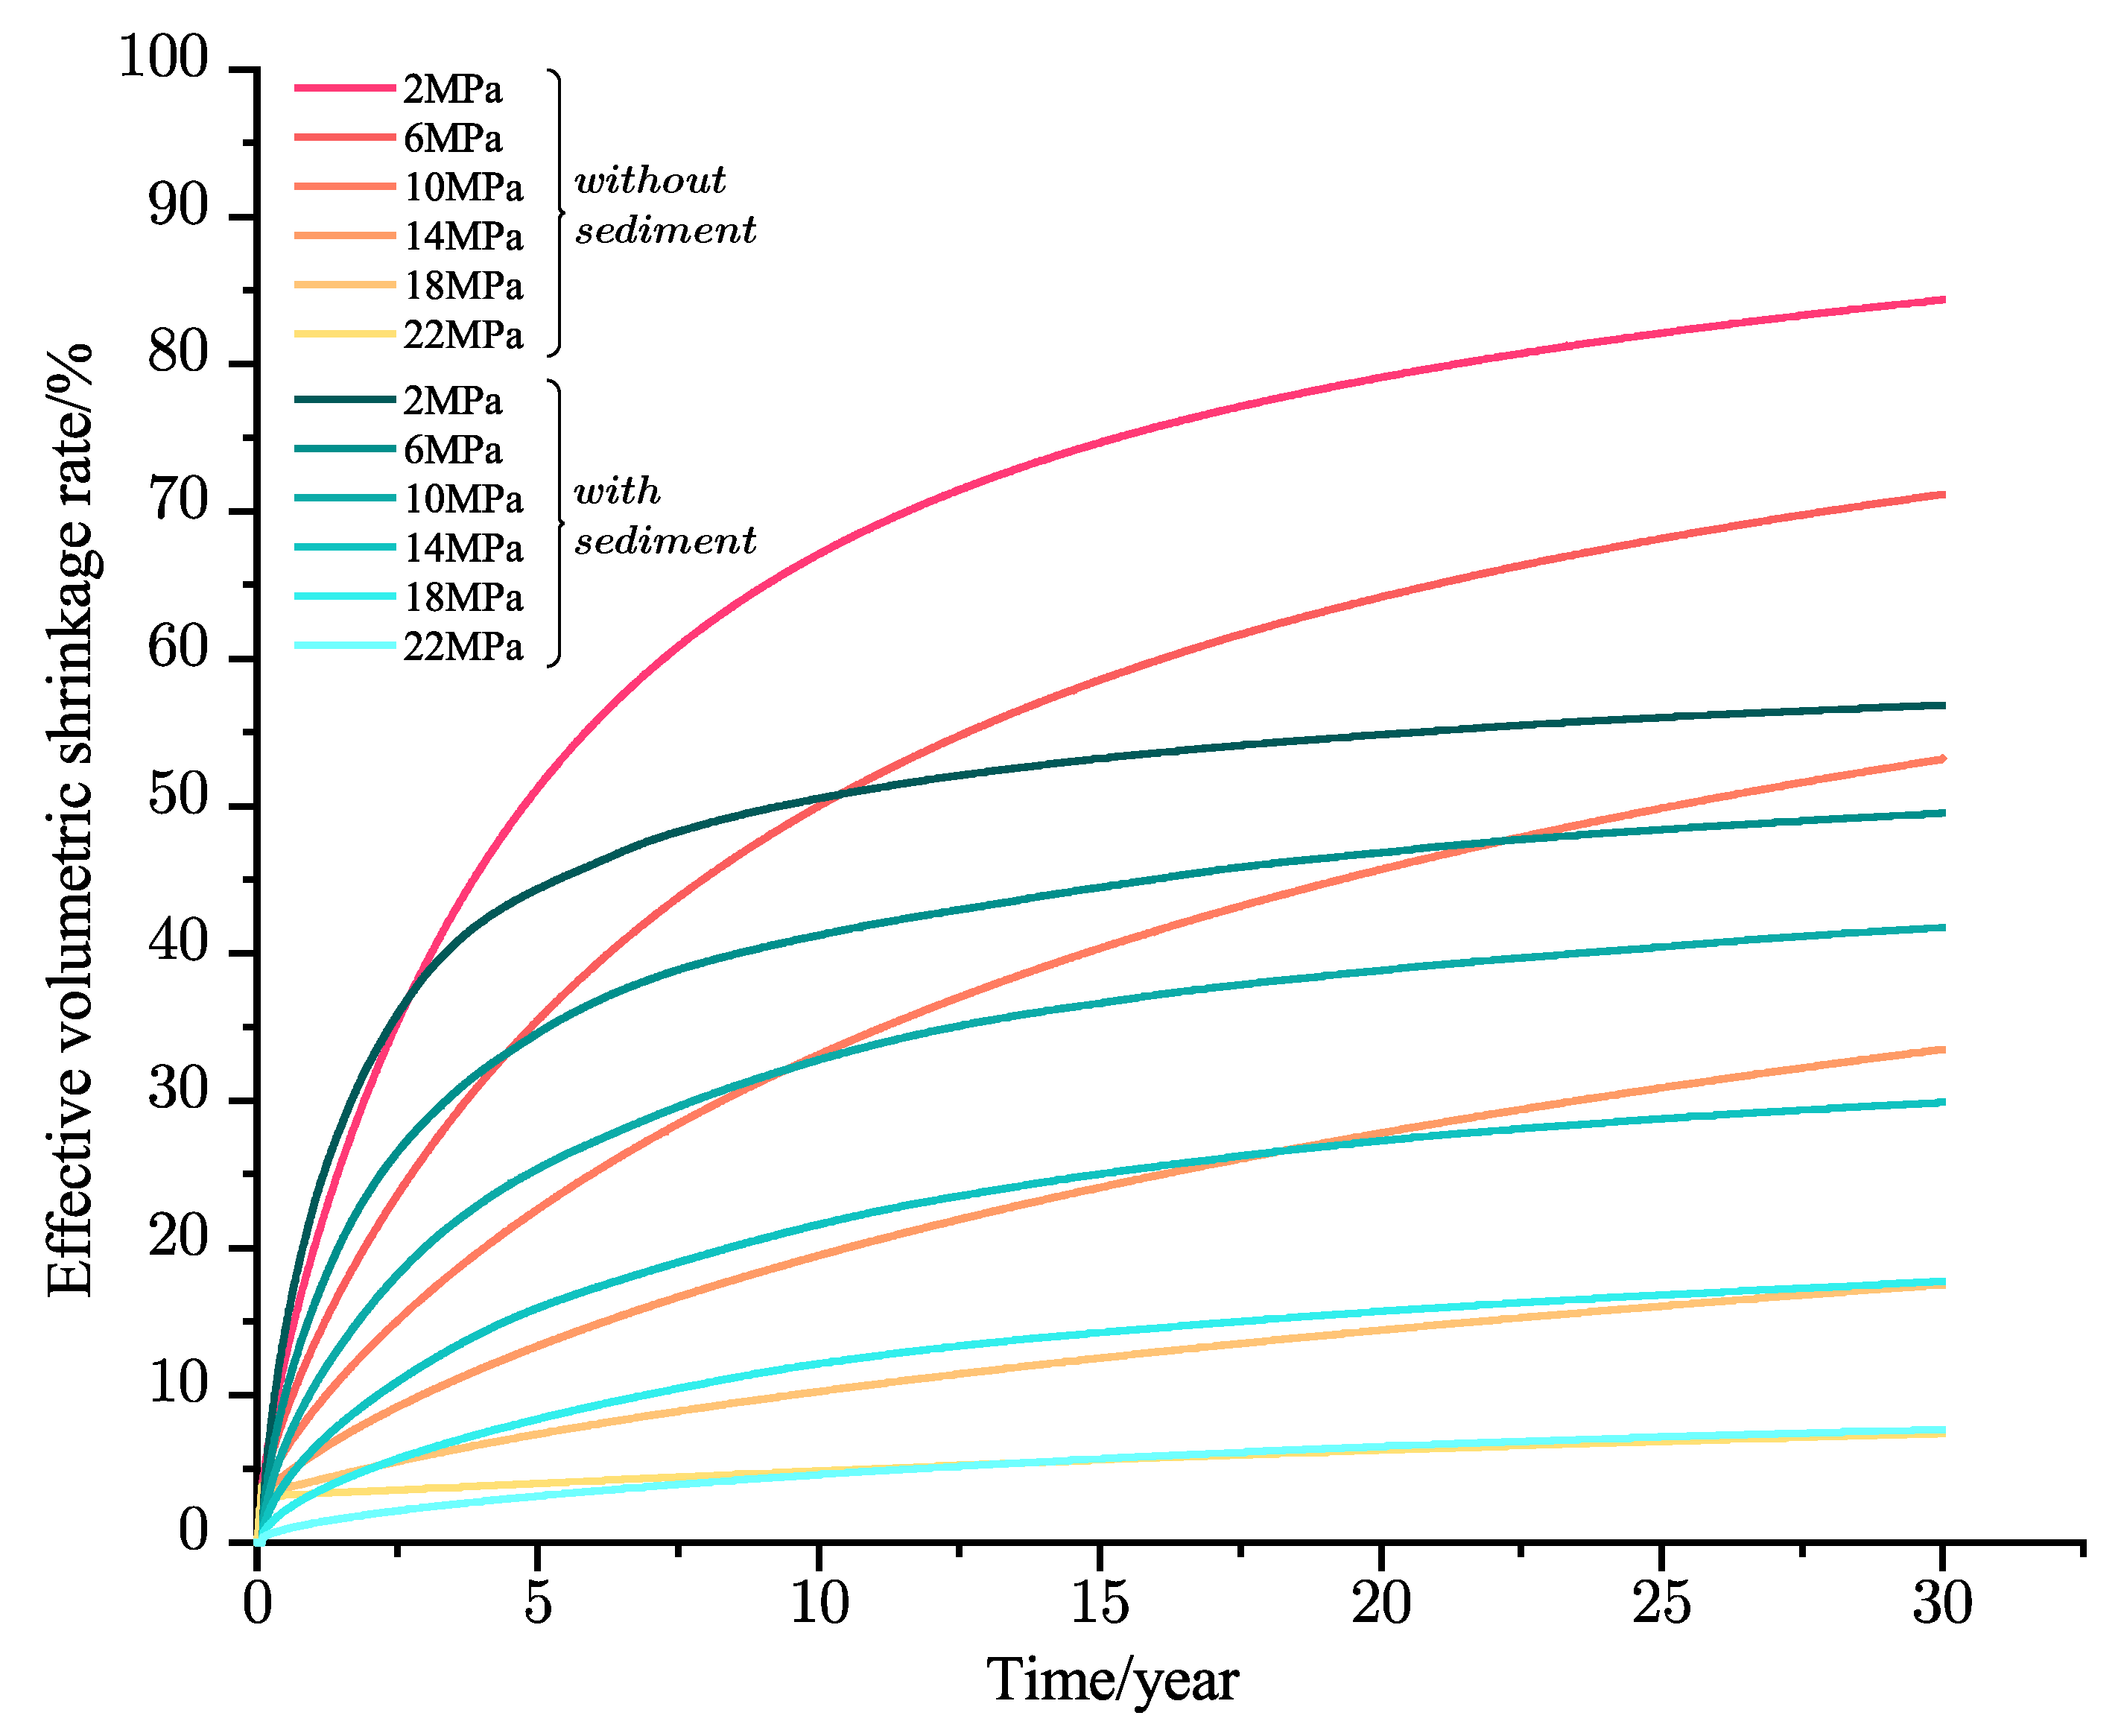
Rock salt exhibits pronounced creep characteristics, and under the influence of in-situ stresses, the volume of salt cavern UGS facilities will continue to contract. The volume of the salt cavern dictates its operational capacity; excessive volume contraction can severely undermine its economic viability and safety. In sediment-filled salt cavern UGS, gas is mainly stored in the voids between sediment particles. Therefore, we define the volume inside the salt cavern, excluding the sediment, as the effective gas storage volume. For unfilled salt cavern UGS, the effective volume is equivalent to the cavern’s volume. We define the reduction in effective volume within the salt cavern and its initial effective volume ratio as the effective volume shrinkage ratio.
Figure 12 presents the effective volume changes over 30 years for the two types of salt cavern UGS facilities under varying internal gas pressures. The curves depicting the change in effective volume over time exhibit a pattern of rapid decline followed by stabilization. At the same internal pressure, the effective volume shrinkage ratio of the sediment-filled salt cavern UGS is consistently lower than that of the unfilled salt cavern UGS. However, the difference in effective volume shrinkage ratio between the two diminishes with increasing internal gas pressure. As the internal gas pressure approaches the in-situ stress of the salt cavern’s surrounding rock, the effective volume shrinkage ratios of the two types gradually converge.
For instance, at internal pressures of 2 MPa, 6 MPa, 10 MPa, 14 MPa, 18 MPa, and 22 MPa, the effective volume shrinkage ratios for the sediment-filled salt cavern UGS and the unfilled salt cavern UGS are 56.8%, 49.5%, 41.7%, 29.9%, 17.7%, 7.4%, and 84.4%, 71.2%, 53.2%, 33.5%, 17.5%, 7.4%, respectively. This indicates that even at lower internal gas pressures, sediment can still assist in restraining the shrinkage of the effective volume within the salt cavern, and this effect becomes more pronounced with decreasing internal gas pressure. Furthermore, after undergoing a rapid volume shrinkage phase, the growth in the effective volume shrinkage ratio of sediment-filled salt cavern UGS is slower compared to unfilled salt cavern UGS due to the restraining influence of sediment on cavern deformation. This implies that sediment-filled caverns can achieve a more stable effective volume level more quickly. For salt cavern UGS, this characteristic is highly advantageous for extending the lifespan of salt cavern UGS, maintaining relatively stable operational capacity over an extended period, and enhancing economic viability.

6.4. Equivalent Strain

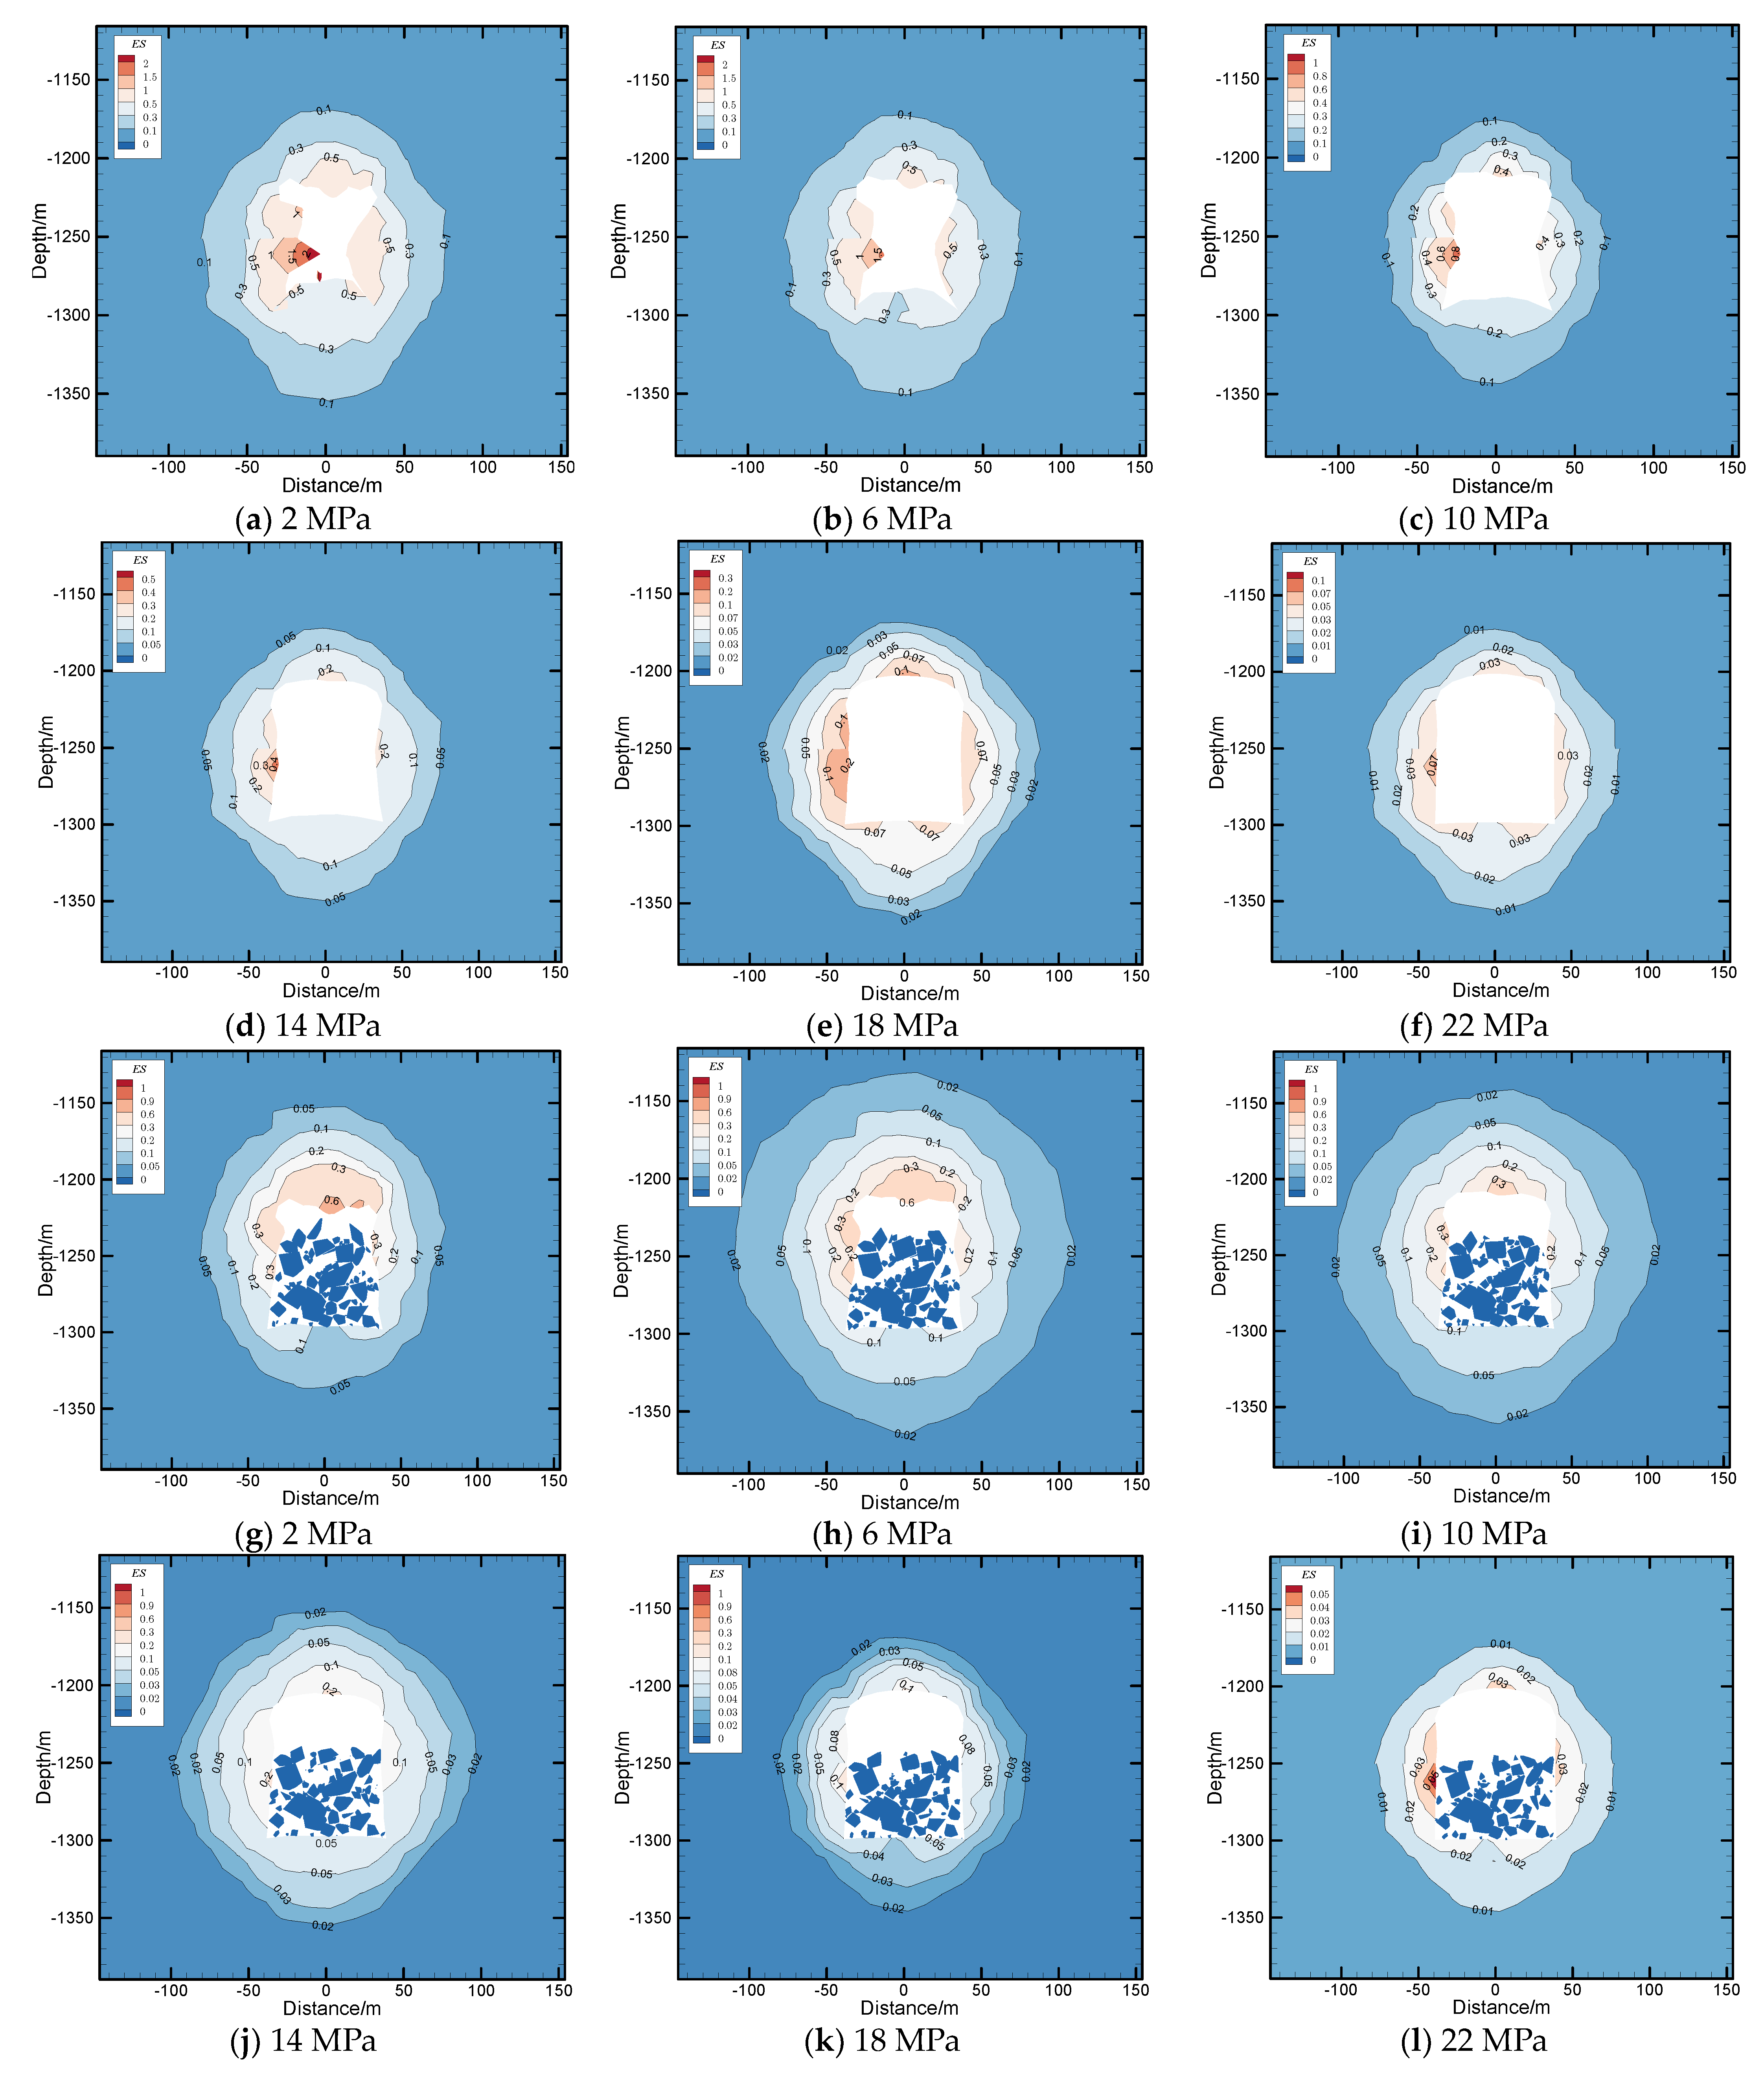
The equivalent strain contours, presented in Figure 13, offer valuable insights into the behavior of the two types of salt cavern UGS after 30 years of operation. For the unfilled salt cavern UGS, prominent zones of elevated equivalent strain are evident around the cavern, with the top and mid-sections of the cavern walls exhibiting relatively higher equivalent strain values compared to other areas. The maximum equivalent strain occurs slightly below the center of the cavern wall. Notably, as the internal gas pressure increases, there is a corresponding decrease in the overall equivalent strain. In this context, elevating the internal gas pressure remains the sole strategy for mitigating equivalent strain around the cavern periphery in the case of unfilled salt cavern UGS. However, it is important to acknowledge that this approach concurrently results in a reduction in the operational gas capacity of the salt cavern UGS.
In contrast, the equivalent strain contours for sediment-filled salt cavern UGS reveal distinct behaviors. Under varying internal gas pressures, larger regions of equivalent strain primarily encompass areas around the salt cavern that do not directly interface with sediment. Specifically, the cavern’s top section consistently demonstrates considerable equivalent strain. On the salt cavern walls in contact with sediment, the equivalent strain values progressively decrease as sediment depth increases. Remarkably, the location of the maximum equivalent strain aligns closely with the top surface of the sediment. This observation underscores the vital role of sediment in providing effective support to balance deviatoric stresses within the surrounding rock, consequently leading to reduced strain in the rock directly interfacing with the sediment.
Consequently, for sediment-filled salt cavern UGS, a focal point should be the safety of regions outside the sediment-filled zone. This consideration takes precedence when designing the minimum internal gas pressure for the cavern. Decreasing internal gas pressure implies greater compression on the sediment. As the sediment’s top surface rises, the position of maximum equivalent strain on the cavern wall also ascends. In scenarios where potential weak layers, such as micro-permeable interlayers, exist within the cavern’s depth range, it is imperative to mitigate the occurrence of maximum equivalent strain in such areas. This concern is paramount when crafting the design of sediment-filled salt cavern UGS.
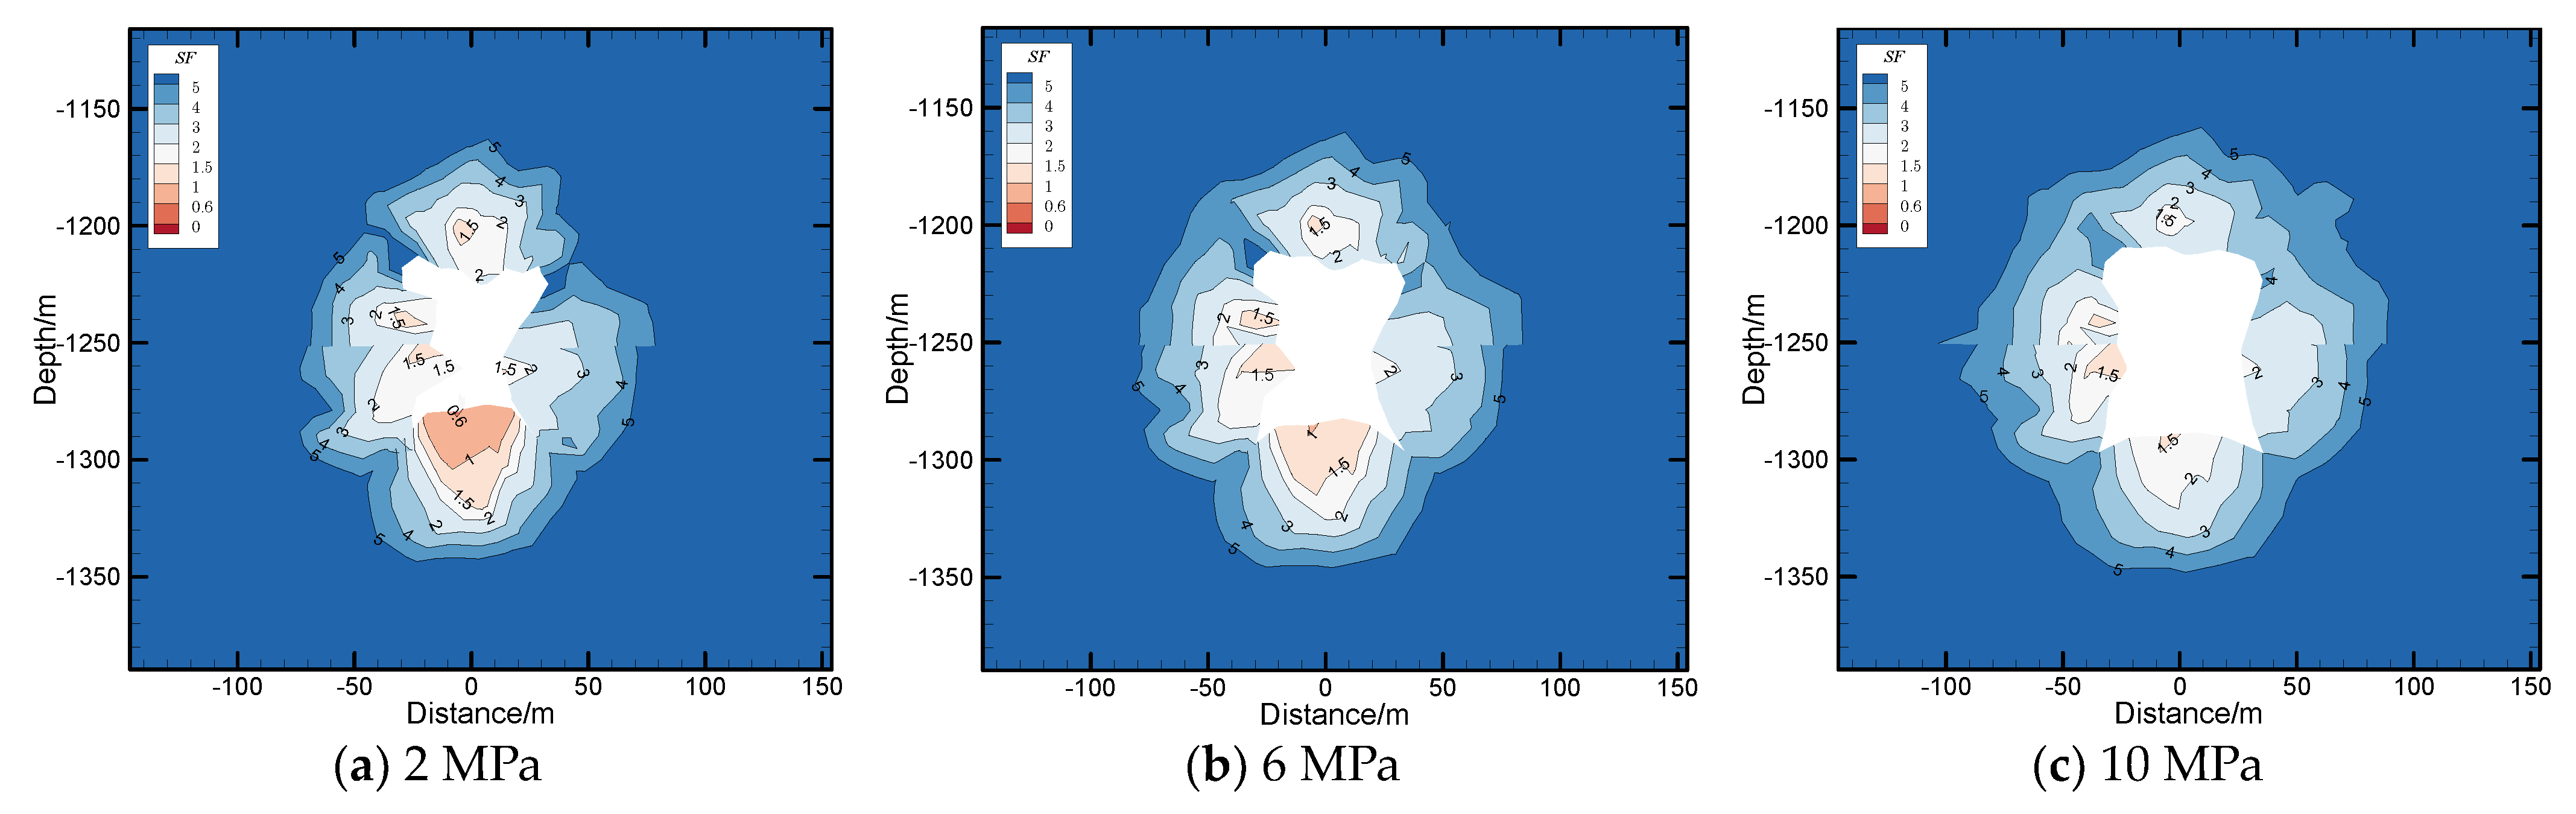
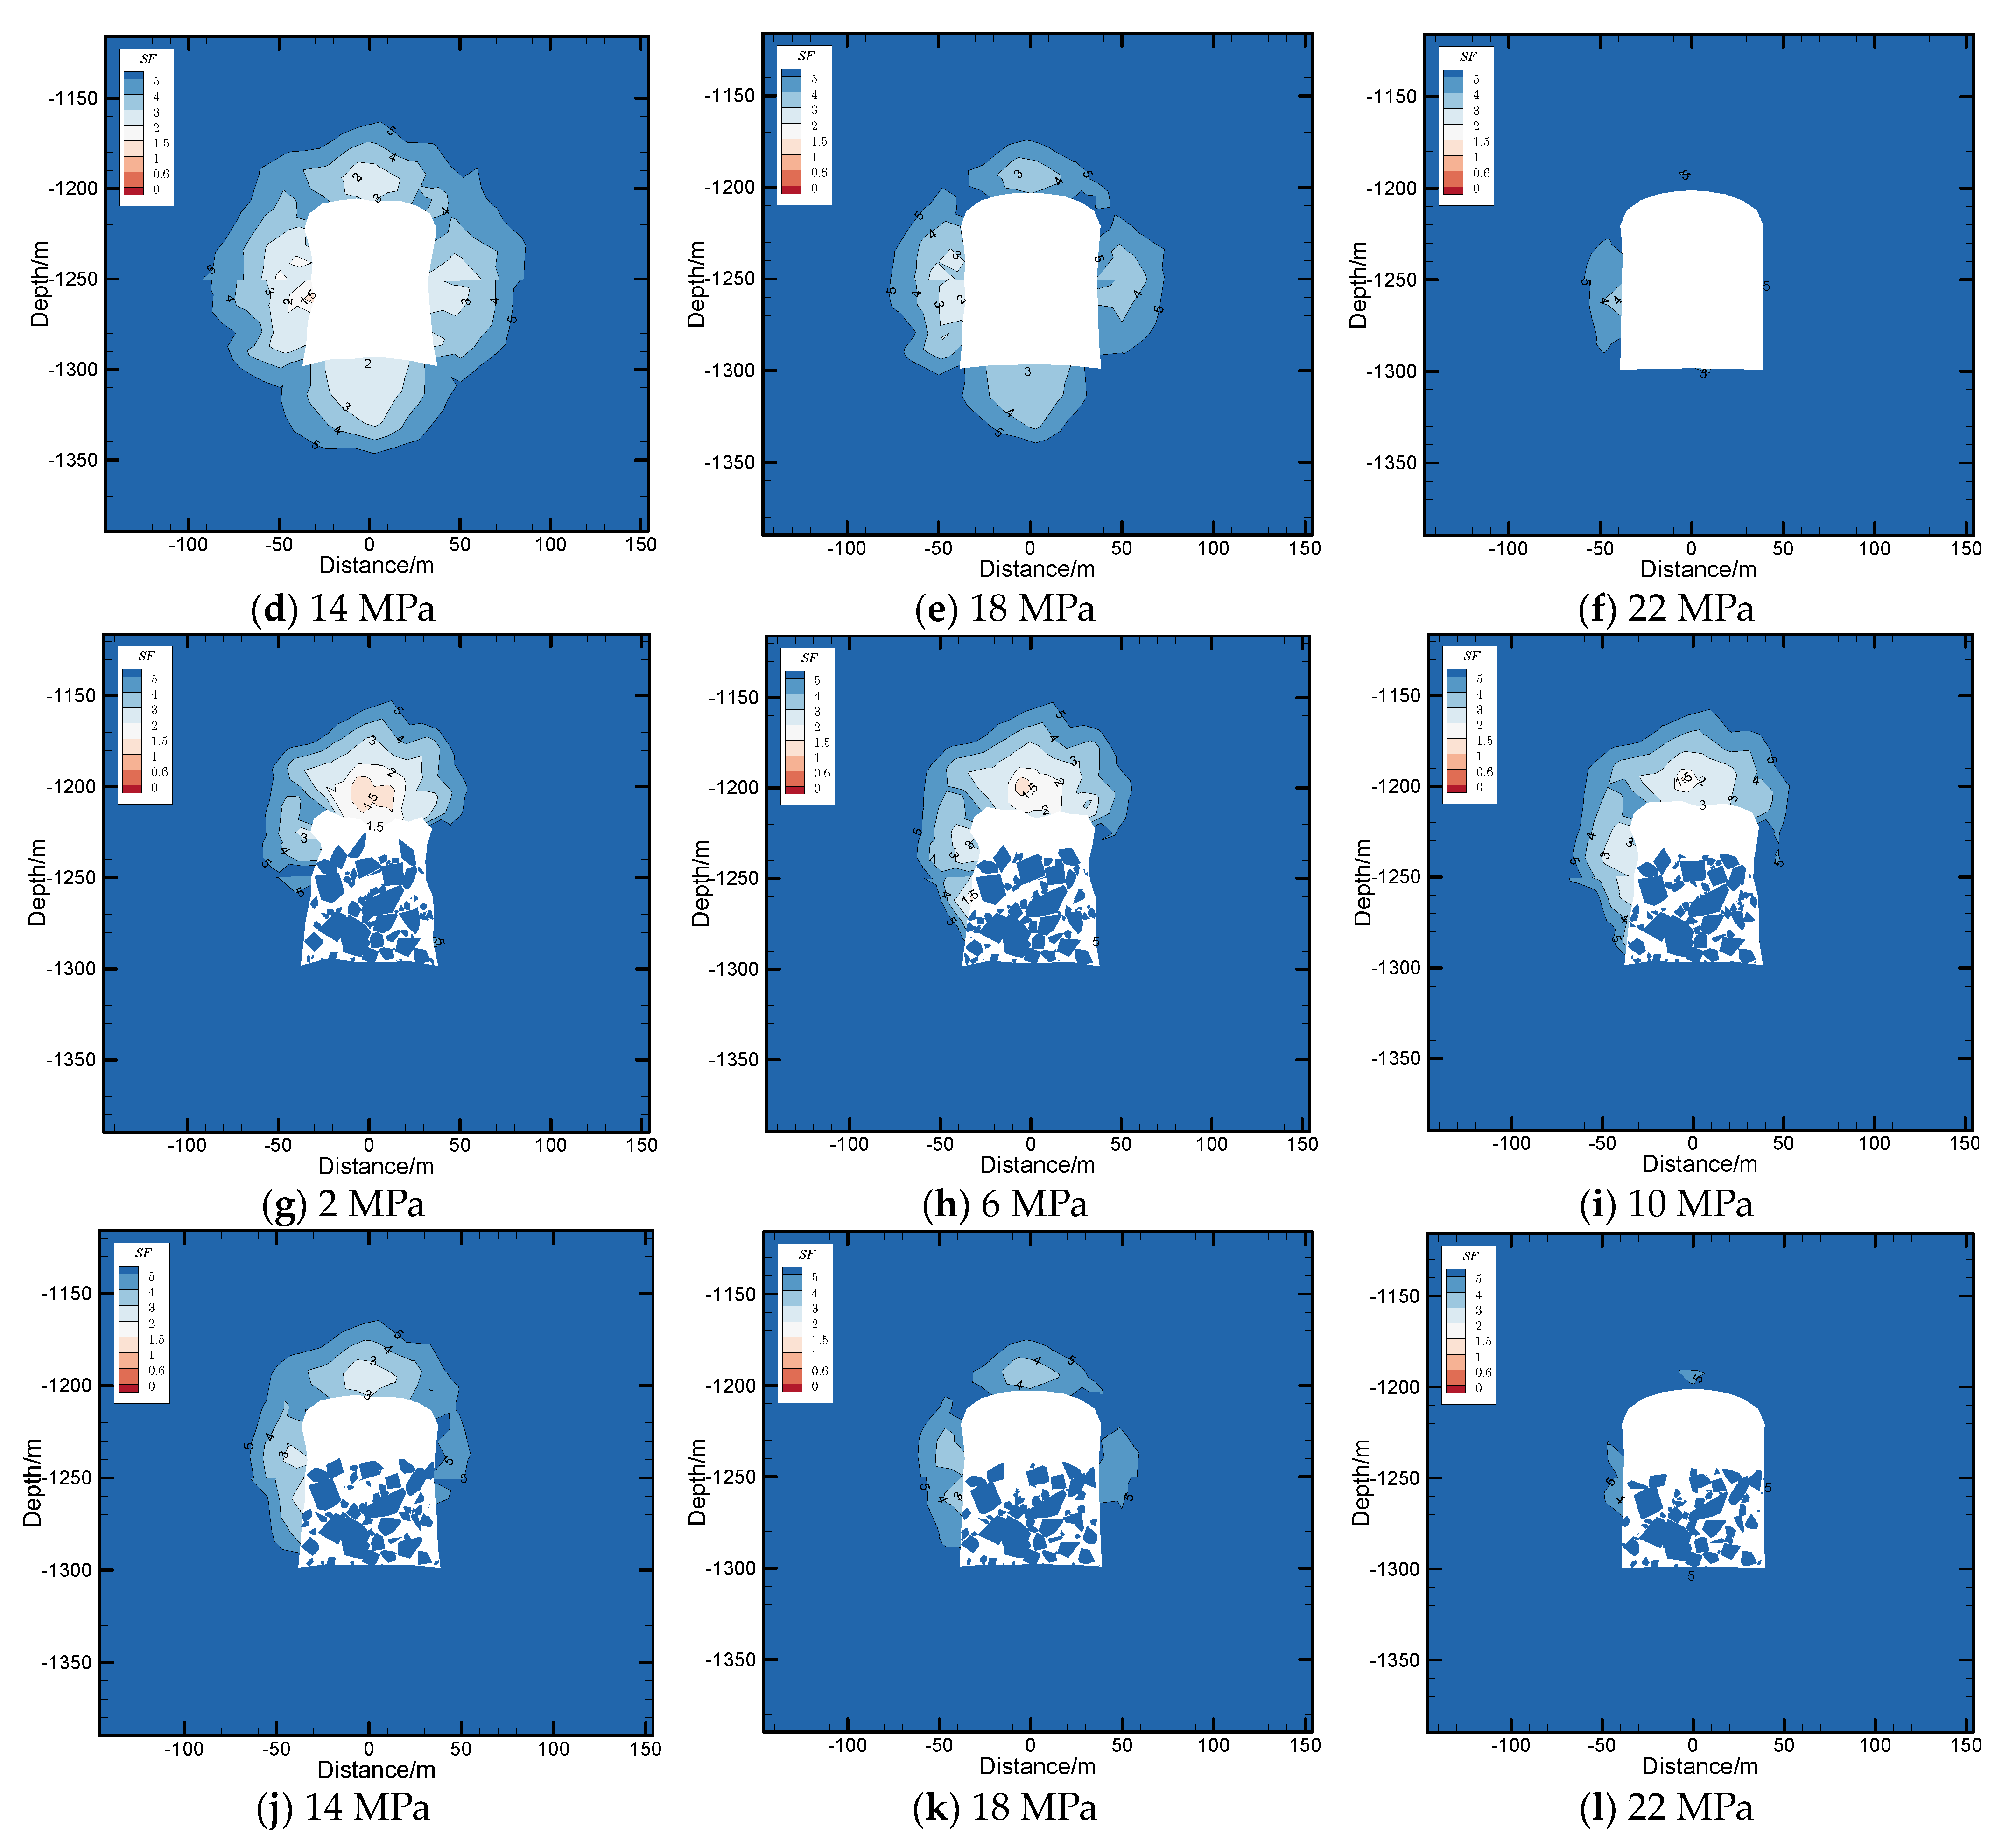
6.5. Safety Factor

Figure 14 illustrates the safety factor (SF) contours for unfilled salt cavern UGS and sediment-filled salt cavern UGS after 30 years of operation under varying internal gas pressures. Previous studies have indicated that SF < 1.5 signifies localized damage, SF < 1.0 denotes material failure, and SF < 0.6 indicates the onset of collapse [35]. The SF contours reveal that the bottoms of unfilled salt cavern UGS consistently exhibit the lowest SF values, a phenomenon particularly pronounced with lower internal gas pressures. At an internal gas pressure of 2 MPa, extensive collapse areas have already emerged at the cavern bottom after 30 years of operation. While increasing internal gas pressure significantly enhances SF within the surrounding rock, this comes at the cost of sacrificing the gas-supplying capacity of the salt cavern UGS. Figure 14g–l showcases the safety factor contours for sediment-filled salt cavern UGS under different internal pressures after 30 years of operation. It is evident that sediment exerts a substantial influence on the SF of the cavern’s surrounding rock. Regions filled with sediment exhibit SF predominantly exceeding 1.5, implying that sediment inhibits the dilatant behavior of the adjacent salt rock.
This observation underscores sediment’s role in curtailing the escalation of damage resulting from salt rock deformation. Preserving the low permeability of the salt rock and maintaining the sealing integrity of the cavern are highly advantageous consequences of sediment-induced suppression of salt rock deformation and associated damage. This further affirms the positive influence of sediment in bolstering the stability of sediment-filled salt cavern UGS, emphasizing their potential for enhancing both safety and gas-storage efficiency.

7. Summary and Conclusions

In this study, a new modeling method for sediment-filled salt caverns is introduced to simulate the UGS in sediment-filled salt caverns, and the effect of sediment on the stability of salt caverns is evaluated using a multi-parameter system. The primary conclusions can be summarized as follows:
(1)
A novel modeling approach was devised for sediment-filled salt cavern UGS. The Discrete Element Method was employed to simulate sediment-filled salt caverns, with both sediment and rock formations represented by rigid and deformable elements, respectively. Drawing from experimental outcomes of simulated sedimentation, the ellipsoidal elemental framework was employed to construct a sediment particle model with a specified size distribution. This innovative modeling strategy successfully elucidated the impact of sediment on salt cavern UGS stability.
(2)
Deformation, plastic zone development, effective volume shrinkage ratio, equivalent strain, and safety factor were employed to assess sediment’s impact on salt cavern stability. Through 30-year simulations of sediment-filled and unfilled salt cavern UGS under varying internal gas pressures, it was observed that sediment significantly curbed deformation, and reduced effective volume shrinkage, with a more pronounced effect at lower internal gas pressures. Additionally, sediment’s supporting role substantially diminished the plastic zones within the rock adjacent to sediment and notably enhanced the safety factor of this section. Compared to unfilled salt cavern UGS, sediment-filled counterparts reached a relatively stable effective volume and plastic zone level more rapidly under similar internal gas pressure conditions, ensuring a stable storage space for natural gas.
(3)
The research outcomes underscore the long-term advantages of sediment-filled salt cavern UGS. Nonetheless, it is essential to recognize that sediment’s impact on cavern stability primarily affects the surrounding rock in contact with sediment. Hence, while assessing cavern UGS stability or designing internal gas pressures, careful consideration should be given to the rock sections within caverns not in direct contact with sediment.
(4)
Leveraging sediment-filled voids for natural gas storage constitutes a pivotal direction for China’s salt cavern UGS development. The work in this paper shows that sediment has a positive effect on the stability of salt cavern UGS, and the results of the study can be used as a reference for the salt cavern research community.

Author Contributions

X.L.: Methodology, Writing—original draft, Visualization. H.M.: Resources, Supervision. R.C.: Writing—review & editing. K.Z.: Writing—review & editing. X.W.: Validation. Z.Z.: Validation. X.S.: Validation. C.Y.: Validation. All authors have read and agreed to the published version of the manuscript.

Funding

This research was funded by Major Research Development Program of Hubei province, grant number No. 2022BAA093, No. 2022BAD163, Excellent Young Scientists Fund Program of National Natural Science Foundation of China, grant number No. 52122403, Special Fund for Strategic Pilot Technology of Chinese Academy of Sciences, grant number Grant No. XDPB21.

Data Availability Statement

No new data were created or analyzed in this study. Data sharing is not applicable to this article.

Conflicts of Interest

The authors declare that they have no known competing financial interests or personal relationships that could have appeared to influence the work reported in this paper.

References

  1. Department of Oil and Gas NEA, Institute of Resources and Environmental Policy DRC of the SC, Oil and Gas Resources Strategy Research Center M of NR of the PR of C. China Natural Gas Development Report (2023). 2022. Available online: http://www.nea.gov.cn/2023-07/21/c_1310733569.htm (accessed on 16 October 2023).
  2. Khaledi, K.; Mahmoudi, E.; Datcheva, M.; Schanz, T. Analysis of compressed air storage caverns in rock salt considering thermo-mechanical cyclic loading. Environ. Earth Sci. 2016, 75, 1149. [Google Scholar] [CrossRef]
  3. BP. BP Statistical Review of World Energy 2022. UK: BP. 2022. Available online: https://www.bp.com/en/global/corporate/energy-economics/statistical-review-of-world-energy.html (accessed on 16 October 2023).
  4. Cornet, J.S.; Dabrowski, M.; Schmid, D.W. Long term creep closure of salt cavities. Int. J. Rock Mech. Min. Sci. 2018, 103, 96–106. [Google Scholar] [CrossRef]
  5. Lyu, C.; Liu, J.; Ren, Y.; Liang, C.; Liao, Y. Study on very long-term creep tests and nonlinear creep-damage constitutive model of salt rock. Int. J. Rock Mech. Min. Sci. 2021, 146, 104873. [Google Scholar] [CrossRef]
  6. Schulze, O.; Popp, T.; Kern, H. Development of damage and permeability in deforming rock salt. Eng. Geol. 2001, 61, 163–180. [Google Scholar] [CrossRef]
  7. Wu, W.; Hou, Z.; Yang, C. Investigations on permeability of rock salt. Chin. J. Geotech. Eng. 2005, 27, 746–749. [Google Scholar] [CrossRef]
  8. Chen, J.; Kang, Y.; Liu, W.; Fan, J.; Jiang, D.; Chemenda, A. Self-healing capacity of damaged rock salt with different initial damage. Geomech. Eng. 2018, 15, 615–620. [Google Scholar]
  9. Hunsche, U.; Hampel, A. Rock salt—The mechanical properties of the host rock material for a radioactive waste repository. Eng. Geol. 1999, 52, 271–291. [Google Scholar] [CrossRef]
  10. Bauer, S.J. Waste Disposal in Horizonal Solution Mined Caverns Considerations of Site Location, Cavern Stability, and Development Considerations; Sandia National Laboratories: Albuquerque, NM, USA, 1998; Available online: https://www.yumpu.com/en/document/view/32186359/waste-disposal-in-horizontal-solution-mined-caverns (accessed on 16 October 2023).
  11. Soubeyran, A.; Rouabhi, A.; Coquelet, C. Thermodynamic analysis of carbon dioxide storage in salt caverns to improve the Power-to-Gas process. Appl. Energy 2019, 242, 1090–1107. [Google Scholar] [CrossRef]
  12. Warren, J.K. Solution Mining and Salt Cavern Usage. Evaporites; Springer International Publishing: Cham, Switzerland, 2016; pp. 1303–1374. [Google Scholar] [CrossRef]
  13. Zhang, M.; Gou, Y.; Zhu, H.; Wu, Z.; Liu, T. Water soluble performance and solution mining countermeasures of salt-cavern gas storages with complex lithologies. Oil Drill. Prod. Technol. 2020, 42, 467–470. [Google Scholar] [CrossRef]
  14. Ban, F. Study on Optimization Design of Solution Mining Cavern for Underground Gas Storage. Ph.D. Thesis, Institute of Porous Flow & Fluid Mechanics, Chinese Academy of Sciences, Langfang, China, 2008. [Google Scholar]
  15. Chen, X.; Zhang, L.; Li, Y.; Ma, H.; Ji, G. Experimental investigation on bulking-expansion coefficient of sediment of storage in bedded salt. Min. RD 2013, 33, 34–37. [Google Scholar] [CrossRef]
  16. Zhao, W.; Gao, H.; Chen, W.; Xie, P. Analytical study on seismic response of subsea tunnels in a multi-layered seabed subjected to P- and SV-waves. Tunn. Undergr. Space Technol. 2023, 134, 105015. [Google Scholar] [CrossRef]
  17. Wu, W. Experimental Studies and Theoretic Analysis of Static & Dynamic Mechanical Characteristics of Rock Salt—Investigation on Mechanical Aspects for Energy (Petroleum, Natural Gas) Storage or Wastes Disposal in Host Rock Salt. Ph.D. Thesis, Institute of Rock & Soil Mechanics, The Chinese Academy of Science, Wuhan, China, 2003. [Google Scholar]
  18. Li, J.C.; Li, H.B.; Ma, G.W.; Zhou, Y.X. Assessment of underground tunnel stability to adjacent tunnel explosion. Tunn. Undergr. Space Technol. 2013, 35, 227–234. [Google Scholar] [CrossRef]
  19. Le, Z.; Yu, Q.; Zheng, H.; Cao, Y. Interaction Mechanism Between Granular Backfill and Rock Pillar Under Lateral Confined Conditions. J. Northeast. Univ. 2021, 42, 124–130. [Google Scholar]
  20. Song, W.; Ren, H.; Cao, S. Interaction mechanism between backfill and rock pillar under confined compression condition. J. China Univ. Min. Technol. 2016, 45, 49–55. [Google Scholar] [CrossRef]
  21. Li, P.; Li, Y.; Shi, X.; Zhao, K.; Liu, X.; Ma, H.; Yang, C. Prediction method for calculating the porosity of insoluble sediments for salt cavern gas storage applications. Energy 2021, 221, 119815. [Google Scholar] [CrossRef]
  22. Zheng, Y.; Qiu, X.; Ding, G.; Zhao, Y.; Zhang, M.; Lai, X. Experimental research on using residue void space in salt cavern gas storage. J. Salt Sci. Chem. Ind. 2019, 48, 14–19. (In Chinese) [Google Scholar] [CrossRef]
  23. Li, J.; Tang, Y.; Shi, X.; Xu, W.; Yang, C. Modeling the construction of energy storage salt caverns in bedded salt. Appl. Energy 2019, 255, 113866. [Google Scholar] [CrossRef]
  24. Liang, X.; Ma, H.; Li, P.; Cai, R.; Zhao, K.; Li, H.; Yu, H.; Yang, C. A prediction method of the effective volume in sediment-filled salt cavern. J. Energy Storage 2022, 56, 106026. [Google Scholar] [CrossRef]
  25. Zhang, Y. Numerical Simulation of Long-Term Operation Stability of Horizontal Salt Cavern Gas Storage. Master’s Thesis, University of Chinese Academy of Sciences, Wuhan, China, 2020. [Google Scholar]
  26. Itasca Consulting Group Inc. 3DEC Version 5.0 User’s Guide; Itasca Consulting Group Inc.: Minneapolis, MN, USA, 2013. [Google Scholar]
  27. Shi, C.; Zhu, W.; Zheng, W. Numerical Simulation Techniques and Engineering Applications of Discrete Element Numerical Simulation of Blocks; China Architecture & Building Press: Beijing, China, 2016. [Google Scholar]
  28. Wu, W.; Hou, Z.; Yang, C. Investigations on evaluating criteria of stablilties for energy (petroleum and natural gas) storage on caverns in rock salt. Chin. J. Rock Mech. Eng. 2005, 24, 2497–2505. (In Chinese) [Google Scholar]
  29. Labaune, P.; Rouabhi, A. Dilatancy and tensile criteria for salt cavern design in the context of cyclic loading for energy storage. J. Nat. Gas Sci. Eng. 2019, 62, 314–329. [Google Scholar] [CrossRef]
  30. Hunsche, U. Determination of dilatancy boundary and damage up to failure for four types of rock salt at different stress geometries. Ser. Rock Soil Mech. 1998, 163–174. Available online: https://www.semanticscholar.org/paper/Determination-of-dilatancy-boundary-and-damage-up-Hunsche/b87e703ef254c346e4b05a2861357172239ad2d6 (accessed on 16 October 2023).
  31. Alkan, H.; Cinar, Y.; Pusch, G. Rock salt dilatancy boundary from combined acoustic emission and triaxial compression tests. Int. J. Rock Mech. Min. Sci. 2007, 44, 108–119. [Google Scholar] [CrossRef]
  32. Van Sambeek, L.L.; Ratigan, J.L.; Hansen, F.D. Dilatancy of rock salt in laboratory tests. Int. J. Rock Mech. Min. Sci. Geomech. Abstr. 1993, 30, 735–738. [Google Scholar] [CrossRef]
  33. Devries, K.L. Laboratory Testing in Support of a Bedded Salt Failure Criterion. In Proceedings of the Solution Mining Research Institute Fall Meeting 2003, Washington, DC, USA, 11–12 December 2012; pp. 90–113. [Google Scholar]
  34. DeVries, K.L. Geomechanical analyses to determine the onset of dilation around natural gas storage caverns in bedded salt. In Proceedings of the SMRI Spring Technical Meeting, Brussels, Belgium, 30 April–3 May 2006; pp. 131–150. [Google Scholar]
  35. Yang, C.; Wang, T.; Li, Y.; Yang, H.; Li, J.; Qu, D.; Xu, B.; Yang, Y.; Daemen, J. Feasibility analysis of using abandoned salt caverns for large-scale underground energy storage in China. Appl. Energy 2015, 137, 467–481. [Google Scholar] [CrossRef]
Figure 1. China’s natural gas consumption and growth rate, 2011–2022 [3].
Energies 16 07825 g001
Figure 2. Schematic diagram of the process of debrining: (a) traditional salt cavern UGS; (b) sediment-filled salt cavern UGS.
Energies 16 07825 g002
Figure 3. Interaction between the sediment and the salt cavern through contact forces.
Energies 16 07825 g003
Figure 4. Schematic diagram of the process of interaction between sediment and salt caverns.
Energies 16 07825 g004
Figure 5. Calculation cycle in 3DEC.
Energies 16 07825 g005
Figure 6. Generation of sediment particles based on ellipsoidal elemental framework. (a) ellipsoidal elemental framework; (b) Simulation of sediment particles.
Energies 16 07825 g006
Figure 7. 3D geomechanical model: (a) Profile of the mesh model; (b) Schematic of model size.
Energies 16 07825 g007
Figure 8. Displacement contours of different salt cavern UGSs after 30 years of operation under different internal gas pressures (profiles perpendicular to the Y-direction, Y = 0): (af) are the displacement contours of the unfilled salt cavern UGS, and (gl) are the displacement contours of the sediment-filled salt UGS.
Energies 16 07825 g008
Figure 9. Displacement curves at different monitoring points. (a) Top monitoring point; (b) Bottom monitoring point; (c) Sidewall monitoring point.
Energies 16 07825 g009aEnergies 16 07825 g009b
Figure 10. Plasticity zones of unfilled salt cavern UGS and sediment-filled salt cavern UGS after 30 years of operation under different internal gas pressures.
Energies 16 07825 g010aEnergies 16 07825 g010b
Figure 11. Ratio of plastic zone volume to salt cavern volume under different internal gas pressures.
Energies 16 07825 g011
Figure 12. Effective volume shrinkage ratio of salt cavern UGS at different internal gas pressures.
Energies 16 07825 g012
Figure 13. ES contours of different salt cavern UGSs after 30 years of operation under different internal gas pressures (profiles perpendicular to the Y-direction, Y = 0): (af) are the ES contours of the unfilled salt cavern UGS, and (gl) are the ES contours of the sediment-filled salt UGS.
Energies 16 07825 g013
Figure 14. SF contours of different salt cavern UGSs after 30 years of operation under different internal gas pressures (profiles perpendicular to the Y-direction, Y = 0): (af) are the SF contours of the unfilled salt cavern UGS, and (gl) are the SF contours of the sediment-filled salt UGS.
Energies 16 07825 g014aEnergies 16 07825 g014b
Table 1. Mechanical parameters used in the numerical simulations.
RegionsParametersValues
Rock saltDensity/(kg/m3)2160
Elastic modulus/GPa4.6
Poisson’s ratio0.23
Cohesion/MPa9.8
Friction angle /degrees36
Tensile strength/MPa1.5
A/(MPa−2.9/h)5.8 × 10−9
n2.7
SedimentDensity/(kg/m3)2900
ContactStiffness-normal/GPa1.0
Stiffness-shear/GPa1.0
Friction/degrees40
Damping0.8
Disclaimer/Publisher’s Note: The statements, opinions and data contained in all publications are solely those of the individual author(s) and contributor(s) and not of MDPI and/or the editor(s). MDPI and/or the editor(s) disclaim responsibility for any injury to people or property resulting from any ideas, methods, instructions or products referred to in the content.

