


Optimal Electric Vehicle Parking Lot Energy Supply Based on Mixed-Integer Linear Programming


Abstract
:1. Introduction
1.1. Literature Review
1.2. Research Questions and Contributions
- 1.
- The mathematical formulation, based on MILP, of an optimal parking lot power supply solution combining different important investment/management aspects.
- 2.
- A detailed analysis of different parking lot supply options as well as the effect of different reimbursement mechanisms for PV energy production surplus on system design and costs.
- 3.
- A comprehensive analysis of the optimal parking lot solution for a Croatian test case based on realistic data with a sensitivity analysis for relevant parameters.
2. Mathematical Model
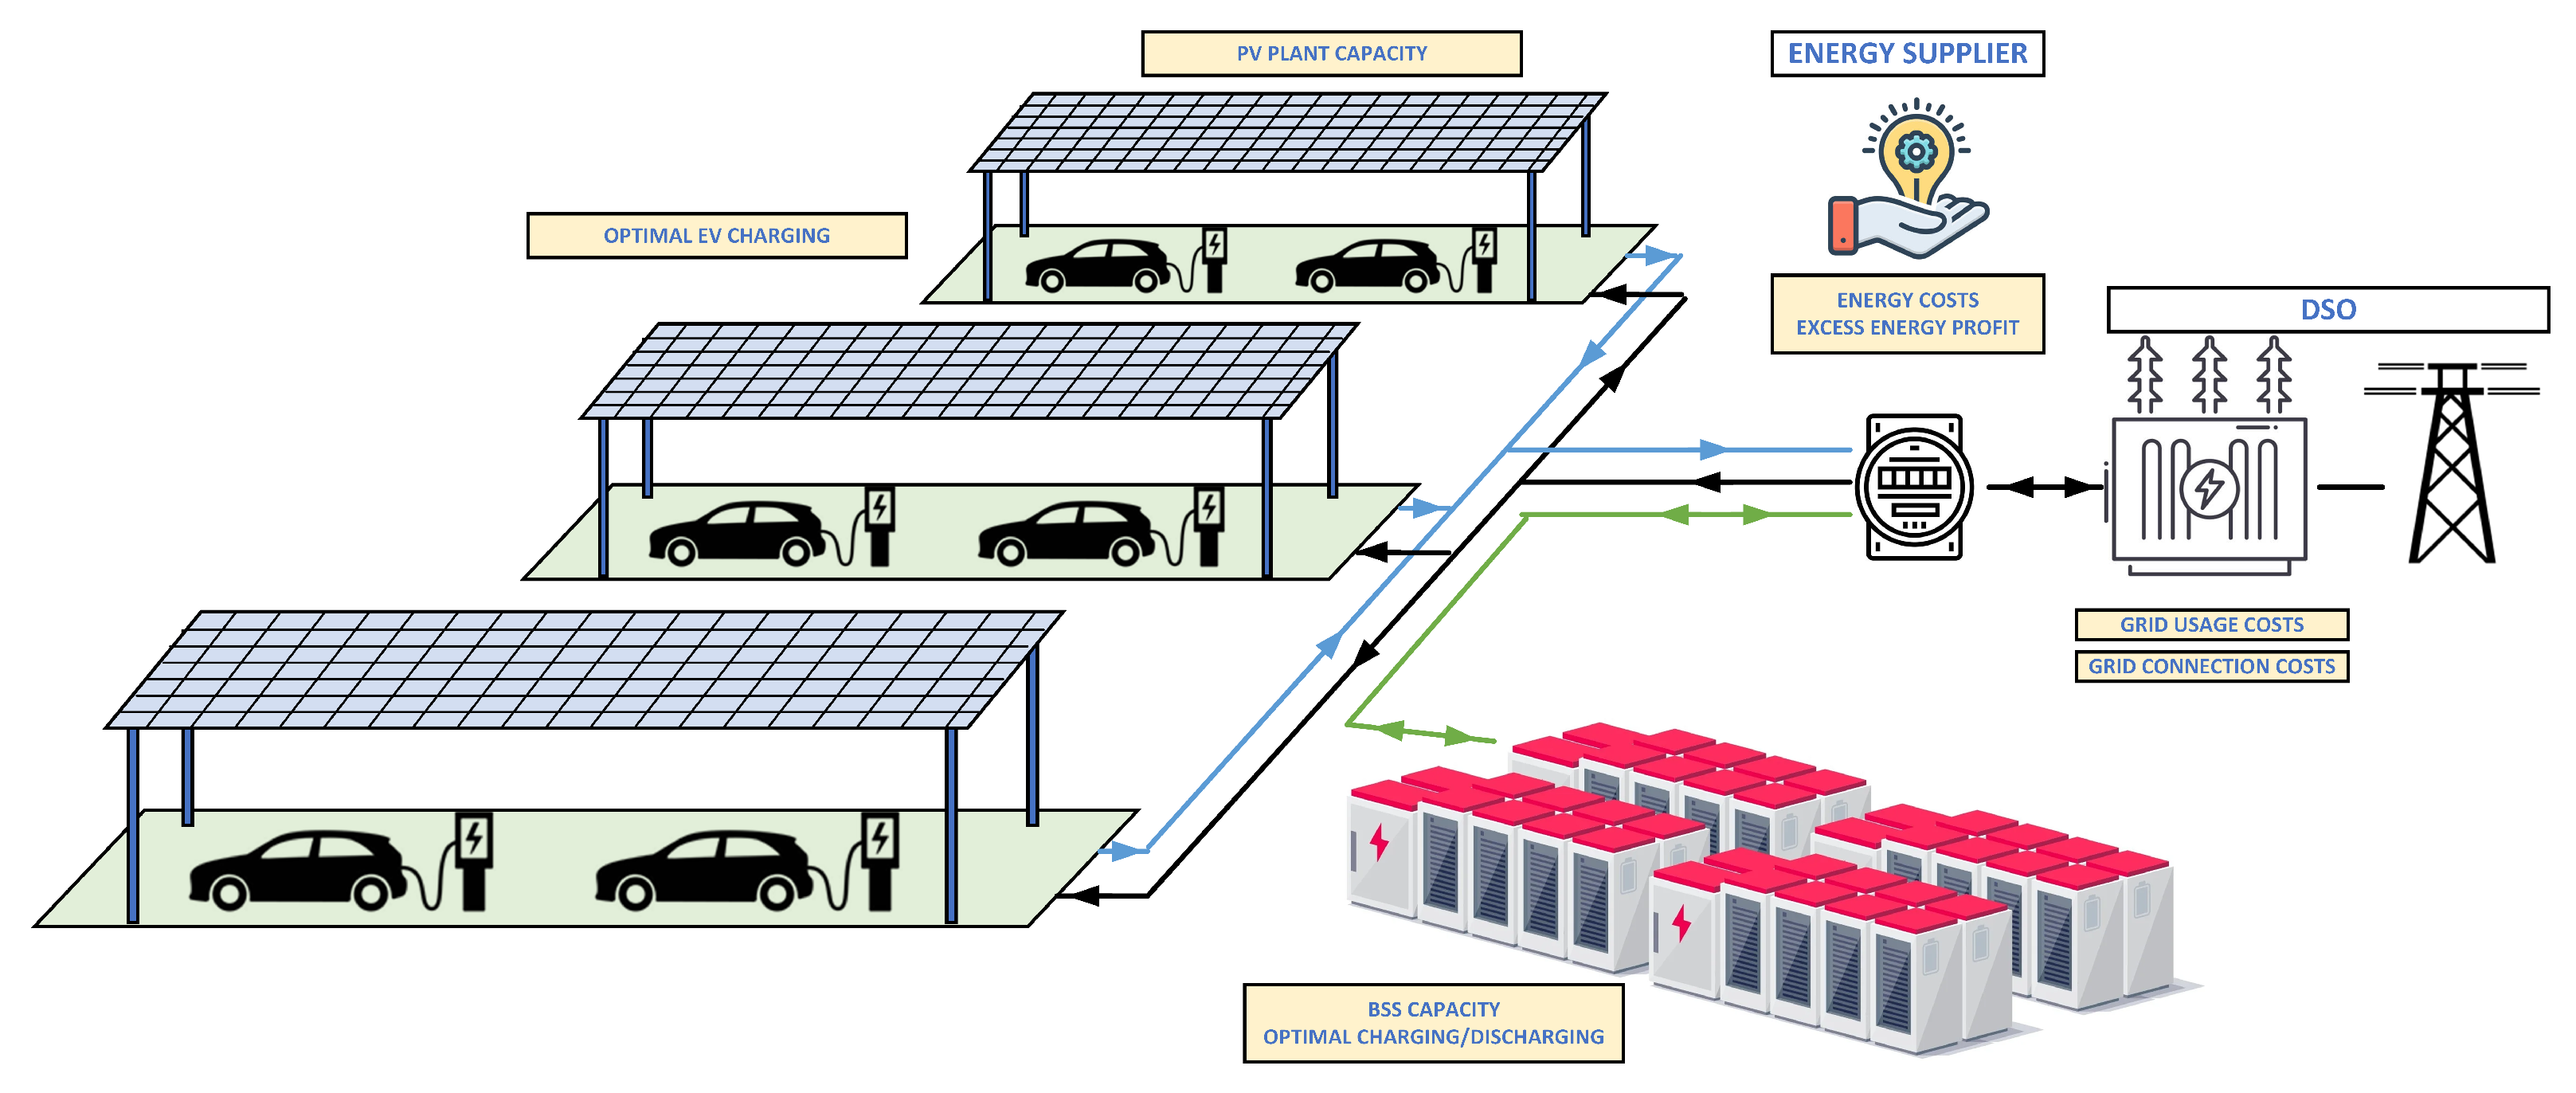
2.1. Model and Input Data Description
2.2. Mathematical Formulation
- Power supply investment decision variables: PV plant investment (), BSS investment (), grid connection purchase power ().
- PL management variables: EV charging (), PV plant production (), BSS operation (), grid supply and associated costs ().
3. Case Study
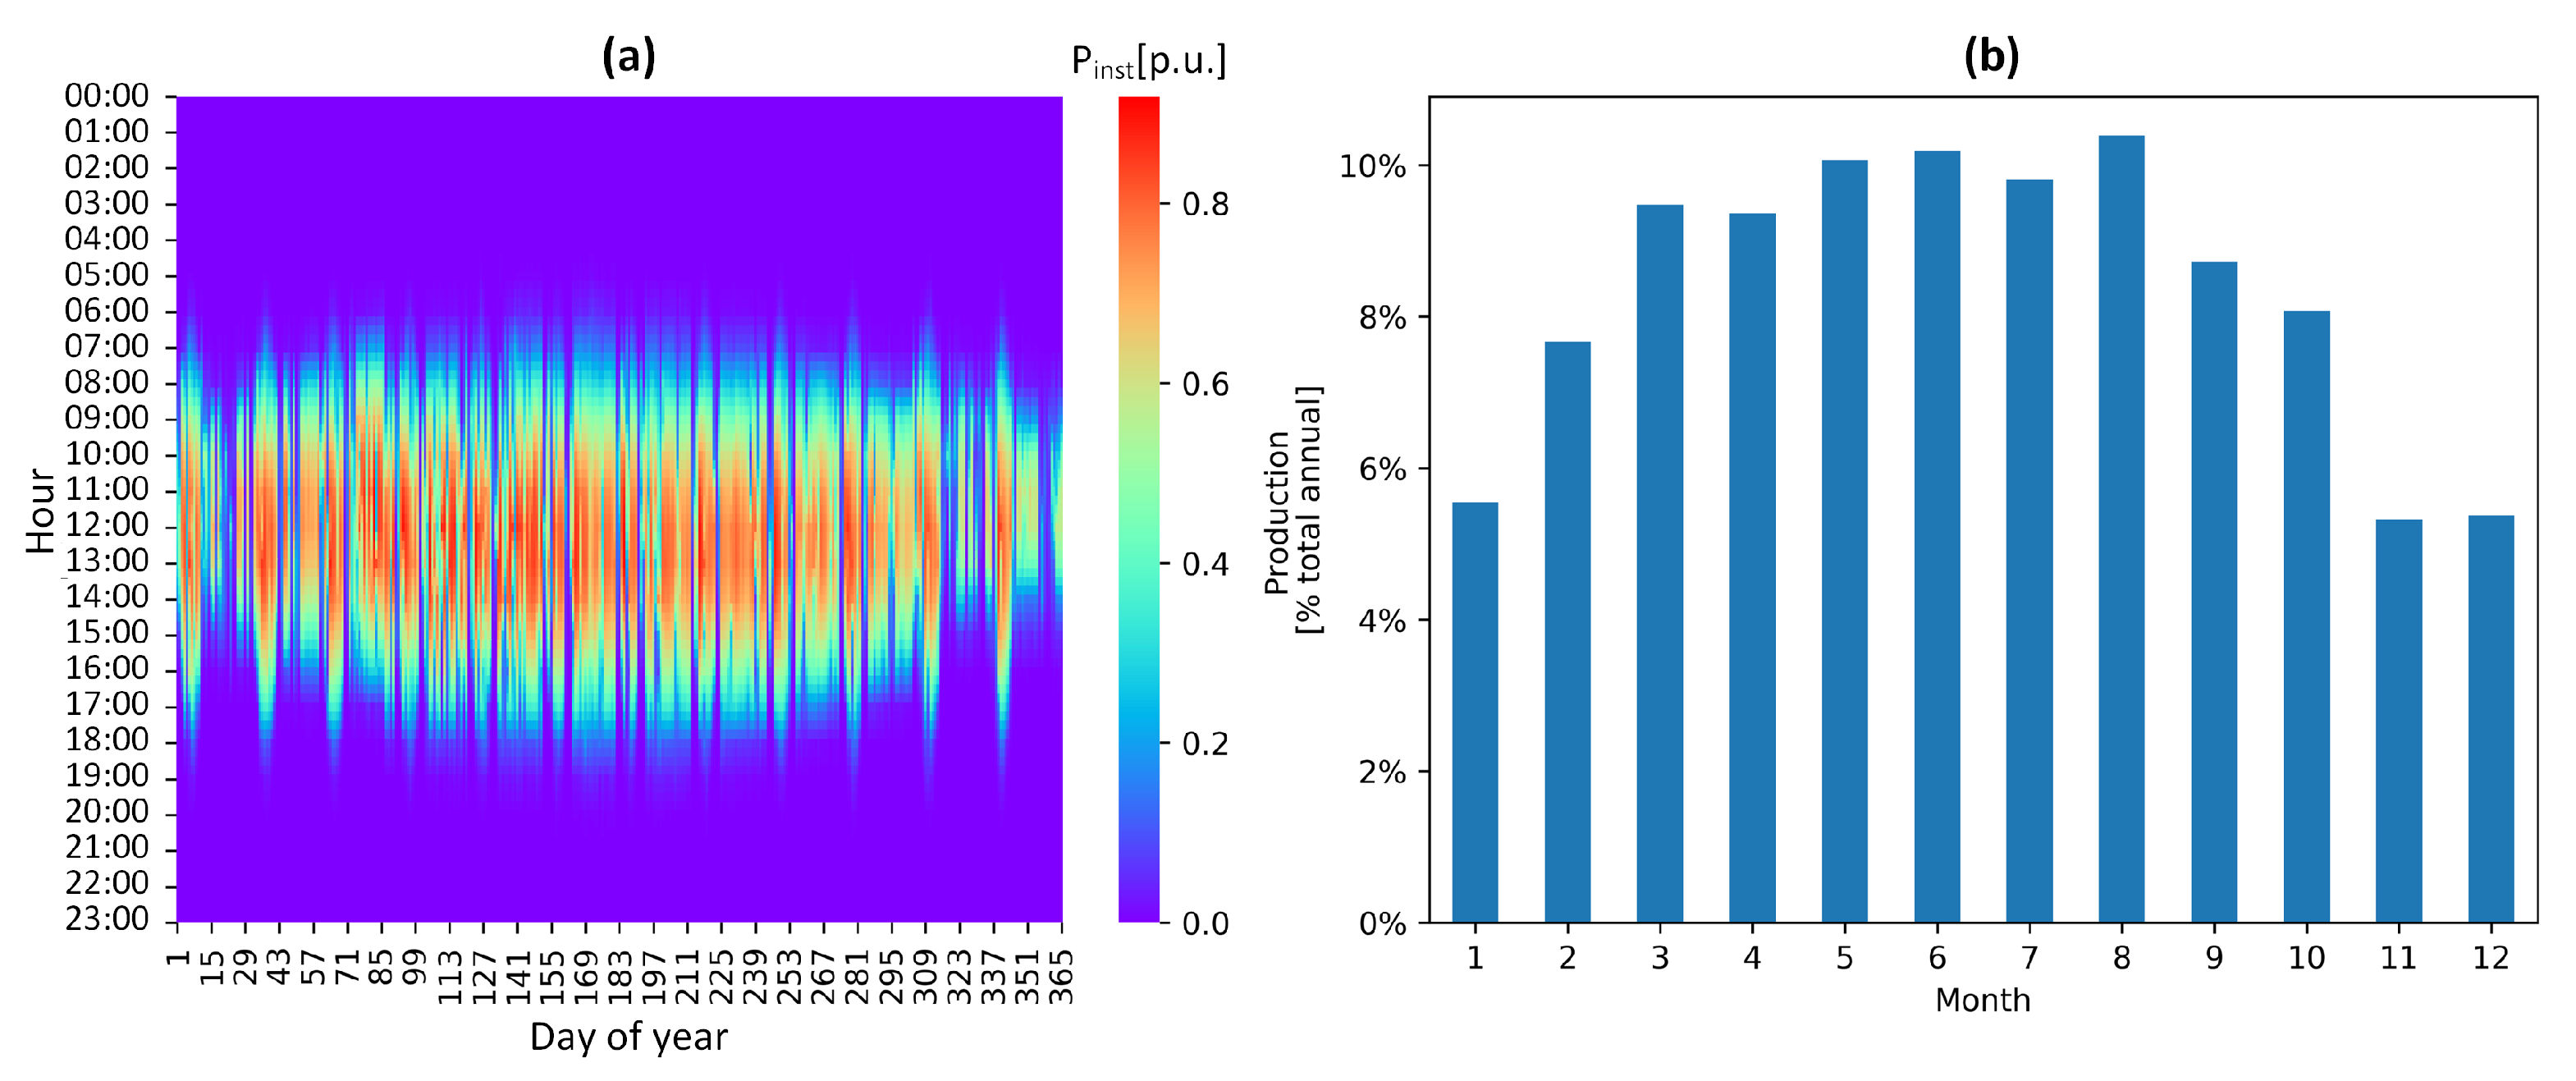
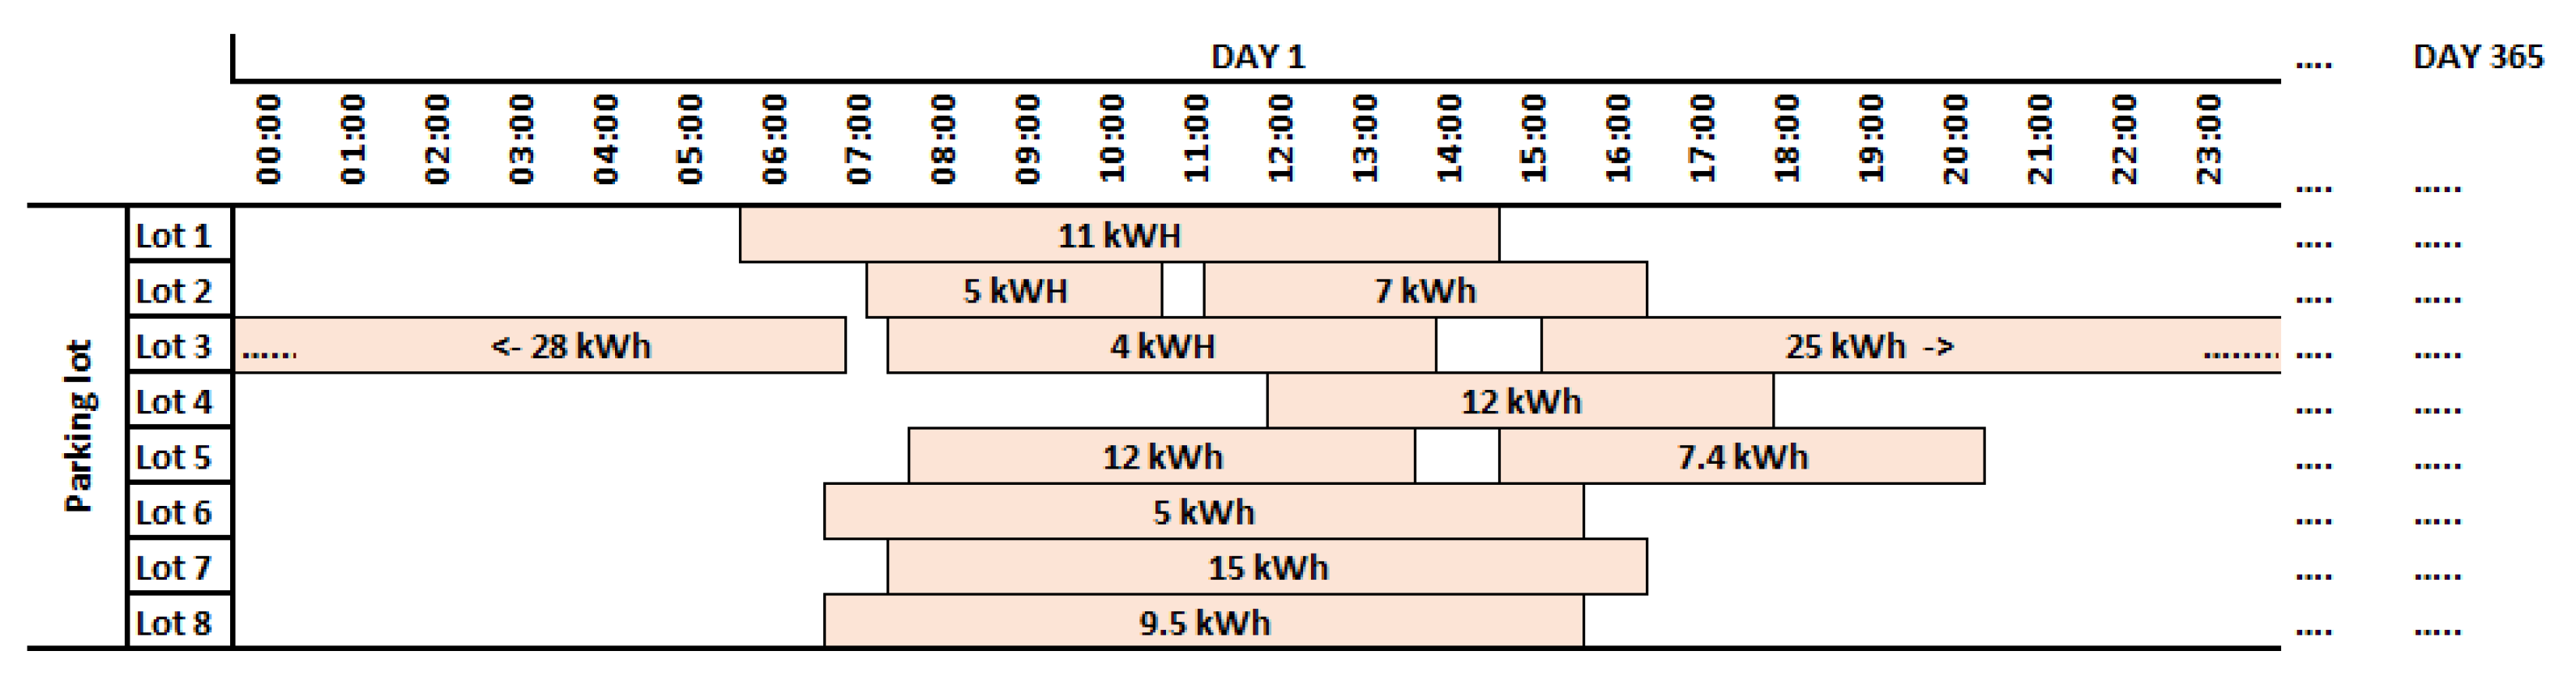
3.1. Input Data
3.2. Charging Station Power Supply Options
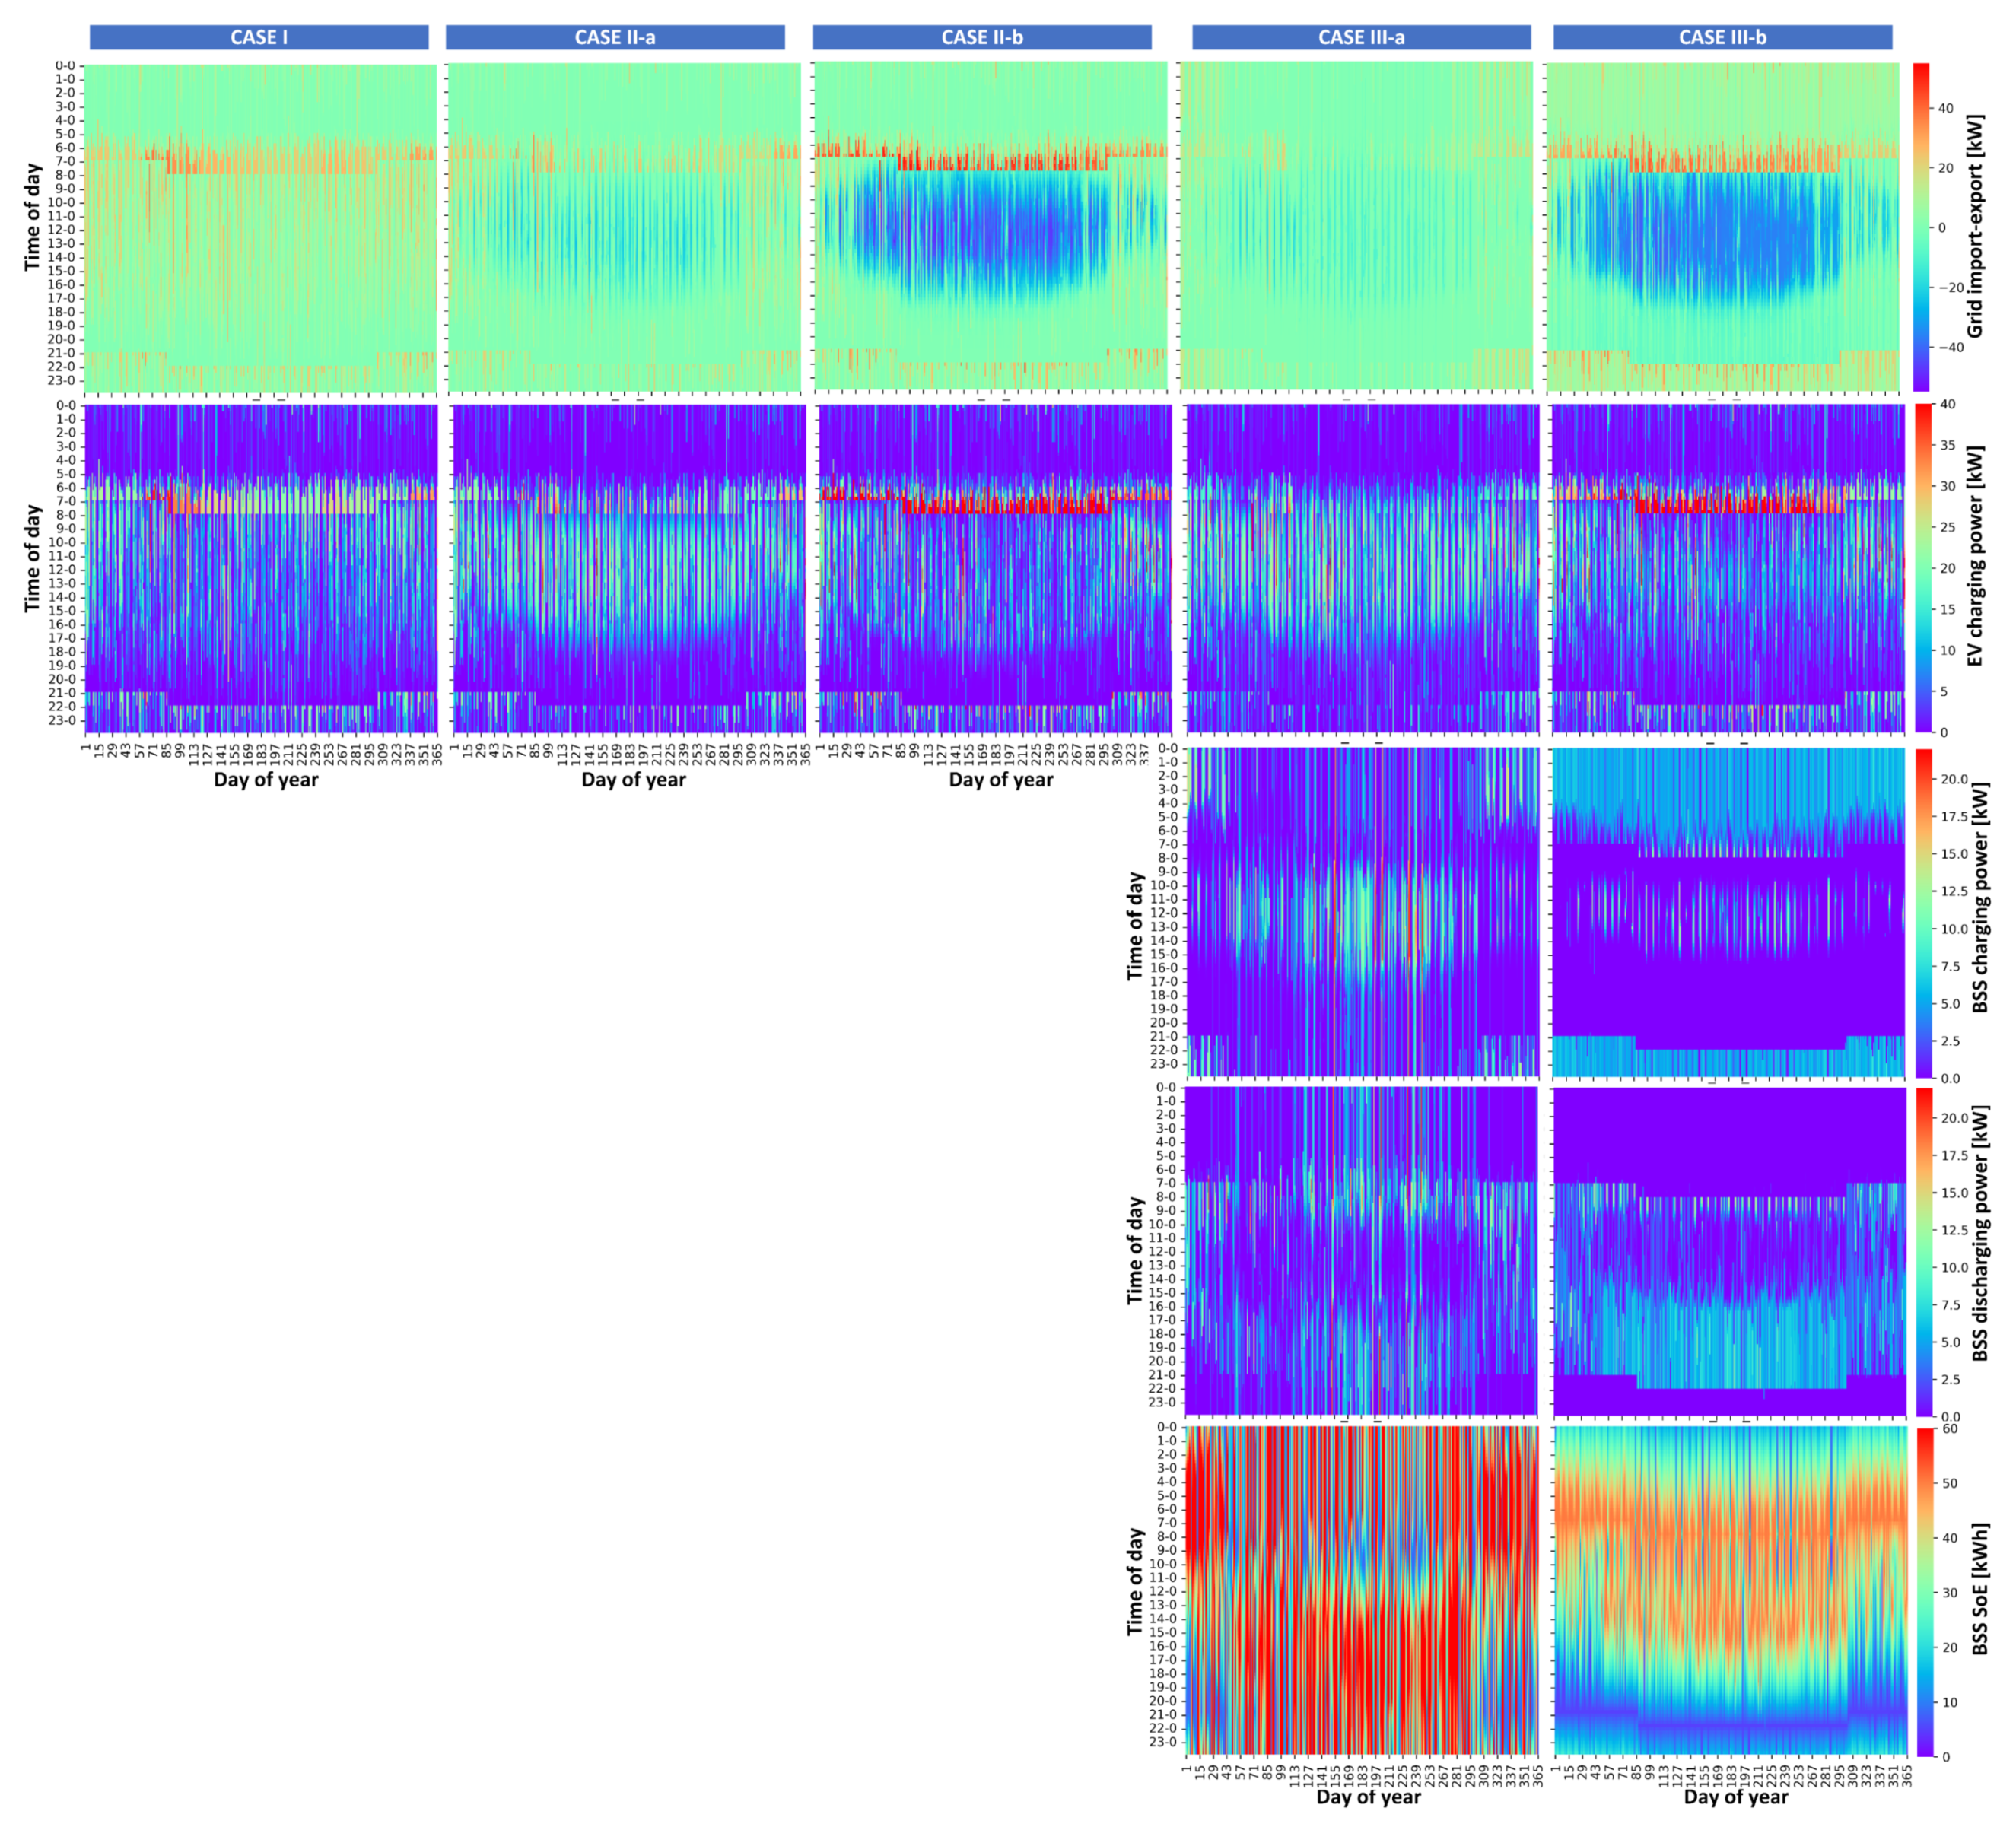
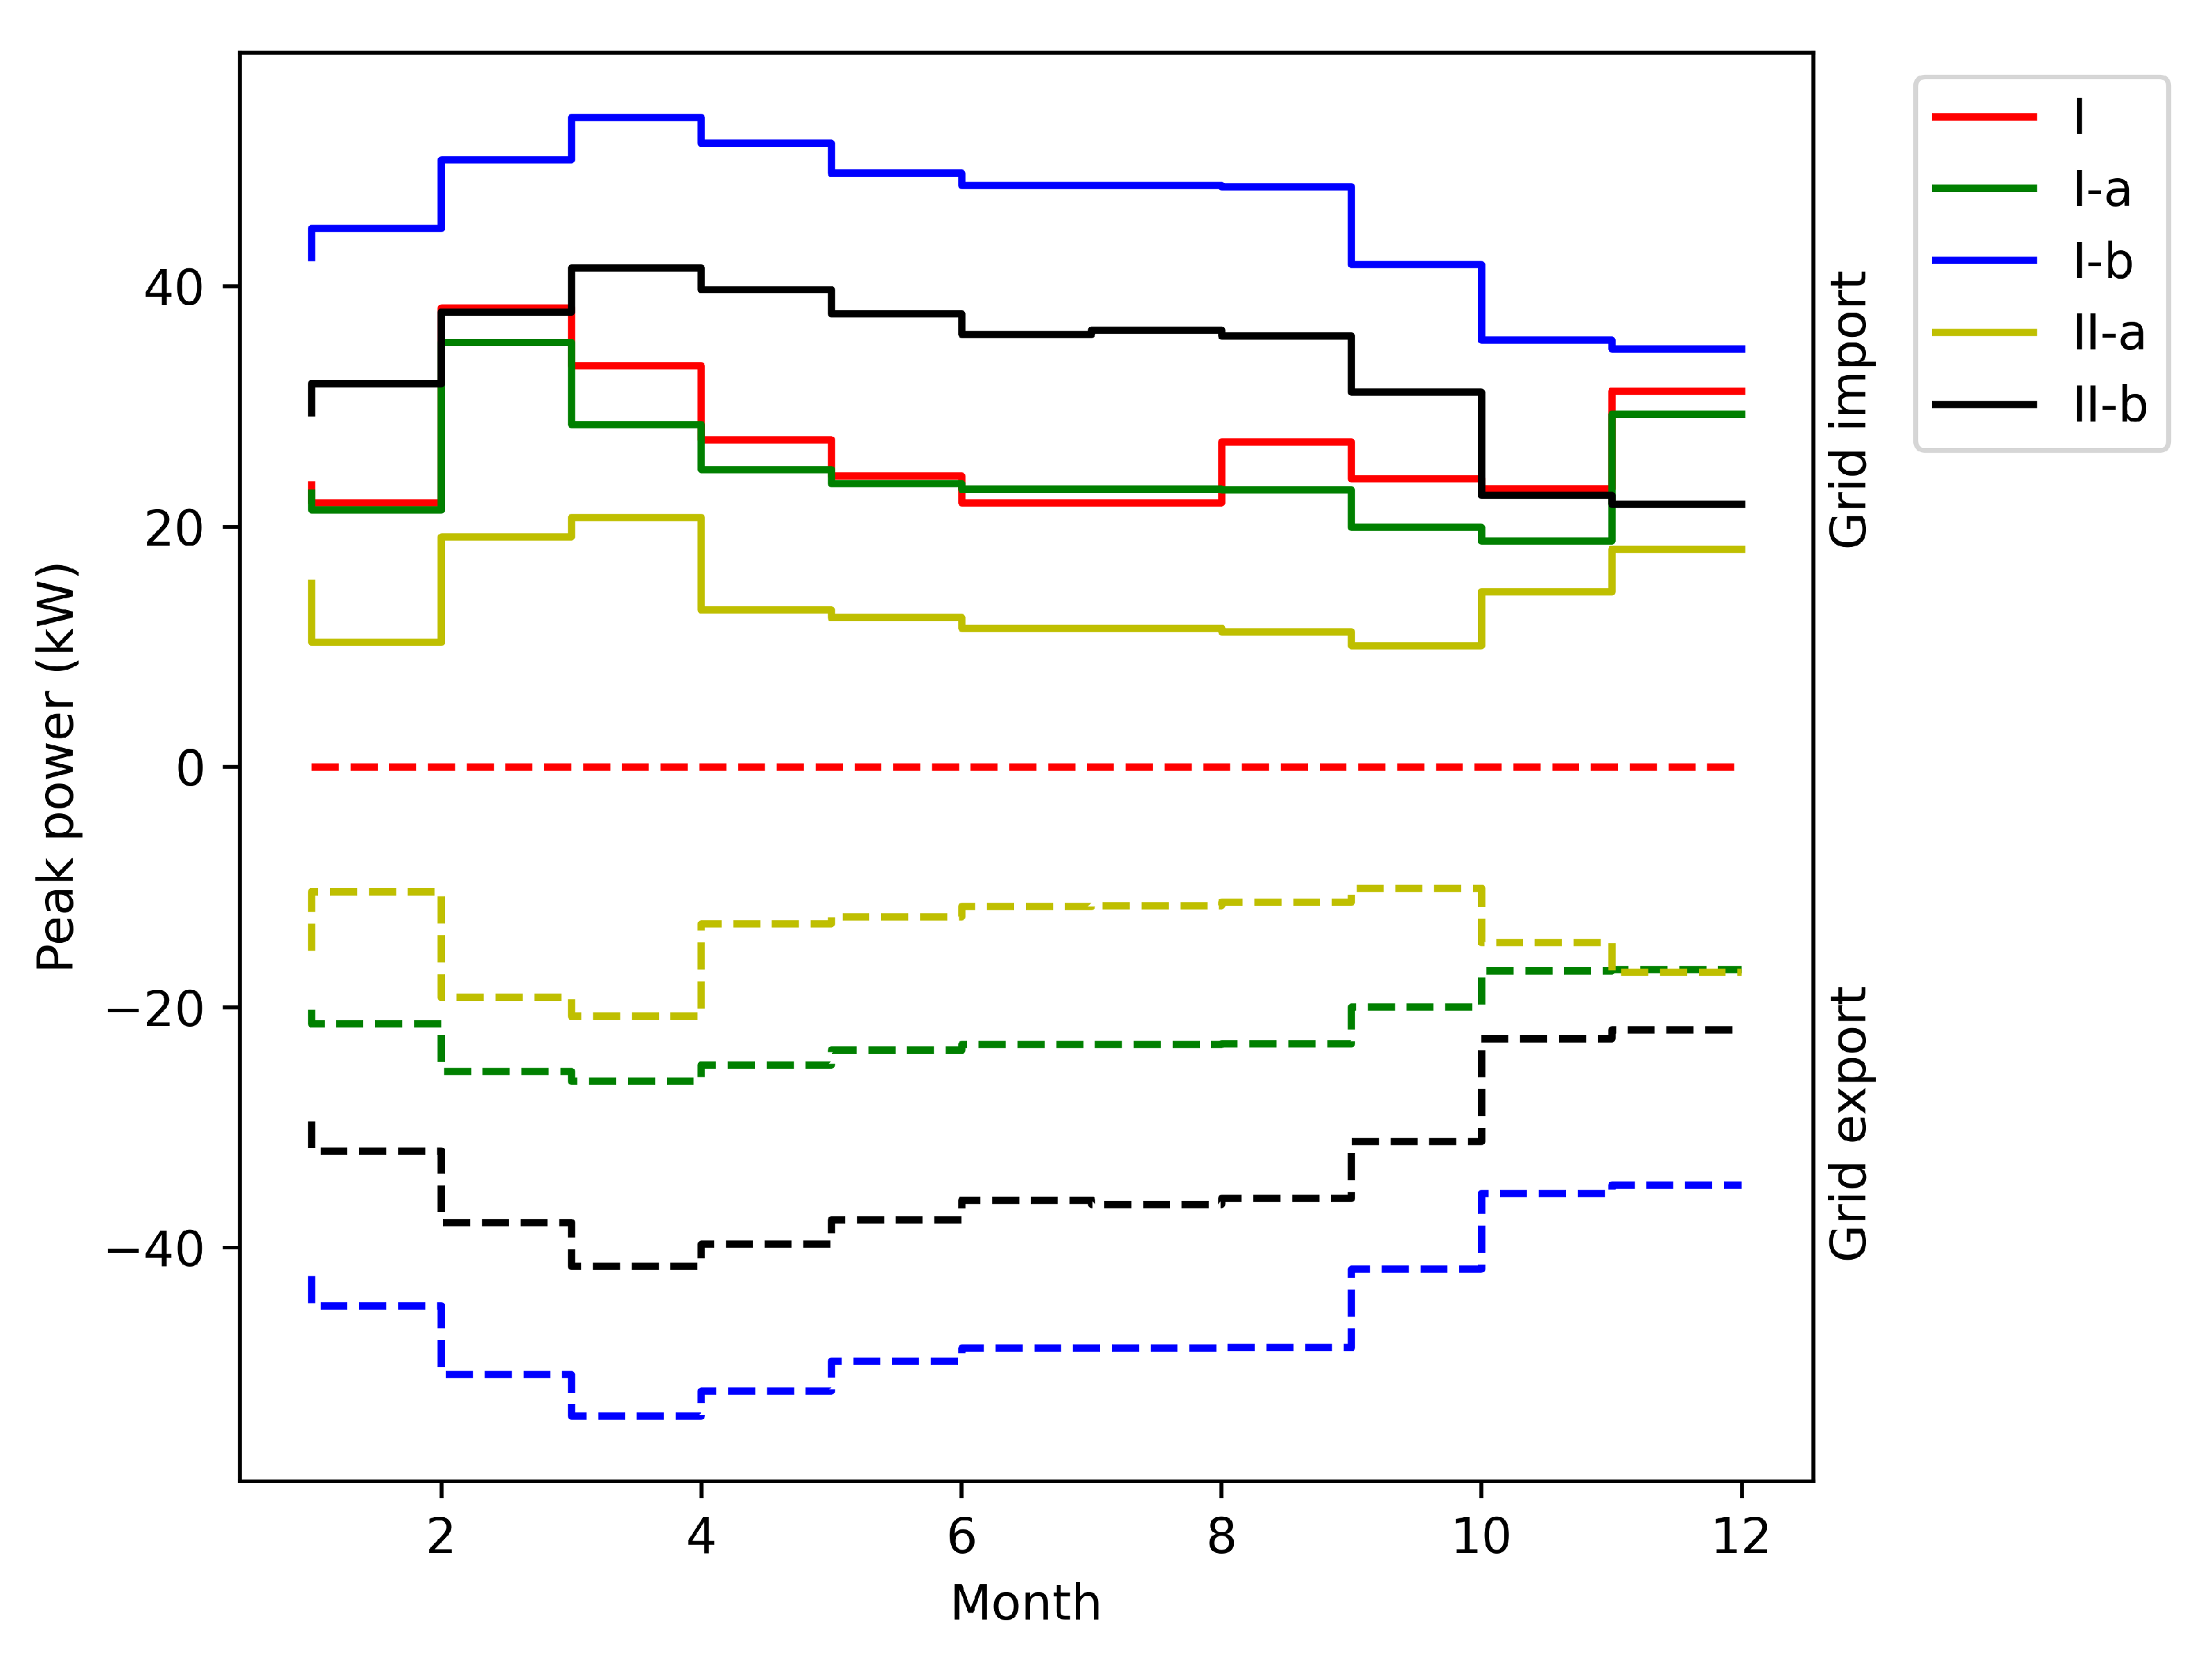
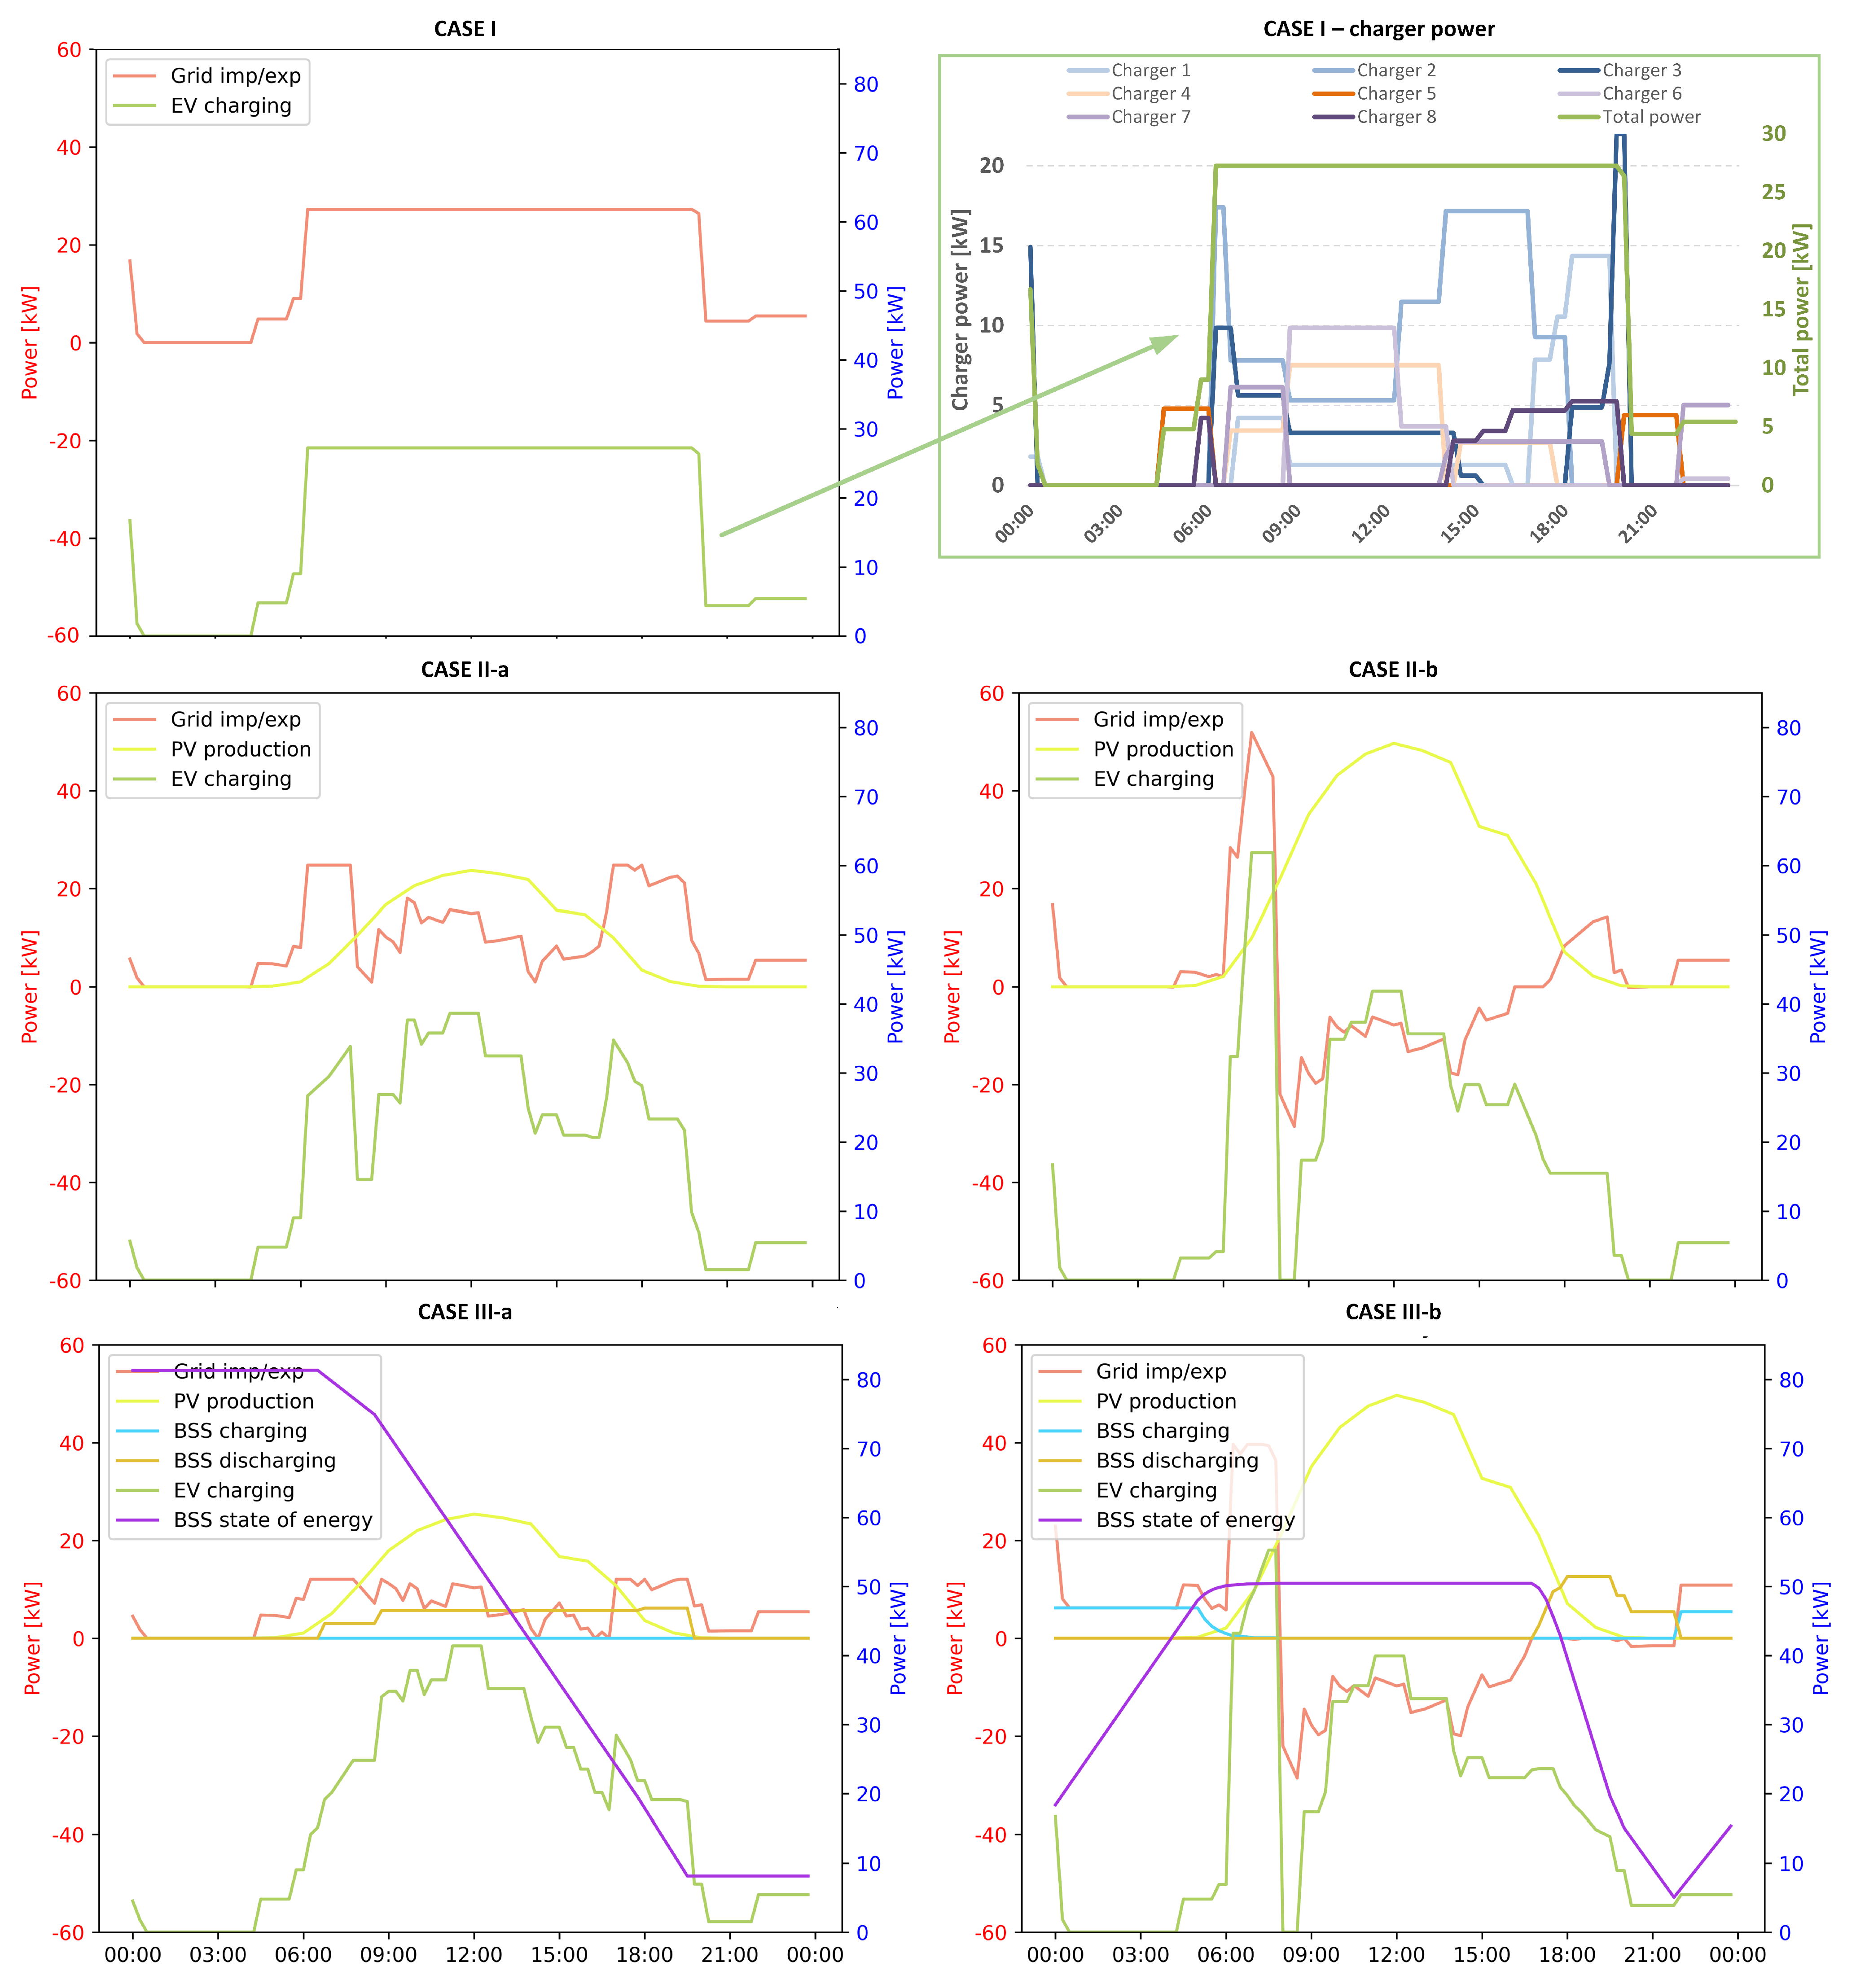
- Case I —The first case is centered around EV charging stations alone, exploring the impact of the EV smart charging strategy on the grid energy costs (energy costs, peak power costs, grid connection costs). In this simulation framework, the proposed model analyzes the benefits of increasing the grid connection power and associated costs in relation to the energy/peak power operation costs in the smart charging context.
- Case II—In the second case, the analysis was expanded to include the integration of photovoltaic (PV) plants alongside EV charging stations. This combination allowed for the utilization of solar energy to power the charging stations, reducing grid energy import costs. The lack of battery energy storage in this supply option limits the possibility of grid peak cost reduction together with grid connection cost reduction. In this test case, two subcases were considered in relation to the PV energy surplus reimbursement method:
- –
- Case II-a—In this case we assume that there is no financial reimbursement for energy surplus from the PV plant delivered to the distribution network in certain time instances.
- –
- Case II-b—In this case, the PV plant’s energy surplus is reimbursed with a unit price equal to 80% of the energy supply price paid for EV charging from energy suppliers.
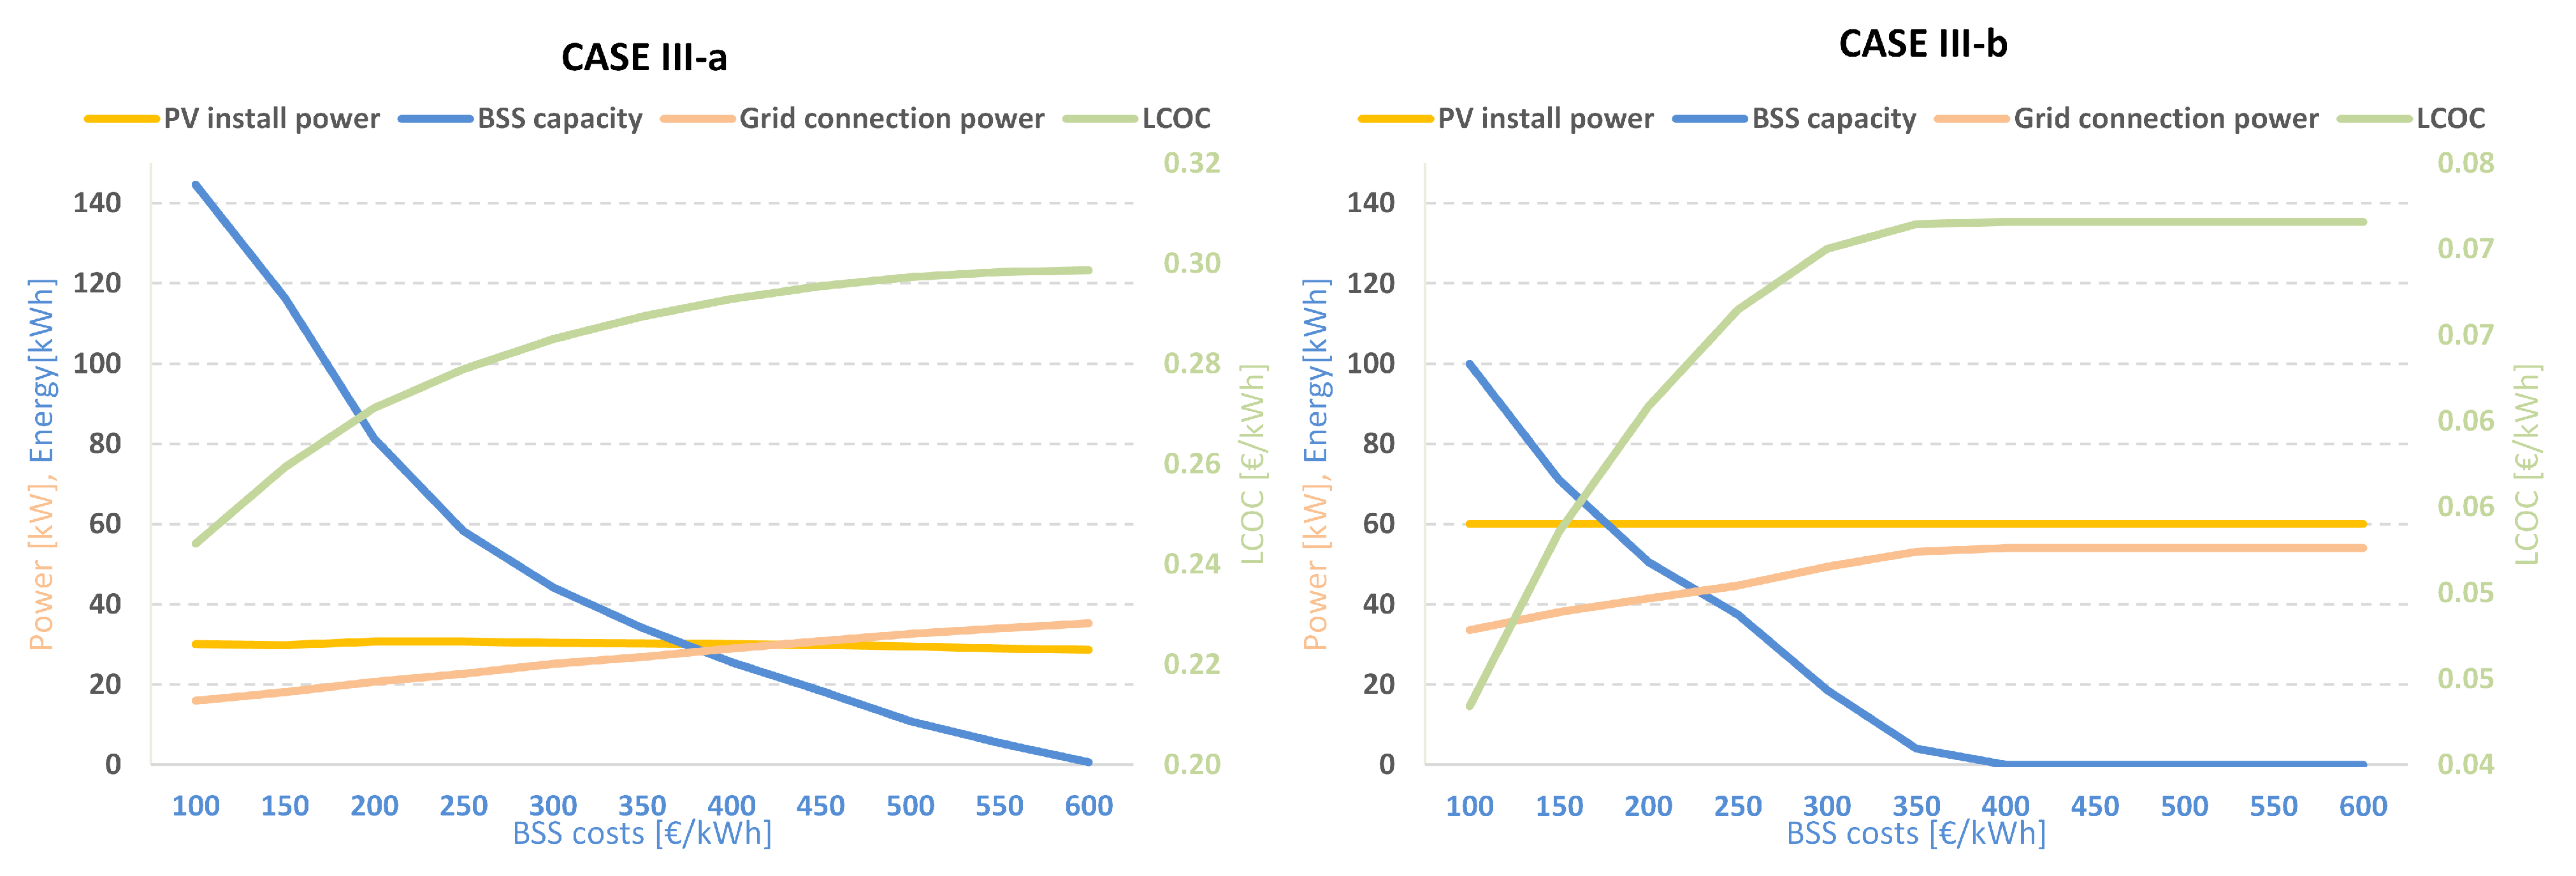
- Case III—The third and most comprehensive case examined the integration of EV charging stations, PV plants, and battery storage systems. This holistic approach, which combines solar power and battery energy storage systems, can help to mitigate peak power demand charges, reduce grid connection costs, and reduce EV energy supply costs. Integrating solar power and battery energy storage, charging stations can reduce their dependence on the grid and alleviate the need for expensive grid connection upgrades. This approach can save costs associated with grid infrastructure expansion and reduce strain on the existing electrical infrastructure. Similar to Cases II-a and II-b, two subcases were considered in relation to the PV energy surplus reimbursement method:
- –
- Case III-a—Excess energy from PV plant is not reimbursed;
- –
- CASE III-b—Excess energy from PV plant is reimbursed with unit price equal to 80% of energy supply price paid for EV charging from the energy supplier.
3.3. Results
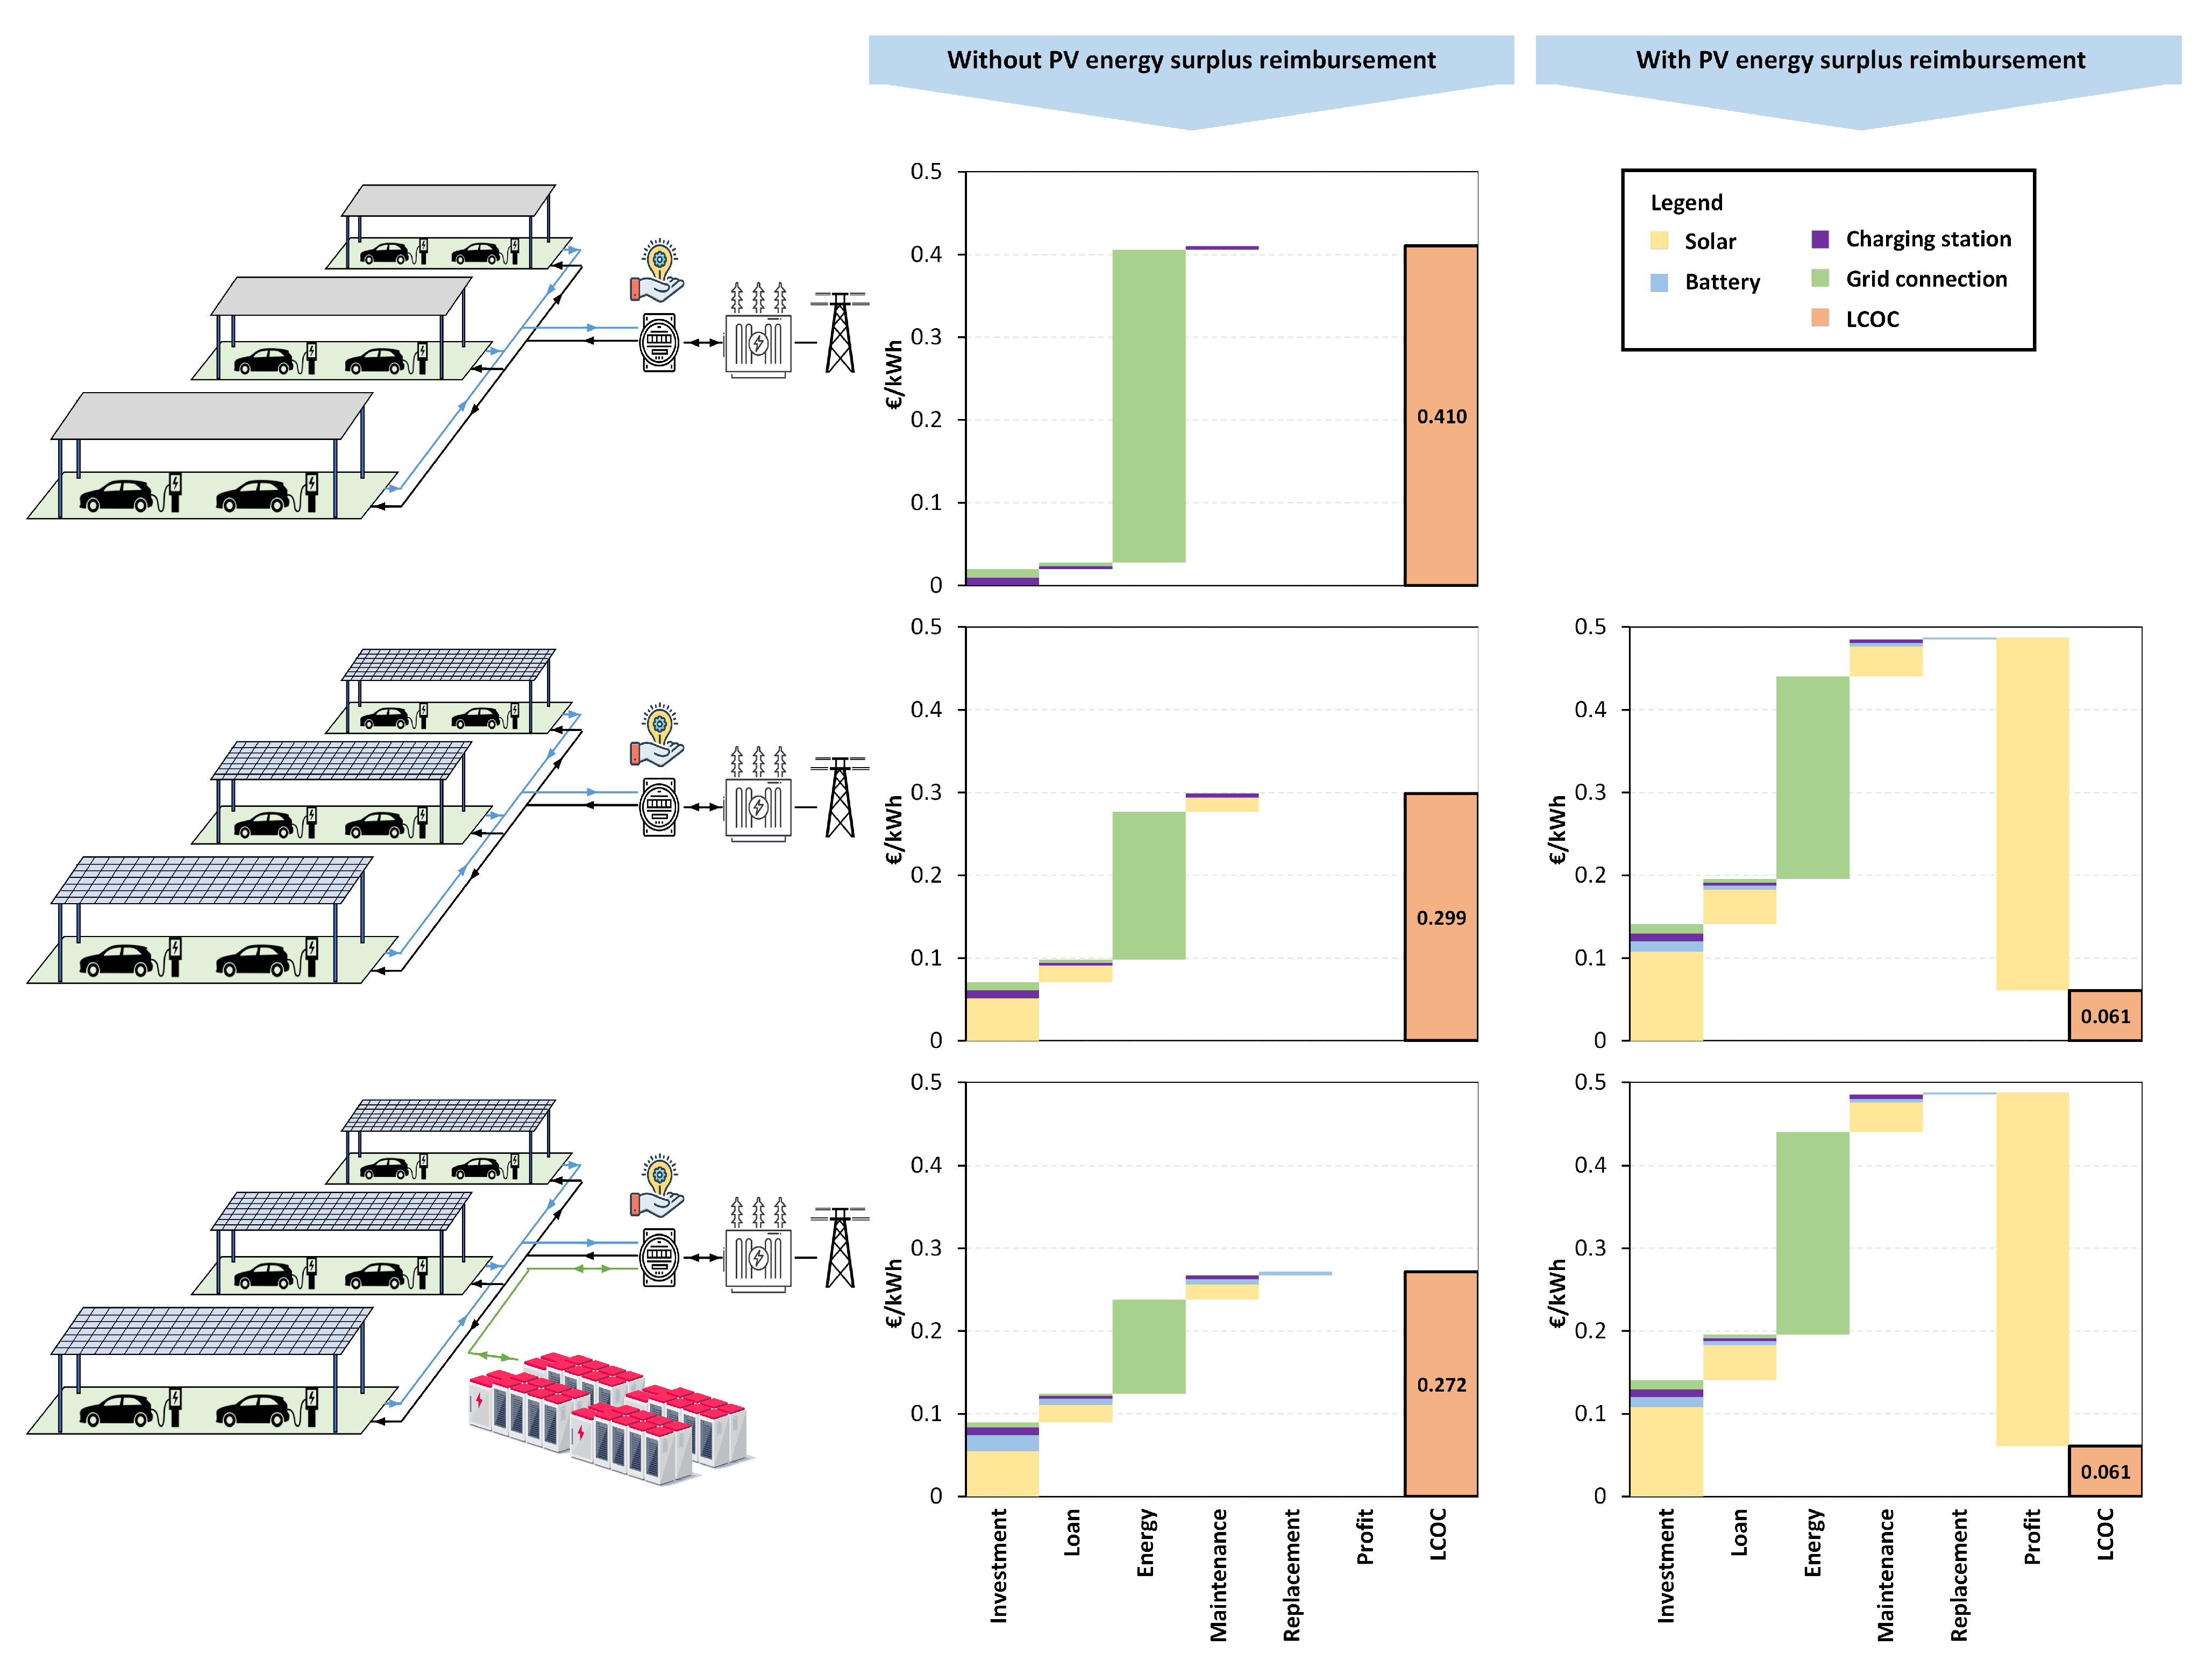
3.4. Parking Lot Levelized Cost of Charging
3.5. Discussion
4. Conclusions
Author Contributions
Funding
Data Availability Statement
Conflicts of Interest
Nomenclature
| Sets | |
| Set of all optimization problem variables | |
| L | Loan payback period year set |
| M | Month set |
| N | Project lifetime period set |
| PL | Set of parking lots |
| T | Time instances set |
| Time instance duration | |
| Charging efficiency | |
| Discharging efficiency | |
| BSS variable cost | |
| Battery replacement costs | |
| Grid connection variable costs | |
| Grid peak power costs | |
| Fix investment cost per parking lot | |
| PV plant variable costs | |
| Parameters | |
| Energy production costs in high/low tariff at time step t | |
| Grid usage costs in high/low tariff | |
| RES support tax price at time step t | |
| d | Discount rate |
| DoD | BSS depth of discharge limit |
| Maximum BSS energy capacity | |
| Total EV energy demand on annual basis | |
| Initial BSS state of charge | |
| Battery capacity of EV | |
| BSS CC-CV mode switch limit | |
| Energy state of the EV on arrival at time t | |
| f | Portion of total investment financed through a loan |
| k | Loan interest rate |
| Large-enough scalar | |
| Number of EV chargers/parking lots | |
| PV plant maximum install power | |
| BSS maximum charging/discharging power | |
| Relative PV plant production at time t | |
| r | Fix annual growth rate |
| Requested energy requirement for EV at departure time t | |
| z | BSS battery replacement year |
| BSS energy state at time step t | |
| Levelized cost of charging | |
| BSS maintenance costs | |
| Parking lot maintenance costs | |
| PV plant maintenance costs | |
| Grid connection purchase power | |
| EV installed charging power | |
| Optimal PV plant install power | |
| BSS maximum charging power at time step t | |
| EV maximum charging power | |
| Monthly grid peak power at month m | |
| Maximum charging power for EV at time step t | |
| Charging power for EV at time step t | |
| BSS charging power at time t | |
| BSS discharging power at time t | |
| Power imported from grid at time step t | |
| Power exported to grid at time step t | |
| Total exported and imported grid power at time step t | |
| PV plant power production at time t | |
| State of Energy of EV at time step t | |
| Annuity cost for loan | |
| Total annual electric energy costs (energy + grid usage + peak power costs) | |
| Present value of total electric energy costs (energy + grid usage + peak power costs) | |
| Variables | |
| BSS binary investment decision variable | |
| Binary variable indicating power import from grid at time t | |
| PV plant binary investment decision variable | |
| Optimal BSS capacity | |
| Energy state of EV at time step t | |
| Investment costs | |
| Present value of loan costs | |
| Annual PV plant maintenance cost | |
| Annual BSS maintenance cost | |
| Annual charging station maintenance cost | |
| Present value of total equipment maintenance costs | |
| Annual profit from excess PV energy export to the grid | |
| Present value of total profit from excess PV energy export to the grid | |
| BSS system replacement costs | |
| Present value of equipment replacement costs | |
| Total charging station net present cost | |
| Binary variable indicating BSS charging at time t |
References
- Wu, T.; Li, G.; Bie, Z. Charging Price Determination and Energy Management of EV Parking Lot Considering Price Elasticity. In Proceedings of the IEEE 8th International Conference on Advanced Power System Automation and Protection (APAP), Xi’an, China, 21–24 October 2019; pp. 1789–1793. [Google Scholar] [CrossRef]
- Vaya, M.G.; Andersson, G. Centralized and decentralized approaches to smart charging of plug-in Vehicles. In Proceedings of the IEEE Power and Energy Society General Meeting, San Diego, CA, USA, 22–26 July 2012; pp. 1–8. [Google Scholar] [CrossRef]
- Leemput, N.; Roy, J.V.; Geth, F.; Tant, P.; Claessens, B.; Driesen, J. Comparative analysis of coordination strategies for electric vehicles. In Proceedings of the 2nd IEEE PES International Conference and Exhibition on Innovative Smart Grid Technologies, Manchester, UK, 5–7 December 2011. [Google Scholar] [CrossRef]
- Abdelaal, G.; Gilany, M.I.; Elshahed, M.; Sharaf, H.M.; El, F. A Smart On-Line Centralized Coordinated Charging Strategy in Residential Distribution Networks. Int. J. Renew. Energy Res. 2021, 11, 8187. [Google Scholar] [CrossRef]
- Fernandez, G.S.; Krishnasamy, V.; Kuppusamy, S.; Ali, J.S.; Ali, Z.M.; El-Shahat, A.; Aleem, S.H.A. Optimal dynamic scheduling of electric vehicles in a parking lot using particle swarm optimization and shuffled frog leaping algorithm. Energies 2020, 13, 6384. [Google Scholar] [CrossRef]
- Hao, D.; Ren, X.; Mohammed, A.S. Optimal Design of Electric Vehicle Parking Lot based on Energy Management Considering Hydrogen Storage System and Demand Side Management. J. Energy Storage 2021, 42, 103045. [Google Scholar] [CrossRef]
- Jannati, J.; Nazarpour, D. Optimal energy management of the smart parking lot under demand response program in the presence of the electrolyser and fuel cell as hydrogen storage system. Energy Convers. Manag. 2017, 138, 659–669. [Google Scholar] [CrossRef]
- Mathur, A.K.; Teja, S.C.; Yemula, P.K. Optimal Charging Schedule for Electric Vehicles in Parking Lot with Solar Power Generation; Institute of Electrical and Electronics Engineers Inc.: Piscataway, NJ, USA, 2018; pp. 611–615. [Google Scholar] [CrossRef]
- Irshad, U.B.; Nizami, M.S.H.; Rafique, S.; Hossain, M.J.; Mukhopadhyay, S.C. A Battery Energy Storage Sizing Method for Parking Lot Equipped with EV Chargers. IEEE Syst. J. 2020, 15, 4459–4469. [Google Scholar] [CrossRef]
- Zhang, L.; Li, Y. Optimal Management for Parking-Lot Electric Vehicle Charging by Two-Stage Approximate Dynamic Programming. IEEE Trans. Smart Grid 2017, 8, 1722–1730. [Google Scholar] [CrossRef]
- Ahsan, S.M.; Khan, H.A.; ul Hassan, N. Optimized power dispatch for smart building(s) and electric vehicles with V2X operation. Energy Rep. 2022, 8, 10849–10867. [Google Scholar] [CrossRef]
- Ahsan, S.M.; Khan, H.A.; Sohaib, S.; Hashmi, A.M. Optimized Power Dispatch for Smart Building and Electric Vehicles with V2V, V2B and V2G Operations. Energies 2023, 16, 4884. [Google Scholar] [CrossRef]
- Sengor, I.; Erdinc, O.; Yener, B.; Tascikaraoglu, A.; Catalao, J.P. Optimal energy management of EV parking lots under peak load reduction based DR programs considering uncertainty. IEEE Trans. Sustain. Energy 2019, 10, 1034–1043. [Google Scholar] [CrossRef]
- Prajapati, S.; Fernandez, E. Solar PV parking lots to maximize charge operator profit for EV charging with minimum grid power purchase. In Energy Sources, Part A: Recovery, Utilization, and Environmental Effects; Taylor & Francis: Boca Raton, FL, USA, 2020; pp. 1–11. [Google Scholar] [CrossRef]
- Domínguez-Navarro, J.; Dufo-López, R.; Yusta-Loyo, J.; Artal-Sevil, J.; Bernal-Agustín, J. Design of an electric vehicle fast-charging station with integration of renewable energy and storage systems. Int. J. Electr. Power Energy Syst. 2019, 105, 46–58. [Google Scholar] [CrossRef]
- Han, X.; Liang, Y.; Ai, Y.; Li, J. Economic evaluation of a PV combined energy storage charging station based on cost estimation of second-use batteries. Energy 2018, 165, 326–339. [Google Scholar] [CrossRef]
- Bilal, M.; Alsaidan, I.; Alaraj, M.; Almasoudi, F.M.; Rizwan, M. Techno-Economic and Environmental Analysis of Grid-Connected Electric Vehicle Charging Station Using AI-Based Algorithm. Mathematics 2022, 10, 924. [Google Scholar] [CrossRef]
- Antarasee, P.; Premrudeepreechacharn, S.; Siritaratiwat, A.; Khunkitti, S. Optimal Design of Electric Vehicle Fast-Charging Stations Structure Using Metaheuristic Algorithms. Sustainability 2023, 15, 771. [Google Scholar] [CrossRef]
- Lanz, L.; Noll, B.; Schmidt, T.S.; Bjarne, S. Comparing the levelized cost of electric vehicle charging options in Europe. Nat. Commun. 2022, 13, 1–13. [Google Scholar] [CrossRef]
- Chen, L.; Chung, C.Y.; Nie, Y.; Yu, R. Modeling and optimization of electric vehicle charging load in a parking lot. In Proceedings of the 2013 IEEE PES Asia-Pacific Power and Energy Engineering Conference (APPEEC), Hong Kong, China, 8–11 December 2013; pp. 1–5. [Google Scholar] [CrossRef]
- Borlaug, B.; Yang, F.; Pritchard, E.; Wood, E.; Gonder, J. Public electric vehicle charging station utilization in the United States. Transp. Res. Part Transp. Environ. 2023, 114, 103564. [Google Scholar] [CrossRef]
- Shi, R.; Zhang, J.; Su, H.; Liang, Z.; Lee, K.Y. An economic penalty scheme for optimal parking lot utilization with EV charging requirements. Energies 2020, 13, 6155. [Google Scholar] [CrossRef]
- Kane, S.; Manz, F.; Richter, F.N.F. EV Fast Charging: How to Build and Sustain Competitive Differentiation; Technical report; McKinsey: Mumbai, India, 2021. [Google Scholar]
- Wesley, C.; Frazier, A.W. Cost Projections for Utility-Scale Battery Storage: 2020 Update; Technical Report; National Renewable Energy Laboratory: Golden, CO, USA, 2020. [Google Scholar]
- Gonzalez-Castellanos, A.J.; Pozo, D.; Bischi, A. Non-Ideal Linear Operation Model for Li-Ion Batteries. IEEE Trans. Power Syst. 2020, 35, 672–682. [Google Scholar] [CrossRef]
- Gurobi Optimization LLC. Gurobi Optimizer Reference Manual; Gurobi: Monheim am Rhein, Germany, 2023. [Google Scholar]
- Bynum, M.L.; Hackebeil, G.A.; Hart, W.E.; Laird, C.D.; Nicholson, B.L.; Siirola, J.D.; Watson, J.P.; Woodruff, D.L. Pyomo–Optimization Modeling in Python, 3rd ed.; Springer Science & Business Media: New York, NY, USA, 2021; Volume 67. [Google Scholar]
- Hart, W.E.; Watson, J.P.; Woodruff, D.L. Pyomo: Modeling and solving mathematical programs in Python. Math. Program. Comput. 2011, 3, 219–260. [Google Scholar] [CrossRef]


| Rotary Parking Lot Parameters | ||
|---|---|---|
| Technical parameters | Unit | Value |
| No. of EV chargers/lots | nb. | 8 |
| EV charger efficiency | p.u. | 0.95 |
| EV charger rated power | kW | 22 |
| Financial parameters | Unit | Value |
| Rotary parking investment costs | EUR/lot | 1000 |
| Rotary parking maintenance costs | % investment | 3.0% |
| PV Plant Parameters | ||
| Technical parameters | Unit | Value |
| PV plant max. inst. power | kW | 60 |
| Financial parameters | Unit | Value |
| PV plant investment costs | EUR/kW | 1500 |
| PV plant maintenance costs | % investment | 2.0% |
| BSS Parameters | ||
| Technical parameters | Unit | Value |
| Maximum capacity | kWh | 500 |
| Power-to-energy ratio | - | 0.25 |
| Charging efficiency | p.u. | 0.95 |
| Discharging efficiency | p.u. | 0.95 |
| DoD | p.u. | 0.1 |
| CC-CV mode switch limit | p.u. | 0.90 |
| Financial parameters | Unit | Value |
| BSS investment costs | EUR/kWh | 200 |
| BSS maintenance costs | % investment | 2.0% |
| BSS battery replacement | year | 10 |
| Battery replacement costs | EUR/kWh | 60 |
| Time-of-Use Tariff Cost, Croatia | ||
|---|---|---|
| Energy production cost (EPC) | Unit | Value |
| EPC—high tariff (07–21 h) | EUR/kWh | 0.285 |
| EPC—low tariff (21–07 h) | EUR/kWh | 0.168 |
| Grid usage cost (GUC) | Unit | Value |
| GUC—high tariff (07–21 h) | EUR/kWh | 0.029 |
| GUC—low tariff (21–07 h) | EUR/kWh | 0.013 |
| Peak power cost (PPC) | EUR/kW | 5.17 |
| RES tax | EUR/kWh | 0.014 |
| Annual increase in EPC, GUC, PPC | % | 2% |
| Grid connection cost | EUR/kW contract | 225 |
| General Financial Parameters | ||
|---|---|---|
| Project lifetime | years | 25 |
| Discount rate | % | 7% |
| Loan/self-financing ratio | % invest. | 30%/70% |
| Loan interest rate | % | 5% |
| Loan payback time | years | 10 |
| Grid Connection Power (kW) | PV Plant Power (kW) | BSS Capacity (kWh) | NPV Total Costs (EUR) | Average Annual EV’s Energy Demand (kWh) | LCOC (EUR/kWh) | |
|---|---|---|---|---|---|---|
| CASE I | 38.2 | - | - | 240.049 | 50.196 | 0.410 |
| CASE II-a | 35.4 | 28.6 | - | 174.712 | 0.299 | |
| CASE II-b | 54.0 | 60.0 | - | 41.865 | 0.072 | |
| CASE III-a | 20.7 | 30.7 | 80.0 | 158.824 | 0.272 | |
| CASE III-b | 41.5 | 60.0 | 51.7 | 35.639 | 0.061 |
Disclaimer/Publisher’s Note: The statements, opinions and data contained in all publications are solely those of the individual author(s) and contributor(s) and not of MDPI and/or the editor(s). MDPI and/or the editor(s) disclaim responsibility for any injury to people or property resulting from any ideas, methods, instructions or products referred to in the content. |
© 2023 by the authors. Licensee MDPI, Basel, Switzerland. This article is an open access article distributed under the terms and conditions of the Creative Commons Attribution (CC BY) license (https://creativecommons.org/licenses/by/4.0/).
Share and Cite
Jakus, D.; Vasilj, J.; Jolevski, D. Optimal Electric Vehicle Parking Lot Energy Supply Based on Mixed-Integer Linear Programming. Energies 2023, 16, 7793. https://doi.org/10.3390/en16237793
Jakus D, Vasilj J, Jolevski D. Optimal Electric Vehicle Parking Lot Energy Supply Based on Mixed-Integer Linear Programming. Energies. 2023; 16(23):7793. https://doi.org/10.3390/en16237793
Chicago/Turabian StyleJakus, Damir, Josip Vasilj, and Danijel Jolevski. 2023. "Optimal Electric Vehicle Parking Lot Energy Supply Based on Mixed-Integer Linear Programming" Energies 16, no. 23: 7793. https://doi.org/10.3390/en16237793
APA StyleJakus, D., Vasilj, J., & Jolevski, D. (2023). Optimal Electric Vehicle Parking Lot Energy Supply Based on Mixed-Integer Linear Programming. Energies, 16(23), 7793. https://doi.org/10.3390/en16237793