Article

Sequence Impedance Modeling and Analysis of Modular Multilevel Converter Considering DC Port Characteristics

School of Electrical Engineering, Shenyang University of Technology, Shenyang 110870, China
*
Author to whom correspondence should be addressed.
Energies 2023, 16(23), 7770; https://doi.org/10.3390/en16237770
Submission received: 30 October 2023 / Revised: 23 November 2023 / Accepted: 24 November 2023 / Published: 25 November 2023
(This article belongs to the Section F: Electrical Engineering)

Abstract

:
The extensive deployment of Modular Multilevel Converters (MMCs) in AC/DC systems can lead to complex resonance issues. Impedance modeling forms the foundation for analyzing the stability of interconnected system. Existing investigations primarily address resonance concerns on the AC side of MMC. In the process of impedance modeling, the DC system is generally approximated as an ideal voltage source, thereby neglecting its dynamic impact on the impedance characteristic of MMC. Such simplification may result in inaccuracies within stability analysis findings. Based on the multi-harmonic linearization method, this paper introduces an impedance modeling approach that takes into account the characteristics of the DC port. Taking DC voltage control as a case study, the impedance model for the AC side of the MMC is established. The results of programming calculation and simulation measurement of sequence impedance are mutually verified. Finally, the MMC impedance responses determined by different DC port characteristics are analyzed. Significant alterations in MMC impedance characteristics are introduced by DC side resistance and capacitance, which may result in negative damping effects and a decrease in system stability margins. The DC side inductance has a relatively minor impact on MMC impedance responses. The analysis results show that the sequence impedance model of MMC considering DC port characteristics can improve the accuracy of stability analysis results.

1. Introduction

The modular multilevel converter, with its high-power quality, decoupled control of active and reactive power, capability of supplying power to passive systems, and modular manufacturing [1,2,3], is widely adopted in many fields, including renewable energy integration, high-voltage direct current transmission (HVDC), and medium- to low-voltage DC distribution [4,5]. Such a trend results in a significant number of MMC system resonance instabilities extending over a wide range of frequencies [6,7,8]. Simultaneously, precise modeling of MMC is a prerequisite for accurate analysis of system stability. The sequence impedance model of MMC directly characterizes the dynamic relationship between terminal voltage and current [9]. Model validation and system stability criteria are more intuitively comprehensible [10,11,12].
With the continuous development of modern power systems, the operational modes of AC/DC grids consisting of multiple converters are complex and variable. The resonant problems are evolving towards largescale, complex, and wideband characteristics [13]. In the conventional resonance investigations at the AC terminal of MMC, the analysis is limited to the impedance characteristics of the converter, while considering the DC system as an ideal voltage source to simplify the analysis [14,15]. In practice, MMC interconnects AC/DC systems, and the small-signal components on the AC terminal are effectively transmitted to the DC system through the converter [16,17]. Then, the small-signal perturbations on the DC side are influenced by the dynamic of the DC system and transferred to the AC terminal. Neglecting the influence of the DC system may introduce inaccuracies in stability analysis results.
Due to the presence of a significant number of submodules (SM), there are complicated internal multi-harmonic coupling characteristics within the MMC arms. Reference [16] modified the matrix representation for multi-harmonic linearization during the sequence impedance modeling process. Nevertheless, different outer loop control methods were not taken into account. Additional studies have focused on impedance modeling related to voltage feedforward [18,19], various control approaches [20], positive and negative sequence separation phase current control [21,22], frequency coupling characteristics [23], and control delay [24]. Nonetheless, the sequence impedance modeling described above treats the MMC’s DC port as an ideal DC source with a constant DC bus voltage, while disregarding the dynamic of the DC system on the AC terminal impedance characteristics of MMC. Incorporating the influence of the wind farm, the DC side impedance of MMC was developed [25]. The results suggest that incorporating AC dynamics into DC impedance modeling enhances the accuracy of DC system resonance analysis. Including the DC impedance of the onshore MMC, Ref. [5] established the AC side impedance model of offshore MMC and analyzed the sub-/super-synchronous oscillation occurring in the connection with the offshore wind farm. However, in the modeling process, the offshore MMC employs VF control and does not incorporate PLL. Given the possible influence of the DC system on MMC’s AC side impedance characteristics, which may lead to impedance mismatch with the AC grid and subsequent system resonance, there is currently an absence of a modeling approach for MMC’s AC side sequence impedance that considers DC system dynamics.
In this paper, a method for MMC sequence impedance modeling that incorporates the dynamics of the DC system is proposed. Firstly, a constant DC voltage control MMC is used as an illustration, and the power stage model of MMC considering DC bus voltage perturbation is established based on multi-harmonic linearization. The DC current is represented by the MMC arm current at the corresponding frequency. Therefore, the impact of DC bus voltage can be introduced via the multiplication of DC current and the DC system impedance. Secondly, the complete control model of MMC is developed with the consideration of DC bus voltage dynamics, which includes DC voltage control, current control, phase-locked loop (PLL), circulating current suppression control (CCSC), and capacitor voltage balance control. Thirdly, the frequency response scan is realized by the simulation model of MMC in the time domain. The correctness of the suggested impedance modeling method is verified by comparing the analytic calculation and the impedance measurements. Accordingly, the influence of the DC system on the sequence impedance characteristics of MMC is analyzed. The paper is organized as follows: In Section 2, the small signal model of MMC considering DC bus perturbation is developed. Section 3 presents a comprehensive control modeling with DC voltage dynamics. Verification and analysis of the impedance with DC port characteristics are illustrated in Section 4. Section 5 concludes the impact of DC system dynamics on the impedance response of MMC.

2. Small Signal Model of MMC Considering DC Bus Perturbation

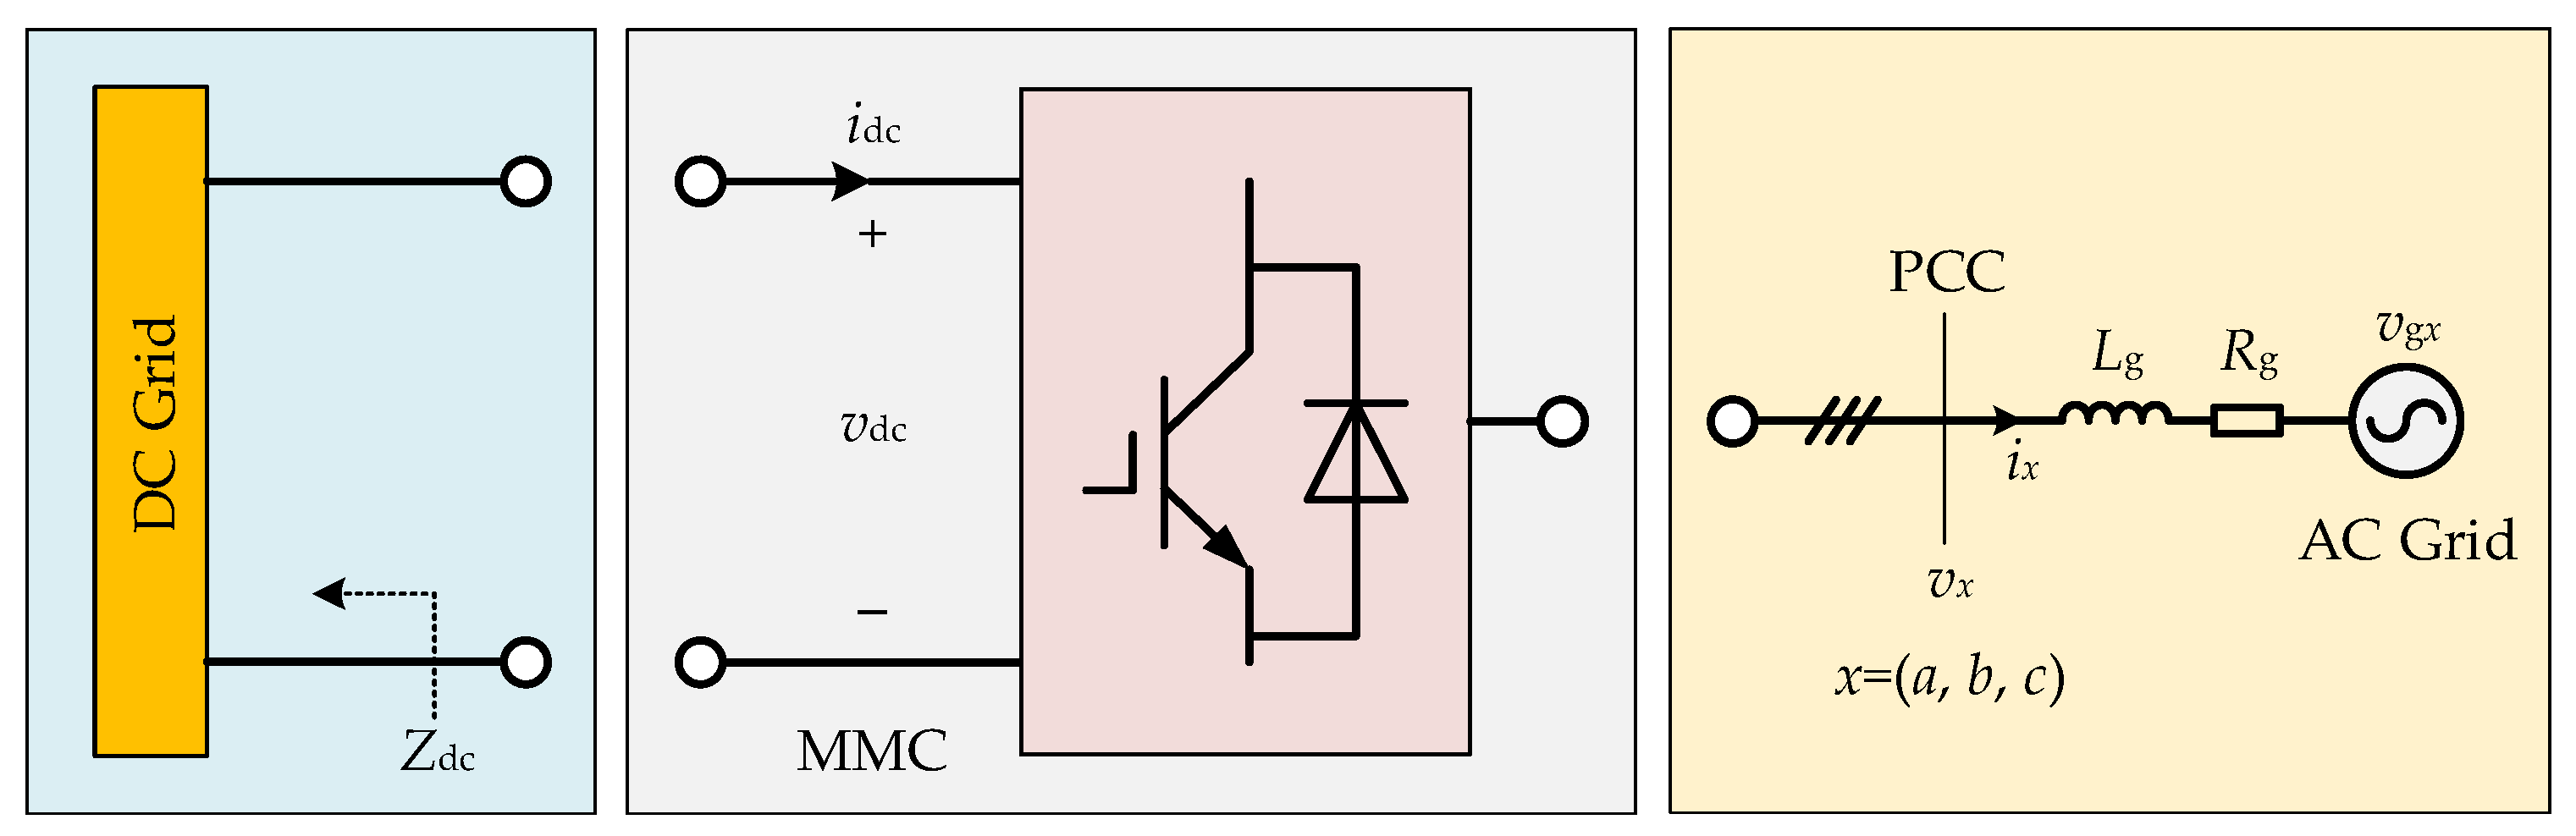
Figure 1 illustrates the main circuit structure of the three-phase MMC system studied in this paper. A conventional Thevenin equivalent circuit is employed to describe the circuit configuration of the AC network. Namely, simulating an active power grid utilizing a three-phase ideal voltage source characterized by an amplitude of Vg and a fundamental frequency of f1. To model the strength of the AC grid, three-phase symmetrical impedances are employed. At the point of common coupling (PCC), the AC voltage is represented as vabc. The current flowing from the AC terminal of MMC to the AC grid is denoted as iabc, and this is also defined as its reference direction. To characterize the DC port of the MMC, a ‘black-box’ network is connected in parallel with the DC bus. The input impedance of the DC port is expressed as Zdc. In practice, the DC network can take the form of constant current source, constant power source, or large-scale MMC-HVDC transmission system. This paper does not impose extensive constraints on the topology of the DC network. Using a ‘black-box’ model for the DC network is more effective in demonstrating the advantages of the modeling method presented in the subsequent sections. At the DC port of the MMC, the DC voltage and current are represented as vdc and idc, respectively. Similarly, the reference direction follows the motor convention that is defined as the current flowing from the DC network into the MMC.
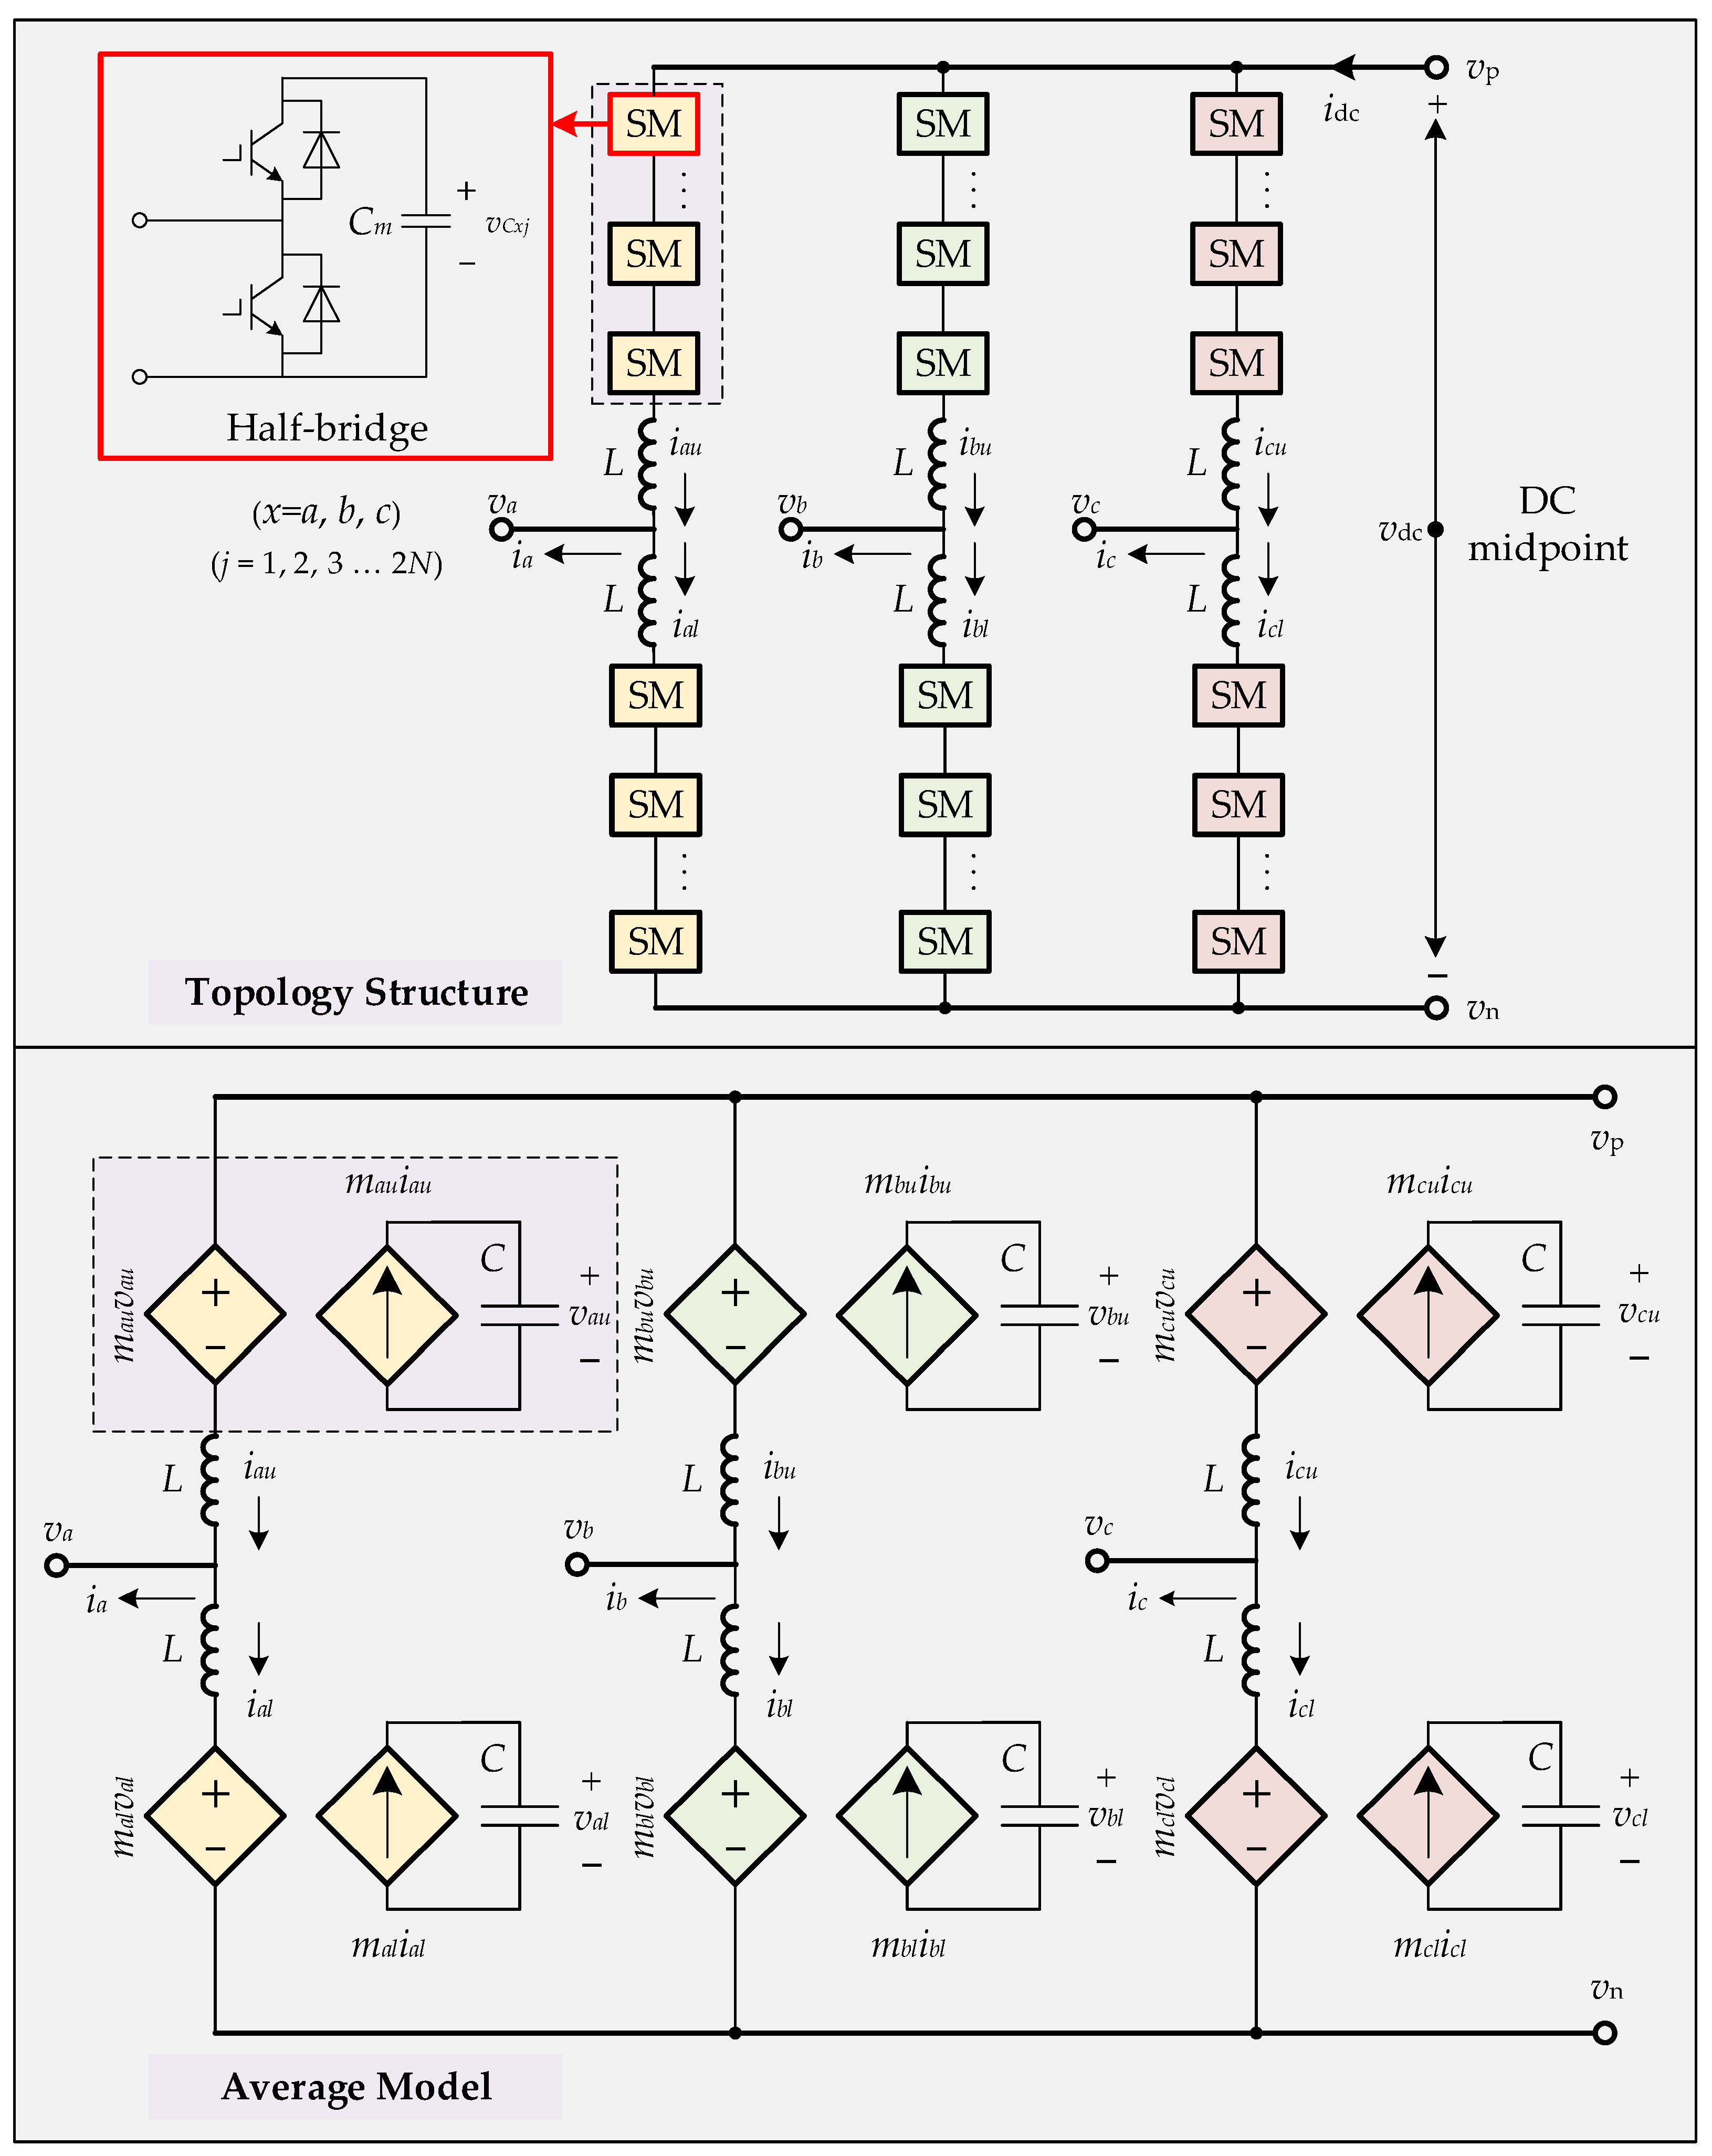
In the MMC topological structure and average model shown in Figure 2, each variable subscript indicates the three-phase abc and upper-lower arm (u for upper arm, l for lower arm). The MMC arms consist of N submodules, L represents the arm inductance, rL indicates the series resistance, and Cm denotes the submodule capacitance. The submodule capacitor voltages vCxj are kept in balance. It is worth emphasizing that this does not indicate the absence of voltage harmonics or unchanging capacitor voltage. For the upper arm of phase a, the average model of MMC can be represented as follows.
L d i a u d t + r L i a u = 0.5 v dc v a m a u v a u + v m
C d v a u d t = m a u i a u
v m = 1 6 x = a , b , c ( m x u v x u m x l v x l )
The modulation index mau is defined as the ratio of the number of inserted submodules to the total number of submodules in the upper arm of phase a, vau is the sum of the submodule capacitor voltages in the arm, and iau is the arm current. C = Cm/N indicates the equivalent capacitance of N submodule capacitors in series. vm represents the voltage from the DC midpoint to the AC neutral, such that vp = vdc/2 + vm, and vn = −vdc/2 + vm. The derivation of Equations (1)–(3) can be repeated in three phases to obtain the complete power stage model of MMC.
Based on multi-harmonic linearization, the sequence impedance modeling applies sinusoidal voltage perturbation v ^ p at the AC terminal of MMC and derives the AC current response i ^ p at the perturbation frequency fp. According to the reference direction described above, the impedance of MMC can be obtained as z ^ p = v ^ p / i ^ p . The instantaneous AC voltage and current of phase a are presented in Equation (4).
{ v a ( t ) = V 1 cos ( 2 π f 1 t ) + V ^ p cos ( 2 π f p t + φ v p ) i a ( t ) = I 1 cos ( 2 π f 1 t + φ i 1 ) + I ^ p cos ( 2 π f p t + φ i p )
The phase and sequence relationships of small-signal harmonics in each variable caused by the AC voltage perturbation are illustrated in Table 1. As defined by the symmetrical component analysis, PS, NS, and ZS correspond to the positive, negative, and zero sequence components of the three-phase system. For common and differential mode (CM and DM) representations, the electrical quantities in the upper and lower arms exhibit a phase difference of 180° and −180°, respectively. In view of model accuracy and computational complexity, the consideration of harmonics up to the third order is satisfactory for impedance-based stability analysis purpose. Under the assumption of three-phase balance, phase b/c voltages and currents can be determined from phase a based on the sequence of perturbation voltage and symmetry relationships, which will not be elaborated as follows.
As indicated in Table 1, when subjected to PS/NS perturbation voltages at the frequency fp on the AC side, all variables may produce small-signal harmonics at frequencies fp ± kf1, where k = 1, …, n. Within the range of the third harmonic consideration in the linearization of the power stage model, only the ZS/CM components at frequencies fpf1 and fp + f1 contribute to the DC side of MMC. Consequently, small-signal harmonics from the AC side are transmitted through the MMC to the DC side in practical operation. In the existing research, the establishment of an AC impedance model for the converter often neglects the impact of dynamic DC voltage and ignores the consideration of impedance characteristics on the DC system, which may lead to inaccuracies in stability analysis results.
In order to capture the interactions between AC/DC systems and the harmonic transfer characteristics through MMC, this section introduces the AC side sequence impedance model of MMC that accounts for the dynamics of DC voltage. Taking the upper arm of phase a as an example, the frequency-domain small-signal response vectors for i ^ u , v ^ u , m ^ u , and v ^ p are defined as shown in Equation (5), with the subscript ‘a’ omitted.
i ^ u = [ I ^ p n e j α ^ p n I ^ p 1 e j α ^ p 1 I ^ p e j α ^ p I ^ p + 1 e j α ^ p + 1 I ^ p + n e j α ^ p + n ] , v ^ u = [ V ^ p n e j β ^ p n V ^ p 1 e j β ^ p 1 V ^ p e j β ^ p V ^ p + 1 e j β ^ p + 1 V ^ p + n e j β ^ p + n ] , m ^ u = [ M ^ p n e j γ ^ p n M ^ p 1 e j γ ^ p 1 M ^ p e j γ ^ p M ^ p + 1 e j γ ^ p + 1 M ^ p + n e j γ ^ p + n ] , v ^ p = 1 2 [ 0 0 V ^ p e j φ p 0 0 ]
The nonlinearity in Equations (1) and (2) arises from the time-domain multiplication of m ^ u and v ^ u . By linearizing this nonlinearity as the sum of convolutions between one variable perturbation and the periodic steady-state response of another variable, we obtain the frequency-domain representation of the linearized power stage model.
Z l i ^ u = 0.5 v ^ dc v ^ p v u m ^ u m u v ^ u + v ^ m
Y c v ^ u = i u m ^ u + m u i ^ u
In the context of small-signal harmonic frequencies, Zl and Yc are the symmetric matrices expressing the impedance of arm inductance L and the admittance of equivalent capacitance C.
Z l = j 2 π L diag [ f p n f 1 , f p ( n 1 ) f 1 , , f p f 1 , f p ,   f p + f 1 , , f p + ( n 1 ) f 1 ,   f p + n f 1 ] + diag [ r L , r L , r L ]
Y c = j 2 π C diag [ f p n f 1 , f p ( n 1 ) f 1 , , f p f 1 , f p ,   f p + f 1 , , f p + ( n 1 ) f 1 ,   f p + n f 1 ]
Utilizing the phase and sequence relationships mentioned earlier, the small-signal dynamics of the MMC can be expressed using a single-arm model. To develop an independent small-signal model, it is imperative to remove the other arm variables involved in Equation (6) concerning v ^ m , such that the steady state vm can be expressed as Equation (10) in the frequency domain.
v m = 1 6 x = a , b , c ( m x u v x u m x l v x l )
As can be inferred from the above equation, the actual function of v ^ m is to remove the ZS/CM small-signal harmonic components from the arm voltage m ^ u v ^ u , thereby ensuring that the small-signal arm current i ^ u no longer contains ZS/CM harmonic components. Defining the steady-state harmonic vectors vu, mu, and iu as Toeplitz matrices V, M, and I, Equations (6) and (7) can be reformulated as follows.
i ^ = Y l ( 0.5 v ^ dc v ^ p V m ^ M v ^ )
Y c v ^ = I m ^ + M i ^
where Yl represents the inverse matrix of Zl, with its elements resulting in zeros when multiplied by the ZS/CM components. Including DC voltage perturbation, Equations (11) and (12) provide the small-signal model of MMC in the frequency domain, with the exclusion of the upper arm variable subscript ‘u’. In order to obtain the impedance of MMC, which is equivalent to the transfer function relationship between v ^ p and i ^ , it is essential to remove the intermediate variables v ^ d c , m ^ , and v ^ . The research approach in this paper is as follows: in Section 3, we will focus on modeling the MMC control system to derive the relationship between m ^ and i ^ , v ^ d c , v ^ p , v ^ ; in 
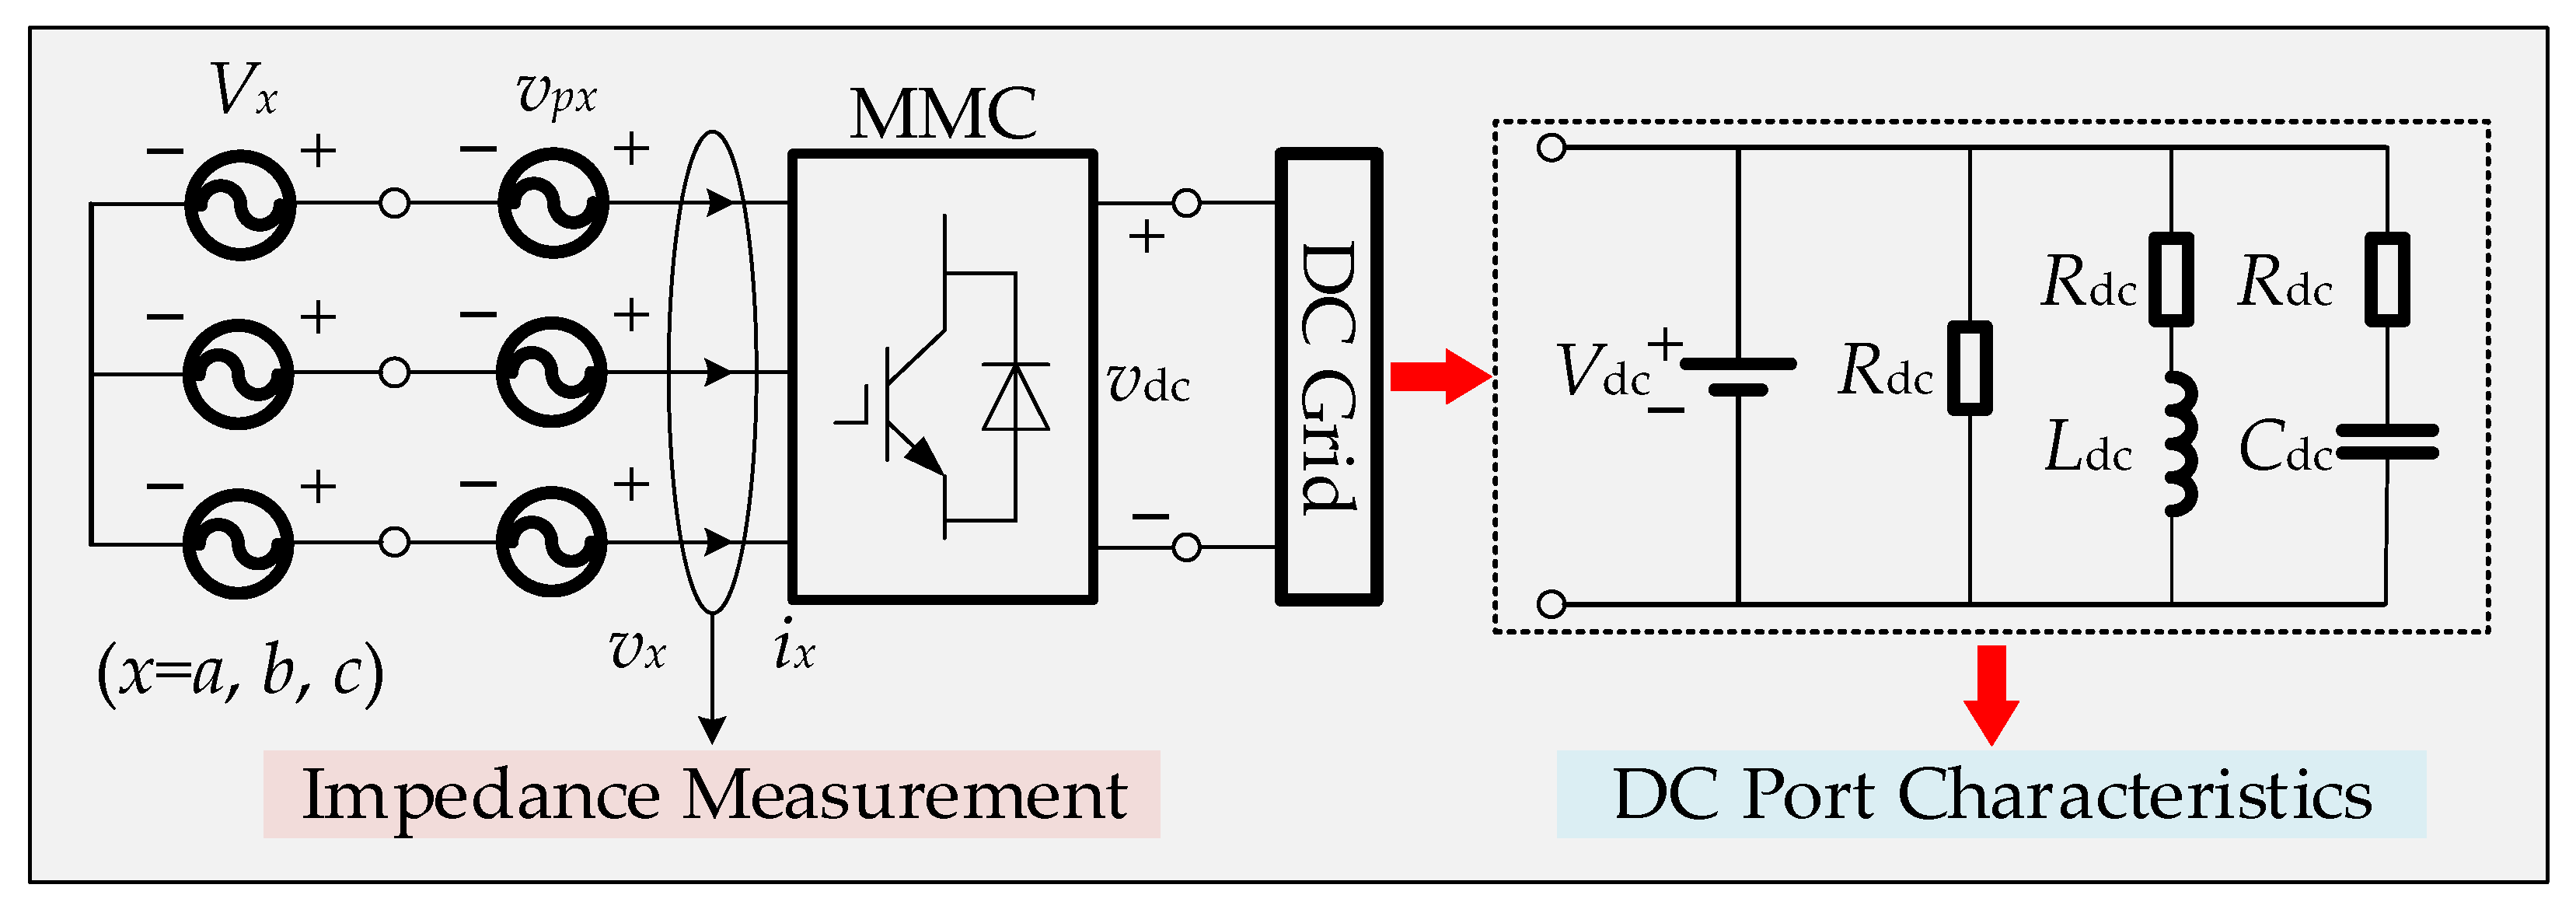
Section 4, assuming a known DC system impedance Zdc, the small signal harmonics of DC voltage v ^ d c = Z d c i ^ d c , where i ^ d c can be represented using the ZS/CM component of the arm current i ^ . Further eliminating v ^ , the analytic expression of the sequence impedance model of MMC can be obtained. For a detailed derivation, please refer to Section 4.

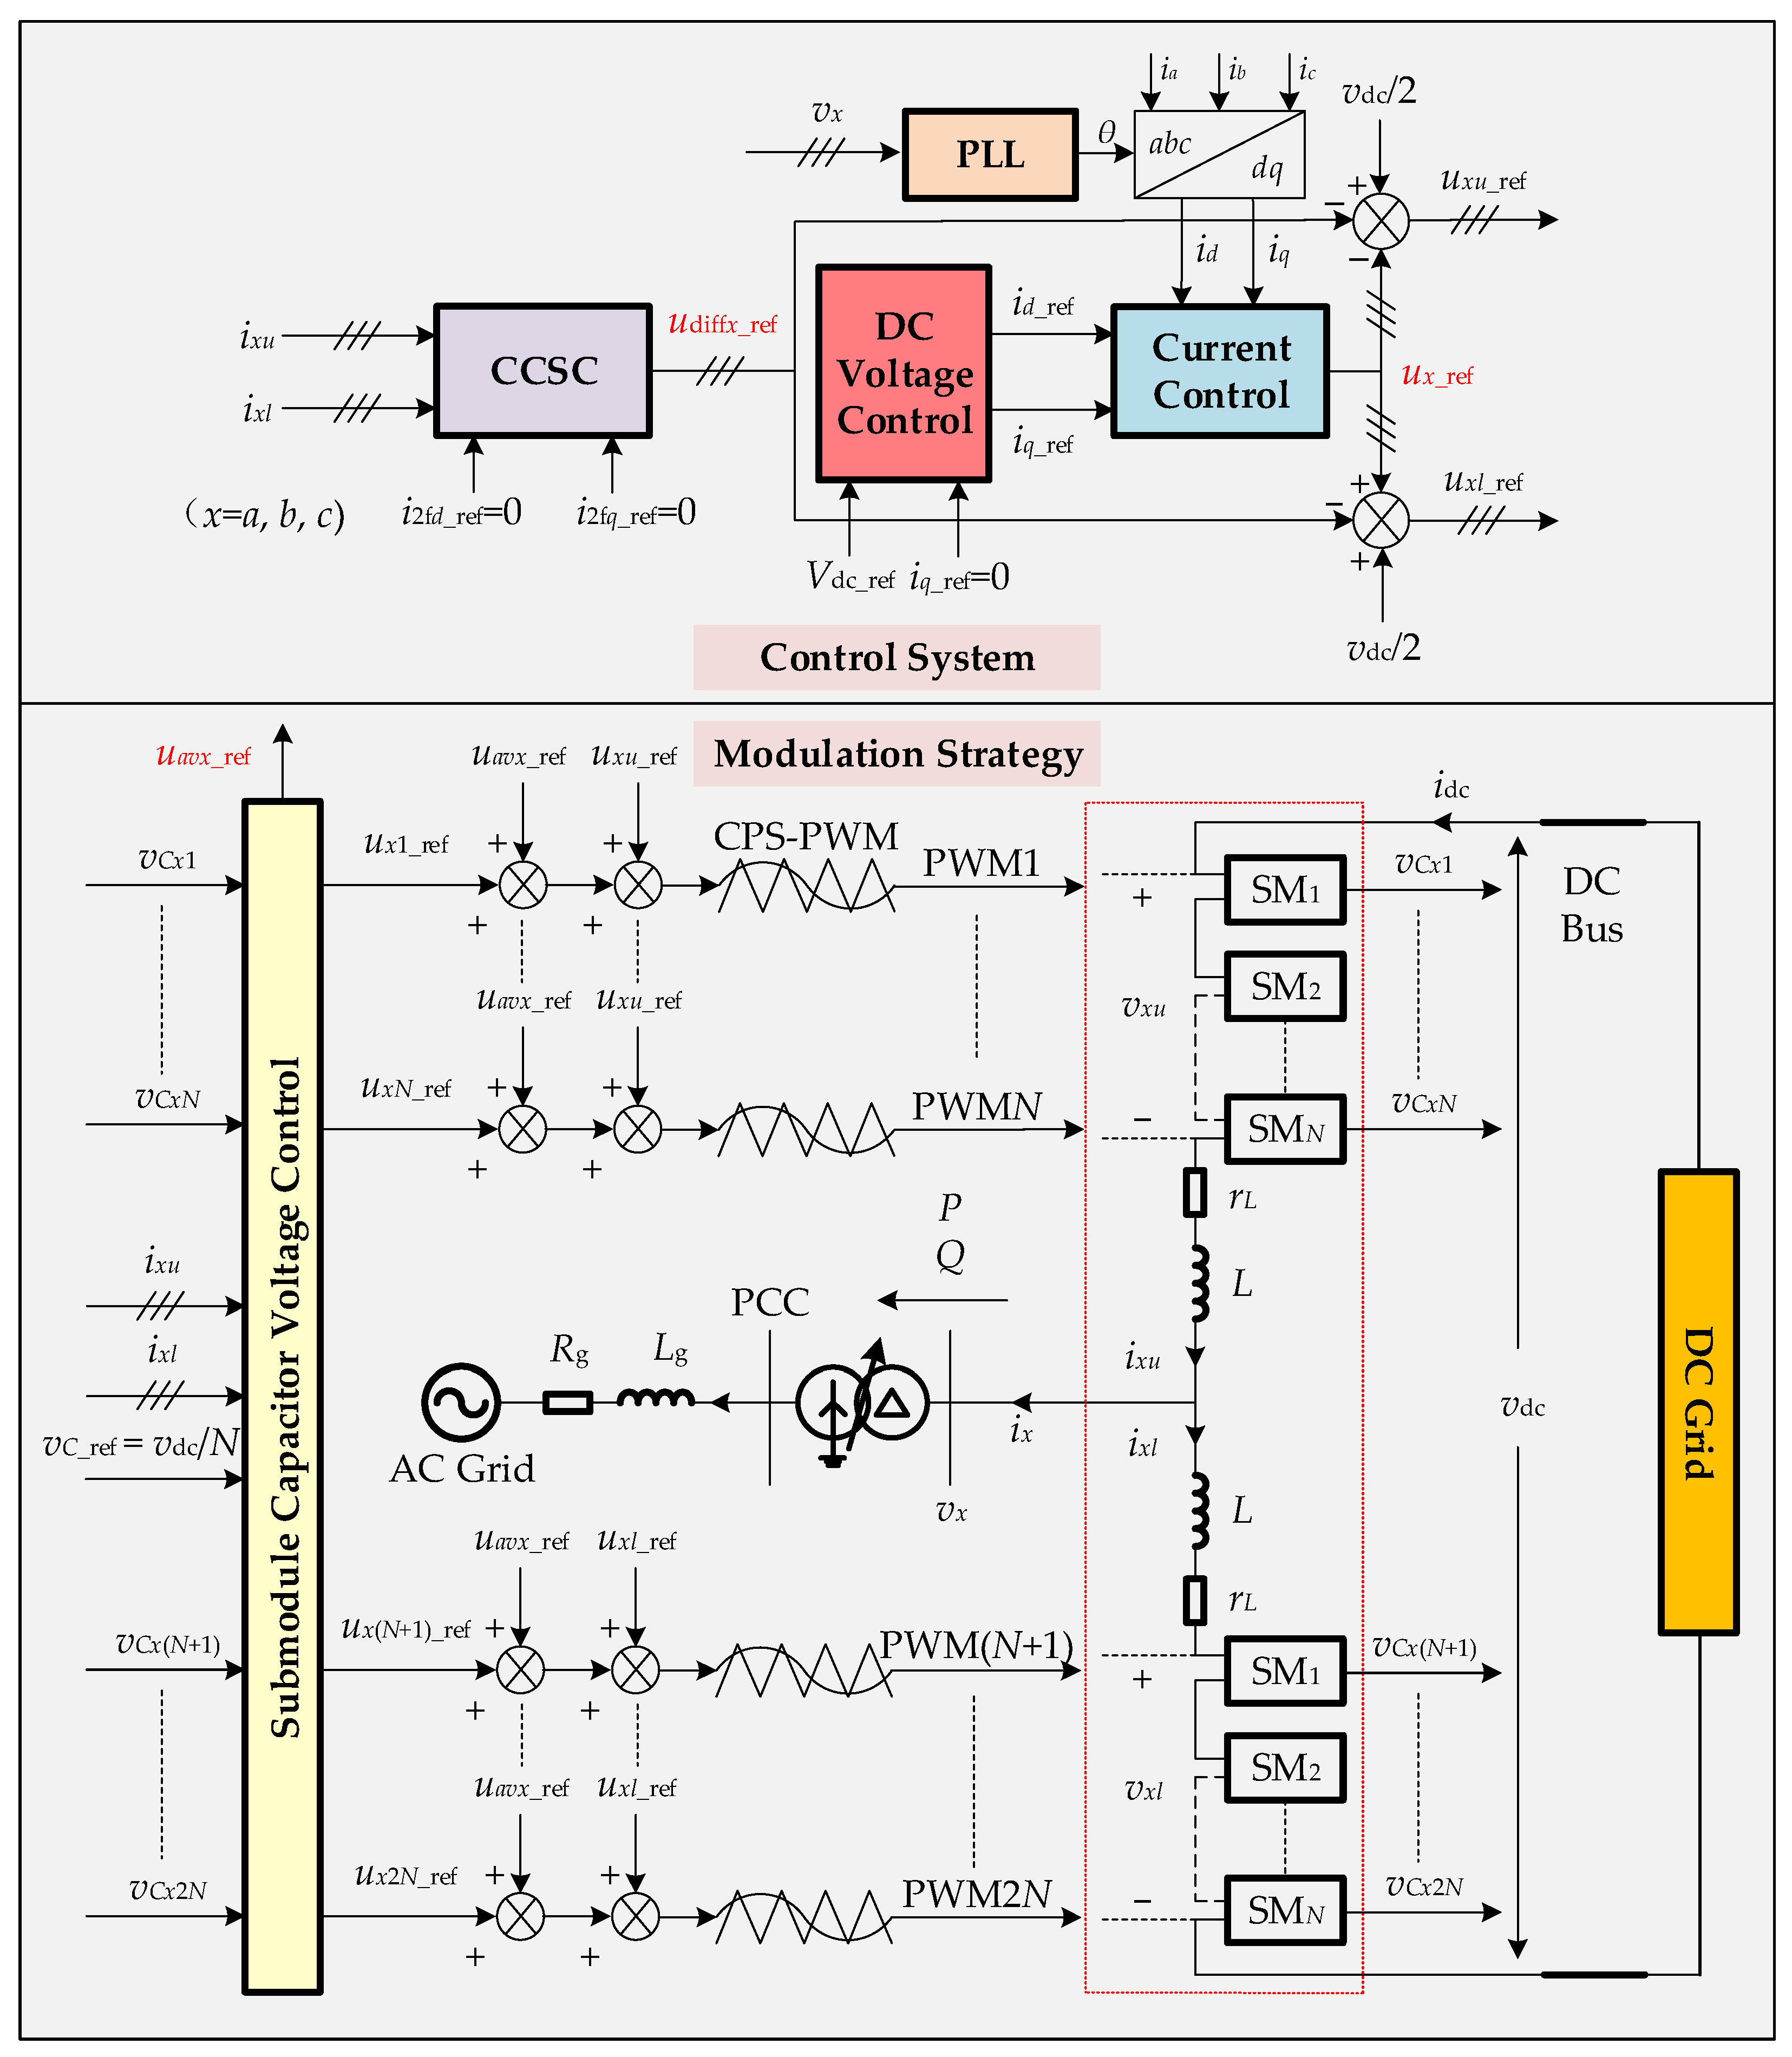
3. Control Modeling with DC Voltage Dynamics

The overall control system of the MMC is illustrated in Figure 3. In practical MMC projects, the most commonly used control strategy is based on the synchronous rotating dq coordinate system. In the following sections, the control strategy for MMC with a constant DC bus voltage is used as an example to illustrate the control modeling with the DC voltage dynamics. It involves the constant DC voltage outer loop control, phase current inner loop control, PLL, CCSC, and submodule capacitor voltage control. The detailed control system diagram is depicted in Figure 4. The purpose of control modeling is to establish the relationships between small-signal harmonics in modulation index m ^ and variables in the power stage model. The coefficient matrices Q, E, D, and P, respectively, denote the influence of i ^ , v ^ p , v ^ , and v ^ d c on the small-signal harmonics of m ^ . As depicted in Figure 4, PI controllers are used for all control loops, and the elements of the coefficient matrices are determined by the control structure and parameters.
m ^ = ( Q i ^ + E v ^ + D v ^ dc + P v ^ p ) / V dc
In this section, the main focus is on the small-signal modeling for different control loops in the MMC, involving small-signal harmonic components influenced by the complete control system, the linearization of PLL and coordinate transformations, the derivation of specific elements in the coefficient matrices.
The multi-harmonic linearization accounts for the third-order and lower small-signal harmonics. Therefore, all coefficient matrices are of the seventh order. In this context, Q comprises Qi, Qci, and Qai, signifying the influence of the phase current control, CCSC, and the circulating current inner loop of the submodule capacitor voltage control. Ddc represents the influence of the constant DC voltage control. Eav and Dav indicate the average voltage outer loop of the submodule capacitor voltage control. Pi and Pm are used to represent the effects of the fundamental current component through dq transformation and the DC component of the modulation reference voltage (dq-frame) through dq inverse transformation. In conclusion, all the coefficient matrices are further represented in Equation (14).
{ Q = Q i + Q c i + Q a i E = E a v D = D dc + D a v P = P i + P m
As shown in Figure 3, considering the upper arm of phase a as an example, the small-signal harmonics of the modulation index m ^ can be formulated as Equation (15).
m ^ = ( u ^ a _ ref + u ^ diff a _ ref u ^ a v a _ ref ) / V dc

3.1. Phase Current Control

Here, we establish the phase current control model Qi without taking into account phase angle disturbances from the PLL output. The small-signal harmonics of i ^ , after passing through dq transformation, phase current control, and dq inverse transformation, generate harmonics at the same frequencies in u ^ a _ r e f . In this process, the PS component goes through dq transformation, causing a reduction in its frequency by f1, while the NS component is reduced by f1 after dq transformation. Considering the example of introducing PS voltage perturbation on the AC side of MMC, by the phase and sequence relationships of small-signal harmonics detailed in Table 1, we can determine the expressions for the elements in Qi, noted as Q i + in Equation (16). Due to the control input being the AC side three-phase currents of MMC, the phase current control exclusively addresses the NS/PS-DM components in i ^ at frequencies fp − 2f1 and fp. The detailed element expressions are provided in Equation (17), in which Hi(s) denotes the transfer function of the phase current controller, with Kid = 1L representing the phase current control decoupling coefficient.
Q i + = diag [ 0 Q i p 2 0 Q i p 0 0 0 ]
Q i p 2 , p = 2 [ H i ( j 2 π ( f p f 1 ) ) ± j K i d ]
Similarly, when subjected to NS voltage perturbation, the phase current control coefficient matrix Q i is as illustrated in Equations (18) and (19).
Q i = diag [ 0 0 0 Q i p 0 Q i p + 2 0 ]
Q i p , p + 2 = 2 [ H i ( j 2 π ( f p + f 1 ) ) j K i d ]

3.2. Circulating Current Suppression Control

With the sum of upper and lower arm currents as the input, after dq transformation at −2f1, PI controller Hci(s), and dq inverse transformation at −2f1, only PS/NS-CM components in i ^ that are affected by CCSC. As with the modeling of phase current control, when exposed to PS/NS voltage perturbations, the coefficient matrices Q c i + / Q c i for CCSC can be defined as Equations (20)–(23) with Kcd = j2ω1L as decoupling coefficient.
Q c i + = diag [ Q c i p 3 0 0 0 Q c i p + 1 0 0 ]
Q c i p 3 , p + 1 = H c i ( j 2 π ( f p f 1 ) ) ± j K c d
Q c i = diag [ 0 0 Q c i p 1 0 0 0 Q c i p + 3 ]
Q c i p 1 , p + 3 = H c i ( j 2 π ( f p + f 1 ) ) j K c d

3.3. DC Voltage Control

In response to AC side voltage perturbations of frequency fp in both PS/NS, small-signal harmonics of the voltage at fpf1 and fp + f1 are induced on the DC side. These harmonics, after being processed by the DC voltage controller Hdc(s), phase current controller Hci(s), and dq inverse transformation, result in small-signal harmonic responses at fp − 2f1/fp and fp/fp + 2f1 within u ^ a _ r e f . The coefficient matrices D d c + / D d c of DC voltage control are detailed as Equations (24)–(27). It should be observed that Ddc contains two non-zero elements only in the column corresponding to frequencies of perturbations in DC voltage, with all other elements being zeros. The AC side voltage perturbations are transmitted through the MMC to the DC side, influencing the modulation reference wave through constant DC voltage control. Neglecting the dynamic of the DC bus voltage in the development of the AC side sequence impedance could potentially impact the results of stability analysis.
D dc + ( : , 3 ) = [ 0 D dc p 2 0 D dc p 0 0 0 ] T
D dc p 2 , p = 0.5 H dc ( j 2 π ( f p f 1 ) ) H i ( j 2 π ( f p f 1 ) )
D dc ( : , 5 ) = [ 0 0 0 D dc p 0 D dc p + 2 0 ] T
D dc p , p + 2 = 0.5 H dc ( j 2 π ( f p + f 1 ) ) H i ( j 2 π ( f p + f 1 ) )

3.4. Phase Locked Loop Control

Under the influence of AC side voltage perturbations, there are small signal harmonics in the output phase angle of PLL, which can be denoted by θ ^ in the frequency domain. Impedance modeling must consider the small-signal harmonic response in m ^ caused by θ ^ during dq transformation and dq inverse transformation. Previous studies have extensively explored the derivation of PLL small-signal model and linearization approach for coordinate transformation. In this context, we directly provide the transfer function matrix GPLL, as shown in Equation (28), establishing the relationship between v ^ p and θ ^ .
θ ^ = G PLL v ^ p
Under PS/NS voltage perturbations, Equations (29)–(32) provide the comprehensive expressions for coefficient matrices G P L L + / G P L L , respectively. Where HPLL(s) signifies the transfer function of the PI controller in PLL. TPLL(s) represents the open-loop transfer function of the system as depicted in Figure 4c. Therefore, GPLL(s) represents the closed-loop transfer function of the small-signal model of PLL. θ ^ exhibits small-signal harmonics at fpf1/fp + f1 when subjected to PS/NS AC side voltage perturbations at fp, respectively. Hence, GPLL has a single non-zero element exclusively at the corresponding frequency position (fpf1, fp) or (fp + f1, fp), while all other elements are zero.
G PLL + ( 3 , 4 ) = j G PLL ( j 2 π ( f p f 1 ) )
G PLL ( 5 , 4 ) = j G PLL ( j 2 π ( f p + f 1 ) )
G PLL ( s ) = T PLL ( s ) / [ 1 + V 1 T PLL ( s ) ]
T PLL ( s ) = H PLL ( s ) / s
In the process of coordinate transformation, θ ^ induces additional small-signal harmonics in m ^ . The actual dq transformation and dq inverse transformation matrices influenced by the phase angle disturbance are as follows.
T d q ( 2 π f 1 t + θ ^ ) T d q ( 2 π f 1 t ) + θ ^ T d q ( 2 π f 1 t + π 2 )
T d q T ( 2 π f 1 t + θ ^ ) T d q T ( 2 π f 1 t ) + θ ^ T d q T ( 2 π f 1 t + π 2 )
Figure 4a illustrates the process of performing dq transformation on the three-phase currents and subsequently applying dq inverse transformation to the dq-frame output of phase current control. The actual phase currents comprise a steady-state fundamental frequency component I 1 = I 1 e j φ 1 along with an array of small-signal harmonics. While the dq-frame output modulation reference voltages include a steady-state DC component, corresponding to U 1 = U 1 e j γ 1 at fundamental frequency, and a series of small-signal harmonics. The steady-state components individually multiply the second term on the right-hand side of Equations (33) and (34) to generate small-signal harmonics in m ^ . In conclusion, when exposed to PS/NS voltage perturbations on the AC side, the coefficient matrices P + / P are affected by the PLL. Equations (35) and (36) provide the detailed expressions of non-zero elements, with all the other elements being zero. The impact of steady-state operation on the impedance of MMC is introduced by PLL.
{ P + ( 4 , 4 ) = 0.5 G PLL ( j 2 π ( f p f 1 ) ) { [ H i ( j 2 π ( f p f 1 ) ) j K i d ] I 1 e j φ 1 + U 1 e j γ 1 } P + ( 2 , 4 ) = 0.5 G PLL ( j 2 π ( f p f 1 ) ) { [ H i ( j 2 π ( f p f 1 ) ) + j K i d ] I 1 e j φ 1 + U 1 e j γ 1 }
{ P ( 4 , 4 ) = 0.5 G PLL ( j 2 π ( f p + f 1 ) ) { [ H i ( j 2 π ( f p + f 1 ) ) + j K i d ] I 1 e j φ 1 + U 1 e j γ 1 } P ( 6 , 4 ) = 0.5 K m G PLL ( j 2 π ( f p + f 1 ) ) { [ H i ( j 2 π ( f p + f 1 ) ) j K i d ] I 1 e j φ 1 + U 1 e j γ 1 }
In Figure 4b, under ideal control conditions, the circulating currents of MMC are close to zero. Simultaneously, the DC component of the output of CCSC on the negative sequence second-harmonic dq-frame is very small. The small signal harmonics generated by the PLL in CCSC can be neglected.

3.5. Submodule Capacitor Voltage Control with DC Voltage Dynamics

In Figure 2, vCxj represents the capacitor voltage of each submodule. Submodule capacitor voltage control can be divided into two parts, averaging control and balancing control [26], as depicted in Figure 4d. In the outer loop of averaging control, the reference is the DC bus voltage divided by the number of submodules in a single arm, and the average of the sum of capacitor voltages v ¯ C x inside a phase leg is used as a feedback variable. The output icirx_ref is the reference of circulating currents in the phase domain. Finally, uavx_ref is superimposed together with the output of CCSC and double closed-loop control to contribute the small-signal harmonics in m ^ . The modeling of MMC sequence impedance is based on the assumption of balanced submodule capacitor voltages. However, the balancing control is used to adjust the insertion or bypass time for individual submodule and it can be neglected in the modeling process. Dav, Eav, and Qai corresponding the small-signal harmonics transfer mechanism from v ^ d c , v ^ , and i ^ to m ^ , through the submodule capacitor voltage control.
The detailed expressions of these matrix elements are provided in Equations (37)–(42). Taking the upper arm of phase a as an example, there are only CM components of vau/N in v ¯ C a , and CM components of iau in icira. In Figure 4d, all controllers directly operate in the phase domain, the CM components of vau and iau are controlled by PI compensators Hav(s) and Hai(s), respectively. Under PS/NS perturbation voltages, the elements of the coefficient matrices Eav and Qai have the same analytic expression. Dav indicates the control effect of DC voltage and contains non-zero elements only in (fpf1, fpf1) or (fp + f1, fp + f1).
E a v = diag [ { E a v k } | k = 3 , , 0 , , 3 ]
E a v k = ( 1 | mod ( k + 1 , 2 ) | ) N H a v ( j 2 π ( f p + k f 1 ) ) H a i ( j 2 π ( f p + k f 1 ) )
Q a i = diag [ { Q a i k } | k = 3 , , 0 , , 3 ]
Q a i k = ( 1 | mod ( k + 1 , 2 ) | ) H a i ( j 2 π ( f p + k f 1 ) )
D a v + ( 3 , 3 ) = H a v ( j 2 π ( f p f 1 ) ) H a i ( j 2 π ( f p f 1 ) ) / N
D a v ( 5 , 5 ) = H a v ( j 2 π ( f p + f 1 ) ) H a i ( j 2 π ( f p + f 1 ) ) / N
This section has completed the modeling of the control system from variables i ^ , v ^ , v ^ p , and v ^ d c in the power stage model to the modulation index m ^ , substituting m ^ into Equations (11) and (12) to eliminate the intermediate variables m ^ and v ^ . The DC current is represented by the ZS/CM component of the arm current, multiplied by the impedance of the DC system, and the intermediate variable v ^ d c is eliminated. Finally, the transfer function matrix between i ^ and v ^ p can be derived.

4. Verification and Analysis of the Impedance Considering DC Port Characteristics

4.1. Impedance Models Considering DC System Dynamics

When establishing the AC side sequence impedance Zac of the MMC, the impact of the DC system impedance Zdc is considered. Referring to the DC current reference direction depicted in Figure 2, the DC current is three times the ZS/CM component of the upper arm current of phase a. Assuming a known DC system impedance Zdc, the relationship of small-signal harmonics between the arm current i ^ and DC bus voltage v ^ d c can be expressed as Equation (43).
v ^ dc = Z dc i ^ dc = 3 Z dc i ^
Under the influence of PS/NS voltage perturbations on the AC side, the DC system impedance Zdc can be expressed as in Equations (44) and (45), respectively. Non-zero elements are exclusively found in (fpf1, fpf1) or (fp + f1, fp + f1), with all other elements being zero.
Z dc + = diag [ 0 0 Z dc p 1 0 0 0 0 ]
Z dc = diag [ 0 0 0 0 Z dc p + 1 0 0 ]
Substituting Equation (43) containing the DC port impedance characteristics and the control model from Equation (13) into the MMC power stage model, Equations (11) and (12), we obtain the small-signal model for the arm current i ^ and voltage perturbation v ^ p , as shown in Equation (46).
{ U + Y l [ 1.5 Z dc + V Q 3 V D Z dc + ( V E + M ) ( Y c I E ) 1 ( I Q 3 I D Z dc + M ) ] } i ^ = Y l [ U + V P + ( V E + M ) ( Y c I E ) 1 I P ] v ^ p
where U represents a seventh-order identity matrix. Q, D, E, and P are defined in Equation (14) by the control modeling process. To simplify the representation, Yl denotes the inverse of the impedance matrix Zl, which captures the impedance of arm inductance at small-signal harmonic frequencies. In a specific steady-state operating mode of MMC, V, I, and M represent a Toeplitz matrix of steady-state harmonic components for the sum of submodule capacitor voltages, the arm current, and the modulation index in the upper arm of phase a. Introduced here is the influence of the steady-state operation point on the impedance characteristics of MMC.
According to the current reference direction illustrated in Figure 2, the transfer function matrix between the AC side voltage perturbation and the phase current response is as described in Equation (47). At the frequency of fp, the phase current is twice that of the arm current. Therefore, the input impedance of MMC at fp is denoted as Zac(n + 1, n + 1), which signifies the (n + 1, n + 1) element within Zac.
Z ac = v ^ p i ^ a = v ^ p 2 i ^

4.2. Verification and Analysis of Impedance Modeling

In the following section, we will present the impedance measurement results obtained through detailed switching circuit simulations. These results will be compared with the impedance responses predicted by the impedance model developed previously, serving as validation for the proposed modeling approach. The desired MMC system parameters are provided in Table 2.
The scheme of impedance measurement is shown in Figure 5. In this simulation, the converter applies perturbation voltages in the AC terminal at a frequency of fp. Once the MMC reaches a periodic steady state, Fourier analysis is employed to extract the phase current response i ^ p at the perturbation frequency. Using the symmetrical component analysis to separate the PS/NS components of three-phase voltages and currents, the corresponding impedance responses of MMC are calculated. The impedance measurement and calculation results are compared to validate the accuracy of the proposed modeling approach of MMC.
The converter initially operates in an open-loop mode, which means each arm is driven by fixed control signals. When setting the coefficient matrices Q, E, D, and P to zero in Equation (13), we obtain the open-loop impedance matrix to confirm the accuracy of the power stage model. Subsequently, various control loops are introduced in the following sequence to verify the control system modeling of MMC: phase current control, CCSC, PLL, submodule capacitor control, and DC voltage control. Finally, different types of DC system equivalent impedance are used to analyze the impact of DC port characteristics on the impedance of MMC. In the figures of this section, the red and black curves represent the PS/NS impedance responses of the MMC calculated using the proposed modeling method, while the dashed lines depict the impedance responses obtained from simulation measurements and the frequency ranges from 0 to 2000 Hz.

4.2.1. Impedance Responses with Open-Loop Control

The modulation index for the upper arm of phase a is defined as in Equation (48). Corresponding to the MMC operating in the inverter mode, transmitting rated active power, both the AC and DC systems are assumed to be ideal voltage sources. With the symmetric relationships, control signals of the other arms can be derived accordingly.
m a u ( t ) = 0.4971 0.4207 cos ( ω 1 t 172.1 ) 0.0122 cos ( 2 ω 1 t 87.3 )
In the upper arm of phase a, Table 3 summarizes the Fourier coefficients of the arm current Iau, equivalent capacitor voltage Vau, and modulation index Mau in a steady state.
The corresponding open-loop impedance responses are depicted in Figure 6. The system resonance risks are observed at 26 Hz and 74 Hz, where 26 Hz is associated with the series resonance frequency of the arm inductance L and submodule capacitance Cm listed in Table 2, while the 74 Hz resonance is induced by the frequency-coupling characteristic (fp and 2f1fp) of MMC. The predicted responses agree well with the impedance measurement results.
From the phase-frequency responses shown in Figure 6, the PS/NS impedances of MMC display phase angles of −90° and 90° on either side of the resonant frequency. As the frequency increases, they are essentially the same and transition from capacitive to inductive at 26 Hz.
The matrices Q, D, E, and P in Equation (46) are set to zero, and a simplified open-loop impedance Zac0 can be obtained, as shown in Equation (49).
Z ac = Z l ( U + Y l M Y c 1 M )
It is evident that in an open-loop mode, with control signals preset, the characteristics of the MMC impedance models are solely dependent on the arm inductance impedance and submodule capacitance admittance, reduced to the features of a passive system. Once the main circuit parameters are established, only the steady-state harmonics at the operating point affect the MMC impedance characteristics.

4.2.2. Impedance Responses with Closed-Loop Control

Verification of the previously established control model is achieved by sequentially adding the following control loops: (1) phase current control; (2) CCSC; (3) PLL; (4) constant DC voltage and submodule capacitor voltage control. In the control modeling and validation process for (1) and (2), it is assumed that the voltage phase angle in the PCC is known and directly applied during the coordinate transformation. The AC/DC systems of MMC are all considered as ideal voltage sources in (1) to (3). Simultaneously, the MMC operates in inverter mode, transmitting rated active power, with a steady-state operating point identical to the open-loop mode. To confirm the accuracy of impedance modeling in power reverse transfer and to analyze the impact of DC port characteristics on impedance responses, the DC side is configured as a resistive load in (4), corresponding to the rated active power.
In Figure 7, the PS/NS impedance responses of the MMC considering phase current control are illustrated. The closed-loop transfer function of the current control is a typical second-order system. Following the parameters listed in Table 2, the bandwidth of the phase current controller is 308 Hz. Therefore, compared to the open-loop mode in Figure 6, the PS/NS impedance responses within the bandwidth frequency range (0~358 Hz) are significantly influenced by phase current control, whereas the magnitude and phase characteristics remain substantially consistent beyond the bandwidth frequency range. This is because the MMC control system is implemented through the dq synchronous rotating coordinate system, while controllers are typically designed based on the abc stationary coordinate system. The closed-loop transfer function characteristics are symmetric about f = 0 Hz, but the MMC control signals undergo a coordinate transformation, which is reflected as symmetry around f = f1 in the impedance responses of MMC. The resonance peak of the PS impedance near the fundamental frequency is induced by the phase current control, and its physical significance can be explained as follows: the current control enforces phase currents tracking of the reference values, and under ideal control conditions, the MMC exhibits the characteristics of an ideal current source at the fundamental frequency, with infinite internal impedance.
Figure 8 illustrates the impedance responses of MMC with the phase current control and CCSC. Compared to the impedance responses with current control, the CCSC effectively introduces a resonance peak near 3 Hz in the NS impedance and has minimal impact on PS/NS impedances above 20 Hz. For the analysis of high-frequency resonances, the effect of the CCSC on MMC impedance characteristics can be omitted.
Figure 9 depicts the use of practical PLL in phase current control and CCSC. In comparison to Figure 8, where the ideal phase angle was used for coordinate transformation, the impact of PLL on the PS impedance of MMC is primarily seen in the frequency range mirroring the fundamental frequency, commonly referred to as the frequency coupling characteristic. Based on the controller parameters and AC voltage magnitude provided in Table 2, the PLL bandwidth is calculated to be 107 Hz, theoretically mainly affecting the impedance characteristics within the bandwidth frequency range (0~157 Hz) on either side of the fundamental frequency. The influence of the PLL in the frequency range above 157 Hz is relatively minor. It should be emphasized that the addition of PLL induces a negative damping effect in the MMC impedance. The phase responses of PS/NS impedances over a broad frequency range consistently exceed ±90°, indicating that the real parts of impedances are negative and demonstrate negative resistance properties. At the frequency where the impedance of MMC intersects with the external impedance on the magnitude, and the phase difference between them exceeds 180°, the negative damping characteristic can lead to resonance instability according to the Nyquist criterion.
As shown in Figure 10, the MMC impedance responses are further verified with the incorporation of constant DC voltage control and submodule capacitor voltage control. The DC side system is reconfigured as a resistive load, Rdc = 18.75 Ohm, which corresponds to the consumption of rated active power, P = 30 kW. The impedance responses calculation matches well with the measured results. With a DC voltage controller bandwidth of 90 Hz, its impact on impedance characteristics is concentrated in the low-frequency range, mitigating the negative damping effects introduced by the PLL. In the low-frequency region, the magnitude of the MMC impedance exhibits a slight increase.
The verification presented above confirms the MMC impedance modeling approach proposed in this paper, which considers the dynamics of the DC bus voltage. When comparing the impedance characteristics of the control loops mentioned above, in the high-frequency range, the PS/NS impedance characteristics of the converter are quite similar. The phase angle perturbation from the PLL exhibits a significant impact on the MMC impedance characteristics in the sub-/super-synchronous frequency range. Phase current control, CCSC, and constant DC voltage control predominantly affect the MMC impedance characteristics within their respective bandwidths in the lower frequency range.

4.3. Influence of DC Port Characteristics on Impedance Responses

As a typical two-port network, the MMC’s DC side dynamics are also reflected on the AC side. The instabilities associated with resonance may be caused by the DC side dynamics passing through the MMC and the control interactions with the weak AC grid. Modeling impedance only on the AC side and simplifying the DC network to an ideal voltage source may compromise the accuracy of stability analysis. Therefore, via the impedance modeling approach discussed in this paper, this section will analyze the effects of various types of DC system loads on the AC side sequence impedance characteristics of the MMC. To enhance model applicability and generality for various types of equivalent impedances in the DC grid, three categories of DC side loads are defined: resistive load; resistive and inductive load; resistive and capacitive load.
Figure 11 illustrates the impedance responses of the MMC on the AC side for various resistive loads on the DC side. MMC operates in rectifier mode, transferring active power at 10, 20, and 30 kW, corresponding to DC side resistances Rdc of 18.75, 28.16, and 56.25 Ohms, respectively. All other control parameters are consistent with Table 2. When Rdc = 18.75 Ohm, the phase responses in PS/NS impedances fluctuate between ±90°, with no presence of the negative damping effect. The system has a significant stability margin. With an increase in Rdc, the MMC exhibits reduced active power transfer to the DC side. The magnitude responses in the 0–100 Hz range show a slight difference, while the phase responses exceeding ±90° in multiple frequency ranges indicate a negative damping effect in MMC impedance. At frequencies where the MMC impedance intersects with the external system impedance on magnitude, and the phase difference exceeds 180°, there exists a risk of resonance instability. The impact of operating point drift caused by resistance variations on MMC’s AC side impedance characteristics should not be underestimated.
To investigate the impact of diverse DC side loads on the AC side sequence impedance characteristics of the MMC, while keeping the DC side resistance constant, ensuring that the active power transmission of the MMC remains unchanged, inductance loads were introduced. With regard to the modification of a single variable, when two distinct inductive loads, Ldc = 5 mH and 10 mH, are connected in series to Rdc = 18.75 Ohm, Figure 12 illustrates the MMC impedance responses. It is evident that the inductive loads have a minimal effect on MMC AC side impedance characteristics. This can be attributed to the fact that the impedance magnitude of the inductors is almost zero at 0 Hz, effectively treated as short circuits, thereby causing minimal perturbations to the MMC’s steady-state operating point.
Similarly, in a series with a DC resistance of Rdc = 18.75 Ohms, two capacitors are connected on the DC side, Cdc = 5 μF and 10 μF, and Figure 13 illustrates the corresponding impedance responses of the MMC. There is a substantial variation in the frequency responses within the 0–200 Hz frequency range. Nevertheless, the values of the capacitors have a relatively minor impact on the MMC’s impedance characteristics, and the impedance responses of the MMC with both capacitors installed are relatively close to each other. In this situation, there is a noticeable rise in the magnitude response of the PS impedances of MMC, and both PS/NS impedance phases exceed ±90°. It is conceivable that the negative damping effect might trigger system instability. The explanation for this phenomenon is as follows: with a high impedance magnitude at low frequency, the voltage on either side of the capacitor Cdc is in proximity to the DC bus voltage, resulting in minimal DC current through Rdc. Consequently, the DC side of MMC is effectively an open circuit, and the active power transmitted through MMC approaches zero, leading to significant variations in steady-state harmonics compared to a single resistive load. As a result, the influence of DC side capacitors on the AC side impedance characteristics of MMC is primarily concentrated within the lower-frequency range.
The influence of DC port characteristics on the AC side impedance response of the MMC can be summarized as causing deviations in different operating points, resulting in changes in power transferred through the MMC, as well as alterations in the amplitude and phase of voltages and currents at the grid connection point. Additionally, there are significant variations in the control signals and internal harmonic characteristics of the MMC. Consequently, MMCs with the same control parameters exhibit significantly different external characteristics. Without comprehensive considering DC port characteristics in stability analysis can lead to inaccuracies in stability analysis results and stability margin assessments.

5. Conclusions

This paper introduces a sequence impedance modeling method for MMC that incorporates the dynamic behavior of the DC system and investigates the influence of various types of DC port characteristics on the impedance responses of MMC. In summary, the results of the analysis lead to the following conclusions:
(1)
Taking into account the DC port characteristics and the impact of DC voltage control, while utilizing the DC bus voltage as an intermediary variable, the AC side sequence impedance model of MMC is established. The proposed method is useful for modeling with different DC subsystems and analysis of hybrid AC/DC networks.
(2)
Validating the effectiveness of the proposed modeling method through impedance frequency scan and assessing the generality for various types of DC networks. The conventional modeling assumption of an ideal DC voltage source has certain limitations. As a typical two-port network, the coupling between AC/DC sides of MMC should not be neglected in the analysis of resonance instability.
(3)
The DC port characteristics have a significant impact on the impedance frequency response of MMC. As the resistive and capacitive loads on the DC side increase, the phase responses of the AC side impedance in MMC exceeds ±90°, exhibiting negative damping characteristics. The influence of inductive load on the DC side has a limited effect on the impedance response of MMC. The primary factor leading to these effects is the fluctuation in the steady-state operating points of MMC.

Author Contributions

Conceptualization, Z.Y. and J.X.; methodology, Z.Y. and J.X.; software, Z.Y.; validation, Z.Y.; formal analysis, Z.Y. and J.X.; investigation, Z.Y.; resources, J.X.; data curation, Z.Y.; writing—original draft preparation, Z.Y.; writing—review and editing, Z.Y.; visualization, J.X.; supervision, J.X.; project administration, J.X.; funding acquisition, J.X. All authors have read and agreed to the published version of the manuscript.

Funding

This research was funded by the National Natural Science Foundation of China (51777130).

Data Availability Statement

Data are contained within the article.

Acknowledgments

This paper is supported by the Institute of High Voltage and Power System, Shenyang University of Technology.

Conflicts of Interest

The authors declare no conflict of interest.

References

  1. Lesnicar, A.; Marquardt, R. An Innovative Modular Multilevel Converter Topology Suitable for a Wide Power Range. In Proceedings of the 2003 IEEE Bologna PowerTech Conference, Bologna, Italy, 23–26 June 2003; pp. 1–6. [Google Scholar]
  2. Li, Z.; Wang, Z.; Wang, Y.; Yin, T.; Mei, N.; Yue, B.; Lei, W. Accurate Impedance Modeling and Control Strategy for Improving the Stability of DC System in Multiterminal MMC-Based DC Grid. IEEE Trans. Power Electron. 2020, 35, 10026–10049. [Google Scholar] [CrossRef]
  3. Wang, Y.; Xu, Q.; Guerrero, J.M. Effect of Frequency Coupling on Stability Analysis of a Grid-Connected Modular Multilevel Converter System. Energies 2021, 14, 6580. [Google Scholar] [CrossRef]
  4. Zhang, Y.; Chen, X.; Sun, J. Sequence Impedance Modeling and Analysis of MMC in Single-Star Configuration. IEEE Trans. Power Electron. 2020, 35, 334–346. [Google Scholar] [CrossRef]
  5. Ji, K.; Tang, G.; Pang, H.; Yang, J. Impedance Modeling and Analysis of MMC-HVdc for Offshore Wind Farm Integration. IEEE Trans. Power Deliv. 2020, 35, 1488–1501. [Google Scholar] [CrossRef]
  6. Xu, Z.; Li, B.; Wang, X.; Blaabjerg, F.; Xu, D. High-Frequency Resonance Suppression Based on Unified MMC High-Frequency Impedance Model. IEEE Trans. Power Electron. 2022, 37, 14755–14769. [Google Scholar] [CrossRef]
  7. Xu, Z.; Li, B.; Han, L.; Hu, J.; Wang, S.; Zhang, S.; Xu, D. A Complete HSS-Based Impedance Model of MMC Considering Grid Impedance Coupling. IEEE Trans. Power Electron. 2020, 35, 12929–12948. [Google Scholar] [CrossRef]
  8. Man, J.; Xie, X.; Xu, S.; Zou, C.; Yin, C. Frequency-Coupling Impedance Model Based Analysis of a High-Frequency Resonance Incident in an Actual MMC-HVDC System. IEEE Trans. Power Deliv. 2020, 35, 2963–2971. [Google Scholar] [CrossRef]
  9. Cespedes, M.; Sun, J. Impedance Modeling and Analysis of Grid-Connected Voltage-Source Converters. IEEE Trans. Power Electron. 2013, 29, 1254–1261. [Google Scholar] [CrossRef]
  10. Sun, J. Small-Signal Methods for AC Distributed Power Systems–A Review. IEEE Trans. Power Electron. 2009, 24, 2545–2554. [Google Scholar]
  11. Sun, J. Impedance-Based Stability Criterion for Grid-Connected Inverters. IEEE Trans. Power Electron. 2011, 26, 3075–3078. [Google Scholar] [CrossRef]
  12. Li, M.; Nian, H.; Hu, B.; Xu, Y.; Liao, Y.; Yang, J. Design Method of Multi-Sine Signal for Broadband Impedance Measurement Considering Frequency Coupling Characteristic. IEEE J. Emerg. Sel. Top. Power Electron. 2022, 10, 532–543. [Google Scholar] [CrossRef]
  13. Zhang, B.; Du, X.; Du, C.; Zhao, J.; Li, F. Stability Modeling of a Three-Terminal MMC-HVDC Transmission System. IEEE Trans. Power Deliv. 2022, 37, 1754–1763. [Google Scholar] [CrossRef]
  14. Sun, J.; Liu, H. Sequence Impedance Modeling of Modular Multilevel Converters. IEEE J. Emerg. Sel. Top. Power Electron. 2017, 5, 1427–1443. [Google Scholar] [CrossRef]
  15. Lyu, J.; Zhang, X.; Cai, X.; Molinas, M. Harmonic State-Space Based Small-Signal Impedance Modeling of a Modular Multilevel Converter with Consideration of Internal Harmonic Dynamics. IEEE Trans. Power Electron. 2019, 34, 2134–2148. [Google Scholar] [CrossRef]
  16. Vieto, I.; Sun, J. Sequence Impedance Modeling and Converter-Grid Resonance Analysis Considering DC Bus Dynamics and Mirrored Harmonics. In Proceedings of the 2018 IEEE 19th Workshop on Control and Modeling for Power Electronics (COMPEL), Padua, Italy, 25–28 June 2018; pp. 1–8. [Google Scholar]
  17. Vieto, I.; Du, X.; Nian, H.; Sun, J. Frequency-domain coupling in two-level VSC small-signal dynamics. In Proceedings of the 2017 IEEE 18th Workshop on Control and Modeling for Power Electronics (COMPEL), Stanford, CA, USA, 9–12 July 2017; pp. 1–8. [Google Scholar]
  18. Huang, T.; Chen, X. Sequence Impedance Modeling and Optimization of MMC-HVDC Considering DC Voltage Control and Voltage Feedforward Control. Energies 2022, 15, 9649. [Google Scholar] [CrossRef]
  19. Yin, T.; Wang, Y.; Wang, X.; Yue, B.; Zhao, D.; Sun, J.; Li, P.; Liu, Y. Modeling and Analysis of High-Frequency MMC Impedance Considering Different Control Modes and Voltage Feedforward. IEEE Access 2020, 8, 218575–218584. [Google Scholar] [CrossRef]
  20. Yin, T.; Wang, Y.; Yue, B.; Xu, P.; Li, P.; Mei, N.; Xu, D. Impedance-Based Stability Analysis and Stabilization Control Strategy of MMC-HVDC Considering Complete Control Loops. IEEE Access 2020, 8, 55602–55618. [Google Scholar] [CrossRef]
  21. Ji, K.; Tang, G.; Yang, J.; Li, Y.; Liu, D. Harmonic Stability Analysis of MMC-Based DC System Using DC Impedance Model. IEEE J. Emerg. Sel. Top. Power Electron. 2020, 8, 1152–1163. [Google Scholar] [CrossRef]
  22. Yin, T.; Wang, Y.; Sun, J.; Li, X.; Yue, B.; Wang, X.; Liu, P.; Peng, Y.; Liu, Y.; Li, P. Impedance-Based Characterization of Positive–Negative Sequence Separation and Its Effects on MMC-HVDC Stability. IEEE J. Emerg. Sel. Top. Power Electron. 2022, 10, 4395–4412. [Google Scholar] [CrossRef]
  23. Zong, H.; Zhang, C.; Lyu, J.; Cai, X.; Molinas, M.; Rao, F. Generalized MIMO Sequence Impedance Modeling and Stability Analysis of MMC-HVDC With Wind Farm Considering Frequency Couplings. IEEE Access 2020, 8, 55602–55618. [Google Scholar] [CrossRef]
  24. Sun, J.; Vieto, I.; Larsen, E.V.; Buchhagen, C. Impedance-Based Characterization of Digital Control Delay and Its Effects on System Stability. In Proceedings of the 2019 20th Workshop on Control and Modeling for Power Electronics (COMPEL), Toronto, ON, Canada, 17–20 June 2019; pp. 1–8. [Google Scholar]
  25. Ji, K.; Pang, H.; Yang, J.; Tang, G. DC Side Harmonic Resonance Analysis of MMC-HVDC Considering Wind Farm Integration. IEEE Trans. Power Deliv. 2021, 36, 254–266. [Google Scholar] [CrossRef]
  26. Hagiwara, M.; Akagi, H. Control and Experiment of Pulsewidth-Modulated Modular Multilevel Converters. IEEE Trans. Power Deliv. 2009, 24, 1737–1746. [Google Scholar] [CrossRef]
Figure 1. Main circuit diagram of grid-connected MMC.
Energies 16 07770 g001
Figure 2. Topology structure and the averaged model of MMC.
Energies 16 07770 g002
Figure 3. Control and modulation block diagram of MMC.
Energies 16 07770 g003
Figure 4. MMC control system scheme: (a) phase current control and DC voltage control; (b) CCSC; (c) PLL; (d) submodule capacitor voltage control.
Energies 16 07770 g004aEnergies 16 07770 g004b
Figure 5. Scheme of impedance measurement.
Energies 16 07770 g005
Figure 6. Impedance responses in open-loop mode.
Energies 16 07770 g006
Figure 7. Impedance responses with phase current control.
Energies 16 07770 g007
Figure 8. Impedance responses with phase current control and CCSC.
Energies 16 07770 g008
Figure 9. Impedance responses with phase current control, CCSC, and PLL.
Energies 16 07770 g009
Figure 10. Impedance responses with phase current control, CCSC, PLL, DC voltage control, and submodule capacitor voltage control.
Energies 16 07770 g010
Figure 11. Impedance responses of MMC with resistive load on the DC side.
Energies 16 07770 g011
Figure 12. Impedance responses of MMC with resistive and inductive load on the DC side.
Energies 16 07770 g012
Figure 13. Impedance responses of MMC with resistive and capacitive load on the DC side.
Energies 16 07770 g013
Table 1. Phase and sequence relationships of small-signal harmonics.
FrequencySequenceSignPerturbation
fp − 3f1PS/NSCM/CMPS/NS
fp − 2f1NS/ZSDM/DM
fpf1ZS/PSCM/CM
fpPS/NSDM/DM
fp + f1NS/ZSCM/CM
fp + 2f1ZS/PSDM/DM
fp + 3f1PS/NSCM/CM
Table 2. Detailed system parameters of MMC.
ParametersValuesParametersValues
Rated AC Voltage Vac/V380DC Voltage ControlHdc(s) = 1 + 5/s
Rated DC Voltage Vdc/V750Phase Current ControlHi(s) = 5 + 300/s
Rated Power S/kVA30CCSCHci(s) = 10 + 500/s
Number of Submodules per arm N4Averaging ControlHav(s) = 1 + 50/s
Submodule Capacitance Cm/μF7200Circulating Current ControlHai(s) = 5 + 100/s
Arm Inductance L/mH5Phase-Locked LoopHPLL(s) = 1 + 500/s
Arm Resistance rL0.1Balancing ControlKc = 1
Switching Frequency fs/Hz1000 HzSubmodule TopologyHalf-bridge
Table 3. Harmonics in steady state of MMC.
FrequencyMauIau/AVau/V
0 Hz0.497113.53750
50 Hz−0.20835 − j0.0289116.115−0.78669 − j9.17634
100 Hz0.00029 − j0.006090.01350 + j0.01149−0.45750 + j2.95528
150 Hz 0.00146 + j0.00068−0.05764 − j0.00667
Disclaimer/Publisher’s Note: The statements, opinions and data contained in all publications are solely those of the individual author(s) and contributor(s) and not of MDPI and/or the editor(s). MDPI and/or the editor(s) disclaim responsibility for any injury to people or property resulting from any ideas, methods, instructions or products referred to in the content.

