Article

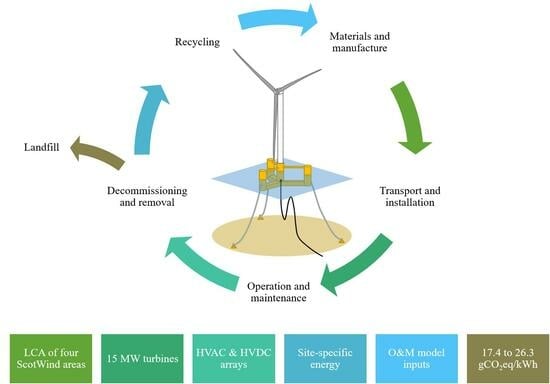
Life Cycle Assessment of Four Floating Wind Farms around Scotland Using a Site-Specific Operation and Maintenance Model with SOVs

1
School of Engineering, University of Edinburgh, Edinburgh EH9 3FB, UK
2
Industrial CDT in Offshore Renewable Energy (IDCORE), University of Strathclyde, Glasgow G1 1XQ, UK
3
Research and Disruptive Innovation, ORE Catapult, Glasgow G1 1RD, UK
*
Author to whom correspondence should be addressed.
Energies 2023, 16(23), 7739; https://doi.org/10.3390/en16237739
Submission received: 29 September 2023 / Revised: 10 November 2023 / Accepted: 16 November 2023 / Published: 23 November 2023
(This article belongs to the Topic Sustainable Environmental Technologies)

Abstract

:
This paper presents a life cycle assessment (LCA) of the International Energy Agency (IEA) 15 MW Reference Wind Turbine (RWT), on floating platforms, deployed in commercial-scale arrays at multiple locations around Scotland in the ScotWind leasing round. Site-specific energy production and vessel operations are provided by a dedicated offshore wind farm operations and maintenance (O&M) model, COMPASS, allowing service operation vessel (SOV) O&M impacts to be assessed with increased confidence. For climate change, the median global warming impact varied from 17.4 to 26.3 gCO2eq/kWh across the four sites within a 95% confidence interval using an uncertainty assessment of both foreground and background data. As is common with other offshore renewable energy systems, materials and manufacture account for 71% to 79% of global warming impact, while O&M comprise between 9% and 16% of the global warming impacts. High-voltage direct current (HVDC) export cables, floating platforms, and composite blades are significant contributors to the environmental impacts of these arrays (by mass and material choice), while the contributions from ballast, vessel transportation emissions, and power-train components are lower. The results suggest that material efficiencies, circularity, and decarbonizing material supply inventories should be a priority for the Scottish floating wind sector, followed by minimizing vessel operations and the decarbonization of vessel propulsion, while avoiding burden shifting to other impact categories.

Graphical Abstract

1. Introduction

Electricity generation from floating offshore wind (FOW) turbines has a significant global potential [1] and is expected to make a major contribution to the electricity sector from around 2030 [2]. However, bottom-fixed offshore wind (BFOW) technologies currently make up 99.7% of all offshore wind installed capacity: in 2022, the global installed capacity of offshore wind was 64.3 GW, of which only 188 MW was floating [3].
In 2022, the UK was the second largest operator of offshore wind globally, with nearly a quarter of all operating capacity, after China with 46%. The UK offshore wind installed capacity of 13.7 GW delivered 45 TWh, or around 14% of all UK electricity generation in 2022 [4]. Of this, only 78 MW, or 0.6%, of the UK’s total offshore wind capacity is floating. While nascent, this is around 41% of all floating wind generation globally, making the UK the single largest operator of floating wind in 2022 [3].
All of these installed capacities are expected to grow significantly to achieve the UK’s climate targets: in 2022, the UK government stated its ambition to deploy up to 50 GW of offshore wind by 2030 [5]. For the UK, FOW is expected to be located primarily in the Celtic Sea and Scottish waters, at around 4.5 GW [6] and 7 GW, respectively. The ScotWind seabed leasing round is expected to achieve 10 GW of offshore wind around 2030, of which more than 70% (7 GW) may use FOW technologies [7], subject to ongoing commercial development.
In the UK, the Committee on Climate Change has identified that FOW could cut costs and improve the diversity of the UK’s energy mix by 2050, and so play a greater role in the power sector decarbonization [8]. FOW can be constructed in water depths that are cost-prohibitive for BFOW, increasing the spatial distribution of wind generation across the grid, and potentially reducing the variability of aggregate wind power generation. Furthermore, additional wind power is likely to further reduce the carbon intensity of power generation operating on the British grid [9], which stood at 182 gCO2/kWh in 2022 [10]. However, to avoid unintended burden shifting from climate change to other environmental impacts, the significant expansion of FOW installed capacity should merit a proportional interest in not just the operational emissions impacts, but the wider life cycle environmental impacts of these emerging technologies.

1.1. Methodology of Life Cycle Assessment

The environmental impacts of products and systems, including floating wind farms, can be quantified using life cycle assessment (LCA). LCA is a scientific method to address the use of resources, and the environmental consequences of releases, throughout a product’s life cycle—from raw material acquisition through production, use, end-of-life treatment, recycling, and final disposal [11].
Life cycle assessment is a relatively young discipline with its beginnings around 1970 in the United States [12]. Subsequent efforts emerged across Europe, undergoing a surge in interest in the late 1980s, codification in the early 1990s, and international standardization of the scientific method in the late 1990s [13]. Today, the methodology and applications continue to innovate and mature, with increasing numbers of publications annually in the last two decades [14]. Accordingly, LCA is now widely recognized and increasingly applied in diverse fields including industry, academia, and policy development [15].
The basic process of an LCA is to collate a material and process inventory of the product life cycle; represent the inventory using data selected from an appropriate environmental impact database; aggregate the flows of material and energy to and from the environment manually or automatically; and report the environmental impacts using pre-defined life cycle impact assessment (LCIA) algorithms (“Methods”). Specifically, however, the basic structure of a life cycle assessment according to internationally standardized LCA principles and framework (ISO 14040), and general requirements and guidelines (ISO 14044) [11,16], comprises four phases [13]:
  • Goal and scope definition: The goal definition is the first phase of an LCA study, which sets out the context of the LCA study and determines the purpose of the study in detail. The scope determines the specific technical terms, limits, and characteristics of the analysis to be executed.
  • Inventory analysis: In the second phase of an LCA study, a system model is constructed according to the requirements of the goal and scope definition [17]. This is the central phase of an LCA, the core activity of which is the development and collation of data on the physical (material and energy) flows which make up the life cycle model of the system in question [13]. An assessment of uncertainty can be initiated in this phase [13] and the output is the system Life Cycle Inventory (LCI) which is often cached within specialized LCA software using dedicated LCI databases, which contain the “building blocks” of the life cycle model that the LCA practitioner can draw upon.
  • Impact assessment: This phase transforms the LCI data of physical flows and inventories of the product system into environmental impacts via impact models and pathways (LCIA “Methods”), developed by environmental science [13]. The selected impact categories are defined in the study scope, which classifies and assigns a characterization factor to each physical flow, enabling aggregation of all contributing harms from diverse chemical species into a single score for a given impact category.
  • Interpretation: In the final phase, the LCA practitioner interprets the results of the assessment in accordance with the goal and scope. Often, an iterative approach is required to judge the appropriate robustness of the conclusions, and may include uncertainty or sensitivity assessments [17] to fully evaluate the findings.
Developing a life cycle model of an artefact as large and complicated as a floating wind farm requires a sound understanding of the manufacturing, installation, maintenance, decommissioning, and disposal processes, as well as a significant application of effort to obtain representative inventory data. This is particularly challenging for future technologies, where engineering judgement must be applied throughout the assessment, to determine the modelled level of detail and appropriateness of available data. This challenge can be mitigated by the appropriate use of uncertainty assessment and sensitivity studies as set out in the international standards [11,16].

1.2. Life Cycle Assessments of Floating Wind Technologies

The number of LCA studies for floating wind is not large. A literature review published in 2018 [18] collated 148 wind energy LCA studies, of which 32 were for offshore wind farms, and only 2 for floating wind—perhaps reflecting the relative maturity of these technologies. The authors of this study have identified ten floating wind LCA studies of interest [19,20,21,22,23,24,25,26,27,28] (Table 1). In general terms, life cycle models have tended to increase incrementally in representation and sophistication, particularly around different configurations of farm and floating substructure. The rated power of the turbines assessed is also increasing (broadly), as is the popularity of semi-submersible substructure designs, somewhat mirroring real-world technological trends. A key area of opportunity, however, remains around the representation of operation and maintenance, which has tended to be (understandably) represented by simple assumptions from the literature, apart from a recent exception [25].
Transparently condensing and communicating the high level of detail, assumptions, and references required to generate a life cycle model inventory is not trivial, and this can be further exacerbated by the proprietary nature (or technology readiness) of the turbine, cable, substation, and substructure technologies themselves, to say nothing of the commercially sensitive maintenance burdens. Accordingly, it can occasionally be difficult to fully interrogate the assumptions behind some of the literature. This, along with the differences in each practitioner’s style, model granularity, and the choice of life cycle impact assessment method, combine to make inter-study comparison difficult and potentially misleading. To combat this, considering multiple arrays within a single study can be insightful.
The studies identified here focus on a mix of hypothetical, planned, pre-constructed, and constructed sites, with array sizes ranging from a single turbine to 190 turbines, mostly in Europe and North America, with a single instance in China. A variety of floating substructure (platform) designs are considered, covering a range of water depths from 60 to 450 m in near-shore and distant offshore sites (3 to 230 km). For large arrays where substations are necessary, they are included, with examples of both floating and bottom-fixed jacket substructures. Where present, nearly all substation types utilize high-voltage alternating current (HVAC) designs, with only one example of a high-voltage direct current HVDC [28]. The capacity factor varies significantly from 23 to 54% across the studies, and this is the predominant method of energy calculation, with [24,25,28] augmenting this process using site-specific metocean data and, only in one example [25], linking this to a dedicated operations and maintenance (O&M) model to determine turbine availability. This is problematic given the inherently high sensitivity of the results to the functional unit of lifetime energy production, kWh [24], where assuming array availability and vessel impacts without a robust O&M model could lead to incomplete results.
The life cycle inventories also differ significantly. Component transportation (trucks and vessels) and manufacturing processes (for example, sandblasting, welding, and paint application) are variously present and modelled in different ways and levels of detail. The maintenance life cycle stage also varies significantly. Vessels (and helicopters) are represented by different processes, for example, per ton-kilometre (t.km) transportation of various vessel types, direct fuel consumption, or scaling existing transportation processes to represent appropriate vessels. The actual maintenance burden itself is typically modelled by assumptions from the literature or, most recently, utilizing dedicated O&M models.

1.3. Research Opportunities

There are several research opportunities for floating wind LCA, specifically: modelling turbines with rated power greater than 10 MW, with HVAC and HVDC architecture in arrays far from the grid connection; using site-specific wind resource data to assess annual energy production; incorporating dedicated O&M model outputs; including an assessment of uncertainty for foreground and background data; and modelling real-world, planned sites that are of interest to policymakers.
This study was completed in response to these opportunities, as an LCA of a 15 MW reference wind turbine, developed by the National Renewable Energy Laboratory (NREL) and the International Energy Agency (IEA). Here, these turbines have been considered as forming four very large floating wind farms, located in the ScotWind leasing round, using a mix of HVAC and HVDC transmission systems, using data from a dedicated O&M model, COMPASS [29]. The O&M modelling and other foreground data have been prepared with expert input from the Offshore Renewable Energy (ORE) Catapult in Glasgow, Scotland.

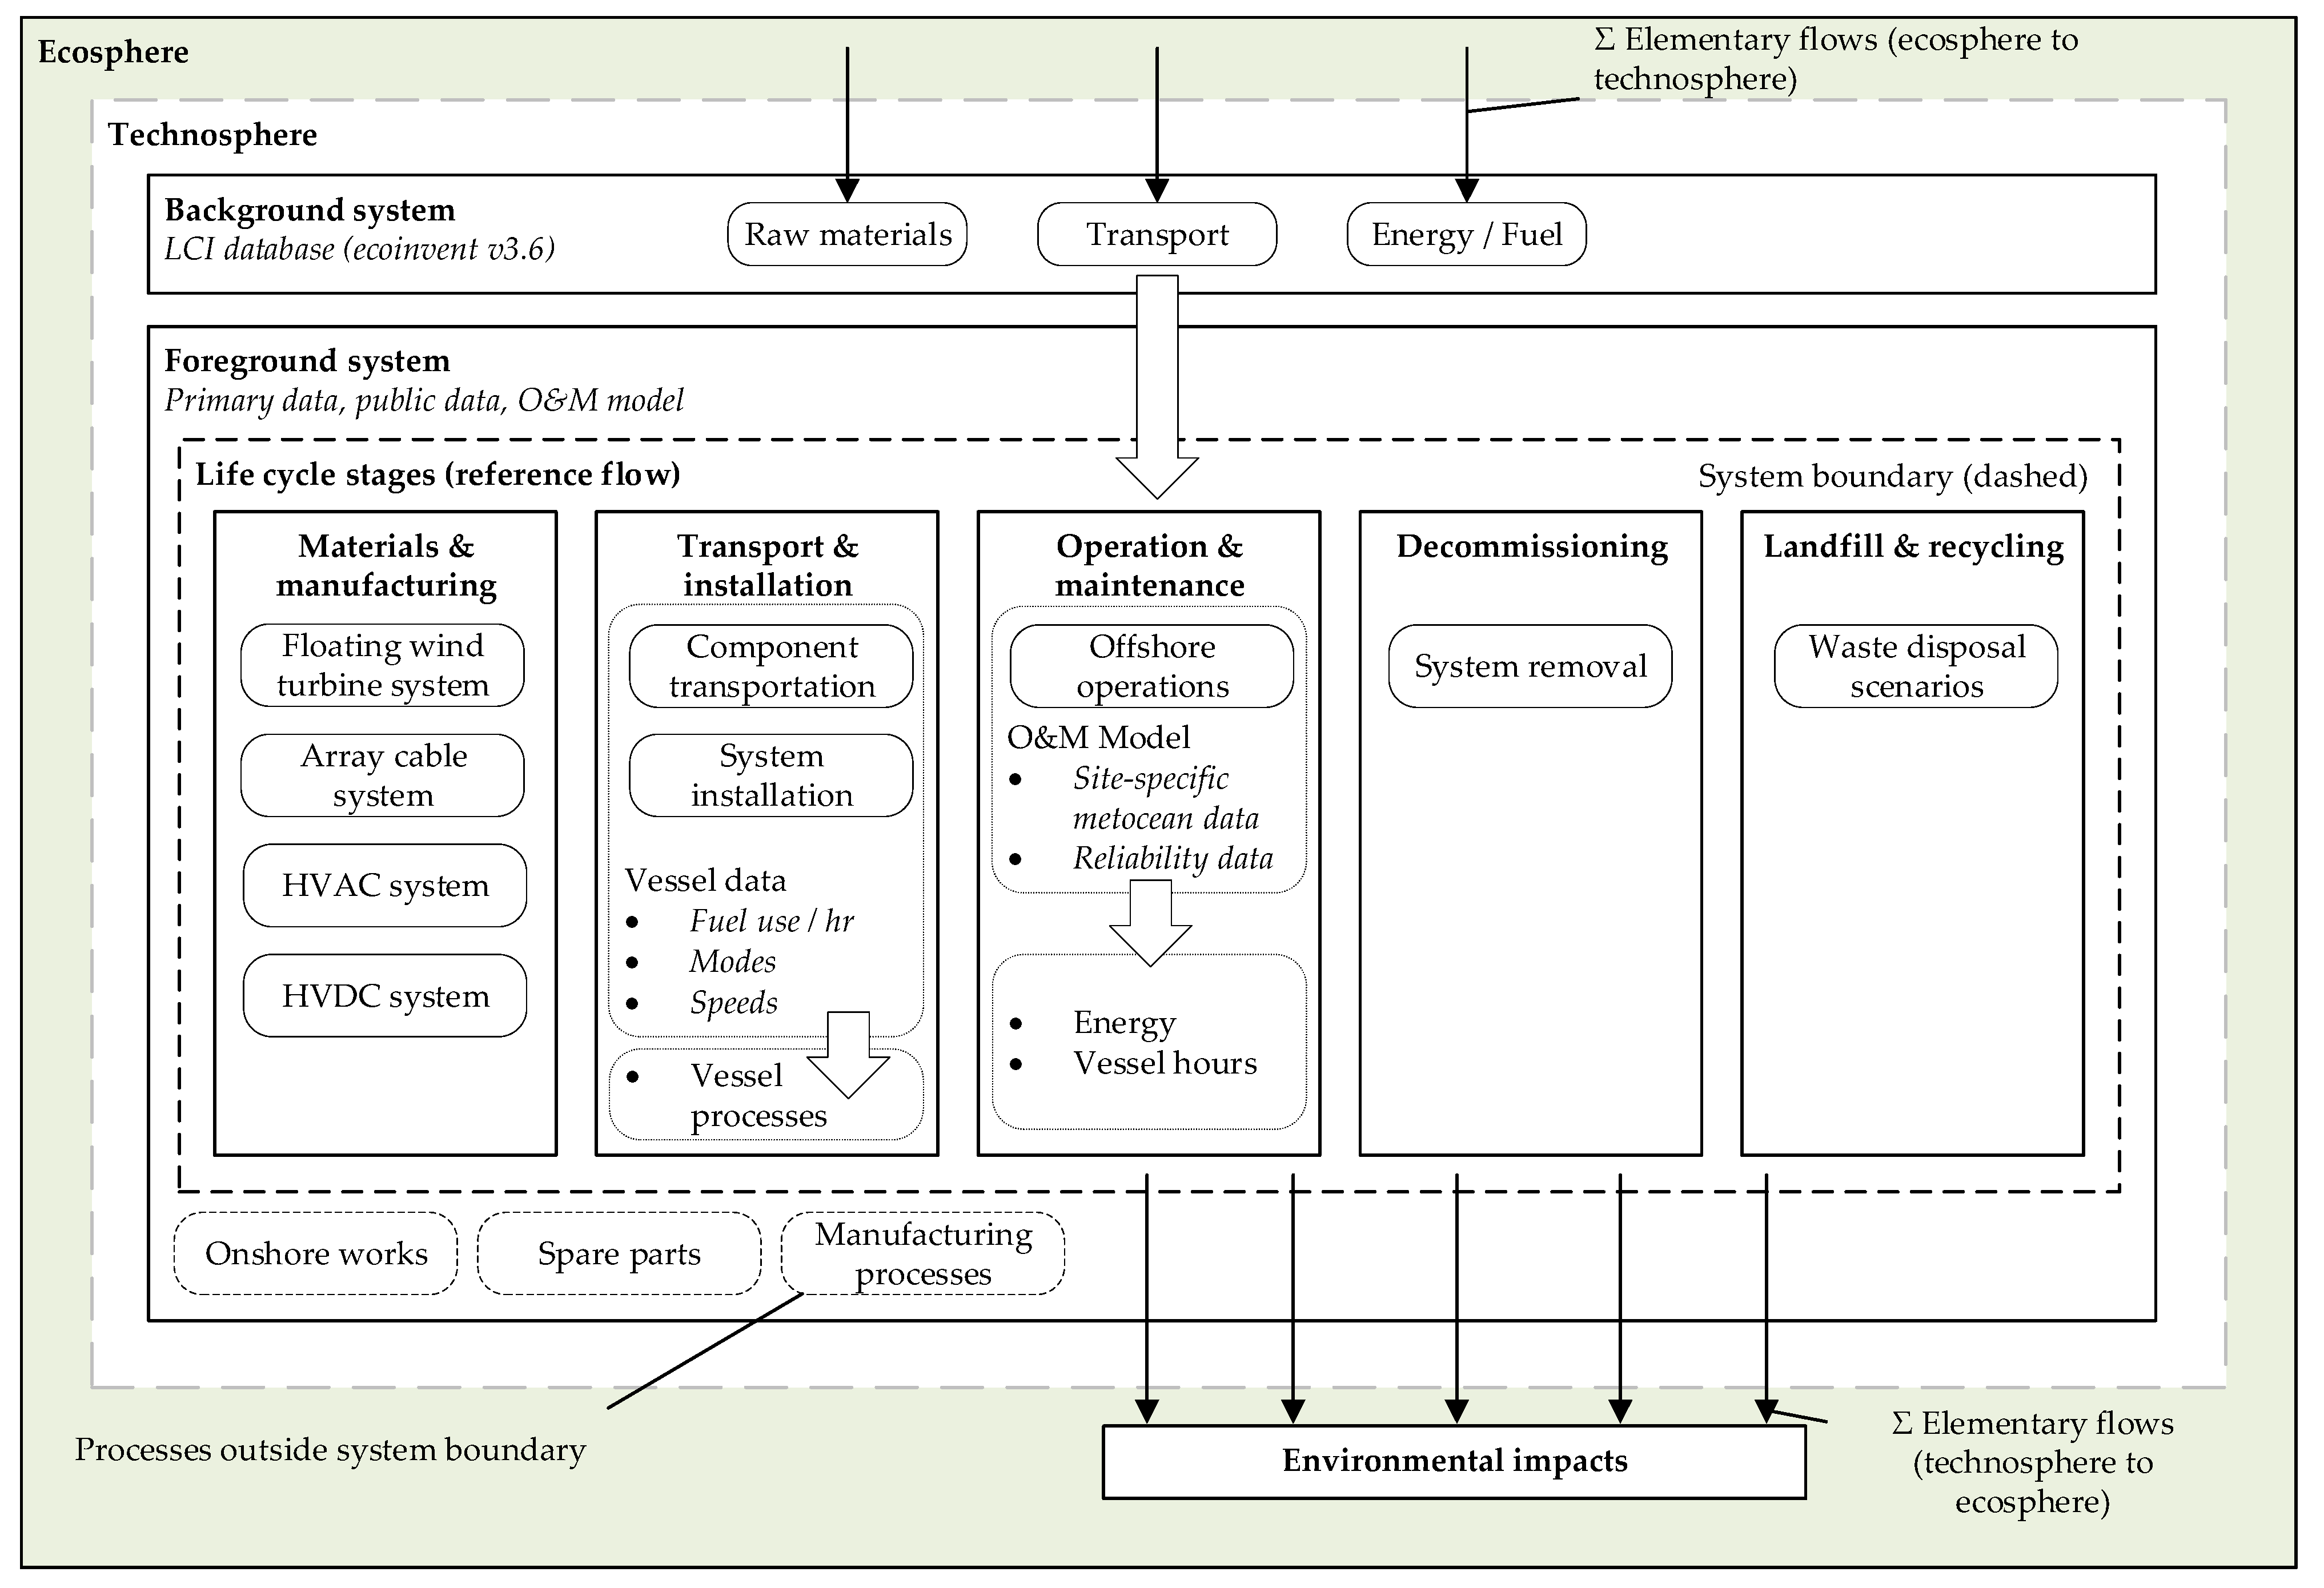
2. Materials and Methods

This section describes the methodology of the LCA procedure followed in this study, with complete details provided in the Supplementary Materials. This study uses an attributional, process-based LCA, employing SimaPro 9.1 software, with background data sourced from the ecoinvent database v3.6 [30]. As introduced in Section 1.1, the LCA procedure used in this study was aligned with internationally standardized LCA principles and framework (ISO 14040), and general requirements and guidelines (ISO 14044) [11,16], comprising goal and scope definition, inventory analysis, impact assessment, and interpretation.

2.1. Goal and Scope

The goals of this study were to (i) address the opportunities identified in the literature review and (ii) quantify the environmental impacts of multiple, real-world representative floating wind farms using site-specific metocean data, very large turbines, HVAC and HVDC architecture, and dedicated O&M modelling, including an assessment of foreground and background data uncertainty. The outputs of the study are intended for researchers, project developers, and policymakers.
The scope of the study is a cradle-to-grave, attributional LCA of the 15 MW reference wind turbine and platform from IEA and the University of Maine (Figure 1) in four representative sites from the ScotWind leasing round: East 3, North East 1, North East 7 and North 3 (E3, NE1, NE7, and N3). These sites were selected for their range of relevant characteristics: electrical export system design; distance to grid connection point; distance to operating ports; water depth; number of turbines; and metocean conditions. Note that these sites represent general wind farm designs only, not the specific, commercial designs under development [31]. Five life cycle stages were defined: materials and manufacturing (M&M); transport and installation (T&I); operation and maintenance (O&M); decommissioning and removal (D&R); and landfill and recycling (L&R).

2.1.1. System Boundary

Figure 2 shows a schematic of the cradle-to-grave life cycle model. The system boundary was set as the landward end of the offshore transmission system, creating the reference flow of a single, complete floating wind farm: all floating wind turbine units, array cables, HVAC collector stations, and HVDC converter stations, through its raw material acquisition, production, installation, design life, decommissioning, and recycling. Onshore works were not considered, nor were spare parts, detailed manufacturing processes, or minor components. Throughout, the cut-off criteria were based on the availability of representative data and acceptable granularity.

2.1.2. Allocation Approach

Allocation by the ‘Recycled Content’ or ‘Cut-off by classification’ system model was used, as recommended in the European Product Environmental Footprint guideline [13], where the recycling of waste material is outside the system boundary. Thus, recycling impacts are only included for input materials; no credits are applied to the environmental impacts.

2.1.3. Functional Unit

The functional unit for this study was selected as a kilowatt hour (kWh) of electricity supplied to the grid. The energy production was determined using site-specific wind data and the array availability computed by COMPASS.

2.2. Inventory Analysis

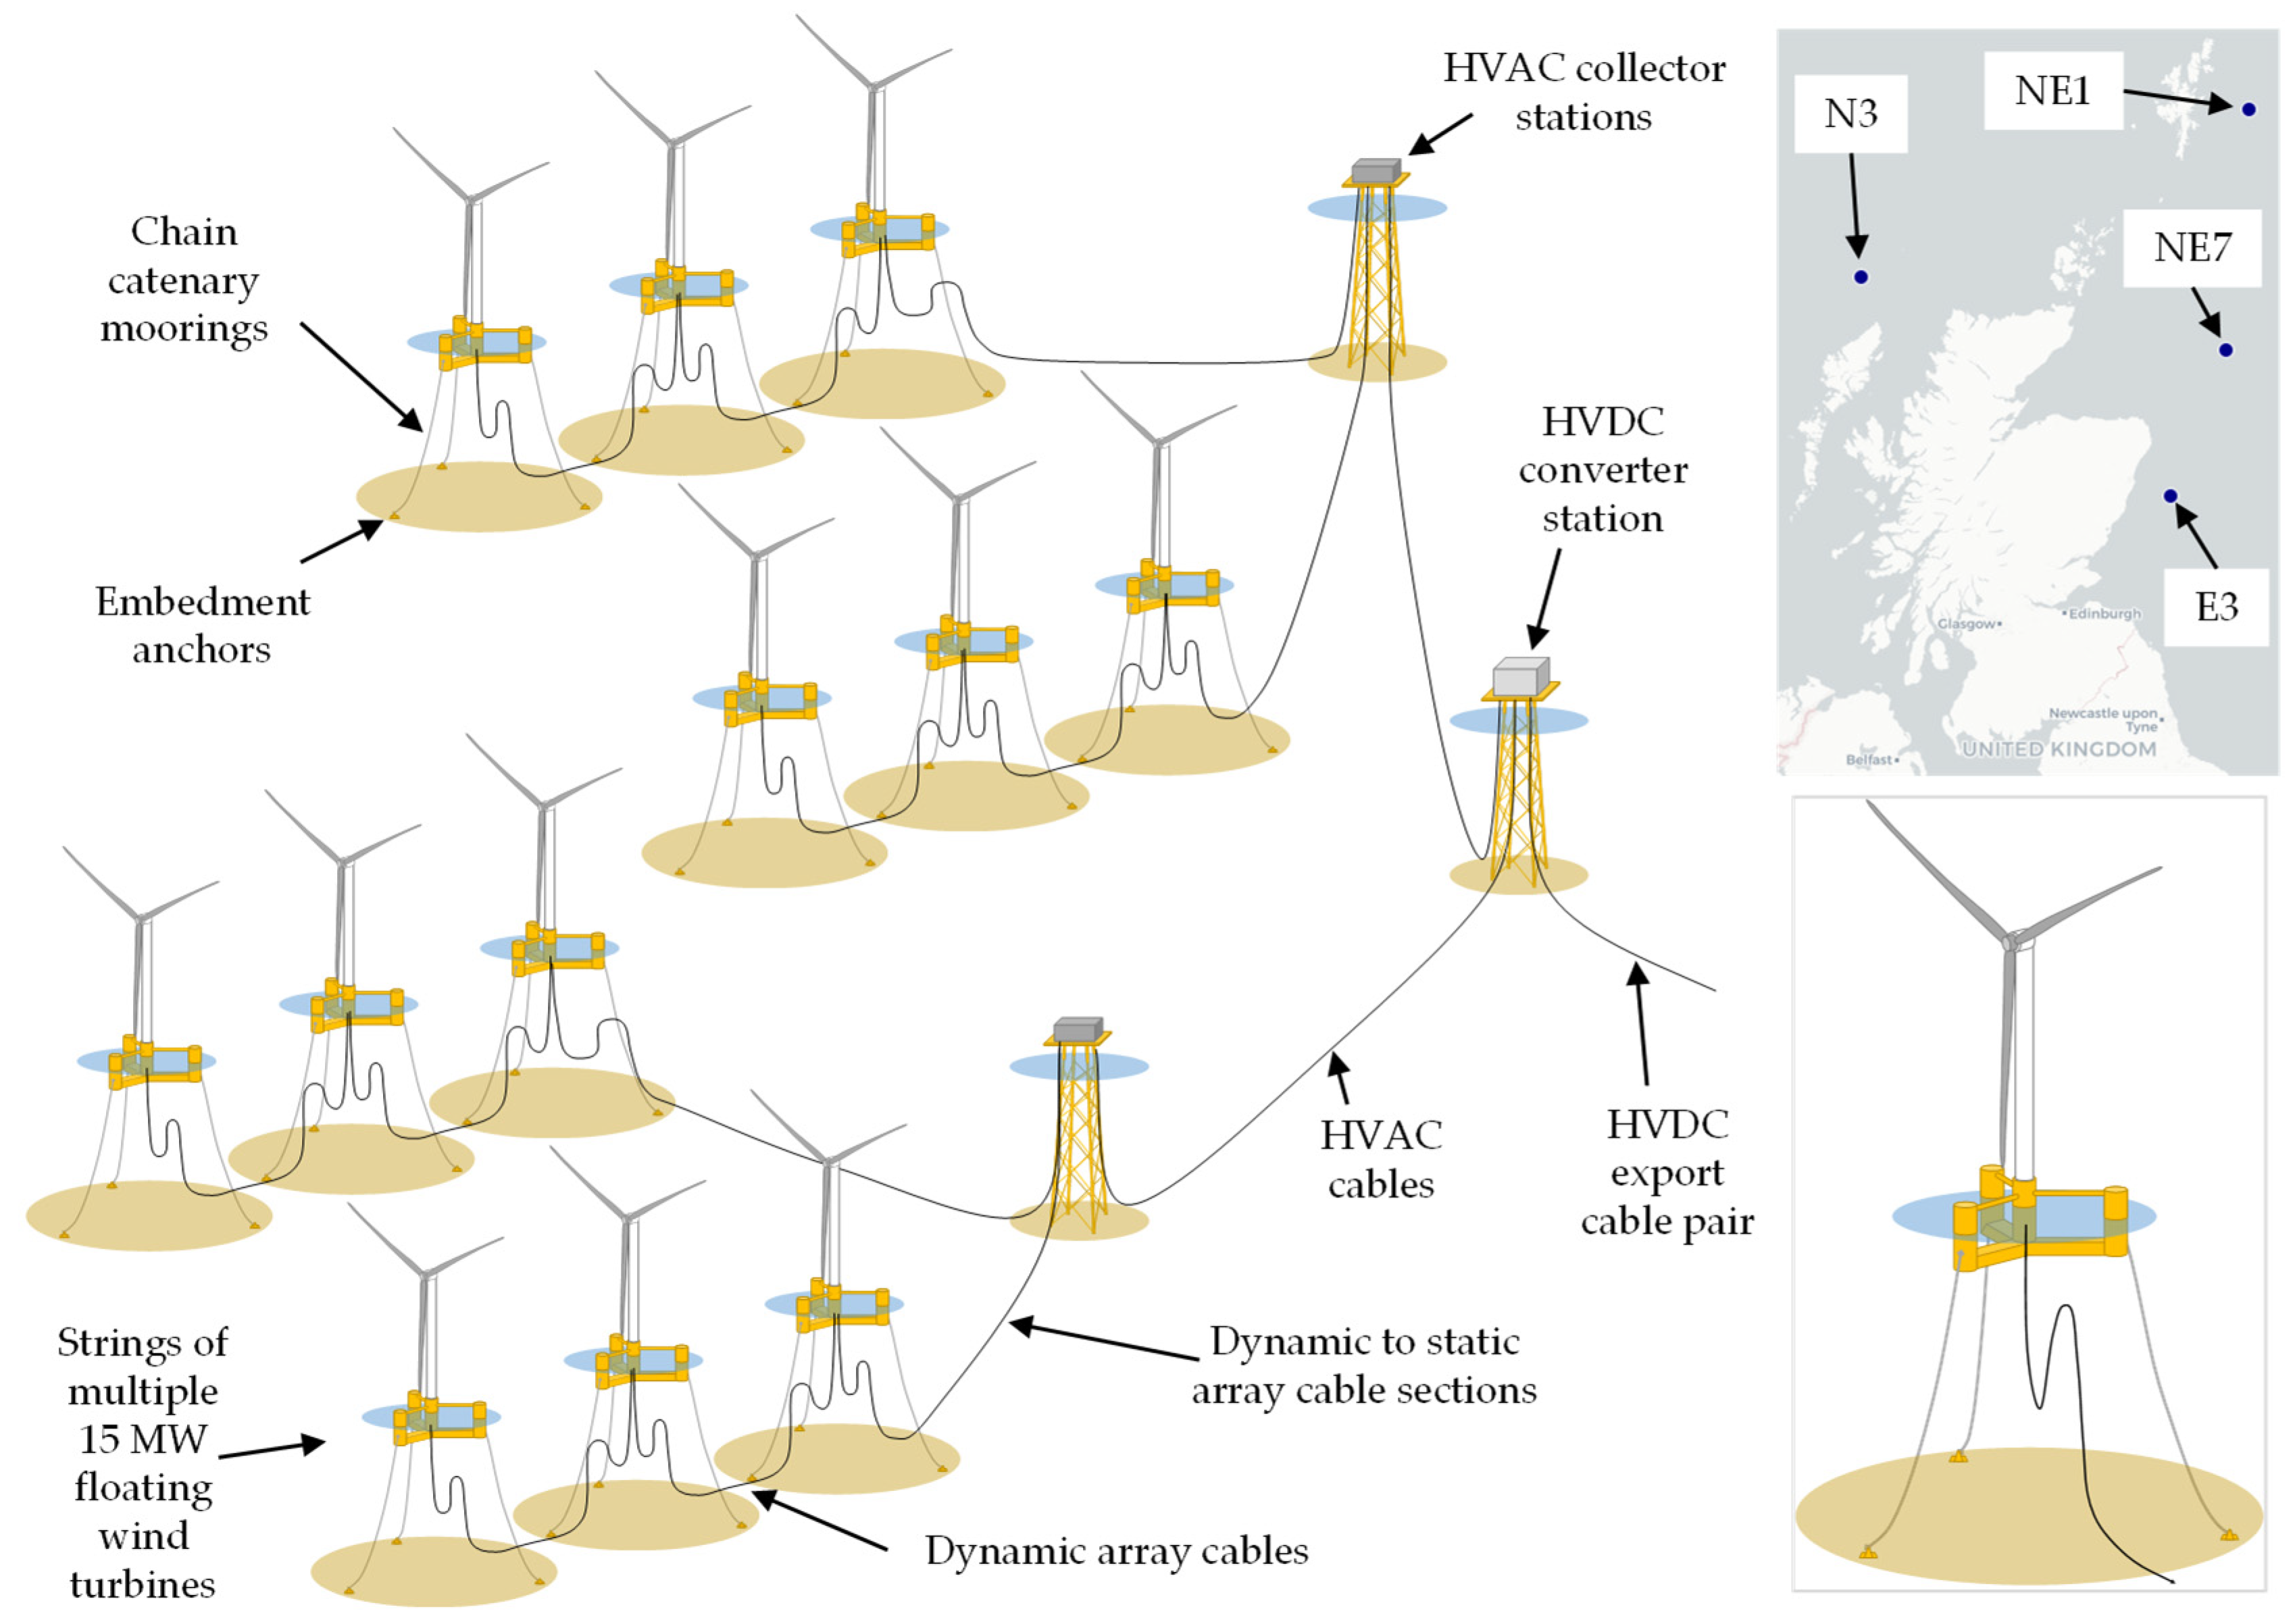
2.2.1. Site Parameters

Parameters were developed to represent the four floating wind farms using expert input and in-house models from ORE Catapult and publicly available data. E3 is the shallowest site, with a 40 km export route, and with the lowest installed capacity, using an HVAC export system. NE1 is located 48 km east of Lerwick, in deep water, east of Shetland, with a HVDC system. NE7 is defined as 3 GW in 110 m with an HVDC system. N3 is the largest site considered (3.3 GW) and in the deepest water, with an HVDC system. However, these data is are aggregated from a number of sources and do not precisely represent the commercial project awards announced in January 2022 [31]. Further, the scale of port activities assumed at certain locations (for example, Methil) would require development of the existing infrastructure. Full inventory data and assumptions for each site are provided in the Supplementary Materials.

2.2.2. Systematic Breakdown Structure

Each floating wind farm reference flow was divided into four primary systems: the floating wind turbine unit (turbine, floating platform, and moorings); the array cable system (all dynamic and static sections); the HVAC collector station system and HVDC converter station system (both comprising a station topside, jacket substructure, pile foundations, and transmission cables, albeit with different bodily properties).

2.2.3. Vessel Representation

The transportation, installation, and decommissioning of each system, subsystem, assembly, or component by vessel were modelled explicitly in each life cycle stage, where required. Hours of vessel use were modelled in SimaPro using simple, parameterized equations which included vessel type, speed, operating mode, and site/port locations. The ecoinvent database does not contain processes representing the fleet required throughout the floating wind farm life cycle so an appropriate process within ecoinvent was modified to emulate representative vessels. Representative vessel types were informed by input from ORE Catapult and the COMPASS O&M model. By obtaining fuel consumption data for each vessel mode, the process ‘Diesel, burned in fishing vessel GLO—diesel, burned in fishing vessel—Cut-off, U’ (MJ) was scaled by inspection of diesel density (kg/m3), specific energy (kg/MJ), and volumetric fuel consumption (l/hr), converting the process to represent hours of vessel operation. In this way, the study included anchor handling tug supply (AHTS) vessels, tugs, high-speed heavy cargo vessels (HSHCVs), semi-submersible heavy cargo vessels (SSHCVs), crane vessels, cable lay vessels (CLVs), offshore subsea construction vessels (OSCVs), and service operation vessels (SOVs).

2.2.4. Materials and Manufacture (M&M)

The inventory for the floating wind turbine unit (FWTU) was taken from primary data [32,35], with mooring length calculations performed by engineers at ORE Catapult. The reference wind turbine is a Class IB direct-drive machine, with a rotor diameter of 240 m and a hub height of 150 m. The blade composition, array cable lengths, cable compositions, and HVAC collector station and HVDC converter station properties were similarly provided by ORE Catapult data and modelling. Electrical equipment was represented where appropriate using Environmental Product Declarations. Allowances for material transport and energy use are provided by the unit processes in ecoinvent, in accordance with the study scope and in line with the approach in [20,26,27,28].

2.2.5. Transport and Installation (T&I)

The hours of vessel use for the transportation of major components were modelled directly in SimaPro using simple, parameterized equations to represent the site-specific distances travelled during transport and installation. The distances travelled by each vessel were developed using historical floating wind projects as examples, current and future supply chains, local content, and site capabilities. For every journey, an appropriate vessel was selected, using the scaled vessel processes created for this study.

2.2.6. Operation and Maintenance (O&M)

O&M has been identified as an important life cycle stage affecting the environmental impacts of floating wind farms [25]. Each site was modelled using the COMPASS O&M model to determine hours of SOV use, and overall array annual energy production (AEP), based on site-specific wind resource and weather windows. In addition, the industrial literature was reviewed to input other array-scale vessel interventions: 0.0205 maintenance interventions per turbine per year by crane vessel (1.4 days for ‘Vessel for replacement of large parts (jack up) (O&M)’ and 0.2 days for ‘Jack-up for replacement of heavy components (O&M)’ for 78 turbines; (1.4 + 0.2)/78 = 0.0205 days, where each day is 24 h) [36] and cable servicing at 1 km per hour, every 2 years using an OSCV [23].

2.2.7. Decommissioning and Removal (D&R)

Decommissioning and removal were modelled as the reverse of installation but with the transportation of the disassembled subsystems removed on the basis of the high uncertainty around disposal location. Cable laying and pile removal operations were omitted to represent cable abandonment and pile cutting at the end of life.

2.2.8. Landfill and Recycling (L&R)

A recycling rate of 90% was assumed for steel [21,25,37], copper, and plastic [38]. Any waste streams remaining after separation were variously recycled, incinerated, or sent to landfill as per the ecoinvent process ‘Waste (waste scenario) {ENG}|treatment of waste|Cut-off, U’.

2.3. Data Quality

To enable the goal and scope of the LCA to be met, data quality was addressed in accordance with international standards [11]. Data quality was addressed as follows:
  • Time-related coverage: assessed in Supplementary Materials under additional uncertainty data quality indicators.
  • Geographical coverage: as above.
  • Technology coverage: as above.
  • Precision: Data sourced directly from the reference wind turbine and platform definition literature are assumed to be precise, although the turbine is by definition a generic design, and thus not completely representative of a real-world, commercially designed machine. ORE Catapult data are assumed to be similarly precise.
  • Completeness: the authors assess that the primary, public and industrial partner data result in an acceptably complete representation of the sites of interest.
  • Representativeness: qualitatively assessed by the authors that the data do reflect the true population of interest.
  • Consistency: qualitatively assessed by the authors that the study methodology is applied uniformly to the various components of the analysis.
  • Reproducibility: qualitatively assessed by the authors that the data presented in the Supplementary Materials would allow an independent practitioner to reproduce the result reported in this study.
  • Sources of the data: provided in the Supplementary Materials.
  • Uncertainty of the information: assessed for foreground and background systems [39].
All input data, assumptions, and uncertainty estimates developed according to the pedigree matrix method set out in the ecoinvent data quality guidelines [39] are detailed in the Supplementary Materials.

2.4. Life Cycle Impact Assessment

Two life cycle impact assessment (LCIA) methods were used: the multi-criteria ReCiPe 2016 v1.1, midpoint method, Hierarchist version with global normalization, and the single-criterion Cumulative Energy Demand (CED) v1.11. ReCiPe computes 18 impact categories, providing a detailed picture of environmental impacts. CED calculates the embodied energy of the arrays. Both were selected to broadly align with similar, recent studies [25].

2.5. Interpretation

The environmental impacts are assessed with reference to the functional unit of 1 kWh electricity produced. Median values within a 95% confidence interval are reported here using a Monte Carlo uncertainty analysis of the foreground and background data (SimaPro 9.1 default settings: 1000 step, 0.005 stop factor). The results are not compared to ecoinvent processes of other generation technologies directly due to the inevitable, inherent methodological differences. The four sites are, however, compared to each other, assuming (reasonably) that the methodological differences between sites within this work are negligible. The contributions from each life cycle stage and the sensitivity of the results to key site parameters are considered for all impact categories. The main opportunities to mitigate global warming impacts are identified and discussed. The results are discussed in relation to perspectives from the literature and contextualized by comparison to two unit processes of British electricity.

2.6. Operation and Maintenance Model: COMPASS

COMPASS is a strategic O&M simulation tool which can model the full lifetime of a wind farm and estimate key performance indicators associated with its operation [29]. The energy production used in the environmental impact calculation is taken from the availability modelling from COMPASS.

3. Results and Discussion

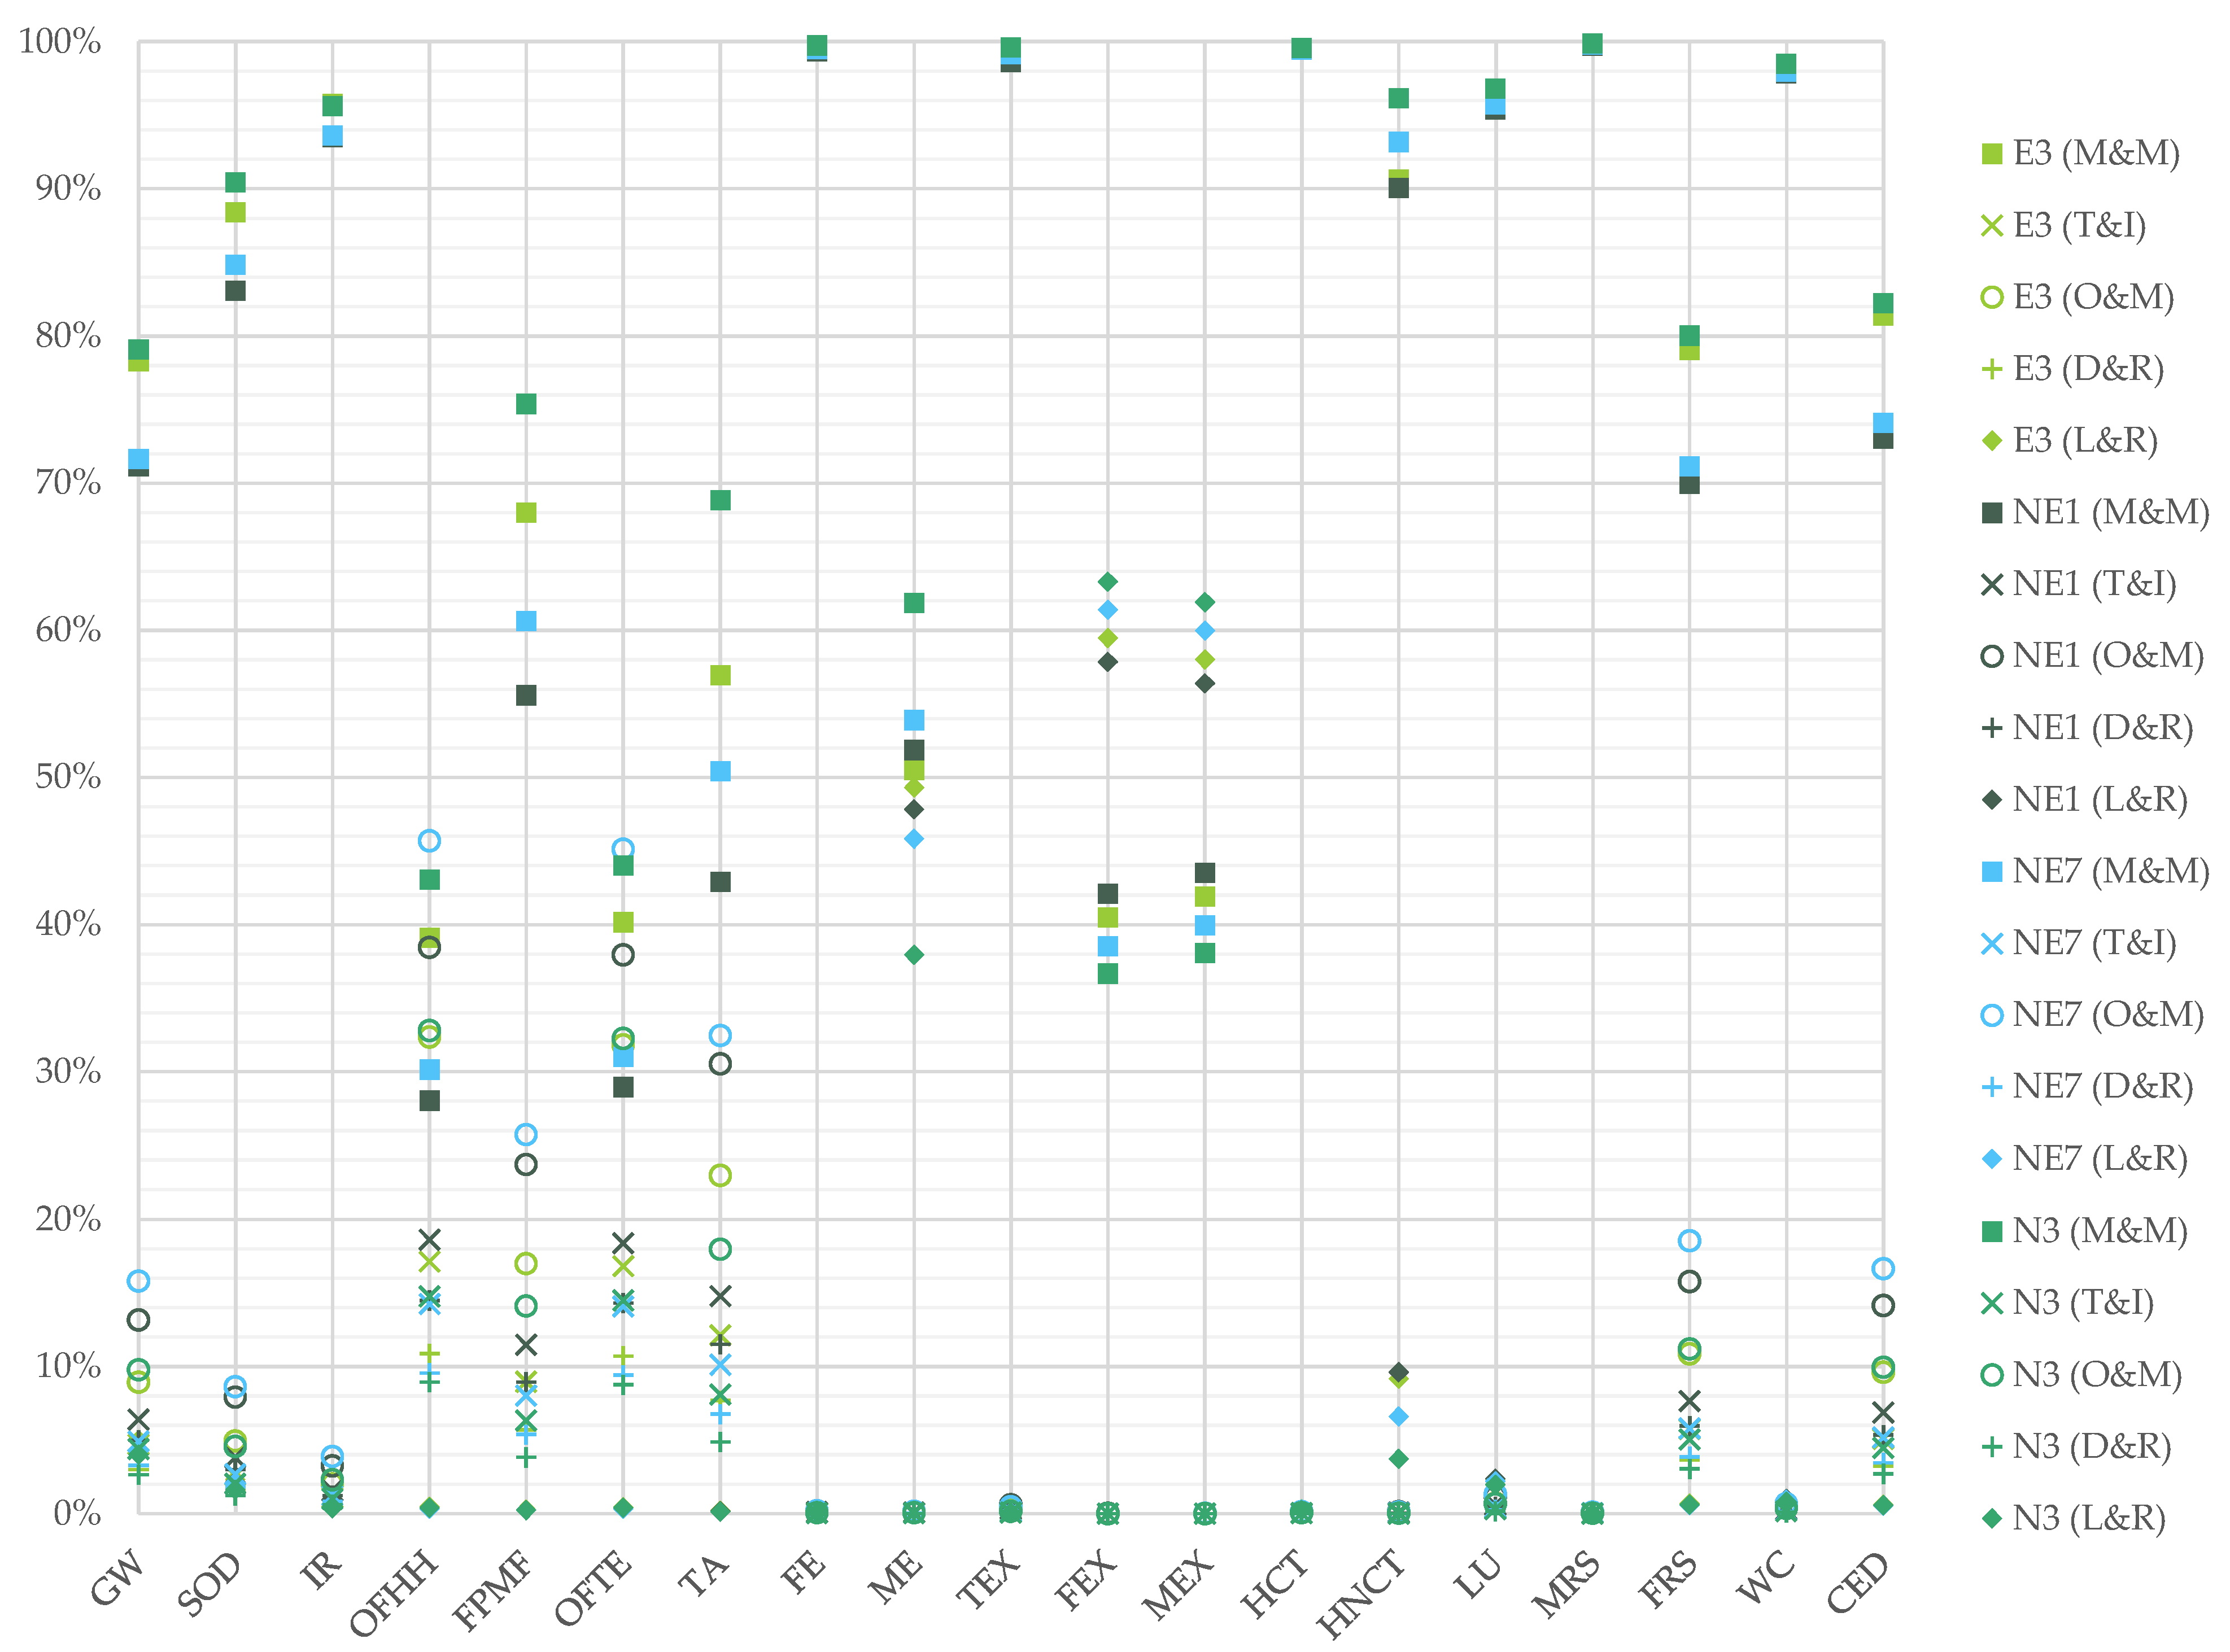
3.1. Default Uncertainty Results for All Four Sites

In accordance with the goal and scope of this study, the inventory analysis was developed with an assessment of basic and additional uncertainty according to [39], enabling the results to be reported as a median value within a 95% confidence interval (Table 2).
The median results show that E3 was typically the site with the lowest environmental impacts, despite having the lowest turbine AEP. The vessel travelling distances for E3, in almost every case, were the shortest of all the sites, and the site has no HVDC transmission equipment (reducing its material requirements). It also has the lowest total SOV usage time. In contrast, site N3 has the highest impact in every category, driven by its remoteness from port facilities, HVDC system, and relatively low turbine AEP. The uncertainty across the four sites is typically within an order of magnitude, but not for all categories; ionising radiation (IR) and water consumption (WC) show the largest uncertainty. WC is so uncertain as to vary from environmental harm (positive impact) to environmental benefit (negative impact), as noted in other studies [25]. The median global warming (GW) impacts and 95% confidence interval for the E3, NE1, NE7, and N3 sites were 17.4 (13.0–23.6), 20.0 (14.9–27.8), 20.5 (15.4–28.2), and 26.3 (20.2–35.4) gCO2eq/kWh, respectively.

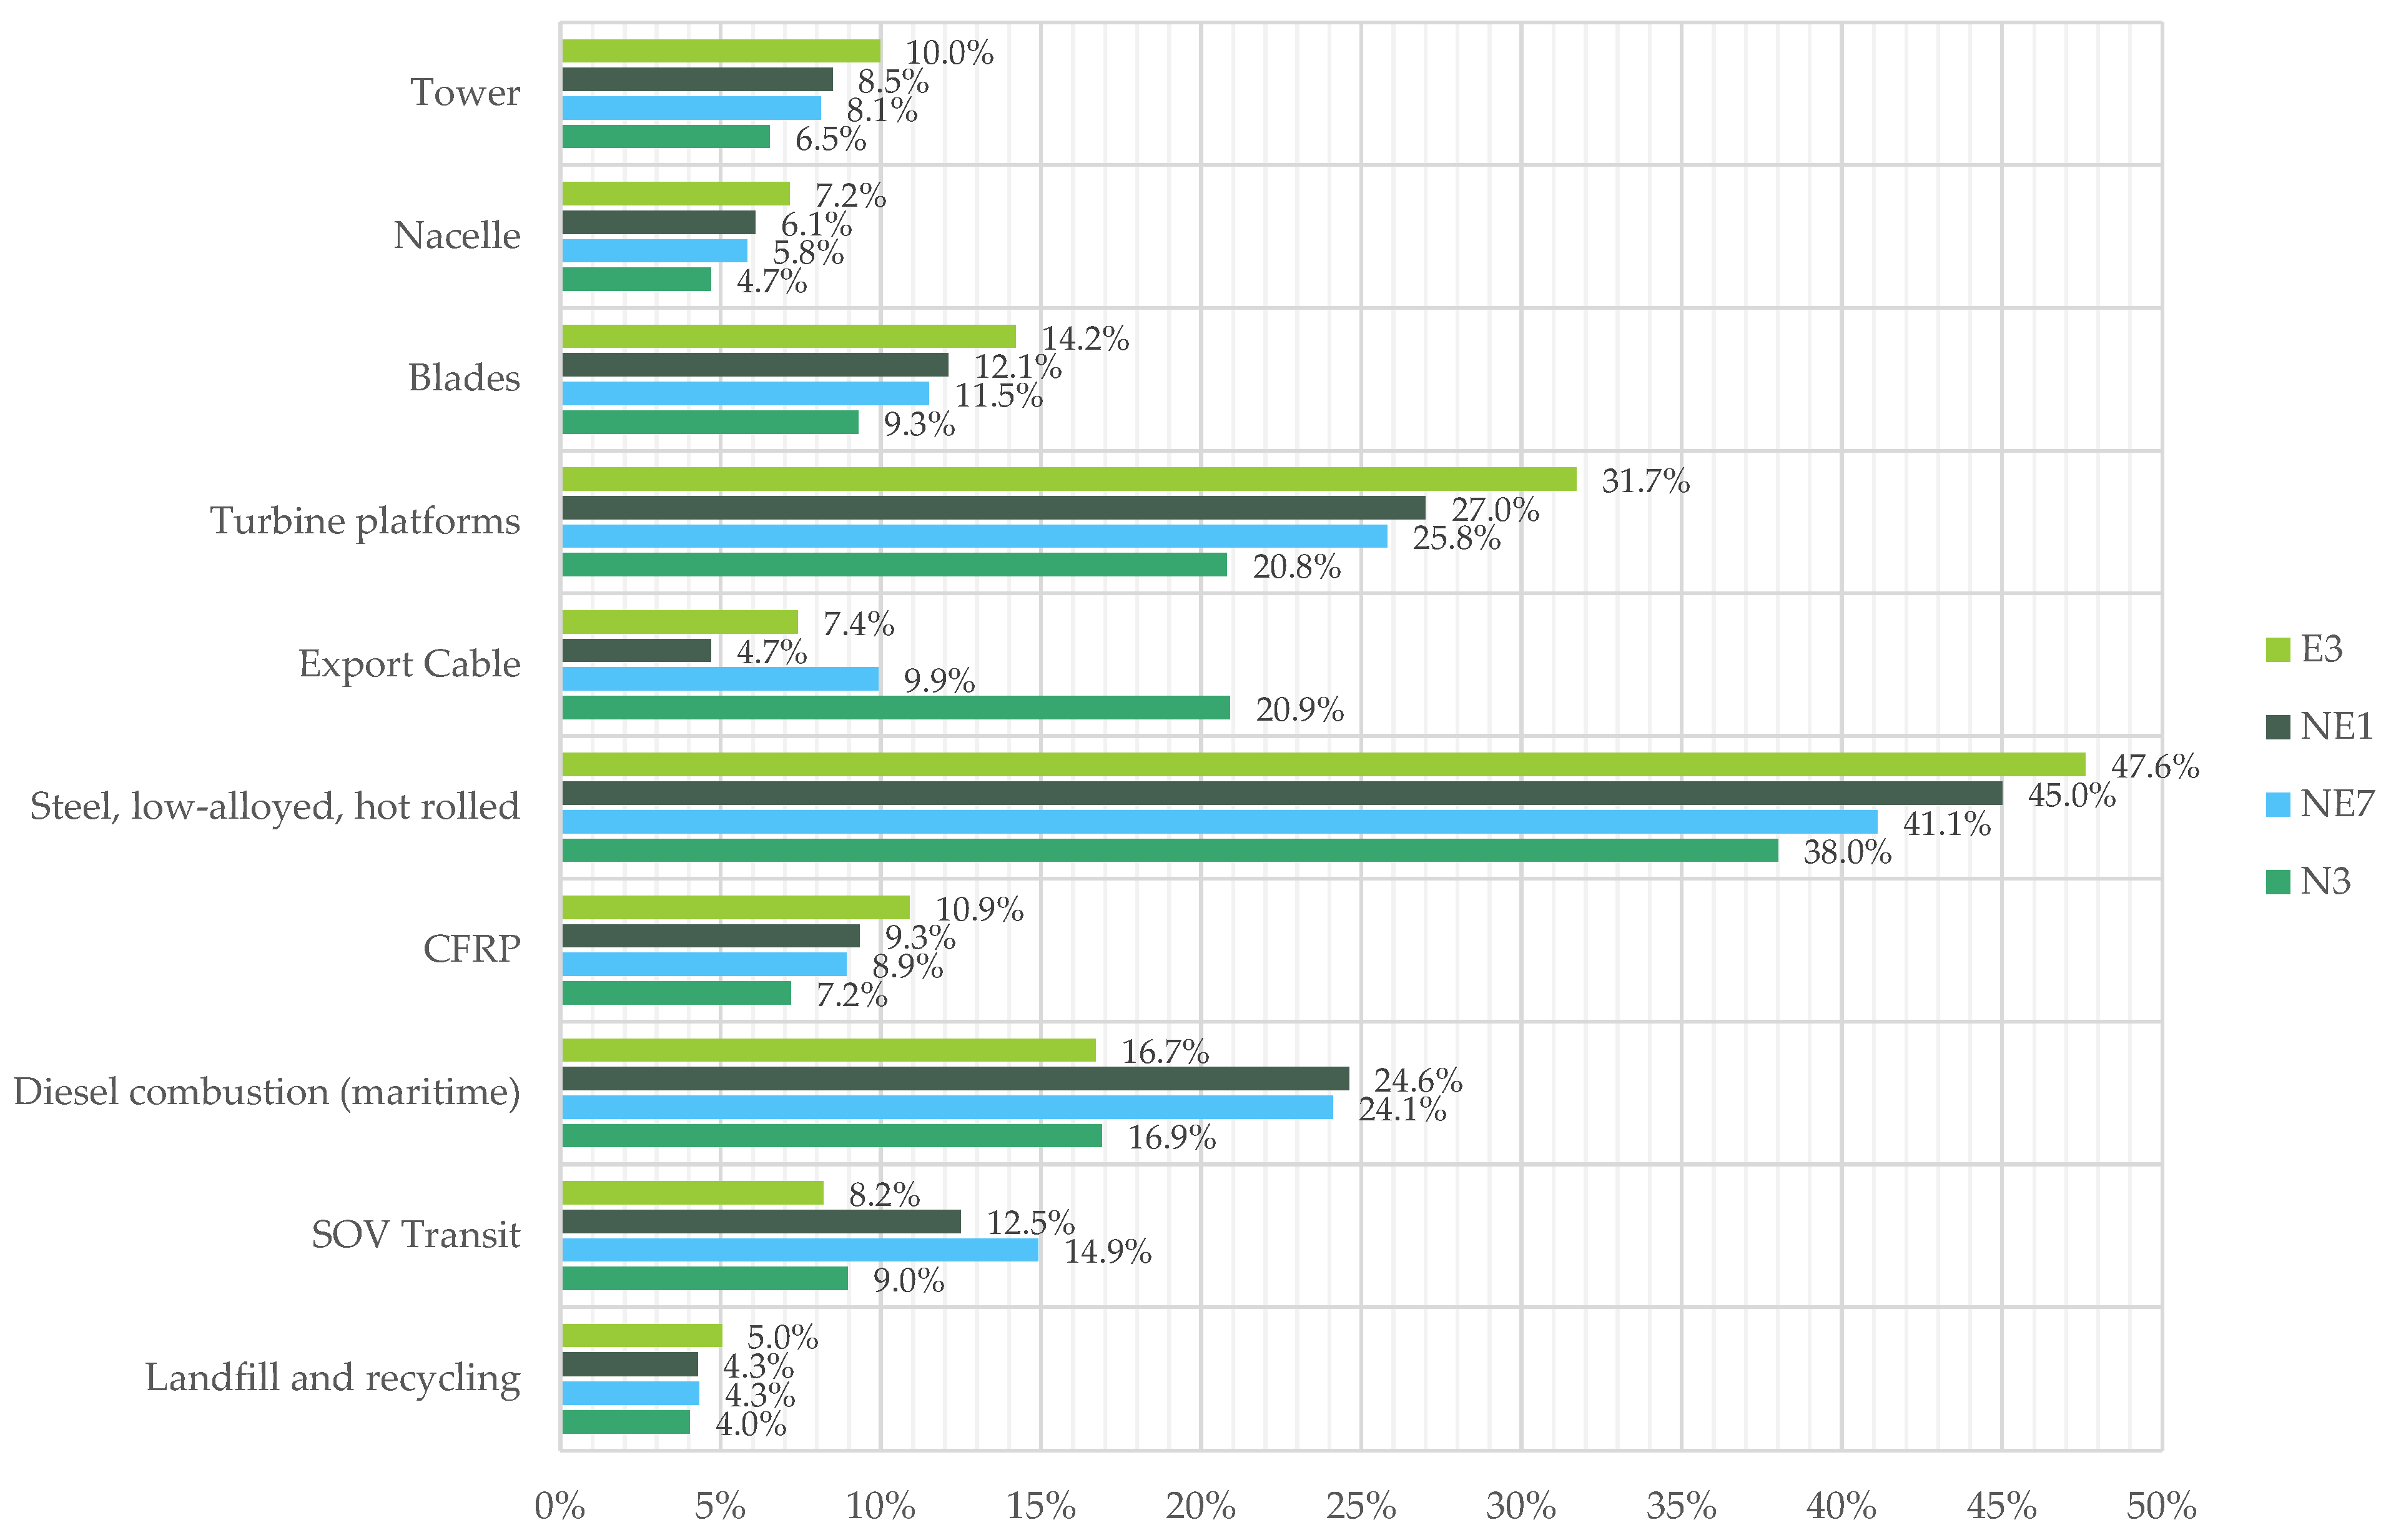
3.2. Contributions from Life Cycle Stages, Processes, and Components

As with other studies in the literature [19,20,21,22,23,24,25,26,27,28], life cycle impacts are dominated by the materials and manufacturing life cycle stage. For the four sites considered, the materials and manufacturing account for 71% to 79% of the global warming impact (Figure 3). O&M is commonly the second most impactful across the impact categories, with L&R dominating in the freshwater and marine ecotoxicity metrics. Component-wise, the most massive typically have the highest impact, including wind turbine platforms and other massive steel components such as the nacelle housing and turbine tower. The carbon-fibre-reinforced plastic (CFRP) of the turbine blades is also prominent due to its high primary energy requirement (heat and electricity). Relative to site N3, the environmental impacts of E3 are lower due to its proximity to the grid connection point and the HVAC export system design. For N3, the very long HVDC cables (connecting the farm in the east of Shetland to the GB grid at Dounreay) dominate these selected impacts. Each impact category is driven by different processes; for example, for GW, LU, MRS, and CED the most influential are steel, copper, lead, and polyethylene. O&M is significant for a number of impact categories (OFHH, FPMF, OFTE, TA, FRS, CED, and GW). For GW, this ranges from 9% to 16% (with distant sites showing higher impacts); however, this is not as significant as in a recent study [25]. This is possibly due to the optimization of turbine availability (and hence, AEP) in COMPASS and the use of in-field SOVs for a broad range of interventions (dramatically reducing the number of vessel transit journeys to the site relative to port-based crew transfer vessels, CTVs), as well as the influence of array-scale components in this study. The contributions to global warming are examined in more detail in Section 3.4 for each site.

3.3. Sensitivity Analysis

3.3.1. Lifetime Energy Production

Due to the functional unit, the environmental impacts will always scale in inverse proportion to the lifetime energy production [24]. This applies to many common parameters of interest: availability, capacity factor, and turbine AEP, obviating the requirement to include these in a sensitivity study. Extending the design life will also have an impact, but this would not be a pure inverse relationship due to the increased annual requirement for O&M, as described below.

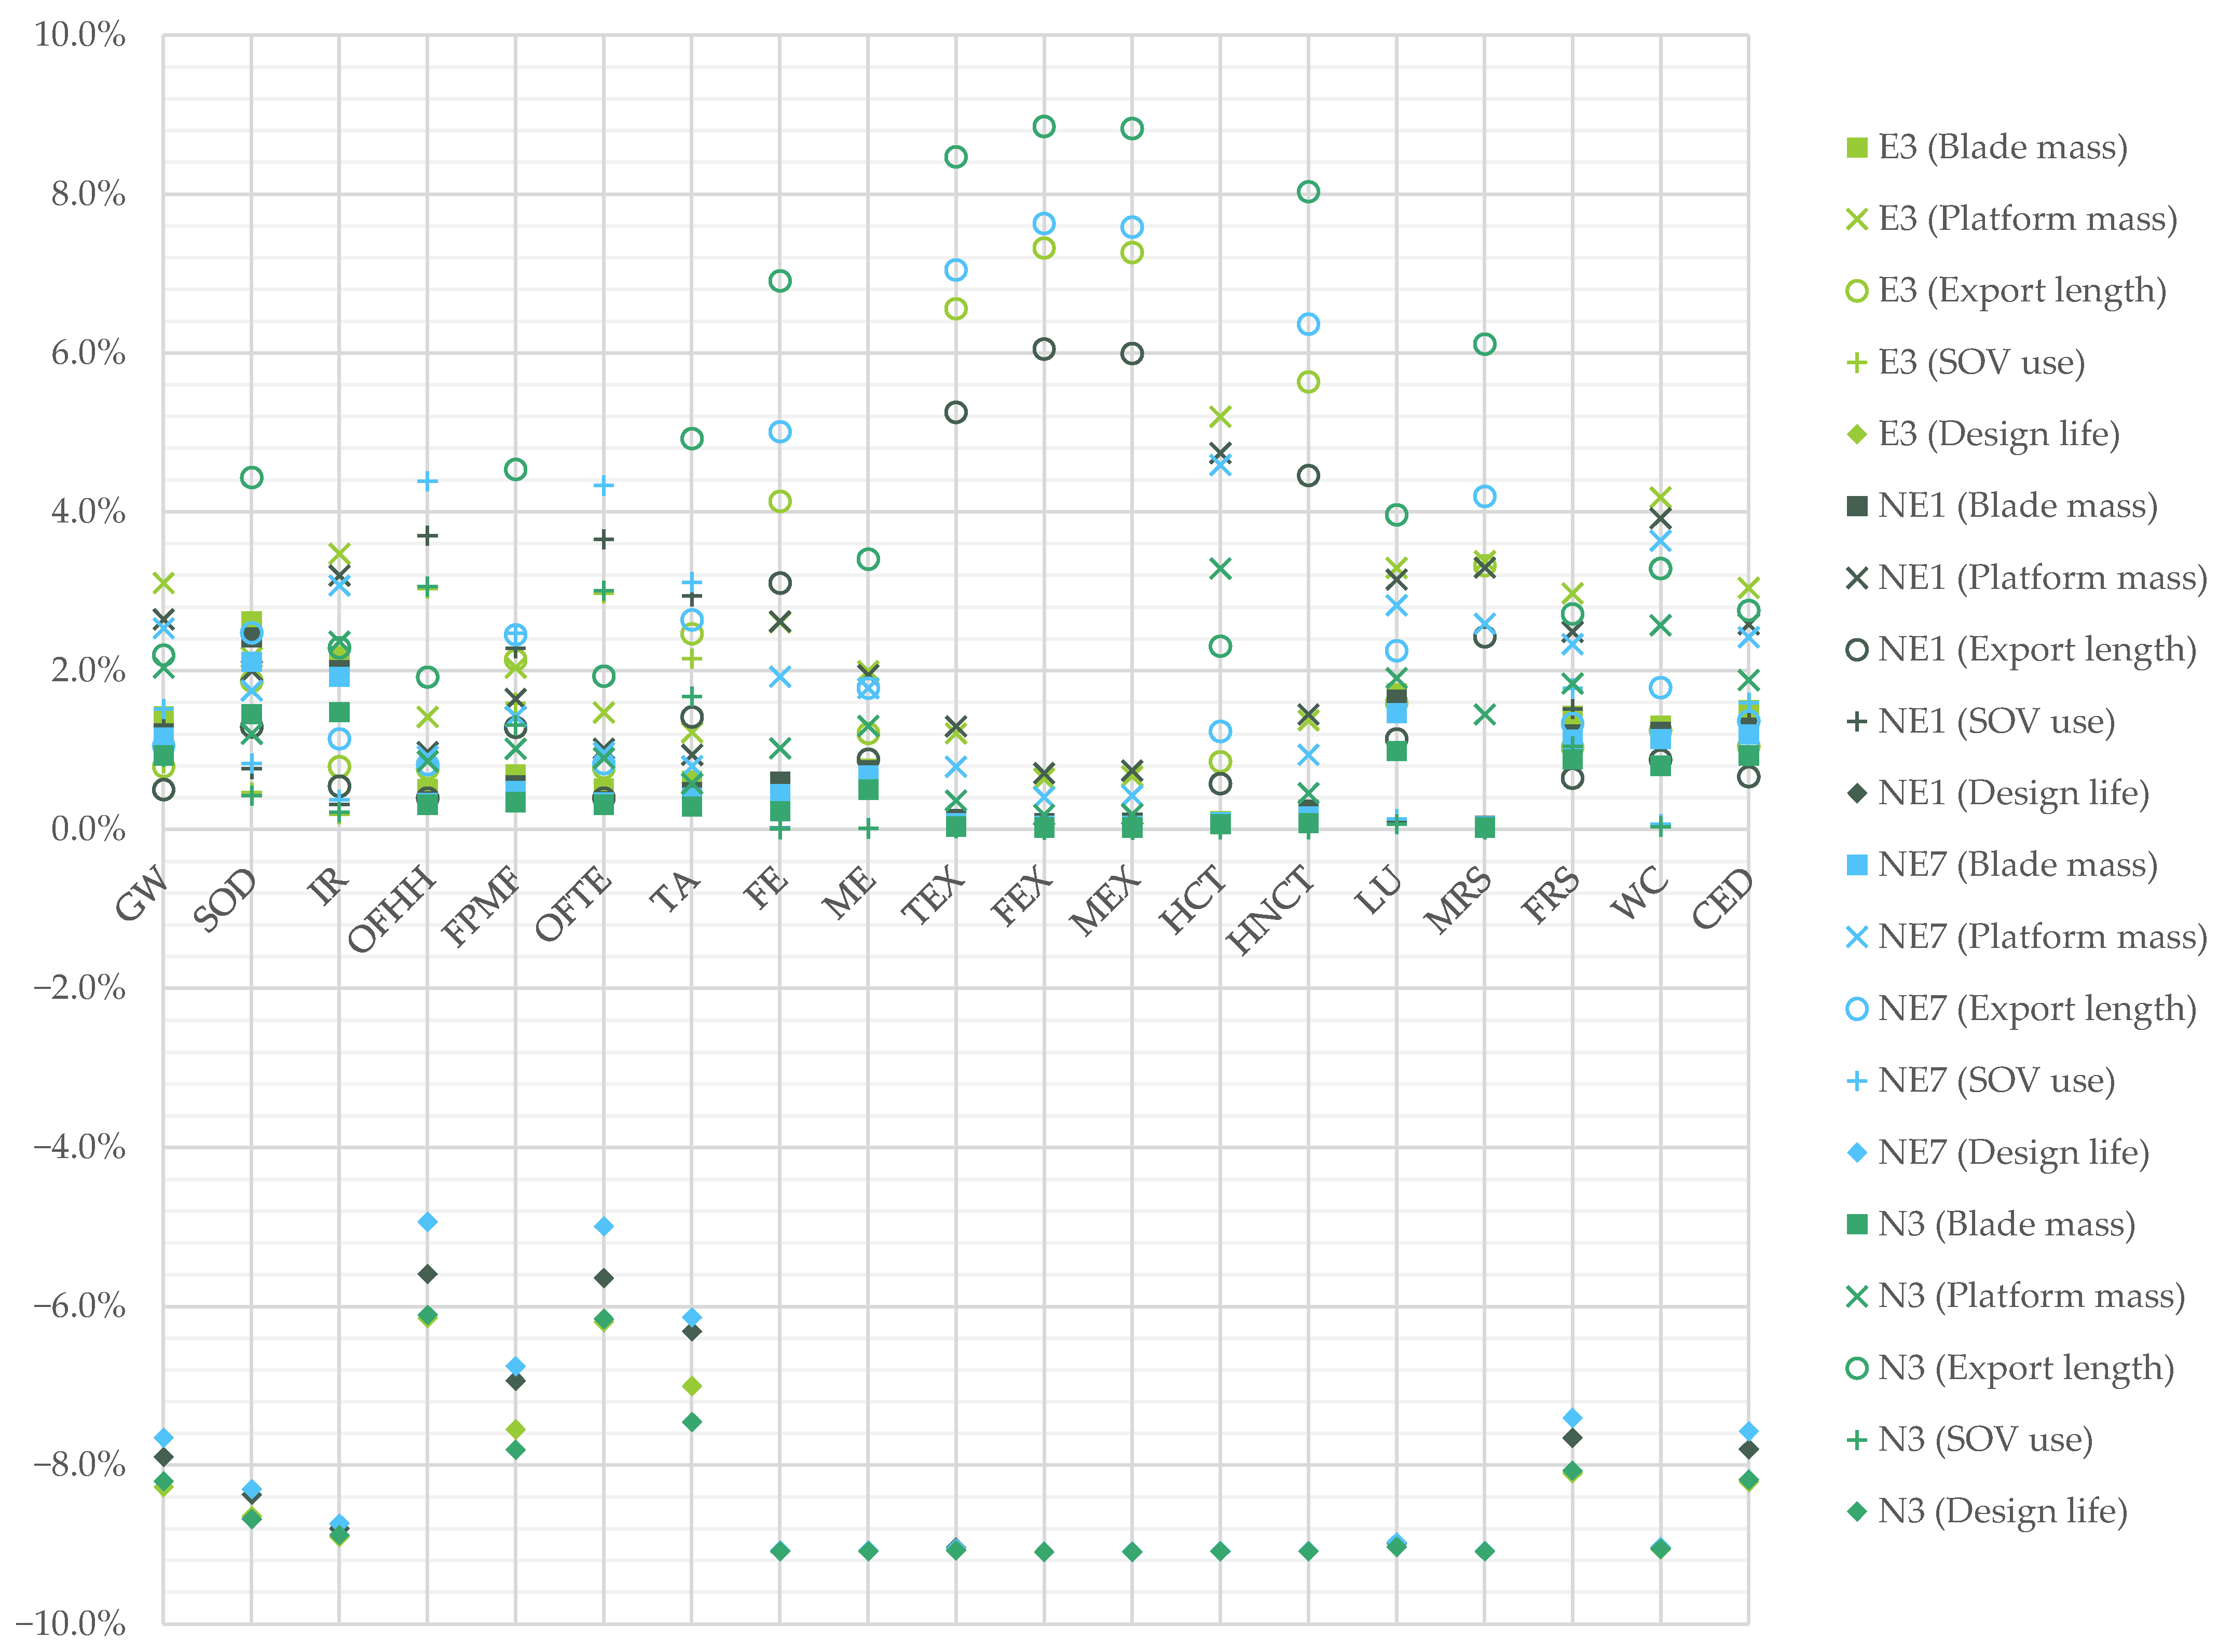
3.3.2. Site and Engineering Design Parameters

The life cycle impact category results were reviewed for their sensitivity to site and engineering design parameters, which can be somewhat controlled during development. Five relevant parameters were identified: blade mass, wind turbine platform mass, export cable length (HVAC or HVDC), SOV use, and design life. The sensitivity of the life cycle impacts to these parameters was quantified by scaling the parameters by 10% and reviewing the change relative to the basic results without uncertainty, assuming no other changes to the life cycle model.
Firstly, the results for all sites were consistently improved by increasing design life, reflecting other sensitivity studies of this parameter [24]. Across all impact categories, this reduction was −4.9% (OFHH) to −9.1% (multiple) (Figure 4). Life extension improves every environmental impact almost linearly, bar the additional yearly requirement for O&M. Accordingly, ozone formation metrics show the least improvements due to these increased vessel emissions. This approach excludes additional impacts from increased structural materiality or O&M consumables necessary to maintain turbine life, which are expected to be relatively minor in most categories [25]. This aligns with typical cost reduction approaches, where extending design life aims to maximize developer return on investment, and—for this parameter—suggests synergy between project cost engineering and environmental impacts.
The results were relatively insensitive to 10% increased blade mass (0.02 to 2.6% across all categories) and platform mass (0.2 to 5.2% across all categories). However, the impact categories sensitivity to increased HVAC and HVDC export cable length was more pronounced, with some categories observing small differences (including global warming, GW at 0.5% to 2.2%) while others observed significant changes (up to 8.8% for terrestrial, freshwater, and marine ecotoxicity metrics: TEX, FEX, and MEX at N3). This pattern was found for all sites, but especially for N3 with the most HVDC converter stations (4, Table A1) and the second longest export cable route (149 km, Table A1) resulting in the longest total cable length of the sites considered.
Increases in SOV use (transit to site and station-keeping infield) saw the largest increases in categories associated with diesel combustion (up to 4.4% in OFHH at site NE7, which has the longest distance to O&M port (105 km, Table A1)). However, multiple impact categories were insensitive to increased SOV use. Notably, the 10% increase in SOV use resulted in only a 0.8% to 1.5% increase in GW impacts, reflecting the dominance of other life cycle stages in climate change impacts.
These results show that the environmental impacts of these very large floating wind farms are primarily affected by design life, making life extension a crucial priority for the environmental impacts of these arrays. Material use—not vessel use—is, on balance, the next most significant contribution, suggesting that “greening” the supply of materials (via recycled materials, or alternative low-impact processes) should be the first priority, followed by decarbonizing vessel propulsion. However, there is already broad support for an accelerated transition to clean maritime operations in North Sea wind farm O&M [40].

3.4. Opportunities to Mitigate Global Warming Impact

Figure 5 shows the main contributions to GW for all four sites, split by assembly, process, and vessel operation, with a cut-off resolution of around 5%, in order to include ordinates for all arrays. As discussed previously, steel use is the single largest contribution to the GW impact for every farm. The turbine platform (steel alone; ballast was typically only around 1%) is the next most significant, which permits the opportunity for platform designers to significantly affect the climate impact of their products. Then, diesel combustion at around a fifth of the impact—also significant for contemporary efforts at vessel propulsion decarbonization. For N3, export cables are also significant given the site’s second-longest distance-to-site and the large number of export-connected HVDC stations.

3.5. Comparison with Literature

3.5.1. Contribution from Life Cycle Stages across Impact Categories

Material production and manufacture was the most impactful life cycle stage on global warming in all the studies reviewed [19,20,21,22,23,24,25,26,27,28], ranging from 49% [21] to a maximum of 94% [26]. The material supply of cables (typically containing aluminium or copper conductors and lead) also dominated, for example, in the ecotoxicity [25] and abiotic depletion [22,27,28] metrics. However, beyond the agreement on materials and manufacturing, the next most impactful stages vary according to the study and the impact category. O&M was often the next most frequently significant [21,25], for CED only. O&M was occasionally the most impactful stage for impact categories associated with fuel combustion (such as ozone depletion potential (ODP) at 59.41% [27]), in contrast to Figure 3. O&M is the most impactful life cycle stage in multiple impact categories in only one study [25]: this study also uses inputs from a dedicated O&M model for the LCA but also includes the impact of spare parts. In one instance, O&M (using a transport by barge unit process) is not significant across all categories [22]. As found in this study, assembly, transportation, installation, and decommissioning were rarely significant [20,24,27,28]. This disparity reinforces the important effect of vessel representation on the life cycle environmental impacts. Lastly, the end-of-life stages are highly dependent on practitioner assumptions and are found to be both significant [19,22,23] and to make little contribution [24,28].
Overall, the results of this study align well with the literature regarding life cycle stages. As with the literature, Figure 3 reflects the dominance of M&M across most impact categories, but (as with the literature) also finds significant O&M and L&R impacts in selected instances, highlighting the need to accurately represent these stages in floating wind farm life cycle models.

3.5.2. Contribution from Processes/Materials

Across the literature, the largest contribution to all impact categories tends to arise from steel production [19,20,23,27], although fuel use is also significant in some studies, where it can be inferred in eight impact categories (FPMF, FRS, GW, OFHH, OFTE, SOD, TA, and CED) [25], again reinforcing the importance of the impact of O&M and vessel representation on the wider life cycle environmental impacts. Fossil fuel use is obviously relevant to global warming metrics, for example diesel at 20% of GWP [21] and diesel (and coal, not disaggregated) at 27% of GWP [23], but whether vessel use appears in this contribution tends to depend on the practitioner modelling choices for vessel representation. Cable conductor materials also contribute significantly to diverse impact categories, for example, FEX, FE, HNCT, ME, TEX, [25], eutrophication potential (EP) [27], and abiotic depletion of elements (AD el), [28]. This includes, in some cases, global warming [19,20], although this was occasionally not notable [21]. Glass fibre was also significant in the global warming results of some studies (for example 9% to 27% [20,25]), but not others [26,28].
Figure 5 in this study shows steel, diesel use, and CFRP as the three largest contributing unit processes to global warming at around 40%, 20%, and 10%, respectively, across the four arrays. The impact of copper cable conductors can be inferred from Figure 4, where varying the export length has a proportionate impact on select categories, especially FE, TEX, FEX, MEX, HNCT, and MRS, reflecting the results from recent studies [25,27,28].

3.5.3. Contribution from Components

The literature commonly finds that the massive (usually steel) floating platforms are the most significant contributors to most life cycle environmental impacts [22,24,25,26], beyond just global warming [20,23] and CED [21]. The next most significant component in the literature is typically the inter-array and export cables. As described, by virtue of their material composition, these components most commonly affect resource consumption metrics. For example, the abiotic depletion potential (ADP) of the manufacturing, transportation, and installation of all cables was found to be only slightly smaller than that of the platform (47% compared to 51%), via lead and copper use [22]. The power transmission system dominated FEX, FE, HNCT, MEX, and TEX [25], while cable manufacturing accounted for 64% of ADP (and 28% of EP) [27]. Most recently, cables were found to be the main contributor to abiotic depletion (52%), acidification (17%), and eutrophication (14%), again driven by the use of copper [28].
Section 3.3 and Section 3.4 of this study align well with these perspectives from the literature. Figure 5 shows that the platforms are the component with the greatest impact on global warming for each array shown (20.8% to 31.7%). This is a smaller contribution than reported in some earlier studies (63%, 51%, 41%) [20,22,23] and comparable to more recent studies of larger turbines [25,28]. The sensitivity to platform mass and cable length in Figure 4 also reflects the attributions in the literature described above.

3.5.4. Contributions from O&M

Given the relatively novel use of outputs from a dedicated O&M model as inputs to a life cycle model, specific attention is given here to the contributions from O&M. A recent semi-submersible case study [25] finds that the O&M life cycle stage contributes 40.7% (after M&M at 46.6%). Of this, vessel processes comprise 30.0%, and the remainder is allocated to spare parts. This case study results in a life cycle global warming of 25.6 to 27.6 gCO2eq/kWh, comparable to the 17.4 to 26.3 gCO2eq/kWh found in this paper. However, this O&M contribution is quite different from Figure 3, which shows that O&M contributes only 9% to 16% to global warming, despite the likely more onerous metocean conditions at these remote sites. This may be due to the size of the array (demonstrator compared to utility-scale) and the assumptions underpinning the O&M model: further work would be required to resolve these model differences. Regardless, both these studies’ O&M contributions contrast with some of the reviewed literature, where the overall O&M contribution to global warming is typically low. In other impact categories, O&M vessel processes are the single largest process contribution to FPMF, FRS, GW, OFHH, OFTE, SOD, TA, and CED [25]. Figure 3 in this paper reflects these trends, although the contribution of O&M to SOD is more similar to the proportion seen in [28].

3.5.5. General Comparability

It is usually challenging to compare studies because the methodical choices are different. Fundamentally, the system boundary selection issue is still a critical weakness in current LCA studies [41], as well as the various differences in inventory detail and representation, lifetime power generation, and array design life (Table 1). Section 3.3.1 and Figure 4 describe the respective significances of these parameters, which make it difficult to draw firm comparisons.
Generally, there will always be a tendency toward a decrease in environmental impacts with increased lifetime energy generation and life extension (Figure 4) [20,24]. For example, a related study with a comparable 190-turbine wind farm in Italy has a longer design life (30 years compared to 20, and hence more impact from each year of vessel operations), but a lower capacity factor (34.35%), resulting in a higher global warming impact of 31.3 gCO2eq/kWh [28]. This compares to the capacity factors (52.3%, 53.9%, 54.4%, and 52.4%) and global warming results (17.4, 20.0, 20.5, and 26.3 gCO2eq/kWh) for sites E3, NE1, NE7, and N3, respectively. When additional impacts from O&M are included to match a 30-year design life, and multiplied by the ratio of capacity factors between the studies (1.52, 1.57, 1.58, and 1.53), the global warming results from this study become 27.6, 33.1, 34.9, and 42.2 gCO2eq/kWh, a difference of −12% to +35%, where any additional differences may be attributed to site characteristics, use of a dedicated O&M model as input, and vessel representation. This holds less well for the only other comparable impact category, CED, which becomes (376, 452, 487, and 607 kJ/kWh), in contrast with 410 kJ/kWh [28], a difference of −8% to +48%.
Conversely, alignment is observed with the literature on certain specific site characteristics, where shallow-water, close-to-shore sites can outperform more remote sites with higher average power generation. This is found to be the case with site E3 (Section 3.1, Figure 3), which tends to have the lowest environmental impacts, reflecting [21], but generally illustrates the relative importance of the ratio of life cycle model inventory to lifetime energy production [24].

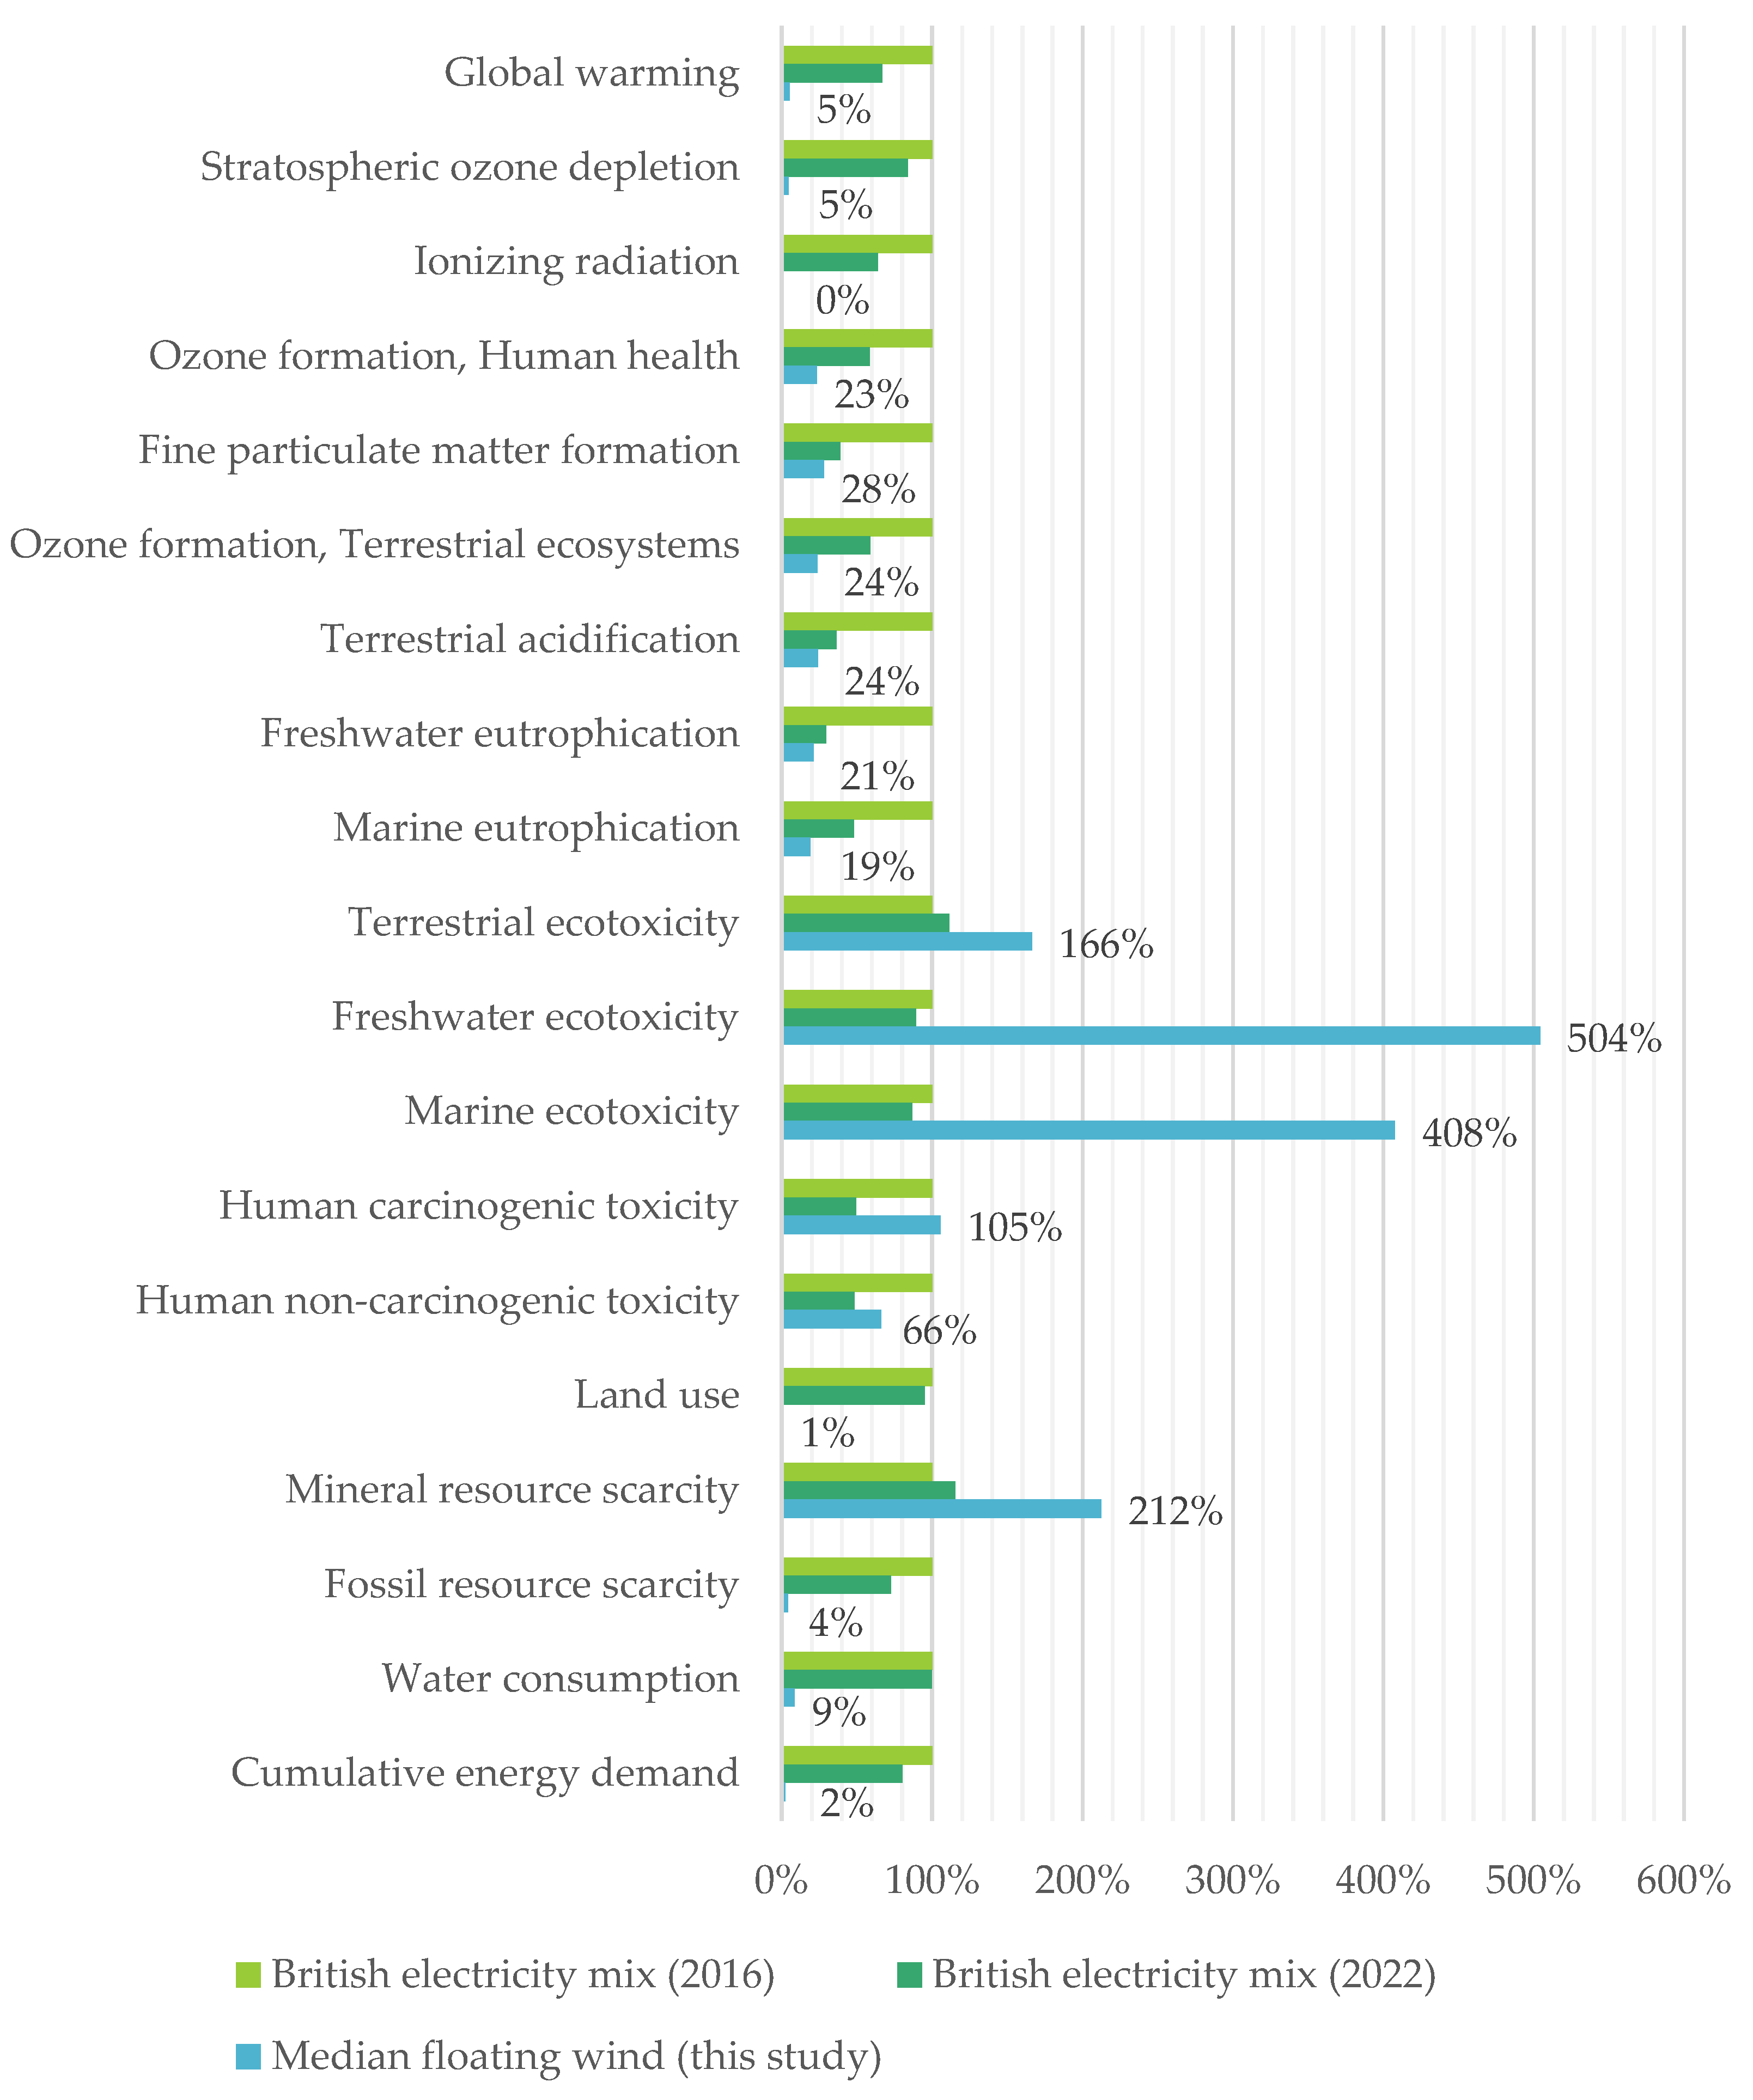
3.6. Comparison with the Historical British Electricity Mix

The environmental performance of these arrays can also be considered by comparison with the life cycle impacts of the current British electricity mix. It is important to note that carbon intensity (182 gCO2/kWh in 2022 [10]) only considers the operational (or direct) emissions from the power system generation mix, and so should not be compared with the life cycle global warming potential determined above. However, the LCI database, ecoinvent, does include a unit process suitable for this purpose (‘Electricity, high voltage {GB}|market for|Cut-off, U’) with data valid for the year 2016. This generation mix is primarily fossil gas, followed by nuclear, wind, and coal [30]. As a first approximation of contemporary data, electricity generation statistics for 2022 were reviewed [42,43] and used to modify this unit process to represent the electricity generation in 2022. This new mix is characterized by a slight reduction in gas, very low generation from coal, and increased generation from solar and wind (both offshore and onshore) relative to 2016. Figure 6 shows that the median floating wind environmental impacts calculated in this study are generally significantly lower than the average 2016 mix, with only five exceptions: terrestrial ecotoxicity (166%), freshwater ecotoxicity (504%), marine ecotoxicity (408%), human carcinogenic toxicity (105%), and mineral resource scarcity (212%). These are primarily driven by copper production, copper disposal (for both freshwater and marine ecotoxicity), steel slag disposal, and the production of iron ore, ferronickel, and lead, respectively. The results of the modified 2022 electricity mix broadly follow the patterns between the 2016 mix and the median floating wind results, except across the freshwater, marine, and human toxicity metrics. This suggests that the floating wind LCI includes greater proportions of copper production and waste treatment allocation per functional unit. This is supported by inspection of the respective ecoinvent unit processes and again highlights the importance of detailed waste treatment representation for these technologies [19,21,22,25,28]. On balance, the median life cycle impact of these arrays is generally far lower than that of the contemporary electricity generation mix for most impact categories; however, it is important that impact categories other than climate change are considered, especially during material production and disposal.

3.7. Limitations

As with any model, it is impossible to replicate exactly the complexity of the system under assessment, and approximations are essential for a tractable solution. Further, the more detailed a life cycle model, the more processes are included and typically the higher the impacts computed. This is observable in the literature where the inclusion of manufacturing processes and detailed O&M modelling tends to be associated with higher climate change impacts (Table 1).
This study attempted to address some gaps in the literature using modelling input from ORE Catapult. This gives good assurance on the foreground data for materials, vessel choice, and O&M inputs. However, a number of limitations remain. The O&M life cycle stage has only a nominal inclusion for cable inspection and major component replacement, with no allowance for other types of subsea inspection, such as moorings. Investigating tow-to-shore strategies from a life cycle perspective could also be instructive as state-of-the-art O&M practices for floating wind farms utilize tow-to-shore for major repairs, and novel crane vessel technologies necessary for on-site component exchange remain in development. Array losses have not been included in the lifetime energy production, which would have an inversely proportional effect on the environmental impacts (Section 3.3.1). Emission-causing activities during site development (such as vessel surveys) are also omitted. The turbine and platform models used are primarily intended as open benchmarks for new technologies or design methodologies and do not completely represent the LCI of an extant floating wind turbine design. Moreover, the site designs here are speculative and do not precisely represent the detailed designs of the commercial projects under development. Where export cables are shown to be impactful (at extreme site to landfall distances), greater assurance on the routing and cable length should be pursued. Fundamentally, future use of low-impact vessels and materials has the potential to significantly reduce the environmental impacts. Incremental benefits can also be achieved in the near term by technology maturation, such as optimizing platform, turbine, and transmission system designs to reduce mass and increase AEP.

4. Conclusions

This study assessed the life cycle impacts of a 15 MW reference wind turbine on floating platforms in sites representative of four floating wind farms in the ScotWind leasing round (E3, NE1, NE7, and N3) with a mixture of HVAC and HVDC transmission systems. The inventory data for this study used industry inputs for array materials and O&M vessel usage, giving assurance on the accuracy and representativeness of the results. The median global warming was 17.4 to 26.3 gCO2eq/kWh using default values for basic and additional uncertainty in the foreground data and background data. Across the four sites, materials and manufacturing account for 71% to 79% of the global warming impact, although the O&M burden was smaller than in other studies; O&M using SOVs comprised between 9% and 16% of the global warming impact.
This study has shown that the environmental impacts of these very large floating wind farms are fundamentally affected by design life, making life extension a crucial priority for the sustainability of these arrays. Following that, material use—not vessel use—is, on balance, the next most significant contribution, suggesting “greening” the supply of materials (via recycled materials, or alternative low-impact processes such as the use of hydrogen as a reducing agent in steel-making) should be a research priority, followed by decarbonizing vessel propulsion.

Supplementary Materials

The following supporting information can be downloaded at: https://www.mdpi.com/article/10.3390/en16237739/s1, original datasets describing the structure of the life cycle model and life cycle model parameters and data tables of the default uncertainty results, life cycle stage contributions, sensitivity study and global warming contributions.

Author Contributions

Conceptualization, R.C.T. and I.A.S.; investigation, I.A.S.; resources, N.A., M.N. and A.G.; data curation, I.A.S.; writing—original draft preparation, I.A.S.; writing—review and editing, R.C.T., N.A., M.N., A.G. and G.P.H.; supervision, R.C.T. and G.P.H. All authors have read and agreed to the published version of the manuscript.

Funding

I.A.S. gratefully acknowledges funding from the Engineering and Physical Sciences Research Council through the EPSRC Centre for Doctoral Training in Wind and Marine Energy Systems, grant number EP/L016680/1.

Data Availability Statement

The data presented in this study are available in the Supplementary Materials.

Conflicts of Interest

The authors declare no conflict of interest.

Appendix A

Table A1 contains detailed site-specific parameters. Further site-specific inventory data are included in the Supplementary Materials.
Table A1. Site parameters, excluding site-specific inventory data.
SiteE3NE1NE7N3
Number of turbines94154200220
Installed capacity (MW)1410231030003300
Turbine AEP (GWh/year)68.770.871.568.9
Capacity factor52.3%53.9%54.4%52.4%
Assumed water depth (m)60130110150
Export systemHVACHVDCHVDCHVDC
Approximate export cable landfall route (km)Aberdeen
(40)
Sumburgh
(72)
Montrose
(207)
Dounreay
(149)
Number of HVAC Collector Stations3344
Number of HVDC Converter Stations-224
O&M strategySOV
(no tow-to-shore)
SOV
(no tow-to-shore)
SOV
(no tow-to-shore)
SOV
(no tow-to-shore)
Number of SOVs2333
Lifetime (years)20202020
FWTU Assembly Yard (km)Methil, Scotland
(145)
Nigg, Scotland
(370)
Nigg, Scotland
(220)
Nigg, Scotland
(350)
Tower Origin
(km)
Methil, Scotland
(0)
Nigg, Scotland
(0)
Nigg, Scotland
(0)
Nigg, Scotland
(0)
Nacelle Origin
(km)
Esbjerg, Denmark
(725)
Esbjerg, Denmark
(820)
Esbjerg, Denmark
(820)
Esbjerg, Denmark
(820)
Blade Origin
(km)
Hull, England
(420)
Hull, England
(670)
Hull, England
(670)
Hull, England
(670)
WT Platform Origin
(km)
Methil, Scotland
(0)
Nigg, Scotland
(0)
Nigg, Scotland
(0)
Nigg, Scotland
(0)
Moorings Origin
(km)
Bilbao, Spain
(1910)
Bilbao, Spain
(2170)
Bilbao, Spain
(2170)
Bilbao, Spain
(1815)
Mooring Load-out
(km)
Methil, Scotland
(145)
Nigg, Scotland
(370)
Nigg, Scotland
(220)
Arnish, Scotland
(100)
Array Cable Origin
(km)
Hartlepool, England
(280)
Hartlepool, England
(625)
Hartlepool, England
(405)
Hartlepool, England
(685)
HVAC Topsides Origin
(km)
Aalborg, Denmark
(870)
Aalborg, Denmark
(835)
Aalborg, Denmark
(790)
Aalborg, Denmark
(1140)
HVAC Jacket Origin
(km)
Methil, Scotland
(145)
Nigg, Scotland
(370)
Nigg, Scotland
(220)
Arnish, Scotland
(350)
HVAC Piles Origin
(km)
Methil, Scotland
(0)
Methil, Scotland
(0)
Methil, Scotland
(0)
Arnish, Scotland
(0)
HVAC Piles Load-out
(km)
Methil, Scotland
(145)
Methil, Scotland
(510)
Methil, Scotland
(295)
Arnish, Scotland
(100)
HVAC Cable Origin
(km)
Hartlepool, England
(280)
Hartlepool, England
(625)
Hartlepool, England
(405)
Hartlepool, England
(685)
HVDC Topsides Origin
(km)
Aalborg, Denmark
(870)
Aalborg, Denmark
(835)
Aalborg, Denmark
(790)
Aalborg, Denmark
(1140)
HVDC Jacket Origin
(km)
Methil, Scotland
(145)
Methil, Scotland
(510)
Methil, Scotland
(295)
Arnish, Scotland
(100)
HVDC Piles Origin
(km)
Methil, Scotland
(0)
Methil, Scotland
(0)
Methil, Scotland
(0)
Arnish, Scotland
(0)
HVDC Piles Load-out
(km)
Methil, Scotland
(145)
Methil, Scotland
(510)
Methil, Scotland
(295)
Arnish, Scotland
(100)
HVDC Cable Origin
(km)
Hartlepool, England
(280)
Hartlepool, England
(625)
Hartlepool, England
(405)
Hartlepool, England
(685)
O&M Port
(km)
Aberdeen, Scotland
(40)
Lerwick, Scotland
(55)
Fraserburgh, Scotland
(105)
Stornoway, Scotland
(100)
Major Repairs Port
(km)
Aberdeen, Scotland
(40)
Lerwick, Scotland
(55)
Aberdeen, Scotland
(155)
Nigg, Scotland
(350)

References

  1. IEA. Offshore Wind Outlook 2019; IEA: Paris, France, 2019. [Google Scholar]
  2. IEA. Net Zero by 2050 a Roadmap for the Global Energy Sector; IEA: Paris, France, 2021. [Google Scholar]
  3. Williams, R.; Zhao, F. Global Offshore Wind Report 2023. Global Wind Energy Council. August 2023. Available online: https://gwec.net/wp-content/uploads/2023/08/GWEC-Global-Offshore-Wind-Report-2023.pdf (accessed on 2 November 2023).
  4. The Crown Estate. The Crown Estate Offshore Wind 2022. The Crown Estate. April 2023. Available online: https://assets.ctfassets.net/nv65su7t80y5/1Tr60ikvWdBncxjtySAgti/09121dae09f04dea907ee6a3ee2c043a/11720_owoperationalreport_2022_tp_020523plusaccessibility.pdf (accessed on 2 November 2023).
  5. UK Government. Major Acceleration of Homegrown Power in Britain’s Plan for Greater Energy Independence. GOV.UK. Available online: https://www.gov.uk/government/news/major-acceleration-of-homegrown-power-in-britains-plan-for-greater-energy-independence (accessed on 2 November 2023).
  6. The Crown Estate. Offshore Wind Leasing Round 5|The Crown Estate. Available online: https://www.thecrownestate.co.uk/our-business/marine/round-5 (accessed on 2 November 2023).
  7. Gray, A. Initial Predictions for Offshore Wind Farms in the ScotWind Leasing Round; ORE Catapul: Glasgow, UK, 2021. [Google Scholar]
  8. Stark, C.; Thompson, M.; Andrew, T.; Beasley, G.; Bellamy, O.; Budden, P.; Cole, C.; Darke, J.; Davies, E.; Feliciano, D.; et al. Net Zero Technical Report. Committee on Climate Change. 2019. Available online: www.theccc.org.uk/publications (accessed on 12 August 2019).
  9. Thomson, R.C.; Harrison, G.P.; Chick, J.P. Marginal greenhouse gas emissions displacement of wind power in Great Britain. Energy Policy 2017, 101, 201–210. [Google Scholar] [CrossRef]
  10. Britain’s Electricity Explained: 2022 Review|ESO. Britain’s Electricity Explained. 2022 Review. Available online: https://www.nationalgrideso.com/news/britains-electricity-explained-2022-review (accessed on 7 November 2023).
  11. BSI. Environmental Management—Life Cycle Assessment—Requirements and Guidelines; British Standards Institution: London, UK, 2018. [Google Scholar]
  12. Klöpffer, W. Life cycle assessment. Environ. Sci. Pollut. Res. 1997, 4, 223–228. [Google Scholar] [CrossRef] [PubMed]
  13. Hauschild, M.Z.; Rosenbaum, R.K.; Olsen, S.I. Life Cycle Assessment: Theory and Practice; Springer: Berlin/Heidelberg, Germany, 2018. [Google Scholar]
  14. Wulf, C.; Werker, J.; Ball, C.; Zapp, P.; Kuckshinrichs, W. Review of Sustainability Assessment Approaches Based on Life Cycles. Sustainability 2019, 11, 5717. [Google Scholar] [CrossRef]
  15. Amahmoud, A.; Attar, M.M.E.; Meleishy, A. The Evolution of Life Cycle Assessment Approach: A Review of Past and Future Prospects. IOP Conf. Ser. Earth Environ. Sci. 2022, 992, 012002. [Google Scholar] [CrossRef]
  16. BSI. Environmental Management—Life Cycle Assessment—Principles and Framework; British Standards Institution: London, UK, 2006; Volume 3, p. 20. [Google Scholar] [CrossRef]
  17. Baumann, H.; Tillman, A.-M. The Hitch Hiker’s Guide to LCA; Studentlitteratur AB: Lund, Sweden, 2004. [Google Scholar]
  18. Mendecka, B.; Lombardi, L. Life cycle environmental impacts of wind energy technologies: A review of simplified models and harmonization of the results. Renew. Sustain. Energy Rev. 2019, 111, 462–480. [Google Scholar] [CrossRef]
  19. Weinzettel, J.; Reenaas, M.; Solli, C.; Hertwich, E.G. Life cycle assessment of a floating offshore wind turbine. Renew. Energy 2009, 34, 742–747. [Google Scholar] [CrossRef]
  20. Raadal, H.L.; Vold, B.I.; Myhr, A.; Nygaard, T.A. GHG emissions and energy performance of offshore wind power. Renew. Energy 2014, 66, 314–324. [Google Scholar] [CrossRef]
  21. Tsai, L.; Kelly, J.C.; Simon, B.S.; Chalat, R.M.; Keoleian, G.A. Life Cycle Assessment of Offshore Wind Farm Siting: Effects of Locational Factors, Lake Depth, and Distance from Shore. J. Ind. Ecol. 2016. [Google Scholar] [CrossRef]
  22. Elginoz, N.; Bas, B. Life Cycle Assessment of a multi-use offshore platform: Combining wind and wave energy production. Ocean Eng. 2017, 145, 430–443. [Google Scholar] [CrossRef]
  23. Bang, J.-I.; Ma, C.; Tarantino, E.; Vela, A.; Yamane, D. Life Cycle Assessment of Greenhouse Gas Emissions for Floating Offshore Wind Energy in California; University of California: Santa Barbara, CA, USA, 2019. [Google Scholar]
  24. Poujol, B.; Prieur-Vernat, A.; Dubranna, J.; Besseau, R.; Blanc, I.; Pérez-López, P. Site-specific life cycle assessment of a pilot floating offshore wind farm based on suppliers’ data and geo-located wind data. J. Ind. Ecol. 2020, 24, 248–262. [Google Scholar] [CrossRef]
  25. Garcia-Teruel, A.; Rinaldi, G.; Thies, P.R.; Johanning, L.; Jeffrey, H. Life cycle assessment of floating offshore wind farms: An evaluation of operation and maintenance. Appl. Energy 2022, 307, 118067. [Google Scholar] [CrossRef]
  26. Yildiz, N.; Hemida, H.; Baniotopoulos, C. Life cycle assessment of a barge-type floating wind turbine and comparison with other types of wind turbines. Energies 2021, 14, 5656. [Google Scholar] [CrossRef]
  27. Yuan, W.; Feng, J.-C.; Zhang, S.; Sun, L.; Cai, Y.; Yang, Z.; Sheng, S. Floating wind power in deep-sea area: Life cycle assessment of environmental impacts. Adv. Appl. Energy 2023, 9, 100122. [Google Scholar] [CrossRef]
  28. Brussa, G.; Grosso, M.; Rigamonti, L. Life cycle assessment of a floating offshore wind farm in Italy. Sustain. Prod. Consum. 2023, 39, 134–144. [Google Scholar] [CrossRef]
  29. Avanessova, N.; Land, J.; Lee, A.; Lazakis, I.; Thomson, C. Comparison of Operation and Maintenance of Floating 14 MW Turbines and Twin 10 MW Turbines. ASME Open J. Eng. 2023, 2, 021031. [Google Scholar] [CrossRef]
  30. Ecoinvent. Ecoinvent Centre. 2016. Ecoinvent Database (Version 3.6). [Allocation—Cut-off by Classification—Unit]. Retrieved from Simapro Software Version 9.1. December 2019. Available online: www.ecoinvent.org (accessed on 10 September 2023).
  31. Crown Estate Scotland. ScotWind Offshore Wind Leasing Delivers Major Boost to Scotland’s Net Zero Aspirations. Available online: https://www.crownestatescotland.com/news/scotwind-offshore-wind-leasing-delivers-major-boost-to-scotlands-net-zero-aspirations (accessed on 19 January 2022).
  32. Allen, C.; Viselli, A.; Dagher, H.; Goupee, A.; Gaertner, E.; Abbas, N.; Hall, M.; Barter, G. Definition of the UMaine VolturnUS-S Reference Platform Developed for the IEA Wind 15-Megawatt Offshore Reference Wind Turbine; National Renewable Energy Laboratory: Golden, CO, USA, 2020. [Google Scholar]
  33. Aqua-RET Project. Aqua-RET Project, Downloads and Resources’, Downloads and Resources. Available online: https://aquaret.com/index3f8f.html?option=com_content&view=article&id=198&Itemid=50&lang=en (accessed on 26 May 2023).
  34. Boniface, Y. uMap, an OpenStreetMap Project (Version 1.10.0). uMap. Available online: https://umap.openstreetmap.fr/en/ (accessed on 30 October 2023).
  35. Gaertner, E.; Rinker, J.; Sethuraman, L.; Zahle, F.; Anderson, B.; Barter, G.; Abbas, N.; Meng, F.; Bortolotti, P.; Skrzypinski, W.; et al. Definition of the IEA Wind 15-Megawatt Offshore Reference Wind Turbine Technical Report; National Renewable Energy Laboratory. March 2020. Available online: www.nrel.gov/publications (accessed on 29 May 2020).
  36. Birkeland, C. Assessing the Life Cycle Environmental Impacts of Offshore Wind Power Generation and Power Transmission in the North Sea. Master’s Thesis, Norwegian University of Science and Technology, Trondheim, Norway, 2011. [Google Scholar]
  37. Thomson, R.C.; Chick, J.P.; Harrison, G.P. An LCA of the Pelamis wave energy converter. Int. J. Life Cycle Assess. 2019, 24, 51–63. [Google Scholar] [CrossRef] [PubMed]
  38. Karan, H.; Thomson, R.C.; Harrison, G.P. Full life cycle assessment of two surge wave energy converters. Proc. Inst. Mech. Eng. Part J. Power Energy 2019, 234, 1–14. [Google Scholar] [CrossRef]
  39. Weidema, B.P.; Bauer, C.; Hischier, R.; Mutel, C.; Nemecek, T.; Reinhard, J.; Vadenbo, C.O.; Wenet, G. Data Quality Guideline for the Ecoinvent Database Version 3. Ecoinvent Report 1 (v3); Swiss Centre for Life Cycle Inventories: Dübendorf, Switzerland, 2013; Volume 3. [Google Scholar]
  40. ORE Catapult and The Workboat Association. Decarbonising Maritime Operations In North Sea Offshore Wind O&M; Innovation Roadmap produced for the UK Government DfT and FCDO; ORE Catapult and The Workboat Association: Glasgow, UK, 2021. [Google Scholar]
  41. Li, T.; Zhang, H.; Liu, Z.; Ke, Q.; Alting, L. A system boundary identification method for life cycle assessment. Int. J. Life Cycle Assess. 2014, 19, 646–660. [Google Scholar] [CrossRef]
  42. Martin, V. DUKES 2023 Chapter 5: Electricity. Department for Energy Security and Net Zero. July 2023. Available online: https://assets.publishing.service.gov.uk/media/64c23a300c8b960013d1b05e/DUKES_2023_Chapter_5.pdf (accessed on 7 November 2023).
  43. UK Energy in Brief 2023. Department for Energy Security and Net Zero; Department for Energy Security and Net Zero: London, UK, 2023. [Google Scholar]
Figure 1. Overview of components included within the floating wind farms’ reference flows; map of sites considered and general arrangement of the 15 MW reference wind turbine with platform. Diagrams adapted from [32,33], map adapted from [34]. Sites are labelled North 3, North East 1, North East 7 and East 3 (N3, NE1, NE7 and E3).
Energies 16 07739 g001
Figure 2. Schematic of the life cycle model, system boundary, life cycle stages, inventory assemblies, and processes, and the relationship with the COMPASS O&M model. White arrows indicate flows of data within the model, black arrows indicate elementary flows in the LCI.
Energies 16 07739 g002
Figure 3. The relative contribution of life cycle stages to environmental impact categories: materials and manufacturing (M&M); transport and installation (T&I); operation and maintenance (O&M); decommissioning and removal (D&R); landfill and recycling (L&R).
Energies 16 07739 g003
Figure 4. Sensitivity of impact categories to 10% increase in selected site and engineering design parameters for all four sites.
Energies 16 07739 g004
Figure 5. Main contributions to global warming by assemblies, processes, and vessel operations for all four sites.
Energies 16 07739 g005
Figure 6. Comparison of the relative environmental performance of the ecoinvent unit process for 2016 British electricity mix [30], a modified process representative of 2022 generation by energy [42,43], and the median results of the four floating wind farms calculated in this study; 100% corresponds to the 2016 electricity mix results.
Energies 16 07739 g006
Table 1. Selected characteristics of floating wind farm LCA. * The Supporting Information in the study by Tsai references a floating foundation in [19] which is a Sway design. Abbreviations: tension leg buoy (TLB); semi-submersible (Semi-sub); tension leg platform (TLP); megavolt-amp (MVA); high-voltage alternating current (HVAC); high-voltage direct current (HVDC); service operation vessel (SOV); cumulative energy demand (CED); global warming potential (GWP).
Weinzettal (2009)
[19]
Raadal (2014)
[20]
Tsai (2016)
[21]
Elginoz (2017)
[22]
Bang (2019)
[23]
Poujol (2020)
[24]
Yildiz (2021)
[26]
Garcia-Teruel (2022) [25]Yuan (2023)
[27]
Brussa (2023)
[28]
Publication typeJournal paperJournal paperJournal paperJournal paperMaster’s ThesisJournal paperJournal paperJournal paperJournal paperJournal paper
Turbine rated power (MW)55358626; 9.56.715
No. turbines401001007775415;
5
100190
Array scale (MW)200500300385 (wind), 265.5 (wave)60024Single turbine30;
47.5
6702800
Substructure designSwaySpar;
TLB;
Sway;
Semi-sub;
TLP
Sway *Multi-use offshore platform (integrated wave power)SparSemi-subBarge-typeSpar;
Semi-sub
Semi-sub (Wind Float, Gen 3)Semi-sub
LocationDogger Bank area, EnglandNot statedGreat Lakes,
US
Cantabria, SpainCalifornia, USLeucate,
France
FLOATGEN, FranceHywind;
Kincardine, Scotland
ChinaWest of Sicily, Italy
Water depth (m)Concept suitable for 100–300 (not stated)20060–140Not stated (est. 100)450Not statedNot stated95–129;
60–80
60–80200
Distance to shore (km)502005–303–133516Not stated25;
15
12–20230
Design life (years)20202025252020252530
Site statusHypotheticalHypotheticalHypotheticalHypotheticalHypotheticalPre-
construction
ConstructedConstructedHypotheticalPre-
construction
Energy
calculation
Capacity
Factor
Capacity
Factor
Site-specificCapacity
Factor
Capacity
Factor
Site-specificCapacity
Factor
Site-specific, O&M modelCapacity
Factor
Site-specific
Capacity factor (%)534628–3523 (wind)5034Not stated50.2 (tow), 49.4;
40.5 (tow), 39.7
53.834.35
Array voltage (kV)Not stated30–363333Not statedNot statedNot stated333366
Export voltage (kV)170145132132Not statedNot statedNot stated33132
(HVDC)
500
(HVDC)
Substation (substructure)250 MVA
(Floating)
500 MVA
(Not stated)
Yes
(Floating)
Yes
(Jacket)
1000 MVA
(Floating)
NoNoNoYes
(Jacket)
Yes
(Floating)
Reference flowUp to the end of the subsea export cableUp to the end of the subsea export cableUp to the end of the subsea export cableUp to the end of the subsea export cableUp to the end of the subsea export cableUp to the end of the subsea export cableFloating unit only: no export cableUp to the end of the subsea export cableUp to the end of the subsea export cableIncludes onshore HVDC cable
Life cycle stagesMaterials,
manufacturing, transport, O&M, dismantling, end-of-life credits
Production of raw materials, transport, installation, decommissioning, disposalManufacturing and assembly, installation, O&M, and decommissioningManufacturing and processing, transportation, installation; O&M; end-of-lifeManufacturing, transportation, installation, operation, decommissioning, and end-of-life treatment (credits)Materials, manufacture, transport, offshore installation, grid connection, maintenance, end-of-lifeManufacture, transportation, erection, O&M, disposal, and recyclingMaterials, manufacturing, installation (including transport), O&M, decommissioning, disposalComponents manufacturing and transport, wind farm construction, O&M, decommissioning, disposalRaw materials supply, manufacturing and transport of components, assembly and offshore installation, O&M, dismantling, end-of-life including transportation
Manufacturing processesYesNoYes (excludes capital goods)YesNoYesNoYesNoNo
Component transportation and installationTrucks, vesselsVessels onlyTrucks, vesselsTrucks, vesselsTrucks, vesselsTrucks, vesselsTrucks, vesselsTrucks, multiple vessel typesLorry, bargeLorry, ship,
vessels
Vessel
representation
t.km process (barge)Fuel consumptionFuel consumption data for shippingt.km process (barge)t.km process (transoceanic shipping)Diesel (market for)t.km process (not stated)t.km process (ferry), scaled to vessel fuel consumptiont.km/direct fuel uset.km/fuel consumption
Maintenance vehiclesHelicopter, towing boatNot statedVessel, jack-up, craneBarge, helicopterSmall boat, helicopter, specialized vessel, crane vesselNot statedMultiple vessel typesMultiple vessel types, road vehiclesNot statedExcluded
Maintenance frequencyAssumedAssumedAssumedAssumedAssumedAssumedAssumedModelledAssumedExcluded
LCA softwareSimaPro 7.1SimaPro (version not stated)SimaPro 7.3.2GaBiNo (Excel)SimaPro 8.4Gemis 5SimaPro 9.1eFootprintSimaPro 9.3
LCI databaseecoinvent v1.3ecoinvent (version not stated)ecoinvent v2.0GaBiecoinvent v3ecoinvent v3.3Europaecoinvent v3.6Chinese core life cycle database (CLCD)/ecoinvent v3.5ecoinvent v3.7.1
LCIA method/Impact categoryCML 2 baseline 2000 V2.03CEDTRACI;
CED
CML 2001GWPILCD 2011, AWARE, ReCiPe 2016 Midpoint (H), CEDGWP, AP, ADPF, EPTReCiPe Midpoint (H) 2016;
CED
CML 2002EPD; CED
Uncertainty assessmentNoNoNoNoMonte Carlo (input data)BackgroundNoBackgroundForeground and backgroundNo
GWP (gCO2eq/kWh)11.525.3;
18.0;
20.9;
31.4;
19.2;
18.9
38.1;
32.9;
33.0;
33.8;
35.5;
33.1;
33.9;
35.5
18.122.315.418.632.4–45.2 (tow),
30.2–32.7;
27.7–39.4 (tow),
25.6–27.6
25.8 (tow)31.3
Table 2. ReCiPe and CED results for all four sites using default uncertainty parameters (global warming impact shown in bold).
Impact Category/AttributeAbbreviationE3NE1NE7N3Units
2.5%Median97.5%2.5%Median97.5%2.5%Median97.5%2.5%Median97.5%
Global warmingGW13.017.423.614.920.027.815.420.528.220.226.335.4g CO2eq/kWh
Stratospheric ozone depletionSOD5.77.711.05.98.211.76.79.313.99.613.821.3μg CFC11 eq/kWh
Ionizing radiationIR0.10.43.20.10.44.00.10.43.20.20.64.4Bq Co-60 eq/kWh
Ozone formation, Human healthOFHH0.10.10.20.10.10.30.10.20.30.10.20.3g NOx eq/kWh
Fine particulate matter formationFPMF0.00.10.10.10.10.10.10.10.10.10.10.2g PM2.5 eq/kWh
Ozone formation, Terrestrial ecosystemsOFTE0.10.10.20.10.20.30.10.20.30.10.20.3g NOx eq/kWh
Terrestrial acidificationTA0.10.20.20.10.20.30.20.20.30.20.30.5g SO2 eq/kWh
Freshwater eutrophicationFE8.513.523.38.013.124.511.317.628.822.134.759.1mg P eq/kWh
Marine eutrophicationME2.53.55.00.43.55.32.83.95.84.35.98.9mg N eq/kWh
Terrestrial ecotoxicityTEX0.20.40.90.20.30.80.30.51.30.51.13.2kg 1,4-DCB/kWh
Freshwater ecotoxicityFEX14.018.625.612.616.522.421.528.638.249.465.990.1kg 1,4-DCB/kWh
Marine ecotoxicityMEX17.222.831.315.520.227.426.435.046.760.380.4110.4kg 1,4-DCB/kWh
Human carcinogenic toxicityHCT3.57.117.63.87.618.03.87.618.45.911.225.3kg 1,4-DCB/kWh
Human non-carcinogenic toxicityHNCT0.10.10.20.10.10.20.10.20.20.20.30.5kg 1,4-DCB/kWh
Land useLU2.53.55.02.53.55.32.83.95.84.35.98.9cm2a crop eq/kWh
Mineral resource scarcityMRS0.50.81.20.50.81.20.71.01.41.31.82.5kg Cu eq/kWh
Fossil resource scarcityFRS3.44.66.24.05.37.44.15.67.75.67.39.8kg oil eq/kWh
Water consumptionWC−29.70.322.4−29.91.324.6−39.31.926.5−61.13.347.7l/kWh
Cumulative energy demandCED180.9236.9321.7206.4273.1386.6210.1286.1402.6285.9381.9519.6kJ/kWh
Turbines-94154200220-
Turbine AEP (including availability)-68.770.871.568.9GWh/yr
Lifetime array energy production (20 years)-129.2218.1285.8303.3TWh
Disclaimer/Publisher’s Note: The statements, opinions and data contained in all publications are solely those of the individual author(s) and contributor(s) and not of MDPI and/or the editor(s). MDPI and/or the editor(s) disclaim responsibility for any injury to people or property resulting from any ideas, methods, instructions or products referred to in the content.

