Abstract
Nowadays, it has been necessary to investigate battery storage systems as a part of the massification of renewable energies, with a particular emphasis on batteries, which are the most crucial components in these systems. In this study, the two-pulse method is applied to LiFePO4 battery cells to test the effectiveness of this method in this chemistry, based on previous validations in lead-acid cells. As a result, approximate values for the state of health (SOH) and state of charge (SOC) of the battery are obtained, with an estimated average standard error of the mean (SEM) less than 10%. An innovative aspect of the method is the inclusion of Lithium-based chemistry to verify the method and the comparison of the SOH obtained with the strain and temperature of a cell. These measurements can help to complement the information on the state of health of the battery cells. The method’s applicability to lithium-ion cells has been confirmed, although it requires suitable equipment for its correct application. Not all equipment can deliver uniform and controlled current pulses. Finally, it is necessary to consider some restrictions as a minimum current of at least 15% of the battery capacity value is required. The initial characterization may take some time, although parameter values can be found in the literature for certain technologies like lead-acid. The parameter values vary depending on the chemistry.
1. Introduction
The increase in electricity demand in recent years has led to the emergence of new energy concepts such as decarbonization and smart microgrids. Furthermore, there has been a notable surge in the growth of renewable energies. This surge can be attributed to the detrimental environmental impacts of the utilization of fossil fuels, which results in substantial emissions of carbon dioxide and other chemicals. As a result, the shift towards sustainable energy sources has been actively promoted as an essential facet of the decarbonization process [1].
In Colombia, the increase in electricity demand has been constant and the trend is expected to continue ahead. According to the Unidad de Planeación Minero-Energética (UPME), medium-term projections suggest that the electricity demand could have an average increase between 2.22% and 3.33% between 2022 and 2036 [2].
For this reason, the massification of non-conventional renewable energies has emerged as a response to the escalating energy demand. They represent an eco-friendly and sustainable option without environmental repercussions [3]. However, these energy sources have challenges due to their high variability, dependence on climate change, lack of inertia, and daily availability, which can affect the reliability and quality of the power supply when integrated into conventional power grids or when feeding certain loads. This is why additional systems are needed to ensure a constant supply of energy when needed, improving the efficiency of these sources [4,5]. Therefore, it is not only necessary to increase the use of renewable sources, but also to improve the energy storage capacity to efficiently manage electrical supply.
Battery energy storage systems, also known as BESSs (Battery Energy Storage Systems), are an excellent storage option due to their compact size, ease of implementation, low cost compared to other technologies, and their ability to provide immediate power for specific periods of time [6]. Furthermore, these systems enable voltage and frequency stabilization functions, which contribute to the integration of renewable resources [7]. In these systems, the batteries are the principal component of their operation and have significant parameters such as the Amp Hour Capacity (AHC), which indicates the storage capacity in amperes/hour, the State of Charge (SOC), which shows how much charge is available at a given moment, and the State of Health (SOH), which reflects their general condition [8].
Coleman [9] applies the two-pulse method to determine the SOH in lead-acid batteries. In this context, the method is applied to LiFePO4 batteries, but Coleman asserts that the method is replicable in lithium-ion batteries.
Several researchers have employed this method as a foundation for various studies involving lithium-ion batteries. An overview of the authors and their respective applications is presented in Table 1.

Table 1.
Studies involving the two-pulse method.
Furthermore, lithium-ion batteries have garnered significant attention in various research studies. The interest is not only in their state of health, but also in other fields such as the effect of temperature for rechargeable batteries [18], novel high-performance materials [19], fault diagnosis in electric vehicles [20], among others. Consequently, any contribution pertaining to lithium-ion batteries holds substantial value in advancing the progress of this technology.
This article focuses on battery SOH, which indicates the available battery capacity relative to the first cycle of use. This indicator is important for efficient and safe battery management, as well as for efficient management of the delivered energy [21]. It validates the method for a specific technology (LiFePO4) in lithium-ion batteries. For information purposes, the data incorporate deformation and temperature values to complement the SOH result and analyze its impact. The method of verification includes developing software to simulate the process, record results, and estimate the SOH.
2. State-of-the-Art
The SOH index reflects how much a battery has degraded and it is important for determining its lifespan. This indicator cannot be measured directly. It requires measurements on variables such as discharge current, temperature, voltage, internal resistance, and others to estimate it [22].
The SOH can be defined as shown in Equation (1) [23].
The SOH is affected by the SOC, temperature, discharge multiplier, accumulated duration of the useful life of the battery, number of charge/discharge cycles, and cumulative load performance [24].
There are multiple methods to estimate the SOH, which can be classified into two main categories:
- Experimental techniques, which in turn are divided into direct measurement techniques and indirect evaluation techniques.
- Model-based techniques, which are divided into data-based techniques and adaptive filtering techniques.
A summary of the techniques mentioned can be seen in Figure 1, considering the focus of this article.
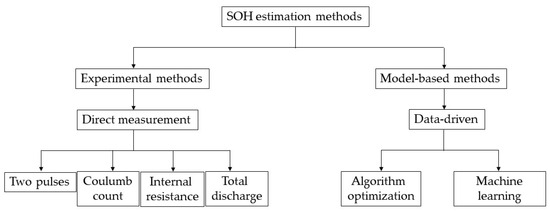
Figure 1.
Classification of SOH estimation methods. Source: adapted from [25].
Methods based on direct measurements estimate the SOH using experimentally obtained variables, which makes them easy to implement, and do not require large computational power. However, they have scalability limitations and are usually implemented in laboratory environments, which are far from real working conditions [26]. Some of these are described below.
2.1. Two Pulses
As its name indicates, two pulses of discharge current are required; the first one resets the battery from its previous history and the second one establishes the parameters that are related to the state of charge and state of health. This method is explained in more detail in the following section since it is the one applied in this study.
2.2. Coulomb or Ampere-Hour Counting
It starts by testing the open circuit voltage to verify that the battery is not below the cut-off voltage. This method is based on the control of the battery voltage VB and charge or discharge current IB. When the battery is in an open circuit with zero current, a self-discharge compensation is performed to correct the initial state of charge and health of the battery.
When VB is lower than the cut-off voltage (according to the datasheet) during discharge, the battery must be recharged as it can no longer be used. When VB reaches the upper limit (according to the datasheet), it means that the battery is fully charged.
In this way, the SOH can be calculated with Equations (2)–(4) [16].
where:
- : current state of charge;
- : initial state of charge;
- : nominal capacity in ampere-hours;
- : charge or discharge current;
- depth of discharge.
2.3. Internal Resistance
This method helps to have a qualitative estimation of battery degradation. It consists of applying a load to the battery and measuring the changes in voltage and current to find the internal resistance. This value is higher when the battery is degraded. An important aspect is that it considers parameters that vary with temperature, so it is not as accurate [27]. A general guideline with this method is that if the impedance increases by 30% from its original value when the battery is new and fully charged, the battery should be replaced [9].
2.4. Total Discharge
It consists of discharging the battery when it is fully charged and measuring the charge delivered. The charge obtained is compared with the one measured when the battery was new. It is discharged using the discharge rate found on the datasheet [27]. It requires this same test to have been performed when the battery was new.
2.5. Data-Driven
Methods such as optimization and Machine Learning (ML) algorithms are well recognized for their advantages, although the implementation is more complex than the methods mentioned above.
Optimization algorithms are usually combined with a representative model to identify the parameters to estimate the SOH. When these parameters are being identified, variation becomes apparent when there are discrepancies between the actual and predicted battery data. For this reason, it is important to carefully select the set of parameters that are part of the model since they directly influence the discrepancies that may occur [25].
Considering the above, Table 2 provides a comparison of the advantages and disadvantages of each method.
Table 2.
Characteristics of methods for SOH estimation.
3. Method Selection Process
An evaluation of the previously chosen methods is carried out considering criteria to which a percentage of relevance is assigned. The criteria are chosen according to the focus of this work.
Table 3 shows the criteria chosen together with their percentage of relevance.
Table 3.
Evaluation criteria.
Table 4 shows the evaluation of each method with its total score. The two-pulse method obtained the highest score, considering the criteria chosen to develop the work. The two-pulse method is selected because it does not require historical data to be implemented. The ease of implementation, temperature influence, and accuracy compared to other methods are also considered.
Table 4.
Evaluation of SOH estimation methods.
4. Battery Model
There are diverse ways of modeling batteries to describe electrochemical processes. Figure 2 shows the Thevenin model, which consists of a Voc source that has the open circuit voltage value, a Rin resistor that represents the internal resistance of the battery, a CSEI capacitor that represents the capacitance of the electrodes in the cells, and an RSEI resistor that models the nonlinear resistance between the electrodes and the electrolyte. These last elements correspond to the modeling of the behavior known as the Solid Electrolyte Interphase [28,29].
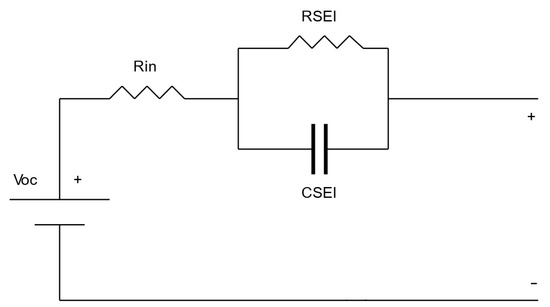
Figure 2.
Thevenin’s model. Source: adapted from [28].
This circuit also adequately describes the waveform shown in Figure 7, which will be explained later.
5. Materials and Methods
5.1. Two-Pulse Method
As explained in [9], the two-pulse method consists of applying two identical current pulses with the same duration, with a controlled load. The method is applied as follows:
- Initially, the battery is left in an open circuit for 60 s. The initial voltage is taken, which is called V0.
- The first current pulse is applied for 10 s. The voltage is measured in the last second, which is called V1. Then, ΔV1 = V0 − V1.
- There is a wait time of 10 s and then the voltage is measured, Vmax.
- The second pulse is applied and the voltage at the last second is measured, obtaining Vmin. In this way, ΔV2 = Vmax − Vmin can be obtained.
After performing the whole procedure, Equations (5)–(8) can be applied.
where:
- : state of charge;
- : maximum voltage;
- : empirical parameters;
- : minimum battery voltage when SOC = 0;
- : current rate;
- : voltage difference between Vmax and Vmin;
- : battery capacity;
- : current applied in the discharge pulse;
- : state of health.
5.2. Materials
The primary components for these tests are the batteries, which are 3.2 V and 26 Ah LiFePO4 cells manufactured in China.
Different measurement and control equipment are used such as an iChargerDuo charger (Junsi, Shenzhen, China), a Hioki® clamp with Bluetooth connection (Hioki, Nagano, Japan), the Metrohm Autolab 10 A Booster (Matrohm, Herisau, Switzerland) together with its modules, among others.
For temperature measurement, 100 KΩ NTC3950 thermistors are used, which are in contact with the surface of the cells. Strain gauges of 350 Ω are used to measure the deformation resistance. These gauges vary the resistance depending on the force applied by the deformation that the cells may present in the packaging.
As for data acquisition, the Arduino Mega ADK (ARDUINO, Ivrea, Italy) board is chosen, which has an ATmega2560 microcontroller, 54 digital I/O, 16 analog I/O, and a 5 V power supply.
6. Results and Discussion
Before the method is applied, it is necessary to obtain the empirical parameter values of the corresponding tests. Employing Coulomb counting and full discharge, the values of β = 0.1080 and α = 0.1641 are found. The parameter β is the average difference between the voltage in open circuit, Vemf, and the voltage after the second pulse, Vmax. The relationship between SOC, Vemf, and Vmax is shown in Figure 3. Only values between 20% and 90% of the SOC are measured since at the extremes (0 to 20% and 90% to 100%), the cell does not have a linear behavior and may erroneously affect the results.
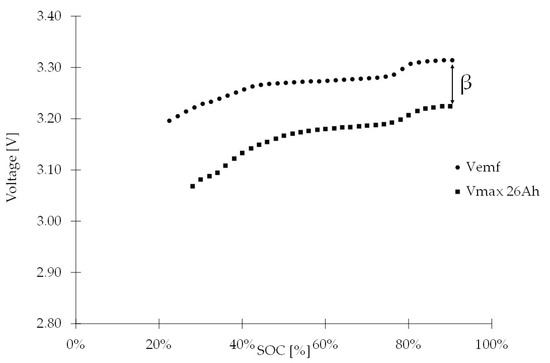
Figure 3.
Vmax with 9 A pulse for a 26 Ah cell.
Now, considering the relationship between Crate and ΔV2, the parameters δ = 25.553 and γ = −0.0548 are found as shown in Figure 4.
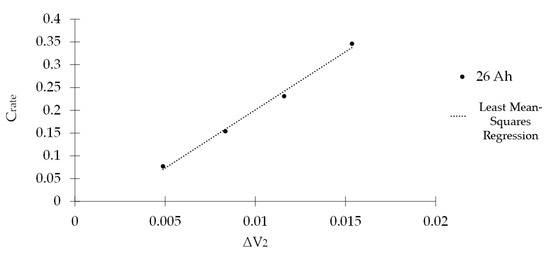
Figure 4.
Relationship between current discharge rate (Crate) and ΔV2.
For more details on how to obtain the parameters, please refer to [8,9].
Once the parameters have been obtained, tests are carried out applying the two-pulse method. In the first six iterations, a charger (iChargerDuo) is used to apply the discharge pulses. Time and voltage measurements are recorded manually. The results are shown in Table 5.
Table 5.
Preliminary results for cell 26253_6-2-2.
In this first result, the SOC and SOH values are not consistent. Although the battery was almost new, it did not make sense that the state of charge increased as discharge pulses were applied. This happened because the charger is not capable of generating discharge pulses, but gradually increases the discharge current of the battery until the indicated value is reached.
For this reason, a setup that reduces the error induced by manual tests is required. The solution was to use the Metrohm Autolab 10 A Booster. This equipment is programmed as shown in Figure 5. The equipment enables taking voltage measurements at the exact time and applying real discharge pulses.
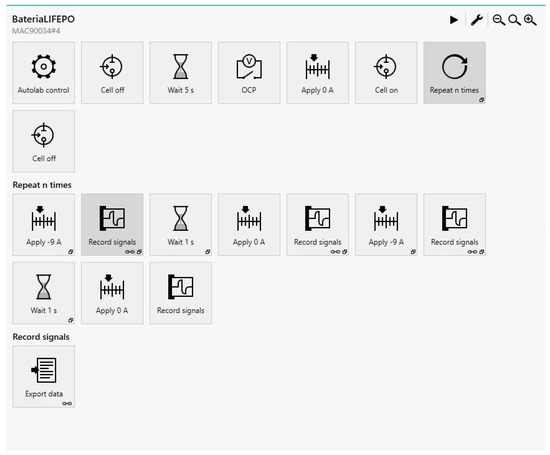
Figure 5.
Booster two-pulse method program.
Figure 6 shows the setup implemented for taking voltage measurements and applying the discharge pulses. This ensures that the pulses are identical and are applied at the same time.
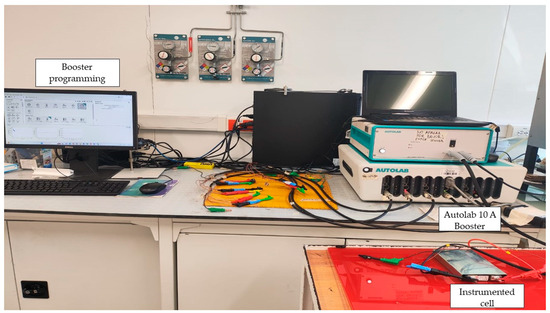
Figure 6.
Assembly for applying discharge pulses.
Table 6 shows the voltages obtained with 6 A pulses, which can be visualized in Figure 7. The results for different current values are also shown.
Table 6.
Results with the booster for different current pulses for cell 26253_6-2-2.
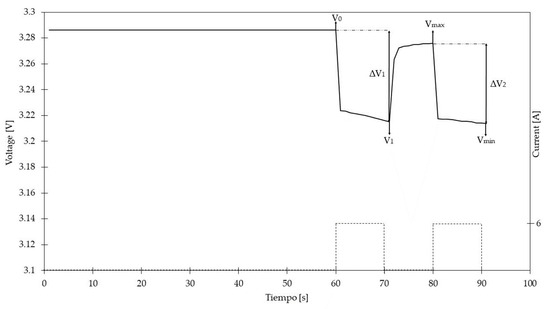
Figure 7.
Waveform of voltages obtained with Microhm Autolab.
After obtaining the voltages with the setup shown in Figure 6, we move to another setup where the calculations are performed to estimate the SOC and SOH. Deformation and temperature measurements are also made. Initially, these values were supposed to be measured at the same time with the Microhm Autolab, but, for availability reasons, these tests were performed separately.
Figure 8 shows the assembly made for this procedure, which has a graphical interface developed in LabVIEW that enables reading of the previous voltages, measurement of the new variables, and presentation of the results in a more organized way. It also allows us to have a history for future reference.

Figure 8.
Setup to measure variables and SOH estimation.
Figure 9 shows the SOC, SOH, battery temperature (BTE), and battery deformation (BDE) or strain results obtained for the case where 8 A is applied to the cell.
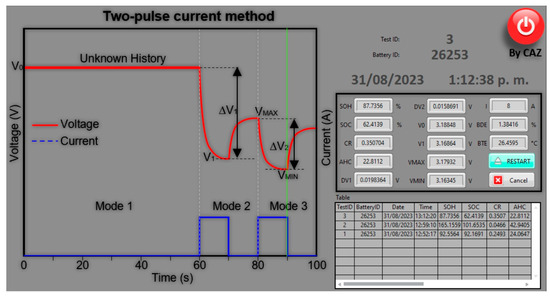
Figure 9.
Graphical interface of the software for measurement and estimation.
This time, the values are consistent since the SOC is decreasing as different discharge pulses are applied, starting with the battery charged, and the SOH is in an expected range. As there is no equipment to measure and check the resolved values, due to the repeatability of the measurement and knowing the history of the batteries, it is observed that the standard error of the mean (SEM) averages 4.5%.
Table 7 shows the summary along with the other results obtained.
Table 7.
Results at different currents for cell 26253_6-2-2.
Also, it can be observed that when the current is extremely low, as in the case of 2A, reliable results are not achieved. It is necessary to guarantee a current of at least 15% of the total capacity of the battery. Finally, deformation measurements can reveal degradation, even if it is not visually apparent. An increase in this value over time signals deterioration. Likewise, analyzing the temperature can help in identifying optimal operating conditions.
Table 8 shows the results of applying the method to a cell damaged by a deep discharge. This cell is inflated and its SOH is low; so, it can be said that it has reached the end of its lifespan.
Table 8.
Results for degraded cell.
In the same way, the method is verified with the other available cells. The results are shown in Table 9.
Table 9.
Results for different cells with pulses of 6 A.
Based on the results, the two-pulse method approximates the battery’s state of health, aiding in decision making regarding its usage. But, the usage in real conditions is challenging due to the requirements in currents, the empirical parameters, and measurement processes that are hard to implement. In the case of a BESS, decommissioning and recommissioning are necessary to perform these measurements in a controlled environment. Also, the standard error of the mean obtained should be informed in a simple qualitative scale denoting the SOH of the battery, i.e., as Excellent, Good, or Bad to eliminate biasing. These ranges should be determined in further works.
7. Conclusions
The method provides a rapid and approximate estimate of the battery’s state of health within minutes. It is important to consider that the initial characterization of the batteries to find empirical parameters may be time-consuming. To apply the method correctly, equipment capable of supplying controlled discharge pulses is required. This prerequisite restricts the method’s applicability in diverse environments. The method proves effective for different current pulses, while factoring in the minimum current stipulation, which must be at least 15% of the battery capacity. The average standard error of the mean (SEM) is less than 10% through the repeatability of the tests. Also, the deformation measurement allows further information on how degraded the battery is. The result shows that the higher the value, the more degraded the battery is. Although, no data-related information was included in the used equations. This will be left for further work. The temperature measurement helps to improve the operating conditions according to how the other variables are behaving.
Author Contributions
Conceptualization, C.Z., C.A.Z. and J.V.R.; methodology, C.Z. and C.A.Z.; software, C.Z. and C.A.Z.; validation, C.Z. and J.V.R.; formal analysis, C.Z.; investigation, C.Z. and C.A.Z.; writing—original draft preparation, C.Z.; writing—review and editing, C.A.Z. and J.V.R.; supervision, C.A.Z. and J.V.R.; project administration, C.A.Z. All authors have read and agreed to the published version of the manuscript.
Funding
This research was funded by Universidad Pontificia Bolivariana (Project 686C-08/21-19) and Energética 2030 alliance (Project 238C-06/18-26).
Data Availability Statement
The data used to support the findings of this study are available from the corresponding author upon request.
Conflicts of Interest
The authors declare no conflict of interest.
References
- Hannan, M.A.; Wali, S.B.; Ker, P.J.; Rahman, M.S.A.; Mansor, M.; Ramachandaramurthy, V.K.; Muttaqi, K.M.; Mahlia, T.M.I.; Dong, Z.Y. Battery energy-storage system: A review of technologies, optimization objectives, constraints, approaches, and outstanding issues. J. Energy Storage 2021, 42, 103023. [Google Scholar] [CrossRef]
- Unidad de Planeación Minero-Energética UPME. Proyección Demanda Energía Eléctrica Gas Natural y Combustibles Líquidos 2022–2036. 2022. Available online: https://repositoriobi.minenergia.gov.co/handle/123456789/2860 (accessed on 3 March 2023).
- European Commission. Directive 2001/77/EC on the promotion of electricity produced from renewable energy sources in the internal energy market. Off. J. Eur. Communities 2001, L 283, 33–40. [Google Scholar]
- Departamento Nacional de Planeación; Enersinc; Korea Green Goruth Paternship; World Bank Group. Energy Supply Situation in Colombia; Departamento Nacional de Planeación: Bogotá, Colombia, 2017; p. 165. Available online: https://www.dnp.gov.co/Crecimiento-Verde/Documents/ejes-tematicos/Energia/MCV-Energy Supply Situation vf.pdf (accessed on 3 March 2023).
- Zakeri, B.; Syri, S. Electrical energy storage systems: A comparative life cycle cost analysis. Renew. Sustain. Energy Rev. 2015, 42, 569–596. [Google Scholar] [CrossRef]
- May, G.J.; Davidson, A.; Monahov, B. Lead batteries for utility energy storage: A review. J. Energy Storage 2018, 15, 145–157. [Google Scholar] [CrossRef]
- Behabtu, H.A.; Messagie, M.; Coosemans, T.; Berecibar, M.; Anlay Fante, K.; Kebede, A.A.; Mierlo, J.V. A review of energy storage technologies’ application potentials in renewable energy sources grid integration. Sustainability 2020, 12, 10511. [Google Scholar] [CrossRef]
- Marchildon, J.; Doumbia, M.L.; Agbossou, K. SOC and SOH characterisation of lead acid batteries. In Proceedings of the IECON 2015—41st Annual Conference of the IEEE Industrial Electronics Society, Yokohama, Japan, 9–12 November 2015; pp. 1442–1446. [Google Scholar] [CrossRef]
- Sun, F.; Xiong, R.; He, H. Estimation of state-of-charge and state-of-power capability of lithium-ion battery considering varying health conditions. J. Power Sources 2014, 259, 166–176. [Google Scholar] [CrossRef]
- Coleman, M.; Hurley, W.G.; Lee, C.K. An improved battery characterization method using a two-pulse load test. IEEE Trans. Energy Convers. 2008, 23, 708–713. [Google Scholar] [CrossRef]
- Raju, A.D.J.; Manohar, S.S.; Beula, A.A.S. A Behavior Modelling and Analysis of Lithium Ion Battery. In Proceedings of the 2023 2nd International Conference for Innovation in Technology (INOCON), Bangalore, India, 3–5 March 2023; pp. 1–5. [Google Scholar] [CrossRef]
- Hammou, A.; Petrone, R.; Diallo, D.; Gualous, H. Estimating the Health Status of Li-ion NMC Batteries from Energy Characteristics for EV Applications. IEEE Trans. Energy Convers. 2023, 38, 2160–2168. [Google Scholar] [CrossRef]
- Li, M.; Cao, Y.; Wang, C.; Li, F. Evaluation and Analysis of Circuit Model for Lithium Batteries. In Proceedings of the 2022 41st Chinese Control Conference (CCC), Hefei, China, 25–27 July 2022; pp. 1343–1348. [Google Scholar] [CrossRef]
- Bobanac, V.; Basic, H.; Pandzic, H. Determining Lithium-ion Battery One-way Energy Efficiencies: Influence of C-rate and Coulombic Losses. In Proceedings of the IEEE EUROCON 2021—19th International Conference on Smart Technologies, Lviv, Ukraine, 6–8 July 2021; pp. 385–389. [Google Scholar] [CrossRef]
- Al Rasyid Ar, Z.J.; Firmansyah, E.; Wijaya, F.D. Modeling of Temperature Effect on SoC of Lithium Ion Battery Pack. In Proceedings of the 2021 3rd International Symposium on Material and Electrical Engineering Conference (ISMEE), Bandung, Indonesia, 10–11 November 2021; pp. 299–303. [Google Scholar] [CrossRef]
- Sun, Q.; Ye, X.; Li, H.; Li, W.; Yuan, R.; Zhai, G. Estimation of Lithium Primary Battery Capacity Based on Pulse Load Test. In Proceedings of the 2021 3rd International Conference on System Reliability and Safety Engineering (SRSE), Harbin, China, 26–28 November 2021; pp. 139–144. [Google Scholar] [CrossRef]
- Basic, H.; Pandzic, H.; Miletic, M.; Pavic, I. Experimental Testing and Evaluation of Lithium-Ion Battery Cells for a Special-Purpose Electric Vacuum Sweeper Vehicle. IEEE Access 2020, 8, 216308–216319. [Google Scholar] [CrossRef]
- Diaz, C.; Quintero, V.; Pérez, A.; Jaramillo, F.; Burgos-Mellado, C.; Rozas, H.; Orchard, M.E.; Sáez, D.; Cárdenas, R. Particle-Filtering-Based Prognostics for the State of Maximum Power Available in Lithium-Ion Batteries at Electromobility Applications. IEEE Trans. Veh. Technol. 2020, 69, 7187–7200. [Google Scholar] [CrossRef]
- Akkinepally, B.; Reddy, I.N.; Manjunath, V.; Reddy, M.V.; Mishra, Y.K.; Ko, T.J.; Zaghib, K.; Shim, J. Temperature effect and kinetics, LiZr2(PO4)3 and Li1.2Al0.2Zr1.8(PO4)3 and electrochemical properties for rechargeable ion batteries. Int. J. Energy Res. 2022, 46, 14116–14132. [Google Scholar] [CrossRef]
- Wang, S.E.; Kim, M.J.; Lee, J.W.; Chun, J.; Choi, J.; Roh, K.C.; Kang, Y.C.; Jung, D.S. A Novel High-Performance TiO2−x/TiO1−yNy Coating Material for Silicon Anode in Lithium-Ion Batteries. Small Methods 2022, 6, 2200430. [Google Scholar] [CrossRef] [PubMed]
- Li, S.; Zhang, C.; Du, J.; Cong, X.; Zhang, L.; Jiang, Y.; Wang, L. Fault diagnosis for lithium-ion batteries in electric vehicles based on signal decomposition and two-dimensional feature clustering. Green Energy Intell. Transp. 2022, 1, 100009. [Google Scholar] [CrossRef]
- Quintero, V.; Che, O.; Ching, E.; Auciello, O.; de Obaldia, E. Baterías de Ion Litio: Características y aplicaciones. Lithium Ion Batteries: Features and applications. Rev. I+D Tecnol. 2021, 17, 14–22. [Google Scholar]
- Rahimi-Eichi, H.; Ojha, U.; Baronti, F.; Chow, M.Y. Battery management system: An overview of its application in the smart grid and electric vehicles. IEEE Ind. Electron. Mag. 2013, 7, 4–16. [Google Scholar] [CrossRef]
- Hou, J.; Li, T.; Zhou, F.; Zhao, D.; Zhong, Y.; Yao, L.; Zeng, L. A Review of Critical State Joint Estimation Methods of Lithium-Ion Batteries in Electric Vehicles. World Electr. Veh. J. 2022, 13, 159. [Google Scholar] [CrossRef]
- Pradhan, S.K.; Chakraborty, B. Battery management strategies: An essential review for battery state of health monitoring techniques. J. Energy Storage 2022, 51, 104427. [Google Scholar] [CrossRef]
- Jiang, S.; Song, Z. A review on the state of health estimation methods of lead-acid batteries. J. Power Sources 2022, 517, 230710. [Google Scholar] [CrossRef]
- Contreras Sillero, A.A. Estimación de los Estados de Carga y Salud de Una Batería de Ion-Litio. Master’s Thesis, Instituto Tecnológico de Celaya, Celaya, Mexico, 2018. [Google Scholar]
- Iglesias, R.; Lago, A.; Nogueiras, A.; Martínez-Peñalver, C.; Marcos, J.; Quintans, C.; Moure, M.J.; Valdés, M.D. Modelado y Simulación de Una Batería de Ion-Litio Comercial Multicelda. In Proceedings of the SAAEI 2012, Guimarães, Portugal, 11–13 July 2012; pp. 464–469. Available online: https://www.researchgate.net/publication/234588217_MODELADO_Y_SIMULACION_DE_UNA_BATERIA_DE_ION-LITIO_COMERCIAL_MULTICELDA (accessed on 16 January 2023).
- Pico, J.D. Diseño de un Sistema de Gestión para Baterías de Alto Rendimiento. Master’s Thesis, Pontificia Universidad Javeriana, Bogotá, Colombia, 2019. [Google Scholar]
Disclaimer/Publisher’s Note: The statements, opinions and data contained in all publications are solely those of the individual author(s) and contributor(s) and not of MDPI and/or the editor(s). MDPI and/or the editor(s) disclaim responsibility for any injury to people or property resulting from any ideas, methods, instructions or products referred to in the content. |
© 2023 by the authors. Licensee MDPI, Basel, Switzerland. This article is an open access article distributed under the terms and conditions of the Creative Commons Attribution (CC BY) license (https://creativecommons.org/licenses/by/4.0/).