Enhanced Dynamic Control Strategy for Stacked Dynamic Regulation Frequency Response Services in Battery Energy Storage Systems
Abstract
:1. Introduction
2. Dynamic Regulation (DR)
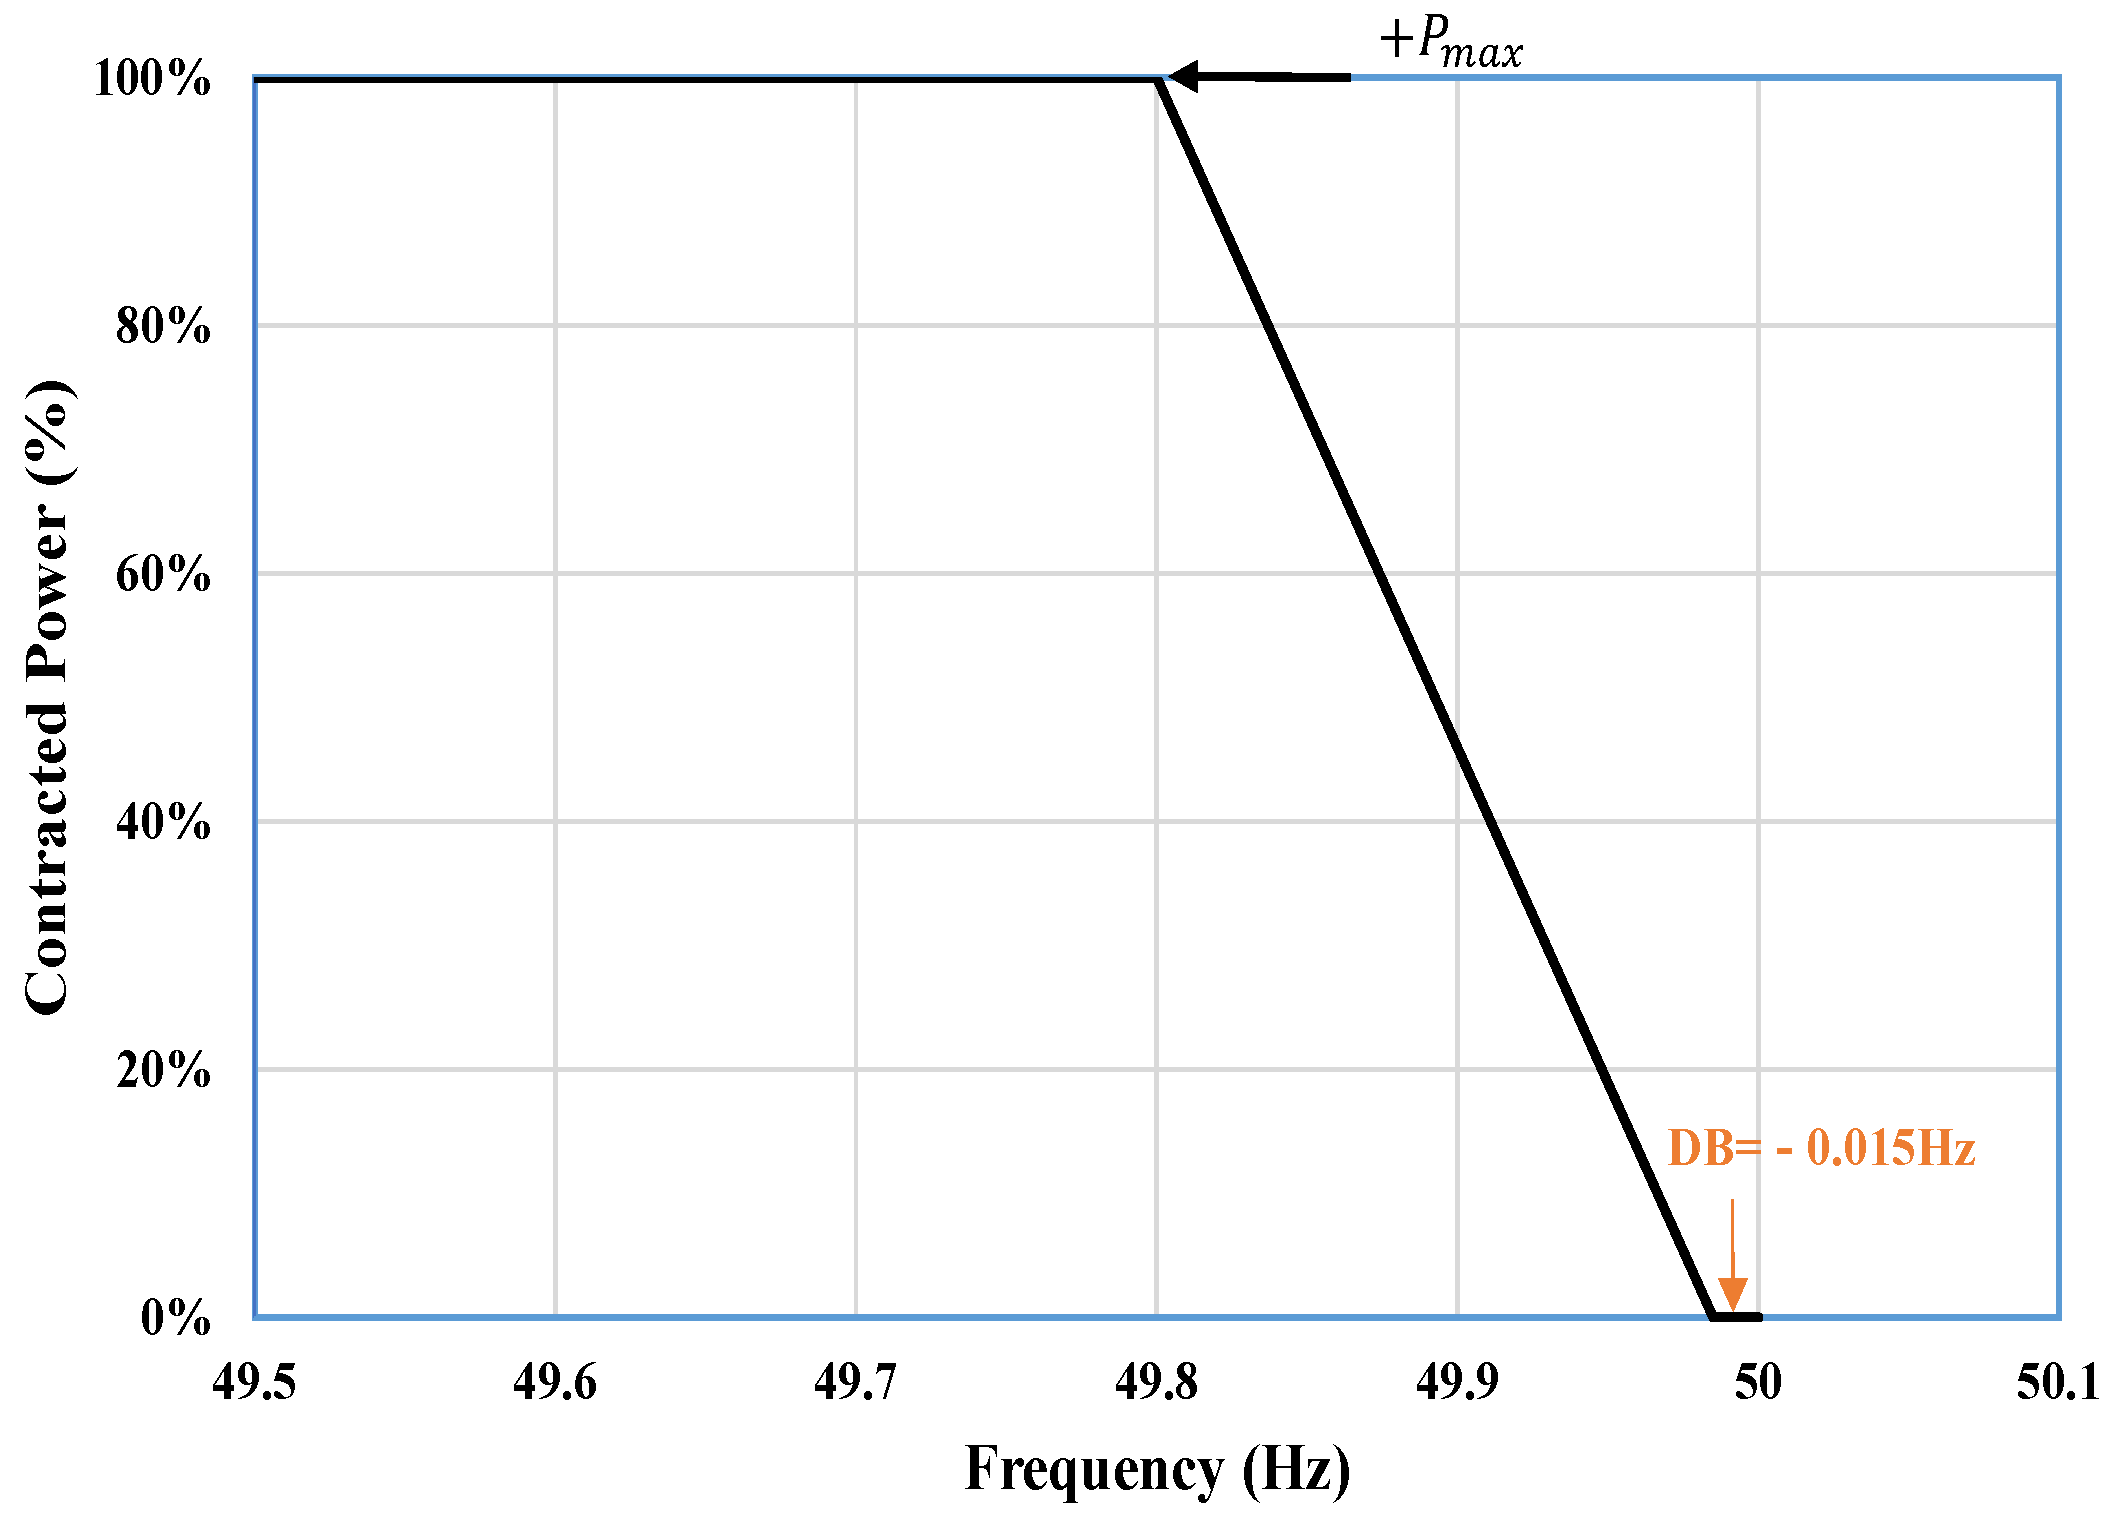
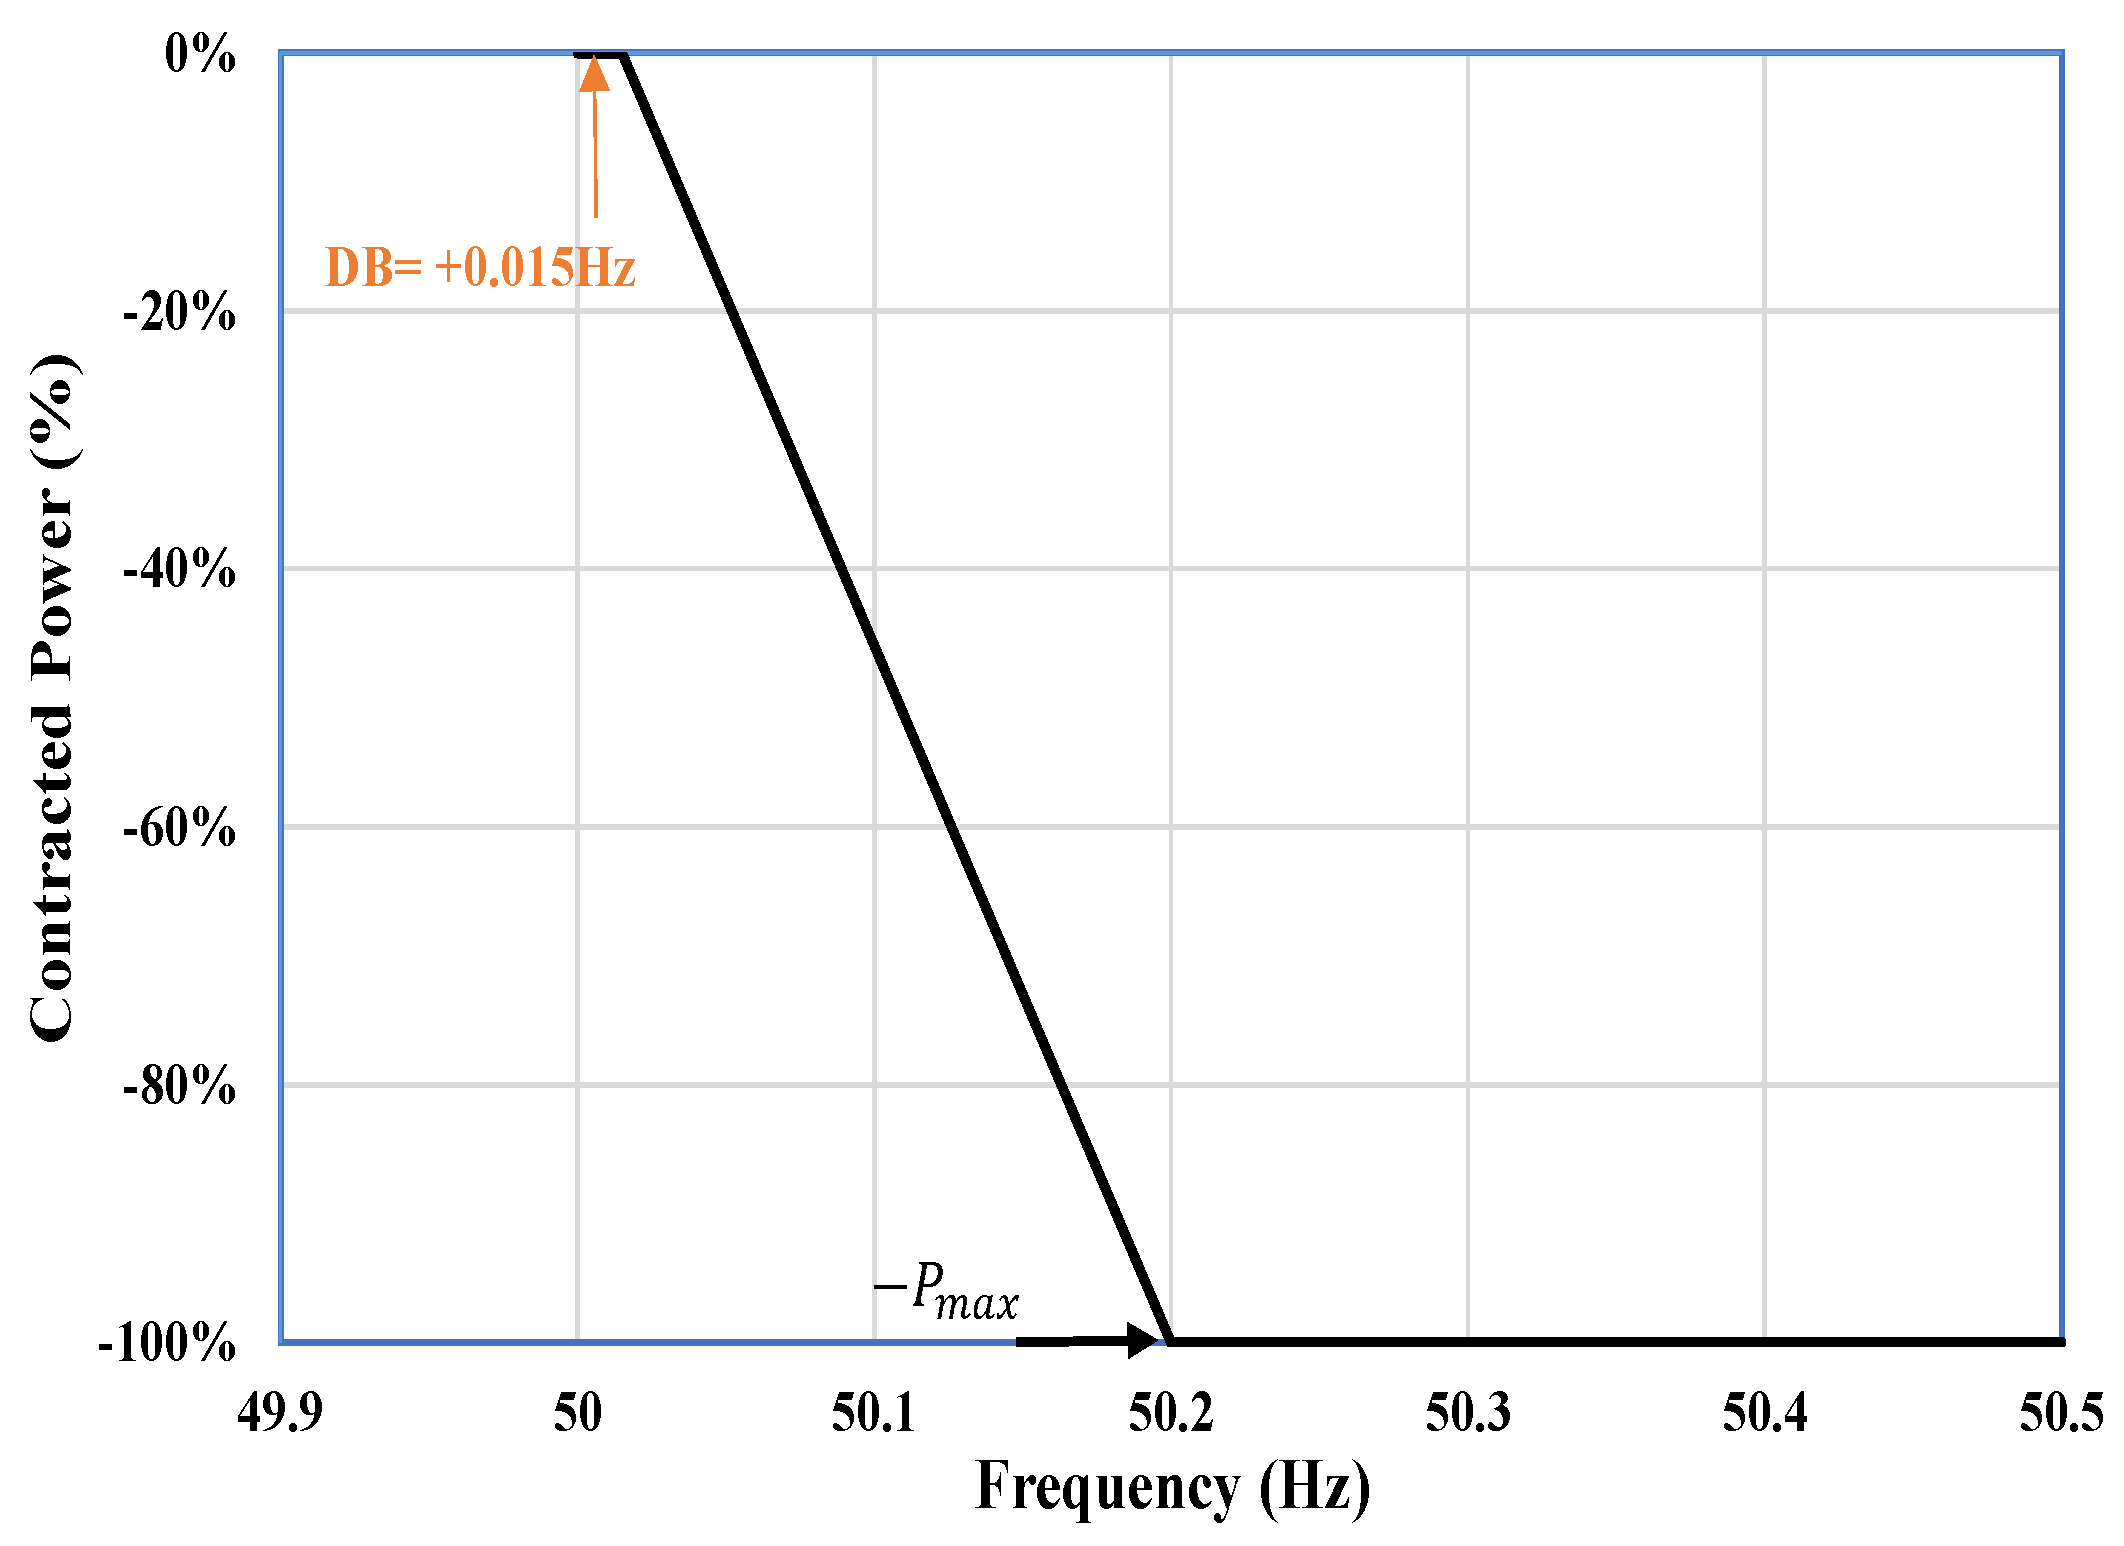
2.1. DR-LF or DR-HF Service Envelope
2.2. DR-LF and DR-HF Service Envelope
2.3. Simulation Results of DR-HF Service Model
2.4. Simulation Results of DR-LF Service Model
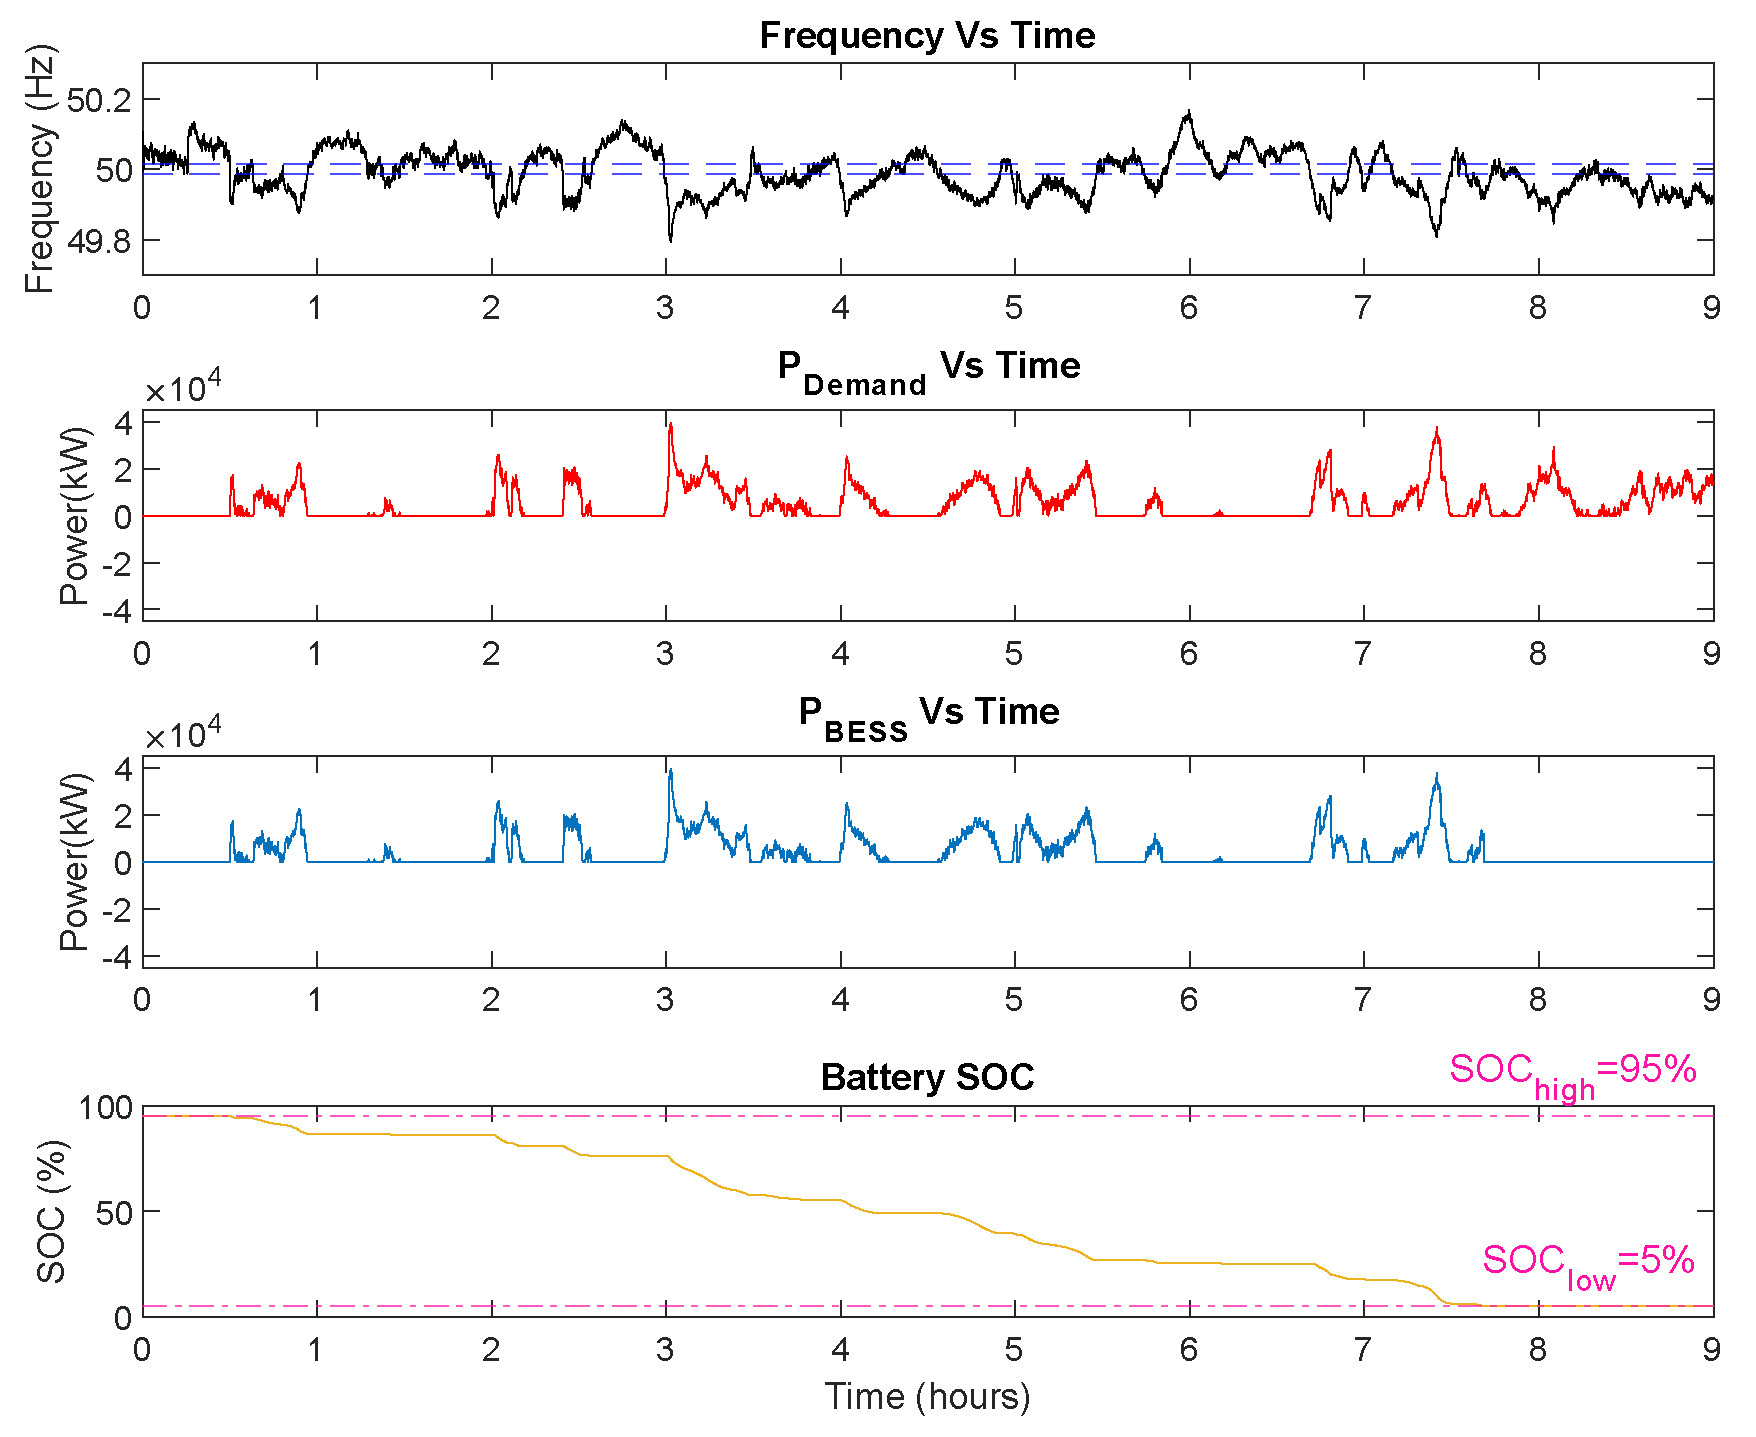
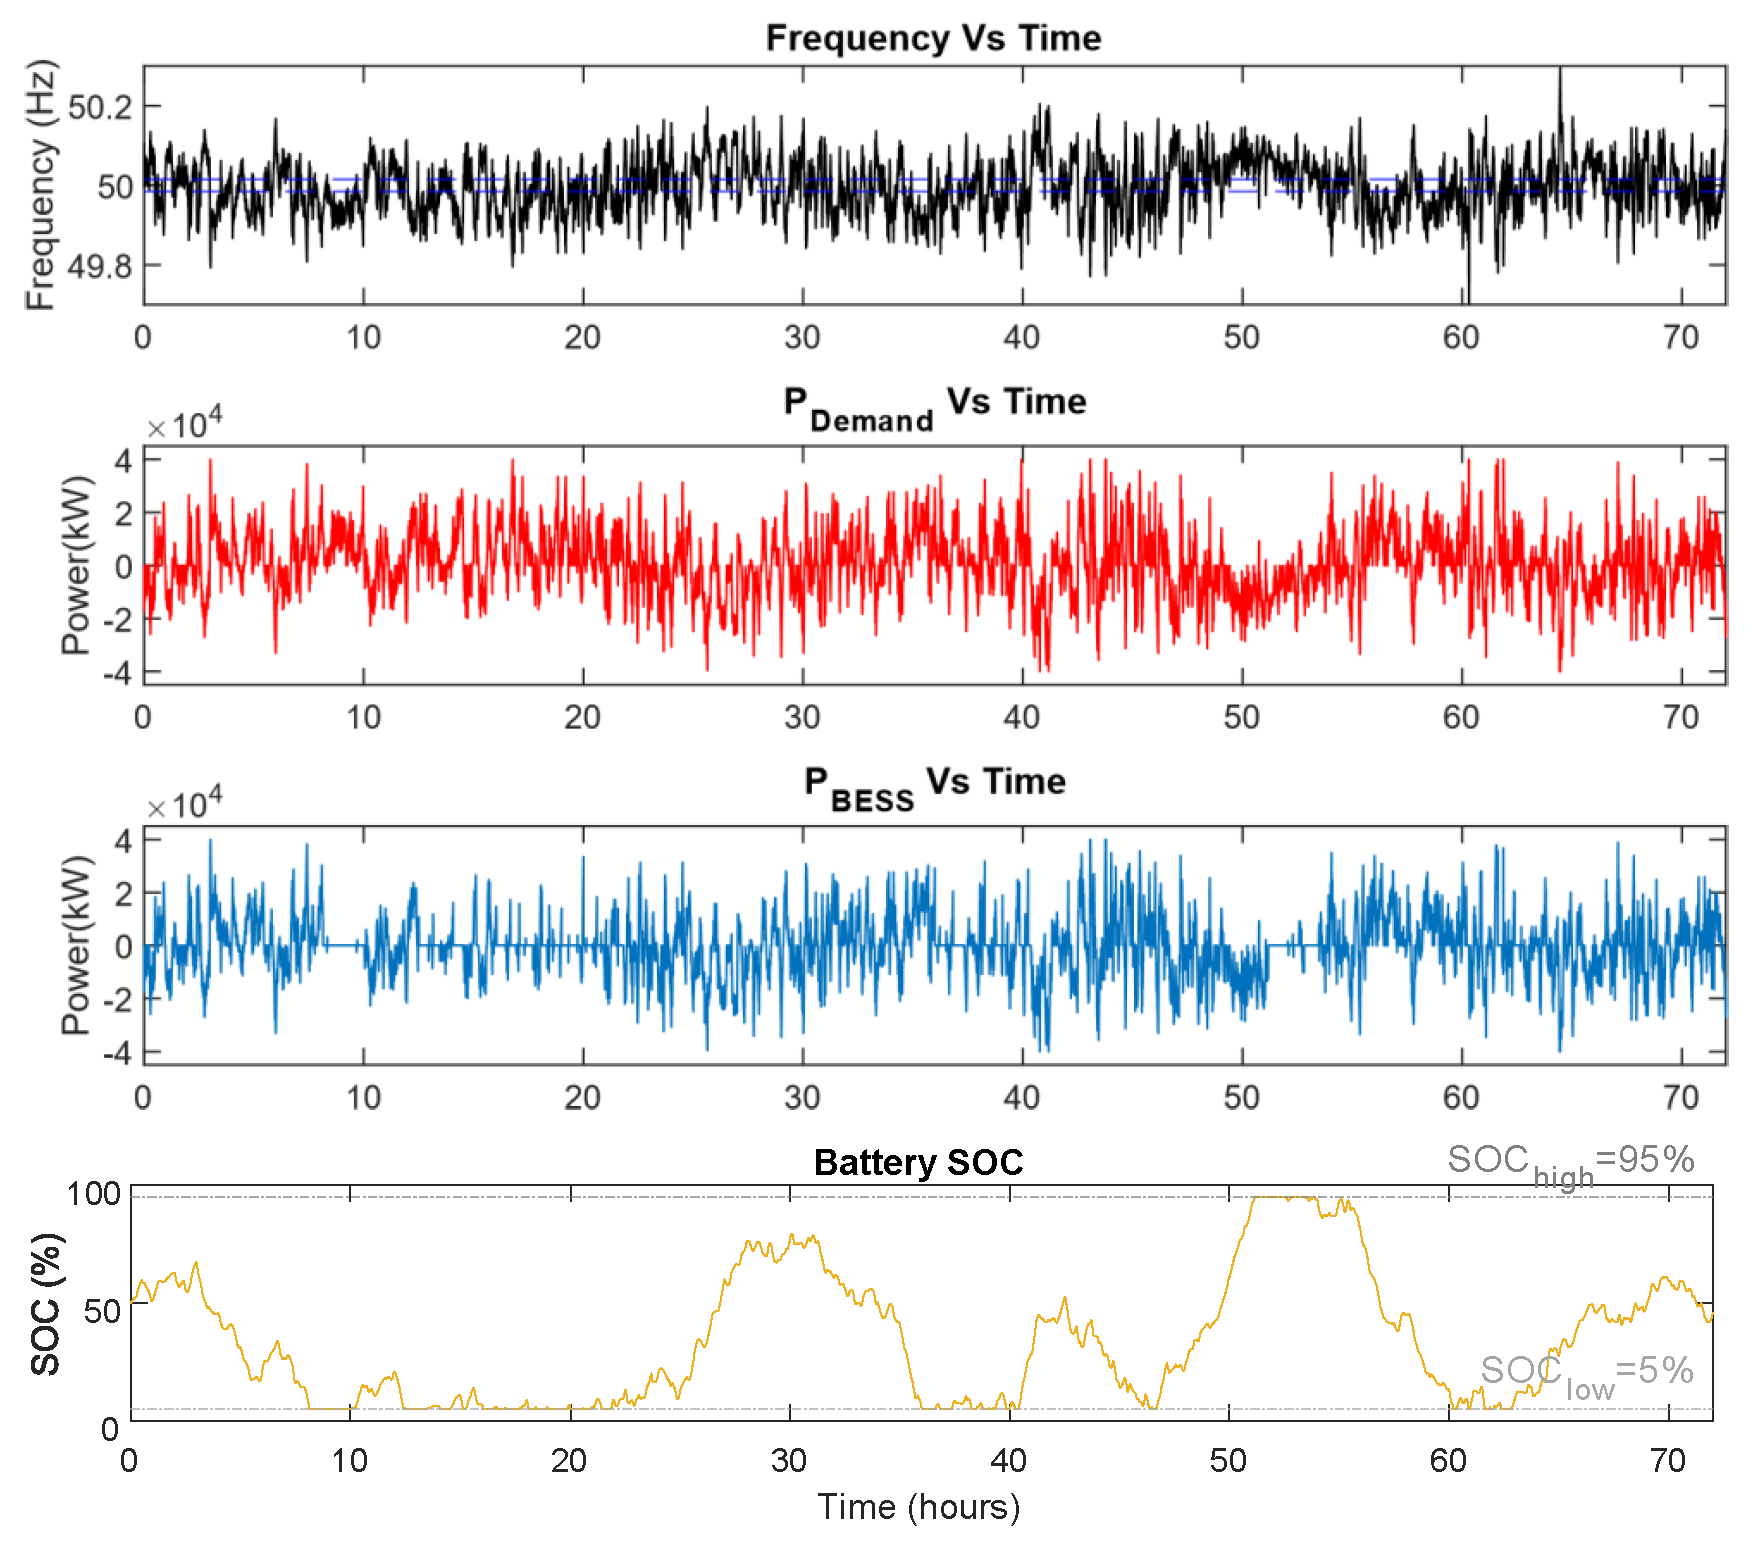
2.5. Simulation Results of Both DR-HF and DR-LF Services
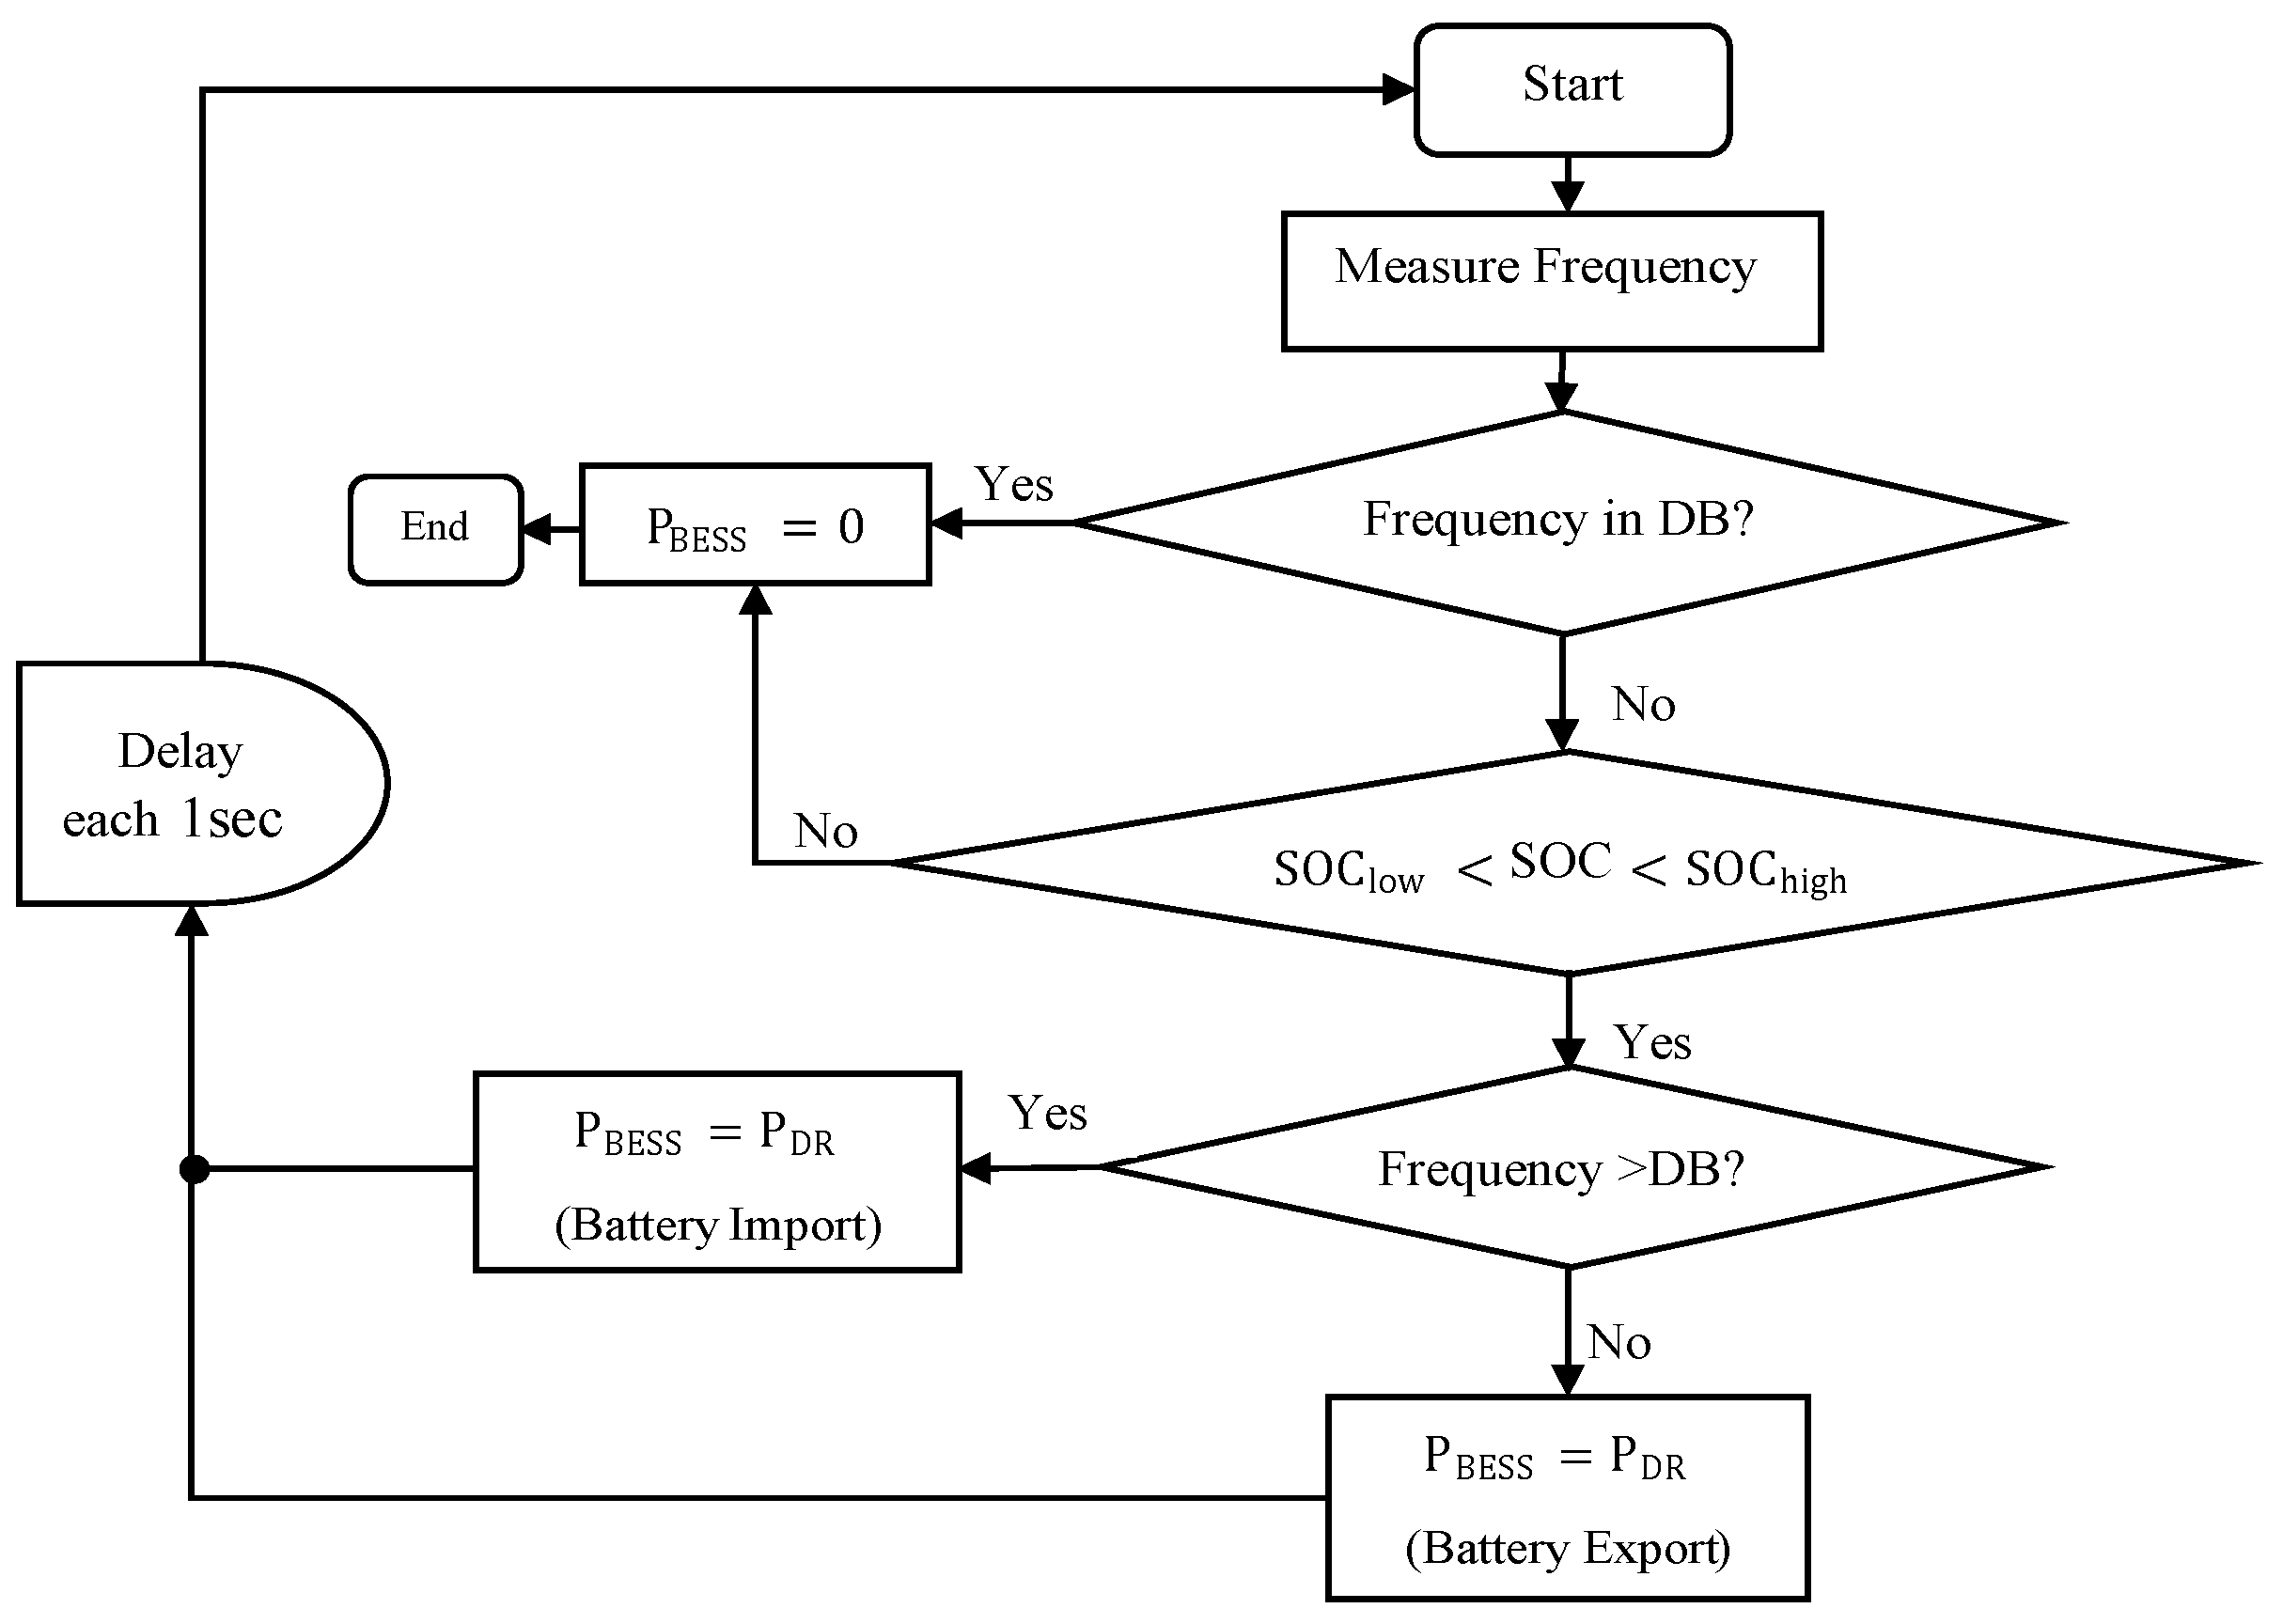
2.6. Dynamic Control of DR-LF or DR-HF
2.6.1. Dynamic Control of DR-HF
2.6.2. Dynamic Control of DR-LF
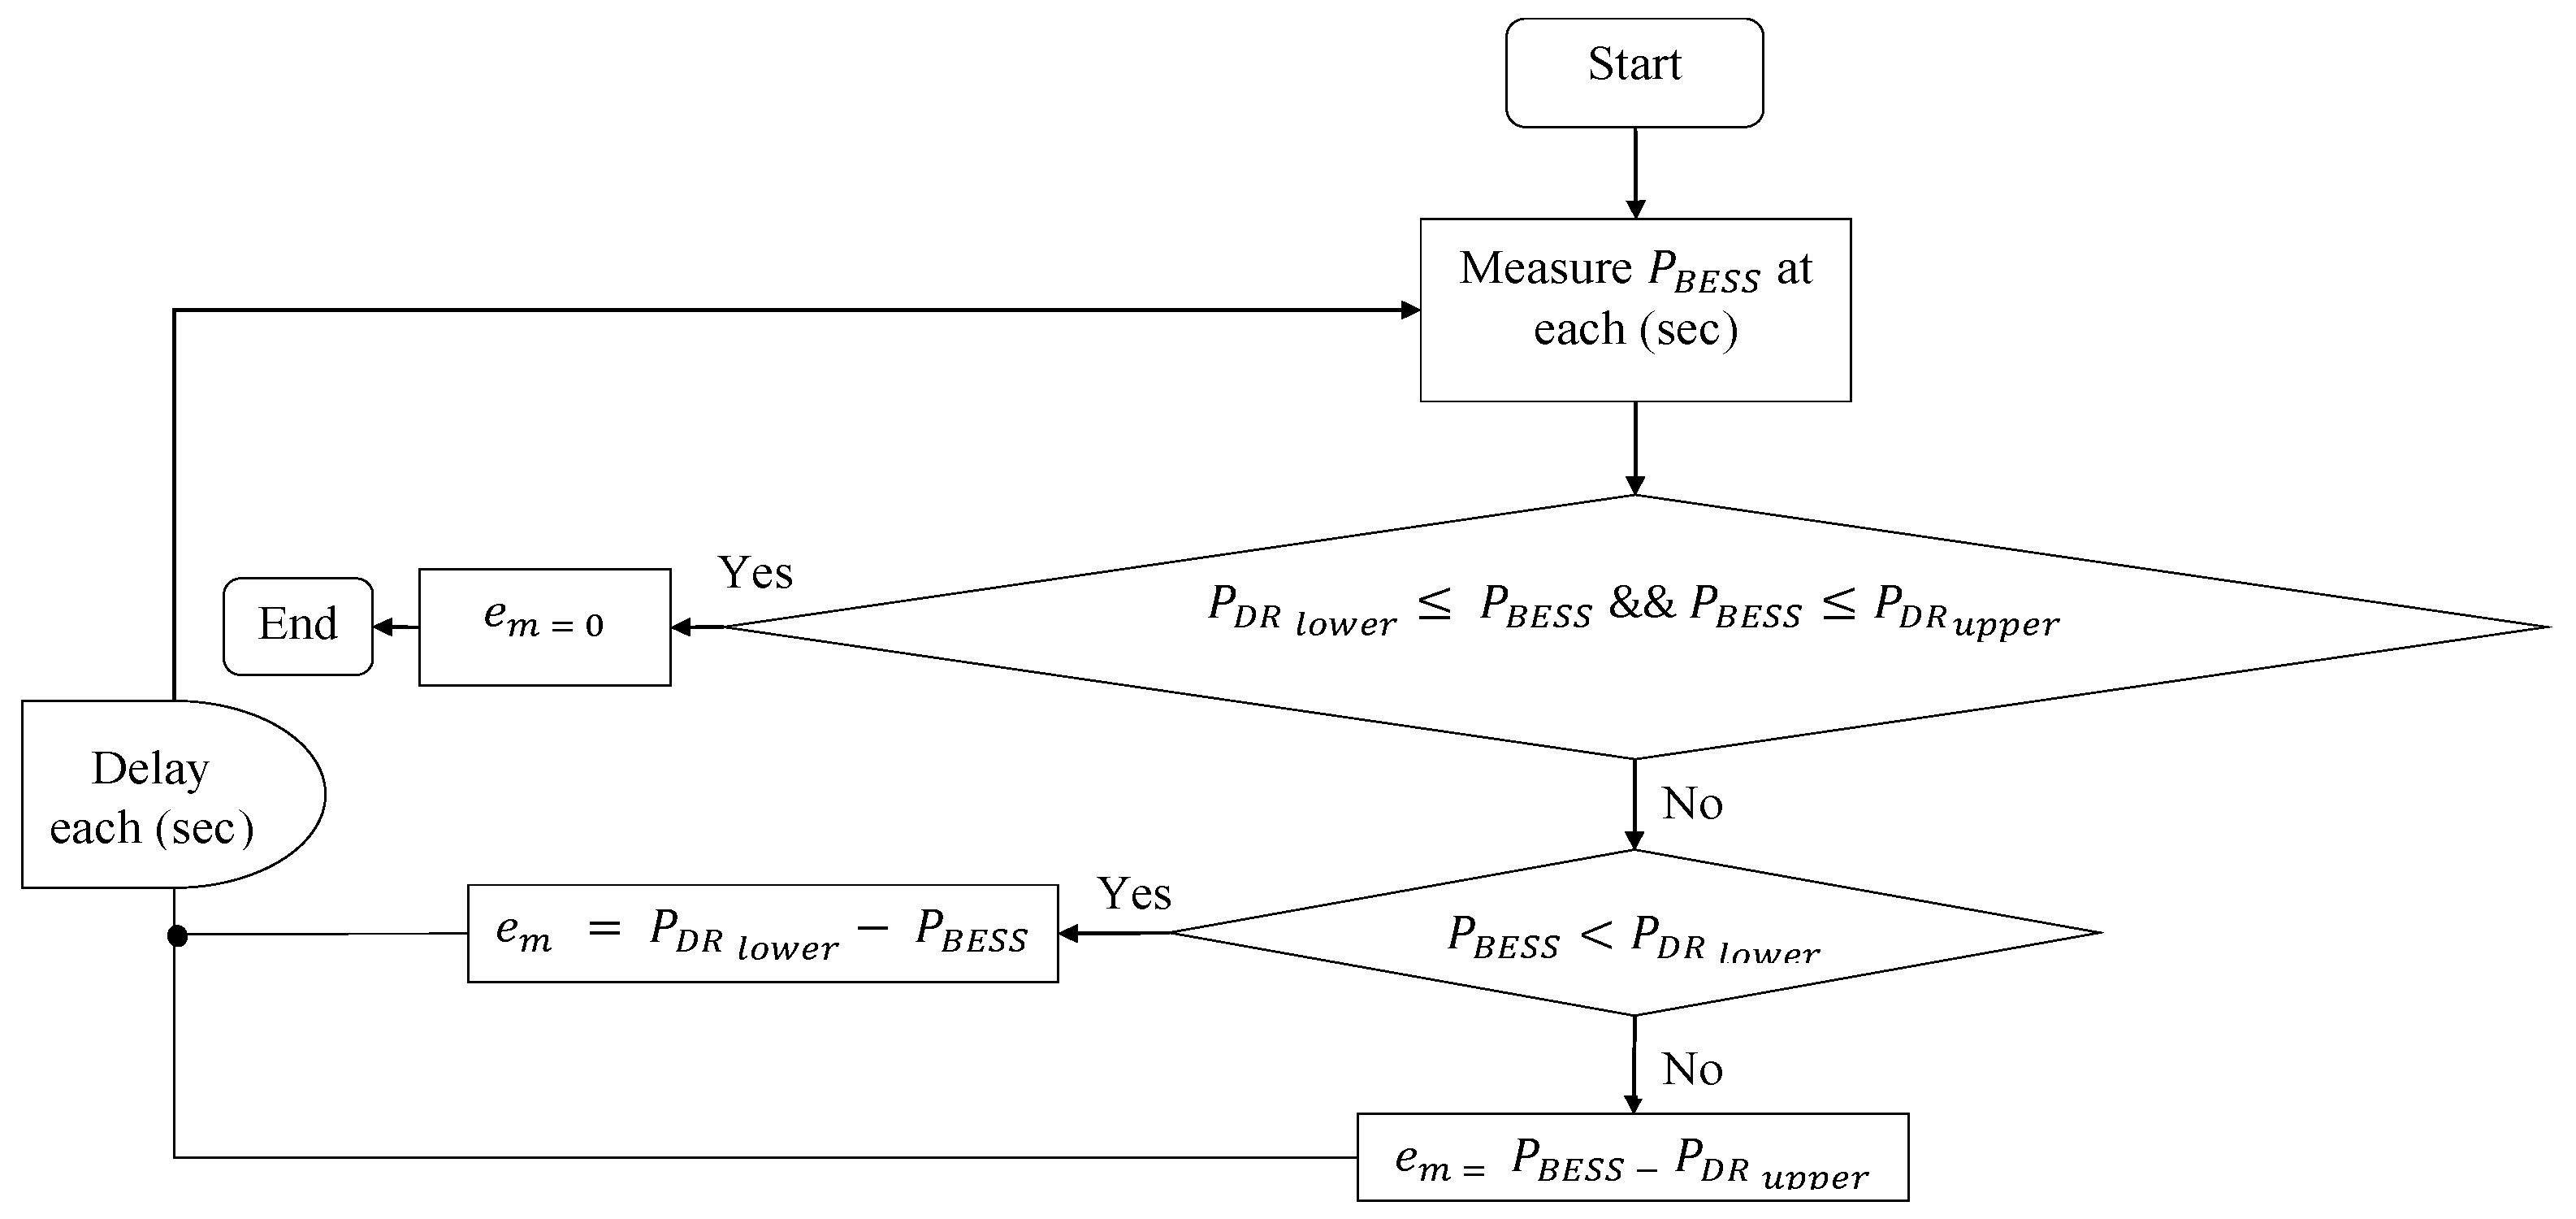
2.7. BESS Availability
2.8. Number of Equivalent Full Cycles (EFCs)
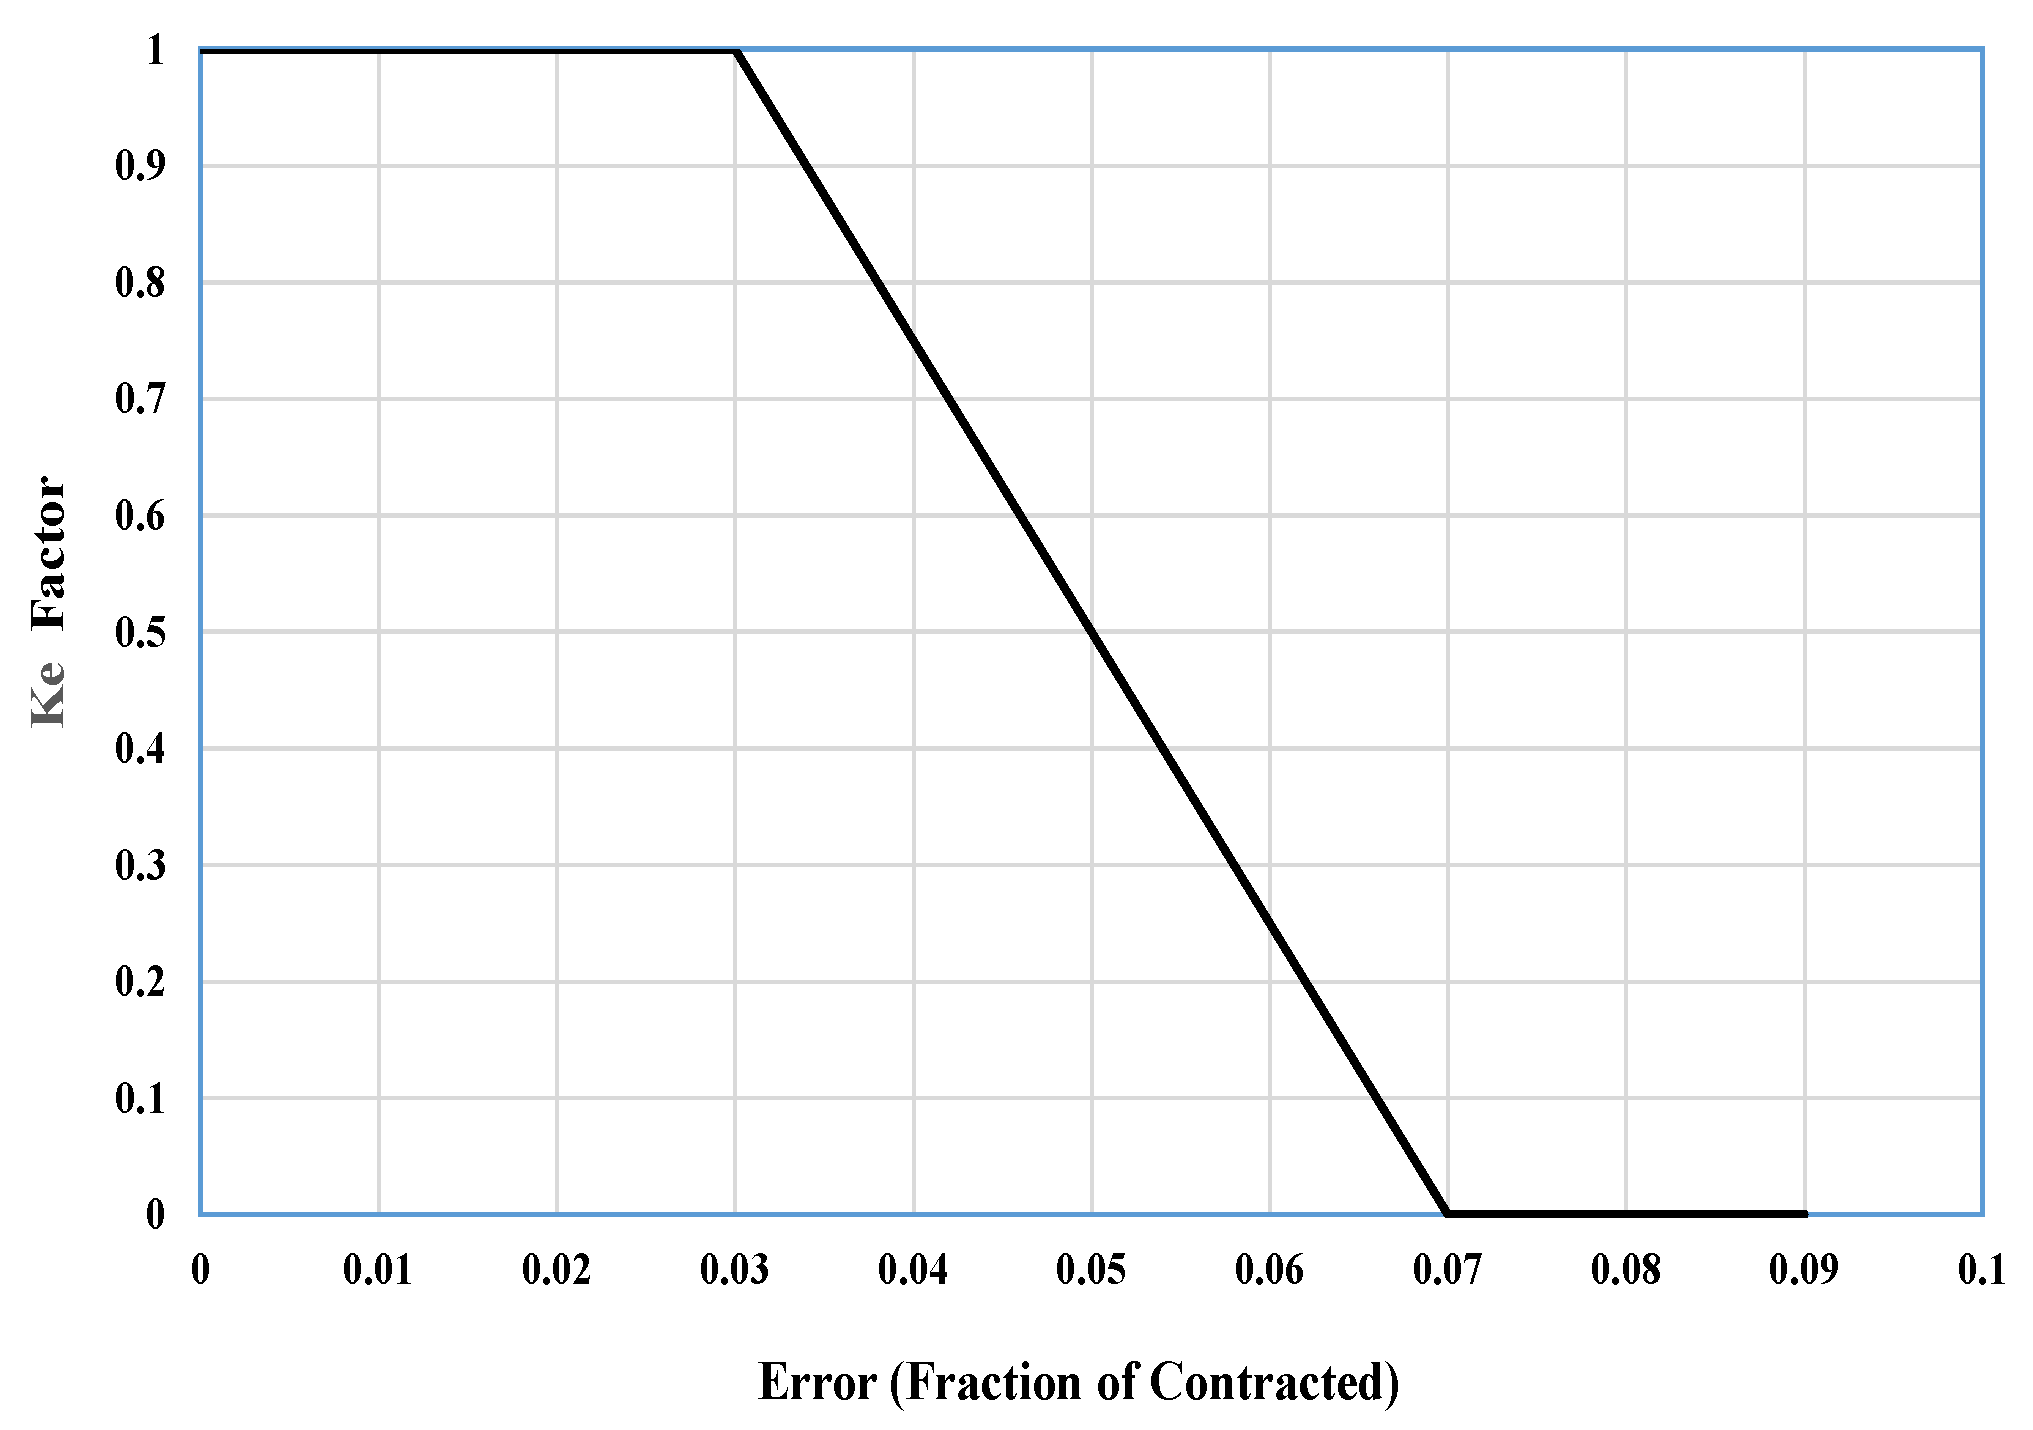
2.9. Penalty Payment
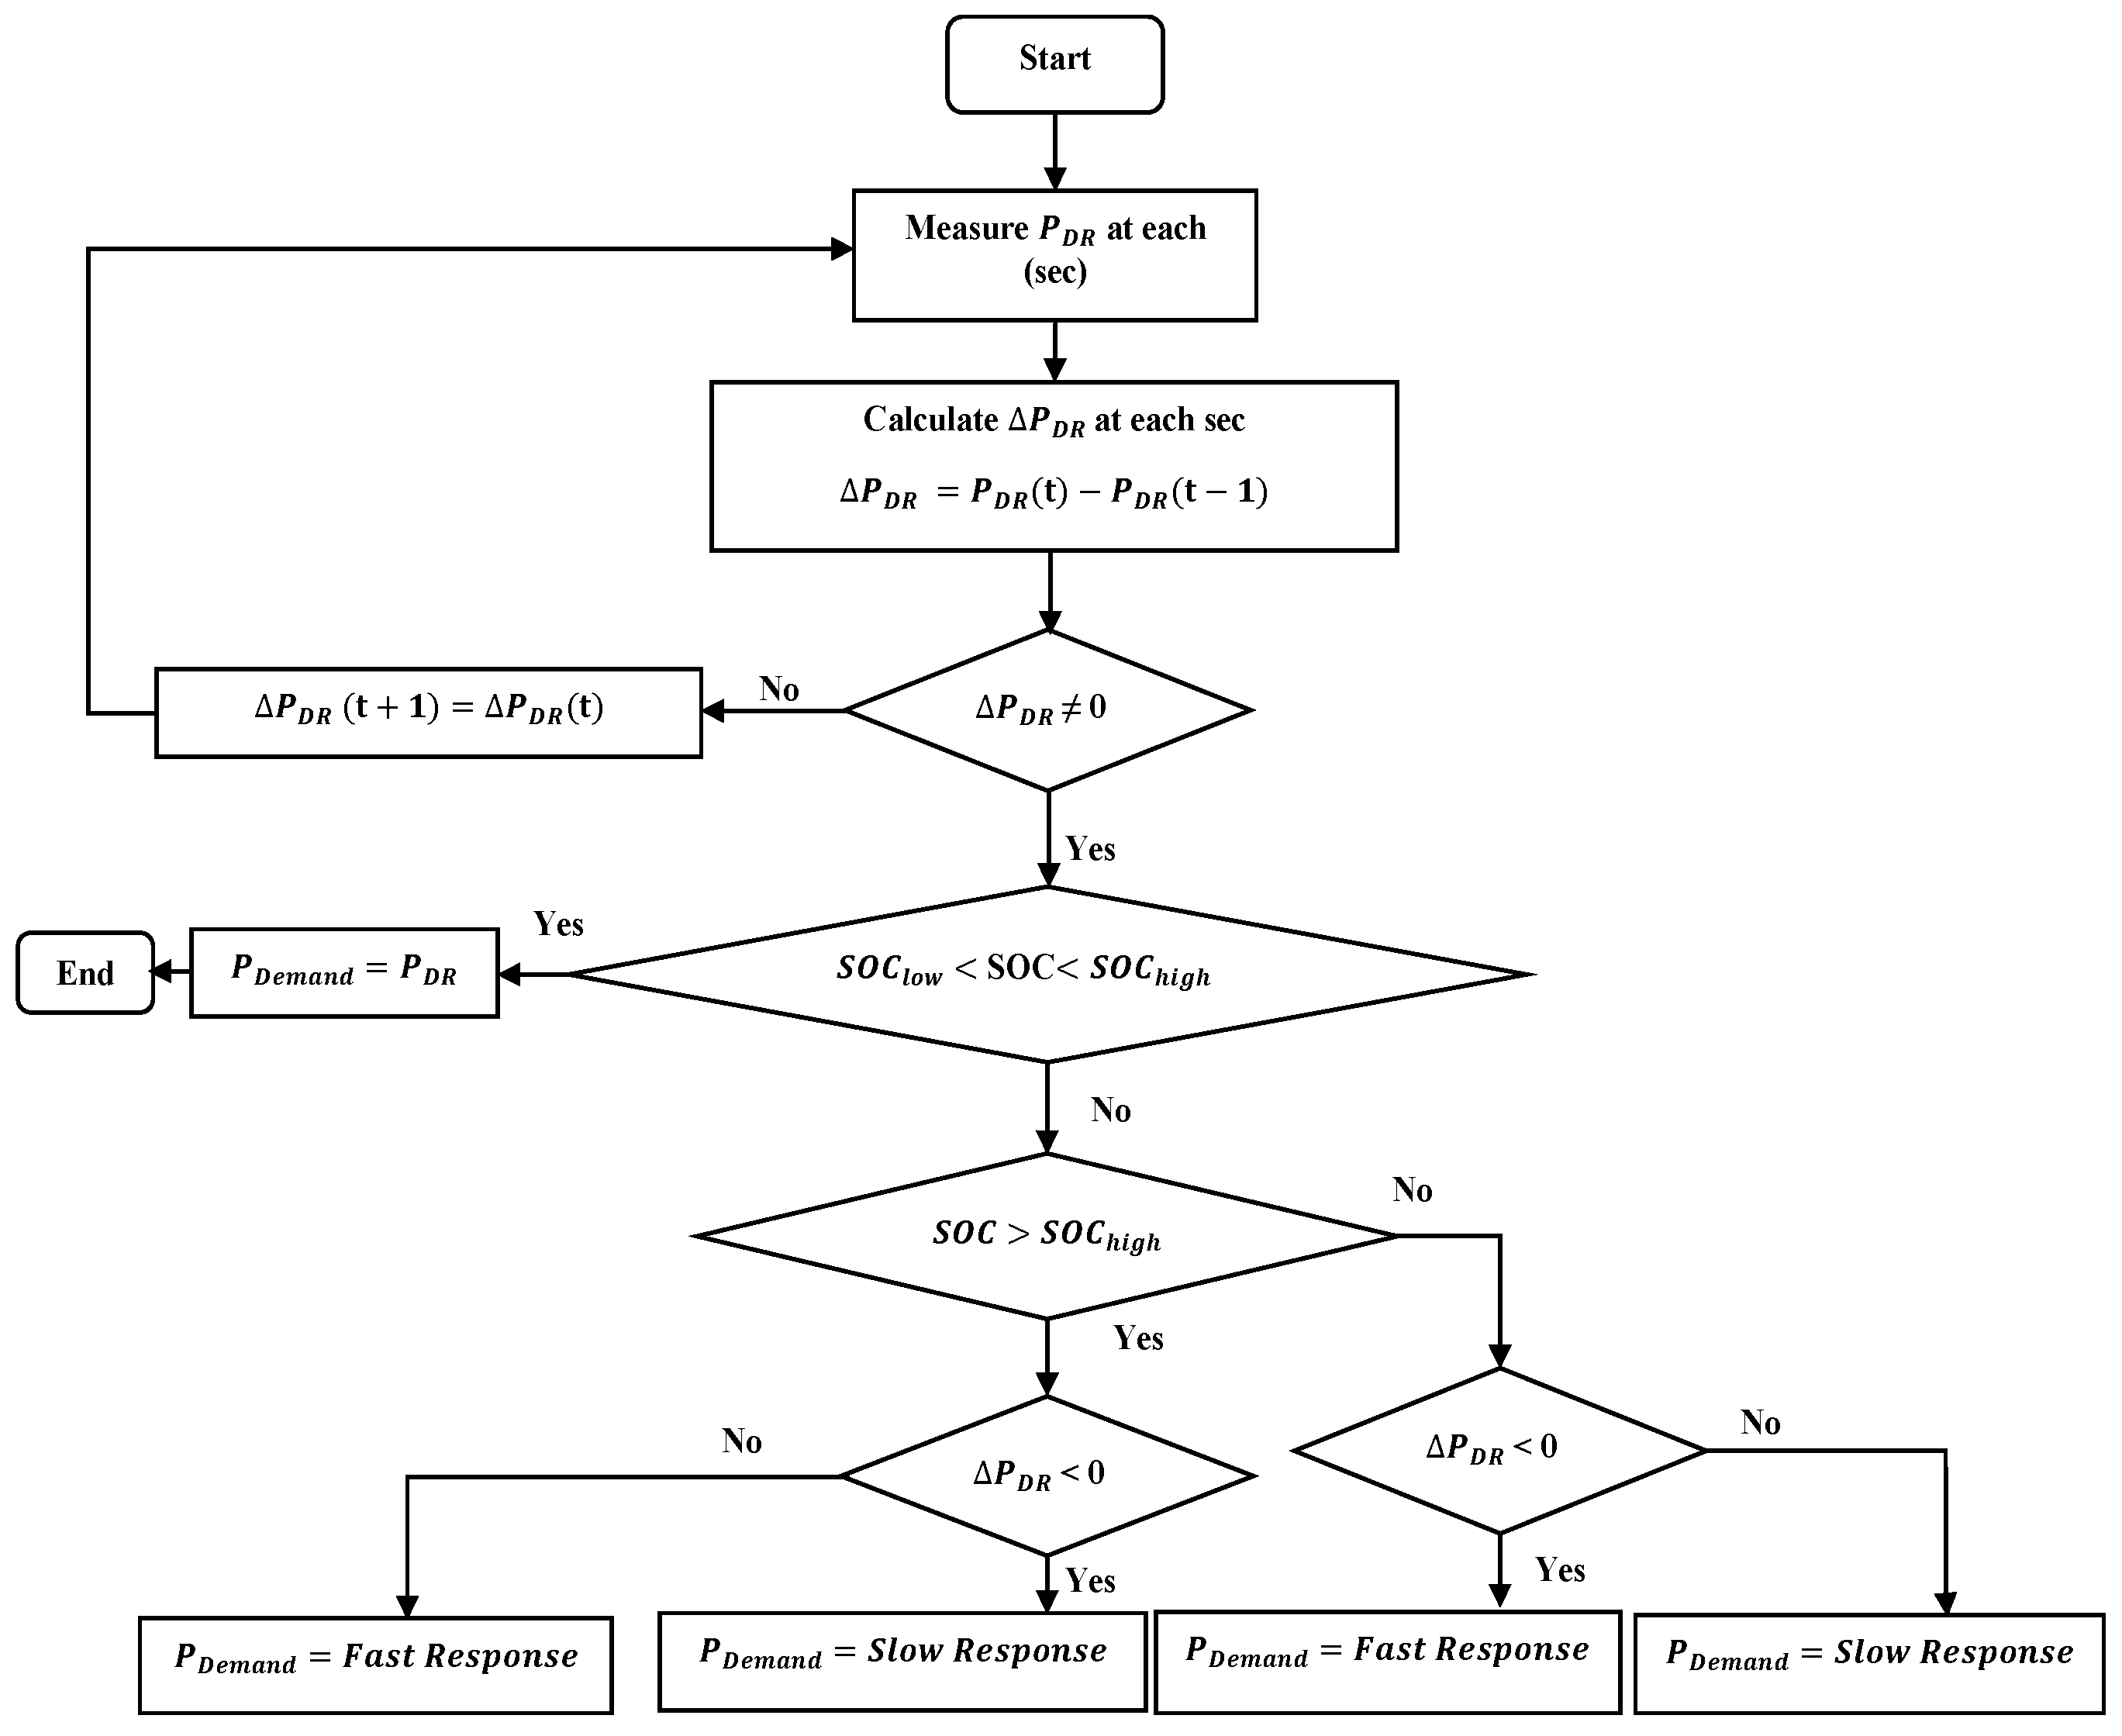
2.10. Dynamic Control of DR-LF and DR-HF
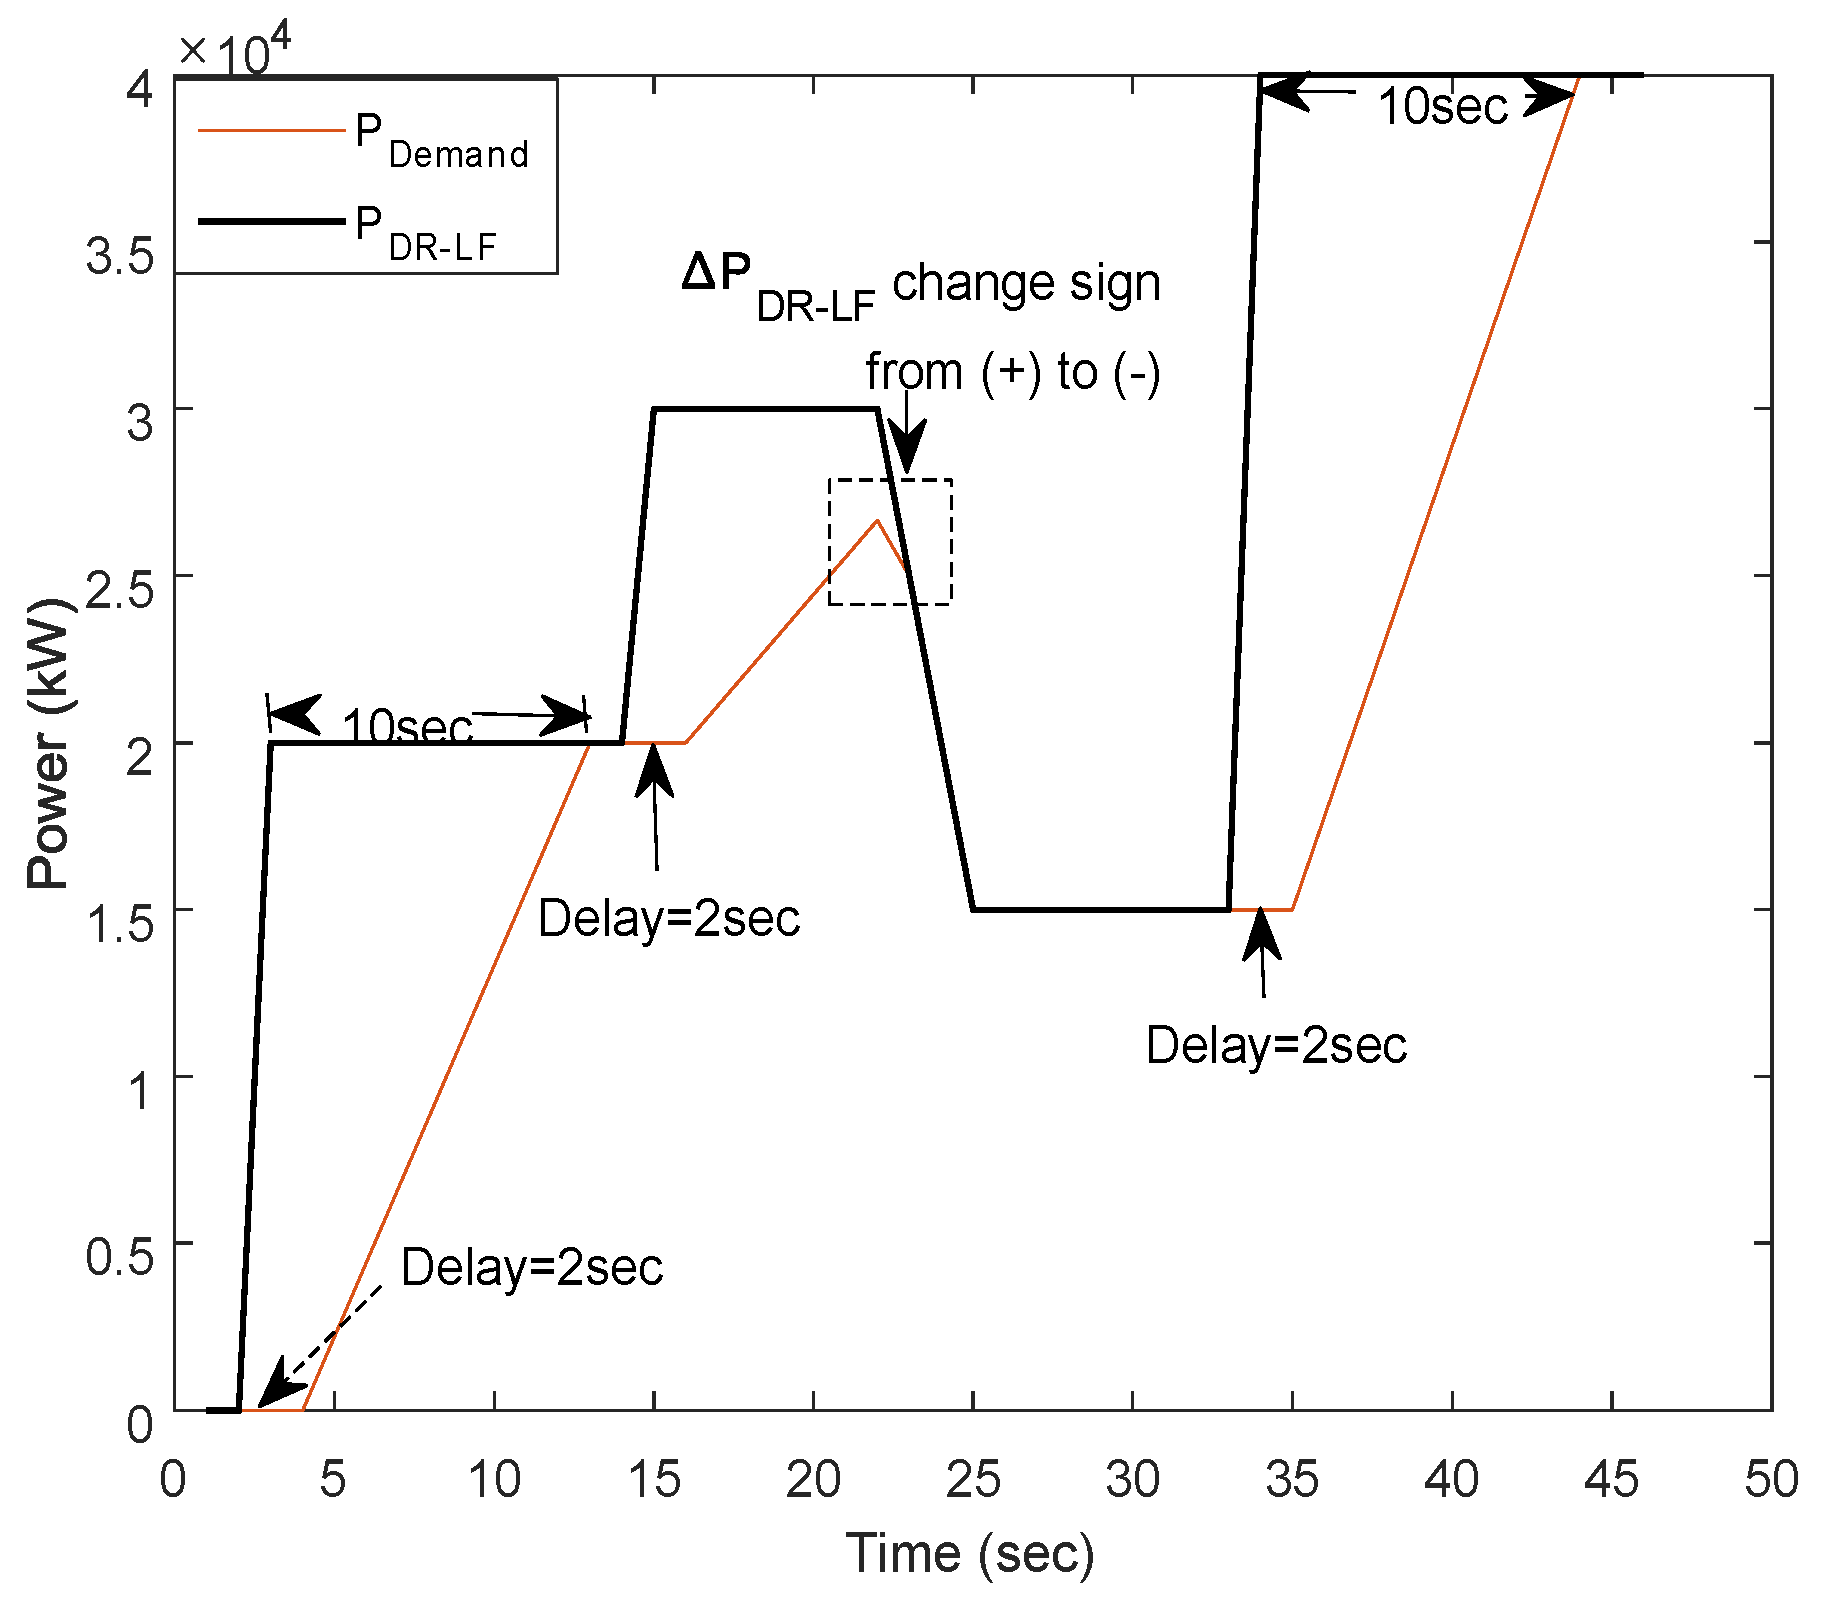
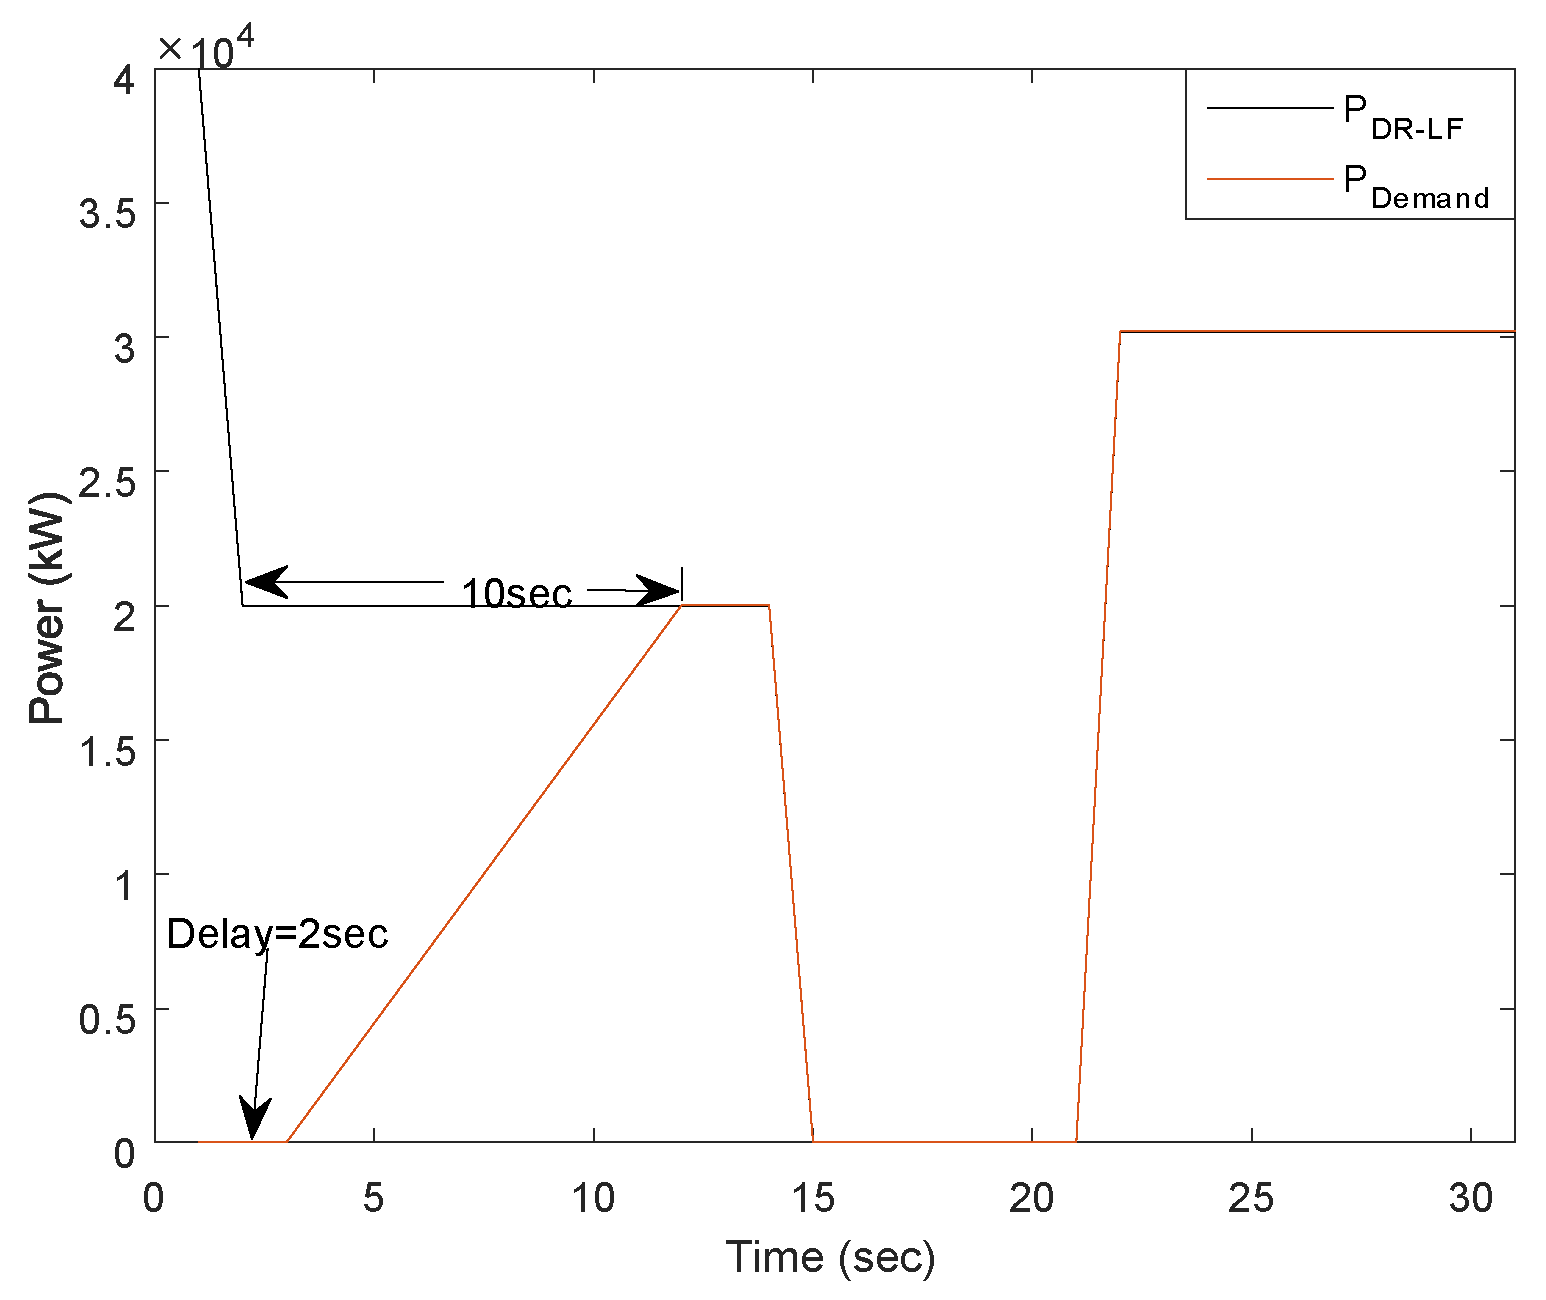
- For DR-LF delivery, the slow response will be delivered if ( > 0) && ( > 0) && (SOC < SOC), whereas the fast response is implemented if ( < 0) && ( < 0) && (SOC < , and the results are shown in Figure 10. Figure 10 illustrates the simulation results of DR-LF for both fast and slow responses again by using an illustrative example, which represents when (SOC < ). It can be seen that, when increases ( > 0) && ( > 0), a slow control response is applied; when ( < 0) && ( < 0), then the fast response is used. For DR-LF, this means that the discharging power is minimized;
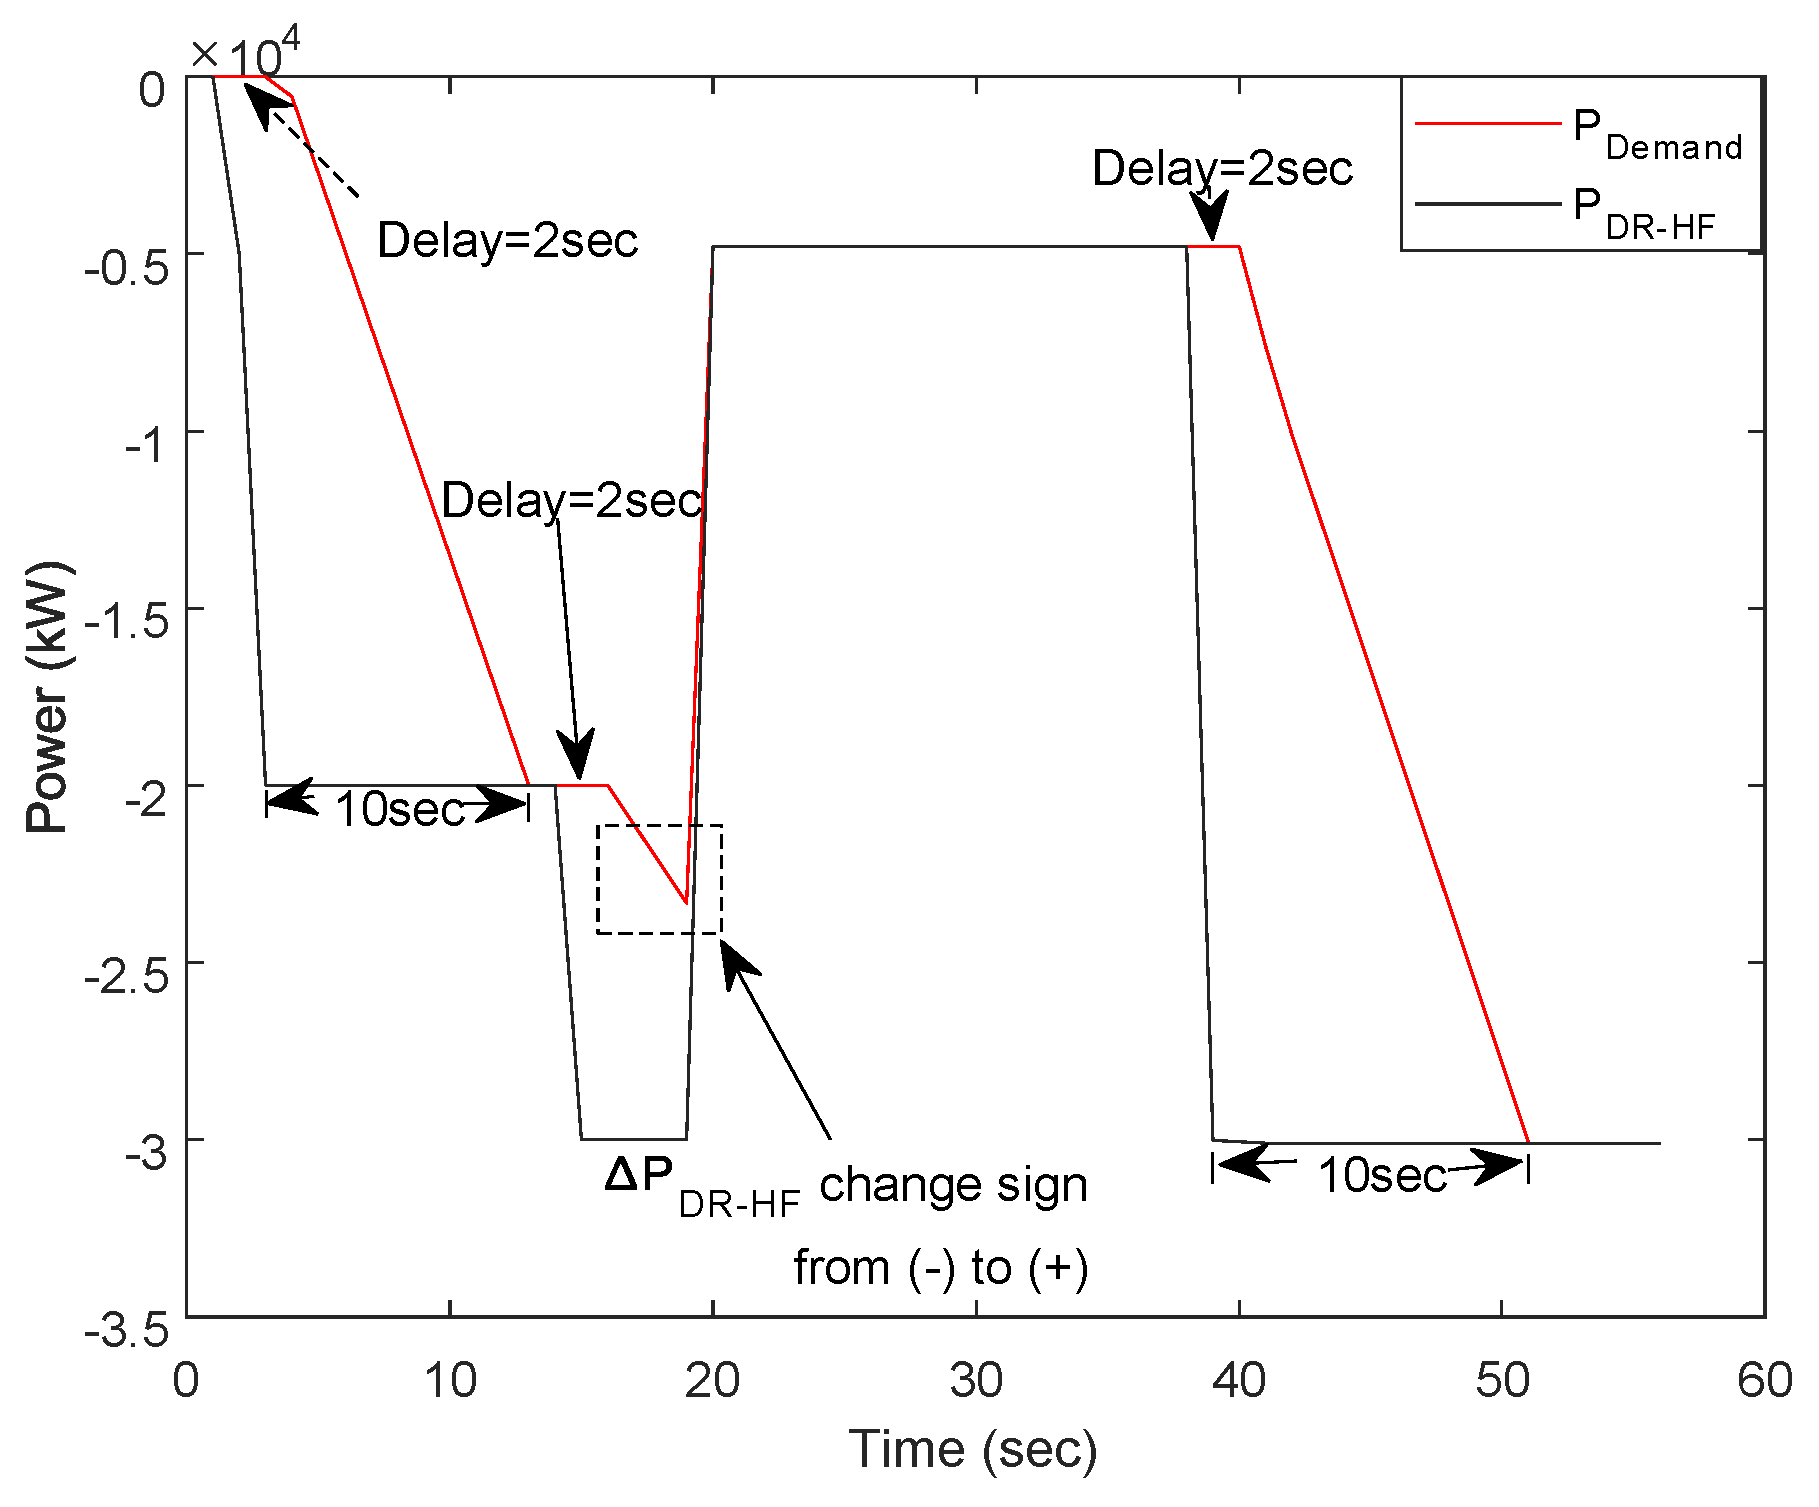
- For DR-HF delivery, the slow response will be delivered if ( > 0) && ( > 0) && (SOC < ), whereas the fast response is implemented if ( < 0) && ( < 0) && (SOC < , and the results are shown in Figure 14.Figure 14 presents the simulation results of DR-HF for both fast and slow responses by using an illustrative example input which represents the when SOC < . It can be noticed that, when decreases, which means ( > 0) && ( > 0), a slow control response is applied, while, when ( < 0) and ( < 0), then the fast control response is applied. The aim of this methodology for DR-HF control is switching between ramp rates and using the maximum allowable delay to minimize the discharging power when SOC < ;
- For DR-HF delivery, the slow response will be delivered if ( < 0) && ( < 0) && (SOC > ), whereas the fast response is implemented if ( > 0) && ( > 0) && (SOC > , and the results are shown in Figure 11. Figure 11 shows the simulation results of DR-HF for both fast and slow responses by using an illustrative example input, which represents . It can be seen that, when increases ( < , then the slow control response is applied, whereas, when ( > , then a fast response is used. In this methodology, the target of the dynamic control for DR-HF is to be used to minimize the charging power when SOC > ;
- For DR-LF delivery, the slow response will be delivered if ( < 0) && ( ≤ 0) && (SOC > ), whereas the fast response is implemented if ( > 0) && ( > 0) && (SOC > , and the results are shown in Figure 15.Figure 15 illustrates the simulation results of DR-LF for both fast and slow responses by using an illustrative example input, which represents when > . It is clear that, when increases ( > , then the fast control response is implemented, whereas, when ( < , then a slow response is used. The aim of this methodology is to exploit the dynamic control for DR-HF to minimize the charging power when > .
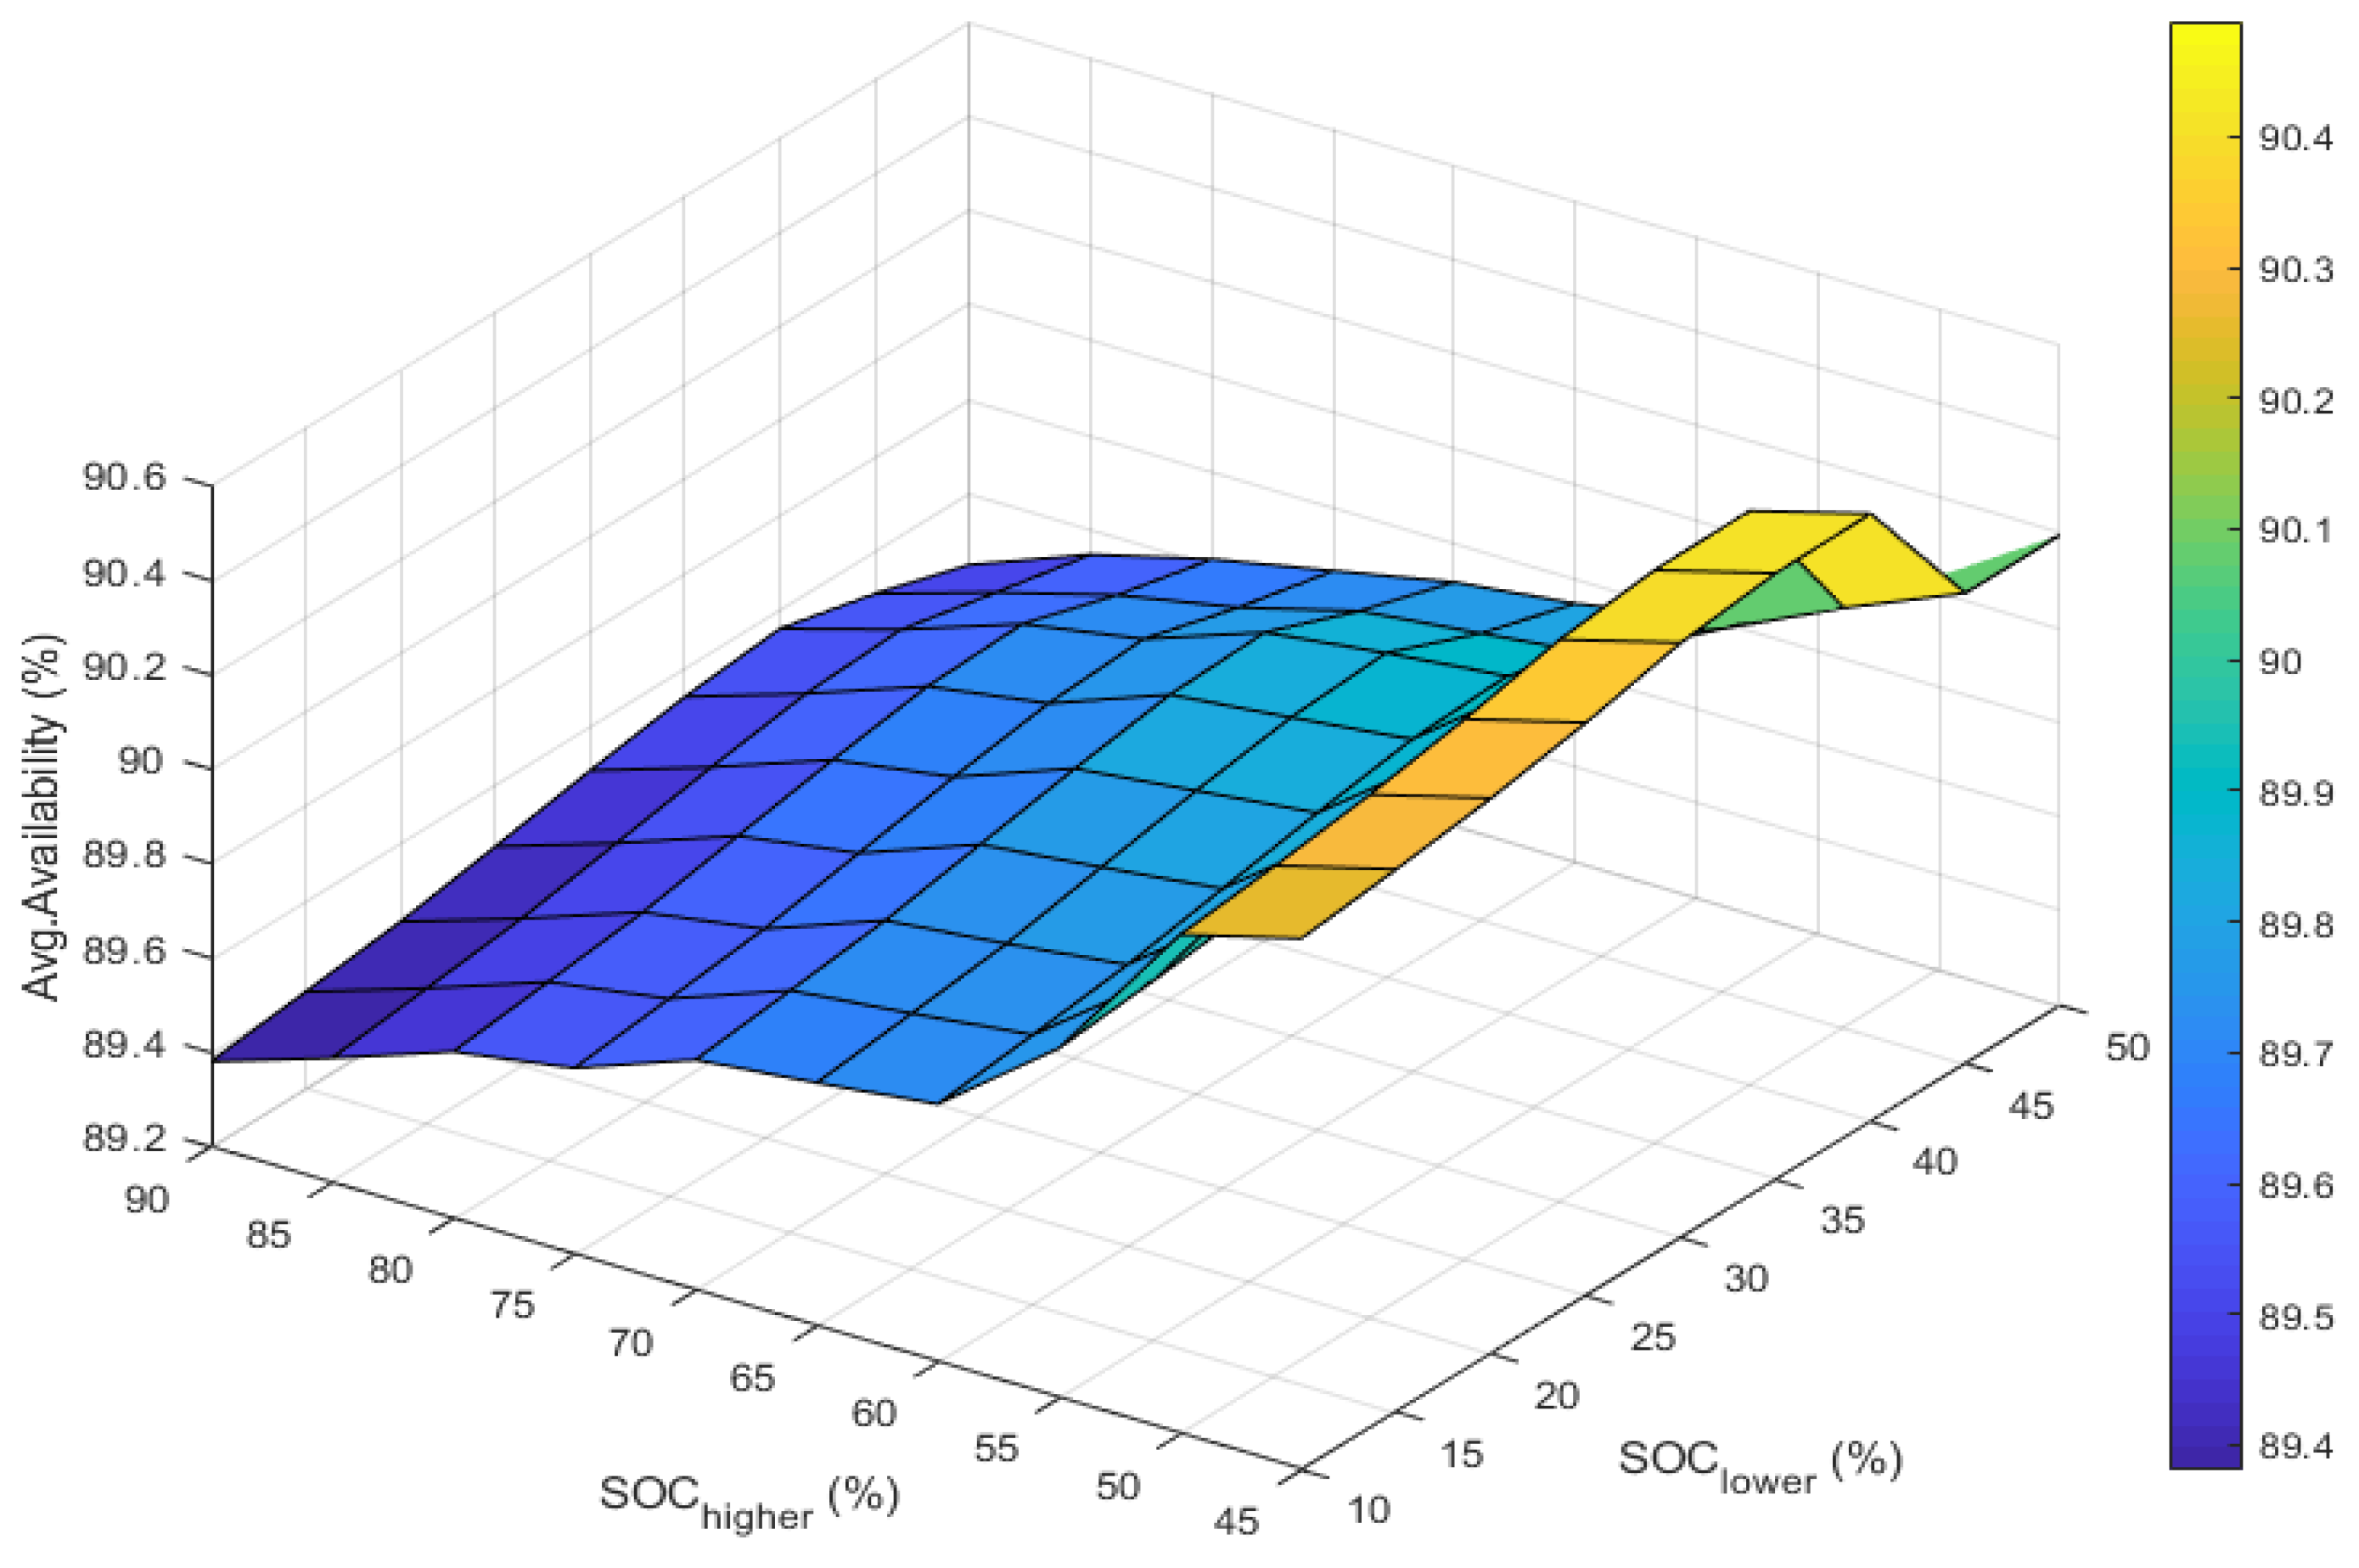
2.11. Analysis of the Availability of BESS Used to Deliver DR-LF and DR-HF Services Based on Grouped Dynamic Control SOC Setpoints
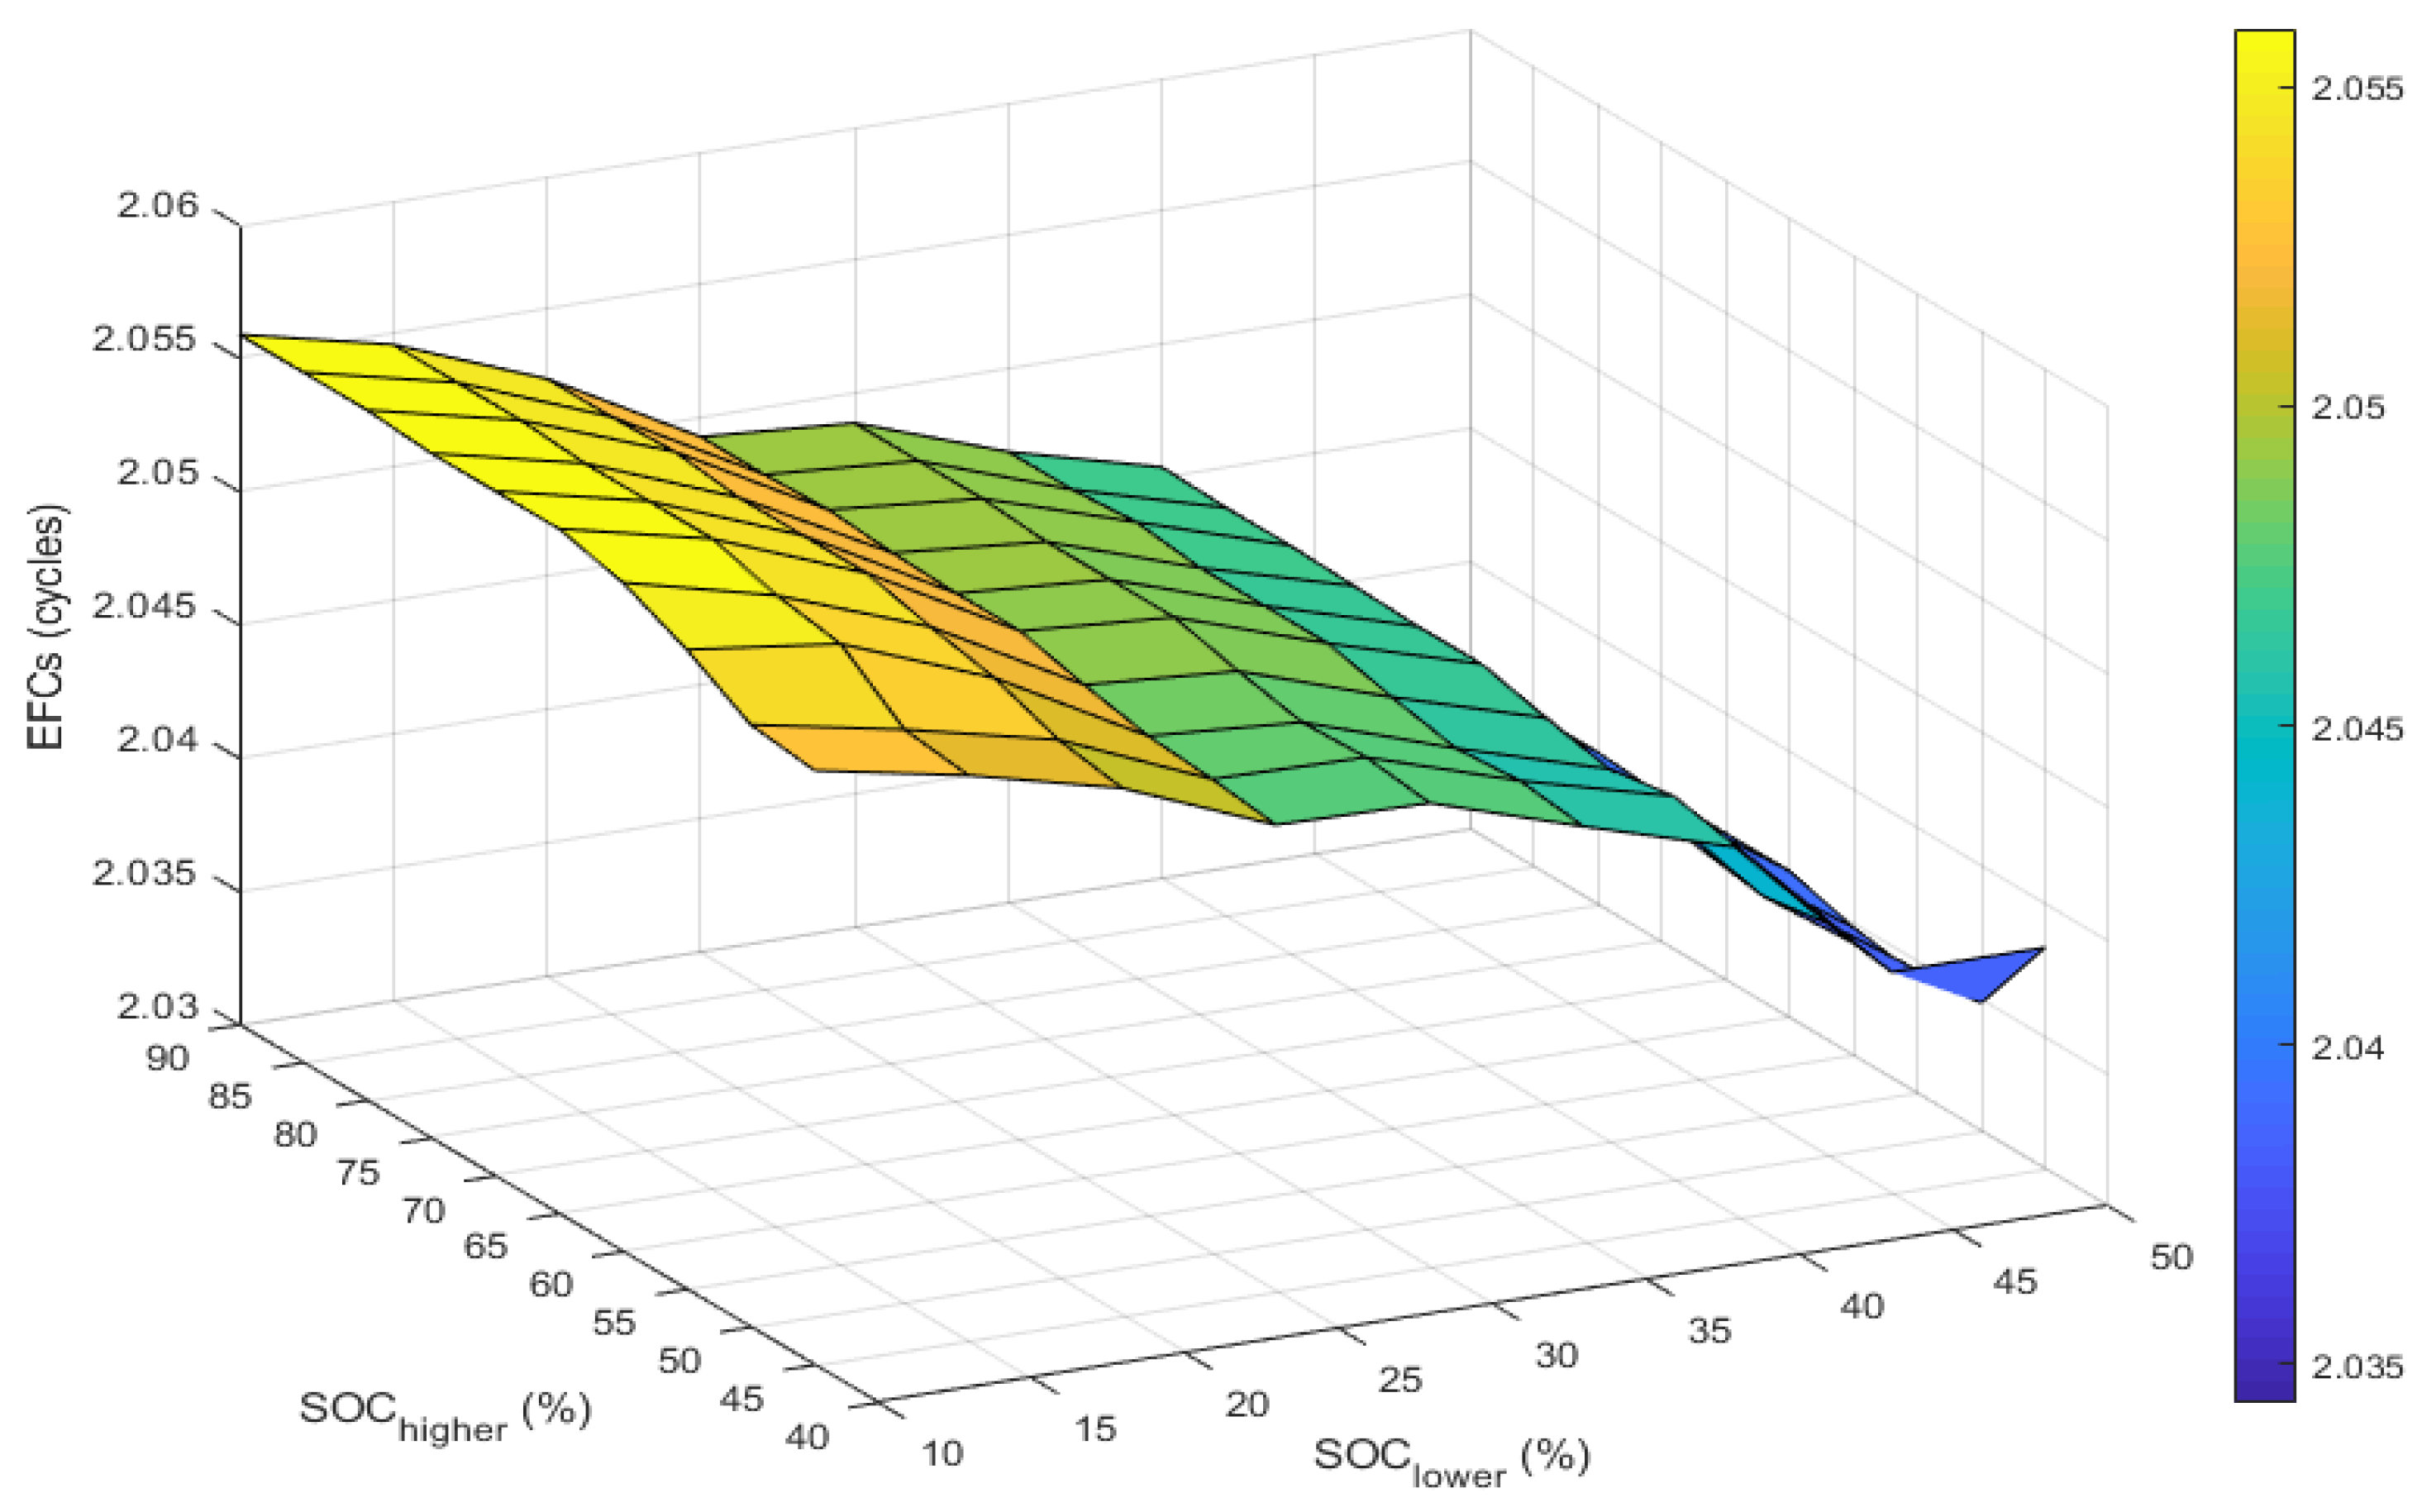
2.12. Analysis of the EFCs of BESS Used to Deliver DR-LF and DR-HF Services Based on a Grouped Dynamic Control SOC Setpoints
2.13. Analysis of BESS Used to Deliver DR-LF & DR-HF Services
- (S1)—The base case that uses a fixed delay (2 s) and maximum ramp rate;
- (S2)—Using dynamic control, as previously described.
3. Conclusions
Author Contributions
Funding
Data Availability Statement
Conflicts of Interest
References
- Strbac, G.; Aunedi, M.; Pudjianto, D.; Djapic, P.; Teng, F.; Sturt, A.; Jackravut, D.; Sansom, R.; Yufit, V.; Brandon, N. Strategic assessment of the role and value of energy storage systems in the UK low carbon energy future. In Report for Carbon Trust; Imperial College London: London, UK, 2012. [Google Scholar]
- Mehr, T.H.; Masoum, M.A.; Jabalameli, N. Grid-connected Lithium-ion battery energy storage system for load leveling and peak shaving. In Proceedings of the 2013 Australasian Universities Power Engineering Conference (AUPEC), Hobart, TAS, Australia, 29 September–3 October 2013; pp. 1–6. [Google Scholar]
- Liang, X. Emerging power quality challenges due to integration of renewable energy sources. IEEE Trans. Ind. Appl. 2016, 53, 855–866. [Google Scholar] [CrossRef]
- Kundur, P.S.; Malik, O.P. Power System Stability and Control; McGraw-Hill Education: New York, NY, USA, 2022. [Google Scholar]
- Gil, G.O.; Chowdhury, J.I.; Balta-Ozkan, N.; Hu, Y.; Varga, L.; Hart, P. Optimising renewable energy integration in new housing developments with low carbon technologies. Renew. Energy 2021, 169, 527–540. [Google Scholar] [CrossRef]
- Vazquez, S.; Lukic, S.M.; Galvan, E.; Franquelo, L.G.; Carrasco, J.M. Energy storage systems for transport and grid applications. IEEE Trans. Ind. Electron. 2010, 57, 3881–3895. [Google Scholar] [CrossRef]
- Diehl, A. Why is Energy Storage Such an Important Part of the Renewables Mix. 2015. Available online: https://www.civicsolar.com/article/why-energy-storage-such-important-part-renewables-mix (accessed on 8 March 2022).
- Tan, K.M.; Babu, T.S.; Ramachandaramurthy, V.K.; Kasinathan, P.; Solanki, S.G.; Raveendran, S.K. Empowering smart grid: A comprehensive review of energy storage technology and application with renewable energy integration. J. Energy Storage 2021, 39, 102591. [Google Scholar] [CrossRef]
- Niroomand, M.; Feldmann, T.; Bollin, E. High-performance control system for grid-tied ESSs. IET Gener. Transm. Distrib. 2017, 11, 2138–2145. [Google Scholar] [CrossRef]
- Divya, K.; Østergaard, J. Battery energy storage technology for power systems—An overview. Electr. Power Syst. Res. 2009, 79, 511–520. [Google Scholar] [CrossRef]
- Rana, M.M.; Uddin, M.; Sarkar, M.R.; Meraj, S.T.; Shafiullah, G.; Muyeen, S.; Islam, M.A.; Jamal, T. Applications of energy storage systems in power grids with and without renewable energy integration—A comprehensive review. J. Energy Storage 2023, 68, 107811. [Google Scholar] [CrossRef]
- Ciez, R.E.; Whitacre, J. Comparative techno-economic analysis of hybrid micro-grid systems utilizing different battery types. Energy Convers. Manag. 2016, 112, 435–444. [Google Scholar] [CrossRef]
- Yadlapalli, R.T.; Alla, R.R.; Kandipati, R.; Kotapati, A. Super capacitors for energy storage: Progress, applications and challenges. J. Energy Storage 2022, 49, 104194. [Google Scholar] [CrossRef]
- Rayit, N.S.; Chowdhury, J.I.; Balta-Ozkan, N. Techno-economic optimisation of battery storage for grid-level energy services using curtailed energy from wind. J. Energy Storage 2021, 39, 102641. [Google Scholar] [CrossRef]
- Gundogdu, B.M.; Nejad, S.; Gladwin, D.T.; Foster, M.P.; Stone, D.A. A battery energy management strategy for UK enhanced frequency response and triad avoidance. IEEE Trans. Ind. Electron. 2018, 65, 9509–9517. [Google Scholar] [CrossRef]
- Shaqsi, A.Z.A.; Sopian, K.; Al-Hinai, A. Review of energy storage services, applications, limitations, and benefits. Energy Rep. 2020, 6, 288–306. [Google Scholar] [CrossRef]
- Xu, X.; Bishop, M.; Oikarinen, D.G.; Hao, C. Application and modeling of battery energy storage in power systems. CSEE J. Power Energy Syst. 2016, 2, 82–90. [Google Scholar] [CrossRef]
- Song, Z.; Nazir, M.S.; Cui, X.; Hiskens, I.A.; Hofmann, H. Benefit assessment of second-life electric vehicle lithium-ion batteries in distributed power grid applications. J. Energy Storage 2022, 56, 105939. [Google Scholar] [CrossRef]
- Gundogdu, B.; Gladwin, D.; Stone, D. Battery energy management strategies for UK firm frequency response services and energy arbitrage. J. Eng. 2019, 2019, 4152–4157. [Google Scholar] [CrossRef]
- National grid ESO. Future of Frequency Response, 2021; National Grid ESO: Warwick, UK, 2017. [Google Scholar]
- NGESO. EBR Article 18 Response consultation Terms and Conditions. 2022. Available online: https://www.nationalgrideso.com/calendar/ebr-article-18-response-consultation-terms-and-conditions (accessed on 15 December 2022).
- National Grid ESO. Historic Frequency Data. 2021. Available online: https://www.nationalgrideso.com/industry-information/balancing-services/frequency-response-services/historic-frequency-data (accessed on 8 March 2022).
- National Grid ESO. Dynamic Regulation-Technical Requirements. 2022. Available online: https://www.nationalgrideso.com/industry-information/balancing-services/Frequency-Response-Services/Dynamic-Regulation/Technical-Requirements (accessed on 18 October 2022).
- Guo, W.; Bai, H.; Szatmari-Voicu, G.; Taylor, A.; Patterson, J.; Kane, J. A 10kW 97%-efficiency LLC resonant DC/DC converter with wide range of output voltage for the battery chargers in Plug-in Hybrid Electric Vehicles. In Proceedings of the 2012 IEEE Transportation Electrification Conference and Expo (ITEC), Dearborn, MI, USA, 18–20 June 2012; pp. 1–4. [Google Scholar]
- Qian, H.; Zhang, J.; Lai, J.S.; Yu, W. A high-efficiency grid-tie battery energy storage system. IEEE Trans. Power Electron. 2010, 26, 886–896. [Google Scholar] [CrossRef]
- Abdulkarim, A.; Gladwin, D.T. A sensitivity analysis on power to energy ratios for energy storage systems providing both dynamic firm and dynamic containment frequency response services in the uk. In Proceedings of the IECON 2021–2047th Annual Conference of the IEEE Industrial Electronics Society, Toronto, ON, Canada, 13–16 October 2021; pp. 1–6. [Google Scholar]
- Energy Storage. Every Charge Cycle Counts When It Comes to Battery Degradation. 2021. Available online: https://www.energy-storage.news/blogs/every-charge-cycle-counts-when-it-comes-to-battery-degradation (accessed on 8 September 2021).
- National Grid ESO. Simplification and Standardisation of FFR Service. 2018. Available online: https://www.nationalgrideso.com/document/102071/download (accessed on 6 January 2023).
- Abdulkarim, A.; Gladwin, D.T. Maximizing energy availability for a Dynamic Regulation Frequency Response Service for Battery Energy Storage Systems. In Proceedings of the IECON 2022–2048th Annual Conference of the IEEE Industrial Electronics Society, Brussels, Belgium, 17–20 October 2022; pp. 1–6. [Google Scholar]
- MODO. Reference Price. 2022. Available online: https://platform.modo.energy/home (accessed on 16 January 2023).





| Parameter | Values | Unites |
|---|---|---|
| Deadband (delivery %) | ±0.015 | Hz |
| Delivery range | ±0.015 to ±0.2 | Hz |
| Initial linear range (delivery %) | ±0.015 to ±0.2 (100% at ±0.2) | Hz |
| Full delivery point | ±0.2 | Hz |
| Max time to full delivery | 10 | s |
| Ramp time | 8 | s |
| Max ramp start | 2 | s |
| Delivery duration | 1 | h |
| Freq. (Hz) | Contracted Power (p.u) | (p.u) |
|---|---|---|
| J = 49.5 | ||
| K = 49.8 | ||
| L = 49.985 | ||
| M = 50 | ||
| N = 50.015 | ||
| O = 50.2 | ||
| P = 50.5 |
| Parameters | Values |
|---|---|
| Nominal Grid Frequency | 50 Hz |
| DeadBand (DB) | ±0.015 Hz |
| Battery initial () | 50% |
| Battery charge/discharge efficiency | 97% [24,25] |
| Inverter efficiency | 97% [24,25] |
| Battery Power/Energy | 40 MW/40 MWh |
| Dynamic control SOC setpoints ( & ) | 40–45% |
| (%) | ||||||||||
|---|---|---|---|---|---|---|---|---|---|---|
| 10 | 15 | 20 | 25 | 30 | 35 | 40 | 45 | 50 | ||
| (%) | 90 | 89.3809 | 89.4055 | 89.4310 | 89.4672 | 89.5051 | 89.5385 | 89.5595 | 89.5104 | 89.4488 |
| 85 | 89.4645 | 89.4891 | 89.5139 | 89.5506 | 89.5886 | 89.6213 | 89.6340 | 89.5894 | 89.5467 | |
| 80 | 89.5540 | 89.5785 | 89.6033 | 89.6419 | 89.6799 | 89.7126 | 89.7218 | 89.6599 | 89.6129 | |
| 75 | 89.5954 | 89.6192 | 89.6439 | 89.6816 | 89.7198 | 89.7527 | 89.7660 | 89.7096 | 89.6643 | |
| 70 | 89.6889 | 89.7127 | 89.7381 | 89.7759 | 89.8138 | 89.8471 | 89.8561 | 89.7783 | 89.7163 | |
| 65 | 89.7163 | 89.7400 | 89.7647 | 89.8039 | 89.8430 | 89.8751 | 89.8886 | 89.8072 | 89.7469 | |
| 60 | 89.7472 | 89.7711 | 89.7965 | 89.8342 | 89.8722 | 89.9050 | 89.9159 | 89.8374 | 89.7955 | |
| 55 | 89.9423 | 89.9626 | 89.9882 | 90.0252 | 90.0638 | 90.0963 | 90.0764 | 89.9693 | 89.9060 | |
| 50 | 90.2584 | 90.2813 | 90.3090 | 90.3458 | 90.3913 | 90.4154 | 90.4177 | 90.0893 | 90.0007 | |
| 45 | 90.3262 | 90.3499 | 90.3775 | 90.4144 | 90.4607 | 90.4848 | 90.4879 | 90.1967 | 90.1967 | |
| (%) | ||||||||||
|---|---|---|---|---|---|---|---|---|---|---|
| 10 | 15 | 20 | 25 | 30 | 35 | 40 | 45 | 50 | ||
| (%) | 90 | 2.0559 | 2.0546 | 2.0524 | 2.0493 | 2.0489 | 2.0469 | 2.0454 | 2.0396 | 2.0356 |
| 85 | 2.0559 | 2.0546 | 2.0524 | 2.0493 | 2.0489 | 2.0469 | 2.0453 | 2.0396 | 2.0357 | |
| 80 | 2.0559 | 2.0546 | 2.0525 | 2.0494 | 2.0489 | 2.0471 | 2.0453 | 2.0396 | 2.0357 | |
| 75 | 2.0557 | 2.0544 | 2.0522 | 2.0492 | 2.0487 | 2.0468 | 2.0452 | 2.0394 | 2.0355 | |
| 70 | 2.0557 | 2.0544 | 2.0522 | 2.0491 | 2.0487 | 2.0468 | 2.0451 | 2.0394 | 2.0355 | |
| 65 | 2.0557 | 2.0544 | 2.0522 | 2.0491 | 2.0487 | 2.0468 | 2.0451 | 2.0394 | 2.0355 | |
| 60 | 2.0551 | 2.0537 | 2.0516 | 2.0485 | 2.0481 | 2.0462 | 2.0445 | 2.0387 | 2.0348 | |
| 55 | 2.054 | 2.0533 | 2.0511 | 2.0480 | 2.0476 | 2.0457 | 2.0440 | 2.0383 | 2.0344 | |
| 50 | 2.0526 | 2.0515 | 2.0502 | 2.0478 | 2.0477 | 2.0459 | 2.0444 | 2.0387 | 2.0348 | |
| 45 | 2.0523 | 2.0512 | 2.0498 | 2.0475 | 2.0474 | 2.0456 | 2.0439 | 2.0383 | 2.0383 | |
| Number of Blocks | & (%) | Total Import Energy (MWh) | Total Export Energy (MWh) | Avg. Availability (%) | EFCs | for Each EFA Block | Factor | Scenarios |
|---|---|---|---|---|---|---|---|---|
| Block1 | 50–27.77 | −11.63 | 18.67 | 100 | 0.379 | 0 | 1 | S1 |
| 50–29.06 | −11.32 | 18.17 | 100 | 0.373 | 0 | 1 | S2 | |
| Block2 | 27.77–5.46 | −8.93 | 16.30 | 99.58 | 0.315 | 0 | 1 | S1 |
| 29.06–5.48 | −8.87 | 16.47 | 99.72 | 0.334 | 0 | 1 | S2 | |
| Block3 | 50–49.18 | −11.58 | 10.56 | 100 | 0.277 | 0 | 1 | S1 |
| 50–49.86 | −11.22 | 10.29 | 100 | 0.269 | 0 | 1 | S2 | |
| Block4 | 49.18–70.85 | −21.42 | 10.83 | 100 | 0.403 | 0 | 1 | S1 |
| 49.87–68.73 | −19.78 | 10.78 | 100 | 0.382 | 0 | 1 | S2 | |
| Block5 | 50–53.63 | −16.97 | 13.66 | 100 | 0.383 | 0 | 1 | S1 |
| 50–54.67 | −15.71 | 13.59 | 100 | 0.366 | 0 | 1 | S2 | |
| Block6 | 53.62–57.55 | −19.34 | 15.66 | 100 | 0.438 | 0 | 1 | S1 |
| 54.6–54.85 | −18.25 | 15.57 | 100 | 0.423 | 0 | 1 | S2 |
| Number of Blocks | & (%) | Total Import Energy (MWh) | Total Export Energy (MWh) | Avg. Availability (%) | EFCs | for Each EFA Block | Factor | Scenarios |
|---|---|---|---|---|---|---|---|---|
| Block1 | 30–15.60 | −11.63 | 15.72 | 98.90 | 0.342 | 0 | 1 | S1 |
| 30–15.58 | −11.59 | 15.69 | 99.14 | 0.341 | 0 | 1 | S2 | |
| Block2 | 15.61–5.46 | −8.93 | 11.73 | 95.89 | 0.258 | 0 | 1 | S1 |
| 15.58–5.48 | −8.88 | 11.67 | 96.78 | 0.257 | 0 | 1 | S2 | |
| Block3 | 30–29.18 | −11.58 | 10.56 | 100 | 0.277 | 0 | 1 | S1 |
| 30–31.76 | −11.51 | 9.59 | 100 | 0.264 | 0 | 1 | S2 | |
| Block4 | 29.19–50.85 | −21.42 | 10.83 | 100 | 0.403 | 0 | 1 | S1 |
| 31.77–53.27 | −21.31 | 10.77 | 100 | 0.388 | 0 | 1 | S2 | |
| Block5 | 30–33.63 | −16.97 | 13.66 | 100 | 0.383 | 0 | 1 | S1 |
| 30–34.31 | −16.41 | 13.30 | 100 | 0.371 | 0 | 1 | S2 | |
| Block6 | 33.62–37.55 | −19.34 | 15.66 | 100 | 0.4375 | 0 | 1 | S1 |
| 34.31–39.16 | −18.99 | 15.12 | 100 | 0.426 | 0 | 1 | S2 |
| Number of Blocks | & (%) | Total Import Energy (MWh) | Total Export Energy (MWh) | Avg. Availability (%) | EFCs | for Each EFA Block | Factor | Scenarios |
|---|---|---|---|---|---|---|---|---|
| Block1 | 70–47.77 | −11.63 | 18.67 | 100 | 0.379 | 0 | 1 | S1 |
| 70–44.52 | −11.04 | 18.59 | 100 | 0.370 | 0 | 1 | S2 | |
| Block2 | 47.78–18.64 | −8.93 | 18.87 | 100 | 0.348 | 0 | 1 | S1 |
| 44.53–19.04 | −8.55 | 18.47 | 100 | 0.338 | 0 | 1 | S2 | |
| Block3 | 70–69.18 | −11.58 | 10.56 | 100 | 0.277 | 0 | 1 | S1 |
| 70–67.70 | −10.52 | 10.49 | 100 | 0.263 | 0 | 1 | S2 | |
| Block4 | 69.19–85.13 | −18.99 | 10.83 | 98.69 | 0.373 | 0 | 1 | S1 |
| 67.71–84.76 | −19.76 | 10.78 | 99.97 | 0.382 | 0 | 1 | S2 | |
| Block5 | 70–69.38 | −15.17 | 13.66 | 97.29 | 0.360 | 0 | 1 | S1 |
| 70–69.53 | −15.12 | 13.59 | 98.90 | 0.359 | 0 | 1 | S2 | |
| Block6 | 69.37–73.30 | −19.34 | 15.66 | 96.01 | 0.438 | 0 | 1 | S1 |
| 70–47.77 | −18.25 | 15.57 | 97.95 | 0.423 | 0 | 1 | S2 |
Disclaimer/Publisher’s Note: The statements, opinions and data contained in all publications are solely those of the individual author(s) and contributor(s) and not of MDPI and/or the editor(s). MDPI and/or the editor(s) disclaim responsibility for any injury to people or property resulting from any ideas, methods, instructions or products referred to in the content. |
© 2023 by the authors. Licensee MDPI, Basel, Switzerland. This article is an open access article distributed under the terms and conditions of the Creative Commons Attribution (CC BY) license (https://creativecommons.org/licenses/by/4.0/).
Share and Cite
Ahmouda, A.; Gladwin, D.T. Enhanced Dynamic Control Strategy for Stacked Dynamic Regulation Frequency Response Services in Battery Energy Storage Systems. Energies 2023, 16, 7686. https://doi.org/10.3390/en16237686
Ahmouda A, Gladwin DT. Enhanced Dynamic Control Strategy for Stacked Dynamic Regulation Frequency Response Services in Battery Energy Storage Systems. Energies. 2023; 16(23):7686. https://doi.org/10.3390/en16237686
Chicago/Turabian StyleAhmouda, Abdulkarim, and Daniel T. Gladwin. 2023. "Enhanced Dynamic Control Strategy for Stacked Dynamic Regulation Frequency Response Services in Battery Energy Storage Systems" Energies 16, no. 23: 7686. https://doi.org/10.3390/en16237686
APA StyleAhmouda, A., & Gladwin, D. T. (2023). Enhanced Dynamic Control Strategy for Stacked Dynamic Regulation Frequency Response Services in Battery Energy Storage Systems. Energies, 16(23), 7686. https://doi.org/10.3390/en16237686


