
Optimal Placement of Electric Vehicle Charging Stations in an Active Distribution Grid with Photovoltaic and Battery Energy Storage System Integration


 ,
,  ,
, 

Abstract
:1. Introduction
Novel Strategy
- To achieve fast and accurate convergence through a combination of analytical search strategies and heuristics.
- To further reduce distribution grid losses, it is important to consider how the active power flow on the slack bus depends on the active power produced by PV and BESSs.
- To maximize the power system stability by minimizing power loss and optimizing active power, power factor, and location for EVCS.
- To analysis the issue of reducing power losses using PV and BESS integration for optimal output active power in terms of power distribution loss coefficients and voltage stability index.
2. Active Power Distribution Network
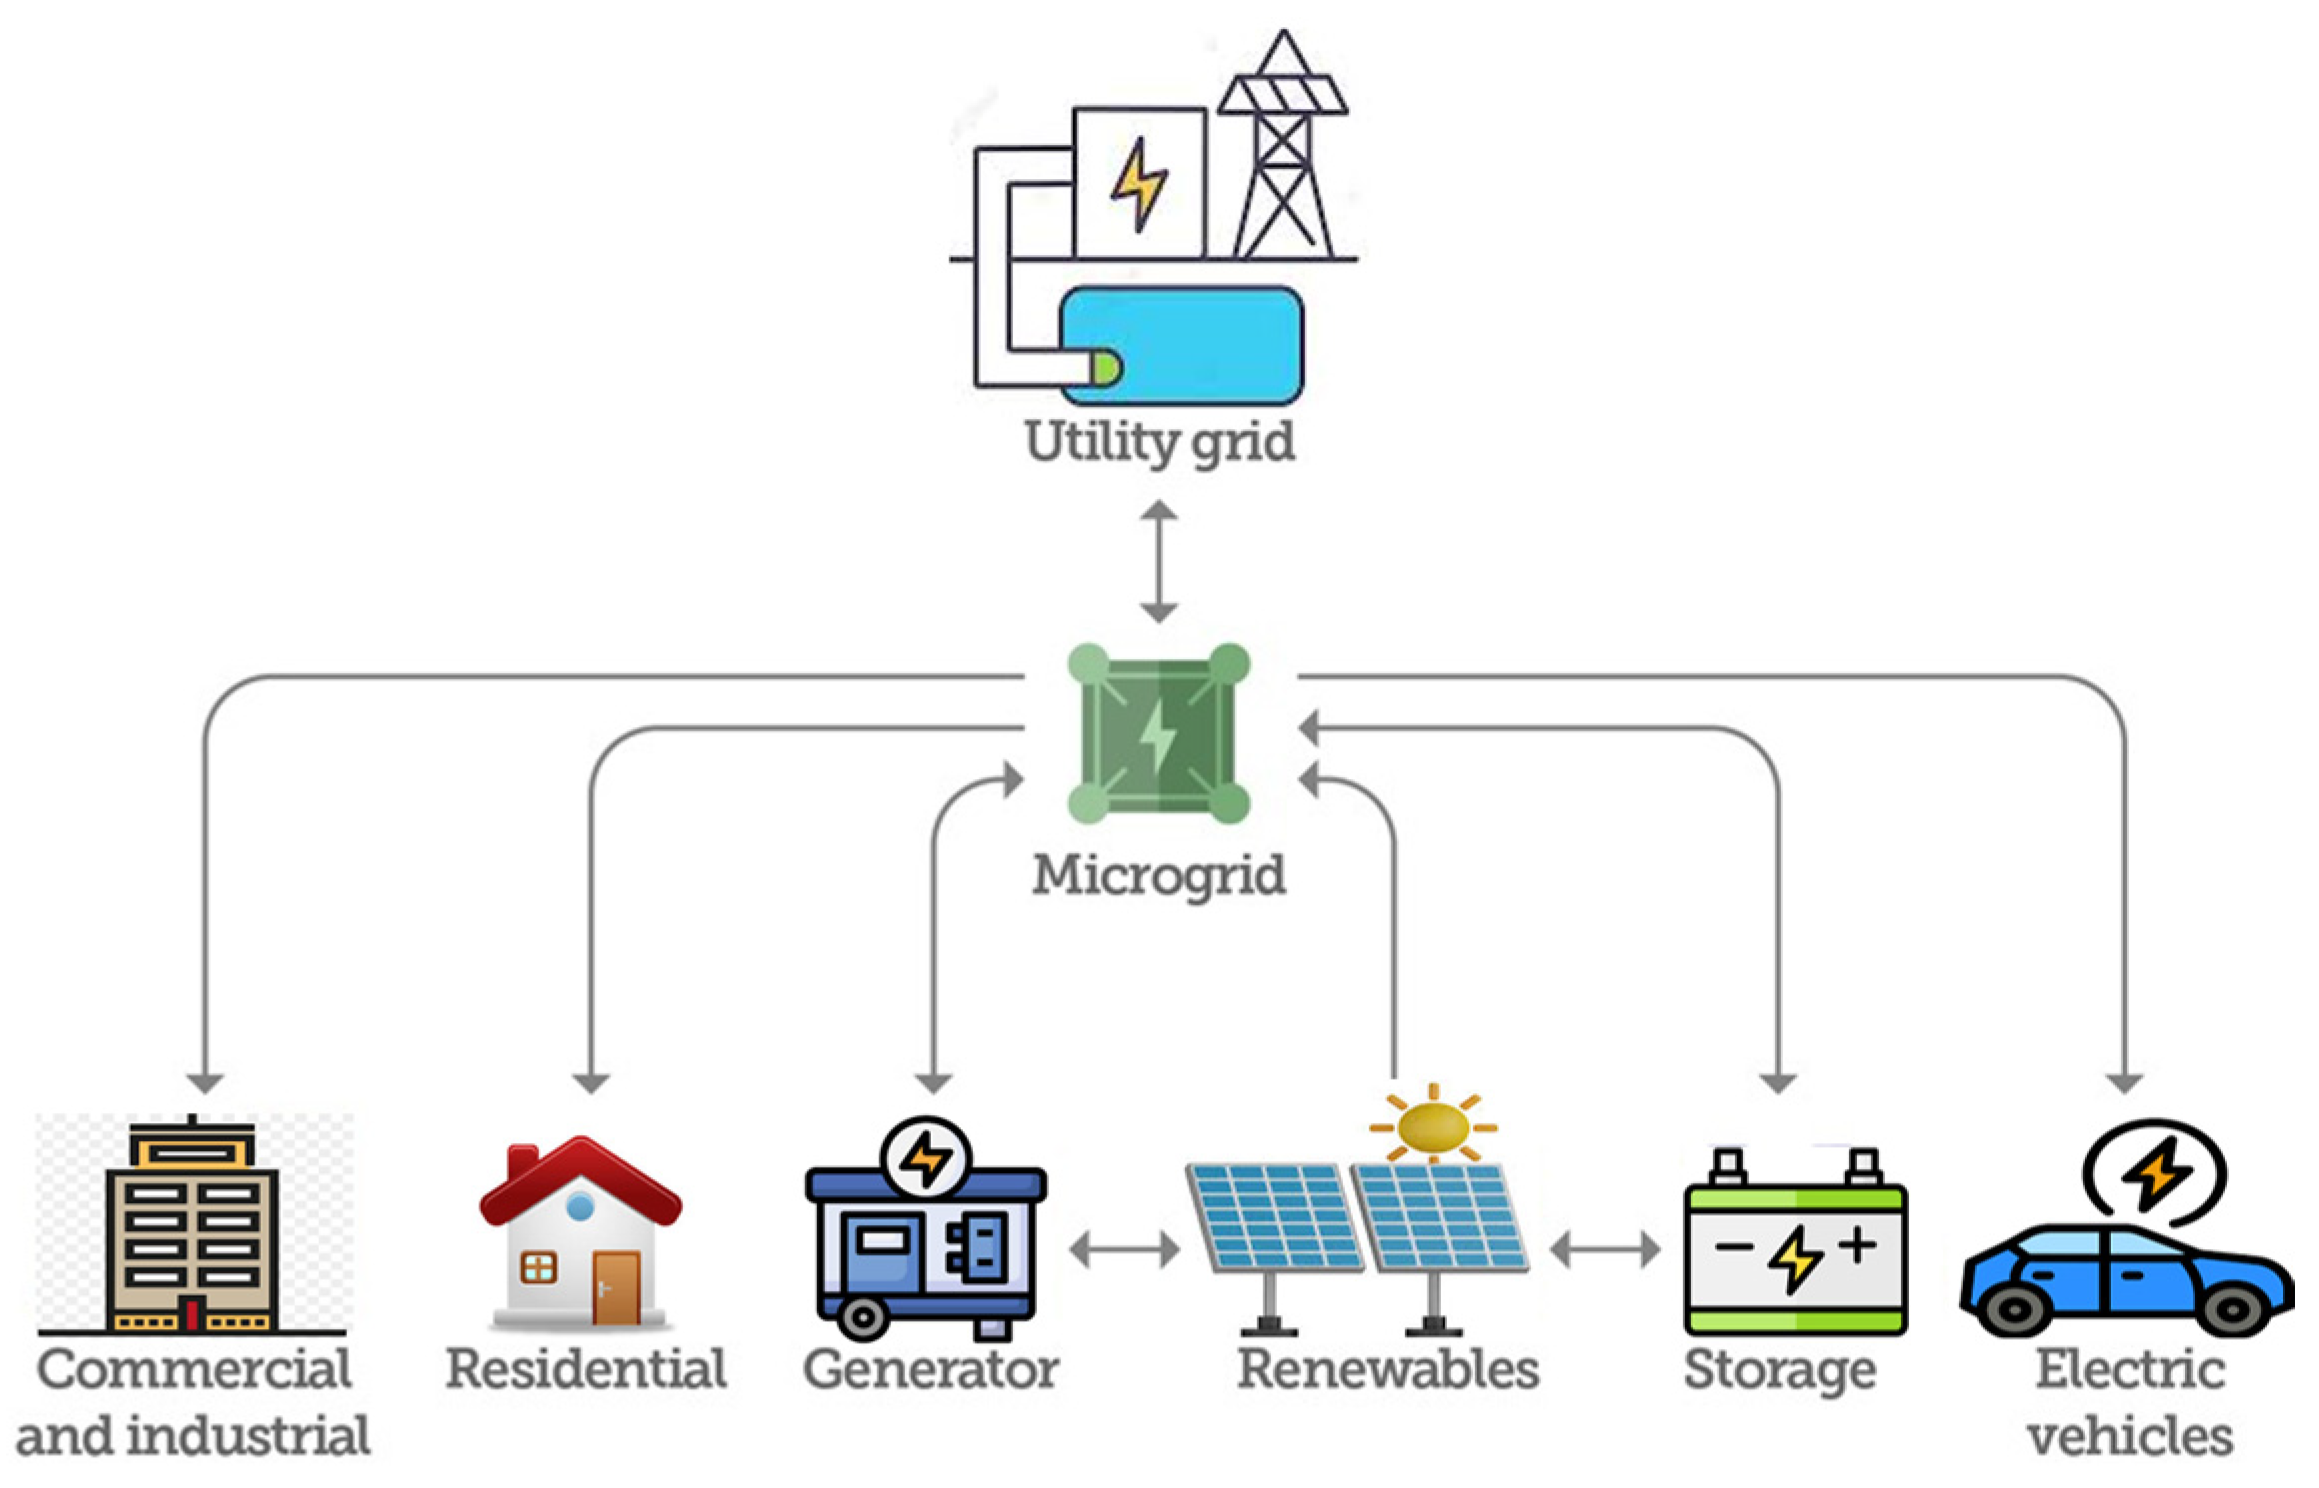
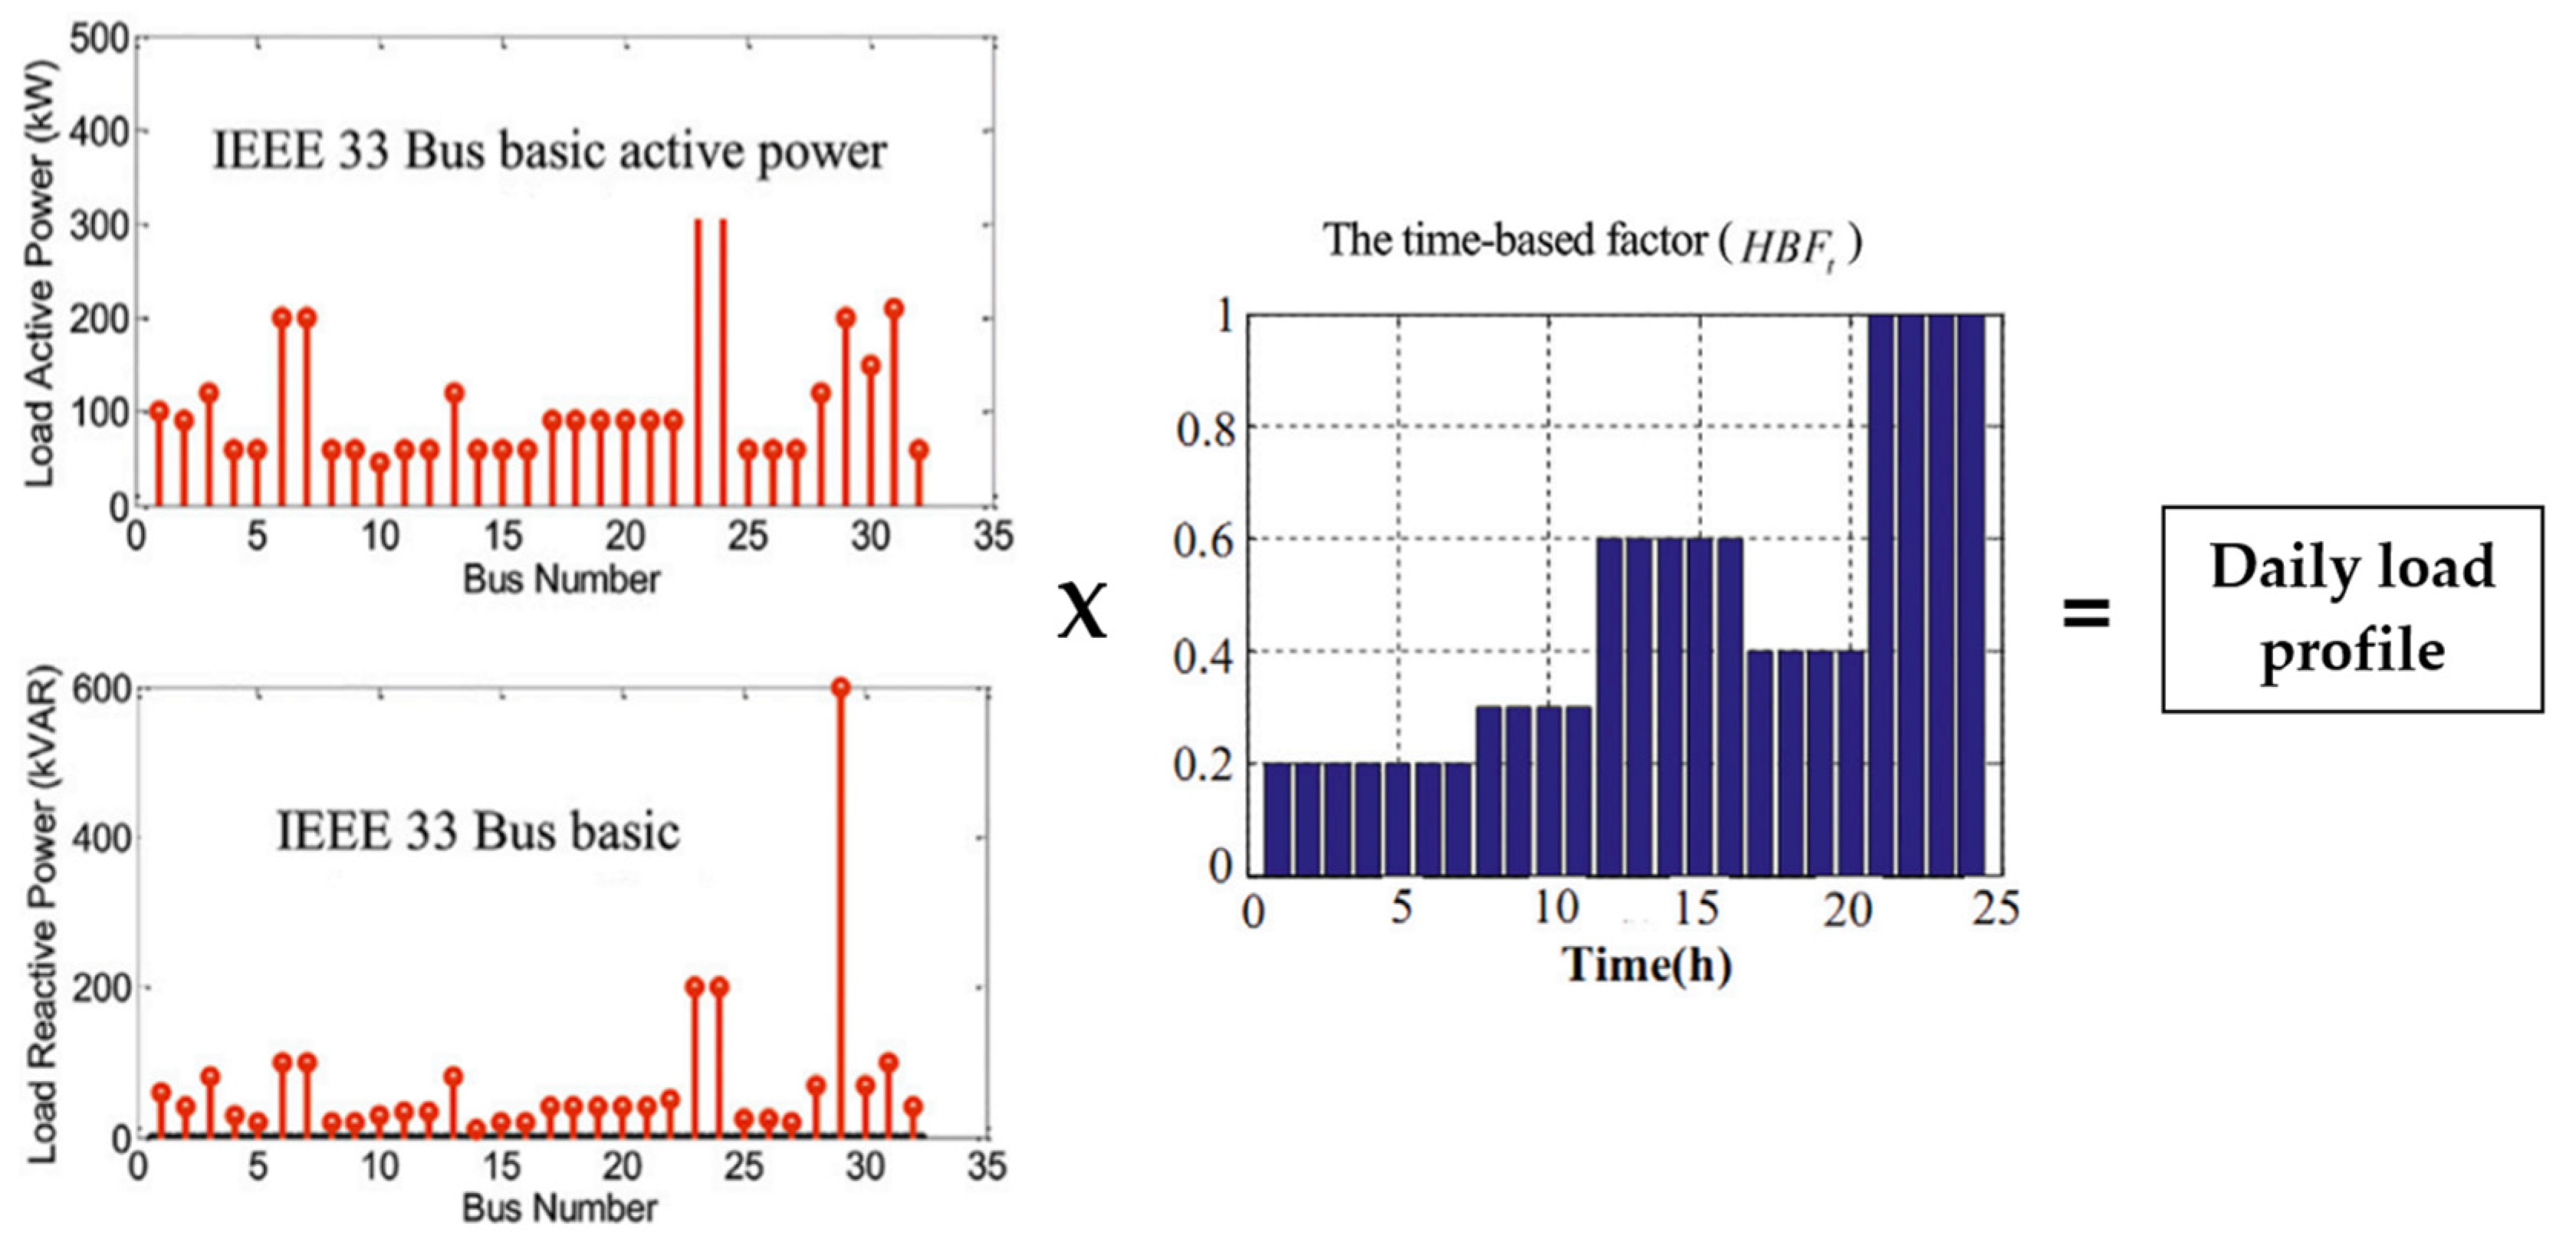
2.1. The Definition of Active Power Distribution Grid
2.2. Voltage Stability Analysis
2.3. Typical PV Panel
2.4. Modelling of Photovoltaic System
2.5. Battery Energy Storage System (BESS)
3. The Optimization Techniques
3.1. Definition of Optimization Technique
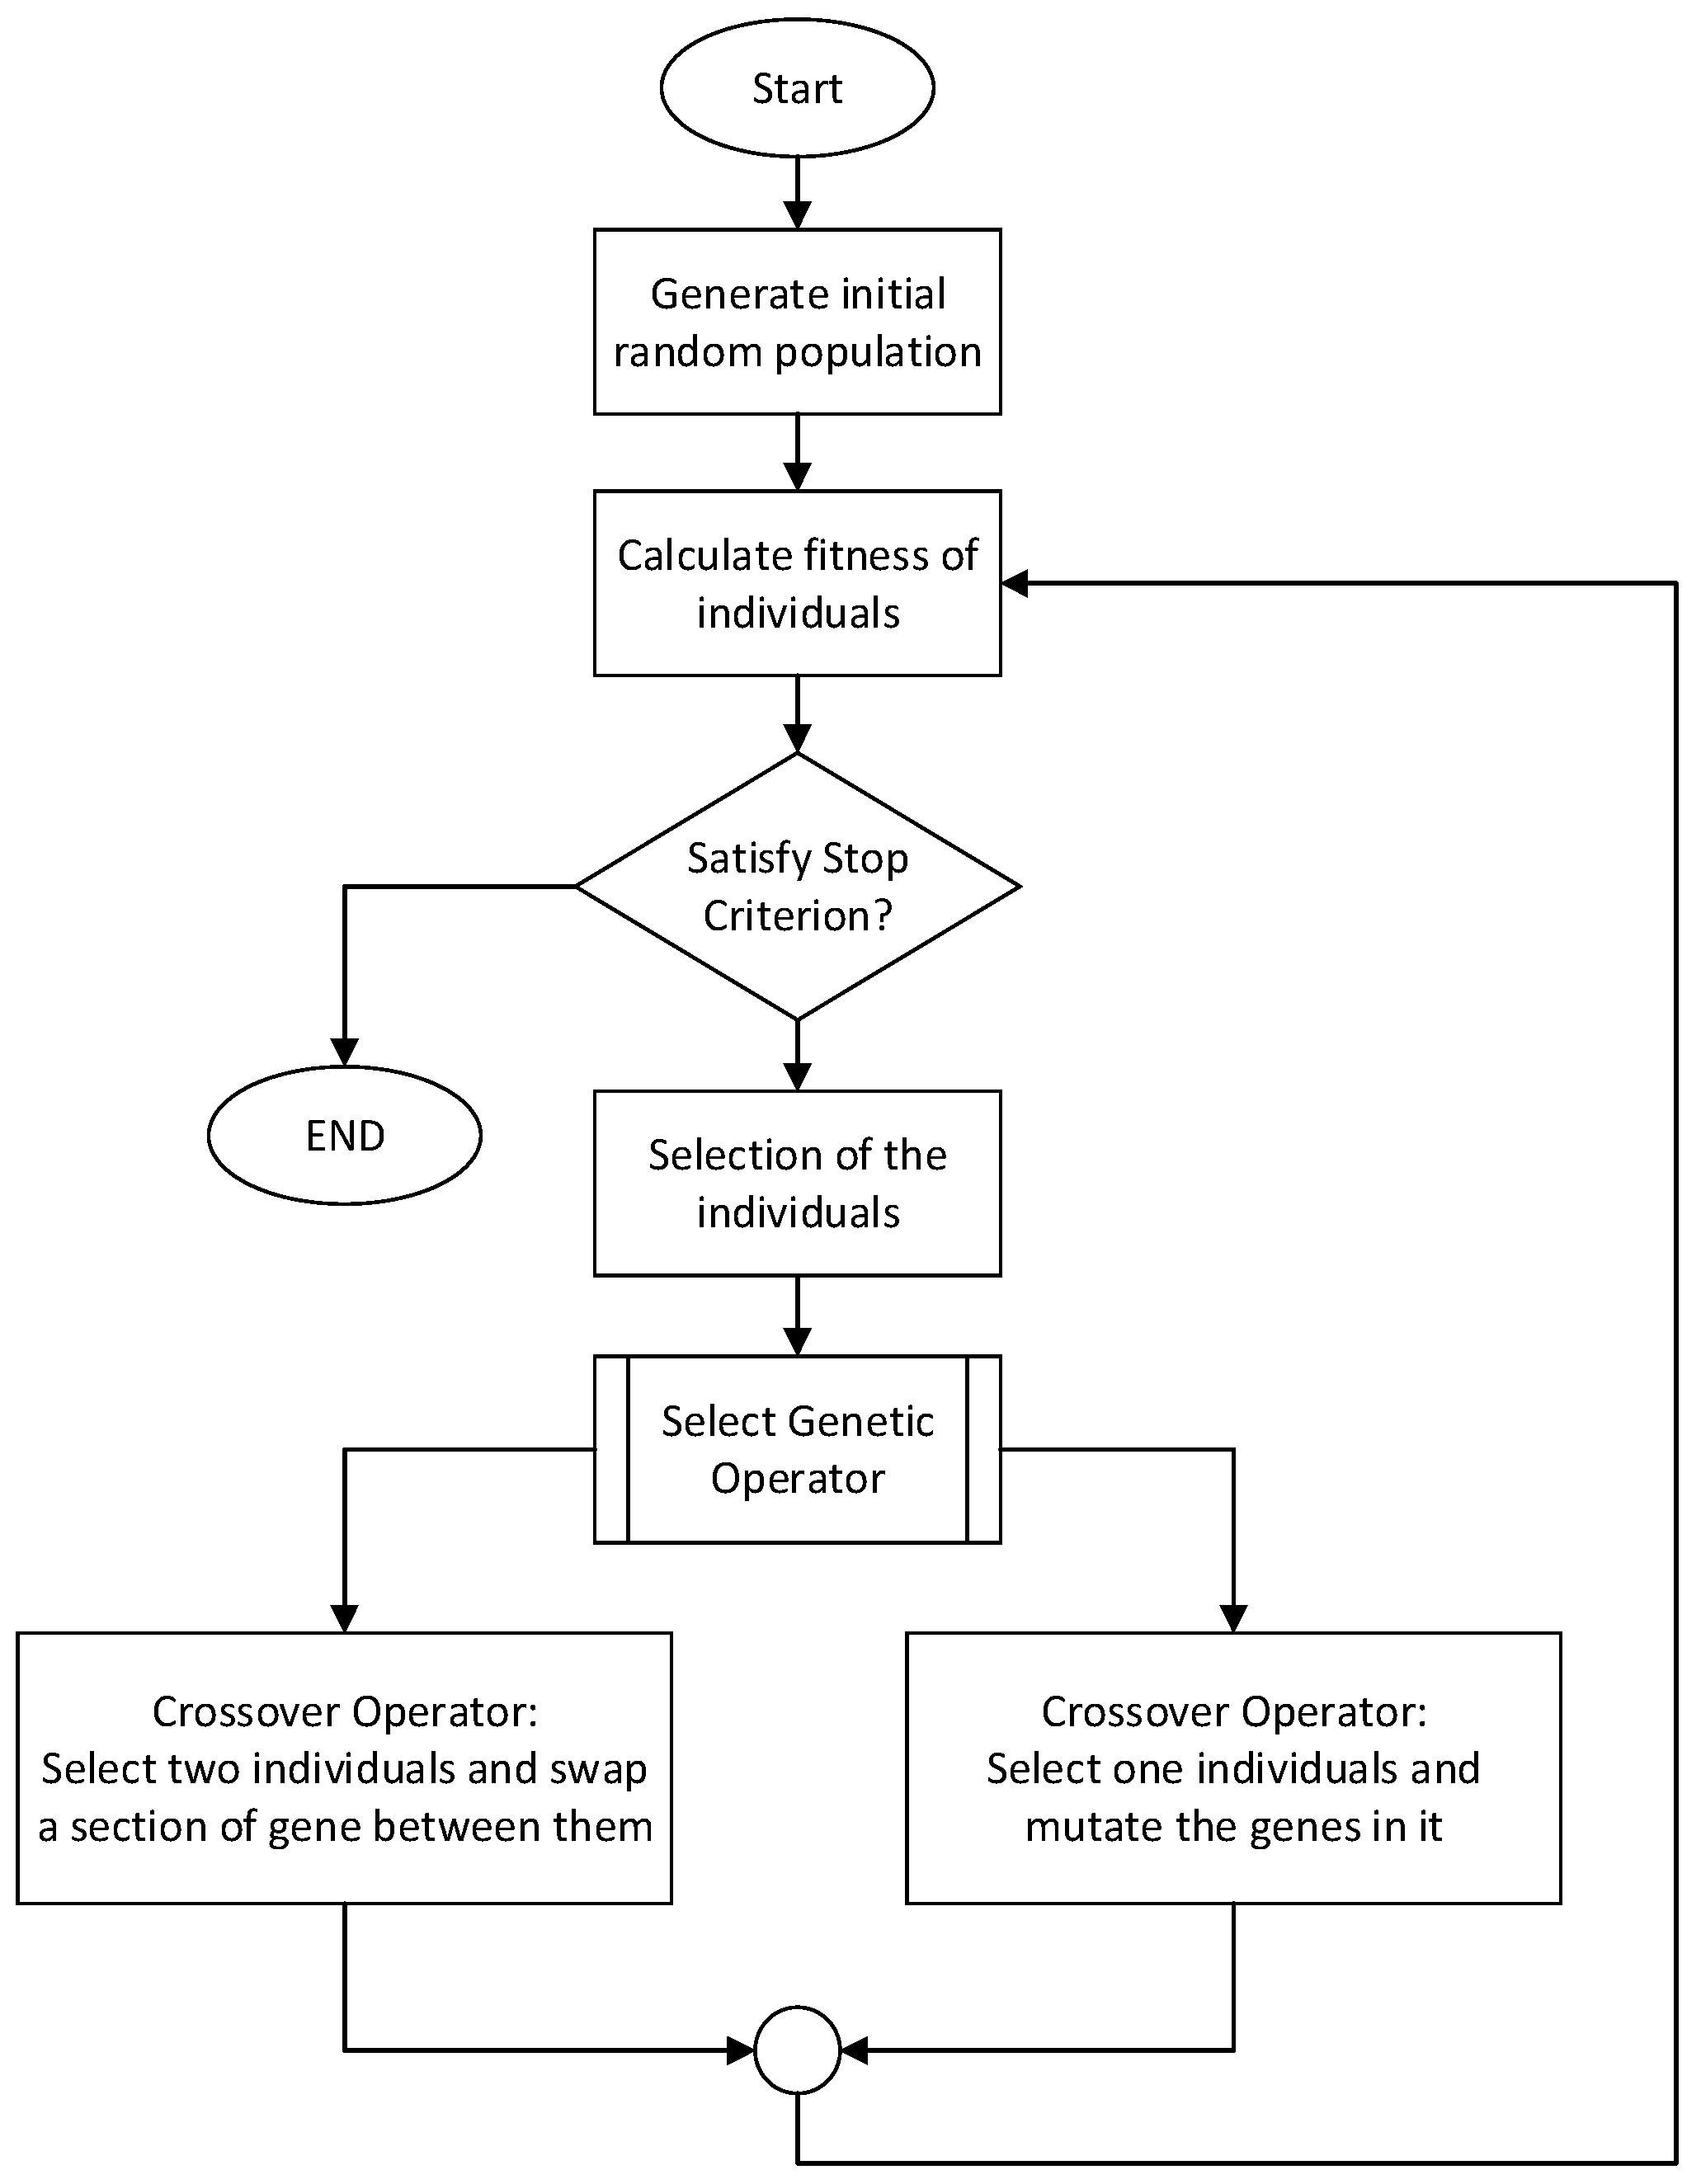
3.2. Genetic Algorithm (GA)
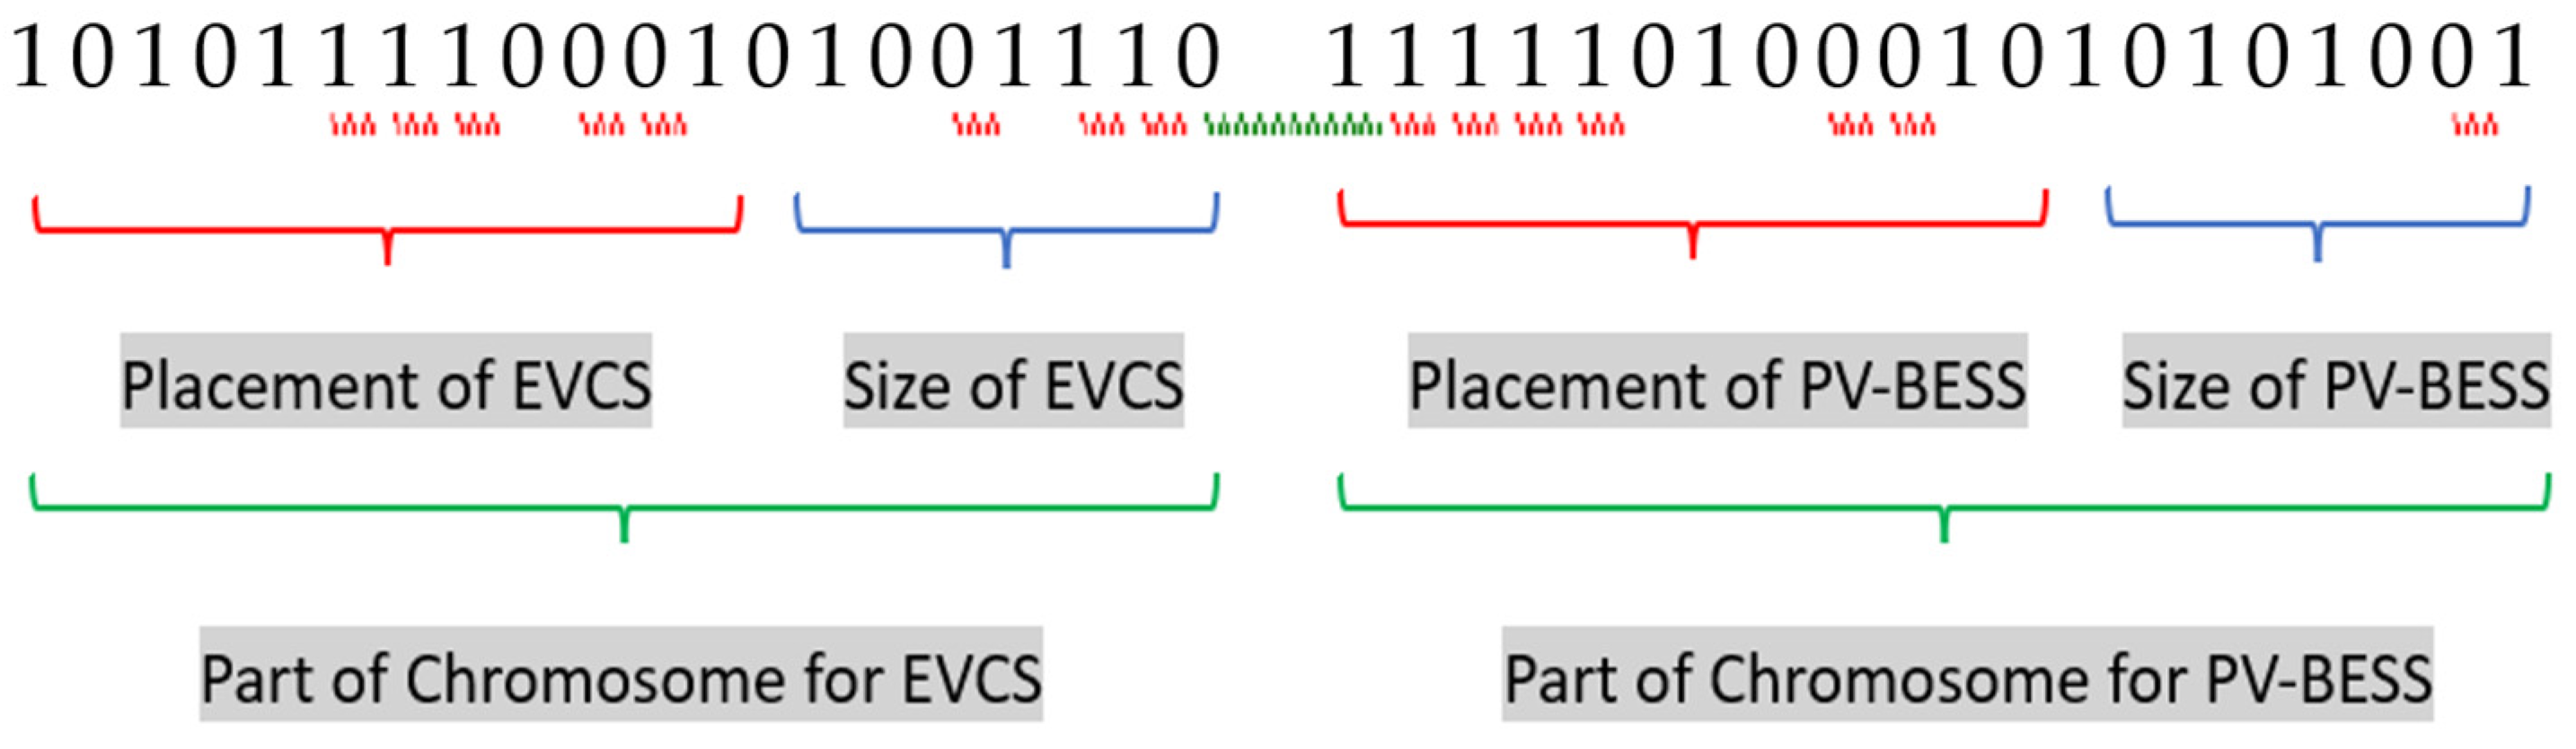
3.3. GA Implementation for the Optimal Placement and Size of EVCS, PV, and BESS
4. Mathematical Formation of Active Distribution Network
4.1. Problem Definition
4.2. Optimal Sizing of EVCS, PV and BESS
4.3. Minimization of Total Power Loss
4.4. Improving the Voltage Stability Index
4.5. EVCS Model
5. Optimal Location and Sizing Using GA
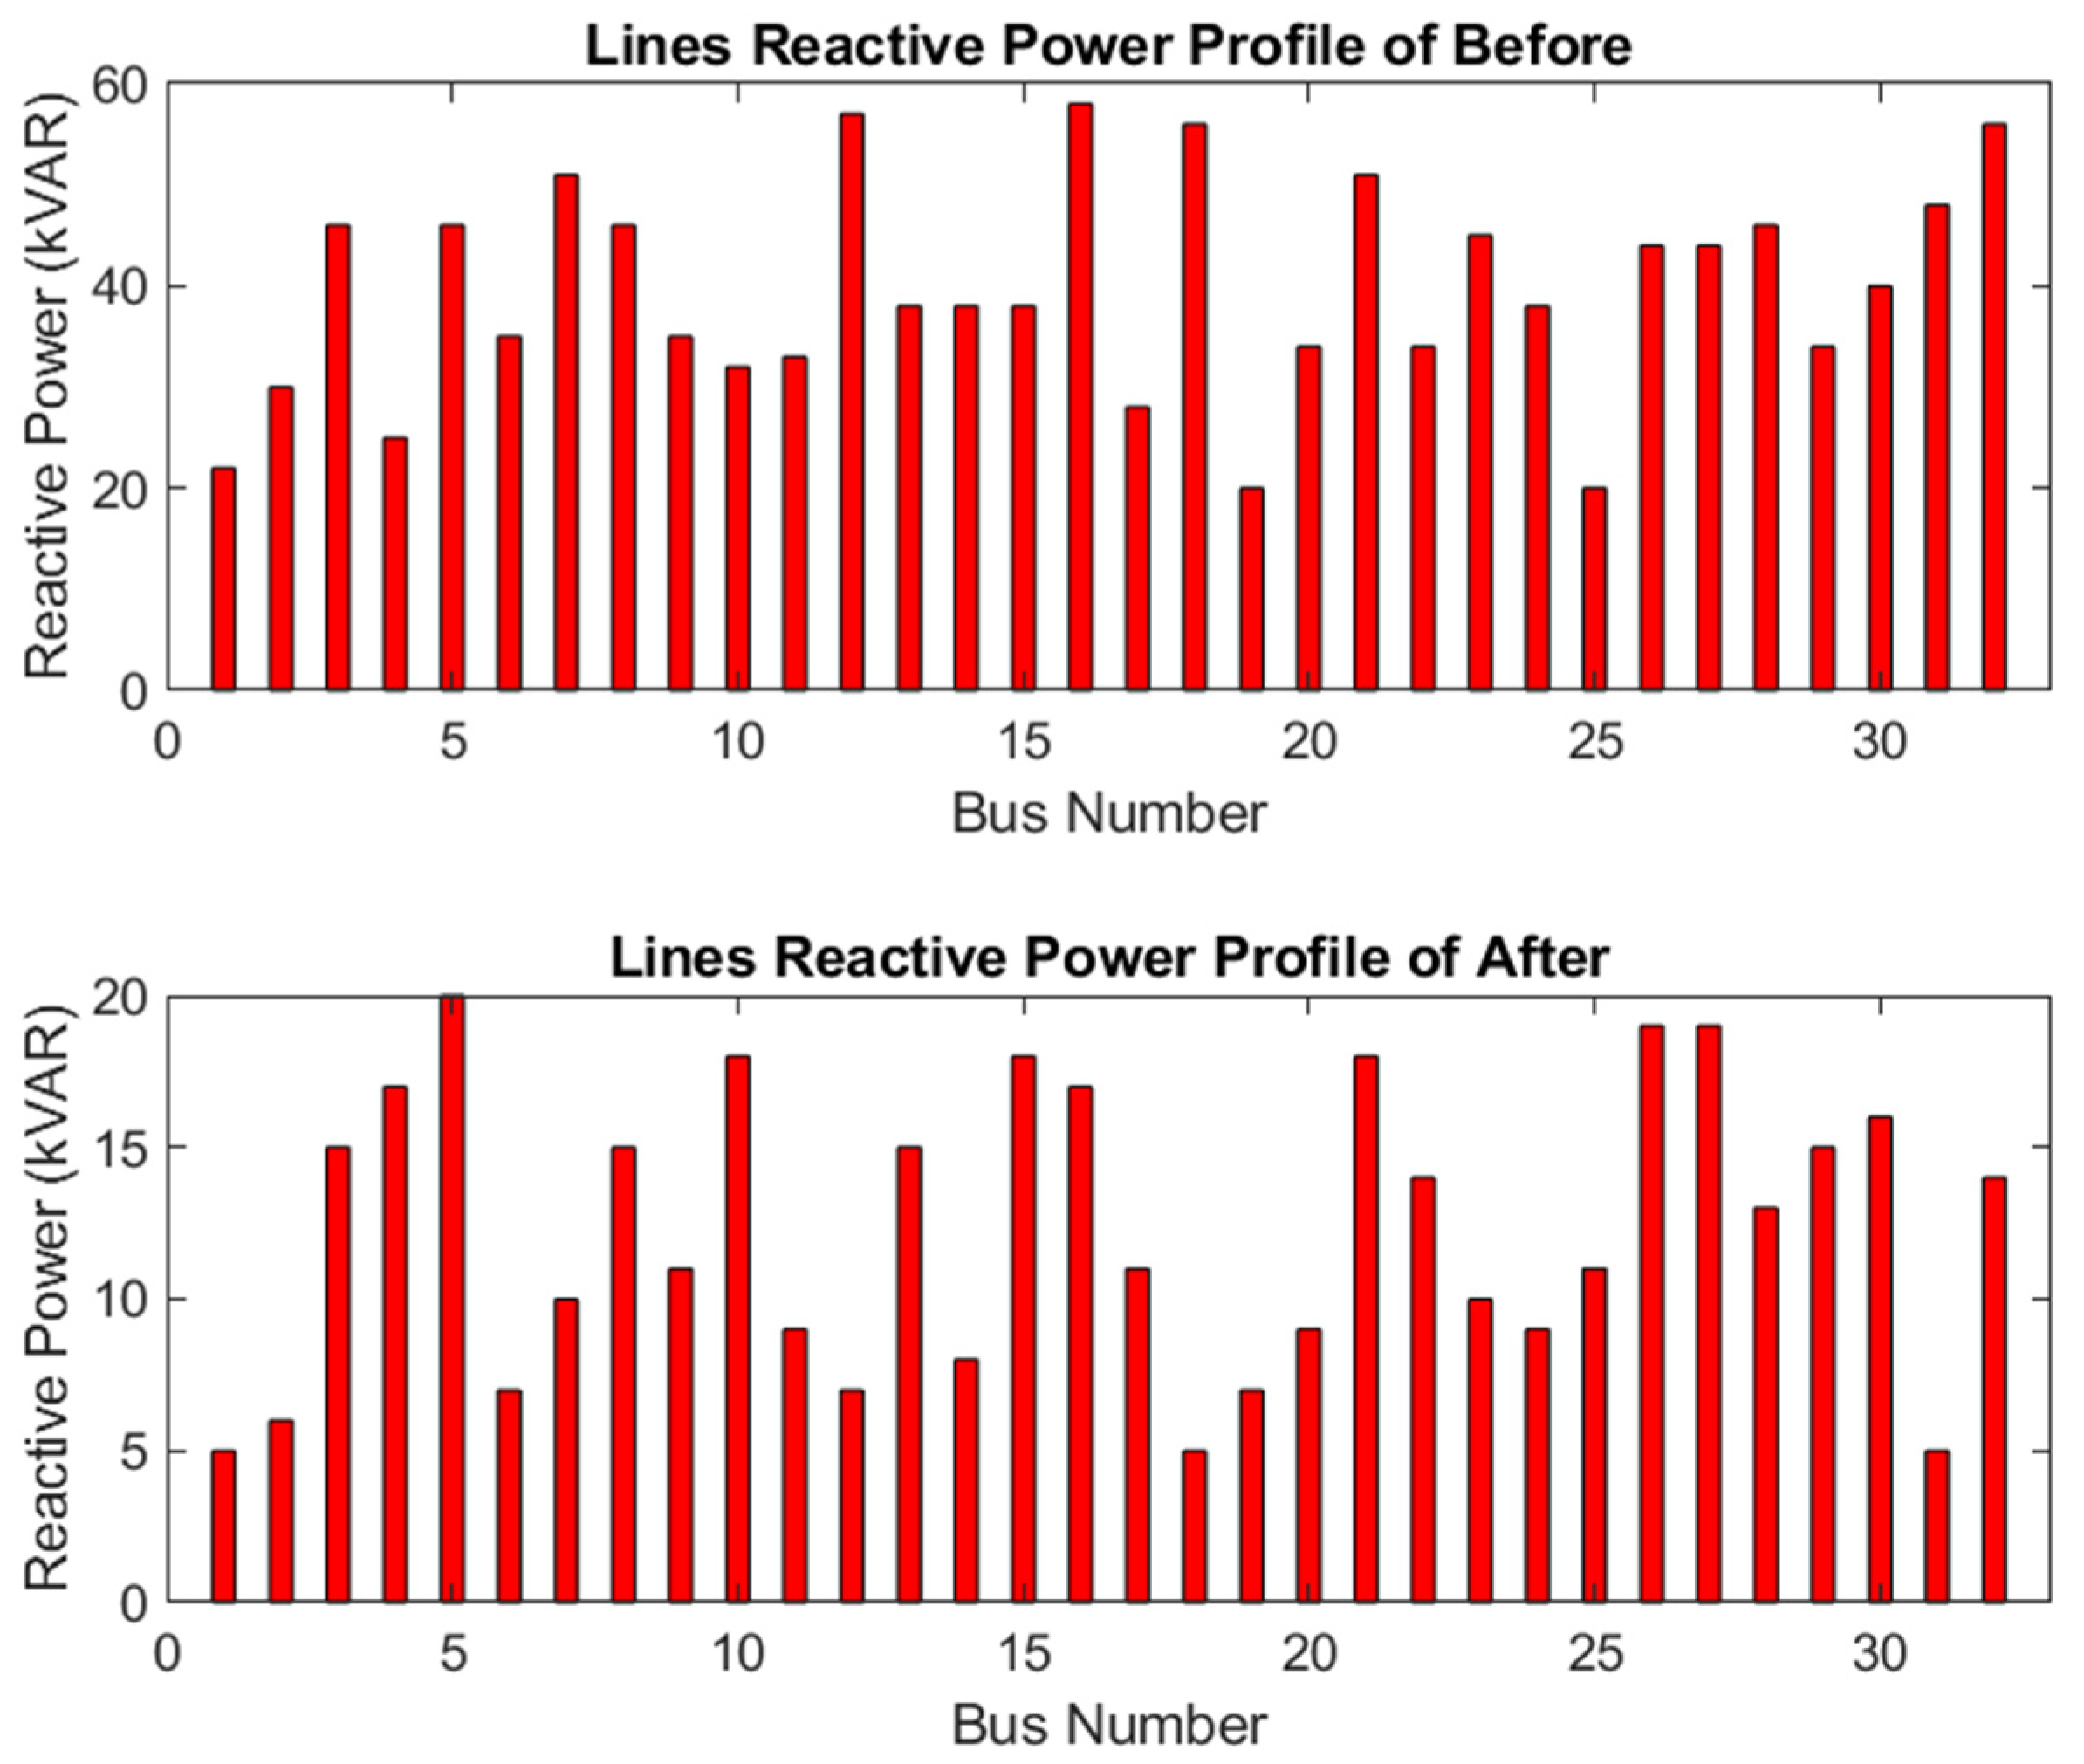
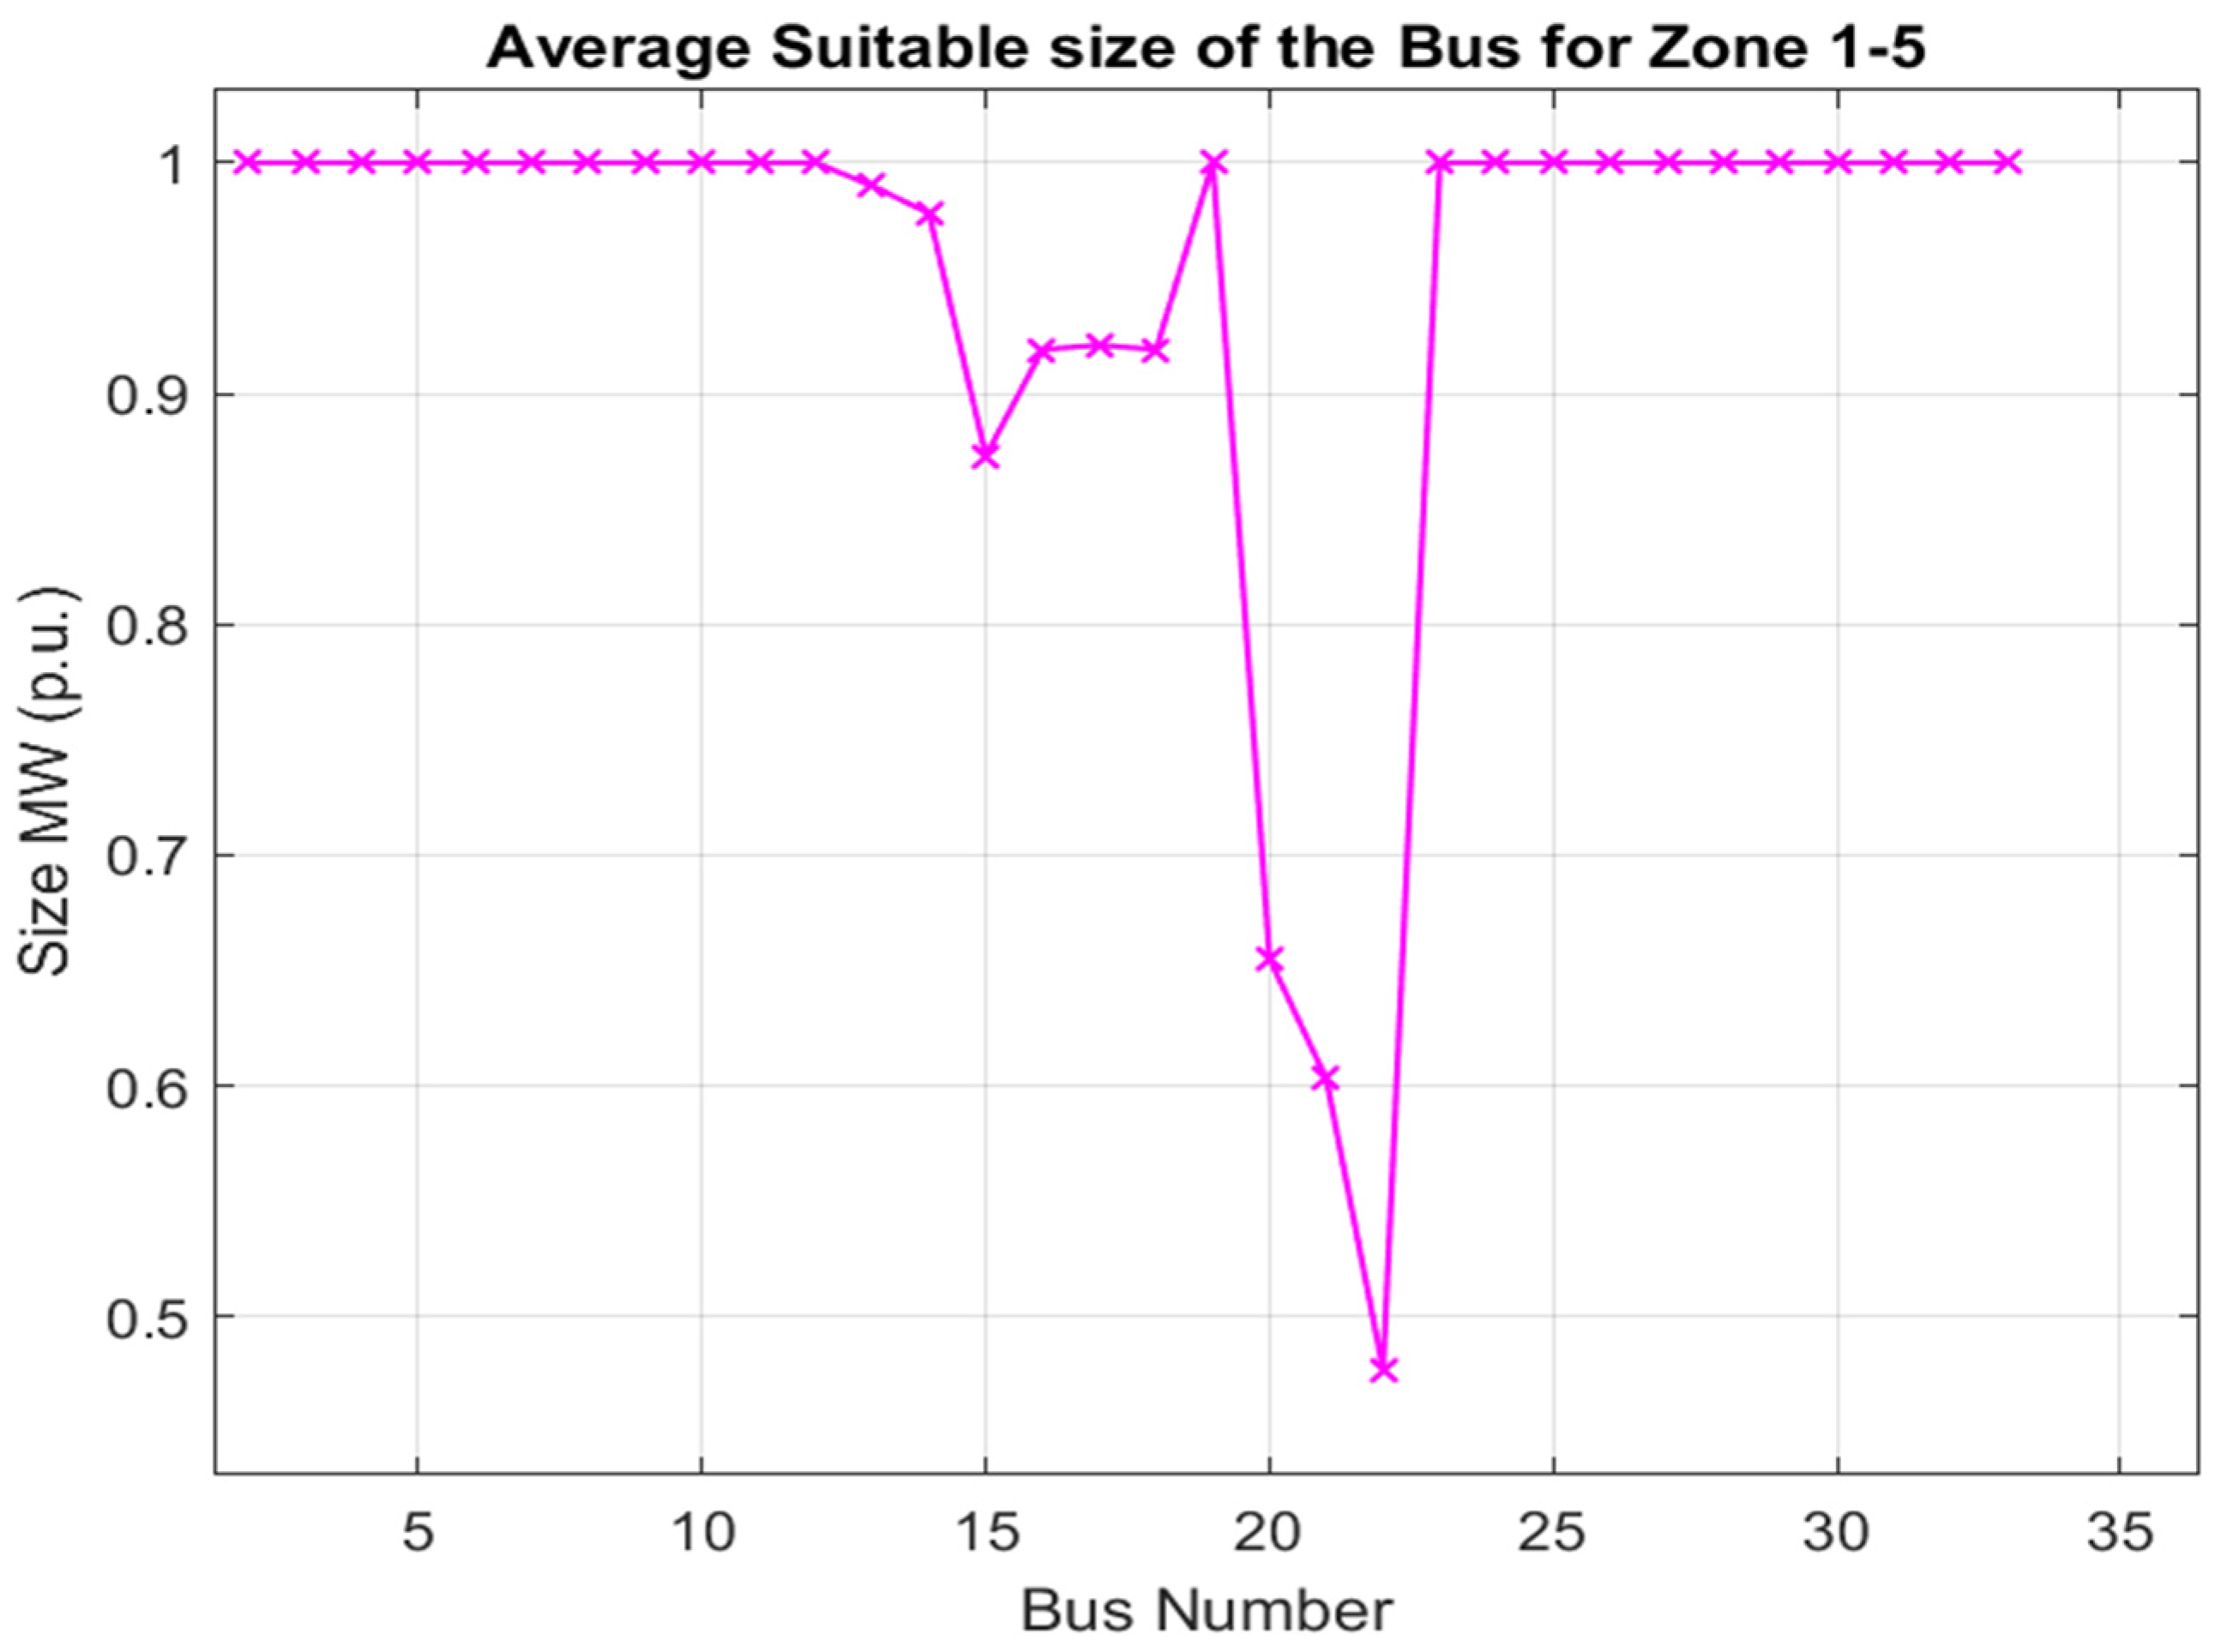
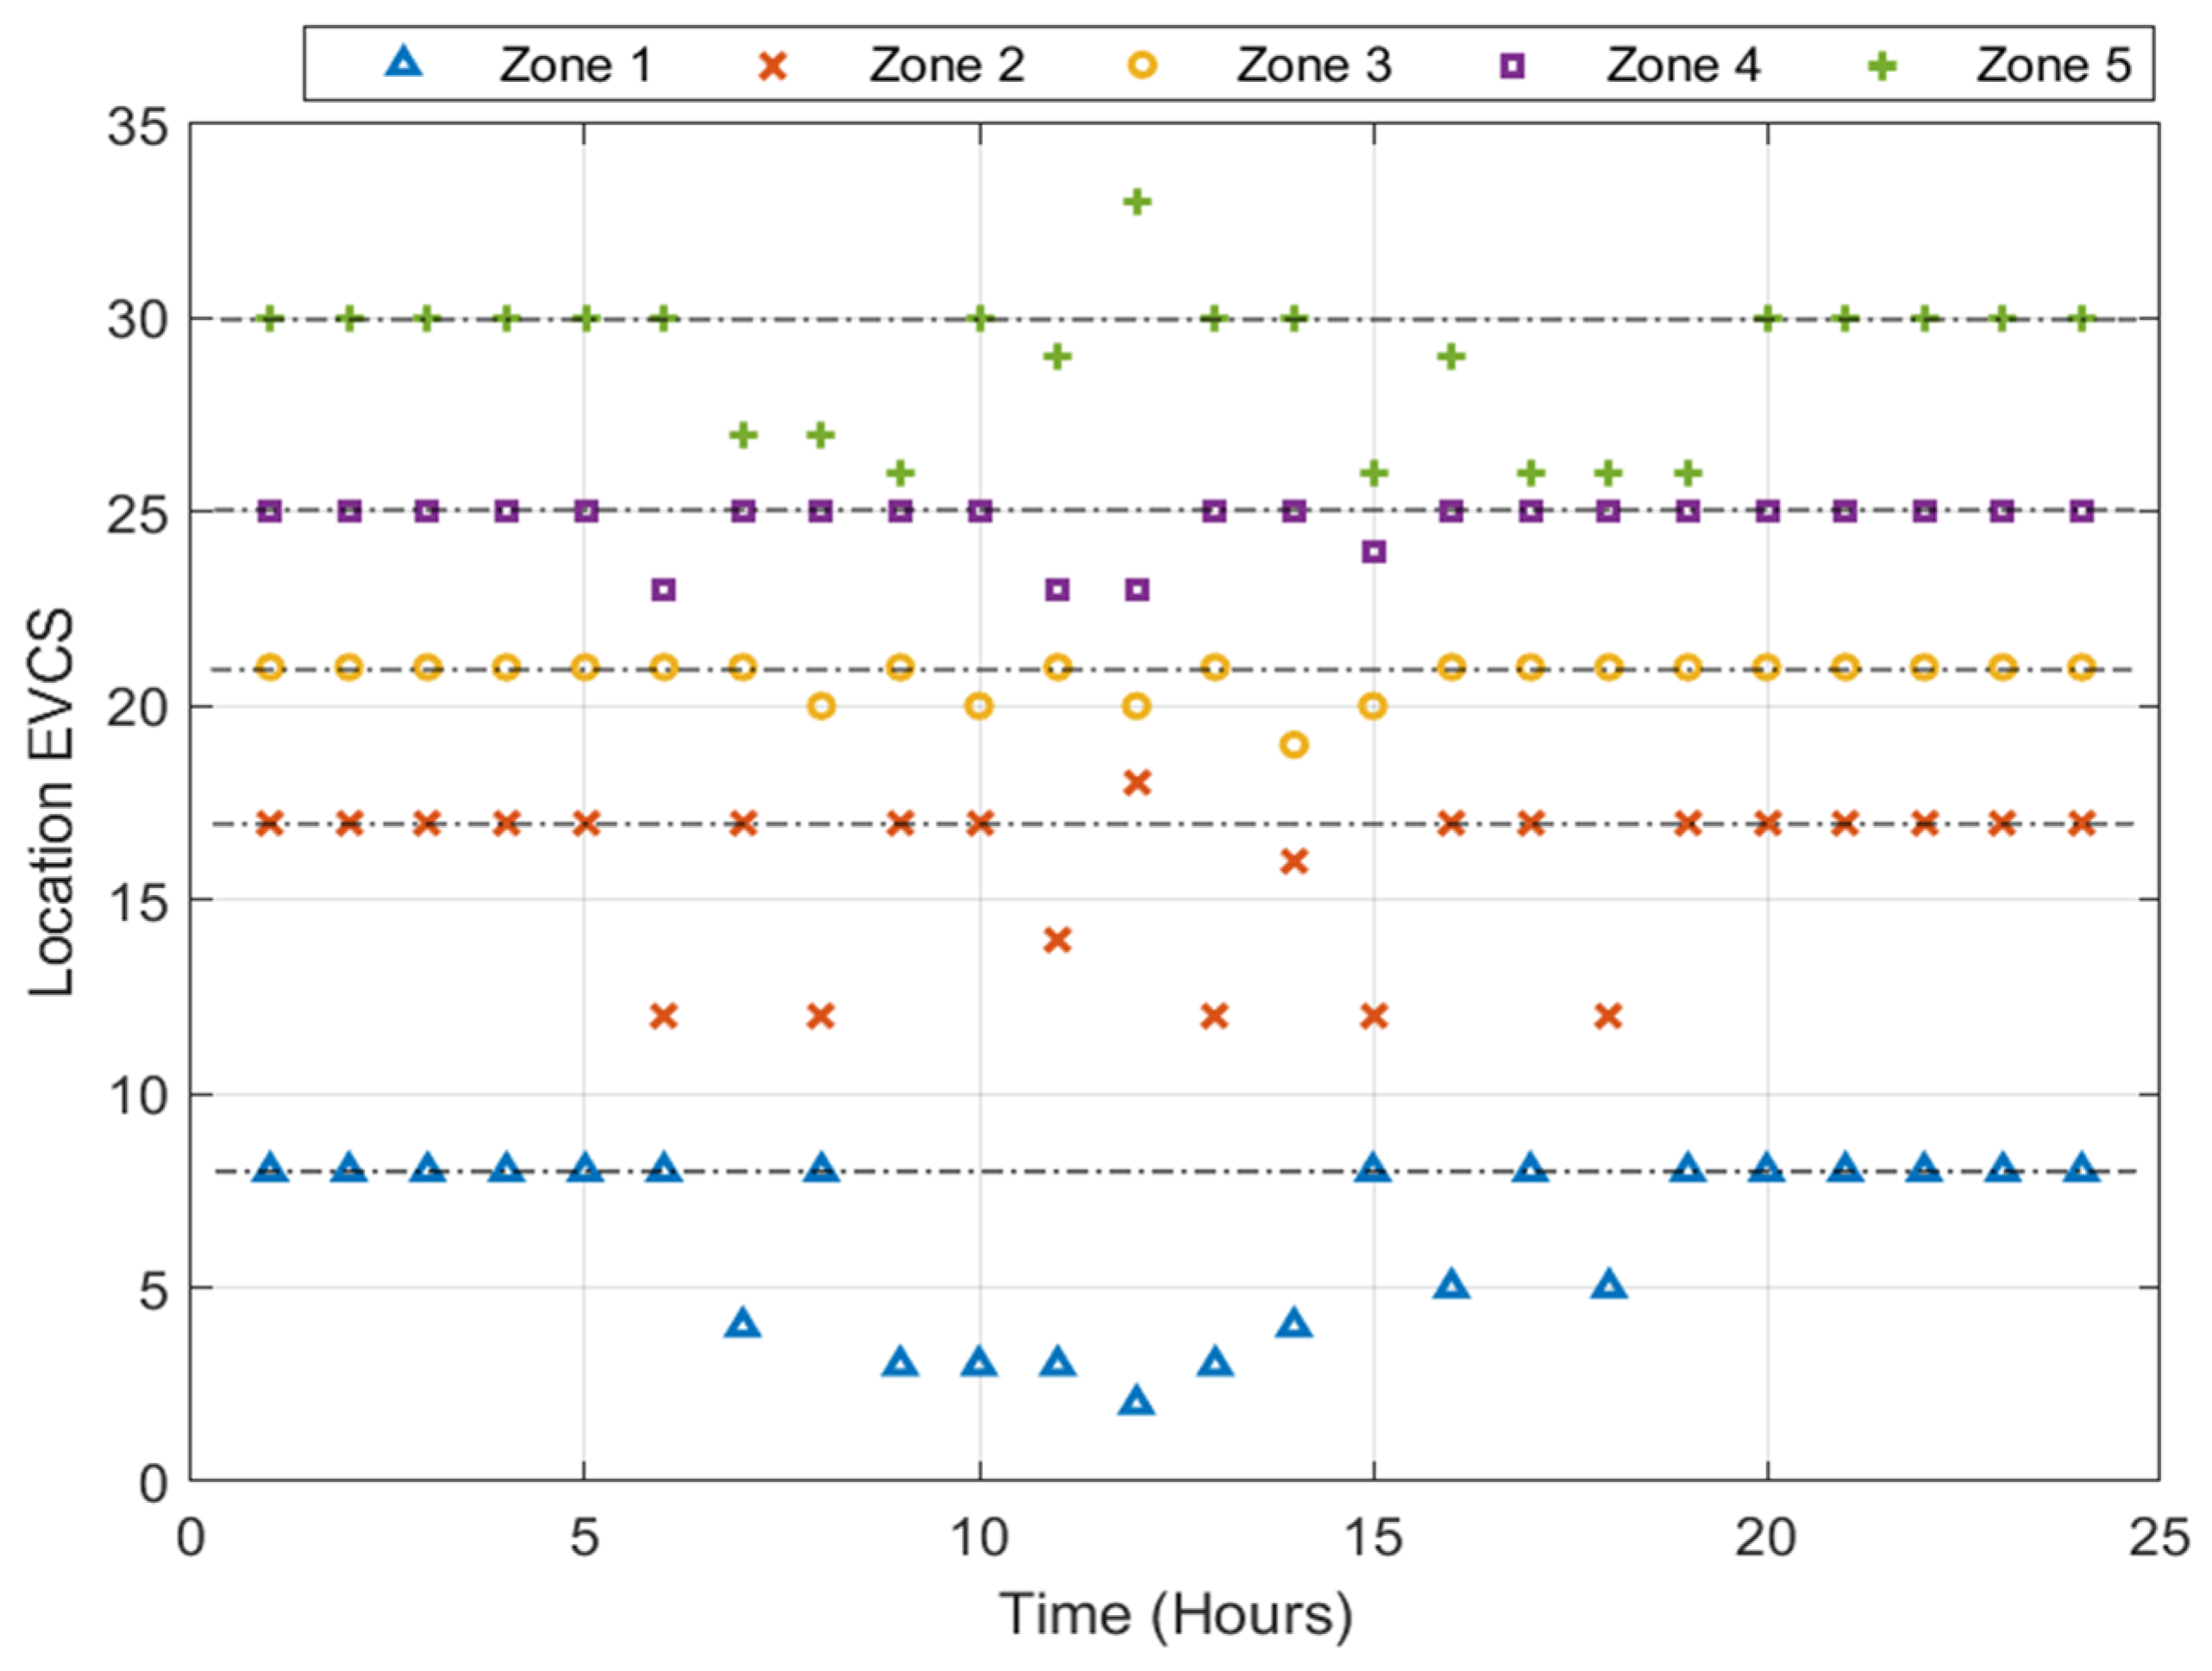
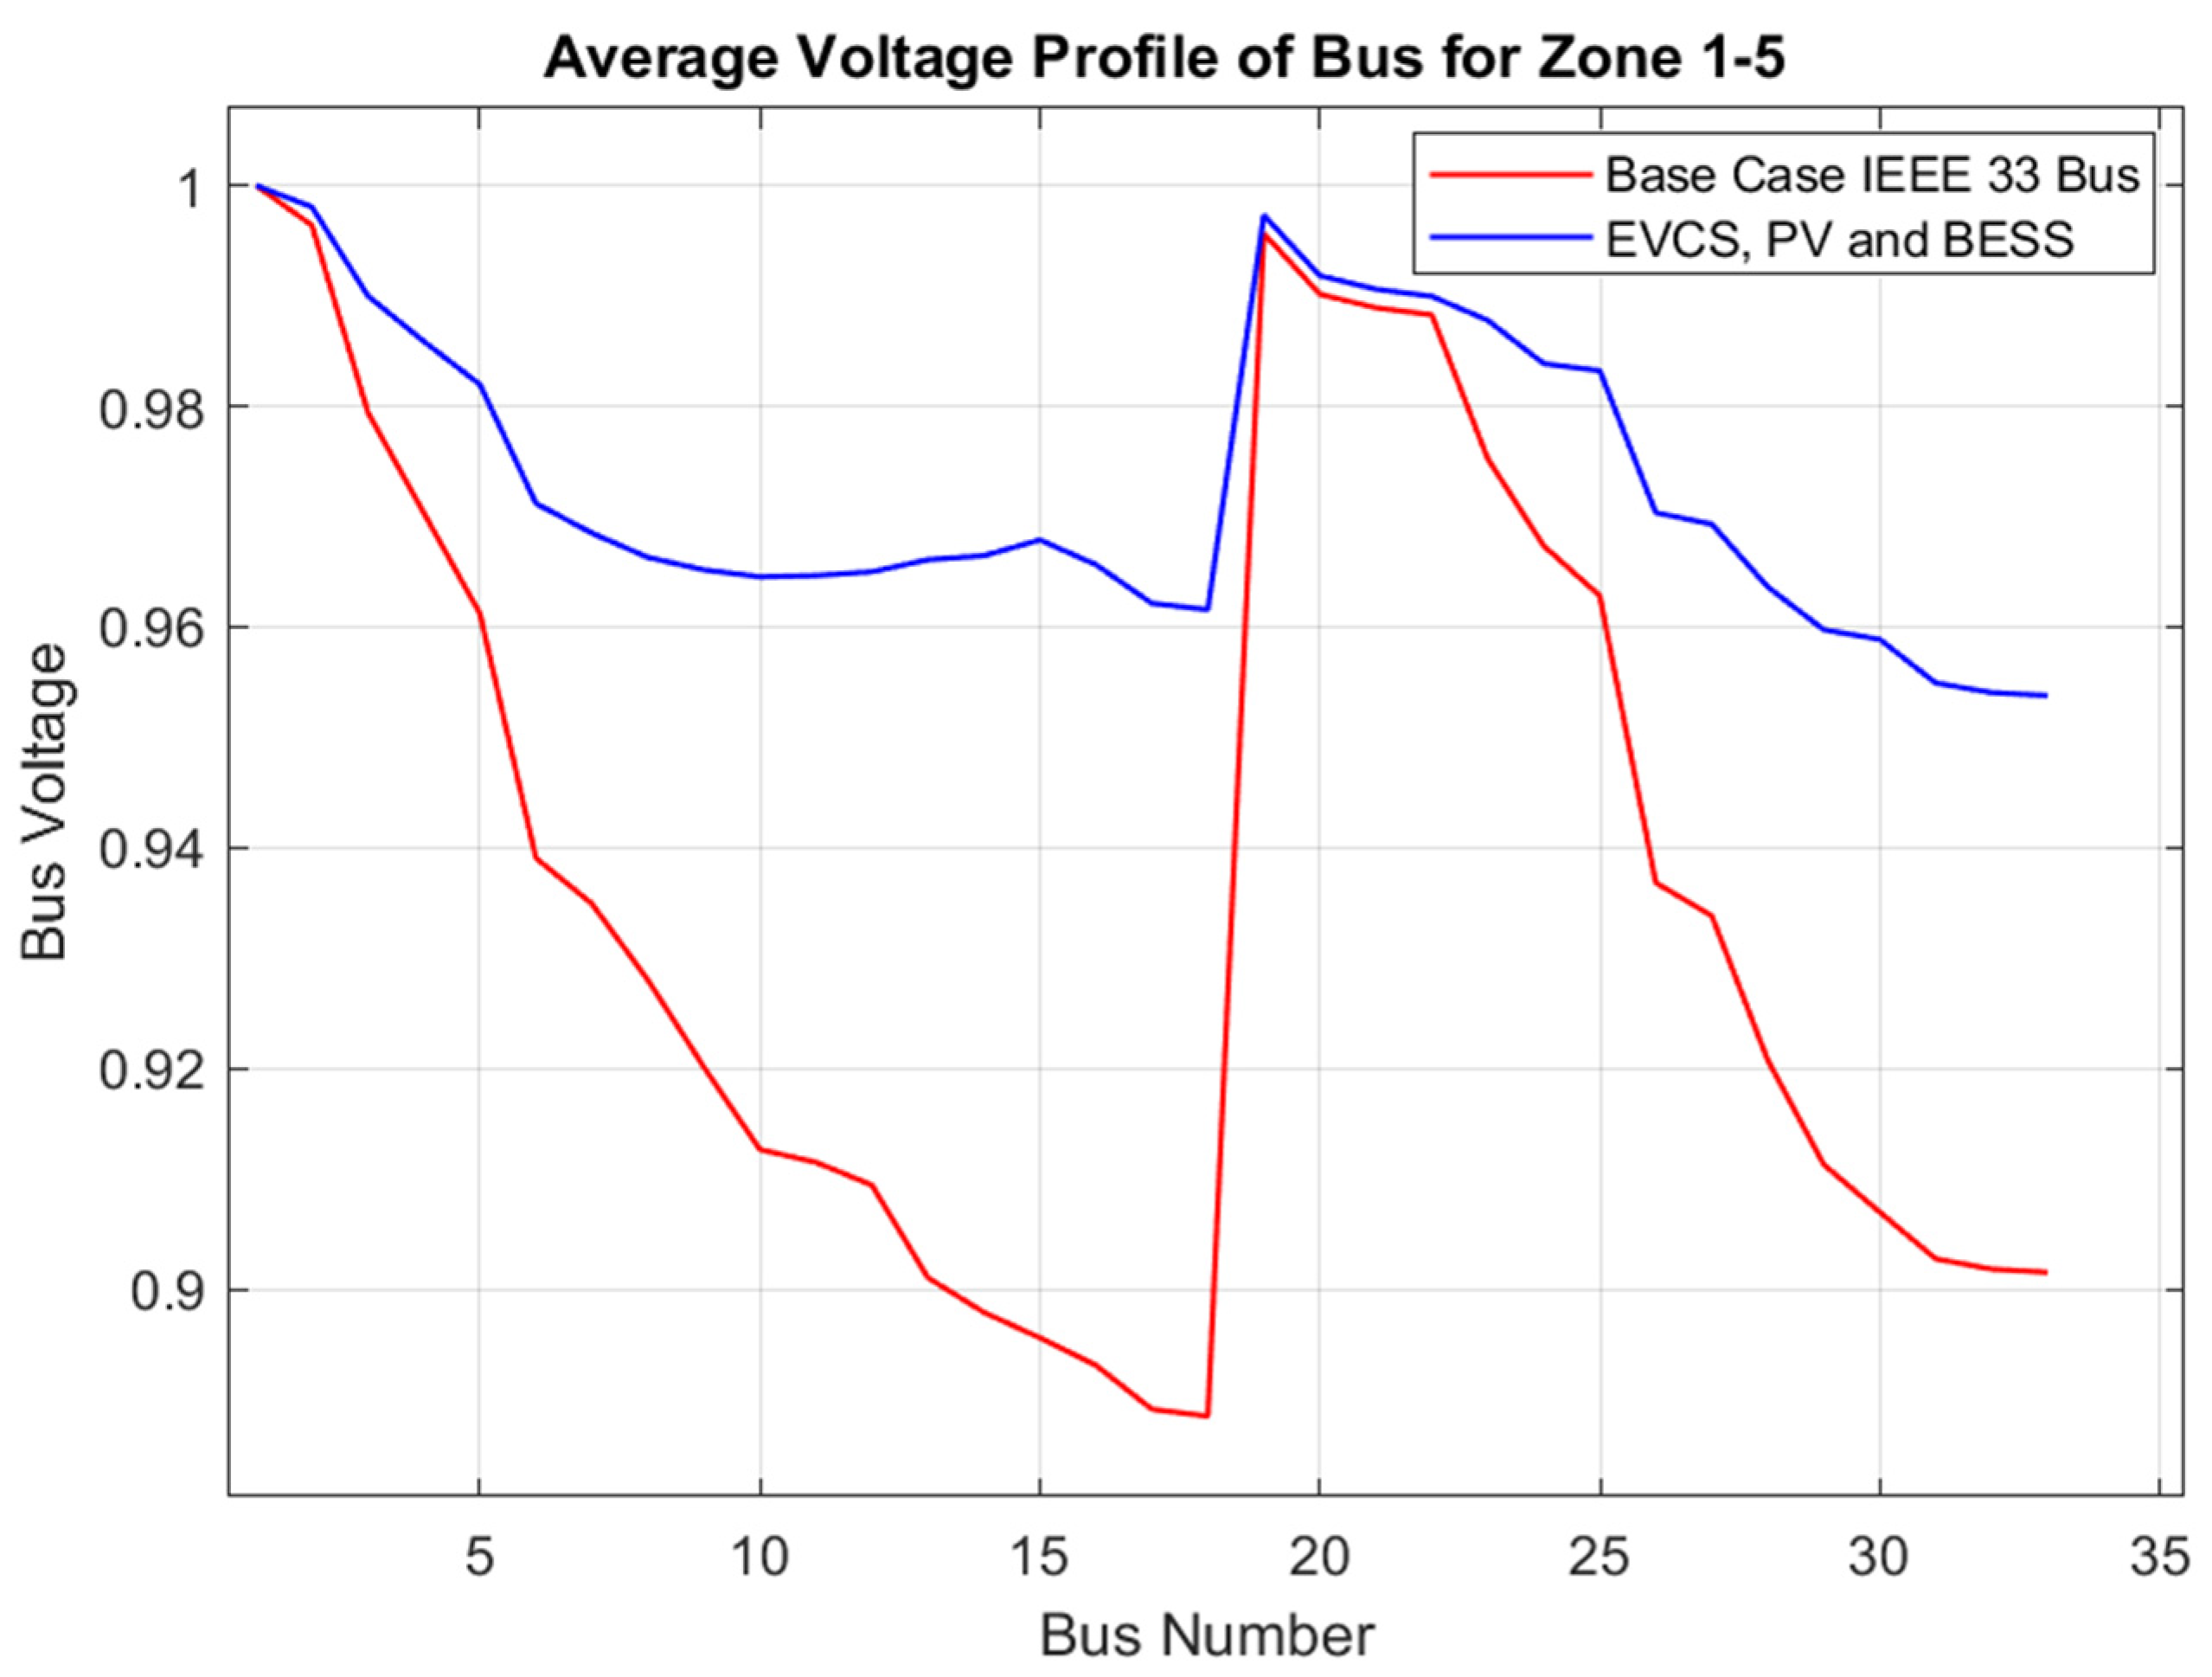
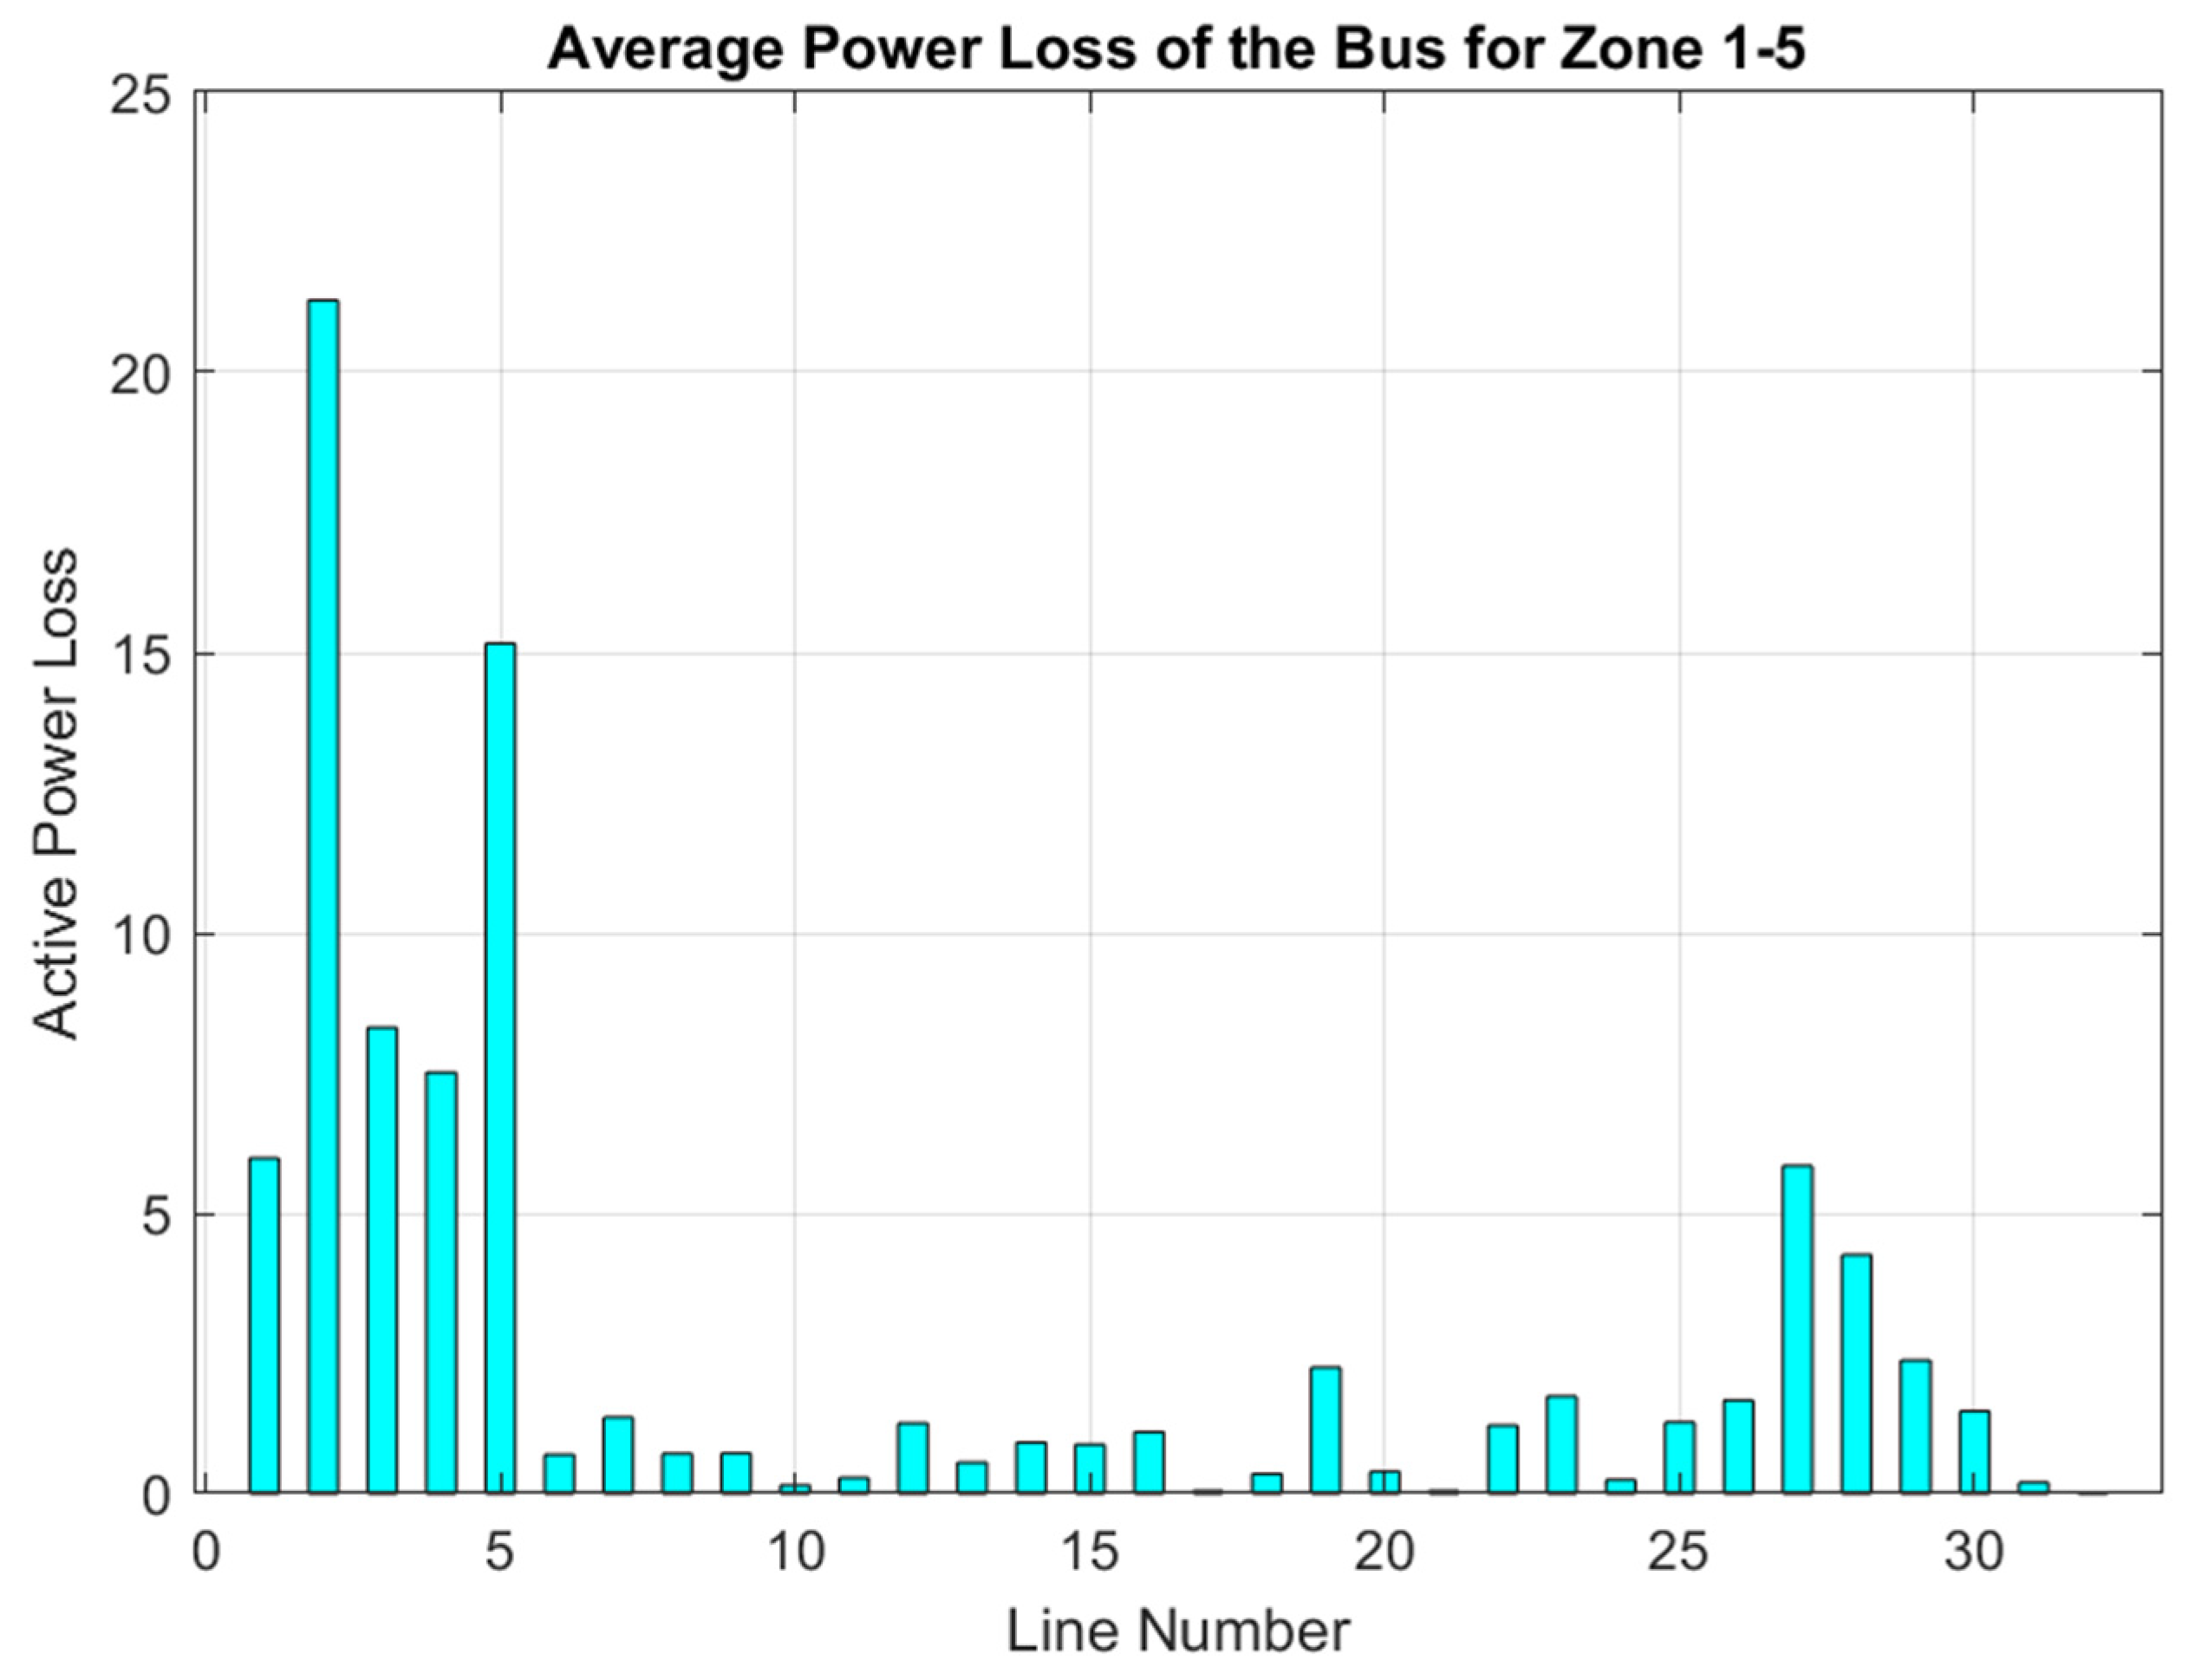
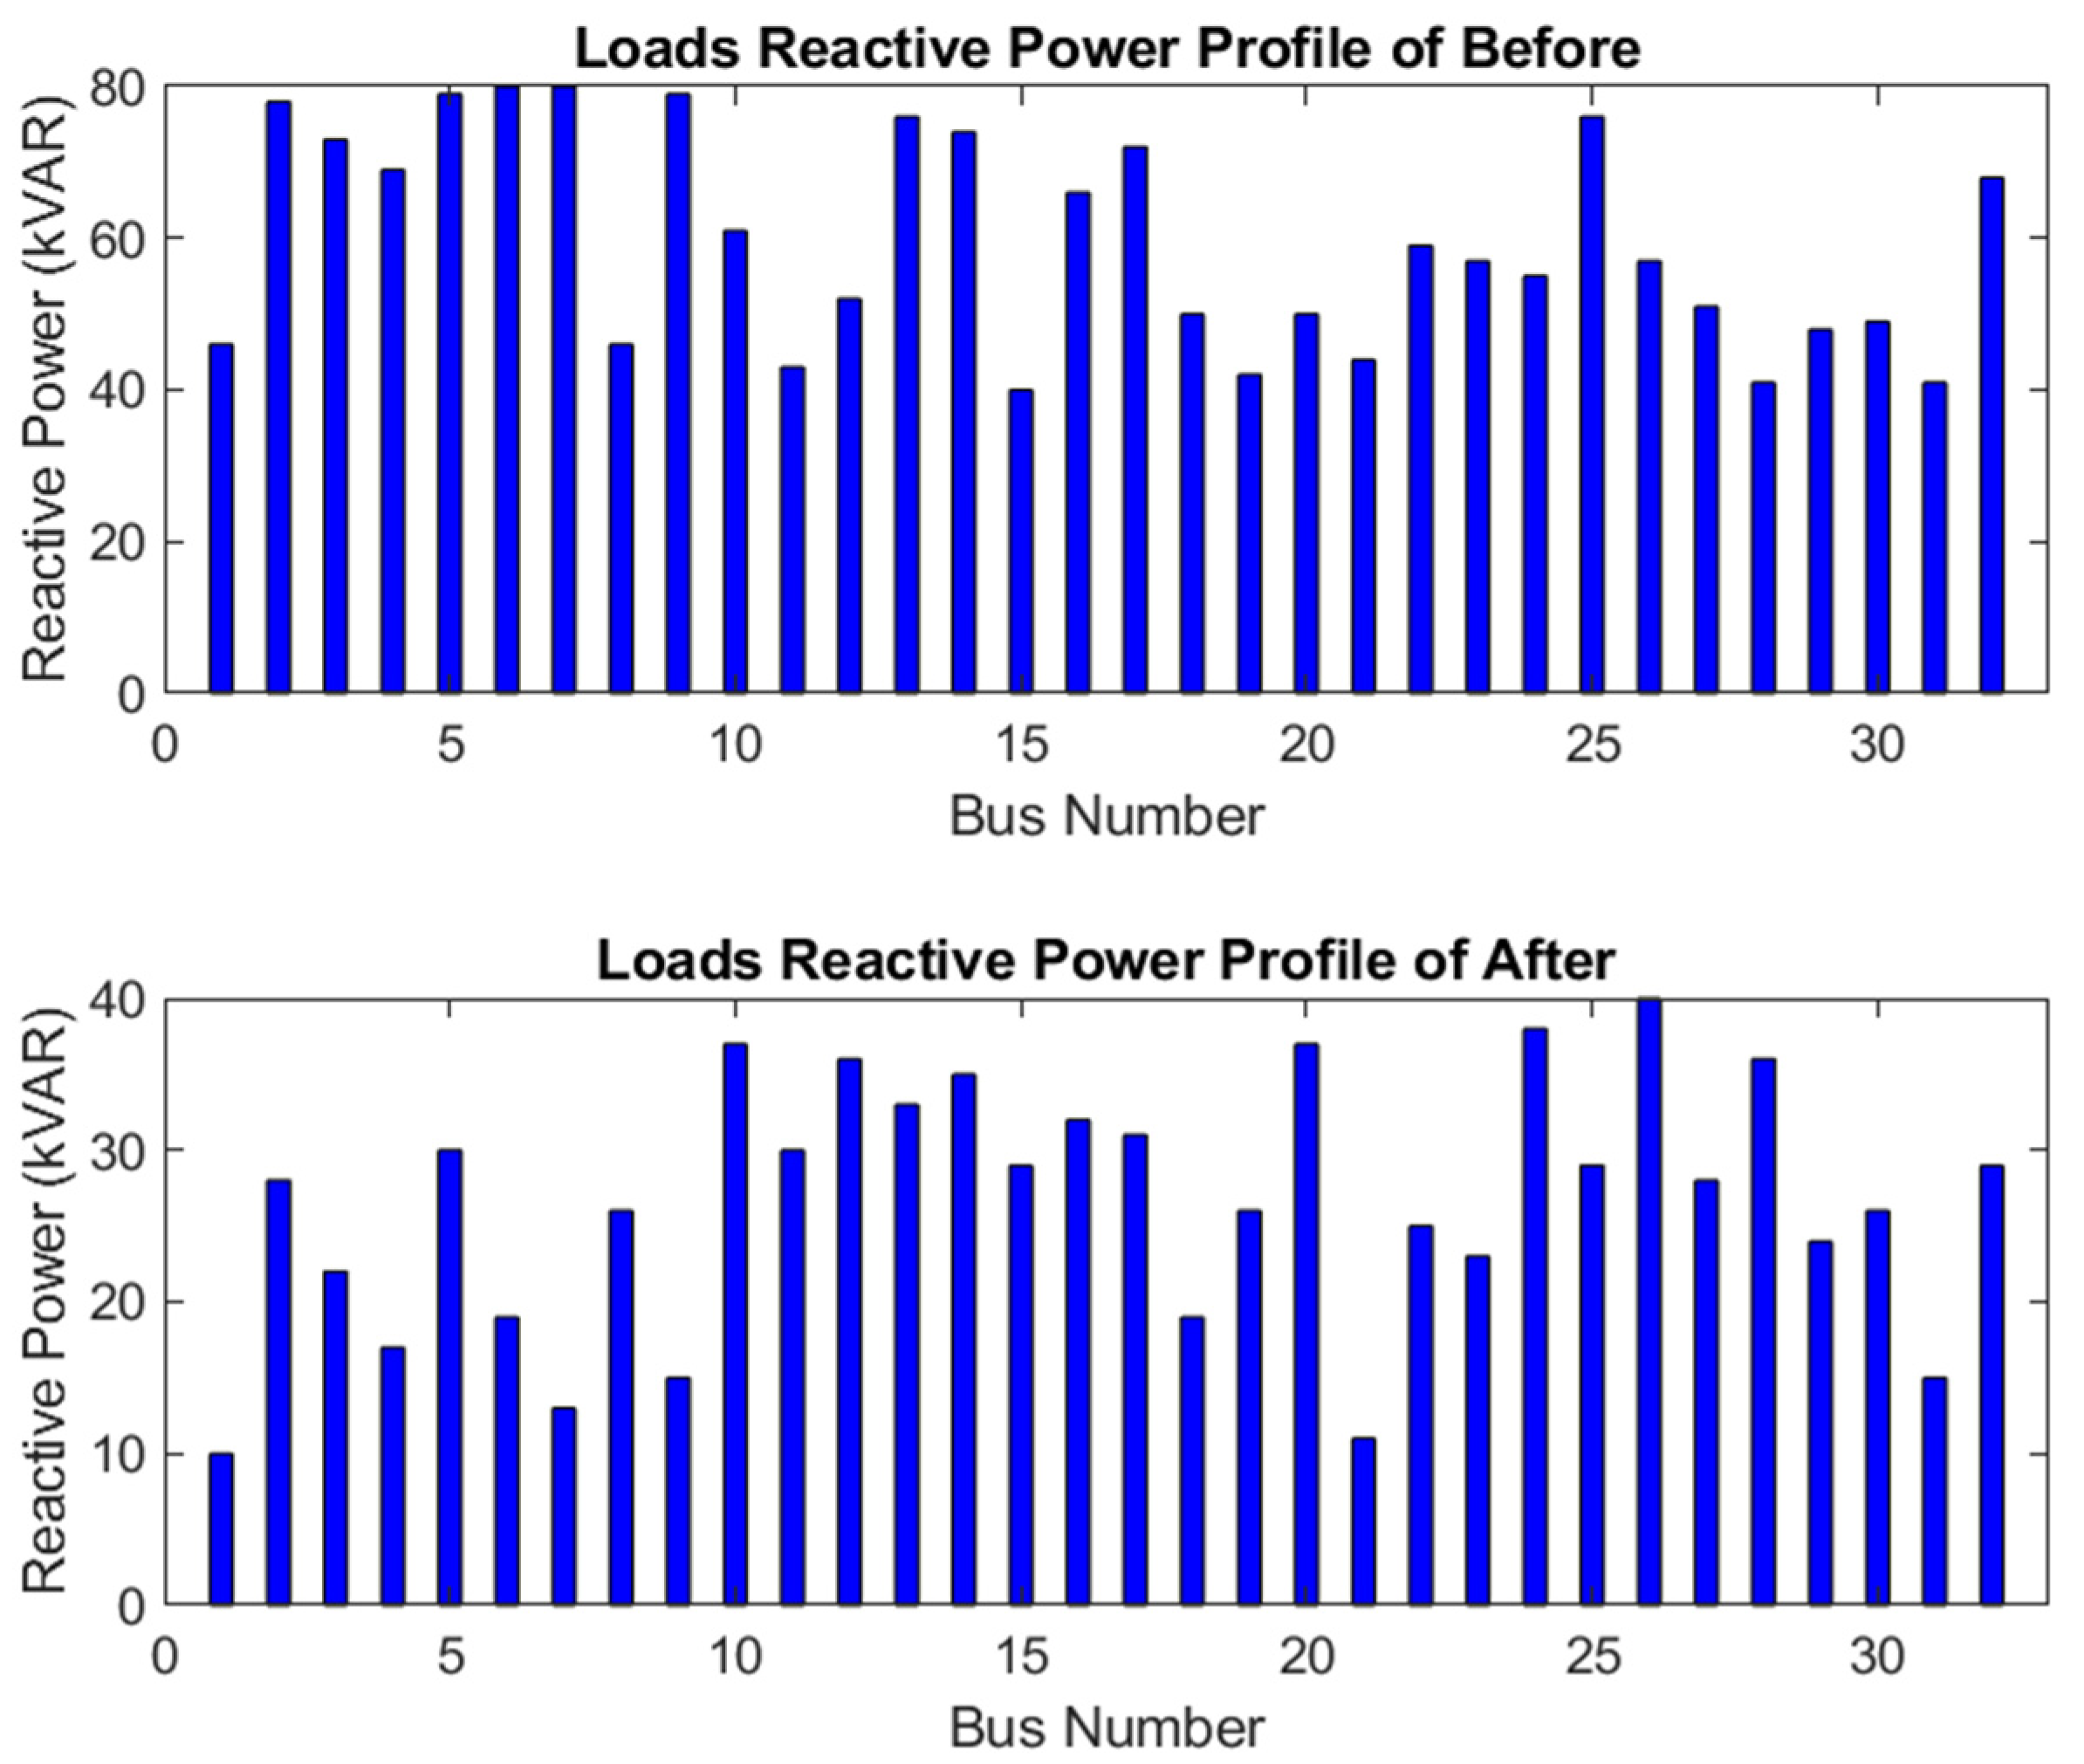
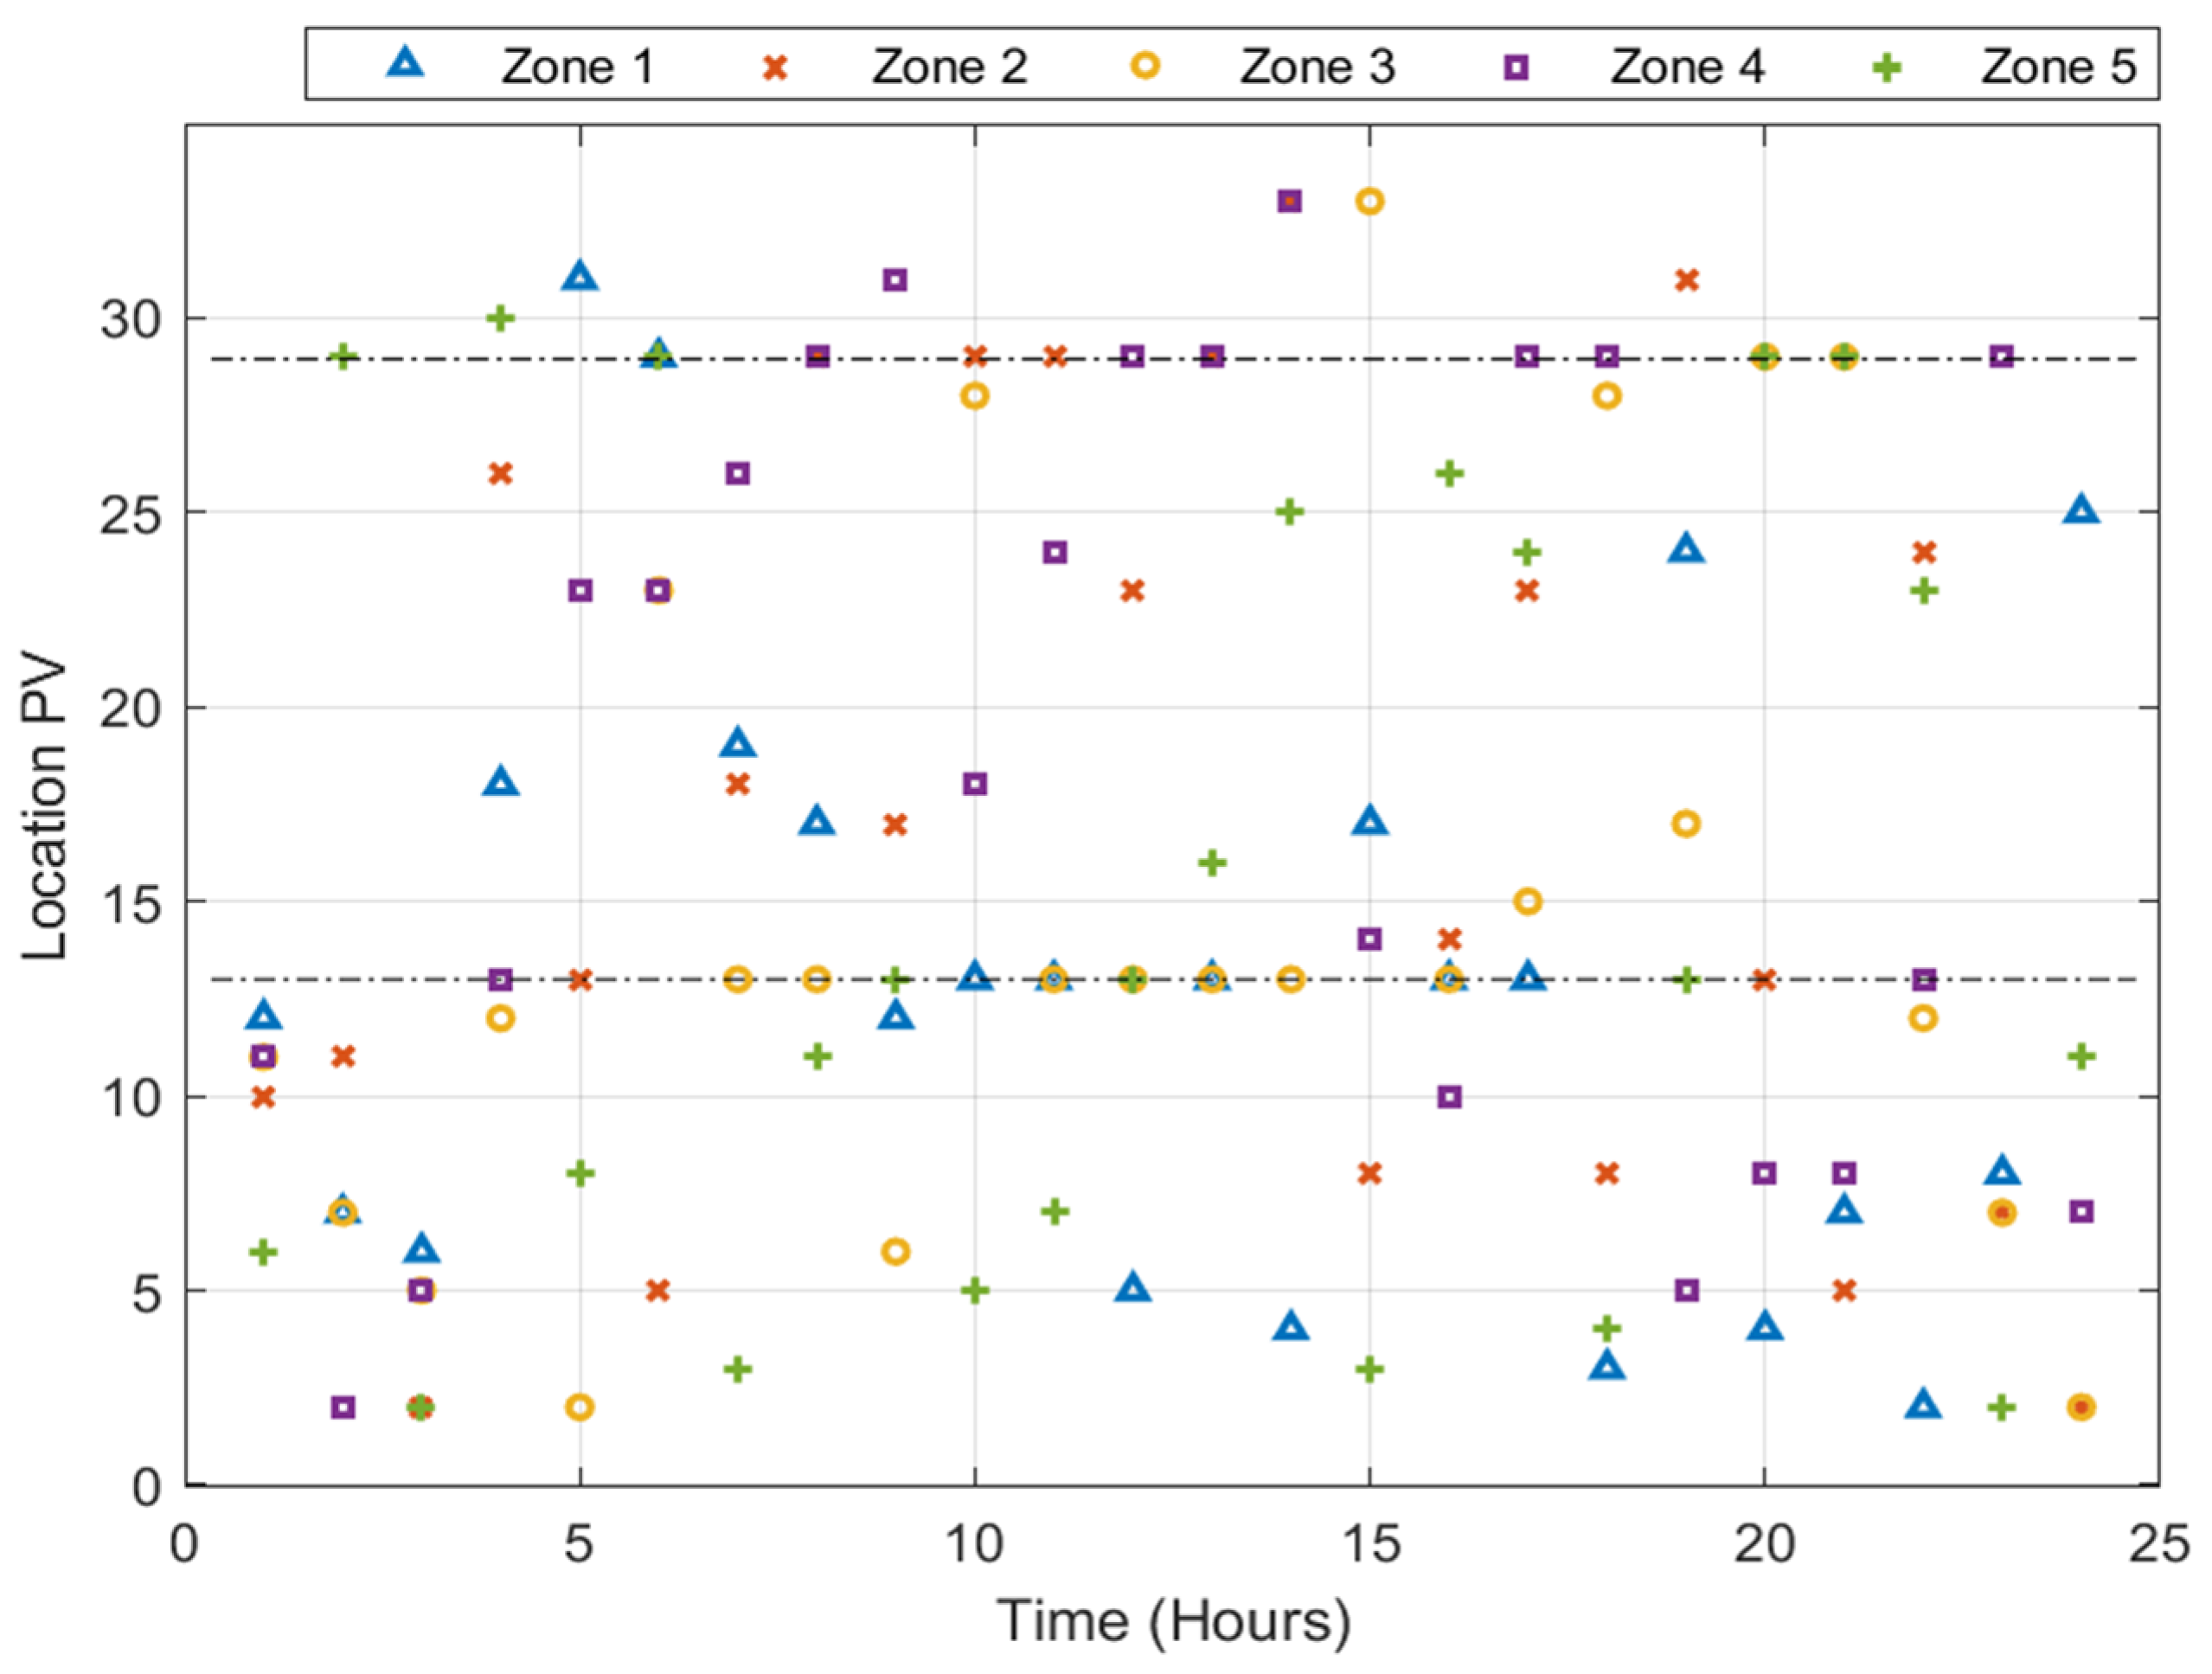
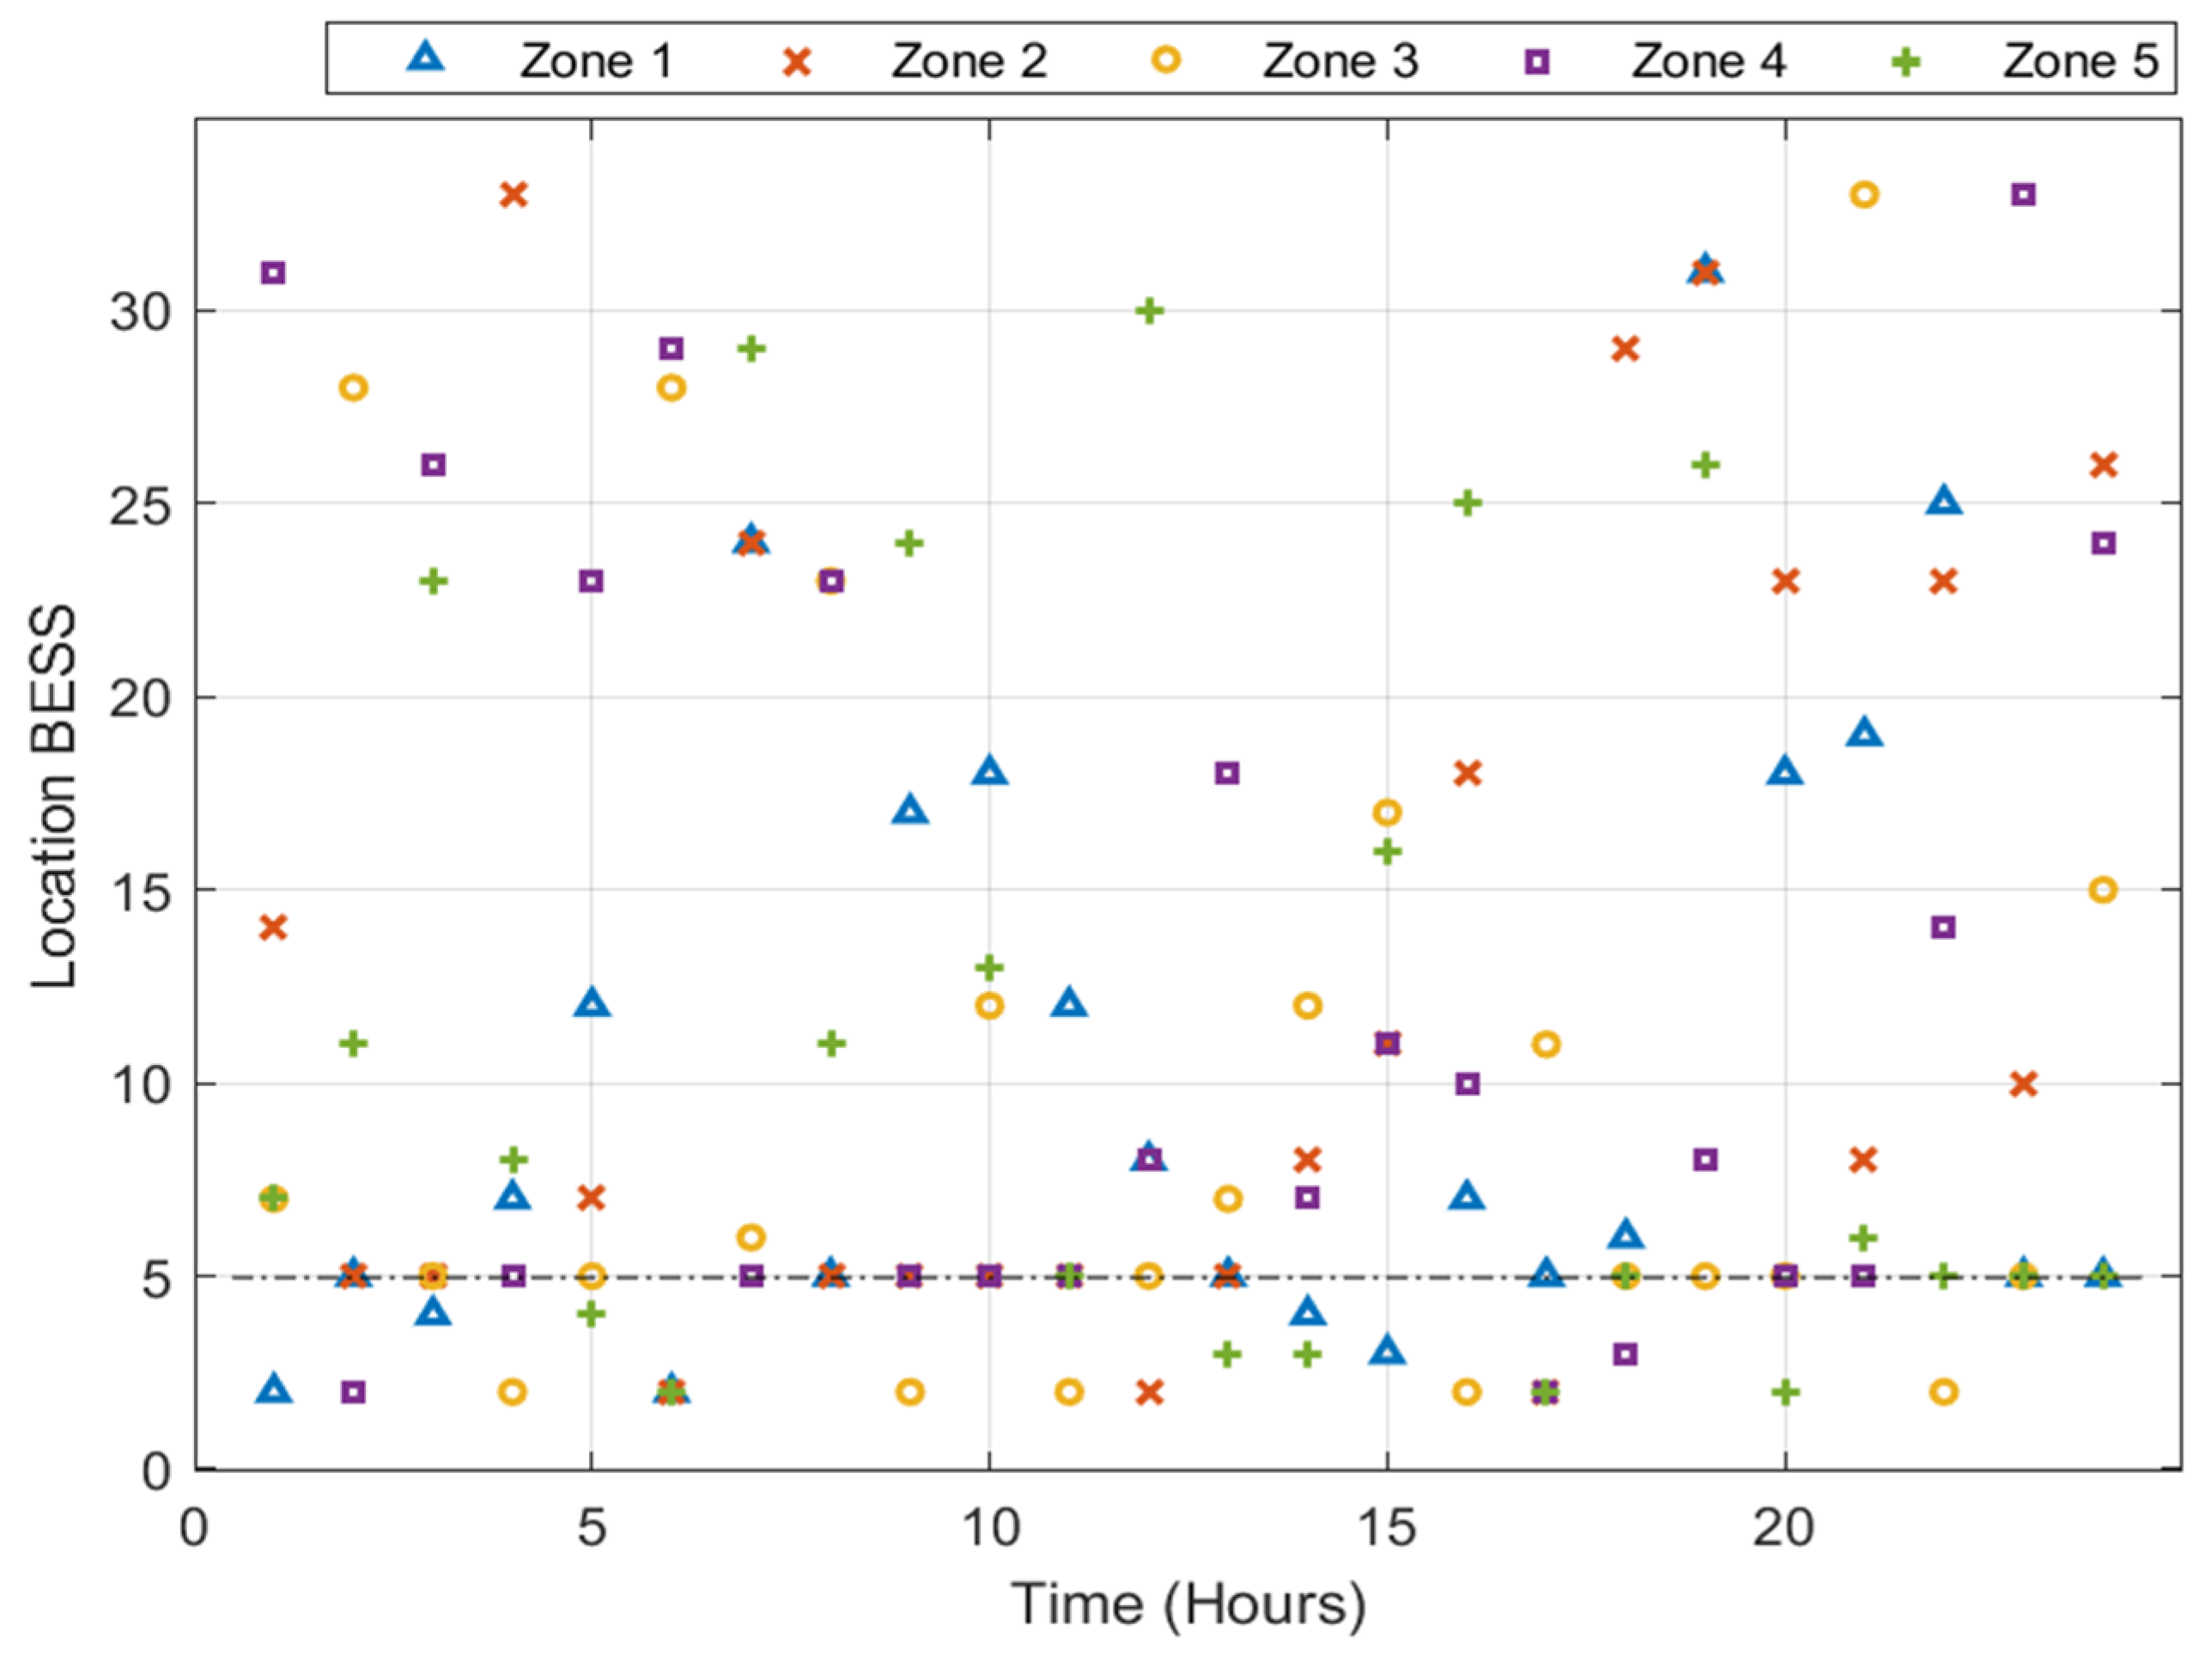
6. Simulation Results
7. Conclusions
Author Contributions
Funding
Data Availability Statement
Conflicts of Interest
References
- Krauter, S. Simple and effective methods to match photovoltaic power generation to the grid load profile for a PV based energy system. Sol. Energy 2018, 159, 768–776. [Google Scholar] [CrossRef]
- Reiman, A.P.; Somani, A.; Alam, M.J.E.; Wang, P.; Wu, D.; Kalsi, K. Power Factor Correction in Feeders with Distributed Photovoltaics Using Residential Appliances as Virtual Batteries. IEEE Access 2019, 7, 99115–99122. [Google Scholar] [CrossRef]
- Khalid, M. Discussion on ‘short-term reactive power planning to minimize cost of energy losses considering PV systems’. IEEE Trans. Smart Grid 2020, 11, 1812. [Google Scholar] [CrossRef]
- Zokaei Ashtiani, M. Challenges in Incorporating Electric Vehicles to Mitigate Greenhouse Gas Emissions. Preprints 2020, 2020120435. [Google Scholar] [CrossRef]
- Chen, Z.; Carrel, A.L.; Gore, C.; Shi, W. Environmental and Economic Impact of Electric Vehicle Adoption in the U.S. Environ. Res. Lett. 2021, 16, 045011. [Google Scholar] [CrossRef]
- Hawkins, T.; Singh, B.; Majeau-Bettez, G.; Strømman, A. Comparative Environmental Life Cycle Assessment of Conventional and Electric Vehicles. J. Ind. Ecol. 2013, 17, 53–64. [Google Scholar] [CrossRef]
- Nour, M.; Chaves-Ávila, J.P.; Magdy, G.; Sánchez-Miralles, Á. Review of Positive and Negative Impacts of Electric Vehicles Charging on Electric Power Systems. Energies 2020, 13, 4675. [Google Scholar] [CrossRef]
- Wang, J.; Bharati, G.R.; Paudyal, S.; Ceylan, O.; Bhattarai, B.P.; Myers, K.S. Coordinated Electric Vehicle Charging With Reactive Power Support to Distribution Grids. IEEE Trans. Ind. Inf. 2019, 15, 54–63. [Google Scholar] [CrossRef]
- Pradhan, P.; Ahmad, I.; Habibi, D.; Kothapalli, G.; Masoum, M.A.S. Reducing the Impacts of Electric Vehicle Charging on Power Distribution Transformers. IEEE Access 2020, 8, 210183–210193. [Google Scholar] [CrossRef]
- Ahmadi, B.; Ceylan, O.; Ozdemir, A. Distributed Energy Resource Allocation Using Multi-Objective Grasshopper Optimization Algorithm. Electr. Power Syst. Res. 2021, 201, 107564. [Google Scholar] [CrossRef]
- Pal, A.; Bhattacharya, A.; Chakraborty, A.K. Allocation of Electric Vehicle Charging Station Considering Uncertainties. Sustain. Energy Grids Netw. 2021, 25, 100422. [Google Scholar] [CrossRef]
- Zhang, Y.; Zhang, Q.; Farnoosh, A.; Chen, S.; Li, Y. GIS-Based Multi-Objective Particle Swarm Optimization of Charging Stations for Electric Vehicles. Energy 2019, 169, 844–853. [Google Scholar] [CrossRef]
- Liu, Q.; Liu, J.; Le, W.; Guo, Z.; He, Z. Data-Driven Intelligent Location of Public Charging Stations for Electric Vehicles. J. Clean. Prod. 2019, 232, 531–541. [Google Scholar] [CrossRef]
- Abo-Elyousr, F.K.; Sharaf, A.M.; Darwish, M.M.F.; Lehtonen, M.; Mahmoud, K. Optimal Scheduling of DG and EV Parking Lots Simultaneously with Demand Response Based on Self-Adjusted PSO and K-Means Clustering. Energy Sci. Eng. 2022, 10, 4025–4043. [Google Scholar] [CrossRef]
- Titus, F.; Thanikanti, S.B.; Deb, S.; Kumar, N.M. Charge Scheduling Optimization of Plug-In Electric Vehicle in a PV Powered Grid-Connected Charging Station Based on Day-Ahead Solar Energy Forecasting in Australia. Sustainability 2022, 14, 3498. [Google Scholar] [CrossRef]
- Martin, H.; Buffat, R.; Bucher, D.; Hamper, J.; Raubal, M. Using Rooftop Photovoltaic Generation to Cover Individual Electric Vehicle Demand—A Detailed Case Study. Renew. Sustain. Energy Rev. 2022, 157, 111969. [Google Scholar] [CrossRef]
- Schettini, T.; dell’Amico, M.; Fumero, F.; Jabali, O.; Malucelli, F. Locating and Sizing Electric Vehicle Chargers Considering Multiple Technologies. Energies 2023, 16, 4186. [Google Scholar] [CrossRef]
- Domínguez-Navarro, J.A.; Dufo-López, R.; Yusta-Loyo, J.M.; Artal-Sevil, J.S.; Bernal-Agustín, J.L. Design of an Electric Vehicle Fast-Charging Station with Integration of Renewable Energy and Storage Systems. Int. J. Electr. Power Energy Syst. 2019, 105, 46–58. [Google Scholar] [CrossRef]
- Salles-Mardones, J.; Flores-Maradiaga, A.; Ahmed, M.A. Feasibility Assessment of Photovoltaic Systems to Save Energy Consumption in Residential Houses with Electric Vehicles in Chile. Sustainability 2022, 14, 5377. [Google Scholar] [CrossRef]
- Roy, P.; He, J.; Liao, Y. Cost optimization of battery and Supercapacitor Hybrid Energy Storage System for dispatching solar PV Power. In Proceedings of the 2020 IEEE Energy Conversion Congress and Exposition (ECCE), Detroit, MI, USA, 11–15 October 2020; IEEE: San Francisco, CA, USA, 2020. [Google Scholar] [CrossRef]
- Garip, S.; Ozdemir, S. Optimization of PV and Battery Energy Storage Size in Grid-Connected Microgrid. Appl. Sci. 2022, 12, 8247. [Google Scholar] [CrossRef]
- Zhou, X.; Zou, S.; Wang, P.; Ma, Z. ADMM-Based Coordination of Electric Vehicles in Constrained Distribution Networks Considering Fast Charging and Degradation. IEEE Trans. Intell. Transp. Syst. 2021, 22, 565–578. [Google Scholar] [CrossRef]
- Das, C. Overview of Energy Storage Systems in Distribution Networks: Placement, Sizing, Operation, and Power Quality. Renew. Sustain. Energy Rev. 2018, 91, 1205–1230. [Google Scholar] [CrossRef]
- Arshad, A.; Lehtonen, M. A Stochastic Assessment of PV Hosting Capacity Enhancement in Distribution Network Utilizing Voltage Support Techniques. IEEE Access 2019, 7, 46461–46471. [Google Scholar] [CrossRef]
- Filip, R.; Püvi, V.; Paar, M.; Lehtonen, M. Analyzing the Impact of EV and BESS Deployment on PV Hosting Capacity of Distribution Networks. Energies 2022, 15, 7921. [Google Scholar] [CrossRef]
- Al Wahedi, A.; Bicer, Y. Techno-Economic Optimization of Novel Stand-Alone Renewables-Based Electric Vehicle Charging Stations in Qatar. Energy 2022, 243, 123008. [Google Scholar] [CrossRef]
- Das, S.; Das, D.; Patra, A. Operation of Distribution Network with Optimal Placement and Sizing of Dispatchable DGs and Shunt Capacitors. Renew. Sustain. Energy Rev. 2019, 113, 109219. [Google Scholar] [CrossRef]
- Dev, A.K.; Kumar, A. Real power loss minimisation and energy cost saving with DG and capacitor using Jaya algorithm in Radial Distribution System. In Lecture Notes in Electrical Engineering; Springer: Singapore, 2023; pp. 11–22. [Google Scholar] [CrossRef]
- Gampa, S.; Das, D. Simultaneous Optimal Allocation and Sizing of Distributed Generations and Shunt Capacitors in Distribution Networks Using Fuzzy GA Methodology. J. Electr. Syst. Inf. Technol. 2019, 6, 4. [Google Scholar] [CrossRef]
- Huy, T.H.B.; Dinh, H.T.; Kim, D. Multi-objective framework for a home energy management system with the integration of solar energy and an electric vehicle using an augmented ε-constraint method and lexicographic optimization. Sustain. Cities Soc. 2023, 88, 104289. [Google Scholar] [CrossRef]
- Nouri, A.; Lachheb, A.; El Amraoui, L. Optimizing efficiency of Vehicle-to-Grid system with intelligent management and ANN-PSO algorithm for battery electric vehicles. Electr. Power Syst. Res. 2024, 226, 109936. [Google Scholar] [CrossRef]
- Bibak, B.; Bai, L. An optimization approach for managing electric vehicle and reused battery charging in a vehicle to grid system under an electricity rate with demand charge. Sustain. Energy Grids Netw. 2023, 36, 101145. [Google Scholar] [CrossRef]
- Allouhi, A.; Rehman, S. Grid-connected hybrid renewable energy systems for supermarkets with electric vehicle charging platforms: Optimization and sensitivity analyses. Energy Rep. 2023, 9, 3305–3318. [Google Scholar] [CrossRef]
- Abdullah-Al-Nahid, S.; Khan, T.A.; Taseen, M.A.; Jamal, T.; Aziz, T. A novel consumer-friendly electric vehicle charging scheme with vehicle to grid provision supported by genetic algorithm based optimization. J. Energy Storage 2022, 50, 104655. [Google Scholar] [CrossRef]
- Metwly, M.Y.; Ahmed, M.; Hamad, M.S.; Abdel-Khalik, A.S.; Hamdan, E.; Elmalhy, N.A. Power management optimization of electric vehicles for grid frequency regulation: Comparative study. Alex. Eng. J. 2023, 65, 749–760. [Google Scholar] [CrossRef]
- Hassan, S.U.; Yousif, M.; Khan, S.N.; Kazmi, S.A.A.; Imran, K. A decision-centric approach for techno-economic optimization and environmental assessment of standalone and grid-integrated renewable-powered electric vehicle charging stations under multiple planning horizons. Energy Convers. Manag. 2023, 294, 117571. [Google Scholar] [CrossRef]
- Liu, J.; Wu, H.; Huang, H.; Yang, H. Renewable Energy Design and Optimization for a Net-Zero Energy Building Integrating Electric Vehicles and Battery Storage Considering Grid Flexibility. Available online: www.elsevier.com/locate/enconman (accessed on 21 October 2023). [CrossRef]
- Datta, J.; Das, D. Energy Management of Multi-microgrids with Renewables and Electric Vehicles considering Price-elasticity based Demand Response: A bi-level Hybrid Optimization Approach. Sustain. Cities Soc. 2023, 99, 104908. [Google Scholar] [CrossRef]
- Barik, A.K.; Das, D.C. Integrated Resource Planning in Sustainable Energy-Based Distributed Microgrids. Sustain. Energy Technol. Assess. 2021, 48, 101622. [Google Scholar] [CrossRef]
- Tchawou Tchuisseu, E.B.; Gomila, D.; Colet, P. Reduction of Power Grid Fluctuations by Communication between Smart Devices. Int. J. Electr. Power Energy Syst. 2019, 108, 145–152. [Google Scholar] [CrossRef]
- Jia, D.; Yang, L.; Gao, X.; Li, K. Assessment of a New Solar Radiation Nowcasting Method Based on FY-4A Satellite Imagery, the McClear Model and SHapley Additive exPlanations (SHAP). Remote Sens. 2023, 15, 2245. [Google Scholar] [CrossRef]
- Almazroui, A.; Mohagheghi, S. Coordinated Control of Electric Vehicles and PV Resources in an Unbalanced Power Distribution System. Energies 2022, 15, 9324. [Google Scholar] [CrossRef]
- Deeum, S.; Janjamraj, N.; Romphochai, S.; Bhumkittipich, K. Optimal Location and Sizing of Renewable Energy Power Generation in Peer-to-Peer Microgrid System Based on Minimized Power Loss. In Proceedings of the 2022 25th International Conference on Electrical Machines and Systems (ICEMS), Chiang Mai, Thailand, 29 November–2 December 2022; pp. 1–4. [Google Scholar]
- Zjavka, L. Solar and Wind Quantity 24 h—Series Prediction Using PDE-Modular Models Gradually Developed according to Spatial Pattern Similarity. Energies 2023, 16, 1085. [Google Scholar] [CrossRef]
- Heidari Yazdi, S.S.; Rahimi, T.; Khadem Haghighian, S.; Gharehpetian, G.B.; Bagheri, M. Over-Voltage Regulation of Distribution Networks by Coordinated Operation of PV Inverters and Demand Side Management Program. Front. Energy Res. 2022, 10, 920654. [Google Scholar] [CrossRef]
- Mojumder, M.R.H.; Ahmed Antara, F.; Hasanuzzaman, M.; Alamri, B.; Alsharef, M. Electric Vehicle-to-Grid (V2G) Technologies: Impact on the Power Grid and Battery. Sustainability 2022, 14, 13856. [Google Scholar] [CrossRef]
- Langwasser, M.; De Carne, G.; Liserre, M.; Biskoping, M. Primary Frequency Regulation using HVDC terminals controlling Voltage Dependent Loads. In Proceedings of the 2021 IEEE Power & Energy Society General Meeting (PESGM), Washington, DC, USA; 2021; pp. 710–720. [Google Scholar] [CrossRef]
- Lazari, V.; Chassiakos, A. Multi-Objective Optimization of Electric Vehicle Charging Station Deployment Using Genetic Algorithms. Appl. Sci. 2023, 13, 4867. [Google Scholar] [CrossRef]
- Song, H.; Han, L.; Wang, Y.; Wen, W.; Qu, Y. Kron Reduction Based on Node Ordering Optimization for Distribution Network Dispatching with Flexible Loads. Energies 2022, 15, 2964. [Google Scholar] [CrossRef]
- Wang, J.; Li, K.-J.; Javid, Z.; Sun, Y. Distributed Optimal Coordinated Operation for Distribution System with the Integration of Residential Microgrids. Appl. Sci. 2019, 9, 2136. [Google Scholar] [CrossRef]


| Reference | Proposed Method | Results |
|---|---|---|
| T.H.B. Huy et al. [30] | Augmented ε-constraint method, Lexicographic optimization | Optimal integration of solar energy and electric vehicle charging; balancing multiple objectives efficiently; enhanced home energy management. |
| A. Nouri et al. [31] | Intelligent Management, ANN-PSO Algorithm | Enhanced efficiency in V2G systems through intelligent management and ANN-PSO optimization, improving the usability of battery electric vehicles in grid support. |
| Bijan Bibak et al. [32] | Optimization Approach, V2G System Modeling | Developed an efficient charging strategy, minimizing costs under demand charge electricity rates. Integrated approach for EVs and reused battery charging. |
| A. Allouhi et al. [33] | Hybrid Renewable Systems, Grid Connection | Enhanced sustainability in supermarkets by integrating renewable energy sources, optimized energy usage through grid connection, efficient EV charging platforms. |
| Syed Abdullah-Al-Nahid et al. [34] | Genetic-Algorithm-based Optimization | Introduction of a user-friendly EV charging scheme; optimization through genetic algorithms, enabling efficient vehicle-to-grid interactions; enhanced usability and accessibility for consumers. |
| M.Y. Metwly et al. [35] | Comparative Study | Comparative analysis of various power management methods for EVs in grid frequency regulation; identification of optimal strategies for effective grid support through EVs. |
| Hassan et al. [36] | Decision-Centric Approach, Multiple Planning Horizons | Comprehensive analysis of standalone and grid-integrated EV charging stations; techno-economic optimization and environmental assessment for multiple planning scenarios; decision-centric approach for robust results. |
| J. Liu et al. [37] | Renewable Energy Optimization, Grid Flexibility Analysis | Integrated approach for net-zero energy building design; optimization of renewable energy systems; incorporation of electric vehicles and battery storage; consideration of grid flexibility for robust solutions. |
| J. Datta et al. [38] | Bi-level hybrid optimization: First level optimizes dynamic pricing and load demand modifications | Integration of price-elasticity based demand response. Incorporation of worst-case realization to handle uncertainties. Novel bi-level hybrid optimization approach (Grey Wolf–Whale Optimization). |
| Amar Kumar Barik et al. [39] | Optimization Algorithms, System Modeling | Efficient allocation of renewable energy sources, energy storage systems, and demand-side management. Enhances microgrid reliability and sustainability. |
| Time (hours) | Solar Radiation Data (W/m2) | Solar Power Data (kW) |
|---|---|---|
| 1 | 0 | 0 |
| 2 | 0 | 0 |
| 3 | 0 | 0 |
| 4 | 0 | 0 |
| 5 | 0 | 0 |
| 6 | 32.1779 | 1290.88 |
| 7 | 203.3411 | 8157.44 |
| 8 | 406.6817 | 16,314.85 |
| 9 | 575.9177 | 23,144.21 |
| 10 | 733.1582 | 29,412.12 |
| 11 | 872.7758 | 35,013.16 |
| 12 | 737.8383 | 29,599.87 |
| 13 | 815.8810 | 32,729.91 |
| 14 | 818.2873 | 32,787.24 |
| 15 | 732.5975 | 29,389.62 |
| 16 | 565.5490 | 22,688.14 |
| 17 | 455.1528 | 18,259.37 |
| 18 | 139.9814 | 5615.64 |
| 19 | 37.669 | 1511.17 |
| 20 | 0 | 0 |
| 21 | 0 | 0 |
| 22 | 0 | 0 |
| 23 | 0 | 0 |
| 24 | 0 | 0 |
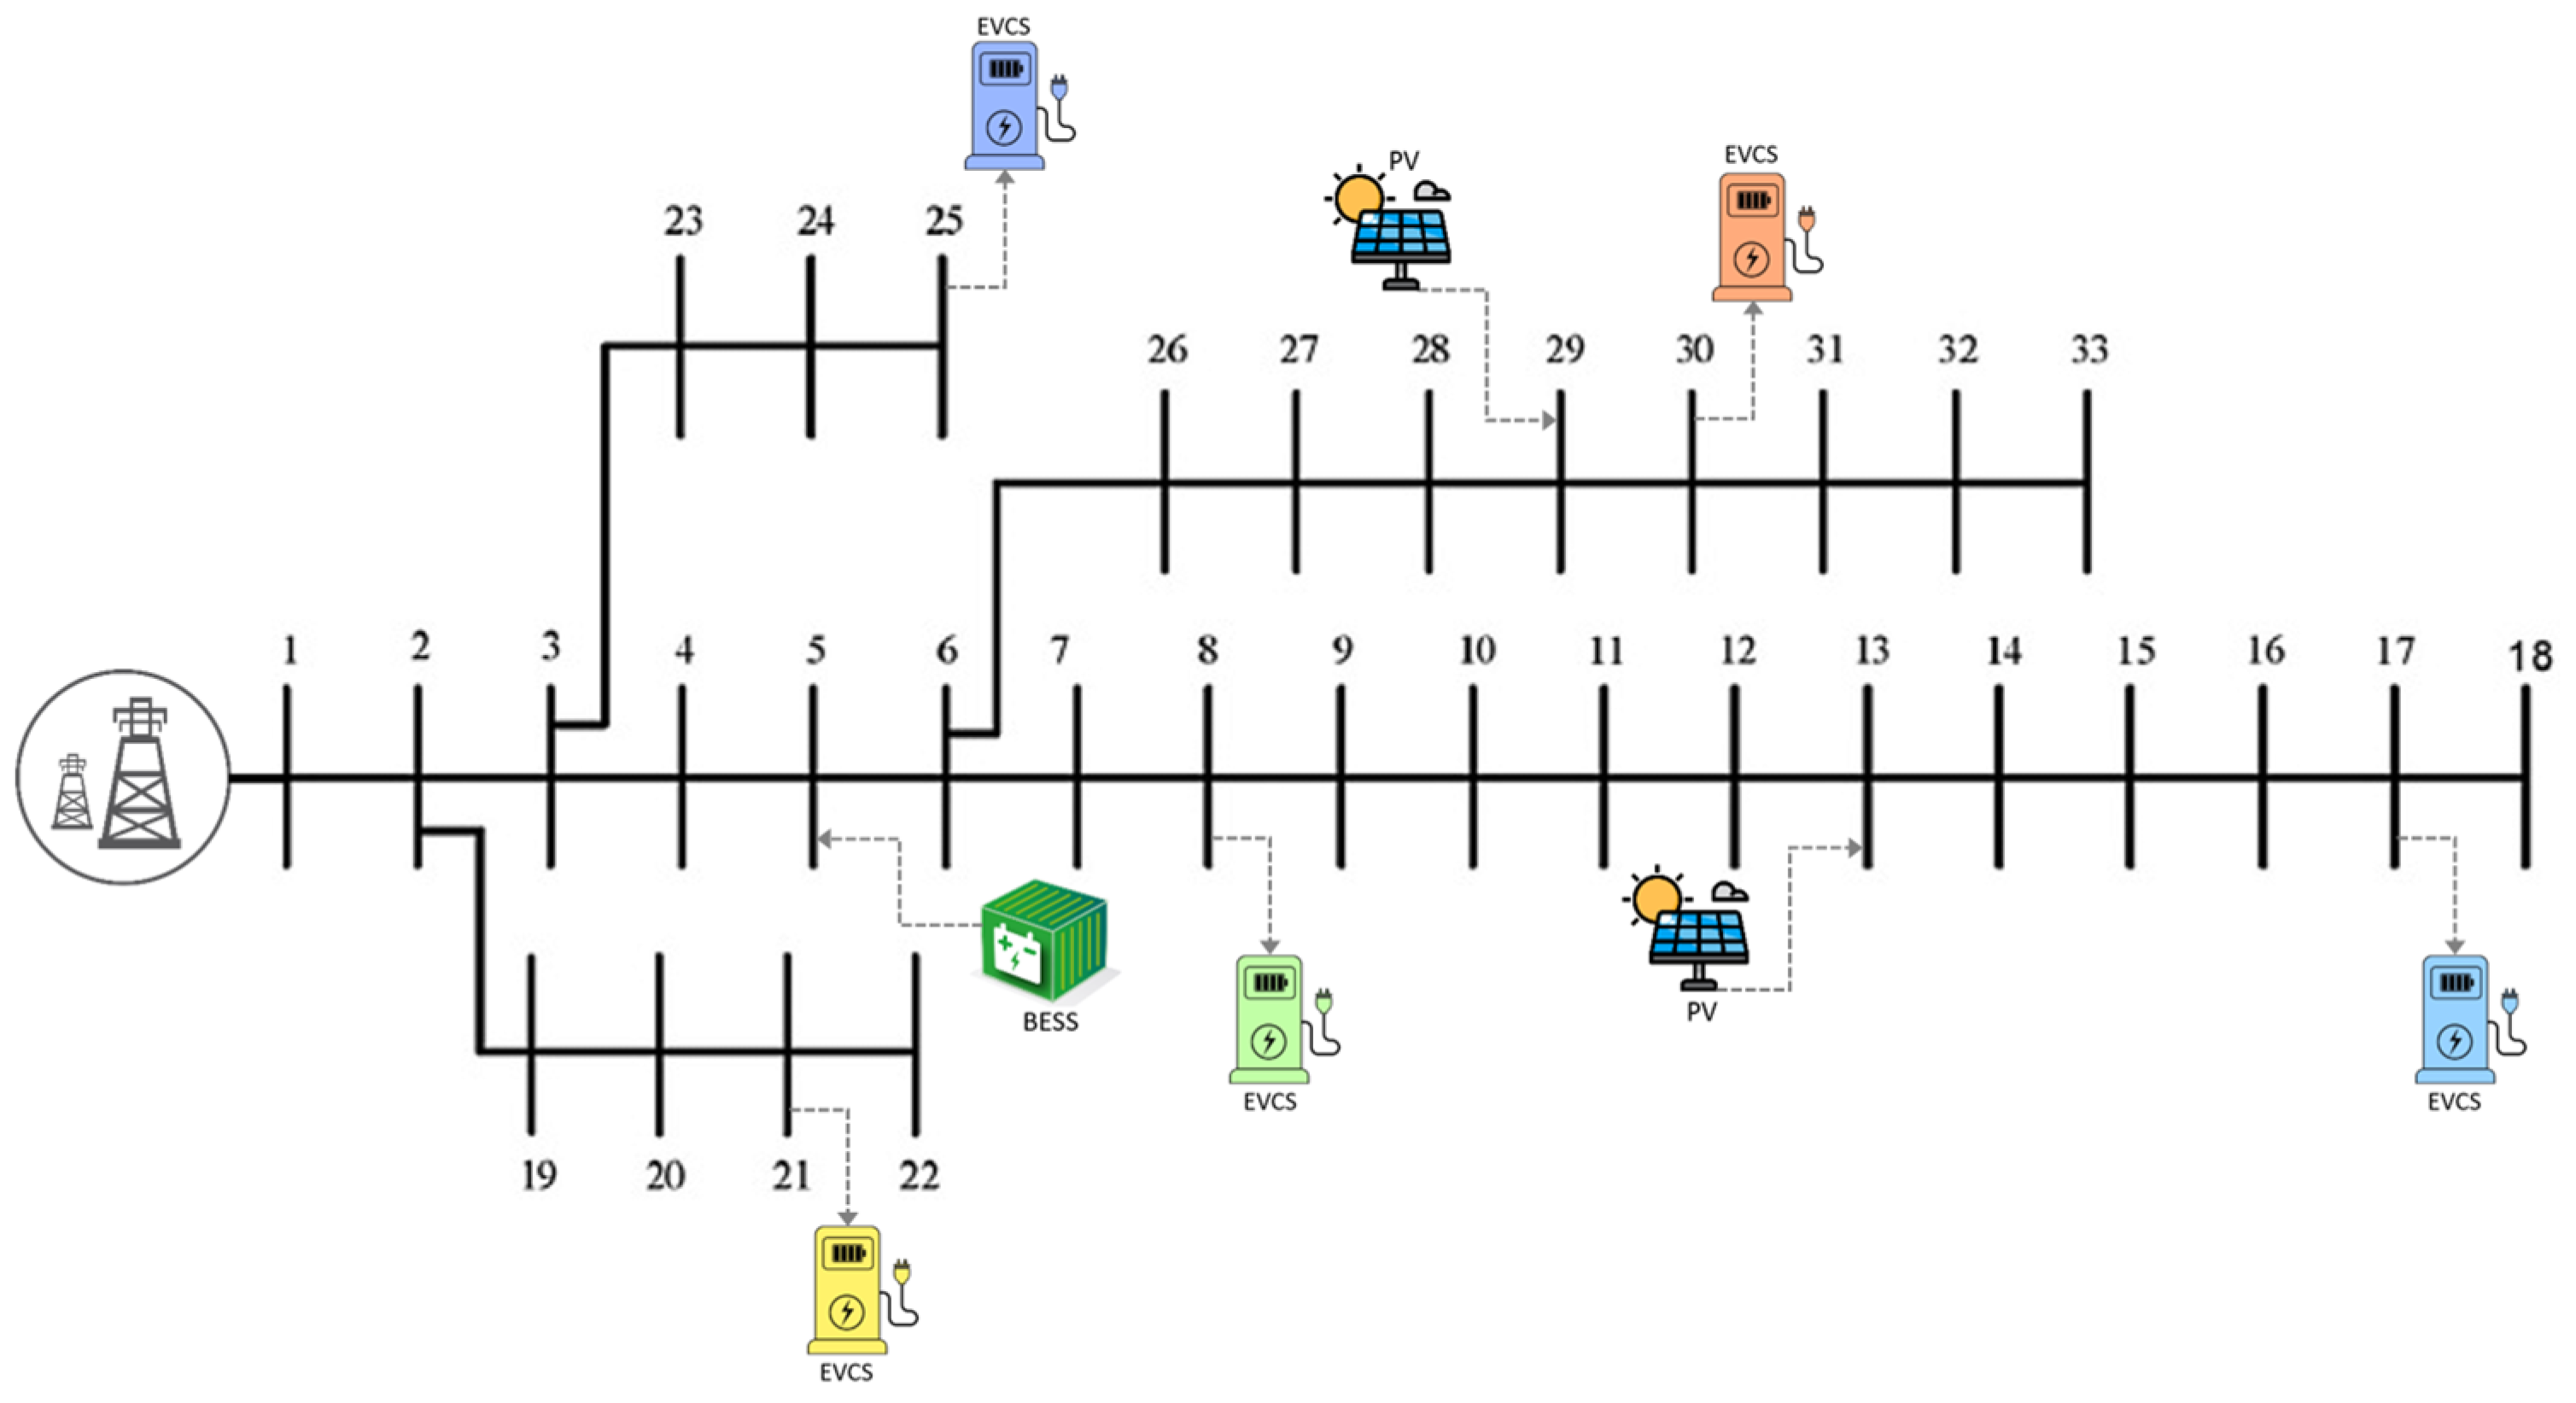
| Electric Vehicle Charging Station at 200 kW in IEEE 33 Bus | Photovoltaic and Battery Energy Storage System | ||||||
|---|---|---|---|---|---|---|---|
| Zone (Bus to Bus) | Location of EVCS | Voltage avg. (p.u.) | P loss min. (kW) | Location of PV | Size of PV (kWp) | Location of BESS | Size of BESS (kWh) |
| Base case | – | 0.9448 | 301.9726 | – | – | – | – |
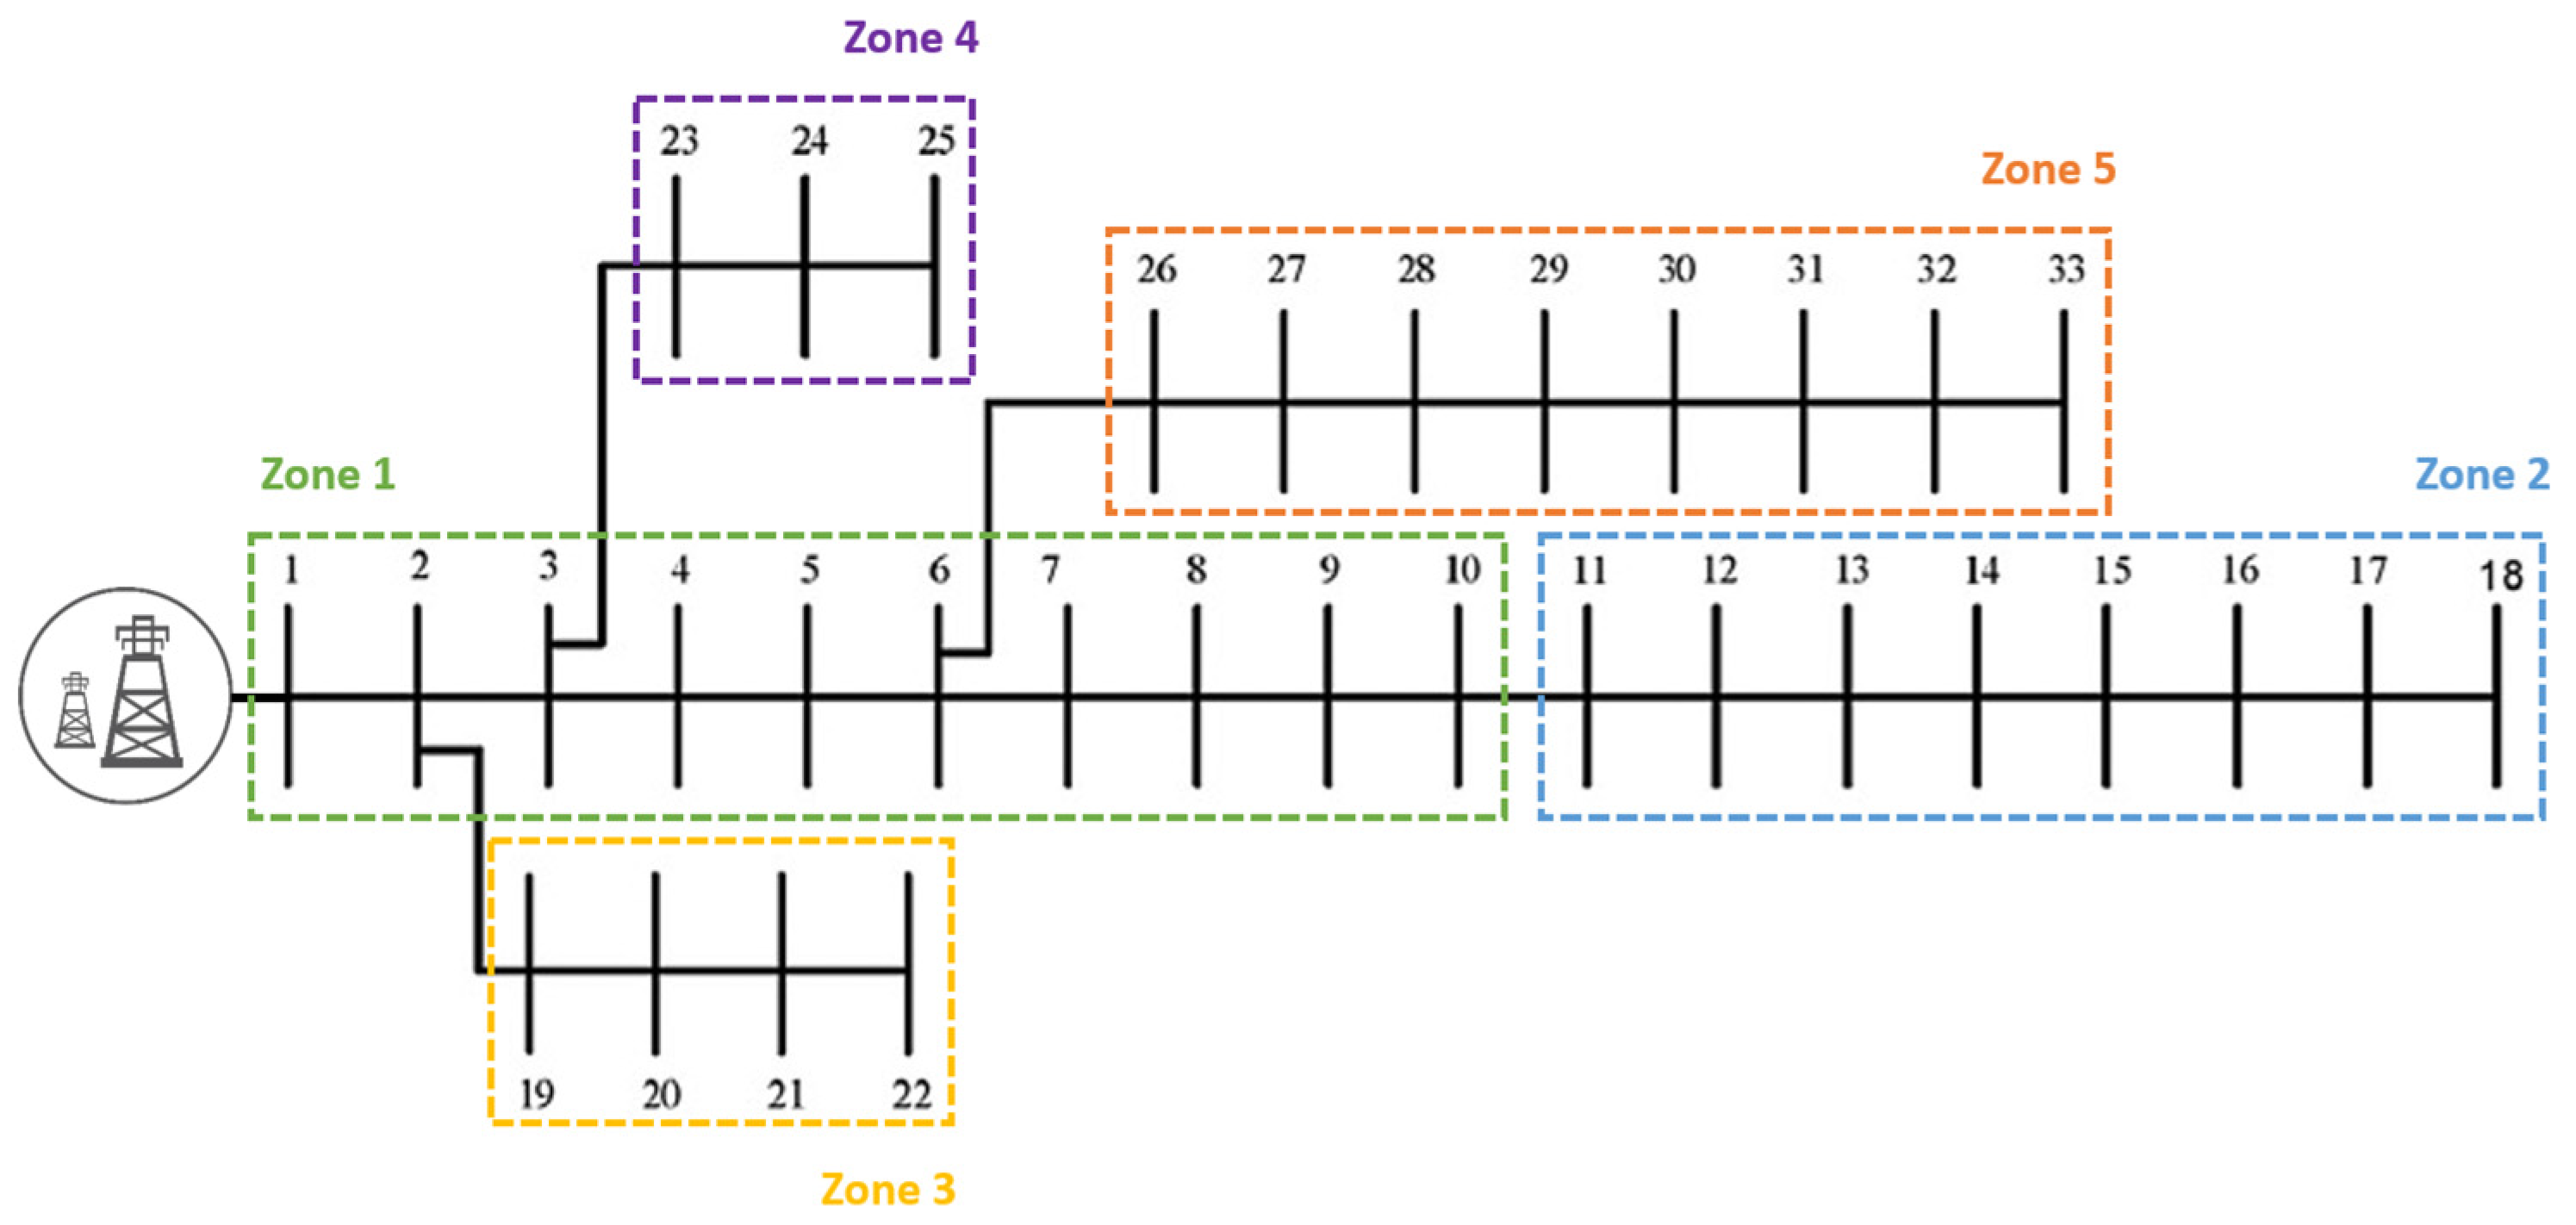
| 1 (2 to 10) | 8 | 0.9467 | 203.3872 | 13 | 692.3567 | 5 | 81.9386 |
| 2 (11 to 18) | 17 | 0.9994 | 210.1145 | 29 | 295.2508 | 5 | 45.6643 |
| 3 (19 to 22) | 21 | 0.9453 | 203.9012 | 13 | 646.2517 | 5 | 74.2527 |
| 4 (23 to 25) | 25 | 0.9476 | 206.0026 | 13 | 658.7533 | 5 | 76.6890 |
| 5 (26 to 33) | 30 | 0.9461 | 203.8362 | 29 | 453.1764 | 5 | 83.1685 |
| Remark: Type of Run EVCS (at Zone), PV and BESS (2-33 Bus) | |||||||
Disclaimer/Publisher’s Note: The statements, opinions and data contained in all publications are solely those of the individual author(s) and contributor(s) and not of MDPI and/or the editor(s). MDPI and/or the editor(s) disclaim responsibility for any injury to people or property resulting from any ideas, methods, instructions or products referred to in the content. |
© 2023 by the authors. Licensee MDPI, Basel, Switzerland. This article is an open access article distributed under the terms and conditions of the Creative Commons Attribution (CC BY) license (https://creativecommons.org/licenses/by/4.0/).
Share and Cite
Deeum, S.; Charoenchan, T.; Janjamraj, N.; Romphochai, S.; Baum, S.; Ohgaki, H.; Mithulananthan, N.; Bhumkittipich, K. Optimal Placement of Electric Vehicle Charging Stations in an Active Distribution Grid with Photovoltaic and Battery Energy Storage System Integration. Energies 2023, 16, 7628. https://doi.org/10.3390/en16227628
Deeum S, Charoenchan T, Janjamraj N, Romphochai S, Baum S, Ohgaki H, Mithulananthan N, Bhumkittipich K. Optimal Placement of Electric Vehicle Charging Stations in an Active Distribution Grid with Photovoltaic and Battery Energy Storage System Integration. Energies. 2023; 16(22):7628. https://doi.org/10.3390/en16227628
Chicago/Turabian StyleDeeum, Saksit, Tossaporn Charoenchan, Natin Janjamraj, Sillawat Romphochai, Sergej Baum, Hideagi Ohgaki, Nadarajah Mithulananthan, and Krischonme Bhumkittipich. 2023. "Optimal Placement of Electric Vehicle Charging Stations in an Active Distribution Grid with Photovoltaic and Battery Energy Storage System Integration" Energies 16, no. 22: 7628. https://doi.org/10.3390/en16227628
APA StyleDeeum, S., Charoenchan, T., Janjamraj, N., Romphochai, S., Baum, S., Ohgaki, H., Mithulananthan, N., & Bhumkittipich, K. (2023). Optimal Placement of Electric Vehicle Charging Stations in an Active Distribution Grid with Photovoltaic and Battery Energy Storage System Integration. Energies, 16(22), 7628. https://doi.org/10.3390/en16227628