Article

Development of an Improved Decision Support Tool for Geothermal Site Selection in Nigeria Based on Comprehensive Criteria

Centre for Environment and Sustainability, University of Surrey, Guildford GU2 7XH, UK
*
Author to whom correspondence should be addressed.
Energies 2023, 16(22), 7602; https://doi.org/10.3390/en16227602
Submission received: 14 July 2023 / Revised: 9 November 2023 / Accepted: 13 November 2023 / Published: 16 November 2023
(This article belongs to the Section H2: Geothermal)

Abstract

:
Geothermal resource assessment is crucial for the rural electrification of Nigeria. A comprehensive set of criteria was used to appraise promising geothermal sites in Nigeria. The evaluation of the sites was performed using the multi-criteria decision analysis (MCDA) method and taking into account evidence of a wide range of criteria from a set of geological, geophysical, well log, environmental, remote sensing, and geochemical datasets to appraise promising geothermal sites and to add to the current debate on the needed criteria for geothermal development. To gather relevant data, various sources such as bottom-hole temperature (BHT) data from different boreholes and oil and gas wells, aeromagnetic maps, reduced-to-the-pole, magnetic, heat flow, seismic, and geothermal gradient data from aerogravity maps, Bouguer anomaly maps, earthquake epicenter maps, satellite images, and geological maps were obtained from the literature. A case study of the thirty-six states of Nigeria, including the federal capital territory, Abuja (FCT), was conducted to illustrate how these criteria would reveal the technical aspect of the geothermal energy situation. A model was developed to show that the application of a wide range of criteria to the six datasets identified and analyzed in this study reveals that the datasets complement each other and should not be used independently. It can be found from the overall suitability map that more than 20% of the study area is suitable for geothermal energy development. It can also be observed from the map that some of the promising sites in Nigeria may include but are not limited to Bauchi, FCT, Taraba, Ebonyi, Adamawa, Oyo, and Nasarawa states in Nigeria. The opportunities for the further application of the approach are discussed, including the use of the model to help policymakers decide where to invest in the future.

1. Introduction

Geothermal energy has been lauded as one of the effective, dependable, clean, and sustainable renewable energy sources in the world, and is expected to become an increasingly significant source of energy in the future [1,2]. As such, nations around the world have started seeking effective ways to address the selection issues that have impeded the development of geothermal energy [3,4]. Identifying areas that may offer significant geothermal resources, and thus justifying investment in field surveys, is complex as no one measure can provide the needed evidence. Multiple criteria can each add some evidence by providing a structured approach to weigh and evaluate these different standards and criteria, often by employing mathematical models, decision matrices, or other ranking methods to arrive at the best possible choice and help judge the potential geothermal source. The selection of appropriate criteria for geothermal site selection is now recognized as a crucial issue, attracting international interest [5]. Many scientists believe that most of the site selection issues for geothermal studies in most parts of the world in the last few decades have been related to the selection of the needed criteria [6,7].
The variety of criteria can be conveniently grouped or clustered, mainly by their technique or technology to aid geothermal site selection. The criteria that are clustered based on their techniques have been tested on potential sites to illustrate their potential impacts, such as in the United States, Iceland, the Philippines, and Kenya [8]. A well-defined set of criteria could help reveal the geothermal energy situation and performance of a particular site or location. However, more broadly an improved approach to resource assessment could help advance the development of geothermal energy globally. Therefore, an MCDA approach is developed in this study to help organize, visualize, and analyze different layers of data from a wide range of criteria, by creating maps and scenes.
The majority of the world’s largest users of geothermal energy (e.g., the United States, Iceland, and the Philippines) have applied geophysical, geological, and geochemical datasets in selecting the sites suitable for geothermal analysis [9,10]. Other datasets have been used in some parts of the world to identify suitable sites for geothermal explorations. For example, in Italy, ref. [11] highlighted the environmental dataset as an evidence dataset for predicting the geothermal suitability of power plants. The authors of ref. [12] adopted geological and geochemical datasets to evaluate the groundwater system to properly delineate geothermal potentials in Tunisia. The authors of ref. [13] adopted a surface geochemical and geophysical dataset to reveal three spatial criteria needed for geothermal studies in the southern rift zone of Tenerife, Canary Islands, Spain. For Iran ref. [14] proposed the use of geological, geochemistry, and geophysical datasets with their associated criteria for geothermal site selections. In ref. [15], the authors combined geological, geophysical, and geochemical datasets in Sicily to organize and integrate subsurface data to establish a modelling framework for geothermal studies. The authors of ref. [16] adopted geological, geochemical, and geophysical datasets to design a detailed geological map to cover west-central to eastern Nevada. Another study [17] adopted remote sensing, well logs, and geophysical datasets for the evaluation of geothermal energy resources in Egypt. The author of ref. [18] adopted remote sensing, geological, geochemical, geophysical, and environmental baseline surveys to analyze the geothermal well suitability of the Eburru geothermal field in Kenya, by integrating surface exploration datasets.
Efforts have been made to streamline the criteria needed for geothermal site selection studies [19]. Some of them have been undertaken on various projects with the sole aim of identifying the needed criteria for geothermal site selections [20,21]. The majority of the works in the literature are based on geophysical, geochemical, environmental, reservoir, and geological datasets with few criteria used and as such were not sufficient for this study [22,23,24]. In ref. [25], the authors stated that local permeability and heat flow had been collectively used to ascertain the most suitable regions for geothermal fluid flow. The authors of ref. [26] selected twenty-nine layers in five stacked layers during ThermoGIS calculations in the Netherlands to pinpoint areas with high geothermal energy. The author of ref. [27] listed ten evident layers of criteria to spot regions with high geothermal energy in British Columbia, which hosts Canada’s best geothermal resources. Meanwhile, other authors have opted for geothermal indicators, such as positive, warning, negative, points, and weights, to assign specific criteria to select the sites suitable for geothermal analysis [28]. A few others have grouped criteria into three datasets regardless of their occurrences, such as geological and hydrogeological conditions, technology for using this energy, and economic conditions to pinpoint areas needed for geothermal energy extraction [29,30]. Their classifications varied with time while the criteria remained unchanged, making them difficult to fully understand. Some studies have specifically focused on Nigeria. For example, ref. [14] adopted five thematic layers in northern Nigeria comprising heat flow, temperature gradient, integrated lineaments, residual gradients, and lithological maps to suggest suitable sites for geothermal site selection. The authors of ref. [31] assumed three magnetic layers in trying to estimate the bottom of the Wikki Warm Spring region in South-Eastern Nigeria. Meanwhile, ref. [32] only evaluated three criteria, namely geothermal gradients, Curie point depths, and near-surface heat, to analyze the Sokoto basin in Nigeria.
The effectiveness of the integration of criteria in the field of spatial mapping to select suitable sites for geothermal studies has been proven in several studies. The authors of ref. [33] stated that the criteria collected in a given region can be integrated to select the most suitable area for siting geothermal wells. The authors of ref. [34] also revealed the importance of combining several criteria to analyze the spatial distribution and identification of the most suitable regions for geothermal heat extraction. In ref. [35], the authors reflected on the integration of a set of input criteria with a function, consequently yielding a potential map. The authors of ref. [36] carried out the integration of criteria for regional-scale geothermal energy mapping.
Several studies in the literature have employed MCDA methods to evaluate the suitability of potential geothermal sites. The authors of ref. [37] analyzed the suitability of 21 provinces for geothermal project implementation in Afghanistan using MCDA. In ref. [12], the authors employed MCDA to carry out spatial assessment of potential geothermal areas, gaining a better understanding of groundwater suitability for supporting the development of geothermal energy projects. The authors of ref. [38] carried out an assessment of the suitability of the chosen criteria in the decision-making process to enhance geothermal projects using multi-criteria decision making. In ref. [39], the authors stated that MCDA can assist decision makers in identifying appropriate areas for geothermal studies. In ref. [40], the author applied sources to a multi-criteria decision analysis model to produce an output model that can assist geothermal scientists in locating areas suitable for geothermal exploration.
There have been a few studies on the possible applications of geothermal energy in Nigeria. The authors of ref. [41] reported that the thermal springs in the Akiri hot spring region are probably caused by volcanic and intrusive activities that originate mainly from the mantle in the Middle Benue Trough, leading to a heating effect. In ref. [42], the authors explored the potential of geothermal resources and stated their utilization could be used for commercial electricity generation giving rise to sustainable energy planning toward 100% electrification of Nigeria by 2030. The authors of ref. [43] stated that the two volcanic points, i.e., Biu plateau and Pindiga, represented a shallow depth of the mantle and could provide (if exploited) an enormous amount of energy for the generation of electricity while the other point (Wikki warm springs) could provide an enormous amount of water for heating and other domestic purposes. In ref. [44], the authors examined various pieces of research aimed at establishing the needed information for stakeholders for the proper assessment of geothermal energy resources in Nigeria for electricity generation. The authors of ref. [45] reflected on the importance of geothermal resources and how the resources, if tapped, would address the electricity issues of Nigeria. The author of ref. [46] highlighted the importance of the usage of geothermal energy and how it would address the electricity issues, if embarked upon, in Nigeria, but ended up emphasizing why the absence of a geothermal database and geothermal energy policies mitigate against the development of geothermal energy in Nigeria. In ref. [43], the authors stated that the wide range of geological formations in the North East region of Nigeria could help in locating geothermal reservoirs in the country. The author of ref. [47] advised the federal government and state government of Nigeria on the need to embark on the exploration of geothermal energy as a way of addressing the electricity issues in the country and which could boost the economy if explored.
The absence of global agreed-upon standards in selecting criteria suitable for geothermal site selection studies, including flawed site selection models and procedures, along with a lack of proper studies on Nigeria’s geothermal potential is a key issue affecting geothermal development in the country.
The purpose of this study is to address the need for a new energy resource due to the rising population growth that has seen both domestic consumption and production increase rapidly since 1960 and which are strongly dependent on traditional thermal energy sources of electricity with a small fraction produced by hydropower. Nigeria’s electricity consumption is predicted to increase in the future by about 17% per year. Hence, the objective of this study is to develop and present an improved approach that makes use of a wider range of criteria, by grouping them into a set of geological, geophysical, well, environmental, remote sensing, and geochemical datasets, to provide a consistent framework within which all of the techniques used in analyzing geothermal potential can be integrated and used to reveal the geothermal energy situation of a particular location. This model is intended to make geothermal site selection more reliable. The proposed methodology has numerous advantages such as the consideration of comprehensive criteria, transparency in assessing the suitability of potential sites, and informed decision making. In recent years, MCDA has been applied as a decision support tool for geothermal site selection. The authors of ref. [48] adopted MCDA as a support tool for the accurate determination of potential geothermal locations. Their study identified five contributing criteria relevant to geothermal resources in northeastern China’s Changbai mountain region. The criteria were used to generate five grid maps. After mapping the criteria, the weights were determined. They finally revealed that the sites revealed regions with extremely high geothermal potential and regions with very high geothermal potential. The authors of ref. [39] proposed the use of a decision-making apparatus to account for multiple criteria and stakeholders’ objectives in decision making. Given this advantage, ref. [49] further stated that MCDA has become increasingly popular in energy project planning for analyzing several criteria during the evaluation processes. The authors of ref. [50] proposed using a multi-criteria decision analysis model to produce an output that could assist geothermal scientists in locating suitable areas for geothermal energy exploration. The author of ref. [51] revealed that the multi-criteria decision analysis (MCDA) technique provides the analytical support tools for geothermal prosperity mapping. The tools involve the use of geographical data, weights, and an MCDA aggregation function to combine spatial data and weights of criteria to evaluate locations. They further stated that MCDA provides a rich collection of procedures for evaluating the geothermal potential of regions.
Concerning other hybrid combinations and improved models for geothermal energy systems, ref. [52] applied multi-criteria analysis to develop a novel cogeneration system using geothermal and natural gas dual sources to respond to thermodynamic effectiveness.
The author of ref. [49] proposed a decision-making tool and provided a sustainable pathway for sizing parameters selection and sustainable geothermal utilization. The authors of ref. [53] proposed an efficient model to estimate the thermal dissipation of fluids and select operating parameters for borehole heat exchangers at 11 sites under multi-operation conditions.
To address the identified gaps in geothermal energy site selection studies a comprehensive approach to the MCDA procedure is developed in this study.
The most important innovation of this study is the consideration of comprehensive criteria to determine potential sites for geothermal energy resources. This study marks the first instance in which comprehensive criteria have been reviewed by considering remote sensing, geological, geophysical, well log, environmental baseline, and geochemical datasets and presenting them all in one piece to appraise potential sites for geothermal energy exploration in Nigeria. This is the first assessment of the suitability of geothermal energy for different sites in Nigeria.
This paper applies the developed approach to the states of Nigeria and the federal capital territory of Nigeria as a case study. The remaining part of the article is organized as follows: Section two introduces the study area, Section three outlines the techniques used, Section four presents the specific findings, and Section five discusses the results and draws conclusions.

2. Study Area

The topography of Nigeria varies from gentle terrains to steep mountains sloping gradually to the coastal zones and it is also bounded on both sides by rugged mountainous terrains acting as major watersheds [54]. The study area also has varieties of alluvial shapes during rainy and dry seasons [55]. Nigeria is drained by two major rivers, namely: the Benue River and the Niger River. The Niger River is the largest river in Nigeria, and it emanates from the Guinea highlands in Guinea [56]. The main tributaries of the study region contribute to erosional processes in the selected zones. The southern part of Nigeria experiences a tropical monsoon climate, while the central regions have a tropical savannah climate. In contrast, the northern parts of the country have a Sahelian and semi-arid climate, where the rainy seasons bring significantly more rainfall than the dry seasons [57]. In addition, the mean annual precipitation of Nigeria is 1165.0 mm which normally spans from April to October, referred to as the rainy season, while minimal rainfall also occurs from November to March and this period is referred to as the dry season. The active fault in the study region creates discharging conduits thereby allowing the flow of hot water from the ascending depths. The geological characteristics of the study area differ tectonically and it is also part of the Precambrian basin. The lithological units also differ, from the Precambrian basin to the Quaternary deposits [58]. The region also contains Paleozoic rock units, and the stratigraphy of the region is formed of Precambrian craterous sandstones [59]. Finally, faults and fractures in Nigeria play significant roles in the formation of hot springs. These springs are spatially distributed within the zones [60]. Hence, geothermal energy could be an option for the rural electrification of Nigeria because the rift axis of Nigeria suggests that the tectonic plate boundaries which stretch across West Africa, including parts of Nigeria, create a geothermal resource base that can be used for electricity generation and because of the fact that the current energy system and energy access might not be sufficient to meet the growing demand for electricity generation sources in remote regions of Nigeria. Finally, before embarking on a discussion of the potential of geothermal energy in Nigeria, it is imperative to understand the current energy system of Nigeria.
Nigeria has recently embarked on Vision 2030, a blueprint strategy to transform the nation’s energy sector from a low-income to a middle-income sector by striving to achieve an economy with over 60% greenhouse gas emission reductions and to provide energy to 40% of the total population currently without access to affordable, reliable, and sustainable electricity [61,62]. Nigeria’s electricity demand currently peaks at only 12,522 MW of the total capacity, and it is predicted to have an annual growth rate of 10% in the coming years. This means that by the year 2030, the potential demand will rise to about 25,044 MW. With a generating capacity of 8000 MW, the nation has embarked on ambitious projects to provide energy security for low-, middle- and high-income earners to meet their demands. The International Renewable Energy Agency (IRENA) has revealed that crude oil and natural gas are the major determinants of the economy of Nigeria [63,64], and both depend on resource extraction [65,66]. In 2022, Nigeria generated 75.88 million dollars from the sale of some 2.2 million barrels of crude oil per day [67,68]. Also, because of the country’s ability to produce a sizable quantity of goods and services for West Africa and other sub-regions, its economy grew to become the largest in Africa in 2013 [69,70].
Crude oil, which is Nigeria’s major export, is concentrated in the country’s South South region [71,72]. Meanwhile, resources like tin, graphite, coal, etc., are distributed in other parts of the country and their activities would not be able to solve the nation’s epileptic power situation and high carbon dioxide emissions. While the government was enacting legislation to reduce bush burning and other resource use, for example, manufacturing firms were mandated to also assist in reducing their carbon prices by passing it on to consumers [73,74]. Agriculture is another viable sector in Nigeria. According to the 2021 census, the agricultural sector contributed 22.35% of the total gross domestic product of Nigeria, with over 70% of Nigerians engaging in agriculture, and this was not enough to solve the country’s energy problems. Coal, which is a viable fossil fuel, accounts for a significant amount of Nigeria’s energy utilization. Most of the coal has been used for electricity generation in the past and this was not enough to serve the majority of the populace [75,76]. A renewable energy source such as hydro, on the other hand, is used for electricity generation in Nigeria at a very high rate and is not affordable for middle and low-income earners [77,78]. The country’s energy strategy is now facing a paradigm shift from fossil fuels to renewable energy, including solar, wind, and geothermal energy, which have come into the limelight. According to government sources, “Geothermal energy resources might be key to the future energy generating systems in Nigeria”.

3. Materials and Methods
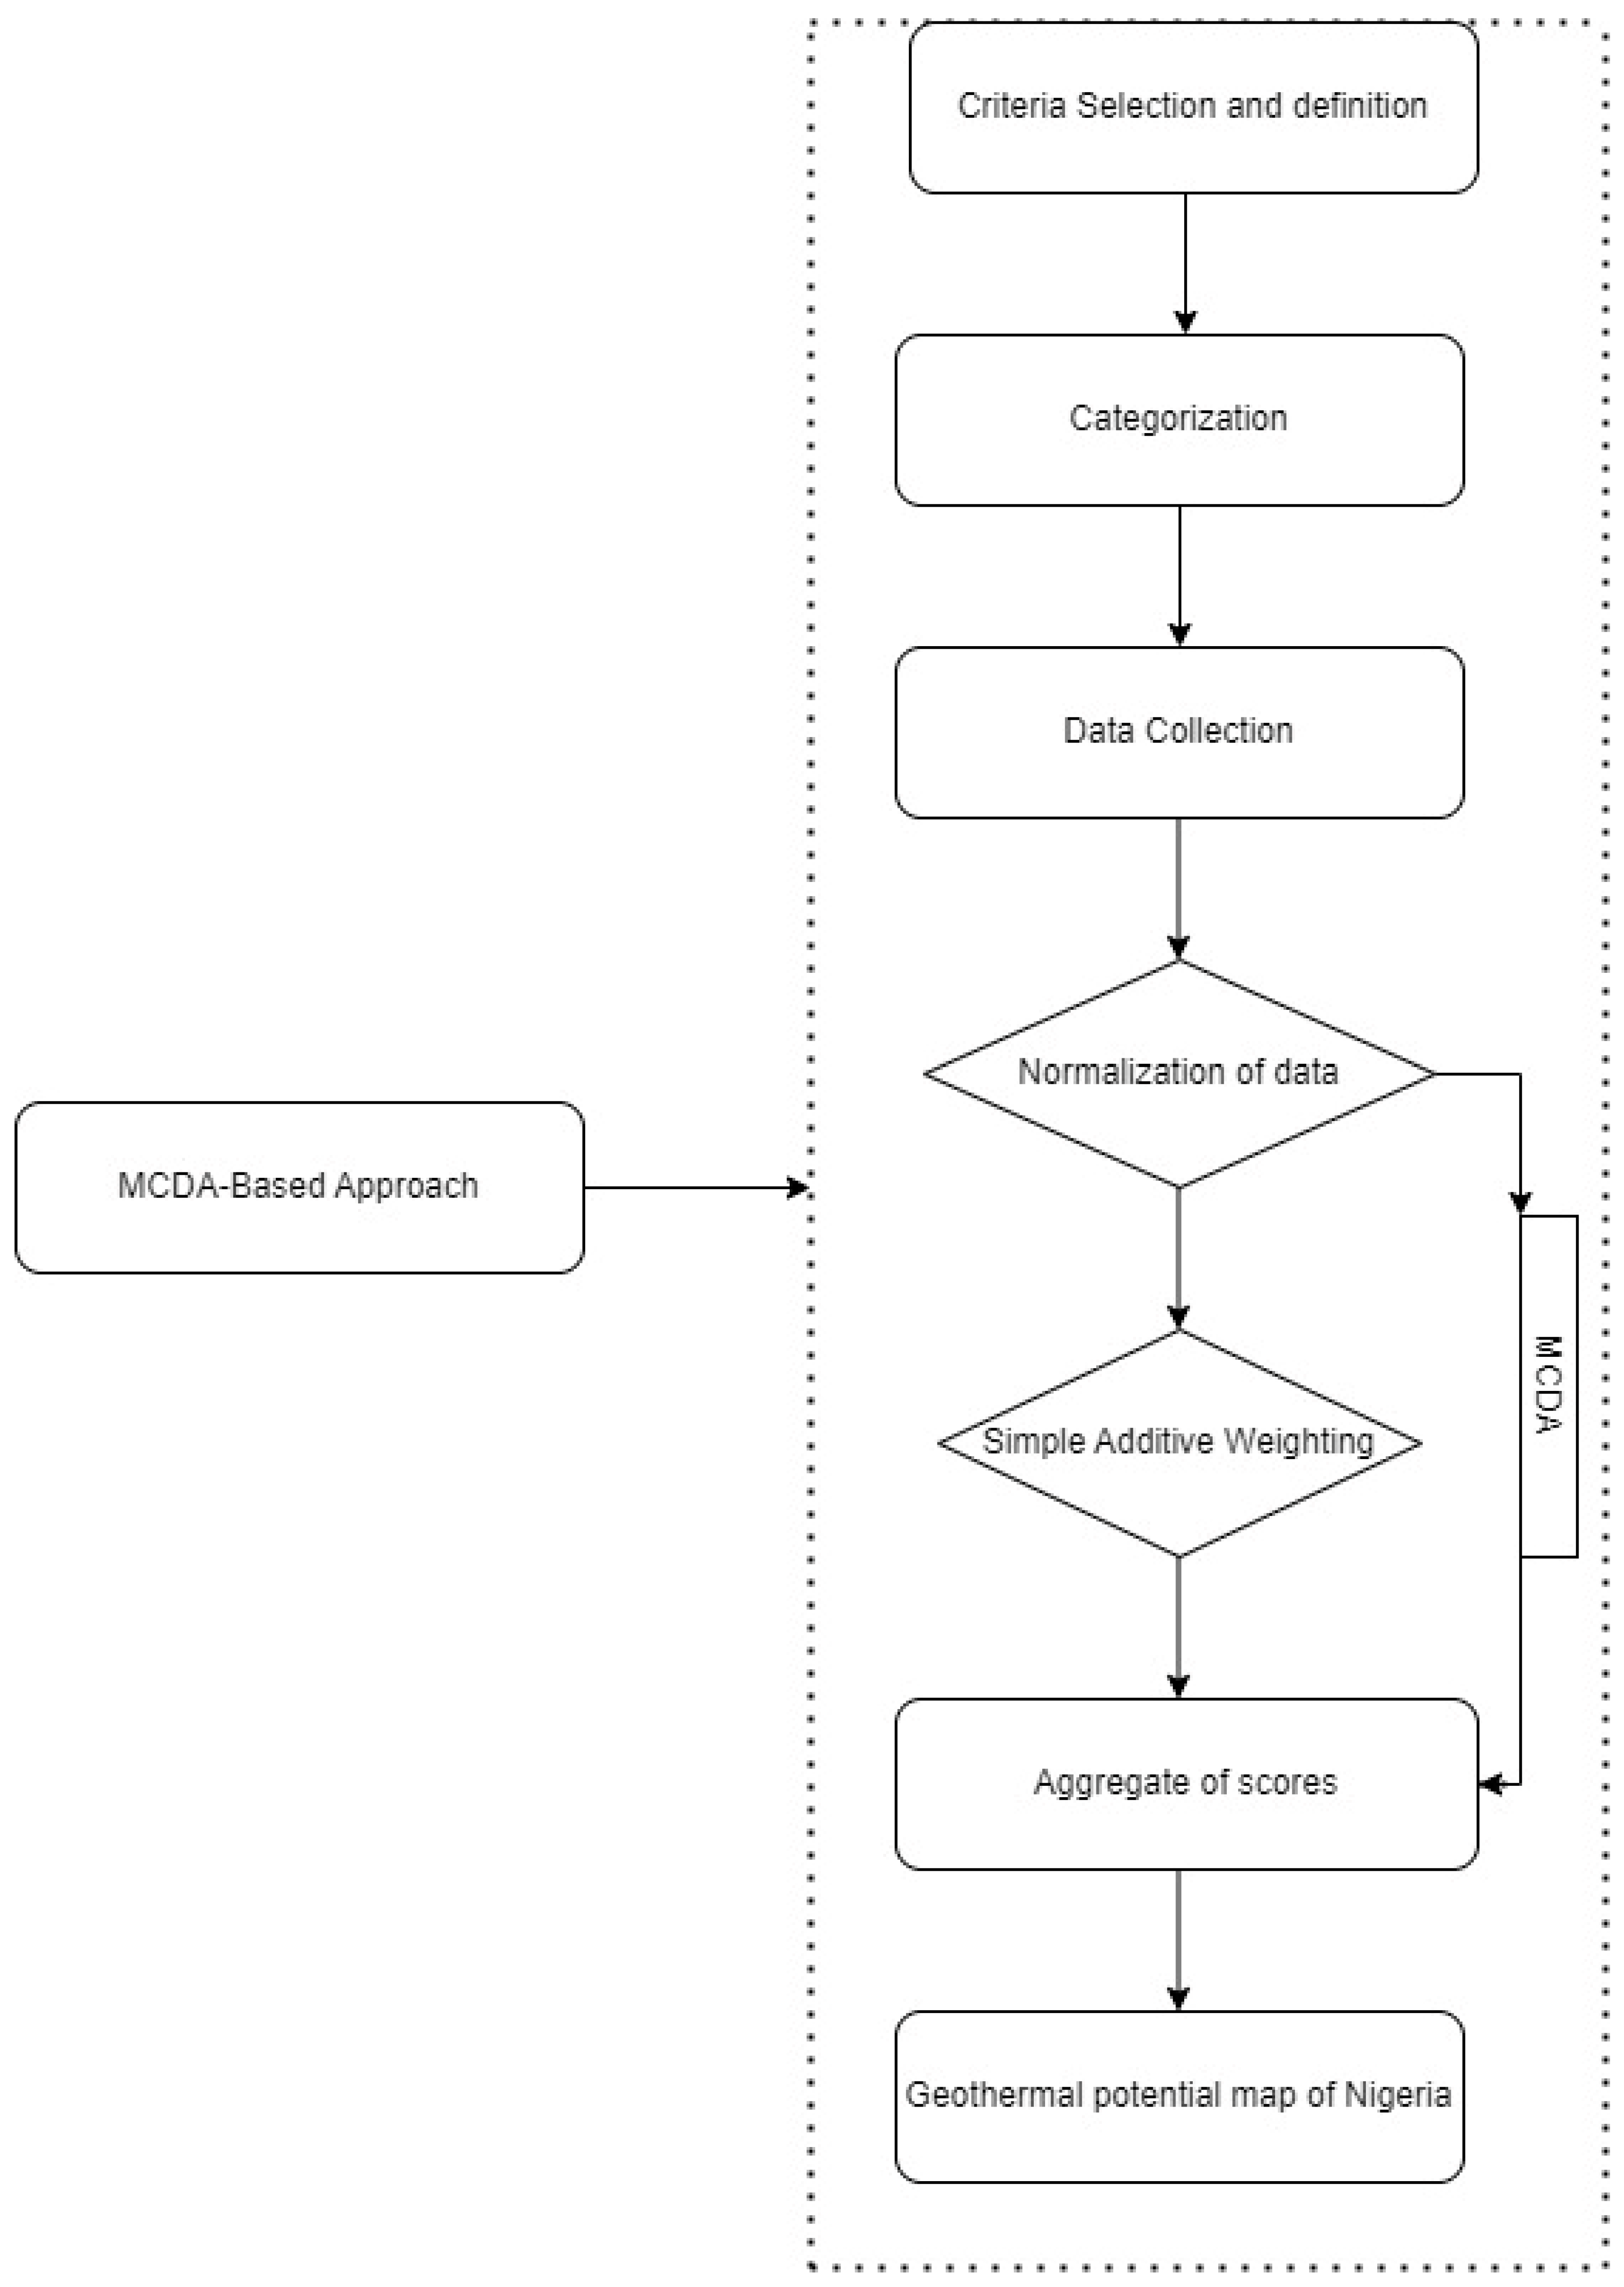
The stepwise research methodology is as follows.
Step 1: A literature review was conducted to gather a wide range of possible criteria: the criteria were grouped based on their respective techniques and the groups were linked into an overall framework.
Step 2: Each of the criteria was normalized before they could be integrated. The input criteria were transformed into a common scale using the linear scale transformation technique. This helps to eliminate any bias that may result from the use of different units of measurement or scales for each criterion.
Step 3: MCDA was adopted as the basis to combine the criteria, by applying equal weighting and using Excel for spatial visualization.

3.1. Framework

A modelling framework allows for a more comprehensive estimation of the geothermal potential of a site, which might lead to a successful and sustainable geothermal project. Without a modelling framework, important data may be overlooked, and the exploration process may be inefficient and less effective, resulting in a higher risk of failure or underperformance of the geothermal site. The modelling framework developed is shown in Figure 1.

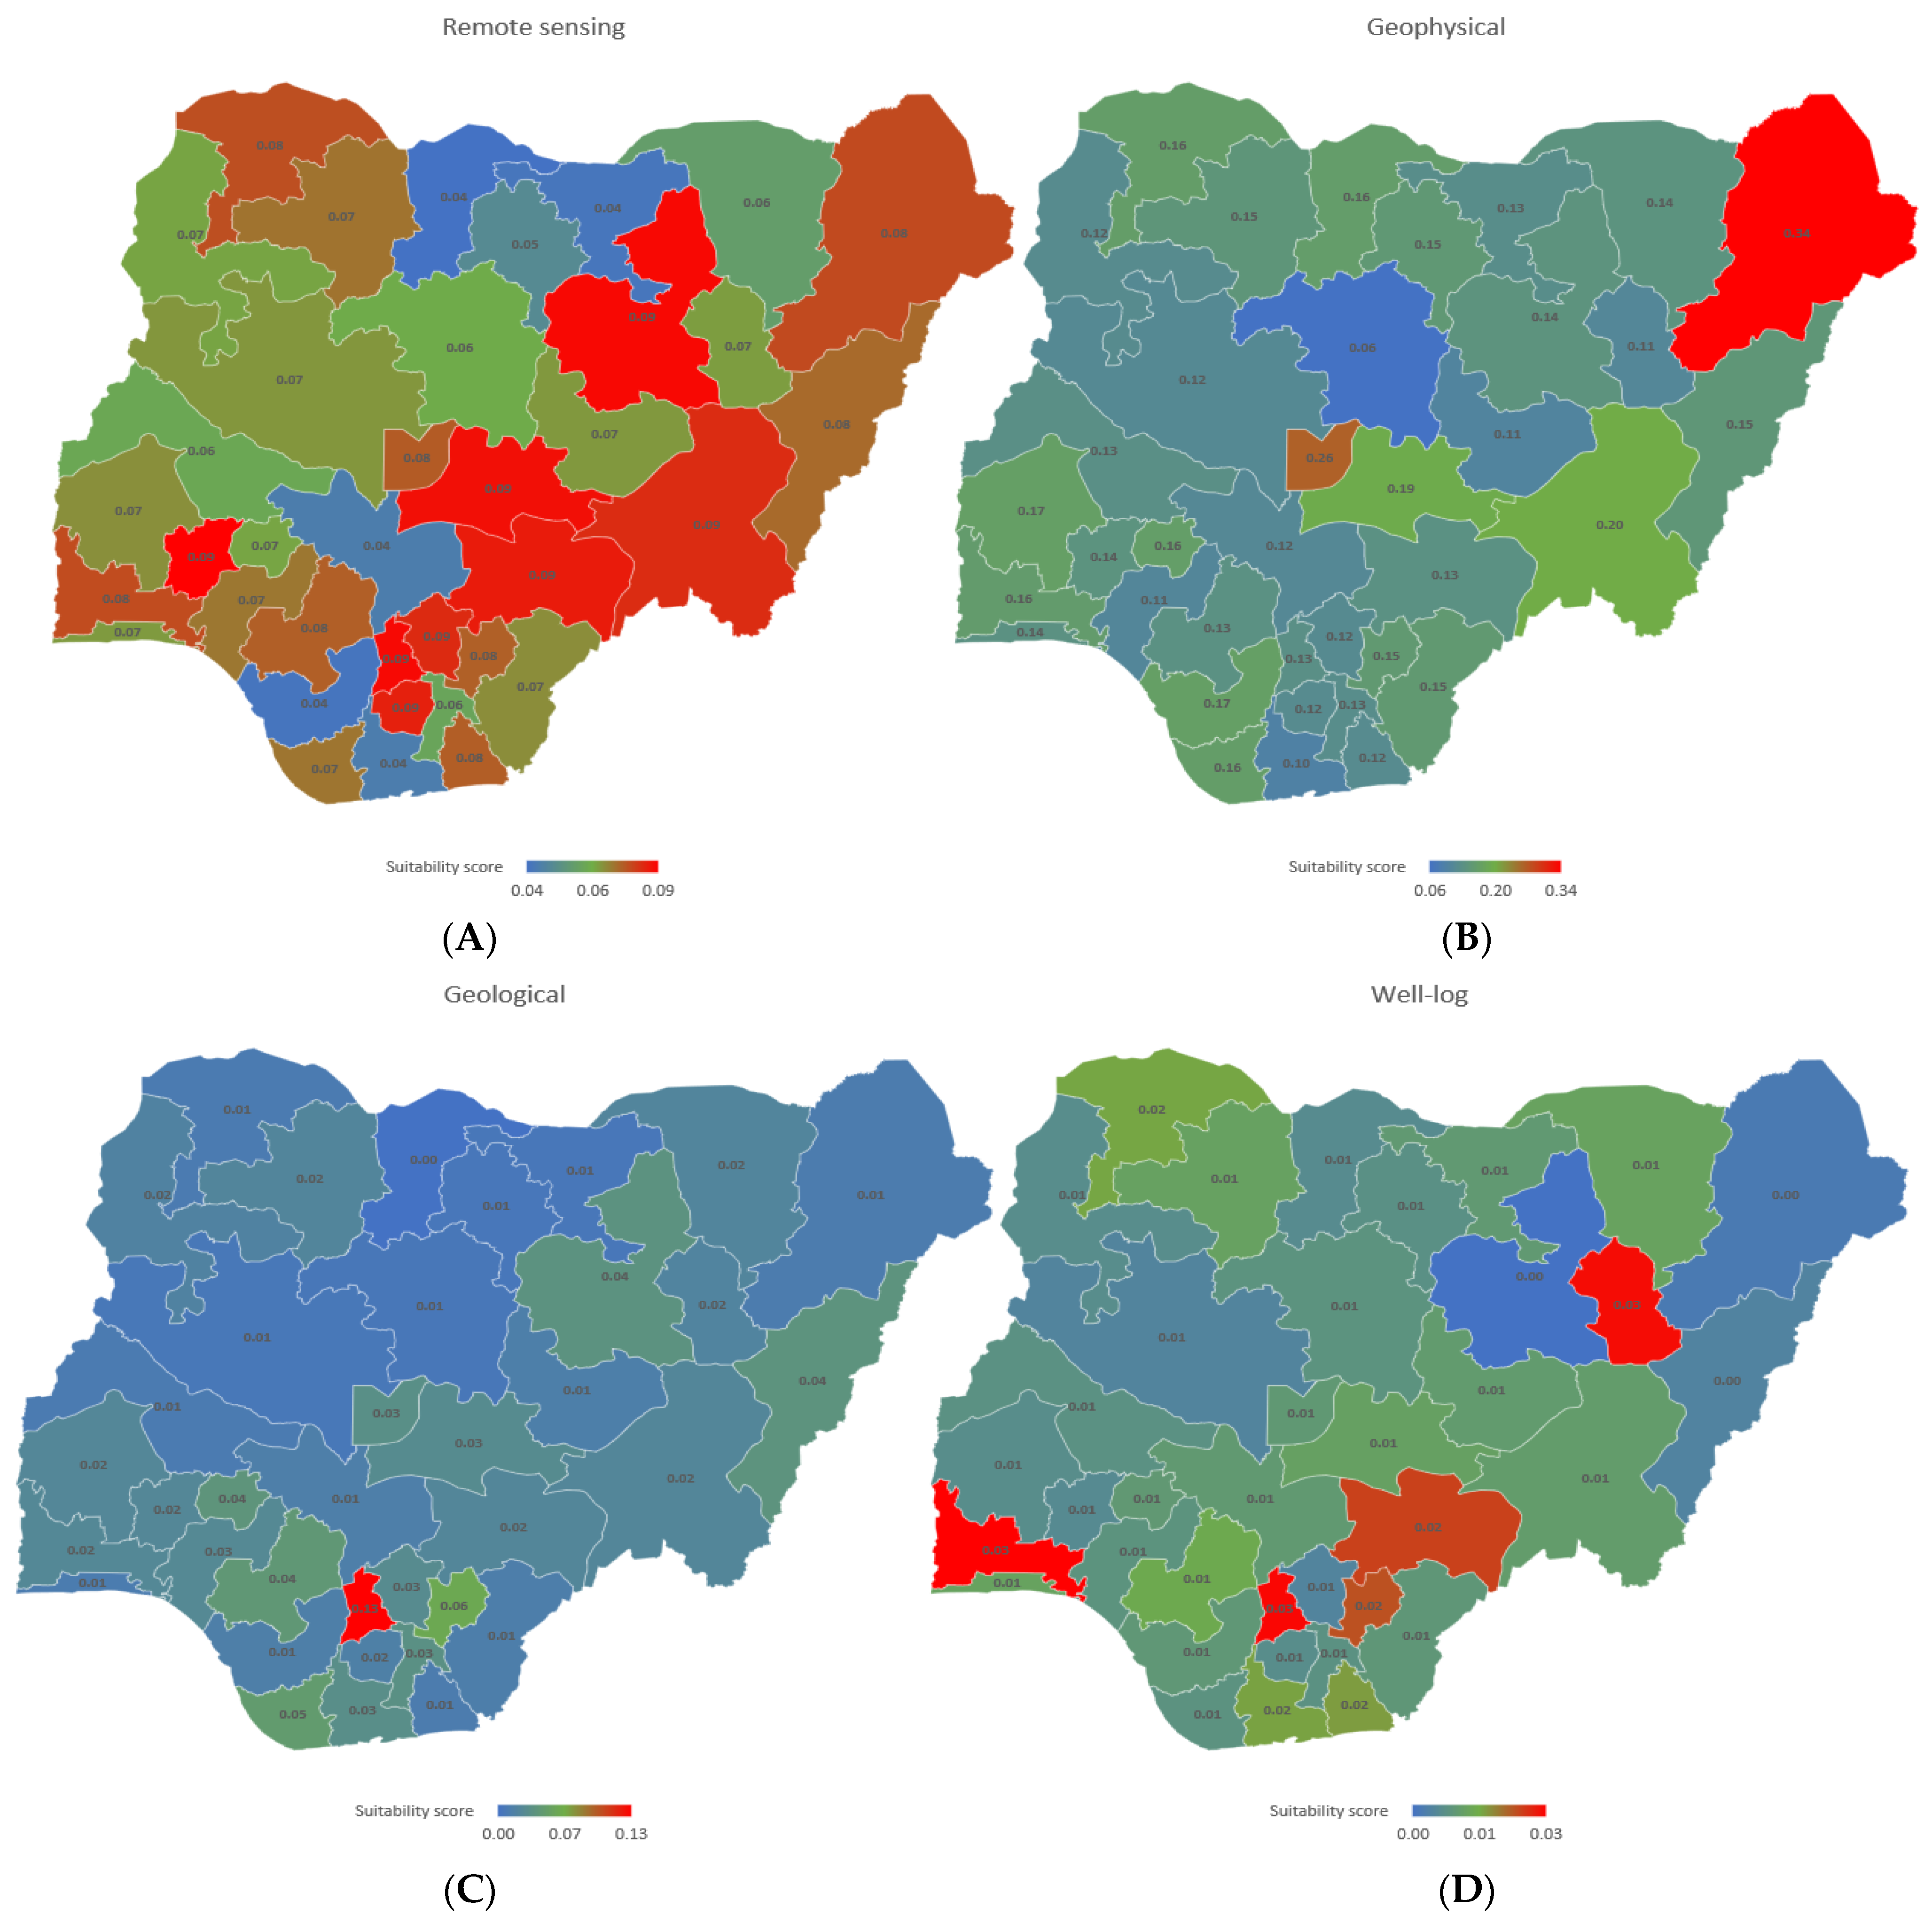
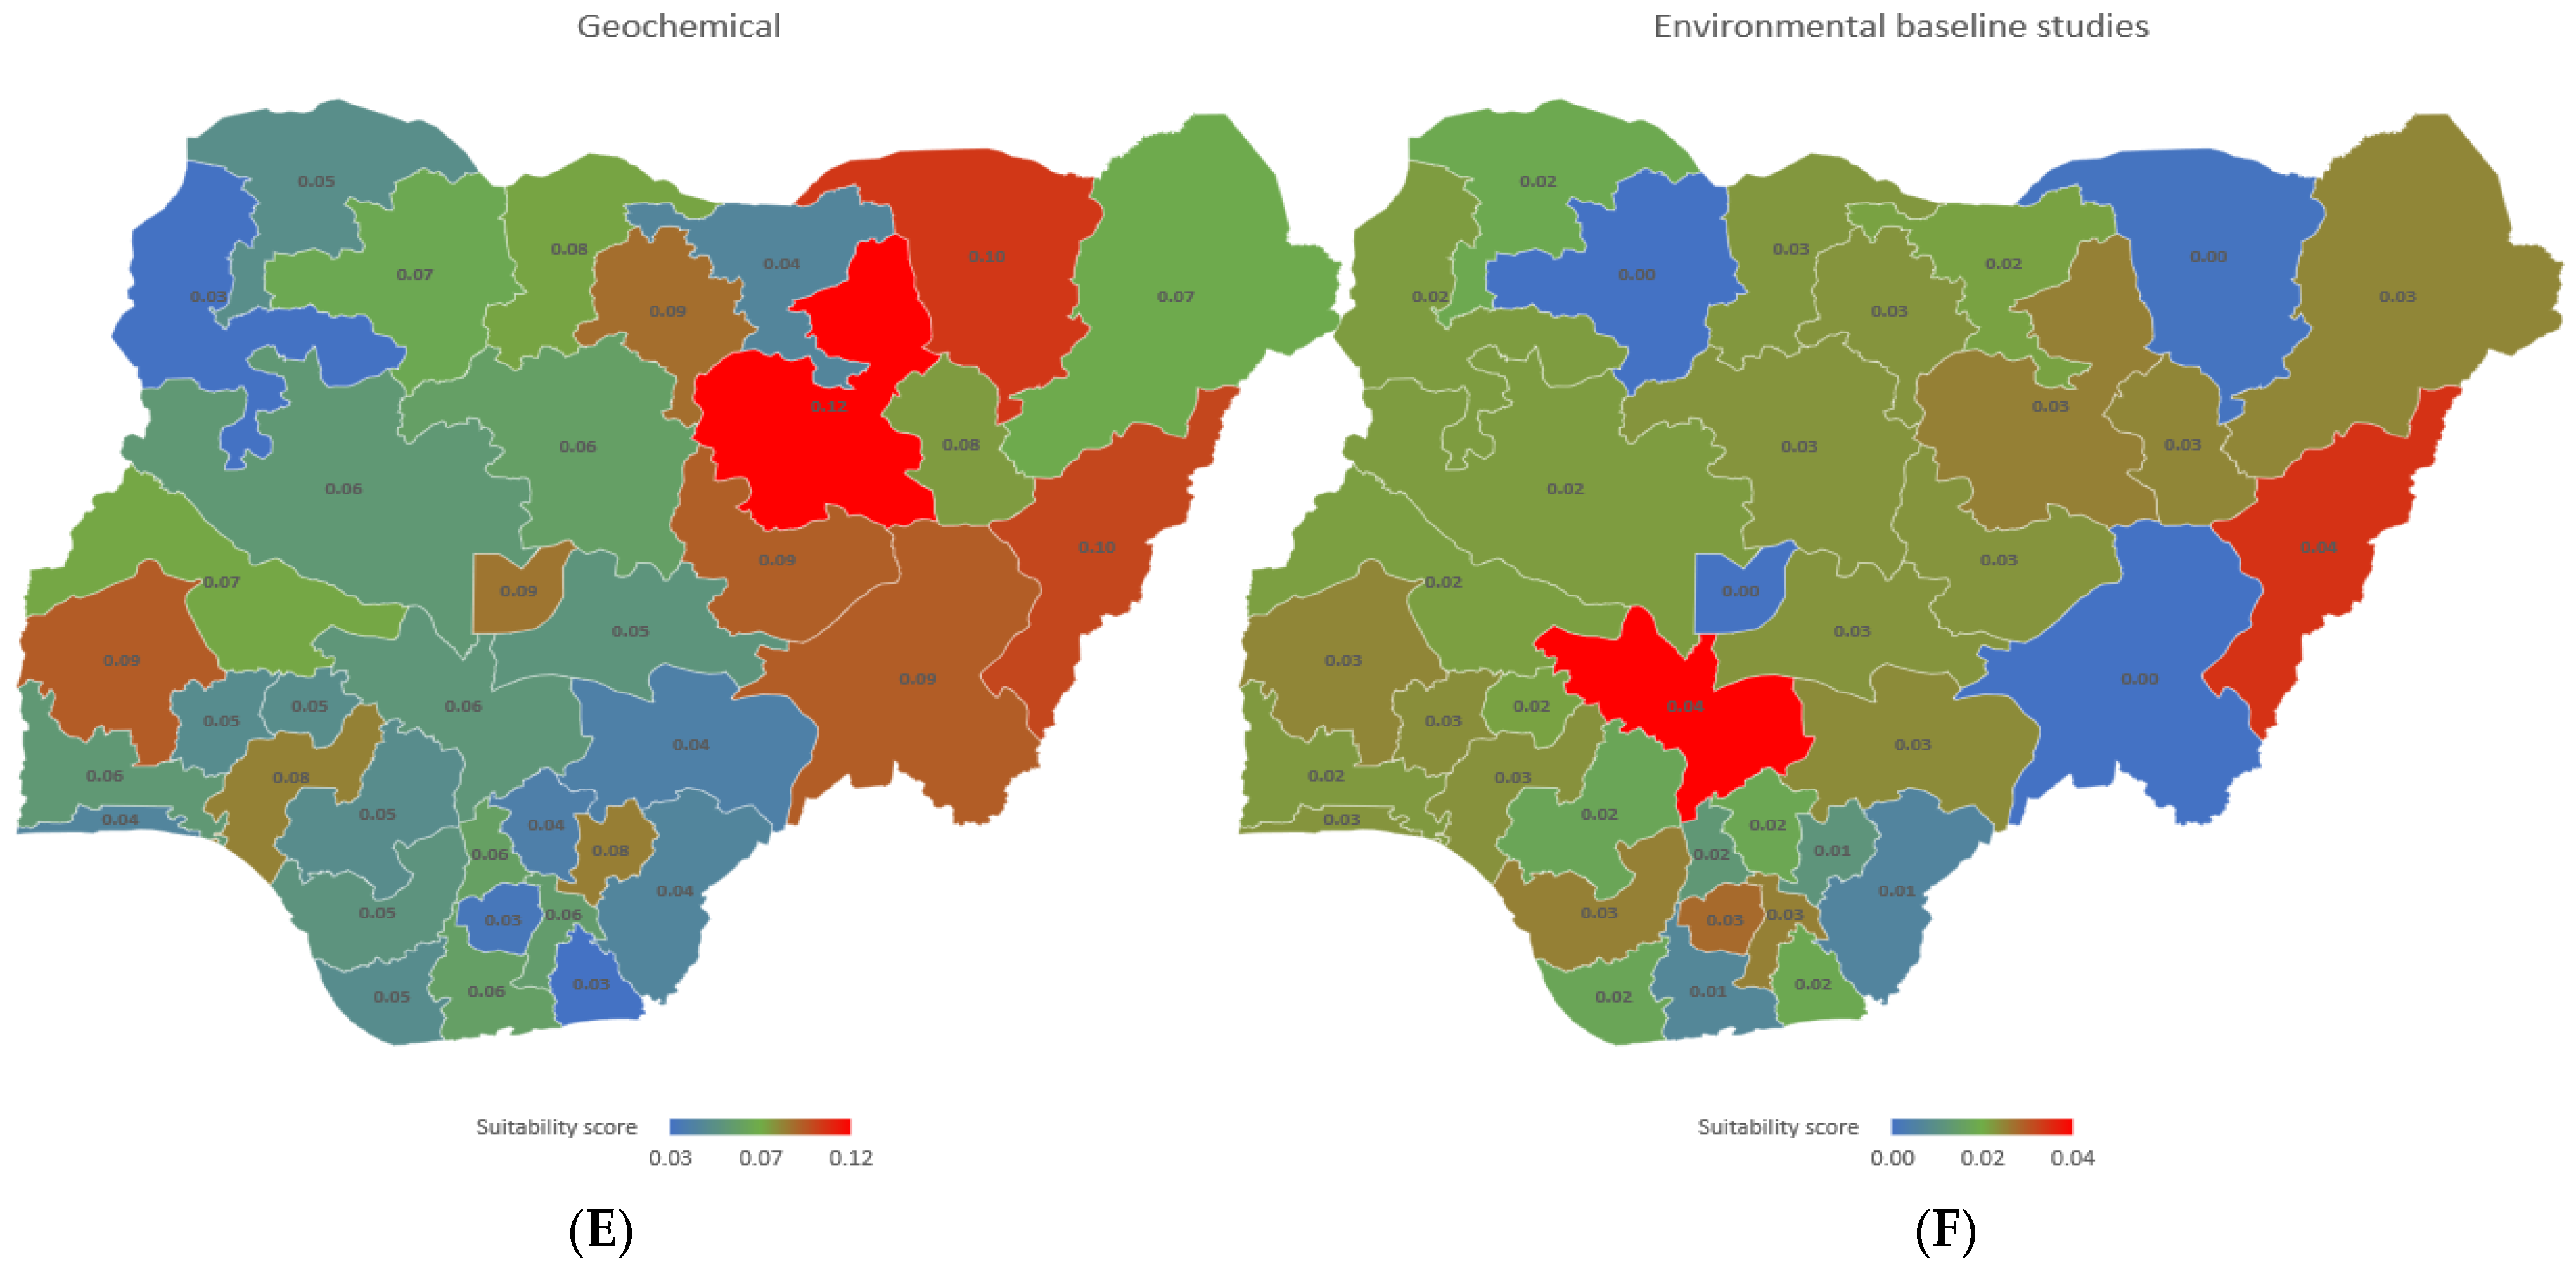
3.2. Identification of Spatial Data Sets

This section aims to outline the criteria that will be used in this study. The criteria were obtained from remote sensing imagery datasets, geophysical datasets, geological datasets, well log datasets, environmental baseline study datasets, and geochemical datasets. Remote sensing datasets are widely used to delineate subsurface features of geothermal activity. Geophysical datasets are characterized by micro seismic epicenters and shallow intrusive bodies used to explain the subsurface structural characteristics of potential sites. Geological datasets are characterized mainly by volcanic rocks, craters, and faults used to delineate the geology of a region. Well log datasets are characterized by corrected BHT and reservoir considerations for geothermal site selection. Environmental baseline studies are characterized by ground surface and vegetation cover bodies used to study the densities of regions with geothermal energy potentials. Geochemistry datasets are characterized by hot springs and hydrothermally altered zones used to study the hydrothermal fluids in a region. More information on the criteria selected for each of the datasets can be obtained in Appendix A.

3.3. Modelling of Spatial Datasets

MCDA was chosen to integrate the wide range of criteria; this involves normalizing and then weighing each criterion. Weights are assigned to these criteria to express their relative importance. In the absence of a geothermal power plant in Nigeria and local experts in the field, equal weighting was applied. This study adopted the suggestion of [79] that the simple weighting of criteria can be used whenever the designer finds no justification for favoring one criterion over another. For the sensitivity analysis, different weighting methods were applied to assess the influence of the criteria on geothermal site selection studies. Besides the equal weighting, we explored scenario (2): assigning double weights to five key criteria values (geothermal gradient, heat flow, sediment temperature, sediment depth, and permeability) while varying the remaining 43 criteria values; and scenario (3): assigning halved weights to the five key criteria (geothermal gradient, heat flow, sediment temperature, sediment depth, and permeability) and varying the remaining 43 criteria values. The detailed weights are shown in Table 1.
A suitability score was formulated in line with Equations (1) and (2) to determine the overall site suitability. Sites as used herein also refer to the states in Nigeria and the federal capital territory, Abuja. The geothermal suitability weighted score for all the areas used in this study was calculated as a percentage between the range of values seen across all the sites. Excel was used to manage the various criteria datasets and display the results of their integration. The geographic distribution of each normalized criterion can be visualized as an individual geothermal site score, as can their weighted summation and the overall suitability.
The total outcome of each site is shown in Equation (1):
G i = j N i j
The normalized function of each criterion can be obtained from Equation (2):
N i j = Geothermal criteria value for each site minimum value of each site Maximum value for each site Minimum value for each site
where:
  • i is the site (i = 1, 2, 3…, 37).
  • j is the criteria (j = 1, 2, 3…, 48).
  • Gi is the total outcome of the ith site.
  • Nij is the normalized value of the jth suitability criterion of the ith site.
The normalized values range from 0 to 1.

4. Results and Discussion

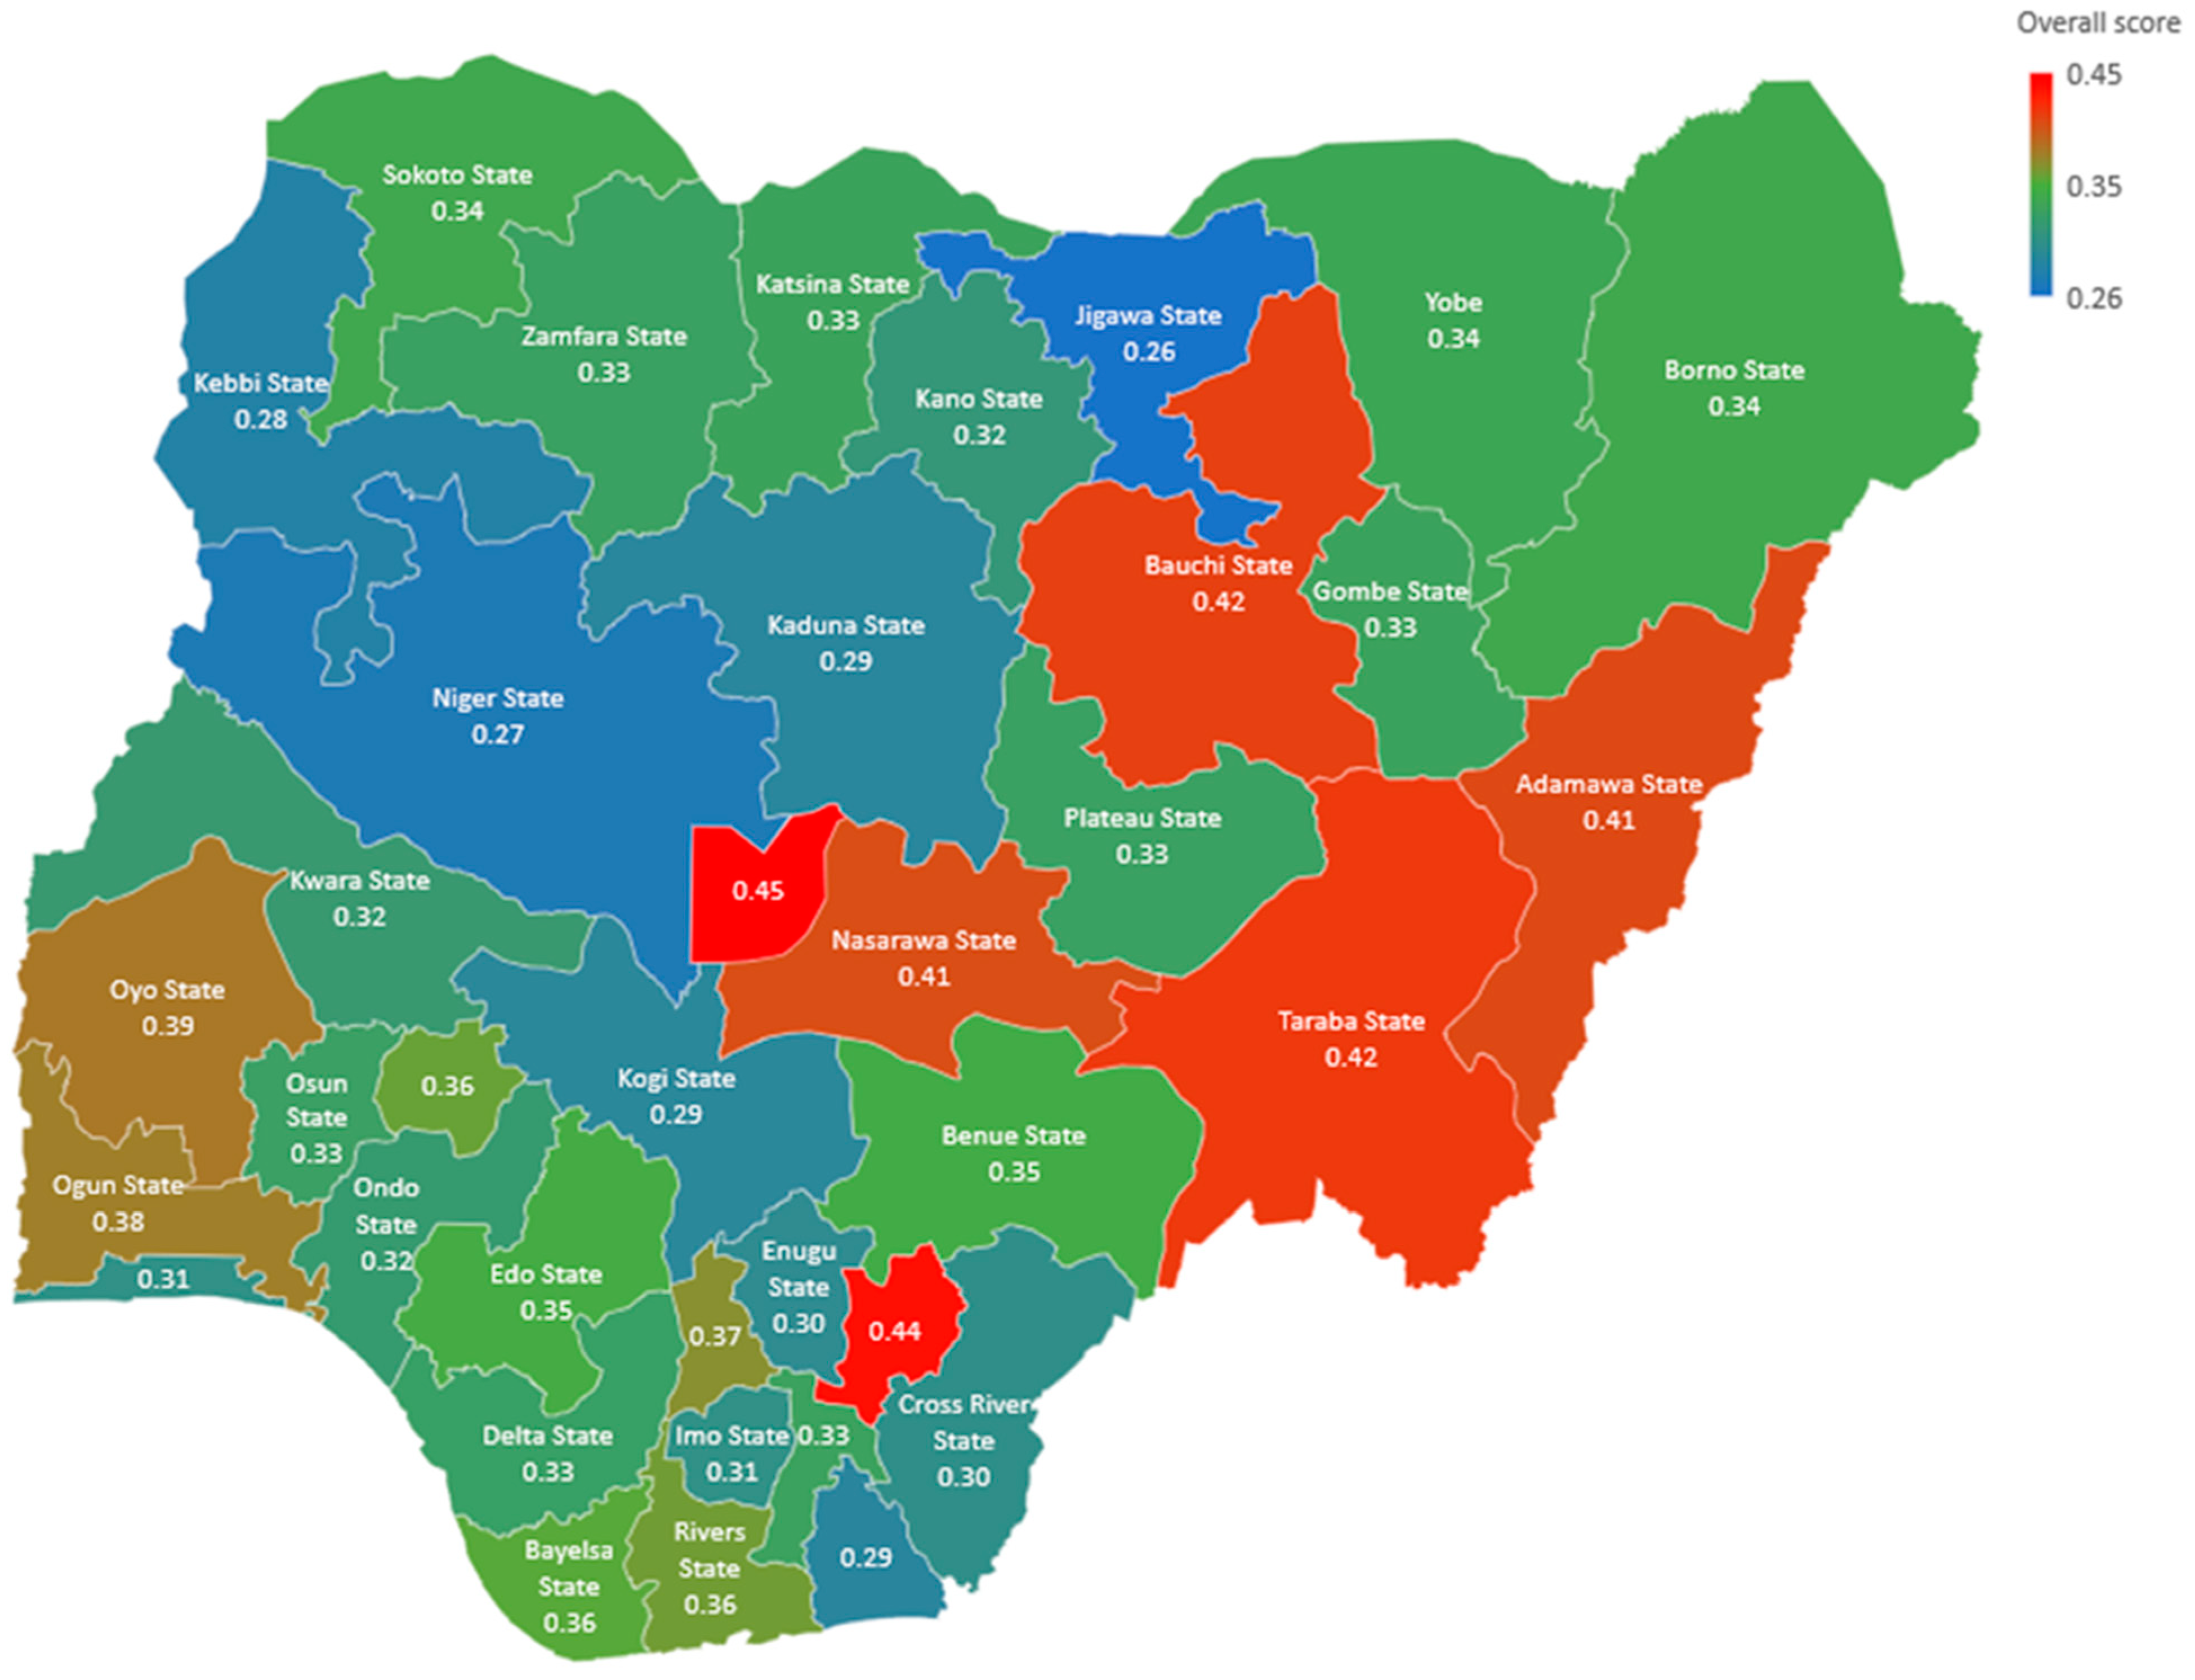
4.1. Overall Geothermal Suitability

The overall suitability map in Figure 2 comprises the result of the MCDA-based analysis. The map presents the varying levels of geothermal site suitability. By inspection, a large number of the sites are relatively high and as such suitable for more geothermal studies. One of the main patterns evident in the overall suitability map in Figure 2 may reflect a key geographical feature of Nigeria, i.e., the rift pattern, which runs in the northeast–southwest direction. This leads to the formation of some troughs which are characterized by several faults and sedimentary rocks deposited in several basins in Nigeria. From the overall suitability map, the areas around the rift locations in Figure 2 suggest that the high scores obtained for some of the criteria are a result of the presence of high cretaceous hot spots, doming, graben formations, sedimentation, magmatism, and tectonism in the region. Some of the potential regions include but are not limited to the South East, North Central, and North East in Figure 2. The patterns evident in Figure 2 are further explored in the next section by unpacking the integrated results with the underlying criteria.
There are quite a few sites that could be recommended for more geothermal energy studies in Nigeria to explore the potential contributions of the site to rural electrification of Nigeria, in terms of area.
The states are classified into three categories based on their suitability values: high (suitability values exceeding 0.4), moderate (values between 0.3 and 0.4), and low (values less than 0.3) suitability regions. Figure 3 shows that the most suitable areas cover a landmass of 205,839 km2, approximately 22% of the total study area of 924,718 km2. In contrast, the moderate and low suitability regions encompass a total land mass of 390,047 km2 (about 42%) and 327,932 km2 (roughly 35%), respectively.

4.2. Discussion

The exploration of the six criteria datasets in this section aims to evaluate the impact of the identified criteria on the overall results.
The results shown in Figure 4A–F geographically highlight the outcomes of the six individual datasets. The variation in the results by dataset type is attributed to the varying geographic distribution of a range of features that each contribute to the likelihood of the presence of geothermal energy, including high volcanic activity, rift valleys, faults, hydrothermal features, active tectonic activity, etc.
Figure 4A depicts the spatial results of the remote sensing datasets. The pattern of the criteria scores largely reflects the Nigerian rift system which is a major tectonic feature that extends from the Gulf of Guinea in the southern part to the Chad basin in the north-central part. Rift regions are characterized by gneisses, metasediments, and variation in the internal tectonic deformation from faults and fold leading to the formation of basins and mountains. These constitute thermal anomalies that are captured through remote sensing of land surface temperatures and radiant GHF.
The geophysical criteria result in Figure 4B reflects the uplift of several rock mountains in some regions and their extension to faults. The results reflect that the subsurface geologic structures, specifically dykes/faults that trend in the east-northeast–west-southwest direction cause variations in the magnetic field intensity values and magnetic patterns. These variations are drawn from the pattern of the magnetic lineaments of the study area, which presented relevant criteria for some regions with very high scores. The patterns of high, moderately high, and low regions also reflect the variations in lithology, and magnetic anomalies in the North Central, South, North East, and other regions. The scores also reflect that the eastern region is characterized by high magnetic anomalies. The northern states exhibit high and low concentrations of faults, while the South West region is thought to have major faults.
The low seismicity of the South West, South East, North Central, and North East regions also contributes to the high scores assigned. The regional stratigraphy and sediment bed thickness pattern of the tectonic perturbations and uplifts in modifying geophysical patterns also reveal the distribution of a high distinct lineament concentration. The most active geothermal resource regions are found along major plate boundaries where less earthquake activity and high volcanoes are concentrated. These points are scattered throughout both the Precambrian basement complex region as well as the tertiary (recent) sediments ranging from the North East to South West and the other regions of Nigeria. The residual values such as the Curie point depths, lithologies, heat flows, geothermal gradients, Bouguer anomalies, sediment bed thicknesses, and temperatures of both aerogravity and the aeromagnetic structure contribute immensely to the variations of the values in Figure 4B, evident from the South West, North Central, and North East regions.
A closer look at the geological criteria scores in Figure 4C shows that the region under study differs tectonically from being part of the Precambrian basin region or being part of the rift system. The NE–SW tectonic trend with the geological structures of Nigeria coincides with the morphological features such as ridges, valleys, and highlands in the shear zone and explains the variation of the criteria reflected in Figure 4C. The results in the Precambrian zones (i.e., in the South West, South East, and North Central regions) have similar outcomes compared to other regions. The surface manifestation features, such as faults and fracture networks, which appear as linear features along the rift axis of some of the sites, facilitate geothermal fluids by providing high permeability of the sites under study and hence are part of the reason for the variations in results obtained for some of the sites. Also, the high values in Figure 4C reflect the presence of high volcanoes and alteration zones, which is attributed to variations in land surface temperature and high sedimentary depth values relative to their surroundings. The turbidity, earth porosities, and rift permeability of some of the high regions reveal a high geothermal potential in some study regions.
The results obtained around the near-top cretaceous region in the well log scoring in Figure 4E are the reason for some of the high criteria values in the north. The stratigraphy pattern of the hydrothermal altered subsurface wells from the late cretaceous to the early cretaceous is also a reason for the variations in the criteria value in Figure 4D. The geological formations, comprising alluvial sands from some reservoirs with some claystone interbeds or sand/silt interbeds along the rift axis of most sites, indicate that some sites are more suitable for geothermal site selection than others. The majority of the stratigraphic regions in Figure 4D share similar results compared to other regions. Furthermore, according to the results in Figure 4D, several sites with corrected BHT and reservoir patterns are systematically high along wetland regions in the northern part of Nigeria and high in some western portions of the Central Swamp, as well as in the shallow offshore waters of the southern part of the study region. As a result of tectonic development, pressure, and temperature gradients, the area resistivity of the sites contributed to the high scores obtained.
The distribution pattern of the geochemical criteria scores reveals higher values in the coastal regions. The distinct distribution of the geochemical criteria values, especially the sulfates, total dissolved solids, and pH, in most regions is attributed to seawater tiding flushing, an abundance of cations, and anions released from the same geochemical processes for both coastal and inland regions. The residual soil anomaly leads to higher geochemical criteria scores for the central and eastern plateaus. The suitability scores in Figure 4E reveal that the hydrothermal alteration patterns of the regions have one or more structural associations implying that several of the sites have structures that serve as channels or pathways for migrating hydrothermal fluids, and the values obtained varied from the northern, northeastern, southwestern, and eastern parts of Nigeria. The hydrothermal alteration aspect of exploring the regional variations of the criteria showed that most of the sites in Nigeria showed a distinct distribution of the criteria selected and they varied from the North West to other regions. While some of the rift and hydrothermally altered zones in the South East, South West, North East, and North West commonly have varied geochemical patterns, they reveal why several regions have high criteria values for geothermal energy site selection studies.
The pattern trends from northwestern to southwestern, northeastern, and north-central Nigeria contain Palaeozoic sediments and carbonates in the upper cretaceous, thereby explaining why some of the criteria in Figure 4E recorded higher geochemical values than others. The stratigraphy of some regions suggests that water is seeping from deeper depths, with the water chemistry influenced by deeper sedimentary and under-trapping formations. This is evident in the values of the total dissolved solids, sulfates, silica, and pH values obtained for some regions.
The variation in the environmental baseline study values of some basins in the study region reflects a low drainage pattern because of the presence of low structural control or disturbances. The basin is not well drained as much of the terrain has highly impermeable sub-surfaces with low to moderate relief. The dominant flow direction of the rivers into the basins, forming a dendritic drainage pattern, leads to some sites in the North West, South West, and other regions in Nigeria having a better drainage value. Vegetation density is an important criterion for environmental baseline studies and as such any changes in vegetation density can be considered as surface disturbance for a geothermal site selection suitability study. Potential sites for geothermal energy studies should ideally be located on terrain with a low vegetation density. Vegetation density fluctuates spatially across regions in Nigeria. The variation in soil sealing connected with a sheet of erosion, leveled by early Holocene to late Pleistocene dune landscapes are reasons for the distinct banded vegetation density pattern values evident in Figure 4F.
Overall, this analysis aimed to identify regions with better geothermal potentials, using a wide range of science-based criteria across the six datasets. What emerged are variations among the datasets, with certain states performing better in some datasets and less well in others. These variations among the datasets emphasize the need to consider a wide range of indicators for geothermal suitability, and that integrating the different datasets should lead to a more reliable and comprehensive result. Relying on any single dataset individually may lead to an incomplete or skewed assessment of geothermal site selection. By combining the datasets, researchers or decision-makers can gain a more comprehensive understanding of the geothermal potential in different states in Nigeria, enabling more informed site selection decisions.

4.3. Sensitivity Analysis

In this study, a sensitivity analysis was conducted to assess suitable areas in the overall geothermal energy suitability map in Figure 2 under varying criteria weights. Figure 5A,B displays the results of this analysis, showing minimal changes.
The sensitivity analysis shows that the changes in assigned weights do not significantly affect the results of the high regions, thereby ensuring the robustness of the results in the overall suitability map. This highlights the possibility of using the suggested methodology for geothermal site selection studies with comprehensive criteria availability.

5. Conclusions

Multi-criteria decision analysis is a key tool for identifying suitable regions for geothermal development. However, there is a lack of consensus in the literature on the relevant criteria needed. This paper presents an MCDA model for geothermal site selection mapping using a wide and comprehensive set of criteria. The model’s usability has been demonstrated through an overall evaluation of geothermal potential across all states in Nigeria. This investigation is the first to provide insight into the suitability of different sites for geothermal energy in Nigeria.
A set of criteria that together describe the likely geothermal potential by region was been established. Forty-three academic sources were used to choose and group useful criteria based on different measurement techniques and datasets. All the states in Nigeria, including the federal capital territory, were considered in this analysis. By applying the proposed framework and collecting relevant data from multiple sources, the most promising sites have been identified.
The generated maps serve as a valuable source of prior information regarding the suitability of an area for geothermal exploration, enabling the identification of suitable drilling locations. Additionally, they empower citizens with insights into the geothermal potential of their region, fostering transparency in future decision making and investments that would benefit the broader public.
It turned out that the nation’s capital (Abuja) appears to be the most promising site for more geothermal studies in Nigeria. The results also revealed that other promising suitable high regions encompass the Ebonyi, Taraba, Bauchi, Adamawa, and Nasarawa states, covering a combined land area of 205,839 km2, with a suitability rating covering 22% of the entire study land mass, while the moderate and low suitability regions cover a land mass of 390,047 km2 (about 42%) and 327,932 km2 (35%), respectively. Sensitivity analysis was performed and demonstrated that the model and its results are reasonably robust to assumptions on criteria weighting.
Criteria weighting remains a research limitation, and further work to bring in the judgement of experts in Nigeria will be important. The study is considered a preliminary step for the identification of suitable sites for geothermal energy projects to assist decision-makers in setting future geothermal energy project plans. Implementing such studies on a smaller scale, such as in communities, can also provide detailed plans for the construction of geothermal energy projects. It would be interesting to carry out the integration of a small-scale geothermal energy mini-grid system into other renewable energy sources as well, such as photovoltaics with wind energy, and also conducting social acceptance analysis to be able to address the rural electrification issues in Nigeria. Identification of a potential geothermal region in the present-day context of high demand for electricity generation in remote regions of Nigeria is necessary because the potential of any resource allows for more studies to be carried out on the resource. One of the selected sites will be explored in the future to build a foundation for the potential contribution of geothermal energy to the rural electrification of Nigeria.

Author Contributions

Conceptualization, U.N., M.L. and L.L.; Methodology, U.N., M.L. and L.L.; Visualization, U.N., M.L. and L.L.; Writing—original draft preparation, U.N., M.L. and L.L.; Writing—review and editing, U.N., M.L. and L.L.; Supervision, M.L. and L.L. All authors have read and agreed to the published version of the manuscript.

Funding

The authors acknowledge support from the University of Surrey. This research received no external funding.

Data Availability Statement

The data supporting the reported results are available from the corresponding author on request.

Conflicts of Interest

The authors affirm that they have no known financial or interpersonal conflicts that would have appeared to have an impact on the research presented in this study.

Appendix A

Appendix A.1. Land Surface Temperature

This criterion evaluates the geothermal condition and suitability of any region for geothermal exploration by mapping the distribution of land surface temperatures associated with geothermal manifestations [17]. It is frequently referred to as the land’s radiative skin temperature, coming from solar radiation. In this study, the land surface temperature was selected as an evident layer for geothermal site selection in Nigeria and it was extracted from Landsat 8 images.

Appendix A.2. Moisture Transfer

This parameter measures moisture content in brine at a distance >1000 m, which is suitable for geothermal energy extraction. In Ardabil province, Iran, ref. [80] reported that soil moisture transfer was necessary for identifying geothermal sites using information from the operational Landsat 8 land imager and thermal infrared sensor. In this study, moisture transfer formed an evident layer to obtain the spatial and temporal variability of water and derive a high-resolution mask.

Appendix A.3. Surface Emissivity

Surface emissivity evaluates the geothermal condition and suitability of a region for geothermal exploration. For example, ref. [81] reviewed geothermal mapping techniques and revealed that remote sensing offers a synoptic capability of mapping land surface emissivity of an area in a real-time and cost-effective manner to detect temperature anomalies and some manifestations such as fumaroles and hot springs. In this study, surface emissivity formed an evident layer because it is essential for a wide variety of surface studies by allowing the proper calculation and evaluation of evapotranspiration.

Appendix A.4. Reflectance

Reflectance evaluates the geothermal condition and suitability of a region for geothermal exploration. The authors of ref. [82] used ASTER to identify high-potential zones through their reflectance. In this study, reflectance formed an evident layer and was used to map possible geothermal regions to understand the geology, environmental monitoring, and land management in Nigeria and the data were extracted from areas mapped with the ASTER, TIR, Modis, Airborne, and Hyperion datasets in the literature.

Appendix A.5. Radiant GHF

Radiant GHF is an important criterion that evaluates the geothermal condition and suitability of a region for geothermal exploration. For example, ref. [83] addressed the challenges of remotely characterizing the spatially and temporally dynamic features in Yellowstone by using nightmare TIR data from ASTER to estimate the radiant geothermal heat flux (GHF) for Yellowstone thermal areas in the USA. In this study, radiant geothermal heat flux (GHF) formed an evident layer and was used to map possible geothermal regions in Nigeria and the data were extracted from areas mapped with the ASTER, TIR, Modis, Airborne, and Hyperion datasets in the literature.

Appendix A.6. Thermal Variance Variation

Thermal variance variation means complex natural variations on both the surface and sub-surface regions of the earth. For example, ref. [84] established the theoretical basis of thermal infrared remote sensing of water temperature in riverine landscapes to reveal both longitudinal and lateral thermal variance variations. In this study, thermal variance variation formed an evident layer and was used to map possible geothermal regions in Nigeria and the data were extracted from areas mapped with the ASTER, TIR, Modis, and Airborne and Hyperion datasets in the literature.

Appendix A.7. Elevation

Elevation refers to the suitability of geothermal energy potentials concerning their elevation and slope. For example, ref. [85] used synthetic aperture radar technology to generate a digital elevation model. In this study, elevation formed an evident layer and was used to map possible geothermal regions in Nigeria and the data were extracted from areas mapped with the DEM, synthetic aperture, radar, and LIDAR map datasets in the literature.

Appendix A.8. Slope and Aspect

Slope and aspect refer to the suitability of geothermal energy potentials concerning their slope and aspect. The authors of refs. [86,87] adopted synthetic aperture radar interferometry to extract the initial slope with low-resolution DEM. In this study, slope and aspect formed an evident layer and were used to map possible geothermal regions in Nigeria and the data were extracted from areas mapped with the DEM, synthetic aperture, radar, LIDAR datasets in the literature.

Appendix A.9. Curie Point Depth

The Curie point depth evaluates the regional condition and construction stability according to the information in the literature and geological prospecting. For example, ref. [88] applied spectral analysis to aeromagnetic anomalies to map Curie point depth and further revealed geothermal and petroleum explorations. The Curie point depth in this investigation formed an evident layer and was used to map possible geothermal regions in Nigeria and the data were extracted from areas mapped with aeromagnetic map datasets in the literature.

Appendix A.10. Heat Flow

Heat flow evaluates the geothermal condition and suitability of a region for geothermal exploration. For example, ref. [89] applied power spectral analysis to an aeromagnetic dataset to estimate heat flow. In this study, heat flow formed an evident layer and was used to map possible geothermal regions in Nigeria and the data were extracted from areas mapped with aeromagnetic map datasets in the literature.

Appendix A.11. Geothermal Gradient

This relates to how the earth’s inner temperature changes as it gets deeper. The geological gradient varies from region to region and the criterion is crucial for geothermal exploration. For example, ref. [89] used power spectrum analysis to calculate the geothermal gradient from an aeromagnetic dataset. In this study, geothermal gradient formed an evident layer and was used to map possible geothermal regions in Nigeria and the data were extracted from areas mapped with aeromagnetic datasets in the literature.

Appendix A.12. Electrical Resistivity

These are additional parameters used to determine geothermal suitability for a particular region. For example, ref. [90] outlined geothermal systems in New Zealand using electrical resistivity and claimed that resistivity data may be easily evaluated using the ostensible one-to-one link between low resistivity and the existence of geothermal fluids. In this study, electrical resistivity formed an evident layer and was used to map possible geothermal regions in Nigeria and the data were extracted from areas mapped with electrical map datasets in the literature.

Appendix A.13. Electrical Conductivity

These parameters refer to favorable factors that facilitate the construction and site selection of potential sites for geothermal energy explorations. For example, refs. [91,92] reported that the electrical conductivity of the subsurface is the crucial parameter for characterizing a geothermal setting. In this study, electrical conductivity formed an evident layer and was used to map possible geothermal regions in Nigeria and the data were extracted from areas mapped with electrical map datasets in the literature.

Appendix A.14. Specific Heat Capacity

These parameters refer to favorable factors that facilitate the construction and site selection of potential sites for geothermal energy explorations. The authors of ref. [93] stated that thermal mapping was based on the space heating and hot water energy demand of each building and the specific heat capacity extraction potential of the subsurface per parcel. In this study, specific heat capacity formed an evident layer and was used to map possible geothermal regions in Nigeria and the data were extracted from areas mapped with thermal map datasets in the literature.

Appendix A.15. Thermal Conductivity

These are additional parameters used to determine geothermal suitability for a particular region. The authors of ref. [94] revealed that the amount of heat flow is a function of the medium’s thermal conductivity. In this study, thermal conductivity formed an evident layer and was used to map possible geothermal regions in Nigeria and the data were extracted from areas mapped with thermal map datasets in the literature.

Appendix A.16. Magnetic Susceptibility

These are additional parameters used to determine geothermal suitability for a particular region. For example, ref. [95] stated that the magnetic method was used in identifying magnetic susceptibility. In this study, magnetic susceptibility formed an evident layer and was utilized to map possible geothermal regions in Nigeria and the data were extracted from areas mapped with magnetic map datasets in the literature.

Appendix A.17. Borehole Diameter

The good bore diameter criterion determines the size of potential wells and their suitability for geothermal energy explorations. The authors of ref. [96] stated that to achieve a realistic borehole diameter, a high-resolution acoustic televiewer was needed. In this study, borehole diameter formed an evident layer and was utilized to map possible geothermal regions in Nigeria and the data were extracted from areas mapped with acoustic televiewer map datasets in the literature.

Appendix A.18. Density of Earthquake

The evaluates the threat of complex geophysical conditions to project safety, including seismic activity, storms, surges, etc. The authors of ref. [17] adopted the use of multi-criteria decision making based on remote sensing, GIS, and geophysical technique support for geothermal resource exploration in Egypt’s Gulf of Suez region. In this investigation, the density of earthquakes formed an evident layer and was used to map possible geothermal regions in Nigeria and the data were extracted from areas mapped with earthquake epicenter map datasets in the literature.

Appendix A.19. Magnitude of Earthquake

This evaluates the threat of complex geophysical conditions to project safety, including seismic activity, storms, surges, etc. The authors of ref. [17] created a multi-criteria decision support for geothermal resource development throughout the Gulf of Suez in Egypt, using GIS, remote sensing, and geophysical techniques. In this study, the magnitude of earthquakes formed an evident layer and was used to map possible geothermal regions in Nigeria and the data were extracted from areas mapped with earthquake epicenter map datasets in the literature.

Appendix A.20. Bouguer Anomaly

This evaluates the regional condition and construction stability according to the information in the literature and geological prospecting. For example, ref. [17] used an aerogravity dataset to demonstrate that the Bouguer anomaly was required to produce a residual gravity map to conduct multi-criteria decision support for the extraction of geothermal resources using remote sensing, GIS, and geophysical methods along the shoreline of the Gulf of Suez in Egypt. In this study, Bouguer anomaly formed an evident layer and was used to map possible geothermal regions in Nigeria and the data were extracted from areas mapped with aerogravity map datasets in the literature.

Appendix A.21. Sediment Bed Thickness

This evaluates the regional condition and construction stability according to the information in the literature and geological prospecting. For example, ref. [97] revealed through aeromagnetic and aerogravity datasets that sediment thickness was necessary to map the basement depth in the Masu area of Nigeria for geothermal explorations. In this study, sediment bed thickness formed an evident layer and was used to map possible geothermal regions in Nigeria and the data were extracted from areas mapped with aerogravity map datasets in the literature.

Appendix A.22. Sediment Temperature

This evaluates the regional condition and construction stability according to the information in the literature and geological prospecting. For example, ref. [98] correlated both aerogravity and bottom-hole temperature data to delineate the subsurface/sediment temperature. In this study, sediment temperature formed an evident layer and was used to map possible geothermal regions in Nigeria and the data were extracted from areas mapped with aerogravity map datasets in the literature.

Appendix A.23. Wave Velocity

This parameter is used to characterize the microstructure inside the rock as a non-destructive method. For example, ref. [99] conducted seismic identification in the geothermal prospecting of the Olkaria area in Kenya to reveal the wave velocity of geothermal exploration. In this study, wave velocity formed an evident layer and was used to map possible geothermal regions in Nigeria and the data were extracted from areas mapped with seismic map datasets in the literature.

Appendix A.24. Density of Rock

This parameter is also a basic criterion for geothermal energy site selection and explorations. For example, ref. [100] revealed that seismic mapping from aerogravity is a geophysical method used to provide greater resolution at depth than any other method and therefore is often referred to as one of the methods of locating hydrocarbons. According to their findings, a seismic map was constructed to depict rock densities. In this investigation, the density of rock formed an evident layer and was used to map possible geothermal regions in Nigeria and the data were extracted from areas mapped with seismic map datasets in the literature.

Appendix A.25. Distance to Fault

For example, ref. [101] revealed that both lithology and stratigraphic structural units had been used to reveal the distance to faults. In this study, distance to fault formed an evident layer and was used to map possible geothermal regions in Nigeria and the data were extracted from areas mapped with lithology and stratigraphic structural unit map datasets in the literature.

Appendix A.26. Lineament Density

Lineament density is one of the most crucial criteria used to select geothermal sites and the suitability of a particular region [102]. A safe distance is obtained from information in the literature. According to calculations, areas that are up to 200 m away show a lineament density of 2.6 and are suitable for geothermal exploration while those <200 m have low weights and are not suitable for geothermal exploration. In this study, lineament density formed an evident layer and was used to map possible geothermal regions in Nigeria and the data were extracted from areas mapped with lithology and stratigraphic feature map datasets in the literature.

Appendix A.27. Porosity

This evaluates the regional condition and construction stability according to the information in the literature and geological prospecting. The author of ref. [103] stated that a volcanic map revealed the porosity of the soil when sulfate water was able to demagnetize volcanic rock near fumaroles. In this study, porosity formed an evident layer and was used to map possible geothermal regions in Nigeria and the data were extracted from areas mapped with volcanic rock map datasets in the literature.

Appendix A.28. Permeability

This evaluates the regional condition and construction stability according to the information in the literature and geological prospecting. The authors of ref. [14] adopted a volcanic crater map in Iran to understand geothermal potential site selection using GIS. Their study revealed that information about the permeability of the earth is necessary for the site selection process. In this study, permeability formed an evident layer and was used to map possible geothermal regions in Nigeria and the data were extracted from areas mapped with volcanic rock map datasets in the literature.

Appendix A.29. Land Displacement

This evaluates the regional condition and construction stability according to the information in the literature and geological prospecting. The authors of ref. [104] revealed land surface displacement from hydrothermal alteration zones by combining SBARS-InSAR and geo statistics to detect land topography. In this study, land displacement formed an evident layer and was used to map possible geothermal regions in Nigeria and the data were extracted from areas mapped with alteration zone map datasets in the literature.

Appendix A.30. Altitude

This evaluates the regional condition and construction stability according to the information in the literature and geological prospecting. The authors of ref. [105] stated that an alteration map was used to reveal altitude during their study on the exploration and monitoring of geothermal activity in Japan. In this study, altitude formed an evident layer and was used to map possible geothermal regions in Nigeria and the data were extracted from areas mapped with alteration zone map datasets in the literature.

Appendix A.31. Sediment Depth

This evaluates the regional condition and construction stability according to the information in the literature and geological prospecting. The authors of ref. [106] used a three-dimensional geothermal field with a high enthalpy, modeled as conductivity, at Tendaho, Ethiopia, revealing that hydrothermal deposits could be used to reveal the sediment depth of geothermal fields. Their study revealed hydrothermal areas at different depths. In this study, sediment depth formed an evident layer and was utilized to map possible geothermal regions in Nigeria and the data were extracted from areas mapped with hydrothermal deposit map datasets in the literature.

Appendix A.32. Turbidity

This evaluates the regional condition and construction stability according to the information in the literature and geological prospecting. The authors of ref. [107] revealed that, in Kenya, sedimentary terrain had been used in detecting turbidity. In the context of geothermal energy studies, high turbidity values can indicate the presence of mineral-rich fluids, which can be useful in identifying potential geothermal energy sources. In this study, turbidity formed an evident layer and was utilized to map possible geothermal regions in Nigeria and the data were extracted from areas mapped with hydrothermal deposit map datasets in the literature.

Appendix A.33. Area Resistivity

These parameters refer to favorable factors that facilitate the construction and site selection of potential sites for geothermal energy explorations. The authors of ref. [108] revealed in India that corrected bottom-hole temperatures can be used to show area resistivity. In this study, area resistivity formed an evident layer and was utilized to map possible geothermal regions in Nigeria and the data were extracted from areas mapped with corrected BHT map datasets in the literature.

Appendix A.34. Pressure Gradient

This measures the convenience and suitability of the heat flow beneath the earth’s surface. The authors of ref. [109] carried out studies on geothermal reservoir engineering. They revealed that the pressure gradient was caused by natural flow in the sediment. In this study, the pressure gradient formed an evident layer and was used to map possible geothermal regions in Nigeria and the data were extracted from areas mapped with geothermal reservoir map datasets in the literature.

Appendix A.35. Temperature Gradient

This measures the convenience and suitability of the heat flow buried deep within the earth. The author of ref. [110] attempted to study existing geothermal reservoirs and later found out that there is a need to consider the temperature gradient of the reservoir before embarking on any explorations. In this study, the temperature gradient formed an evident layer and was used to map possible geothermal regions in Nigeria and the data were extracted from areas mapped with geothermal reservoir map datasets in the literature.

Appendix A.36. Drainage Density

This refers to the nature of the plants around potential sites to determine the site’s suitability and the nature of the basin around the potential region. In ref. [111], it was revealed that information about groundwater resources is needed to reveal the drainage density of any region. In this study, drainage density formed an evident layer and was used to map possible geothermal regions in Nigeria and the data were extracted from areas mapped with groundwater resource map datasets in the literature.

Appendix A.37. Vegetation Density

This refers to the nature of the plants around potential sites to determine the site’s suitability and the nature of the basin around the potential region. In ref. [112], high geothermal potential was identified from a vegetation density cover map using GIS in Sabalan geothermal field. In this study, vegetation density formed an evident layer and was used to map possible geothermal regions in Nigeria and the data were extracted from areas mapped with vegetation cover map datasets in the literature.

Appendix A.38. Temperature

This refers to the geothermal fluid or rock within the subsurface reservoir where the geothermal energy is extracted. In ref. [113], it was revealed that the temperature of fluids is an important criterion for understanding the chemical composition of a reservoir for geothermal energy studies. In this study, temperature values was used to map the geothermal regions in Nigeria. The temperature values were obtained from the literature for each state in Nigeria.

Appendix A.39. pH

The pH level of geothermal fluids plays a crucial role in understanding the characteristics and potential of geothermal resources. In ref. [114], it was stated that pH is an important geochemical fluid criterion used to measure the acidity or alkalinity of substances which can impact the performance of geothermal systems. In this study, the pH values of geochemical fluids were used in mapping potential geothermal regions in Nigeria. The pH values were obtained from the literature for each state in Nigeria.

Appendix A.40. Chloride

Chloride concentrations in geochemical fluids can provide insights into the composition and behavior of geothermal reservoirs. In ref. [115], it was suggested that chloride is an important criterion for understanding the brine salinity in geothermal studies. In this study, chloride values was used to assess potential geothermal regions in Nigeria and the values were obtained from the literature.

Appendix A.41. Fluoride

Fluoride concentrations in geochemical fluids can provide insights into the composition and behavior of geothermal reservoirs. The author of ref. [110] revealed the presence of fluorine in all the samples at variable concentrations in their study and that it can be used to indicate the interaction of water with subsurface mica and apatite-bearing rocks for geothermal energy studies. In the study, fluorine values were used to understand the concentration of geochemical fluids, which was in turn used to assess potential geothermal regions in Nigeria and the values were obtained in the literature.

Appendix A.42. Hydrogen (H2)

The isotopic composition of hydrogen can help determine the source of water, the temperature at which water–rock interactions occurred, and the extent of the mixing between different sources for geothermal studies. In ref. [116], the geochemical processes involved in hydrogen generation for geothermal sites in the upper Rhine graben France were investigated. In this study, hydrogen values were used to understand the concentration of geochemical fluids, which was then used to assess potential geothermal regions in Nigeria and the values were obtained in the literature.

Appendix A.43. Sodium (Na)

Sodium helps in characterizing the reservoir fluids and understanding the fluid–rock interactions that occur within a geothermal system. The author of ref. [110] measured the physical and chemical characteristics of thermal springs and revealed the presence of sodium and other cations in their detailed chemical analysis for geothermal studies. In this study, sodium values were used to understand the concentration of geochemical fluids, which was used to assess potential geothermal regions in Nigeria and the values were obtained in the literature.

Appendix A.44. Silica (SiO2)

Silica is the most common chemical compound in the earth’s crust and an important criteria for most geothermal reservoirs. In ref. [113], geochemical analysis was conducted for major ions such as cations and anions, by adopting geothermometers to reveal the silica contents of geochemical fluids in the Krabi saline geothermal system. In this study, silica values were used to study the geochemical nature of reservoirs and to map potential regions of Nigeria. The silica values were obtained from the literature for each state in Nigeria.

Appendix A.45. Total Dissolved Solids (TDS)

Total dissolved solids (TDS) refers to the total concentration of inorganic salts, minerals, and other dissolved solids present in a liquid. In ref. [113], it was revealed that total dissolved solids can be used to analyze the chemical composition and characteristics of shallow geothermal reservoirs. In this study, total dissolved solids values were used to map potential geothermal regions in Nigeria. The total dissolved solids values were obtained in the literature for each state in Nigeria.

Appendix A.46. Carbon Dioxide (CO2)

Carbon dioxide is an important geochemical criterion in geothermal energy site selection studies. The presence and behavior of carbon dioxide in geothermal systems can provide valuable information about the potential for energy production and the overall viability of a geothermal site. In ref. [117], it was revealed that the study of CO2 concentrations can play a major role in the long-term geochemical impact of geothermal energy sites. In this study, CO2 values were used to map potential geothermal regions in Nigeria. The CO2 values were obtained from the literature for each state in Nigeria.

Appendix A.47. Sulphates (SO42−)

Sulfates or more specifically the concentration of sulfate ions in geothermal fluids can be an important geochemical criterion. The presence and abundance of sulfates in geothermal water can provide valuable information about the geothermal system and its characteristics. The author of ref. [110] measured the physical and chemical characteristics of thermal springs and revealed the presence of sulfates and other anions in their detailed chemical analysis for geothermal studies. In this study, soil sulfate values were used to map potential geothermal regions in Nigeria. The sulfate values were obtained from the literature for each state in Nigeria.

Appendix A.48. Radon Gas (Rn-222)

This is used to detect the presence of permeable zones in a geothermal field. In ref. [118], the importance of soil radon content measurement to understand the geothermal potential of a region was reflected on and it was stated that geothermally active sites have greater radon flux compared to geothermally passive sites, pointing towards a positive correlation between geothermal heat reservoirs and radon concentration. In this study, radon 222 values were used to map potential geothermal regions in Nigeria. The radon values were obtained from the literature for each state in Nigeria.

Appendix B. Sensitivity Results of the Evaluated Sites in Nigeria

Table A1. Sensitivity Results under the different scenarios.
StateBaseline ScoresDouble WeightingHalf Weights
Kano State0.340.290.34
Lagos State0.290.270.30
Kaduna State0.280.260.29
Katsina State0.330.340.33
Oyo State0.390.370.39
Rivers State0.350.350.36
Bauchi State0.410.400.42
Jigawa State0.250.230.26
Benue State0.340.320.34
Anambra State0.370.350.38
Borno State0.340.320.34
Delta State0.310.290.32
Imo State0.300.290.30
Niger State0.280.260.29
Akwa Ibom State0.280.250.29
Ogun State0.370.350.39
Sokoto State0.340.340.34
Ondo State0.330.320.33
Osun State0.330.300.34
Kogi State0.280.270.28
Zamfara State0.330.310.33
Enugu State0.300.300.30
Kebbi State0.270.250.28
Edo State0.340.330.34
Plateau State0.320.290.34
Adamawa State0.400.360.42
Cross River State0.300.290.31
Abia State0.320.300.32
Ekiti State0.350.360.35
Kwara State0.310.310.31
Gombe State0.330.320.34
Yobe State0.340.310.35
Taraba State0.420.420.41
Ebonyi State0.430.380.43
Nasarawa State0.400.390.41
Bayelsa State0.340.300.36
Abuja Federal Capital Territory0.450.430.46

References

  1. Kose, R. Geothermal energy potential for power generation in Turkey: A case study in Simav, Kutahya. Renew. Sustain. Energy Rev. 2007, 11, 497–511. [Google Scholar] [CrossRef]
  2. Noorollahi, Y.; Shabbir, M.S.; Siddiqi, A.F.; Ilyashenko, L.K.; Ahmadi, E. Review of two decade geothermal energy development in Iran, benefits, challenges, and future policy. Geothermics 2019, 77, 257–266. [Google Scholar] [CrossRef]
  3. Halldorsson, B.; Olafsson, S.; Snaebjörnsson, J.T.; Sigurosson, S.; Rupakhety, R.; Sigbjörnsson, R. On the effects of induced earthquakes due to fluid injection at hellisheidi geothermal power plant, Iceland. In Proceedings of the 15th WCEE, Lisbon, Portugal, 24–28 September 2012. [Google Scholar]
  4. Varet, J. Contribution to favorable geothermal site selection in the Afar triangle. In Proceedings of the Argeo Meeting, Djibouti, 22–25 November 2010. [Google Scholar]
  5. Shortall, R.; Davidsdottir, B.; Axelsson, G. Development of a sustainability assessment framework for geothermal energy projects. Energy Sustain. Dev. 2015, 27, 28–45. [Google Scholar] [CrossRef]
  6. Allahvirdizadeh, P. A review on geothermal wells: Well integrity issues. J. Clean. Prod. 2020, 275, 124009. [Google Scholar] [CrossRef]
  7. Yalcin, M.; Gul, F.K. A GIS-based multi criteria decision analysis approach for exploring geothermal resources: Akarcay basin (Afyonkarahisar). Geothermics 2017, 67, 18–28. [Google Scholar] [CrossRef]
  8. Yudha, S.W.; Tjahjono, B.; Longhurst, P. Unearthing the dynamics of Indonesia’s geothermal energy development. Energies 2022, 15, 5009. [Google Scholar] [CrossRef]
  9. Ciriaco, A.E. A Refined Methodology for Quantifying Estimates of Extractable Geothermal Energy: Experimental Design (ED) and Response Surface Methodology (RSM). Ph.D. Thesis, The University of Auckland, Auckland, New Zealand, 2021. [Google Scholar]
  10. Tester, J.W.; Beckers, K.F.; Hawkins, A.J.; Lukawski, M.Z. The evolving role of geothermal energy for decarbonizing the United States. Energy Environ. Sci. 2021, 14, 6211–6241. [Google Scholar] [CrossRef]
  11. Coro, G.; Trumpy, E. Predicting geographical suitability of geothermal power plants. J. Clean. Prod. 2020, 267, 121874. [Google Scholar] [CrossRef]
  12. Brahim, F.B.; Boughariou, E.; Makni, J.; Bouri, S. Evaluation of groundwater hydrogeochemical characteristics and delineation of geothermal potentialities using multi criteria decision analysis: Case of Tozeur region, Tunisia. Appl. Geochem. 2020, 113, 104504. [Google Scholar] [CrossRef]
  13. Rodriguez, F.; Pérez, N.M.; Padrón, E.; Melián, G.; Piña-Varas, P.; Dionis, S.; Barrancos, J.; Padilla, G.D.; Hernández, P.A.; Marrero, R. Surface geochemical and geophysical studies for geothermal exploration at the southern volcanic rift zone of Tenerife, Canary Islands, Spain. Geothermics 2015, 55, 195–206. [Google Scholar] [CrossRef]
  14. Yousefi, H.; Ehara, S.; Noorollahi, Y. Geothermal potential site selection using GIS in Iran. In Proceedings of the 32nd Workshop on Geothermal Reservoir Engineering, Stanford, CA, USA, 22–24 January 2007; pp. 174–182. [Google Scholar]
  15. Trumpy, E.; Donato, A.; Gianelli, G.; Gola, G.; Minissale, A.; Montanari, D.; Santilano, A.; Manzella, A. Data integration and favourability maps for exploring geothermal systems in Sicily, southern Italy. Geothermics 2015, 56, 1–16. [Google Scholar] [CrossRef]
  16. Faulds, J.; Hinz, N.; Coolbaugh, M.; dePolo, C.; Siler, D.; Shevenell, L.; Hammond, W.; Kreemer, C.; Queen, J. Discovering geothermal systems in the Great Basin region: An integrated geologic, geochemical, and geophysical approach for establishing geothermal play fairways. In Proceedings of the 41st Workshop on Geothermal Reservoir Engineering, Stanford, CA, USA, 22–24 February 2016; Nevada Bureau of Mines and Geology, University of Nevada: Reno, NV, USA, 2015. [Google Scholar]
  17. Abuzied, S.M.; Kaiser, M.F.; Shendi, E.-A.H.; Abdel-Fattah, M.I. Multi-criteria decision support for geothermal resources exploration based on remote sensing, GIS and geophysical techniques along the Gulf of Suez coastal area, Egypt. Geothermics 2020, 88, 101893. [Google Scholar] [CrossRef]
  18. Omwenga, B.M. Geothermal Well Site Suitability Selection Using Geographic Information Systems (GIS) and Remote Sensing: Case Study of the Eburru Geothermal Field. In Proceedings of the 45th Workshop on Geothermal Reservoir Engineering, Stanford, CA, USA, 10–12 February 2020; pp. 1–6. [Google Scholar]
  19. Dohaney, J.; Brogt, E.; Kennedy, B. Strategies and perceptions of students’ field note-taking skills: Insights from a geothermal field lesson. J. Geosci. Educ. 2015, 63, 233–249. [Google Scholar] [CrossRef]
  20. DiPippo, R. Geothermal Power Plants: Principles, Applications, Case Studies and Environmental Impact; Butterworth-Heinemann: Oxford, UK, 2012. [Google Scholar]
  21. Procesi, M.; Cantucci, B.; Buttinelli, M.; Armezzani, G.; Quattrocchi, F.; Boschi, E. Strategic use of the underground in an energy mix plan: Synergies among CO2, CH4 geological storage and geothermal energy. Latium Region case study (Central Italy). Appl. Energy 2013, 110, 104–131. [Google Scholar] [CrossRef]
  22. Lopez, S.; Hamm, V.; Le Brun, M.; Schaper, L.; Boissier, F.; Cotiche, C.; Giuglaris, E. 40 years of Dogger aquifer management in Ile-de-France, Paris Basin, France. Geothermics 2010, 39, 339–356. [Google Scholar] [CrossRef]
  23. Muther, T.; Syed, F.I.; Lancaster, A.T.; Salsabila, F.D.; Dahaghi, A.K.; Negahban, S. Geothermal 4.0: AI-Enabled geothermal reservoir development-current status, potentials, limitations, and ways forward. Geothermics 2022, 100, 102348. [Google Scholar] [CrossRef]
  24. Muñoz, G.; Bauer, K.; Moeck, I.; Schulze, A.; Ritter, O. Exploring the Groß Schönebeck (Germany) geothermal site using a statistical joint interpretation of magnetotelluric and seismic tomography models. Geothermics 2010, 39, 35–45. [Google Scholar] [CrossRef]
  25. Faulds, J.; Hinz, N.; Coolbaugh, M.; Ramelli, A.; Glen, J.; Ayling, B.; Wannamaker, P.; Deoreo, S.; Siler, D.; Craig, J. Vectoring into Potential Blind Geothermal Systems in the Granite Springs Valley Area, Western Nevada: Application of the Play Fairway Analysis at Multiple Scales. In Proceedings of the 44th Workshop on Geothermal Reservoir Engineering, Stanford, CA, USA, 11–13 February 2019; Nevada Bureau of Mines and Geology, University of Nevada: Reno, NV, USA, 2019. [Google Scholar]
  26. Vrijlandt, M.; Struijk, E.; Brunner, L.; Veldkamp, J.; Witmans, N.; Maljers, D.; Van Wees, J. ThermoGIS update: A renewed view on geothermal potential in the Netherlands. In Proceedings of the European Geothermal Congress, The Hague, The Netherlands, 11–14 June 2019; pp. 11–14. [Google Scholar]
  27. Kimball, S. Favourability Map of British Columbia Geothermal Resources. Ph.D. Thesis, University of British Columbia, Vancouver, BC, Canada, 2010. [Google Scholar]
  28. Rehman, A.U.; Abidi, M.H.; Umer, U.; Usmani, Y.S. Multi-criteria decision-making approach for selecting wind energy power plant locations. Sustainability 2019, 11, 6112. [Google Scholar] [CrossRef]
  29. Moraga, J.; Duzgun, H.; Cavur, M.; Soydan, H. The Geothermal Artificial Intelligence for geothermal exploration. Renew. Energy 2022, 192, 134–149. [Google Scholar] [CrossRef]
  30. Besser, H.; Mokadem, N.; Redhaounia, B.; Hadji, R.; Hamad, A.; Hamed, Y. Groundwater mixing and geochemical assessment of low-enthalpy resources in the geothermal field of southwestern Tunisia. Euro-Mediterr. J. Environ. Integr. 2018, 3, 16. [Google Scholar] [CrossRef]
  31. Abraham, E.M.; Obande, E.G.; Chukwu, M.; Chukwu, C.G.; Onwe, M.R. Estimating depth to the bottom of magnetic sources at Wikki Warm Spring region, northeastern Nigeria, using fractal distribution of sources approach. Turk. J. Earth Sci. 2015, 24, 494–512. [Google Scholar] [CrossRef]
  32. Nwankwo, L.I.; Shehu, A.T. Evaluation of Curie-point depths, geothermal gradients and near-surface heat flow from high-resolution aeromagnetic (HRAM) data of the entire Sokoto Basin, Nigeria. J. Volcanol. Geotherm. Res. 2015, 305, 45–55. [Google Scholar] [CrossRef]
  33. Noorollahi, Y.; Itoi, R.; Fujii, H.; Tanaka, T. GIS integration model for geothermal exploration and well siting. Geothermics 2008, 37, 107–131. [Google Scholar] [CrossRef]
  34. Gouareh, A.; Settou, N.; Khalfi, A.; Recioui, B.; Negrou, B.; Rahmouni, S.; Dokkar, B. GIS-based analysis of hydrogen production from geothermal electricity using CO2 as working fluid in Algeria. Int. J. Hydrogen Energy 2015, 40, 15244–15253. [Google Scholar] [CrossRef]
  35. Moghaddam, M.K.; Samadzadegan, F.; Noorollahi, Y.; Sharifi, M.A.; Itoi, R. Spatial analysis and multi-criteria decision making for regional-scale geothermal favorability map. Geothermics 2014, 50, 189–201. [Google Scholar] [CrossRef]
  36. Carranza, E.J.M.; Wibowo, H.; Barritt, S.D.; Sumintadireja, P. Spatial data analysis and integration for regional-scale geothermal potential mapping, West Java, Indonesia. Geothermics 2008, 37, 267–299. [Google Scholar] [CrossRef]
  37. Mostafaeipour, A.; Hosseini Dehshiri, S.J.; Hosseini Dehshiri, S.S.; Jahangiri, M.; Techato, K. A thorough analysis of potential geothermal project locations in Afghanistan. Sustainability 2020, 12, 8397. [Google Scholar] [CrossRef]
  38. Raos, S.; Hranić, J.; Rajšl, I.; Bär, K. An extended methodology for multi-criteria decision-making process focused on enhanced geothermal systems. Energy Convers. Manag. 2022, 258, 115253. [Google Scholar] [CrossRef]
  39. Cook, D.; Fazeli, R.; Davíðsdóttir, B. The need for integrated valuation tools to support decision-making—The case of cultural ecosystem services sourced from geothermal areas. Ecosyst. Serv. 2019, 37, 100923. [Google Scholar] [CrossRef]
  40. Mwaura, D.W. Exploration and Optimized Siting of Geothermal Wells Using a Web-Based Spatial Decision Support System. Ph.D. Thesis, Technische Universität Berlin, Berlin, Germany, 2018. [Google Scholar]
  41. Ejiga, E.G.; Yusoff, I.; Ismail, N.E.H.; Kumar, R. Geothermal energy assessment through the Curie point depth, geothermal gradient, and heat flow around the Akiri hot spring region in Central Nigeria. Environ. Earth Sci. 2022, 81, 115. [Google Scholar] [CrossRef]
  42. Bamisile, O.; Huang, Q.; Xu, X.; Hu, W.; Liu, W.; Liu, Z.; Chen, Z. An approach for sustainable energy planning towards 100% electrification of Nigeria by 2030. Energy 2020, 197, 117172. [Google Scholar] [CrossRef]
  43. Abdullahi, B.; Rai, J.; Olaitan, O.; Musa, Y. A Review of the Correlation between Geology and Geothermal Energy in North-Eastern Nigeria. IOSR J. Appl. Geol. Geophys 2014, 2, 74–83. [Google Scholar] [CrossRef]
  44. Abraham, E.; Nkitnam, E. Review of geothermal energy research in Nigeria: The geoscience front. Int. J. Earth Sci. Geophys. 2017, 3, 015. [Google Scholar]
  45. Eyinla, D.S.; Oladunjoye, M.A.; Ogunribido, T.H.; Odundun, O.A. An overview of geothermal energy resources in Nigeria. Environtropica 2016, 12, 61–71. [Google Scholar]
  46. Amoo, O.M. Thermodynamic based resource classification of renewable geothermal energy in Nigeria. J. Renew. Sustain. Energy 2014, 6, 033129. [Google Scholar] [CrossRef]
  47. Zira, A.M. Challenges and prospects of geophysical exploration of geothermal system for national development. Acad. J. Interdiscip. Stud. 2013, 2, 137. [Google Scholar] [CrossRef]
  48. Meng, F.; Liang, X.; Xiao, C.; Wang, G. Geothermal resource potential assessment utilizing GIS-based multi criteria decision analysis method. Geothermics 2021, 89, 101969. [Google Scholar] [CrossRef]
  49. Zayed, M.E.; Shboul, B.; Yin, H.; Zhao, J.; Zayed, A.A. Recent advances in geothermal energy reservoirs modeling: Challenges and potential of thermo-fluid integrated models for reservoir heat extraction and geothermal energy piles design. J. Energy Storage 2023, 62, 106835. [Google Scholar] [CrossRef]
  50. Mwaura, D.; Kada, M. Developing a web-based spatial decision support system for geothermal exploration at the Olkaria geothermal field. Int. J. Digit. Earth 2017, 10, 1118–1145. [Google Scholar] [CrossRef]
  51. Kiavarz, M.; Jelokhani-Niaraki, M. Geothermal prospectivity mapping using GIS-based Ordered Weighted Averaging approach: A case study in Japan’s Akita and Iwate provinces. Geothermics 2017, 70, 295–304. [Google Scholar] [CrossRef]
  52. Azizi, S.; Shakibi, H.; Shokri, A.; Chitsaz, A.; Yari, M. Multi-aspect analysis and RSM-based optimization of a novel dual-source electricity and cooling cogeneration system. Appl. Energy 2023, 332, 120487. [Google Scholar] [CrossRef]
  53. Ma, L.; Li, Y.; Wang, J.; Li, S.; Zhao, J.; Li, W.; Zayed, M.E.; Shao, Q.; Sun, M. A thermal-dissipation correction method for in-situ soil thermal response test: Experiment and simulation under multi-operation conditions. Energy Build. 2019, 194, 218–231. [Google Scholar] [CrossRef]
  54. Dung-Gwom, J.Y.; Jugu, A.S. Characteristics and planning challenges of hilltop settlements in Jos Metropolis, Nigeria. UPLanD—J. Urban Plan. Landsc. Environ. Des. 2017, 2, 129–149. [Google Scholar]
  55. Idris, S. Effect of Long-Term Flooding and Landuse under Different Soil Types: On Selected Soil and Groundwater Properties of Hadejia-Nguru Wetland, Nigeria; LAP Lambert Academic Publishing: Saarbrücken, Germany, 2020. [Google Scholar]
  56. Andersen, I.; Golitzen, K.G. The Niger River Basin: A Vision for Sustainable Management; World Bank Publications: Washington, DC, USA, 2005. [Google Scholar]
  57. Macaulay, B. Land degradation in Northern Nigeria: The impacts and implications of human-related and climatic factors. Afr. J. Environ. Sci. Technol. 2014, 8, 267–273. [Google Scholar]
  58. Akinsunmade, A.; Nguyen Dinh, C.; Wojas, A.; Tomecka-Suchoń, S. Characterization of lithological zones of the Isanlu sheet 225, North Central Nigeria, using aerogeophysical datasets. Acta Geophys. 2020, 68, 651–665. [Google Scholar] [CrossRef]
  59. Ekwok, S.E.; Akpan, A.E.; Kudamnya, E.A.; Ebong, E.D. Assessment of groundwater potential using geophysical data: A case study in parts of Cross River State, south-eastern Nigeria. Appl. Water Sci. 2020, 10, 144. [Google Scholar] [CrossRef]
  60. Ejiga, E.G.; Ismail, N.E.H.; Yusoff, I. Implementing digital edge enhancers on improved high-resolution aeromagnetic signals for structural-depth analysis around the middle benue Trough, Nigeria. Minerals 2021, 11, 1247. [Google Scholar] [CrossRef]
  61. Yetano Roche, M.; Verolme, H.; Agbaegbu, C.; Binnington, T.; Fischedick, M.; Oladipo, E.O. Achieving Sustainable Development Goals in Nigeria’s power sector: Assessment of transition pathways. Clim. Policy 2020, 20, 846–865. [Google Scholar] [CrossRef]
  62. Fekete, H.; Kuramochi, T.; Roelfsema, M.; den Elzen, M.; Forsell, N.; Höhne, N.; Luna, L.; Hans, F.; Sterl, S.; Olivier, J. A review of successful climate change mitigation policies in major emitting economies and the potential of global replication. Renew. Sustain. Energy Rev. 2021, 137, 110602. [Google Scholar] [CrossRef]
  63. Iwayemi, A. Investment in electricity generation and transmission in Nigeria: Issues and options. Int. Assoc. Energy Econ. 2008, 7, 37–42. [Google Scholar]
  64. Emovon, I.; Samuel, O.D.; Mgbemena, C.O.; Adeyeri, M.K. Electric Power generation crisis in Nigeria: A Review of causes and solutions. Int. J. Integr. Eng. 2018, 10, 47–56. [Google Scholar] [CrossRef]
  65. Igberaese, T. The Effect of Oil Dependency on Nigeria’s Economic Growth. Master’s Thesis, International Institute of Social Sciences, The Hague, The Netherlands, 2013. [Google Scholar]
  66. Anyaehie, M.C.; Areji, A.C. Economic diversification for sustainable development in Nigeria. Open J. Political Sci. 2015, 5, 87. [Google Scholar] [CrossRef]
  67. Eko-Raphaels, M.U.; Aruwei, P.; Enaruna, D.V.; Ajiboye, A.O.; Apinoko, R. Natural Gas Logistics, Utilization and Impact on Nigeria’s Economic Health: A Simple Empirics. Int. Res. J. Financ. Econ. 2022, 10, 98–105. [Google Scholar]
  68. Ohimain, E.I. Emerging bio-ethanol projects in Nigeria: Their opportunities and challenges. Energy Policy 2010, 38, 7161–7168. [Google Scholar] [CrossRef]
  69. Jalloh, M. Natural resources endowment and economic growth: The West African Experience. J. Nat. Resour. Dev. 2013, 3, 66–84. [Google Scholar] [CrossRef]
  70. Igwe, C.; Adebayo, M.; Olakanmi, O.; Ogbonna, I.; Aina, O. Promoting Wealth and Job Creation in Nigeria—Review of the Role of Entrepreneurship. J. Sustain. Dev. Stud. 2013, 3, 80–100. [Google Scholar]
  71. Damulak, D.D. Nigeria Solid Mineral Resource Potentials: An Overview; University of Nigeria Nsukka: Nsukka, Nigeria, 2017; pp. 5–10. [Google Scholar]
  72. Metu, A.; Nwogwugwu, U.; Okeyika, K. Overview of the Structure of the Nigerian Economy. In Structure and Problems of the Nigerian Economy; Nnamdi Azikiwe University: Akwa, Nigeria, 2019. [Google Scholar]
  73. Jakada, A.H.; Mahmood, S. An asymmetric effect of economic growth, foreign direct investment and financial development on the quality of environment in Nigeria. J. Manag. Theory Pract. (JMTP) 2020, 1, 5–13. [Google Scholar] [CrossRef]
  74. Enahoro, J.A. Design and Bases of Environmrntal Accounting in Oil & Gas and Manufacturing Sector in Nigeria. Ph.D. Thesis, Covenant University, Ota, Nigeria, 2009. [Google Scholar]
  75. Oyedepo, S.O. Towards achieving energy for sustainable development in Nigeria. Renew. Sustain. Energy Rev. 2014, 34, 255–272. [Google Scholar] [CrossRef]
  76. Oji, J.; Idusuyi, N.; Kareem, B. Coal power utilization as an energy mix option for Nigeria: A review. Am. Acad. Sch. Res. J. 2012, 4, 14–19. [Google Scholar]
  77. Ohunakin, O.S.; Adaramola, M.S.; Oyewola, O.M.; Fagbenle, R.O. Solar energy applications and development in Nigeria: Drivers and barriers. Renew. Sustain. Energy Rev. 2014, 32, 294–301. [Google Scholar] [CrossRef]
  78. Oyedepo, S.O.; Babalola, O.P.; Nwanya, S.C.; Kilanko, O.; Leramo, R.O.; Aworinde, A.K.; Adekeye, T.; Oyebanji, J.A.; Abidakun, A.O.; Agberegha, O.L. Towards a sustainable electricity supply in Nigeria: The role of decentralized renewable energy system. Eur. J. Sustain. Dev. Res. 2018, 2, 40. [Google Scholar] [CrossRef] [PubMed]
  79. Odu, G. Weighting methods for multi-criteria decision making technique. J. Appl. Sci. Environ. Manag. 2019, 23, 1449–1457. [Google Scholar] [CrossRef]
  80. Radmehr, B. Preliminary Design of a Proposed Geothermal Power Plant in NW-Sabalan Area, Azerbaijan-Iran; United Nations University: Tokyo, Japan, 2005. [Google Scholar]
  81. Abubakar, A.J.; Hashim, M.; Pour, A.B.; Shehu, K. A review of geothermal mapping techniques using remotely sensed data. Sci. World J. 2017, 12, 72–82. [Google Scholar]
  82. Wambo, J.D.T.; Pour, A.B.; Ganno, S.; Asimow, P.D.; Zoheir, B.; dos Reis Salles, R.; Nzenti, J.P.; Pradhan, B.; Muslim, A.M. Identifying high potential zones of gold mineralization in a sub-tropical region using Landsat-8 and ASTER remote sensing data: A case study of the Ngoura-Colomines goldfield, eastern Cameroon. Ore Geol. Rev. 2020, 122, 103530. [Google Scholar] [CrossRef]
  83. Vaughan, R.G.; Lowenstern, J.B.; Keszthelyi, L.P.; Jaworowski, C.; Heasler, H. Mapping temperature and radiant geothermal heat flux anomalies in the Yellowstone geothermal system using ASTER thermal infrared data. GRC Trans. 2012, 36, 1403–1410. [Google Scholar]
  84. Handcock, R.N.; Torgersen, C.E.; Cherkauer, K.A.; Gillespie, A.R.; Tockner, K.; Faux, R.N.; Tan, J.; Carbonneau, P. Thermal infrared remote sensing of water temperature in riverine landscapes. Fluv. Remote Sens. Sci. Manag. 2012, 1, 85–113. [Google Scholar]
  85. Ramirez, R.; Lee, S.-R.; Kwon, T.-H. Long-term remote monitoring of ground deformation using sentinel-1 interferometric Synthetic Aperture Radar (InSAR): Applications and insights into geotechnical engineering practices. Appl. Sci. 2020, 10, 7447. [Google Scholar] [CrossRef]
  86. Rosen, P.A.; Hensley, S.; Joughin, I.R.; Li, F.K.; Madsen, S.N.; Rodriguez, E.; Goldstein, R.M. Synthetic aperture radar interferometry. Proc. IEEE 2000, 88, 333–382. [Google Scholar] [CrossRef]
  87. Han, J.-Y.; Forster, R.; Moser, D.; Ford, A.; Ramirez-Hernandez, J.; Tiampo, K. The spatial and temporal subsidence variability of the East Mesa Geothermal Field, California, USA, and its potential impact on the All American Canal System. Int. J. Remote Sens. 2011, 32, 3427–3449. [Google Scholar] [CrossRef]
  88. Saada, S.A. Curie point depth and heat flow from spectral analysis of aeromagnetic data over the northern part of Western Desert, Egypt. J. Appl. Geophys. 2016, 134, 100–111. [Google Scholar] [CrossRef]
  89. Elbarbary, S.; Zaher, M.A.; Mesbah, H.; El-Shahat, A.; Embaby, A. Curie point depth, heat flow and geothermal gradient maps of Egypt deduced from aeromagnetic data. Renew. Sustain. Energy Rev. 2018, 91, 620–629. [Google Scholar] [CrossRef]
  90. Bibby, H.; Risk, G.; Caldwell, T.; Bennie, S. Misinterpretation of electrical resistivity data in geothermal prospecting: A case study from the Taupo Volcanic Zone. In Proceedings of the Geological and Nuclear Sciences: Proceedings, World Geothermal Congress, Antalya, Turkey, 24–29 April 2005; pp. 1–8. [Google Scholar]
  91. Munoz, G. Exploring for geothermal resources with electromagnetic methods. Surv. Geophys. 2014, 35, 101–122. [Google Scholar] [CrossRef]
  92. Kana, J.D.; Djongyang, N.; Raïdandi, D.; Nouck, P.N.; Dadjé, A. A review of geophysical methods for geothermal exploration. Renew. Sustain. Energy Rev. 2015, 44, 87–95. [Google Scholar] [CrossRef]
  93. Schiel, K.; Baume, O.; Caruso, G.; Leopold, U. GIS-based modelling of shallow geothermal energy potential for CO2 emission mitigation in urban areas. Renew. Energy 2016, 86, 1023–1036. [Google Scholar] [CrossRef]
  94. van der Meer, F.; Hecker, C.; van Ruitenbeek, F.; van der Werff, H.; de Wijkerslooth, C.; Wechsler, C. Geologic remote sensing for geothermal exploration: A review. Int. J. Appl. Earth Obs. Geoinf. 2014, 33, 255–269. [Google Scholar] [CrossRef]
  95. Mohammadzadeh Moghaddam, M.; Mirzaei, S.; Nouraliee, J.; Porkhial, S. Integrated magnetic and gravity surveys for geothermal exploration in Central Iran. Arab. J. Geosci. 2016, 9, 506. [Google Scholar] [CrossRef]
  96. Ask, M.V.; Ask, D.; Elvebakk, H.; Olesen, O. Stress Analysis in Boreholes Drag Bh and Leknes Bh, Nordland, North Norway. Rock Mech. Rock Eng. 2015, 48, 1475–1484. [Google Scholar] [CrossRef]
  97. Akiishi, M.; Isikwue, B.; Tyovenda, A. Mapping of Depth to Basement in Masu Area of Nigerian Sector of Chad Basin, Using Aeromagnetic and Aerogravity Data. IOSR J. Appl. Geol. Geophys. (IOSR-JAGG) 2018, 6, 36–45. [Google Scholar]
  98. Mohamed, H.S.; Abdel Zaher, M.; Senosy, M.M.; Saibi, H.; El Nouby, M.; Fairhead, J.D. Correlation of aerogravity and BHT data to develop a geothermal gradient map of the Northern Western Desert of Egypt using an artificial neural network. Pure Appl. Geophys. 2015, 172, 1585–1597. [Google Scholar] [CrossRef]
  99. Simiyu, S.M.; Keller, G.R. Seismic monitoring of the Olkaria Geothermal area, Kenya Rift valley. J. Volcanol. Geotherm. Res. 2000, 95, 197–208. [Google Scholar] [CrossRef]
  100. Schmelzbach, C.; Greenhalgh, S.; Reiser, F.; Girard, J.-F.; Bretaudeau, F.; Capar, L.; Bitri, A. Advanced seismic processing/imaging techniques and their potential for geothermal exploration. Interpretation 2016, 4, SR1–SR18. [Google Scholar] [CrossRef]
  101. Young, K.; Reber, T.; Witherbee, K. Hydrothermal exploration best practices and geothermal knowledge exchange on OpenEI. In Proceedings of the 37th Workshop on Geothermal Reservoir Engineering, Stanford, CA, USA, 30 January–1 February 2012; pp. 1–13. [Google Scholar]
  102. Schill, E.; Meixner, J.; Meller, C.; Grimm, M.; Grimmer, J.C.; Stober, I.; Kohl, T. Criteria and geological setting for the generic geothermal underground research laboratory, GEOLAB. Geotherm. Energy 2016, 4, 7. [Google Scholar] [CrossRef]
  103. Gasperikova, E.; Cumming, W. How geophysics can help the geothermal industry. In Proceedings of the SEG International Exposition and Annual Meeting, Virtual, 11–16 October 2020; OnePetro: Richardson, TX, USA, 2020. [Google Scholar]
  104. Sabrian, P.G.; Saepuloh, A.; Kashiwaya, K.; Koike, K. Combined SBAS-InSAR and geostatistics to detect topographic change and fluid paths in geothermal areas. J. Volcanol. Geotherm. Res. 2021, 416, 107272. [Google Scholar] [CrossRef]
  105. Mia, M.B.; Nishijima, J.; Fujimitsu, Y. Exploration and monitoring geothermal activity using Landsat ETM+ images: A case study at Aso volcanic area in Japan. J. Volcanol. Geotherm. Res. 2014, 275, 14–21. [Google Scholar] [CrossRef]
  106. Didana, Y.; Thiel, S.; Heinson, G. Three dimensional conductivity model of the Tendaho high enthalpy geothermal field, NE Ethiopia. J. Volcanol. Geotherm. Res. 2015, 290, 53–62. [Google Scholar] [CrossRef]
  107. Macharia, M.W.; Gachari, M.K.; Kuria, D.N.; Mariita, N.O. Low Cost Geothermal Energy Indicators and Exploration Methods in Kenya; Geothermal Energy Training and Research Institute (GeTRI): Vadodara, India, 2017. [Google Scholar]
  108. Majumdar, D.; Devi, A. Oilfield geothermal resources of the Upper Assam Petroliferous Basin, NE India. Energy Geosci. 2021, 2, 246–253. [Google Scholar] [CrossRef]
  109. Grant, M. Geothermal Reservoir Engineering; Elsevier: Amsterdam, The Netherlands, 2013. [Google Scholar]
  110. Sircar, A.; Shah, M.; Sahajpal, S.; Vaidya, D.; Dhale, S.; Chaudhary, A. Geothermal exploration in Gujarat: Case study from Dholera. Geotherm. Energy 2015, 3, 22. [Google Scholar] [CrossRef]
  111. Arnous, M.O. Groundwater potentiality mapping of hard-rock terrain in arid regions using geospatial modelling: Example from Wadi Feiran basin, South Sinai, Egypt. Hydrogeol. J. 2016, 24, 1375–1392. [Google Scholar] [CrossRef]
  112. Noorollahi, Y.; Itoi, R.; Fujii, H.; Tanaka, T.; Motooka, N.-k. Geothermal resources exploration and wellsite selection with environmental consideration using GIS in Sabalan geothermal area, Iran. In Proceedings of the 32nd Workshop on Geothermal Reservoir Engineering, Stanford, CA, USA, 22–24 January 2007; pp. 22–24. [Google Scholar]
  113. Dürrast, H.; Ngansom, W. Integrated geophysical and geochemical investigations on the high-salinity geothermal waters of the Khlong Thom Hot Spring tourist attraction in Krabi, southern Thailand. Geosci. J. 2022, 26, 621–635. [Google Scholar] [CrossRef]
  114. Elbarbary, S.; Abdel Zaher, M.; Saibi, H.; Fowler, A.-R.; Saibi, K. Geothermal renewable energy prospects of the African continent using GIS. Geotherm. Energy 2022, 10, 8. [Google Scholar] [CrossRef]
  115. Engle, M.A.; Nye, C.W.; Neupane, G.; Quillinan, S.A.; McLaughlin, J.F.; McLing, T.; Martín-Fernández, J.A. Predicting Rare Earth Element Potential in Produced and Geothermal Waters of the United States via Emergent Self-Organizing Maps. Energies 2022, 15, 4555. [Google Scholar] [CrossRef]
  116. Murray, J.; Clément, A.; Fritz, B.; Schmittbuhl, J.; Bordmann, V.; Fleury, J.M. Abiotic hydrogen generation from biotite-rich granite: A case study of the Soultz-sous-Forêts geothermal site, France. Appl. Geochem. 2020, 119, 104631. [Google Scholar] [CrossRef]
  117. Güleç, N.; Hilton, D.R. Turkish geothermal fields as natural analogues of CO2 storage sites: Gas geochemistry and implications for CO2 trapping mechanisms. Geothermics 2016, 64, 96–110. [Google Scholar] [CrossRef]
  118. Aich, A. Preliminary studies on soil radon activity at geothermal hotspot of Bakreswar-Tantloi. IOP SciNotes 2022, 3, 025201. [Google Scholar] [CrossRef]
Figure 1. Modelling framework for selecting potential sites for geothermal energy studies in Nigeria.
Energies 16 07602 g001
Figure 2. Overall geothermal suitability map.
Energies 16 07602 g002
Figure 3. The land mass of the suitable grids.
Energies 16 07602 g003
Figure 4. Suitability scores of (A) remote sensing; (B) geophysical; (C) geological; (D) well log; (E) geochemical; and (F) environmental baseline datasets in Nigeria.
Energies 16 07602 g004aEnergies 16 07602 g004b
Figure 5. The results of the sensitivity analysis of (A) double weighting and (B) half weighing, reflecting changes in the weights of the key criteria.
Energies 16 07602 g005
Table 1. Weights under different scenarios.
ScenarioCriteria 1–5Criteria 6–48
10.0208330.020833
20.0416670.018411
30.0104170.022045
Disclaimer/Publisher’s Note: The statements, opinions and data contained in all publications are solely those of the individual author(s) and contributor(s) and not of MDPI and/or the editor(s). MDPI and/or the editor(s) disclaim responsibility for any injury to people or property resulting from any ideas, methods, instructions or products referred to in the content.

