Abstract
Land consolidation in rural areas is greatly influenced by a number of social, agricultural, and economic factors. They extend the time and complicate activities related to the implementation of this project. Land consolidation is a huge investment, requiring a good and up-to-date map. Up-to-date data that reflects reality are the basis for good and efficient land consolidation in rural areas. To improve the creation of a land consolidation project, the most appropriate solution would be to place all the necessary data to create a land consolidation project on “geoportals” websites. Providing data on the websites of geoportals in Poland and Finland in the form of a map portal would enable both visual and substantive analysis of spatial changes in rural areas. Therefore, this article pursues two main scientific goals. The first purpose of this article is to analyze the history and scope of land consolidation in Poland and Finland in order to learn the specifics of land consolidation in a given country. Comparisons and analyses were made on the basis of the authors’ experience in Poland and Finland with land consolidation in the areas described. The second scientific goal of the article is to compare the availability of geospatial data in the context of the methodology of performing land consolidation in rural areas, which leads to increased energy efficiency in agricultural production by reducing the need for energy, especially fuel for agricultural machinery. The results from the table with a list of geoportals in Poland and Finland are a summary of the data available for free. Thanks to it, land consolidation contractors around the world will have the opportunity to familiarize themselves with and perhaps use this data when creating a rural land consolidation project. Good land consolidation planning will lead to effective and economical use of rural space. This is part of the 2030/2050 strategy. Reducing agricultural production costs, lower fuel consumption, and a smaller carbon footprint. This is what Poland and Finland are striving for as countries belonging to the European Union.
1. Introduction
As outlined in the [1] study, agriculture is one of the least digitized human activity industries. The higher the level of digitisation, the easier it is to monitor production processes and improve activity indicators, including efficiency [2,3,4]. Food production and agriculture have an important role in maintaining biodiversity and rural landscapes. In addition to its positive effects, agriculture also has adverse environmental impacts on soil, water systems, and the atmosphere [5]. There are a number of factors in agricultural production that farmers have no control over on a macro scale (e.g., country or region) [6], such as temperature or rainfall. Along with soil quality, they are key parameters affecting the efficiency of agricultural production. In order to increase efficiency/profitability, one can either focus on raising yields or lowering production costs. In the first approach, the focus will be on adequate soil moisture, temperature regulation, and proper soil fertilisation. However, each of these activities increases energy requirements. On the other hand, production costs can be minimized by optimizing the shape of farms and the shape of individual plots themselves, which can be achieved by implementing an agricultural land consolidation project. In the land consolidation project, properly designed agricultural transport roads will change the number of kilometers that must be traveled by agricultural machinery. Such an action directly translates into a change in the amount of fuel needed to operate the farm, thus increasing energy efficiency in agricultural operations and reducing the carbon footprint [7,8,9,10].
Therefore, this article pursues two main scientific goals. The first purpose of this article is to analyze the history and scope of land consolidation in Poland and Finland in order to learn the specifics of land consolidation in a given country. The second scientific goal of the article is to compare the availability of geospatial data in the context of the methodology of performing land consolidation in rural areas, which leads to increased energy efficiency in agricultural production by reducing the need for energy, especially fuel for agricultural machinery. Comparisons and analyses were made on the basis of the authors’ experience in Poland and Finland with land consolidation in the areas described.
2. Literature Review
2.1. Geostaptial Datasets and Information
Modern geomatics technologies are used in various tasks related to mapping the natural environment. LiDAR laser scanning can be used both for inventory measurements, describing reality as presented in papers [11,12], as well as for long-term activities, i.e., monitoring [13,14]. In environmental issues, there is often a need to use multi-source data, examples of which can be found in papers [15,16,17,18]. Data integration also occurs in the area of cultural heritage, examples of which can be found in papers [19,20]. The aforementioned LiDAR technology is also very often used in surveying for the acquisition of geometrical source data for cultural heritage [21,22]. An extension of the above-mentioned documentation are BIM/HBIM models, examples of which can be found in [23]. Qualitative aspects in [24], accuracy aspects in [25] or the image-based approach in [26].
The geospatial data obtained in this way are the basis for spatial management [27,28], or cultural heritage [29,30].
An important aspect of having and using geospatial data are also making it available to other entities, scientific units, or the general public. For this reason, publications [31,32,33,34] seem relevant.
The utilitarian aspect of the research should not be overlooked either. In this context, it is worth citing works that could not have been produced without linking the research carried out to the space. These are: noise [35], land consolidation [36], cadastral works [37,38], displacement [39], air quality [40], land use [41], or building monitoring [42].
2.2. Land Consolidation
The level of development of consolidation work in two countries—Poland and Finland—is presented below. The use of digital geospatial data for the planning and implementation of consolidation work were taken as an indicator of the level of development. Due to the history of implemented projects in Poland, where the use of digital geospatial data are lower, the assessment of the effects of consolidation is mainly based on geometric indicators [43,44,45]. In contrast, in Finland, where the history of consolidation work is more than 260 years old, areas are being consolidated once again, assessing the effect mainly in terms of economics.
Almost 100 years of land consolidation development in rural areas that took place in Poland show the multi-criteria nature of this procedure [46]. EU funding helps to improve, among others, the area structure of agricultural land in the European Union (EU) countries [47,48,49]. The agricultural area in EU countries covers almost half of the land of the whole country [50]. In 2015, agricultural land was estimated to cover 42% of all EU land area [51].
Figure 1 shows the agricultural area as a percentage of the total area in individual EU countries. Blue columns: agricultural area in% (scale on the left side of the chart) and size of agricultural area in 1000 hectares—red dots (scale on the right side). The agricultural area is the area that may be included in land consolidation work.
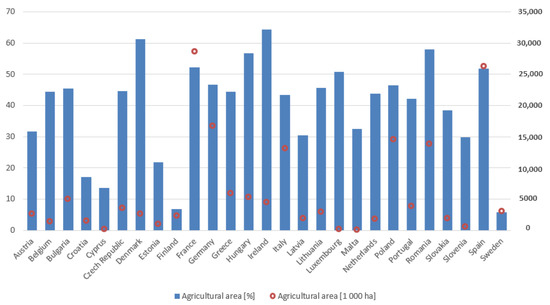
Figure 1.
Agricultural area from the total area in individual EU countries. Source: own study based on data from the FAO Estimate, 2019 [52].
Poland takes 9th place out of 27 EU member states, where 1st place is the largest percentage of agricultural area in relation to the country’s area. Notice that Finland and Sweden have a low percentage. For example, Finland has the same amount of agricultural land as Denmark. Because Finland and Sweden are large countries with large amounts of forests, their percentage here is low. Also, agricultural areas both in Sweden and Finland are concentrated in the southern parts, where municipal or provincial-level percentages can be high.
Additionally, the high fragmentation of the agricultural area in Poland makes us one of the leading countries that urgently needs land consolidation in rural areas [44,53,54,55,56]. The problem of excessive land fragmentation affects many countries. One can read in the literature that it occurs, among others, in Bulgaria [57,58], in the Republic of Belarus [59], in Cyprus [60], in the Czech Republic [61], in Estonia [62], in Finland [63,64], in Hungary [65], in Latvia [66], in Lithuania [67], in Slovakia [68], in Spain [69], in The Netherlands [70,71], and in Ukraine [72].
In Poland, since 2008, the number of cadastral plots has been systematically increasing. Over the past 12 years, the number of cadastral plots has increased by over 3 million. The number of cadastral plots is systematically increasing as a result of dividing real estate. In Finland, agricultural plots are only a small minority of cadastral plots; this number does not show fragmentation at agricultural plots. In Finland, they follow agricultural administration IACS-systems information en masse to show real cultivated parcels (regardless of ownership). We can eliminate the fragmentation of land through comprehensive land consolidation in rural areas. In this article, the areas with the highest fragmentation index are south-eastern Poland and south Finland. It is worth mentioning here that, in Finland, we also perform land consolidation in forests. Agricultural land consolidations often exclude forests, but they can be part of agricultural land consolidation if needed. Nowadays, preparing a land consolidation project requires the use of geospatial data.
2.3. The Impact of Land Consolidation on Energy Efficiency
The land consolidation processes in Poland focus not only on the geometric and location aspects of the farm but also, to a greater extent, on translating these into economic and ecological aspects. Such activities are in line with the directions of the European Green Deal and will certainly translate into reduced energy consumption and a lower carbon footprint [9,73]. Authors [74] suggest that moderate changes in food diets and land use in Finland can reduce GHG emissions from agriculture by more than 40% by 2050. In the period 2021–2030, the collective target of EU Member States is to reduce greenhouse gas emissions by 30% from the 2005 level by 2030 [5].
Better road planning in the land consolidation project will result in reduced agricultural production costs, lower fuel consumption, and a smaller carbon footprint. The basic elements of transport infrastructure are agricultural roads (access to fields). Hence, the high share of agricultural transport costs can be reduced through an appropriate system of these [75] roads. Each newly separated cadastral plot in the land consolidation in rural areas must have access to a public road. Consequently, the road infrastructure in a land consolidation project is extremely important. The road network density indicator is often mentioned by communes as the most important consolidation effect [46]. A very important effect of land consolidation in rural areas is post-merger management, including the arrangement and modernisation of “agricultural transport roads,” which provide access to each registration plot [46]. The paper [75] describes the influence of the distribution—the arrangement of fields in relation to the economic center—on the distance and the expenditure incurred in internal transport. The conclusions from these studies are as follows: Fuel consumption costs are 92.25% [75] lower after consolidating land and arranging all cadastral plots around the farm.
So, as we read above, good land consolidation planning will lead to effective and economical use of rural space. This is part of the 2030/2050 strategy. Reducing agri-cultural production costs, lower fuel consumption, and a smaller carbon footprint. This is what Poland and Finland are striving for as countries belonging to the European Union. In EU countries with socio-economic development, the economic and energy efficiency of agriculture is increasing [76].
3. Level of Development of Land Consolidation and His Historical Background
3.1. History of 100 Years of Land Consolidation in Poland
The complexity of the land consolidation procedure in rural areas in terms of legal regulations took the form of independent acts only in the interwar period. The almost 100-year history of the legal basis for land consolidation is presented in the timeline marked in Figure 2.
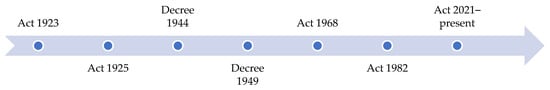
Figure 2.
A total of 100-year history of legal grounds for land consolidation in Poland. Source: own study.
The first law in Poland regulating the issue of land consolidation in rural areas was the Act of 1923 on land consolidation [77]. Consolidation works were carried out within the limits of one village. During consolidation works, the area of small (dwarf) farms was increased, and, if necessary, by parceling out the necessary areas in accordance with the provisions of the Act of 1925 on the implementation of the agricultural reform [78]. This reform legally sanctioned changes in ownership relations combined with a change in the agrarian structure through consolidation or parceling of land. The agrarian question was one of the most important political and economic problems in Poland in the early 1920s. The problem of land “hunger” among Polish peasants in the former Austrian and Russian partitions was particularly acute.
Consolidation works in Poland were undertaken in 1923, and their intensification occurred at the end of the twenties of the twentieth century. These works were interrupted by the outbreak of World War II. They were continued after the end of the war within the changed borders of the country and changed political conditions, based on the Act of 1923 and taking into account the decree of the Polish Committee of National Liberation on the implementation of the agricultural reform introduced in 1944 [79].
The social effect of the agricultural reform carried out in 1944 was the liquidation of the landed gentry as a social class [79]. However, the structure of agricultural ownership, due to the limited amount of land to be divided and the huge number of people willing to purchase it, has not changed much. Peasant farms still remained fragmented in southern and south-eastern Poland. Farms established as a result of the agricultural reform had an area of 3 to 4 ha.
The decree of 1949 on the exchange of land, which was implemented, brought about changes [80]. At the end of 1949, the Minister of Agriculture and Agrarian Reforms suspended land consolidation due to the agricultural policy of the time, which aimed at collectivizing agriculture. In the years 1949–1954, various forms of agricultural cooperatives were created, which had a large impact on the spatial structure of land. During the establishment of agricultural production cooperatives, land exchanges were carried out and farm plots were allocated for members of the cooperative. In Poland, after 1956, most of the cooperatives were dissolved, and the “cooperative” of the villages failed.
In 1968, the liquidation of the patchwork of land was started again, based on the new Act on land consolidation and exchange [81], adopted that year. In addition to the objectives contained in the Act of 1923, the Act introduced a new concept of land exchange and created legal grounds for improving the spatial conditions for the functioning of both State Farms and Agricultural Production Cooperatives [81]. In Poland, in the years 1968–1983, on an area of 3,910,700 hectares of land in 11,515 villages, land consolidation works were carried out. As can be seen from Figure 3, the largest number of land consolidations and exchanges were carried out during this period. As a result of these works, defective land systems were transformed on 20.5% of the country’s agricultural land. In the period from 1979 to 1983, in the new administrative division, the size of consolidation and replacement works throughout the country decreased.
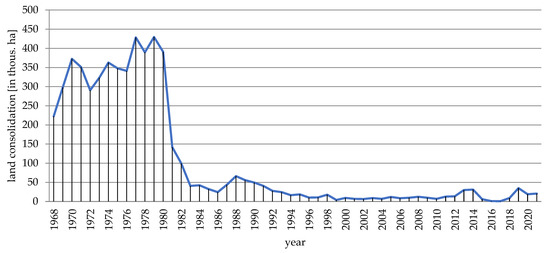
Figure 3.
Scope of land consolidation in Poland in 1968–2021. Source: [36].
The 1980s brought further changes. The political transformation included, among others, regulations concerning the agricultural sector. The result of these changes is the Act of 1982 on land consolidation and exchange [82]. As shown in Figure 3, the scope of consolidation and exchange work in the 1980s was negligible. Only in 1989 was land merged and exchanged in an area of over 55,750 ha. The needs of consolidation works are huge, and yet these works are performed on a smaller and smaller scale. In 2016, land consolidation and exchanges were carried out in an area of only 932 ha.
Since 1968, only 5,592,126 ha in Poland have been consolidated, which is 17.9% of the administrative area of Poland. As shown in Figure 3, most land consolidation in rural areas was carried out in the 1970s. Later, the area of land consolidation decreased. Since 1 May 2004, Poland has been a member of the European Union (EU). Therefore, Poland received subsidies for land consolidation in rural areas under EU programs. These programs are presented in detail in Figure 4. As can be seen in Figure 4, in 2013–2014, at the end of the RDP 2007–2013 program, and in 2019 of the RDP 2014–2020 program, the area of unalloyed land in Poland slightly increased.
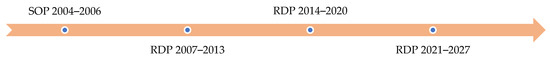
Figure 4.
EU programs for land consolidation in Poland. Source: own study.
According to [45], the demand for consolidation work is very high. The greatest demand for over 50% of the area of communes occurs in south-eastern Poland [83,84,85] including in the Podkarpackie voivodeship [86].
3.2. History of Land Consolidation in Finland
Finnish land consolidation has its origins in the Swedish Basic Land Consolidation. In the year 1757, the Swedish Crown ordered basic land consolidation (isojako in Finnish) procedures to be performed in the whole kingdom (Figure 5). During that time, Finland was a part of the Kingdom of Sweden. Basic land consolidations started in the coastal regions of Finland, although officials often faced strong resistance from local villagers and farmers. The main reason for the basic land consolidations was the establishment of independent farms that could pay taxes. Another benefit of basic land consolidation was the mapping of all agricultural land. During the centuries, basic land consolidations advanced through Finland, and in 1960, the last basic land consolidation procedure was completed in Kuusamo, North-Eastern Finland [63].
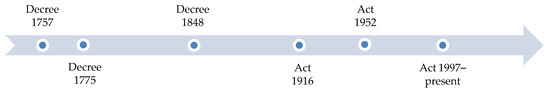
Figure 5.
History of legal grounds for land consolidation in Finland. Notice that when Finland moved in 1809 from the Swedish Kingdom under the Russian Empire, land surveying legislation remained Swedish until 1848, when it became purely Finnish, albeit in many parts copied from Sweden. Source: own study.
After Finland was separated from Sweden in 1809, some differences in land consolidation procedures started to appear between these two nations. During the 1800s, there was a widespread understanding in professional circles in Finland that the first basic land consolidations had not been conducted as well as they should have been. Often, a scattered parcel structure remained. Old Swedish legislation that was in many cases still valid in Finland allowed the arrangement of basic land consolidation to be carried out, and the late 1800s saw a boost in these arrangements. By 1918, the total area arranged by this type of project was 1,547,590 hectares in the whole of Finland [63].
From the beginning of the year 1917, new purely national legislation was in force, and now a new name has emerged for this kind of land rearrangement. The new name was in Finnish, uusjako. The translation of this term is not without problems. Literally, uusjako can be translated as New Land Consolidation meaning land consolidation that is conducted after the Basic Land Consolidation. After a hundred or more years had passed since Basic Land Consolidations and restrictions on farm parceling were lifted, the term uusjako started to mean more or less the same thing as Land Consolidation. The meaning of the term has evolved during the nearly one hundred years that it has been used in Finnish legislation. All this time, there was also the Finnish term tilusjärjestely. This term means land consolidation in a broader sense, and it includes all types of Land Consolidations and, for example, arrangements conducted in conjunction with other cadastral surveys, such as parceling [63].
During the early 1900s Land Consolidations was concentrated in the southern and southwestern agricultural areas of Finland. The projects were large and ambitious. Often, projects included whole villages with fields and forests, often covering a total area of more than 10,000 hectares. Hearings with landowners were formal, and projects did not have to have the approval of landowners. During the period 1918–1980, the total area arranged in land consolidations was 891,000 hectares. As with basic land consolidations, land consolidations advanced through the agricultural heartlands of Finland. This time, Eastern and Northern Finland were excluded because the settlements were of a different type. In Eastern and Northern Finland, farms were and still are often alone in the forest, far apart from each other, so that a scattered parcel structure was a rarity [63].
In the 1990s, land consolidations were concentrated in western Finland, in an area roughly between the cities of Vaasa and Oulu. The reason for this concentration was the strong agriculture in the region and the scattered parcel structure in these areas. In other areas of Finland, the last land consolidations were completed during the 1980s, and land consolidation activity died down despite some efforts to start new projects. At the beginning of the millennium, there was pressure to reform the Land Consolidation process. The strong opposition of landowners and the inefficiency of the old Land Consolidation procedure were evident. Development led to a process that was more customer-driven and project areas that were smaller than earlier, although there were no legislative changes [63,87].
From 1757 to the present day, Land Consolidation in Finland has been a cadastral surveyor-driven process. The land surveyor was and is the chairman and key decision-maker for the project. The role of the land surveyor is similar to that of a court judge in the European (Roman) court system. Since the year 1972, land surveyors have been civil servants at the National Land Survey of Finland (NLS). Decisive legal decisions are made by a land surveyor and two trustees appointed by the municipal council. Often, trustees are from another municipality to avoid improper connections between trustees and landowners. The new process that was implemented in the first years of the new millennium emphasized landowner opinion and one-on-one negotiations between the landowner and land surveyor [63].
The new process has led to a new boom of land consolidations in Finland. New projects have started, and now land consolidation activity has expanded to the regions of Satakunta, Pirkanmaa, Kymenlaakso, Northern Savonia, North Karelia, and Uusimaa. The average project area is 1000 hectares, and the average project time has been reduced to five years. Projects include building operations such as ditching, the building of underground drainage, and agricultural roads. Projects were subsidised by the Ministry of Agriculture and Forestry. During the period 2002–2014, roughly 50–70% of project costs were paid by the Finnish government [63].
Finland joined the European Union in 1995. The Finnish approach to the Common Agricultural Policy (CAP) reflected a necessity to compensate for the competitive disadvantages of the agrarian sector. Farm support is more important in Finland than in other EU countries because of its unfavourable production conditions. Because the CAP does not consider northern agriculture with small farms as a priority, national support is of great importance [88]. During accession negotiations, the Finnish government and the European Union agreed that Finland could not use EU funds to implement land consolidations; therefore, rural development projects around land consolidation issues have focused on spreading information to landowners and farmers. Inside the EU, Finland has streamlined land consolidation subsidies to fit EU regulations. In Finland Land Consolidation can start in two different ways. Agricultural and forest land consolidations can start only with the initiative of the landowners. Project land consolidation can start with the application of the public entity that is implementing the project. For example, such an entity can be a Traffic Infrastructure Agency or an Environmental authority. Project land consolidation has always had some public project, for example, a railway, highway, or environmental protection area, to implement. Currently, there are 58 agricultural and forest land consolidations either in the preliminary survey phase or in implementation, and six project land consolidations are in implementation (Figure 6).
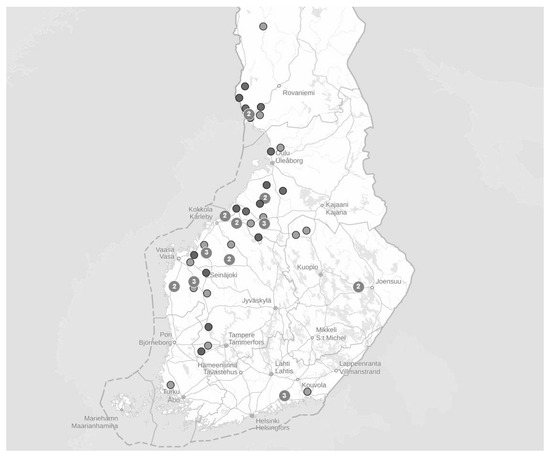
Figure 6.
Location of land consolidation in Finland—dots. Dot with number for example “3” mean—“3 consolidation objects at this location visible at the given map scale”. There are currently 58 consolidations of agricultural or forestry land, both in the initial land consolidation study phase and in the implementation phase. NLS Finland 2023. Source: own study.
3.3. Statistical Characteristic Areas to Be Consolidated in Poland and Finland
Detailed research covered areas to be consolidated in Poland and Finland. As shown in Table 1 and Figure 7, country areas are similar in size. Finland is 2,577,000 ha larger than Poland. The land area is larger in Poland; it is 97.90% of the country’s area. In Finland, agricultural land is only 6.72% of the country’s area because the areas excluded from land consolidation are forests, and there are as many as 66.21% of the country’s area. It is worth mentioning here that, in Finland, we also perform land consolidation in forests. Agricultural land consolidations often exclude forests, but they can be part of agricultural land consolidation if needed. Agricultural land, which may be subject to consolidation, covers 46.45% of Poland’s territory, while forest area covers 30.29% of the country. If we analyse the potential participants in consolidation, the land of natural persons in Poland covers 59.39% of the land area of the country. Population density in land consolidation works is also important because the more inhabitants in a village covered by land consolidation works, the more land consolidation participants there are. Thus, in Poland, the population density is 121.4 inhabitants/km2, and in Finland, it is only 16.3 inhabitants/km2.

Table 1.
Research object—Poland and Finland.
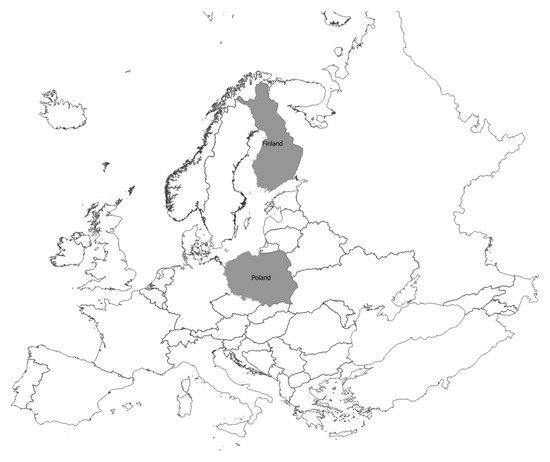
Figure 7.
Location of the research object—Finland and Poland—against the background of other countries. Source: own study.
4. Materials and Databases
This chapter briefly describes the databases and public registers that will be further compared in the context of Poland and Finland. They are summarized in Table 2, Table 3 and Table 4. The ID (A1, B1, etc.) in the first column corresponds to the description paragraph before the table.
Table 2.
Characterisation of the spatial databases—Ownership and Land Use/Land Cover.
Table 3.
Characterisation of the spatial databases—anthropogenic objects and infrastructure.
Table 4.
Characterisation of the spatial databases—terrain and other datasets.
All this requires geospatial and geodetic data. Therefore, the authors undertook the analysis of data necessary for land consolidation. Data available on portals in Poland [91] and Finland [92] were analyzed; details are presented in Table 2, Table 3 and Table 4.
Column 1 contains the ID, which refers to the subject group (letter) and the next item (number). It also allows you to refer to the description in Chapter 4. Column 2, meanwhile, contains the name, briefly describing the contents of the database. Columns 3 and 4 give the specific names of the databases, the source of the data, or the institution responsible for maintaining the database, for Poland and Finland, respectively. Columns 5 and 6 contain information about the native type of data contained in the database—raster/vector/etc. Columns 7 and 8 indicate the source of the data, i.e., whether it is available from an official source—office; agency; etc.—or from a private contractor/company; or possibly with what services the data are available for downloading/viewing—WMS/WFS. Columns 9 and 10 show the situation with regard to payment for the data—paid or free of charge. If available free of charge, is it open access or under some conditions/for specific purposes? Columns 11 and 12 provide information on the geometric parameters of the products, such as accuracy, resolution, or scale-prepared studies/maps. On the other hand, columns 13 and 14 provide information on the timeliness of the various sets/records and how/mode, and frequency they are updated. The last four columns contain the author’s assessment of the use of geospatial data sets in the land consolidation process. The 15th and 16th columns correspond to current use, while the 17th and 18th columns correspond to potential use. A scale from 1 to 5 was adopted, where 1 means “not important data sets, not used in analysis or used from time to time” or “data sets have a low potential of use in land consolidation analysis,” while 5 means “very important data sets, basic data sets for most analysis” or “data sets have a great potential of use in land consolidation analysis.”
The abbreviations used are described below in Table 4. In places in the table that require more elaboration, references (comX) have been made to the descriptions below Table 4.
4.1. Characterisation of the Spatial Databases—Ownership and Land Use/Land Cover
A number of geospatial databases are maintained in both Poland and Finland. They are of value to users if they are up-to-date, reliable, complete, consistent thematically and area-wise, accurate, and are maintained continuously. Brief descriptions of the individual datasets are therefore collected below. These will give future users of these datasets a quick overview of what datasets are available in a particular country and which they can use for their own research. Details of ownership and Land Use/Land Cover are presented in Table 2.
A1 Ownership
EGiB (PL)—the register of land and buildings is kept by “starosts;” which means that, as a result, we have 380 units responsible for running this database in all of Poland. EGiB data, and in particular data on cadastral plots, are the basic reference data for the presentation of various other objects stored in spatial databases. The level of detail corresponds to a map on a scale of 1:500. Nominal accuracy for the vertex of border point buildings consists of the first group of accuracy—better than 10 cm. By law, the whole EGiB should be in digital form—vectors + attributes.
The NLS-FI INSPIRE Cadastral Parcels Theme Dataset (FIN) is a dataset depicting the Cadastral Parcels and Basic Property Units covering the whole of Finland. It contains the following INSPIRE feature types: BasicPropertyUnit, CadastralParcel, and CadastralBoundary. The elements are updated weekly. The dataset is based on the NLS Cadastral Index Map database. The dataset is available via the NLS-FI INSPIRE Download Service (WFS) for Cadastral Parcels Theme, and it can be viewed via the NLS-FI INSPIRE View Service (WMS) for Cadastral Parcels. Spatial resolution: 1:10,000.
There are also 9 layers in the theme Cadastral Parcels on the Finish “Paikkatietoikkuna.” Some of them are without metadata—National Cadastral References or Cadastral Boundaries. There are also regional data sets: the Cadastral Map of the City of Helsinki (1:4000; see also on [93] and Real Estates in Tampere (1:20,000).
B1 Land Use/Land Cover
On Finish geoportal [92] there are 218 layers in the Land Use theme and 423 layers in the Land Cover theme. In the Land Cover theme, there is a lot of information about trees: biomass broken down into individual parts of trees, with the distinction of tree species, volume, canopy height model, stand age, data sets from the multi-source national forest inventory, site fertility class, and LPIS data sets (“Ruokavirasto”). There are visualisations of the Corine Land Cover database in raster (GSD 25 m) and vector (MMU 25 ha) versions.
CORINE LAND COVER (PL and FIN)—The essence of the CORINE Land Cover (CLC) program is to provide up-to-date information on land cover/land use throughout Europe in a regular cycle and to demonstrate changes between successive cycles. There are data sets from 1990, 2000, 2006, 2012, and 2018 supervised by the European Environment Agency (EEA). The direct contractor for the implementation of the CLC1990, CLC2000, CLC2006, and CLC2012 projects in Poland was the Institute of Geodesy and Cartography (IGiK), which also acts as one of the EIONET National Reference Centers for land cover. The dataset for all of Finland has been produced by the Finnish Environment Institute (SYKE).
URBAN ATLAS (PL and FIN) The Urban Atlas provides pan-European comparable land cover and land use data covering a number of Functional Urban Areas (FUA). Since 2012, in UA, there has been information about LULC for the capital cities and an additional 870 cities—developed for the most populous European cities (most cities with over 50,000 inhabitants). This is a local component coordinated by the European Environment Agency. The Urban Atlas is composed of a suite of products that encompasses: Land Cover Land Use products in Functional Urban Areas (FUA), Street Tree Layer produced within the level 1 urban mask for each FUA (all classes starting with code “1”), Population estimates per Urban Atlas polygons, and Building Block Height in cities in a 10 × 10 m grid [94].
BDOT500 (PL)—The Database of Topographic Objects is a set of spatial data that serves as a reference point for various thematic studies and enables the sharing of topographic information. It contains information about all objects on the ground, like buildings and objects permanently attached to the building, fences, communication, land use, sport and recreation, water, and terrain. BDOT500 is a detailed spatial database that corresponds to a 1:500 master map. It is established for urban and rural areas, divided into 380 units responsible for running this database in all of Poland. Nominal accuracy for the objects consists of the first group of accuracy—better than 10 cm. By law, the whole BDOT500 should be in digital form—vectors + attributes.
BDOT10k (PL)—The Database of Topographic Objects; whose level of detail corresponds to a map in scale 1:10,000. BDOT10k collects information on topographic objects, including their spatial location in the applicable national reference system and their characteristics, as well as cartographic codes and object metadata. BDOT10k is created on the basis of the EGiB, GESUT, and BDOT500 databases and other state registers. So, the accuracy of the object is like the accuracy of the source databases. One of the most important parameters determining the suitability of a data set for individual analyses is geometric accuracy. As for the accuracy of recording the coordinates of intermediate points/nodes, or geometric invariants, it is identical in both databases and amounts to 1 cm. The significant difference is the minimum distance between any two vertices (intermediate points of a line or an area). In the BDOT10k database, it is 2 m, unless given objects come from external registers with greater accuracy or if a distance less than 2 m is needed for the proper presentation of the object shape. The scope of information includes the following categories of objects: water supply networks, communication networks, networks of utility lines, land cover, structures and devices, land use complexes, protected areas, territorial division units, and other objects.
The Topographic map (FIN) is a dataset depicting the terrain of all of Finland. The key elements in it are the road network, buildings and constructions, geographic names, waterways, land use, and elevation. The more precise levels of the Topographic map consist of the same map objects and map symbols depicted in the same way as in the familiar basic map. A basic map raster is applicable to be used, for instance, as a base map for planning land use or for excursion and outdoor recreational purposes on mobile devices and in various Internet services associated with nature. The product belongs to the open data of the National Land Survey of Finland.
Basic map raster 1:10,000 and Topographic map raster 1:50,000 are produced from the National Land Survey’s topographic database. Topographic map raster 1:100,000 and 1:250,000 are produced from the following datasets in vector format: Topographic map 1:100,000 and Topographic map 1:250,000. Topographic map raster 1:500,000 is produced from the vector dataset: Topographic map 1:1,000,000. Topographic map raster 1:1,000,000 is produced from the following vector dataset: Topographic map 1:1,000,000. Topographic map raster 1:2,000,000, 1:4,500,000, and 1:8,000,000 are produced from the following vector dataset: Topographic map 1:4,500,000. The updating frequency of the scales in the Topographic map series varies depending on the feature [92].
B2 Land Use/Land Cover
IACS is the main database used for land consolidation surveys in Finland. The IACS register is maintained by the Finnish Food Agency and farmers themselves. This is the first year that farmers obtain correction notices from the mobile app if there is an error in their IACS information, and they can submit corrections from the mobile app directly. National and EU subsidies to farmers are delivered through the IACS register.
Single-frequency GNSS receivers are used during direct subsidy control measurements in Poland. Their localisation accuracy for a single point is relatively low (1–3 m). However, when it comes to area measurement, it is surprisingly good and meets the accuracy guidelines prepared for this type of measurement [95].
4.2. Characterisation of the Spatial Databases—Anthropogenic Objects and Infrastructure
The data in groups C and D represent anthropogenic objects with distinct shapes and edges. For this reason, the precision of determining their location is decidedly higher than that of natural objects. Details about anthropogenic objects and infrastructure are presented in Table 3.
C1 Buildings
EGiB and BDOT500—see A1. The NLS-FI INSPIRE Buildings (FIN) Theme Dataset is a dataset depicting the buildings covering the whole of Finland. It contains the following INSPIRE feature: Building. The elements are updated weekly, and the dataset is based on the NLS Topographic database. Information is available via the NLS-FI INSPIRE Download Service (WFS) for Buildings theme, and it can be viewed via the NLS-FI INSPIRE View Service (WMS) for Buildings. In addition to the national data listed above, there are also regional datasets from Tampere, Paimio, and Helsinki. The capital of Finland also has an extensive collection of building data, e.g., 3D building models with textures, flat and simple roofs, and triangulation models.
C2 Rivers
River network (FIN) is based on the topographic database of the National Land Survey of Finland in scales of 1:5000–1:10,000 from 2000–2008. The continuous network has been created at the Finnish Environment Institute (SYKE) by combining rivers to the central lines through polygon rivers and lakes. The dataset also includes unique river codes and lake codes. The river network includes all river segments with catchment areas larger than 10 km². Other, smaller rivers with smaller catchment areas are also included in case they are considered significant for water management tasks (e.g., WFD). The change from one river segment to another, with a unique river code and information, is located at the junction of the river network. The river code also changes at a connection point between a river segment and a lake. The river network has been created in such a way that all parts of the network are linked topologically to each other and have the correct flow direction so that the dataset can be used for analyzing the network.
BDOT500—see A1
D1 Bridges
Bridges in Finland are one of the 536 layers in the Transport Networks theme. Digiroad is a national dataset under the responsibility of the Finnish Transport Infrastructure Agency (FTIA), which contains the centerline geometries of the road network and traffic-related attributes. Digiroad is an aggregating information system that collects data from the Velho information system of the FTIA, the Topographic Database of the National Land Survey of Finland (NLS), the street information systems of municipalities, and the information systems of a few other authorities (e.g., Helsinki Region Transport HSL).
The centreline geometry of Digiroad’s road network is obtained from the NLSs Topographic Database. It covers all Finnish highways, streets, and private roads, as well as the pedestrian/cycle routes and driving paths in the Topographic Database. In addition, the road network contains some supplementary data about the road line geometry that is not maintained by the NLS. This supplementary road link data are supplied by municipalities and the FTIA. These road links can be separated from the rest of the geometry with the help of administrative class information. Digiroad’s attributes that serve the planning of mobility include, for example, functional class of the road, information about the direction of the traffic flow, road name and address information, restrictions on the use of the road and street network (e.g., closed connection, turning restriction, weight, height, length, and width restrictions), and other attributes of the road network (e.g., speed limit, width, pavement information, level crossings).
The Digiroad data can be downloaded from the FTIAs download and viewing service as a single package. An exception to this is the public transport stop data type, which can also be downloaded from Digiroad’s website. The data are updated in the interface every week and in Väylävirasto’s data service about four times a year.
The responsibility for maintaining Digiroad data are shared between different public administration organizations. Each organization maintains information in its own information systems, from which it is compiled into Digiroad. The National Land Survey of Finland (NLS) is responsible for maintaining the location information of the centreline of the road network; the Finnish Transport Infrastructure Agency (FTIA) is responsible for maintaining the road attribute data in the Velho information system; and the municipalities are responsible for maintaining the road network attribute data. The responsibility for maintaining the attribute data of private roads are shared between the NLS, the FTIA, and the municipalities. In addition, some other administrative organizations are responsible for the maintenance of individual types of data. Since not all municipalities submit information about their own street network to Digiroad, the street network attribute data are incomplete for some municipalities. The information may also be incomplete regarding private roads [92].
Bridges in Poland—BDOT500 and/or BDOT10k, see A1.
D2 Roads
The road link from the INSPIRE (FIN) dataset is one of 536 layers in the Transport Networks theme. A linear spatial object that describes the geometry and connectivity of a road network between two points in the network was delivered by FTIA. Road links can represent paths, bicycle roads, single carriageways, multiple carriageway roads, and even fictitious trajectories across traffic squares.
Roads in Poland are collected in BDOT500 and BDOT10k database—see A1.
D3 Railway track
The railway track from the INSPIRE (FIN) dataset is one of 536 layers in the Transport Networks theme. A linear spatial object that describes the geometry and connectivity of a railway network between two points in the network was delivered by FTIA. Railway tracks in Poland are collected in the BDOT500 and BDOT10k databases (see A1).
D4 Waterworks/Water supply
GESUT (PL)—the Geodetic Record of Utilities Network—is a public register that consists of spatial and descriptive information about land utility networks; including those designed; under construction; and already existing. The database also contains data on the location, purpose, responsible entities, and basic technical parameters of the armaments. District GESUT databases collect information about all infrastructure equipment under the ground: power and telecommunication cables, water, sewer, and gas pipes, cable casings, underground structures, technical devices, points of specified height, poles, masts, and transmission corridors. There are 380 units responsible for running this database in Poland. The level of detail corresponds to a map on a scale of 1:500. Nominal accuracy for the objects consists of the first group of accuracy—better than 10 cm; the height of the sewer manhole is measured with an accuracy of 1 cm. By law, the whole GESUT should be in digital form—vectors + attributes.
D5 Gas pipeline
Information about localisation and other attributes of the gas pipeline for the whole country is stored in the GESUT database (see D4).
D6 High Voltage Power lines
Information about localisation and other attributes of high-voltage power lines for the whole country is stored in the BDOT500 (aboveground parts) and GESUT (underground cables) databases (see A1 and D4).
D7 Drainage ditches
Information about localisation and other attributes of drainage ditches for the whole country is stored in the BDOT500/EGiB/GESUT databases (see A1 and D4).
D8 Sewers
Information about localisation and other attributes of sewer pipelines for the whole country is stored in the GESUT database (see D4).
4.3. Characterisation of the Spatial Databases—Terrain and Other Datasets
The sets in groups E and F represent the shape of the surrounding space—e.g.,; DTM—Digital Terrain Model—and the state of that space as seen mainly from a top view—an aerial or satellite point of view. These data are extremely valuable in the context of monitoring larger areas, like a region or country. Details are in Table 4.
Table abbreviations description:
ID/Group: A—Land ownership; B—Land Use/Land Cover; C—Topographic objects; D—Infrastructure; E—Landform; F—Other data sets.
Database source: EGiB—X; BDOT500; GESUT; BDOT10k; DTM, Geoportal [91].
Type of data: V—vector; R—raster; ASC—ASCII file; PC—point cloud.
Available from an official source: Y—yes/N—no; WMS/WFS/ADM (ADM—to obtain files from administration); OA—Download—Open Access
Paid or free of charge: P—paid/TFREE—total free of charge for everyone for any use/FREE-UC—free of charge under the condition.
Accuracy/resolution: <0.1 m—not worse than 0.1 m.
Timeliness of the data set: UD—up to date—all the time; UT—update as part of the tender—depends on the place in Poland; OD—On date of acquisition.
Use of geospatial data in consolidation applications: Current use: 5—very important data sets; a basic data set for most analysis; 3—important data sets; 1—not important data sets, not used in analysis or used from time to time.
Potential use: 5—this data set has a great potential for use in land consolidation analysis; 3—this data set has a moderate potential for use in land consolidation analysis; 1—this data set has a low potential for use in land consolidation analysis.
Comments on the table contents:
com1—to be made by yourself on the basis of DTM.
com2—not for the whole area of Poland in the digital version.
com3—orthophoto maps are a very popular product in Poland, so many municipalities obtain their own orthophoto more often than government institutions [91].
com4—Download—Open Access mostly from local authorities services (BIP) as a PDF file without georeference—only as a picture; WMS—not for the whole area of Poland.
com5—total free of charge by COVID-19 epoch—science July 2019.
com6—accuracy depends on type of objects.
com7—Remote sensing data are available for civilian applications both openly (free of charge) and commercially. Due to the global market for remote sensing data acquisition and access services, both Poland and Finland will have the same collections with the same parameters. Due to the multiplicity of constellations, only the limiting key parameters have been cited: spatial resolution (0.25–30 m) and revisit time (1–16 days).
Com8—Detail 1:10,000—Accuracy as the source data; i.e.,; BDOT500; EgiB, after taking into account the generalisation with the accuracy of the location of objects, in accordance with the standards set by the law with nationwide coverage.
com9—In Poland; roads; due to their functions in the road network; are divided into categories:
- national roads—A (highway); S (expressway)
- voivodeship roads;
- district roads;
- communal roads.
These roads are marked on EGIB maps. On the other hand, private roads are divided into:
- internal roads,
- easement roads,
that are not marked on EGIB maps.
Com10—poor map validity and low location accuracy; poor data detail; small number of outcrops per 1 km2. Most of the soil and agricultural maps available today in PZGiK at a scale of 1:5000 were developed in the 1960s and 1980s in analog form. For the vast majority of the country, these maps have been converted to vector form.
Com11—Better soils increase the efficiency of agricultural production and have higher value. Therefore, when designing land consolidation in rural areas, it is necessary to precisely determine the ranges of soil types and types and plan a good economic structure for agricultural production.
E1 DTM
Elevation Model 2 m (FIN) is a model depicting the elevation of the ground surface in relation to sea level. Its grid size is 2 × 2 m. The dataset is based on laser scanning data, the point density of which is at least 0.5 points per square metre. The product’s coverage is based on nationwide laser scanning. Elevation model 2 m is produced in two quality classes: the elevation accuracy in class I is on average 0.3 metres and the elevation accuracy in class II varies between 0.3 metres and one metre. The product belongs to the open data of the National Land Survey of Finland. The product is updated as necessary. The elevation model is updated according to the laser scanning of the previous season if significant changes have been detected on the Earth’s surface.
Elevation model 10 m depicts the elevation of the ground surface of the whole of Finland in relation to sea level. Its grid size is 10 × 10 m, and the accuracy of the elevation data are 1.4 metres. The product belongs to the open data of the NLS of Finland. The product is updated once a month if the data in the elevation model 2 m product has changed.
Despite DTM being in raster format, there are also elevation models in raster format, such as a contour map from the basic map raster. The themes of the Topographic database and Topographic map raster series (scale 1:10,000) have been compiled into seven theme entities, or theme rasters, required by the Inspire directive: hydrography, elevation, traffic network, land use, land cover, place names, and buildings. In addition to the above, the theme rasters also include the municipal division, road names, and map sheet division as separate themes. The product belongs to the open data of the NLS of Finland. The updating frequency varies depending on the feature. The spatial resolution of the product is 1:20,000.
To increase the visualisation aspects of the presentation of the DTM, there are elevation models in the hillshade mode. Hillshade (elevation model) is a raster dataset visualizing the elevation of the terrain. There are five product versions available in which the pixel sizes are 2, 8, 32, 64, 128, and 512 metres. Pixel size 2 m has been produced from the dataset Elevation model 2 m. The other sizes have been produced from the dataset Elevation model 10 m. The material does not contain elevation values; it is a greyscale image that visualises the direction and steepness of hills. The product belongs to the open data of the NLS of Finland.
In Poland, data on relief are collected in the DTM database (DTM) maintained at the national level by GUGiK in 1 m and 5 m GRID. The source data for the development of the DTM were classified ALS data with densities of 4/6/12/20 p/m2. Data sets were produced in an ARC/INFO ASCII GRID file with H accuracy < 0.1 m for 1 m DTM and H error 0.5 m for 5 m GRID. The DTM update is planned for 3 years, i.e., data for the entire country is to be acquired again within 3 years.
E2 Slope analysis
The surface water flow model has been calculated based on the terrain database of the NLS and the catchment area division of the Finnish Environment Institute. The material is described based on the data by theme on different map levels. The property information is presented for every 10 m. The results describe a situation where the ditches have been dug as in the basic map, with the assumption that all ditches are of the same depth and size. The reliability of the results decreases in flat areas. Spatial data does not replace the need for terrain planning or other data sources. The source materials may contain errors that affect the calculation results. Interpretations should not be made on the basis of a single observation [92].
F1 Soil-agricultural map
Soil Database 1:250,000 in Finland was implemented by the Agricultural and Food Research Center (MTT), the Geological Research Center (GTK), and the Forestry Research Institute (Metla). The database was prepared according to the instructions of the European Soil Office. The creation combined new production and existing data reserves using geographic information technology (GIS) methods. As a basis, a general geological soil map was used, the patterns of which represent the soil type at a depth of one meter (so-called parent material). The main research subjects were the generalisation of land type patterns using GIS methods, the derivation of the quantities needed for the database from the existing information, and other developments in ICT methods. By interpreting the results of geophysical low-flying data, it was possible to delineate, for example, muddy areas and distinguish between thin peat and deep bogs. For the general soil map patterns according to the Finnish classification, land elevation names were derived according to the WRB-2014 system (World Reference Base for Soil Resources). From these soil elevation patterns, map patterns of less than 6.25 hectares were removed by combining them with adjacent patterns according to the instructions of the European Soil Office. Thus, the land elevation patterns and the geometries of the general soil map are quite consistent, although not identical. The patterns were further generalized into landscapes of at least 150 hectares by combining according to the rules. The characteristic information of painters and soil types was gathered in a database from the material produced by the institutions participating in the project. The responsible unit in Finland is the Natural Resources Institute Finland (Luke).
F2 Ortophotomap
NLS Orthophotos is an aerial photo dataset covering the whole of Finland. An orthophoto is a combination of several individual aerial photos. The geometry of the orthophotos corresponds to a map. The aerial photo data set in orthophoto format is available as the most recent data set, consisting of the most recent aerial photos available. The most recent data are usually 1–3 years old. The second part comprises old aerial photos, consisting of data sets that are older than the most recent data set. The oldest aerial photos were taken in the 1930s. New data are added to the data set continuously. NLS Orthophotos are updated every 3 years (in Northern Lapland, 12 years). The orthophoto with GSD 0.5 m was prepared in different versions: ortophoto, ortophoto (false colour), ortophoto (forest ortho), and ortophoto (natural disasters). The product belongs to the open data of the National Land Survey of Finland [96]. In addition, NLS ortho, there are many regional data sets in different versions and different dates—e.g.,; Helsinki false colour 1982–2021 and GSD 30 cm to 5 cm, Helsinki orthophoto 1932–2021 and GSD 100 cm to 5 cm. Additionally, one of the layers is LANDSAT imaginary with georeference and GSD 30 m.
Since 07.2019, another open data set has been an orthophotograph obtained from the resources of GUGiK (Central Office of Geodesy and Cartography). This database is systematically updated with smaller and smaller pixels, both in terms of RGB and CIR composition [97]. The orthophotomaps stored in GUGiK were made in the PL-1992 or PL-2000 rectangular coordinate system, in real colours (RGB) or false colours with the near infrared (CIR) channel. Most of the orthophotographs in Poland available at geoportal.gov.pl are made in the GSD 25 cm standard, and in urban areas, they are made in the GSD 10 cm standard and smaller. In connection with the plans to make an orthophotomap in a two-year cycle with a pixel of 25 cm and an orthophotomap with a pixel of 5/10 cm for poviat cities, but with an annual shift, the area of each larger city will be updated annually, either with an orthophotomap with a pixel of 25 cm or with an orthophotomap with a pixel of 5/10 cm. There are also true orthophotographs on geoportal.gov.pl, which differ geometrically from the standard orthophotograph in that they eliminate radial shifts of objects protruding above the terrain (e.g., buildings) or “blind spots,” understood as areas obscured by leaning protruding objects. This means that objects lying on the ground surface (e.g., basements of buildings) as well as those protruding above the ground (e.g., roof edges) are presented in an orthogonal projection. The DSM is used to eliminate radial shifts [91].
F3 Local development plan
On Finish geoportal [92] there are master plans for regions in a vector version with a scale of about 1:100,000. The second part consists of local, detailed plans in scale 1:2000.
In Poland, the local development plan (MPZP) consists of two parts: descriptive and graphic. The local development plan specifies a lot of information, from the intended use of a given area to the conditions of development and development of the area, as well as the location of public investments. Poland is not entirely covered by local development plans. Only parts of cities and adjacent areas have local development plans. There are places where local development plans are prepared and should be posted on the website [91], but this is not the case. Information about local development plans can be found on local city websites, for example: https://brmr.erzeszow.pl/mapa/ (accessed on 10 October 2023) and https://mrzeszow.e-mapa.net/ (accessed on 10 October 2023).
F4 LiDAR ALS point clouds
AIRBORNE LASER SCANNING (ALS) POINT CLOUD— Laser scanning is a method of terrain surface registration that involves measuring the distance between the object and the device (the scanner) and emitting and receiving laser impulses that are reflected from the object. As a result of the known beam angle, distance measurement, and scanner space location, it is possible to determine the spatial coordinates (X, Y, Z) of the points representing objects on the surface. The point cloud obtained in this technology, called LiDAR (Light Detection and Ranging), is developed in a projected coordinate system marked PL-1992 (EPSG:2180) and in a height system marked PL-KRON86-NH or PL-EVRF2007-NH. Initial point clouds come from the ISOK project from 2010–2015—density 4/6/12 p/m2. The next ALS project was named CAPAP. Currently, GUGiK plans to acquire ALS data for the entire country in a 3-year cycle with a density of up to 20 p/m2, available for free download in LAZ files. The accuracy of the classified point cloud is 0.4–0.5 m horizontal and 0.10–0.15 m vertical.
Provided by the National Land Survey of Finland at a density of 5 p/m2 and with class attributes available for free download in LAZ files. Regarding unambiguous objects, the standard error of elevation accuracy is at most 0.1 m, and the standard error in planimetric accuracy is 0.45 m.
F5 Airborne multispectral products—CIR
For both Poland and Finland, see the F2 description.
F6 Satellite scenes
There is the same situation in both Poland and Finland. The best worldwide services offer commercial data sets with a GSD of about 0.3 m.
F7 UAV orthophoto map and F8 UAV LiDAR point cloud
Information about technology and products could be found in the F2 and F4 sections. Level of the acquisition can grow up the parameters of the products—GSD about 2–3 cm and the point cloud with density about 800 p/m2. A big advantage is the scale of the project—for one community; it makes no economic sense to make a flight with an airplane because the area is too small. But it is a perfect situation for smaller objects like UAVs.
5. Results—Land Consolidation and Data Set Verification
In Poland, assumptions are made before proceeding with the overall land consolidation project. The assumptions for the land consolidation project consist of a descriptive and graphic part. The following materials are used to develop the assumptions: a land and building register report, data from the agricultural census, an environmental protection program for the commune, a local spatial development plan, and, in the absence of such a plan, a study of conditions and directions of spatial development, other studies and analyses concerning the development of the village area, and postulates for the land consolidation project sent by authorities and institutions.
In Finland, preliminary land consolidation surveys are carried out by NLS Finland’s officials. At the end of the survey, the project manager submits the official land consolidation survey report to the management team of the NLSs land consolidation unit, which makes the decision whether it is possible to use Finnish government funding to implement the project. The content of the land consolidation survey report is regulated. When conducting preliminary land consolidation surveys, NLSs officials use the information systems of NLS. Cadastral information, land register information, topographic maps, aerial orthophotos, and agricultural administration IACS-register, from which you can see who is farming a parcel if the farmer is different from the owner. In the implementation phase of the land consolidation, agricultural parcels are appraised. The project manager makes a purchase price survey of the area or municipality. All land sales are public in Finland, so making an appraisal is relatively easy. Because of the EUs common agricultural policy, farmers are required to take soil samples and analyze them every three years. The results of these are used as background information in appraisals. If needed, soil scientists are used to appraise special conditions of parcels (for example, acidity).
While the concept of the general land consolidation project in Poland should include:
- (1)
- To determine the boundaries of building plots in the presence of the owners and to intend and adopt them in the land consolidation project as invariants.
- (2)
- The land of the property should be left in the existing places; a possible change of location may take place after consultation with the Head of the Commune.
- (3)
- The boundaries of forest plots should be established on the ground in the presence of the owners, planned, and adopted as invariants for the consolidation project.
- (4)
- The existing network of drainage ditches, streams, and watercourses should be planned on the ground and included in the land consolidation project.
- (5)
- When developing the consolidation project, the existing monuments should be left in their current condition and, if possible, with the same owners.
- (6)
- The main communal roads with paved surfaces should be planned on the ground and included in the land consolidation project. The course of the main access roads to the fields is presented in the graphic part of the general design. When designing roads, special attention should be paid to the existing streams and watercourses and to the technical infrastructure (power lines, gas networks).
- (7)
- While developing the consolidation project, the existing rural ponds and ponds in the discussed area should be maintained as future ecological areas.
- (8)
- Maintain the current directions of plots in complexes.
- (9)
- Keep public utilities within their current boundaries, with the possibility of their enlargement.
- (10)
- Participants of the merger residing in neighbouring towns and villages, i.e., the villagers, should allocate equivalents, if possible, in land complexes located on the border with the village of their residence.
6. Discussion
Analyses and comparisons of Polish and Italian geoportals were performed by [98]. In scientific publications, the authors did not come across any scientific studies that compared publicly available geospatial data in Poland and Finland. So far, only selected geospatial products have been used in Poland to support the consolidation process. The authors of this study compiled what they believed to be relevant data sets. Therefore, Table 2, Table 3 and Table 4 present a comparison of data from Polish and Finnish geoportals. These data are necessary when making assumptions for the land consolidation project or for the land consolidation project itself. Both the assumptions and the project of consolidating agricultural land must be based on “real” data (reflecting what is actually on the land of the village) and not data from the map, which are not always up-to-date [53,83].
In order to optimally manage space, including agricultural space, it is necessary to have source information about the current state of the surrounding space. Both quantitative, qualitative, and location aspects are important. To this end, modern measurement technologies should be used to obtain a digital version of the surrounding world quickly and accurately. We can find examples of such activities (localisation and quantity) in [11,15,17,99,100]. As for the quality aspect, confirmation of the validity of this thesis can be found in [101,102,103,104,105]. After integrating quantitative location data with qualitative data, we obtain a kind of Digital Twin, but in a rural version [106]. With the use of additional activities and tools, activities can also be expanded to the level of a smart village [107,108].
In order for actions based on inventory data to be effective and in line with reality, geospatial data must meet normative requirements. This will ensure that the proposed solutions and procedures can be applied in different locations around the world. According to ISO 19157 [109], quality consists of six issues: completeness, logical consistency, position accuracy, thematic accuracy, time accuracy, and application. Digital data speeds up the process of spatial management in both urban [13,110,111], rural [112,113], and land consolidation [114] in rural areas. Operating on digital data also allows partial automation of work as well as almost “cost-free” preparation of variant versions of design solutions. In the whole of the above process, an aspect not to be overlooked is the cost of acquiring and integrating geospatial data; therefore, an insanely important aspect is the cost of acquiring it. The free availability of data are an incredible boost to their use, which we can find confirmation of in w [115,116]. In view of the above examples, this study containing concise descriptions and information on digital geospatial datasets, their timeliness, availability, and accuracy is, in the opinion of the authors, an extremely important source of knowledge for the exchange of good land consolidation practices in Poland and Finland.
Data from the relevant scopes will allow a more sophisticated approach to land consolidation processes in Poland, focusing not only on geometric and location aspects of the farm but also, to a greater extent, on translating these into economic and ecological aspects. Such activities are in line with the directions of the European Green Deal and will certainly translate into reduced energy consumption and a lower carbon footprint [9,73]. Authors [74] suggest that moderate changes in food diets and land use in Finland can reduce GHG emissions from agriculture by more than 40% by 2050. In the period 2021–2030, the collective target of EU Member States is to reduce greenhouse gas emissions by 30% from the 2005 level by 2030 [5].
Reducing agricultural production costs, lower fuel consumption, and a smaller carbon footprint. It will result in better road planning for the land consolidation project. The basic elements of transport infrastructure are agricultural roads (access to fields). Hence, the high share of agricultural transport costs can be reduced through an appropriate system of these roads [75]. Each newly separated cadastral plot in the land consolidation in rural areas must have access to a public road. Consequently, the road infrastructure in a land consolidation project is extremely important. A public road can be called a road included under one of the road categories specified:
- national roads—A (highway); S (expressway);
- voivodeship roads;
- district roads;
- communal roads [35];
- Through a private road, you can reach a public road, and these are:
- internal roads;
- easement roads [36].
On the other hand, agricultural transport roads in the modernisation or construction of new roads in the land consolidation project should take into account the sequence consistent with the functional class:
- main roads;
- collecting roads;
- auxiliary roads.
The road network density indicator is often mentioned by communes as the most important consolidation effect. A very important effect of land consolidation in rural areas is post-merger management, including the arrangement and modernisation of “agricultural transport roads,” which provide access to each registration plot [46].
7. Conclusions
This article pursues two main scientific goals. The first purpose of this article was to analyze the history and scope of land consolidation in Poland and Finland in order to learn the specifics of land consolidation in a given country. Comparisons and analyses were made on the basis of the authors’ experience in Poland and Finland with land consolidation in the areas described. The second scientific goal of the article was to compare the availability of geospatial data in the context of the methodology of performing land consolidation in rural areas, which leads to increased energy efficiency in agricultural production by reducing the need for energy, especially fuel for agricultural machinery.
The compilation of this data will allow for the improvement of land consolidation in rural areas and the use of modern geospatial technologies for proven practices in the field of land consolidation. Good land consolidation planning will lead to effective and economical use of rural space. This is part of the 2030/2050 strategy. Reducing agricultural production costs, lower fuel consumption, and a smaller carbon footprint. This is what Poland and Finland are striving for as countries belonging to the European Union. In EU countries with socio-economic development, the economic and energy efficiency of agriculture is increasing [76]. In agriculture, we observe the use of modern technologies in agricultural machinery. Perhaps soon, agricultural machines will have a smaller carbon footprint. We hope that the exchange of experiences in creating this analysis will lead to the introduction of proven practices of land consolidation from Finland into Poland and proven Polish practices in Finland. We hope that the summary of the potential of individual technologies for recording the Earth’s surface, presented in Table 2, Table 3 and Table 4, will contribute to the interest of land consolidation designers in these data sets.
Further research should involve analysing and evaluating the effects of introducing proven solutions in the field of land consolidation from Finland to Poland and vice versa. Land consolidation carried out using the data listed in Table 2, Table 3 and Table 4 will allow for faster and more effective execution of rural space development works. First of all, more effective planning of agricultural transport routes and thus energy savings, especially on fuel for agricultural machines, cheaper crops, and a better organized life for rural residents.
Author Contributions
Conceptualisation, A.W. and M.B.; methodology, A.W. and M.B.; validation, A.W., M.B. and K.K.; formal analysis, A.W. and M.B.; investigation, A.W., M.B. and K.K.; writing—original draft preparation, A.W., M.B. and K.K.; writing—review and editing, A.W. and M.B. All authors have read and agreed to the published version of the manuscript.
Funding
This research received no external funding.
Data Availability Statement
Data are contained within the article.
Conflicts of Interest
The authors declare no conflict of interest.
References
- McKinsey Global Institute. Digital America: A Tale of The Haves and Have-Mores; McKinsey Global Institute: New York, NY, USA, 2015. [Google Scholar]
- Zawilińska, B.; Brańka, P.; Majewski, K.; Semczuk, M. National Parks—Areas of Economic Development or Stagnation? Evidence from Poland. Sustainability 2021, 13, 11351. [Google Scholar] [CrossRef]
- Telega, A.; Bieda, A. Analizy Stopnia Dopasowania Sposobu Użytkowania Ziemi, Jako Narzędzie Zarządzania Konfliktami Przestrzennymi. Infrastrukt. I Ekol. Teren. Wiej.-Infrastruct. Ecol. Rural AREAS 2015, IV, 1007–1020. [Google Scholar] [CrossRef]
- Li, M.; Milojevic, M.; Gura, D.; Gura, D.; Li, M. Development of Methodology for Evaluating Sustainable Rural Development. Environ. Dev. Sustain. 2023, 1–21. [Google Scholar] [CrossRef]
- Niemi, J.; Väre, M. Agriculture and Food Sector in Finland 2019; Luke Natural Resources Institute Finland: Helsinki, Finland, 2019; ISBN 978-952-326-770-1. [Google Scholar]
- Surówka, M.; Popławski, Ł.; Fidlerová, H. Technical Infrastructure as an Element of Sustainable Development of Rural Regions in Małopolskie Voivodeship in Poland and Trnava Region in Slovakia. Agriculture 2021, 11, 141. [Google Scholar] [CrossRef]
- Manavbaşı, D.; Polat, H.E. Determining the Effects of Land Consolidation on Fuel Consumption and Carbon Dioxide Emissions in Rural Area. J. Agric. Sci. 2012, 18, 157–165. [Google Scholar]
- Ertunç, E.; Janus, J.; Uyan, M. Prioritization of Land Consolidation Projects Using the Multi-Criteria Best-Worst Method: A Case Study from Poland. Environ. Monit. Assess. 2023, 195, 1045. [Google Scholar] [CrossRef] [PubMed]
- Janus, J.; Ertunç, E. Impact of Land Consolidation on Agricultural Decarbonization: Estimation of Changes in Carbon Dioxide Emissions Due to Farm Transport. Sci. Total Environ. 2023, 873, 162391. [Google Scholar] [CrossRef] [PubMed]
- Ramírez del Palacio, Ó.; Hernández-Navarro, S.; Sánchez-Sastre, L.F.; Fernández-Coppel, I.A.; Pando-Fernández, V. Assessment of Land Consolidation Processes from an Environmental Approach: Considerations Related to the Type of Intervention and the Structure of Farms. Agronomy 2022, 12, 1424. [Google Scholar] [CrossRef]
- Chiappini, S.; Pierdicca, R.; Malandra, F.; Tonelli, E.; Malinverni, E.S.; Urbinati, C.; Vitali, A. Comparing Mobile Laser Scanner and Manual Measurements for Dendrometric Variables Estimation in a Black Pine (Pinus Nigra Arn.) Plantation. Comput. Electron. Agric. 2022, 198, 107069. [Google Scholar] [CrossRef]
- Wężyk, P.; Hawryło, P.; Szostak, M.; Zięba-Kulawik, K.; Winczek, M.; Siedlarczyk, E.; Kurzawiński, A.; Rydzyk, J.; Kmiecik, J.; Gilewski, W.; et al. Using LiDAR Point Clouds in Determination of the Scots Pine Stands Spatial Structure Meaning in the Conservation of Lichen Communities in “Bory Tucholskie” National Park. Arch. Photogramm. Cartogr. Remote Sens. 2019, 31, 85–103. [Google Scholar] [CrossRef]
- Zięba-Kulawik, K. Rola Wskaźników Krajobrazowych w Monitorowaniu Przemian Lasów Miejskich z Wykorzystaniem Technologii Geoinformacyjnych; University of Agriculture in Krakow: Krakow, Poland, 2022. [Google Scholar]
- Krawczyk, K. Influence of Reference Stations on the Stability of the Geodetic Control Network during Deformation Determination in the Area of Kadzielnia in Kielce. Rep. Geod. Geoinform. 2023, 115, 19–26. [Google Scholar] [CrossRef]
- Balestra, M.; Chiappini, S.; Vitali, A.; Tonelli, E.; Malandra, F.; Galli, A.; Urbinati, C.; Malinverni, E.S.; Pierdicca, R. Integration of Geomatic Techniques for The 3D Representation and Monitoring of a Veteran Chestnut Tree. In Proceedings of the International Archives of the Photogrammetry, Remote Sensing and Spatial Information Sciences-ISPRS Archives, Krakow, Poland, 23–24 October 2022; Volume 43. [Google Scholar]
- Hajdukiewicz, M. Use of Archival Aerial Photos and Images Acquired Using UAV to Reconstruct the Changes of Annual Load of the Suburban Landfill: Case Study of Promnik, Poland. Energies 2022, 16, 181. [Google Scholar] [CrossRef]
- Warchoł, A.; Szwed, P.; Wężyk, P. Integration of Technology of Airborne, Mobile, and Terrestrial Laser Scanning in the Process of Inventory Urban Vegetation in Selected Parts of Kraków. In Proceedings of the Pokrycie Terenu I Przewietrzanie Krakowa, Krakow, Poland, 20 October 2016; pp. 67–79. [Google Scholar]
- Bakula, K.; Lejzerowicz, A.; Pilarska-Mazurek, M.; Ostrowski, W.; Górka, J.; Biernat, P.; Czernic, P.; Zalegowski, K.; Kleszczewska, K.; Wezka, K.; et al. Sensor Integration and Application of Low-Sized Mobile Mapping Platform Equipped with Lidar, Gpr and Photogrammetric Sensors. In Proceedings of the International Archives of the Photogrammetry, Remote Sensing and Spatial Information Sciences-ISPRS Archives, Krakow, Poland, 23–24 October 2022; Volume 43, pp. 167–172. [Google Scholar]
- Di Stefano, F.; Sanità, M.; Malinverni, E.S.; Doti, G. Geomatic Technologies to Valorize Historical Watermills. Int. Arch. Photogramm. Remote Sens. Spat. Inf. Sci. 2023, 48, 511–518. [Google Scholar] [CrossRef]
- Sobura, S.; Bacharz, K.; Granek, G. Analysis of Two-Option Integration of Unmanned Aerial Vehicle and Terrestrial Laser Scanning Data for Historical Architecture Inventory. Geod. Cartogr. 2023, 49, 76–87. [Google Scholar] [CrossRef]
- Herrero-Tejedor, T.R.; Maté-González, M.Á.; Pérez-Martín, E.; López-Cuervo, S.; López de Herrera, J.; Sánchez-Aparicio, L.J.; Villanueva Llauradó, P. Documentation and Virtualisation of Vernacular Cultural Heritage: The Case of Underground Wine Cellars in Atauta (Soria). Heritage 2023, 6, 5130–5150. [Google Scholar] [CrossRef]
- Gawronek, P.; Makuch, M.; Mitka, B.; Bożek, P.; Klapa, P. 3D Scanning of the Historical Underground of Benedictine Abbey in Tyniec (POLAND). In Proceedings of the International Multidisciplinary Scientific GeoConference: SGEM-Section Geodesy and Mine Surveying, Albena, Bulgaria, 29 June–5 July 2017. [Google Scholar] [CrossRef]
- Warchoł, A.; Lęcznar, J. Gęstość Naziemnych Chmur Punktów LiDAR w Kontekście Modelowania BIM. In Pozyskiwanie Danych Geodezyjnych dla Potrzeb Gospodarowania Przestrzenią Regionu Świętokrzyskiego; Wolski, B., Cienciała, A., Eds.; Wydawnictwo Politechniki Świętokrzyskiej: Kielce, Poland, 2022; pp. 77–99. [Google Scholar]
- Błaszczak-Bąk, W.; Suchocki, C.; Mrówczyńska, M. Optimization of Point Clouds for 3D Bas-Relief Modeling. Autom. Constr. 2022, 140, 104352. [Google Scholar] [CrossRef]
- Skrzypczak, I.; Oleniacz, G.; Leśniak, A.; Zima, K.; Mrówczyńska, M.; Kazak, J.K. Scan-to-BIM Method in Construction: Assessment of the 3D Buildings Model Accuracy in Terms Inventory Measurements. Build. Res. Inf. 2022, 50, 859–880. [Google Scholar] [CrossRef]
- Kontrimovicius, R.; Juszczyk, M.; Leśniak, A.; Ustinovichius, L.; Miedziałkowski, C. Photogrammetry-Based Approach for Collecting and Processing Information about an Existing Building. Bull. Polish Acad. Sci. Tech. Sci. 2023, 71, 144453. [Google Scholar] [CrossRef]
- Karabin, M.; Bakuła, K.; Łuczyński, R. Verification of the Geometrical Representation of Buildings in Cadastre Using UAV Photogrammetry. Geomatics Environ. Eng. 2021, 15, 81–99. [Google Scholar] [CrossRef]
- Medolińska, K.; Gołȩbiowska, I.; Karsznia, I. Local GIS: Development and Assessment of the Geoportal for Local Governments and Local Communities. Case Study of a Small Town in Poland. Misc. Geogr. 2017, 21, 160–167. [Google Scholar] [CrossRef]
- Abate, D.; Agapiou, A.; Toumbas, K.; Lampropoulos, A.; Petrides, K.; Pierdicca, R.; Paolanti, M.; Di Stefano, F.; Felicetti, A.; Malinverni, E.S.; et al. Artificial Intelligence to Fight Illicit Trafficking of Cultural Property. Int. Arch. Photogramm. Remote Sens. Spat. Inf. Sci. 2023, 48, 3–10. [Google Scholar] [CrossRef]
- Malinverni, E.S.; Chiappini, S.; Pierdicca, R. A Geodatabase for Multisource Data Management Applied to Cultural Heritage: The Case Study of Villa Buonaccorsi’s Historical Garden. In Proceedings of the ISPRS Annals of the Photogrammetry, Remote Sensing and Spatial Information Sciences, Milan, Italy, 8–10 May 2019; Volume 42. [Google Scholar]
- Quattrini, R.; Pierdicca, R.; Morbidoni, C.; Malinverni, E.S. Conservation-Oriented Hbim. The Bimexplorer Web Tool. WG HBIM for Management and Maintenance. Int. Arch. Photogramm. Remote Sens. Spat. Inf. Sci. 2017, XLII, 275–283. [Google Scholar] [CrossRef]
- Vasic, I.; Pauls, A.; Mancini, A.; Quattrini, R.; Pierdicca, R.; Angeloni, R.; Malinverni, E.S.; Frontoni, E.; Clini, P.; Vasic, B. Virtualization and Vice Versa: A New Procedural Model of the Reverse Virtualization for the User Behavior Tracking in the Virtual Museums. In Proceedings of the Lecture Notes in Computer Science (including subseries Lecture Notes in Artificial Intelligence and Lecture Notes in Bioinformatics), Lecce, Italy, 6–8 July 2022; Volume 13446 LNCS. [Google Scholar]
- Pierdicca, R.; Mulliri, M.; Lucesoli, M.; Piccinini, F.; Malinverni, E.S. Geomatics Meets XR: A Brief Overview of the Synergy Between Geospatial Data and Augmented Visualization. In Proceedings of the Lecture Notes in Computer Science (including subseries Lecture Notes in Artificial Intelligence and Lecture Notes in Bioinformatics), Lecce, Italy, 6–8 July 2022; Volume 13446 LNCS. [Google Scholar]
- Iosifescu-Enescu, I.; Matthys, C.; Gkonos, C.; Iosifescu-Enescu, C.M.; Hurni, L. Cloud-Based Architectures for Auto-Scalable Web Geoportals towards the Cloudification of the GeoVITe Swiss Academic Geoportal. ISPRS Int. J. Geo-Inf. 2017, 6, 192. [Google Scholar] [CrossRef]
- Szopińska, K.; Balawejder, M.; Warchoł, A. National Legal Regulations and Location of Noise Barriers along the Polish Highway. Transp. Res. Part D Transp. Environ. 2022, 109, 103359. [Google Scholar] [CrossRef]
- Warchoł, A.; Balawejder, M. The Use of Orthophotomaps to Verify the Network of Agricultural Transport Roads in the Land Consolidation Project. In Proceedings of the FIG Congress 2022 Volunteering for the Future-Geospatial Excellence for A Better Living, Warsaw, Poland, 11–15 September 2022. [Google Scholar]
- Femenia-Ribera, C.; Mora-Navarro, G.; Pérez, L.J.S. Evaluating the Use of Old Cadastral Maps. Land Use Policy 2022, 114, 105984. [Google Scholar] [CrossRef]
- Kurczynski, Z.; Bakuła, K.; Karabin, M.; Kowalczyk, M.; Markiewicz, J.S.; Ostrowski, W.; Podlasiak, P.; Zawieska, D. The possibility of using images obtained from the uas in cadastral works. Int. Arch. Photogramm. Remote Sens. Spat. Inf. Sci. 2016, XLI-B1, 909–915. [Google Scholar] [CrossRef]
- Kuras, P.; Ortyl, Ł.; Owerko, T. Empirical SNR-Based Model of the Displacement Accuracy for Ground-Based Radar Measurements. ISPRS J. Photogramm. Remote Sens. 2022, 194, 181–194. [Google Scholar] [CrossRef]
- Szopińska, K.; Cienciała, A.; Bieda, A.; Kwiecień, J.; Kulesza, Ł.; Parzych, P. Verification of the Perception of the Local Community Concerning Air Quality Using ADMS-Roads Modeling. Int. J. Environ. Res. Public Health 2022, 19, 908. [Google Scholar] [CrossRef]
- Ogryzek, M.; Podawca, K.; Cienciała, A. Geospatial Tools in the Analyses of Land Use in the Perspective of the Accessibility of Selected Educational Services in Poland. Land Use Policy 2022, 122, 106373. [Google Scholar] [CrossRef]
- Szojda, L.; Kapusta, Ł. Evaluation of the Elastic Model of a Building on a Curved Mining Ground Based on the Results of Geodetic Monitoring. Arch. Min. Sci. 2020, 65, 213–224. [Google Scholar] [CrossRef]
- Balawejder, M.; Leń, P. The Realization of Complex Work of Consolidation and Exchange of Land in the Villages Divided by a Highway. Geomatics Environ. Eng. 2016, 10, 27. [Google Scholar] [CrossRef]
- Stręk, Ż.; Noga, K. Method of Delimiting the Spatial Structure of Villages for the Purposes of Land Consolidation and Exchange. Remote Sens. 2019, 11, 1268. [Google Scholar] [CrossRef]
- Woch, F.; Janus, J.; Syp, A.M.A. Metody Oceny Prac Scaleniowych (Methods of Evaluation of Consolidation Works); IUNG: Puławy, Polan, 2018. [Google Scholar]
- Balawejder, M.; Matkowska, K.; Rymarczyk, E. Effects of Land Consolidation in Southern Poland. Acta Sci. Pol. Adm. Locorum 2021, 20, 269–282. [Google Scholar] [CrossRef]
- Buśko, M.; Zyga, J.; Hudecová, Ľ.; Kyseľ, P.; Balawejder, M.; Apollo, M. Active Collection of Data in the Real Estate Cadastre in Systems with a Different Pedigree and a Different Way of Building Development: Learning from Poland and Slovakia. Sustainability 2022, 14, 15046. [Google Scholar] [CrossRef]
- Pawlikowska, E.; Popek, P.; Bieda, A.; Moteva; Stoeva, A. Analysis of the Legal Methods of Agricultural Land Protection in Central Europe On the Example of Poland and Bulgaria. Real Estate Manag. Valuat. 2017, 25, 58–71. [Google Scholar] [CrossRef]
- Bieda, A.; Jasinska, E.; Preweda, E. Surveying Protection of Agricultural Land in Poland. In Proceedings of the The 9th International Conference “Environmental Engineering”, Vilnius, Lithuania, 22–23 May 2014. [Google Scholar]
- Klimach, A.; Dawidowicz, A.; Dudzińska, M.; Źróbek, R. An Evaluation of the Informative Usefulness of the Land Administration System for the Agricultural Land Sales Control System in Poland. J. Spat. Sci. 2020, 65, 419–443. [Google Scholar] [CrossRef]
- Perpiña Castillo, C.; Kavalov, B.; Diogo, V.J.-C.C.; Batista e Silva, F.; Baranzelli, C.L.C. Trends in the Eu Agricultural Land within 2015-2030; JRC113717; European Commission: Ispra, Italy, 2018.
- Available online: http://www.fao.org/countryprofiles/index/en/?lang=en&iso3=POL (accessed on 10 October 2023).
- Cienciała, A.; Sobura, S.; Sobolewska-Mikulska, K. Optimising Land Consolidation by Implementing UAV Technology. Sustainability 2022, 14, 4412. [Google Scholar] [CrossRef]
- Janus, J.; Taszakowski, J. Spatial Differentiation of Indicators Presenting Selected Barriers in the Productivity of Agricultural Areas: A Regional Approach to Setting Land Consolidation Priorities. Ecol. Indic. 2018, 93, 718–729. [Google Scholar] [CrossRef]
- Janus, J. Measuring Land Fragmentation Considering the Shape of Transportation Network: A Method to Increase the Accuracy of Modeling the Spatial Structure of Agriculture with Case Study in Poland. Comput. Electron. Agric. 2018, 148, 259–271. [Google Scholar] [CrossRef]
- Noga, K.; Balawejder, M.; Matkowska, K. Dimensions of Destruction of Road Network Providing Access to Cadastral Parcels Resulting from Motorway Construction. Geomatics Environ. Eng. 2017, 11, 65. [Google Scholar] [CrossRef][Green Version]
- Di Falco, S.; Penov, I.; Aleksiev, A.; van Rensburg, T.M. Agrobiodiversity, Farm Profits and Land Fragmentation: Evidence from Bulgaria. Land Use Policy 2010, 27, 763–771. [Google Scholar] [CrossRef]
- Moteva, M. Legal Conditions and Data Provision for Land Property Exchange in the Processes of Land Consolidation and Land Compensation in Bulgaria. Geomat. Environ. Eng. 2020, 14, 59–71. [Google Scholar] [CrossRef]
- Hrybau, A.; Hrydziushka, A.; Napiórkowska-Baryła, A. Current Problems and Challenges of Agriculture in the Republic of Belarus. Acta Sci. Pol. Adm. Locorum 2022, 21, 105–114. [Google Scholar] [CrossRef]
- Demetriou, D. The Assessment of Land Valuation in Land Consolidation Schemes: The Need for a New Land Valuation Framework. Land Use Policy 2016, 54, 487–498. [Google Scholar] [CrossRef]
- Sklenicka, P. Classification of Farmland Ownership Fragmentation as a Cause of Land Degradation: A Review on Typology, Consequences, and Remedies. Land Use Policy 2016, 57, 694–701. [Google Scholar] [CrossRef]
- Jürgenson, E. Land Reform, Land Fragmentation and Perspectives for Future Land Consolidation in Estonia. Land Use Policy 2016, 57, 34–43. [Google Scholar] [CrossRef]
- Hentunen, H.; Konttinen, K. Surveying the Regional Need for Land Consolidations from GIS Information in Finland. In Proceedings of the FIG Congress, FIG Congress 2022, Warsaw, Poland, 11–15 September 2022; p. 11374. [Google Scholar]
- Vitikainen, A. An Overview of Land Consolidation in Europe. Nord. J. Surv. Real Estate Res. 2004, 1, 25–44. [Google Scholar]
- Cegielska, K.; Noszczyk, T.; Kukulska, A.; Szylar, M.; Hernik, J.; Dixon-Gough, R.; Jombach, S.; Valánszki, I.; Filepné Kovács, K. Land Use and Land Cover Changes in Post-Socialist Countries: Some Observations from Hungary and Poland. Land Use Policy 2018, 78, 1–18. [Google Scholar] [CrossRef]
- Jankava, A.; Parsova, V.; Gurskiene, V. Approaches of Consolidation of Land Properties in Rural Area of Latvia. Sci. J. Balt. Surv. 2014, 20, 32–39. [Google Scholar]
- Pašakarnis, G.; Maliene, V. Towards Sustainable Rural Development in Central and Eastern Europe: Applying Land Consolidation. Land Use Policy 2010, 27, 545–549. [Google Scholar] [CrossRef]
- Muchová, Z.; Petrovič, F. Prioritization and Evaluation of Land Consolidation Projects—Žitava River Basin in a Slovakian Case. Sustainability 2019, 11, 2041. [Google Scholar] [CrossRef]
- Crecente, R.; Alvarez, C.; Fra, U. Economic, Social and Environmental Impact of Land Consolidation in Galicia. Land Use Policy 2002, 19, 135–147. [Google Scholar] [CrossRef]
- Stańczuk-Gałwiaczek, M.; Sobolewska-Mikulska, K.; Ritzema, H.; van Loon-Steensma, J.M. Integration of Water Management and Land Consolidation in Rural Areas to Adapt to Climate Change: Experiences from Poland and the Netherlands. Land Use Policy 2018, 77, 498–511. [Google Scholar] [CrossRef]
- Louwsma, M.; Konttinen, K.; Eugene Chigbu, U.; Zhovtonog, O. Generic Tooling for Land Consolidation–The Concept Explained (10748). In Proceedings of the Land Consolidation: From Plan to Implementation FIG Working Week 2020 Smart Surveyors for Land and Water Management, Amsterdam, The Netherlands, 10–14 May 2020. [Google Scholar]
- Martyn, A.; Koshel, A.; Hunko, L.; Kolosa, L.O. Land Consolidation in Ukraine after Land Reform: Voluntary and Forced Mechanisms. Acta Sci. Pol. Adm. Locorum 2022, 21, 223–229. [Google Scholar] [CrossRef]
- Siedlarczyk, E.; Winczek, M.; Zięba-Kulawik, K.; Wężyk, P. Smart green infrastructure in a smart city–the case study of ecosystem services evaluation in Krakow based on i-tree eco software. Geosci. Eng. 2019, 65, 36–43. [Google Scholar] [CrossRef]
- Lehtonen, H.; Rämö, J. Development towards Low Carbon and Sustainable Agriculture in Finland Is Possible with Moderate Changes in Land Use and Diets. Sustain. Sci. 2023, 18, 425–439. [Google Scholar] [CrossRef]
- Kokoszka, S.; Daniel, Z. Arrangement of fields on the farm and the distances and expenditures in internal transport. Infrastruct. Ecol. Rural Areas 2018, 1, 79–88. [Google Scholar] [CrossRef]
- Wysokiński, M.; Domagała, J.; Gromada, A.; Golonko, M.; Trębska, P. Economic and Energy Efficiency of Agriculture. Agric. Econ. Zemědělská Ekon. 2020, 66, 355–364. [Google Scholar] [CrossRef]
- Act. Act of July 31, 1923 on Land Consolidation; Poland, 1923; (Journal of Laws No. 92, item 718). Available online: https://isap.sejm.gov.pl/isap.nsf/download.xsp/WDU19230920718/O/D19230718.pdf (accessed on 10 October 2023).
- Act. Act of December 28, 1925 on the Implementation of the Agrarian Reform; Poland, 1925. (Journal of Laws No. 1, item 1). Available online: https://isap.sejm.gov.pl/isap.nsf/download.xsp/WDU19260010001/O/D19260001.pdf (accessed on 10 October 2023).
- Decree. Decree of the Polish Committee of National Liberation of September 6, 1944 on the Implementation of Agrarian Reform; Poland, 1944. (Journal of Laws No. 4, item 17). Available online: https://isap.sejm.gov.pl/isap.nsf/download.xsp/WDU19440040017/O/D19440017.pdf (accessed on 10 October 2023).
- Decree. Decree of August 16, 1949 on the Exchange of Land; Poland, 1949. (Journal of Laws No. 48, item 367). Available online: https://isap.sejm.gov.pl/isap.nsf/download.xsp/WDU19490480367/O/D19490367.pdf (accessed on 10 October 2023).
- Act. Act of January 24, 1968 on Land Consolidation and Exchange; Poland, 1968. (Journal of Laws No. 3, item 13). Available online: https://isap.sejm.gov.pl/isap.nsf/download.xsp/WDU19680030013/O/D19680013.pdf (accessed on 10 October 2023).
- Act. Act of March 26, 1982 on Land Consolidation and Exchange; Poland, 1982. (Consolidated text Journal of Laws of 2023, item 1197). Available online: https://isap.sejm.gov.pl/isap.nsf/download.xsp/WDU19820110080/U/D19820080Lj.pdf (accessed on 10 October 2023).
- Basista, I.; Balawejder, M. Assessment of Selected Land Consolidation in South-Eastern Poland. Land Use Policy 2020, 99, 105033. [Google Scholar] [CrossRef]
- Basista, I. Przykłady Wykorzystania Narzędzi GIS w Procesie Scalania i Wymiany Gruntów-The Use of GIS Tools in the Land Consolidation and Exchange Process-Examples. Infrastrukt. Ekol. Teren. Wiej. Infrastruct. Ecol. Rural Areas 2015, IV/1, 1047–1055. [Google Scholar] [CrossRef]
- Basista, I. Application of GIS Tools to Describe the Location of New Registered Parcels. Geomatics Environ. Eng. 2020, 14, 5–13. [Google Scholar] [CrossRef]
- Balawejder, M.; Noga, K. The Influence of the Highway Route on the Development of Patchwork of Plots. J. Water L. Dev. 2016, 30, 3–11. [Google Scholar] [CrossRef][Green Version]
- Veršinskas, T.; Vidar, M.; Hartvigsen, M.; Mitic Arsova, K.; van Holst, F.; Gorgan, M. Legal Guide on Land Consolidation; FAO: Rome, Italy, 2020; ISBN 978-92-5-132858-3. [Google Scholar]
- Tomšík, E.R.K. Competitiveness of the Finnish Agriculture after Ten Years in the EU. Agric. Econ.–Czech 2007, 53, 448–454. [Google Scholar] [CrossRef]
- Available online: www.stat.gov.pl (accessed on 10 October 2023).
- Available online: https://www.Maanmittauslaitos.Fi/Ajankohtaista/Blogi-Kuka-Omistaa-Maatamme-Ja-Missa (accessed on 10 October 2023).
- Available online: www.Geoportal.Gov.Pl (accessed on 10 October 2023).
- Available online: https://Kartta.Paikkatietoikkuna.Fi (accessed on 10 October 2023).
- Available online: https://Kartta.Hel.Fi/ (accessed on 10 October 2023).
- Available online: https://Land.Copernicus.Eu/Local (accessed on 10 October 2023).
- Hejmanowska, B.; Dąbrowski, J.; Kramarczyk, P.; Warchoł, A. Validation of GPS Receivers for Area Control in IACS: Accuracy Estimation of Trimble ProXT Beacon. Geomatyka i Inżynieria Kwart. Nauk. PWSTE Jarosław 2012, 4, 47–64. [Google Scholar]
- Available online: www.Nls.Fi (accessed on 10 October 2023).
- Balawejder, M.; Matkowska, K.; Colak, H.E. The Impact of Surveying Works on the Development of Smart City. In Proceedings of the Geographic Information Systems Conference and Exhibition “GIS ODYSSEY 2018”, Perugia, Italy, 10–14 September 2018; Ćwiąkała, P., Kwartnik-Pruc, A., Puniach, E., Eds.; Croatian Information Technology Society–GIS Forum: Perugia, Italy, 2018; pp. 20–32. [Google Scholar]
- Ogryzek, M.; Tarantino, E.; Rząsa, K. Infrastructure of the Spatial Information in the European Community (INSPIRE) Based on Examples of Italy and Poland. ISPRS Int. J. Geo-Inform. 2020, 9, 755. [Google Scholar] [CrossRef]
- Chiappini, S.; Giorgi, V.; Neri, D.; Galli, A.; Marcheggiani, E.; Malinverni, E.S.; Pierdicca, R.; Balestra, M. Innovation in Olive-Growing by Proximal Sensing LiDAR for Tree Volume Estimation. In Proceedings of the 2022 IEEE Workshop on Metrology for Agriculture and Forestry, MetroAgriFor 2022-Proceedings, Perugia, Italy, 3–5 November 2022. [Google Scholar]
- Krok, G.; Kraszewski, B.; Stereńczak, K. Application of Terrestrial Laser Scanning in Forest Inventory—An Overview of Selected Issues. For. Res. Pap. 2020, 81, 175–194. [Google Scholar] [CrossRef]
- Hawryło, P.; Francini, S.; Chirici, G.; Giannetti, F.; Parkitna, K.; Krok, G.; Mitelsztedt, K.; Lisańczuk, M.; Stereńczak, K.; Ciesielski, M.; et al. The Use of Remotely Sensed Data and Polish NFI Plots for Prediction of Growing Stock Volume Using Different Predictive Methods. Remote Sens. 2020, 12, 3331. [Google Scholar] [CrossRef]
- Grabska, E.; Hawryło, P.; Socha, J. Continuous Detection of Small-Scale Changes in Scots Pine Dominated Stands Using Dense Sentinel-2 Time Series. Remote Sens. 2020, 12, 1298. [Google Scholar] [CrossRef]
- Wanic, T.; Bodziarczyk, J.; Gąsiorek, M.; Hawryło, P.; Józefowska, A.; Kajdas, B.; Mazurek, R.; Szostak, M.; Usień, M.; Wężyk, P.; et al. Trophic Conditions of Forest Soils of the Pieniny National Park, Southern Poland. Soil Sci. Annu. 2017, 68, 205–211. [Google Scholar] [CrossRef][Green Version]
- Kolodiy, P.; Pidlypna, M. The Improvement of the Agricultural Yields Forecasting Model Using the Software Product “Land Viewer”. Geomatics Environ. Eng. 2020, 14, 5–67. [Google Scholar] [CrossRef]
- Makinde, E.O.; Andonegui, C.M.; Vicario, A.A. Green Space Assessment and Management in Biscay Province, Spain Using Remote Sensing Technology. Geomat. Environ. Eng. 2021, 15, 21–43. [Google Scholar] [CrossRef]
- Available online: https://www.Smartrural21.Eu/Smart-Solution/Digital-Village-Twin/ (accessed on 10 October 2023).
- Available online: https://www.Smartrural21.Eu (accessed on 10 October 2023).
- Bielska, A.; Stańczuk-Gałwiaczek, M.; Sobolewska-Mikulska, K.; Mroczkowski, R. Implementation of the Smart Village Concept Based on Selected Spatial Patterns—A Case Study of Mazowieckie Voivodeship in Poland. Land Use Policy 2021, 104, 105366. [Google Scholar] [CrossRef]
- Available online: https://www.iso.org/standard/78900.html (accessed on 12 November 2023).
- Arco, E.; Boccardo, P.; Gandino, F.; Lingua, A.; Noardo, F.; Rebaudengo, M. An integrated approach for pollution monitoring: Smart acquirement and smart information. ISPRS Ann. Photogramm. Remote Sens. Spat. Inf. Sci. 2016, IV-4/W1, 67–74. [Google Scholar] [CrossRef]
- Lei, B.; Janssen, P.; Stoter, J.; Biljecki, F. Challenges of Urban Digital Twins: A Systematic Review and a Delphi Expert Survey. Autom. Constr. 2023, 147, 104716. [Google Scholar] [CrossRef]
- Available online: https://www.Smartrural21.Eu/Smart-Solution/Drones-in-Agriculture/ (accessed on 10 October 2023).
- Apollo, M.; Jakubiak, M.; Nistor, S.; Lewinska, P.; Krawczyk, A.; Borowski, Ł.; Specht, M.; Krzykowska-Piotrowska, K.; Marchel, Ł.; Pęska-Siwik, A.; et al. Geodata in science—A review of selected scientific fields. Acta Sci. Pol. Form. Circumiectus 2023, 22, 17–40. [Google Scholar] [CrossRef]
- Harasimowicz, S.; Janus, J. Using computer technologies to analyse changes of transportation network as a result of land consolidation process, based on selected example. Infrastruct. Ekol. Rural AREAS 2008, 3, 83–91. [Google Scholar]
- Biljecki, F.; Chew, L.Z.X.; Milojevic-Dupont, N.; Creutzig, F. Open Government Geospatial Data on Buildings for Planning Sustainable and Resilient Cities. arXiv 2021, arXiv:2107.04023. [Google Scholar]
- Coetzee, S.; Ivánová, I.; Mitasova, H.; Brovelli, M.A. Open Geospatial Software and Data: A Review of the Current State and a Perspective into the Future. ISPRS Int. J. Geo-Inf. 2020, 9, 90. [Google Scholar] [CrossRef]


Disclaimer/Publisher’s Note: The statements, opinions and data contained in all publications are solely those of the individual author(s) and contributor(s) and not of MDPI and/or the editor(s). MDPI and/or the editor(s) disclaim responsibility for any injury to people or property resulting from any ideas, methods, instructions or products referred to in the content. |
© 2023 by the authors. Licensee MDPI, Basel, Switzerland. This article is an open access article distributed under the terms and conditions of the Creative Commons Attribution (CC BY) license (https://creativecommons.org/licenses/by/4.0/).