1. Introduction
In order to achieve a high penetration of VRE (Variable Renewable Energy, such as solar and wind energy) in the energy market, the problem of production/load matching must be solved by suitable strategy of production and adequate storage systems [
1,
2,
3,
4]. Two key factors when developing a suitable strategy are: (i) the integration of different technologies with complementary aspects, and (ii) the use of large and economically viable storage systems that can store energy produced from various sources, for better integration.
The integration of photovoltaic (PV) with concentrated solar–thermal power (CSP) systems is promising due to their complementarity [
5,
6,
7,
8,
9]: PV provides low-cost electric energy that can be—in large part—directly used to supply daily load, while CSP produces easily storable heat that can be used to supply the night load (via a power block). Integration models proposed in the literature involve many different configurations both for the CSP plant (parabolic trough, solar tower, linear Fresnel) and the PV configuration (fixed or tracking, flat-plate or concentrating). The integration type can be classified into two categories: non-compact, when the CSP and PV systems are two almost-independent plants which share at most the energy storage; or compact, when the two technologies are fully integrated (such as a single solar field with a PV/thermal receiver). The potential of non-compact hybrid CSP–PV plants under different configurations and technologies has been investigated by many authors [
10,
11,
12,
13]: different CSP technologies such as parabolic troughs, linear Fresnel concentrators, solar towers have been considered, together with different options for the PV plant (fixed-angle or tracking panels, flat plate, or concentrated PV). There is a general agreement that the integration leads to a strong increase in the daily load potentially supplied by solar source, with respect to CSP-alone or PV-alone plants. The increase in the energy production cost with respect to PV-alone is easily compensated by the possibility to supply energy on-demand, also when the renewable energy source is scarce and the energy price is more remunerative.
This work will illustrate an example of non-compact integration based on a new concept of a CSP tower system, even though research activity has been recently focused on compact CSP–PV systems [
14,
15]. The low cost and reliability of commercial PV flat-plate solutions are directly exploitable for non-compact integrated systems, while the complex optical solutions that are required by compact integration are currently less attractive. Contrarily, there are not strictly technical reasons for the current limited applications of non-compact hybrid systems, which can be explained by the general trend towards economical, fixed flat-plate PV-only plants; but it can be expected that, above a certain level of penetration of variable renewable energies, the interest in technologies that provide a better energy dispatchability will increase.
The presence of a thermal energy storage (TES) of the CSP system is fundamental to achieve the desired complementarity with the PV system, since TES allows to store energy for night usage. Moreover, the TES can be additionally used to store the excess of energy production of the PV field, that is converted to heat and partially recovered when the heat is supplied to the power block; this allows the PV capacity to be increased, avoiding excessive energy waste, as it does for the load fraction supplied by the CSP + PV system. The integration of electrochemical batteries in PV systems to store the extra PV power seems not to be profitable when the storage capacity is larger than 3 h, while TES can effectively reach storage capacity up to 16 h and more [
16,
17,
18]. Moreover, the use of the TES system of the CSP plant to store any surplus electricity is attractive due to its limited impact on the investment costs of the plant: the only additional element required is a system to discharge electrical energy in the TES: a conventional electrical heater, or maybe—for a suitable low-temperature TES—a heat pump. This approach has been recently proposed in a constant-load scenario [
19] and in both constant- and variable-load scenarios [
7], showing the advantages of the interaction between the CSP and the PV field through the TES.
In this paper, a detailed analysis of a non-compact integration between a CSP central tower system and a PV solar field is presented. Since tower systems allow a high working temperature—and, consequently, a high storage temperature—the excess of PV energy can be converted to high-grade heat, suitable for efficient re-conversion into electricity. The CSP tower system considered is an innovative design proposed by Magaldi Group [
20,
21]: it adopts a cavity receiver in which a solid particle fluidized bed with horizontal flow collects the concentrated radiation, and a two-tank storage system. Some advantages of a fluidized solid bed compared to other proposed solutions, such as falling particle receivers or cavity absorber [
22], are below listed:
The heat transport within the fluidized bed is very efficient, thus homogenizing the solid particles temperature and avoiding over-heating;
The residence time of the solid particles in the receiver can be controlled to obtain the desired target temperature, according to either the available irradiation or inlet particles temperature;
Transient phases and non-production phases (such as the pre-heating of the fluidized bed receiver) can be easily managed.
In
Section 2, a description of the system is provided, whereas
Section 3 describes the stationary efficiency functions adopted for the different elements of the plant: heliostat field, CSP receiver, PV field and power block.
Section 4 details the integration scheme and the simulation procedure whereas, in
Section 5, results are presented and discussed.
2. Plant Description
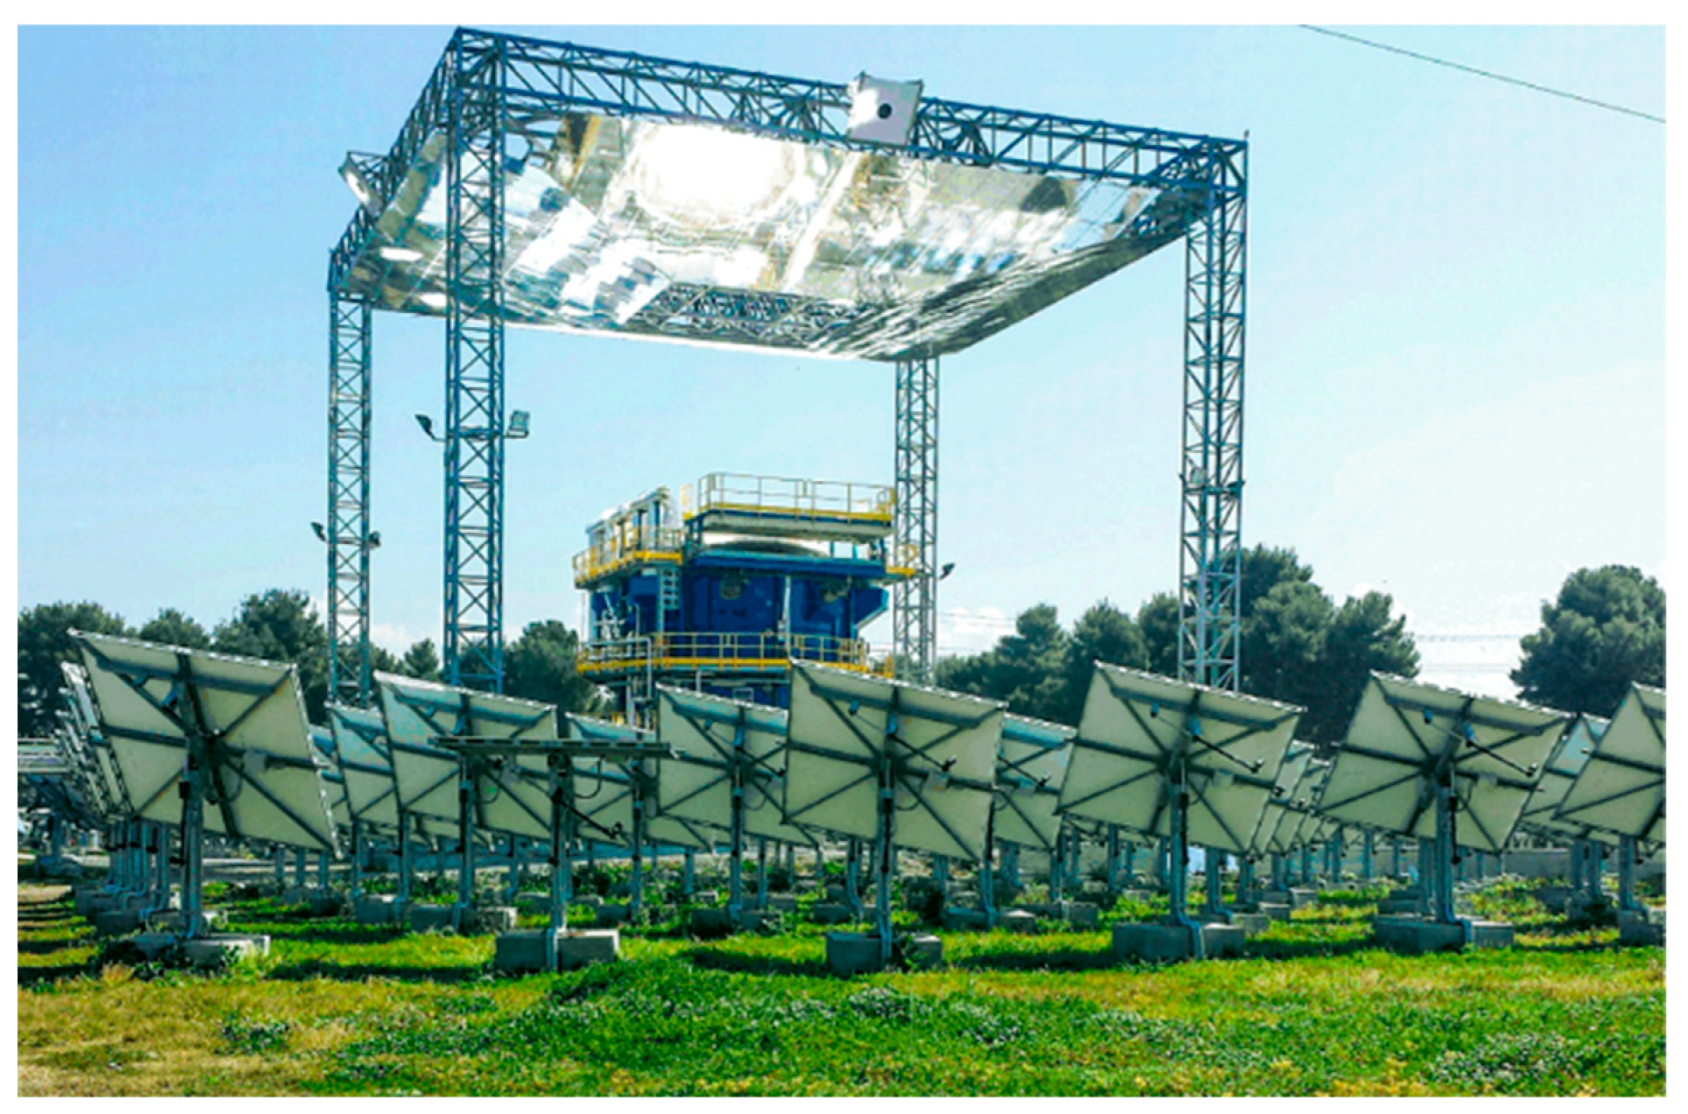
The two main elements of the integrated plant are the CSP tower system with integrated thermal storage and the PV solar field. In the last decade, Magaldi developed a concentrating solar power system, STEM
® (Solar Thermo Electric Magaldi, San Filippo Del Mela, ME, Italy), composed of a heliostats field with secondary beam-down reflector and a fluidized bed of silica sand. Particularly, the STEM
® fluidized bed system, realized so far (see
Figure 1), features a single “tank”, which contains the solid particles fluidized bed and accomplishes the three functions of (a) solar receiver, (b) heat storage, (c) heat transfer to the heat transfer fluid (HTF). In this case, the heat is transferred from the fluidized bed heat storage to the HTF by means of a heat exchanger immersed in the fluidized bed.
A demonstration plant (
Figure 1), based on that concept, was built at the A2A power plant in San Filippo del Mela, (Messina, Italy), in 2016, with 2 MW solar peak power, and was operated for over 12,000 h, generating steam up to 550 °C and 50 bar, with temperatures over 600 °C in the fluidized bed.
As a continuation of the successful test campaign of the STEM
® demonstration plant and following the recent development pathways of scientific research and industrial innovation of CSP technology [
23,
24], Magaldi introduced a different system configuration, still based on the fluidized bed solar receiver concept, to consolidate the potential exploitation of high temperature HTF for high-efficiency conversion cycles (e.g., supercritical CO
2, sCO
2) and the possible hybridization of the primary solar source with other renewable energy sources.
This different configuration (
Figure 2) features a solar tower with a solid particle fluidized bed, arranged on the top, rather than at the ground, which works only as solar receiver and incorporates an integrated beam-down: the heat storage is based on a two-tanks system (hot/cold tanks), located downstream of the fluidized bed receiver; high-temperature HTF is generated by a solid particles/HTF counter-current heat exchanger (
Figure 2), located between the hot and cold tanks (in place of the in-bed heat exchanger of the system at
Figure 1). The solid particles mass flow rate from the hot tank to the counter-current heat exchanger can be adjusted by means of a dedicated feeder extractor. Also, mass flow rate from the fluidized bed receiver to the hot tank is adjustable. Thanks to the integration of the counter-current heat exchanger between hot and cold tanks, this configuration (compared to the CSP fluidized bed plant design in
Figure 1) allows the temperature of the generated HTF to be stabilized, maintaining it very close to the particles’ maximum temperature, given the same maximum temperature of the fluidized bed particles. Consequently, this allows a power block (such as a steam or sCO
2 turbine) to be driven with a higher average efficiency over time, keeping the same maximum solid particles temperature.
Compared to other CSP tower technologies proposed in the literature, based on particle receivers (such as falling particle or cavity absorber receivers [
22]) and including hot/cold tanks and counter-current heat exchanger, the system configuration at
Figure 2 is characterized by (i) a solid particles fluidized bed receiver, with integrated beam-down and lateral solar apertures, and (ii) a solid particles mechanical transport system, suitable for high temperature levels, consisting in close and thermally insulated mechanical conveyors (Magaldi “Ecobelt” type [
25,
26]), featuring excellent reliability and limited heat losses. As mentioned in
Section 1, the proposed fluidized bed solar receiver allows to obtain (i) high thermal diffusivity in the particle flows to guarantee a homogeneous temperature distribution, (ii) suitably long and adjustable residence time of the irradiated solid particles, in order to efficiently control the particles outlet temperature.
The above-described CSP tower configuration was conceptualized in the context of the SOLARGRID project [
27].
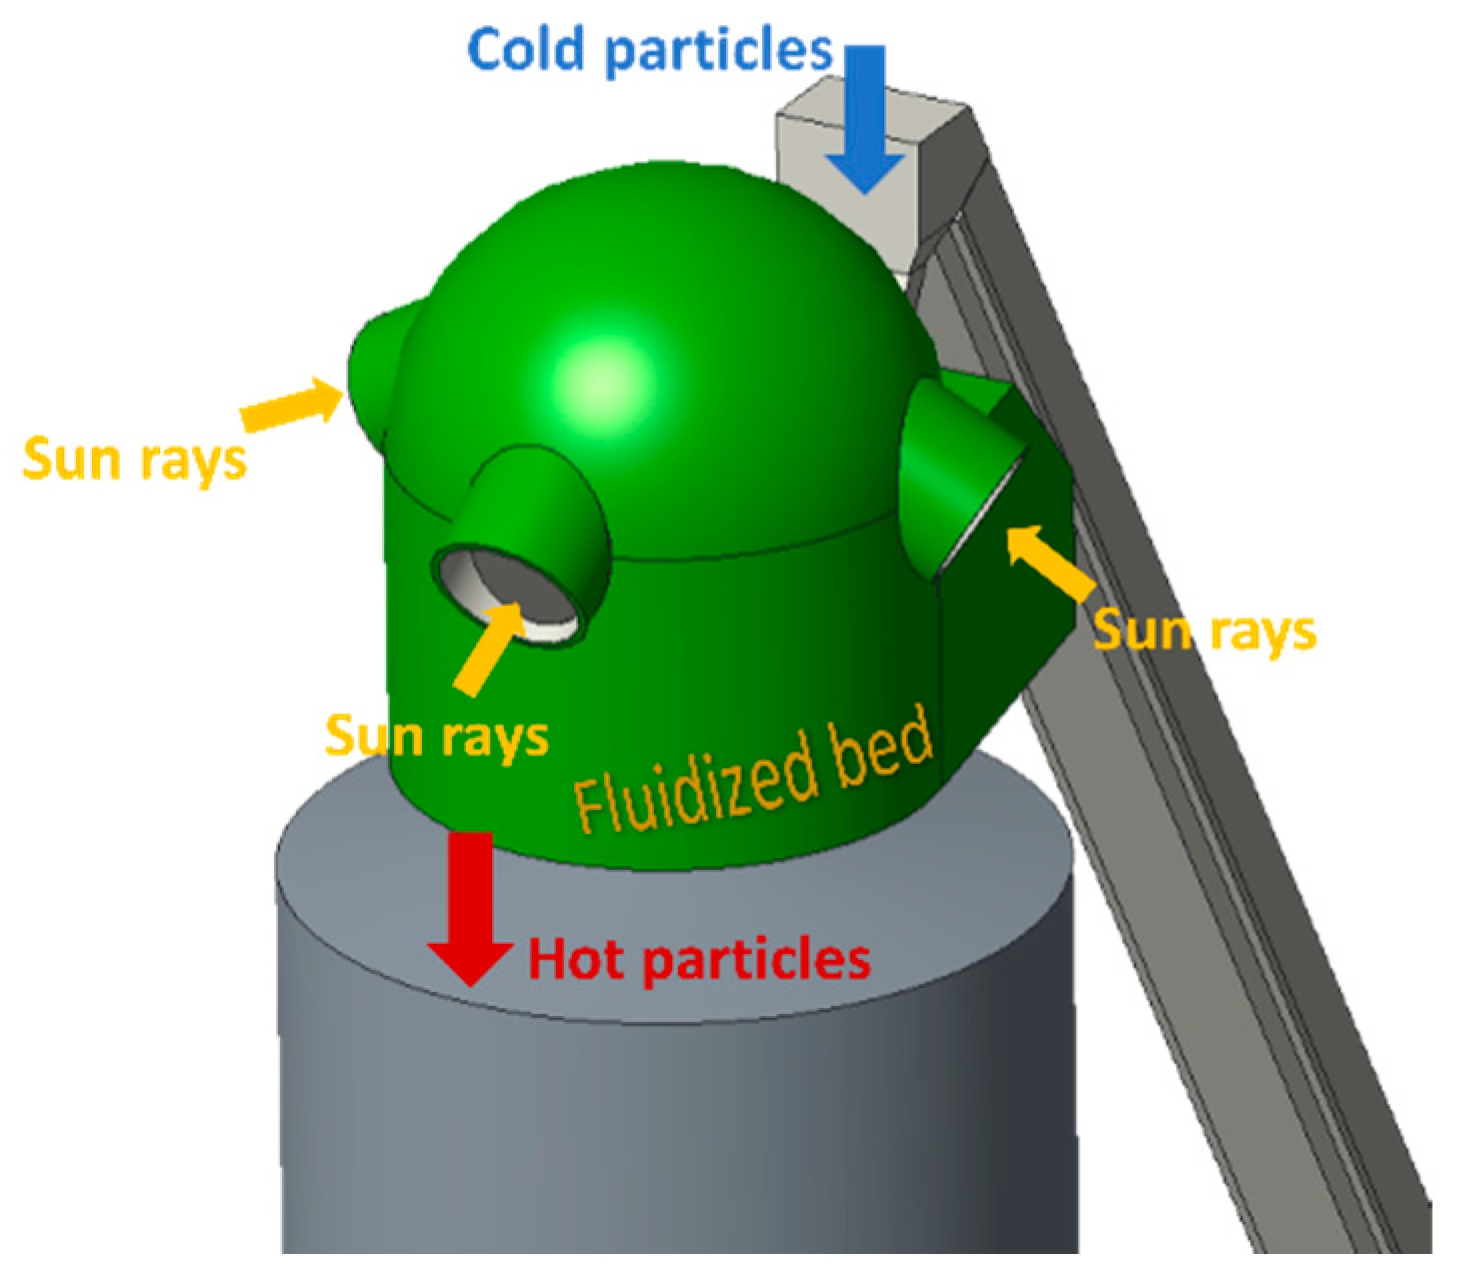
In the present paper, the Solar Tower (ST) is powered by a heliostat field, distributed around the tower and divided into three angular sectors, each aiming at one of the three receiver openings. The selected disposition of the heliostat is aimed at obtaining the maximum collection of solar radiation on a yearly basis, for a given nominal power at the receiver openings. The receiver is open, without glass or quartz windows, and the openings are inclined with respect to the vertical direction, to face the corresponding sector of the solar field with the smallest incidence angle.
As already mentioned, the receiver contains a fluidized bed, where granular materials with high solar absorbance [
28] (such as “black proppants”, olivine, etc.) can be employed as heat absorber. Particularly, the black proppant can be considered a suitable option: they are engineered ceramics particles, already adopted in CSP solid particles receivers [
22], with good optical properties, specifically high solar absorptivity and temperature stability [
28], as well as suitability for fluidization in case of a proper particle size distribution. Particles, transported from the cold tank to the top of the tower via a thermally insulated mechanical conveyor system (Magaldi Ecobelt conveyors), are introduced into the fluidized bed receiver from above and fluidized by an air flux. The fluidized bed receiver, thanks to an adjustable particles flow rate that can be tuned according to the actual direct normal irradiation (DNI) level, provides sufficiently long residence time and is capable of controlling the hot particles’ outlet temperature. Hot particles are then directly stored in the hot tank, positioned just below the solar receiver. A solid particle extractor transports the hot particles, at the desired rate, from the hot silo to the downstream heat exchanger. A high-temperature/pressure HTF is generated by the counter current solid particles heat exchanger, to drive a high efficiency power block (e.g., steam, CO
2 or sCO
2). A schematic representation of the system is represented in
Figure 3: the two tanks (hot and cold one) of the TES system and the heat exchanger are positioned inside the receiver tower. Furthermore, the electrical surplus of PV production is supplied as pre-heating of the solid particles during the conveying phase, therefore contributing to the overall energy collection and storage.
The size of PV and CSP plants and the size of the storage system have been defined considering a load with a peak demand of 10 MW
e (see below,
Section 4). The PV field is composed of flat, fixed, mono-Si panels. The panel spacing is assumed to be enough to avoid shadowing, and their orientation is selected in order to obtain the maximum electricity production at a given irradiation. An electric heating system is turned on to provide thermal energy to the particles in correspondence of a surplus of PV production.
The main characteristics of the investigated system are given in
Table 1.
3. Efficiency
3.1. Optical Efficiency of the CSP System
The optical efficiency of the CSP system depends on the sun position, given as Zenith
z and Azimuth G coordinates. The optical efficiency,
is defined as the ratio of the radiation entering the receiver openings to the DNI collected by the total heliostat area, as follows:
The first step to compute a performance map is the proper design of the solar field, here implemented via the software SolarPILOT (v. 1.1) [
29]. The optimal disposition of the heliostats obviously depends on the geographical location. Two locations have been here chosen, one in Spain (Long 4.999° W, Lat 37.457° N) and one in Australia (Long 121.355° E, Lat 24.467° S). The input meteorological data, obtained from Meteonorm, are hourly radiation sequences for these two locations, relative to the year 2005. In detail, the coordinates are not referred to any specific industrial site but selected for the TMY (Typical Meteorological Year) value of potential interest.
In the first case, the central opening of the receiver will face north; in the second case, it will face south. The other openings will face east and west directions.
The input data required by the software are the geometrical parameters of the heliostats and the receiver (see
Table 1) and the nominal power of the receiver, defined as the power collected at noon of summer solstice with DNI = 950 W/m
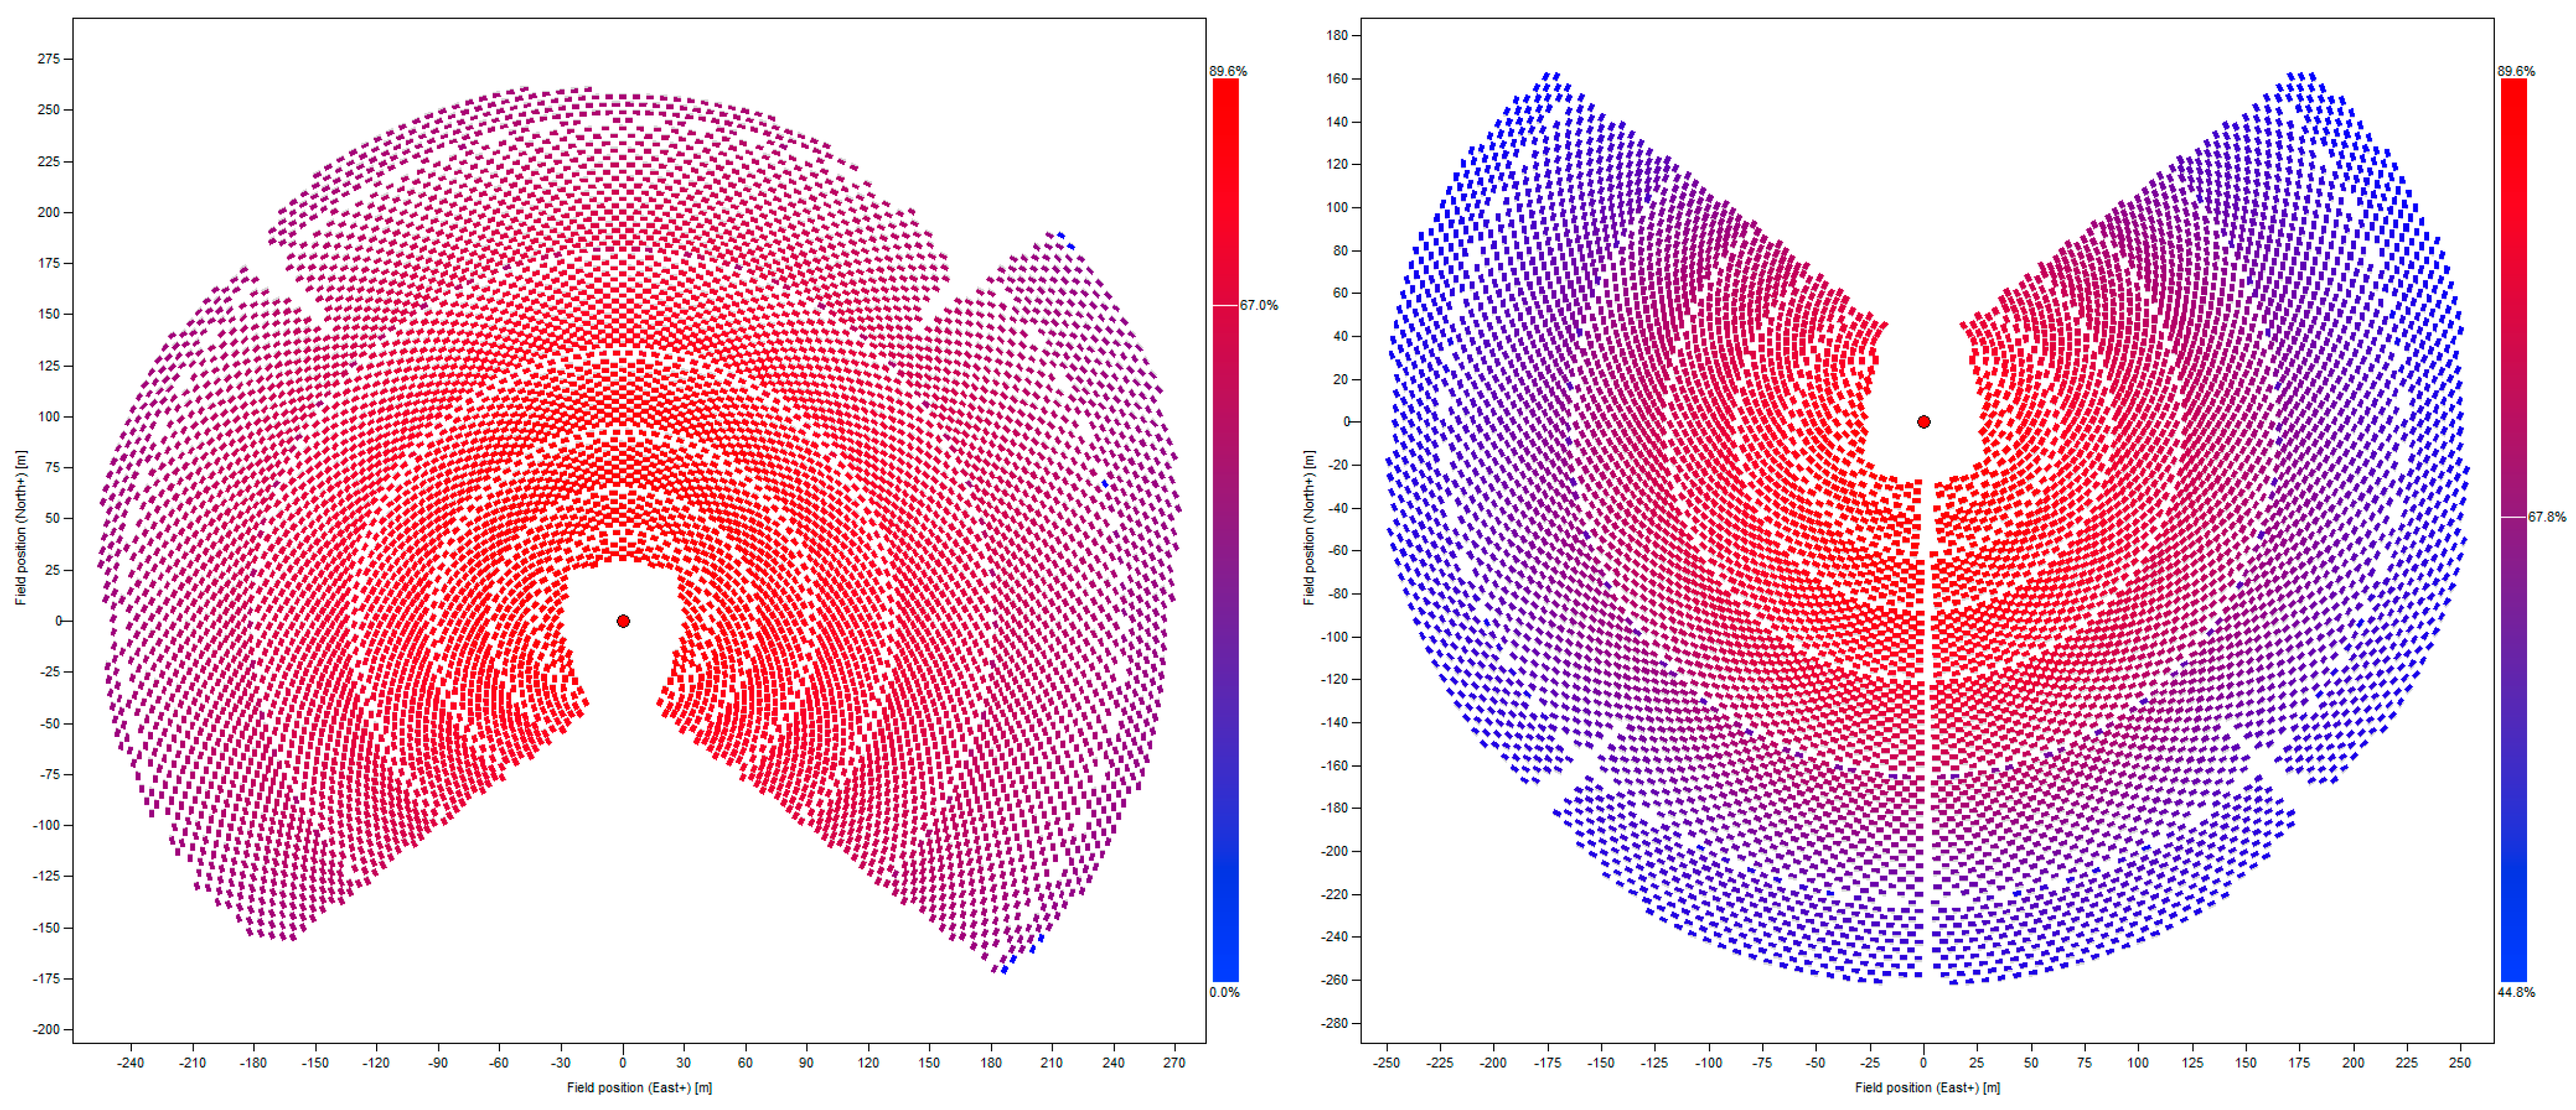
2. The optimization proceeds by cutting-off: the heliostats are initially disposed in all the available land (the area within 300 m from the tower) adopting local criteria for shadowing and blocking reduction, and then the least efficient (considering yearly efficiencies with real meteorological data) are eliminated one by one until the nominal power is the desired one. With a chosen nominal power of 32 MW, the obtained configurations are shown in
Figure 4. The number of heliostats required are 7249 (Spain) and 7125 (Australia). The configuration for Spain exhibits a marked asymmetry, probably due to local meteorological conditions.
z and Γ indicate the solar Zenith and the solar Azimuth, respectively. Once the configurations are obtained, the dependence of the optical efficiency on the position can be calculated on a (z, Γ) grid by placing the sun at the given point (z, Γ) of the grid and running a computation of the radiation collected with DNI = 1, then dividing by the overall area of the heliostats. The grid is saved in a table that will be used as an interpolation grid in the simulation, when the optical efficiency at a given sun position is required. In nominal conditions (sun at noon at summer solstice, DNI 950 W/m2), the optical efficiency is 64.9% for the Spanish site and 67.8% for the Australian site.
3.2. Efficiency of the Receiver
The efficiency of the receiver,
is defined as the ratio of the heat transferred to the solid particles to the radiation entering the receiver openings:
In the assumed case of three-openings receiver (
Figure 5), efficiency is mainly affected by thermal loss via convection and thermal irradiation. At the assumed working temperature of the solid particles (650 °C), thermal irradiation is likely to be the dominant loss factor.
The thermal irradiation loss has been computed via the radiative Montecarlo multi-band model implemented in FLUENT code, in the framework of SOLARGRID project [
27]. The irradiation models are based on steady-state solution of energy equation for the solar-cavity domain, assigning spectral proprieties to surface materials participating in solar irradiation and thermal re-emittance. The air in the cavity is assumed as a non-participating media to the balance, whereas the free top surface of the fluidized bed is assumed to be flat and at a constant average input temperature.
A simulation campaign has been assessed in which, for the given receiver geometry and materials, the efficiency of the receiver is explored in a closed domain of temperature,
Ts, of the fluidized bed (°C) and radiation power,
Wr, that enters the receiver (in MW). A polynomial correlation has been developed by means of fitting the pointwise steady-state solutions with the least-square algorithm, giving, for the geometry and materials used in the model, the following equation:
In this preliminary analysis, the convective heat loss has not been simulated in detail since it is expected to be less significant than the radiative loss. Anyway, to take into account this thermal loss contribution, a parametric study varying the convective losses in the range 0–35% (of the total thermal losses) has been performed.
When the receiver is not working, thermal losses in the fluidized bed are assumed as equivalent to 0.5 °C per hour.
3.3. Efficiency of the PV Field
The PV panels considered are commercial mono c-Si LG NeON R 380Q1C-V5 [
30]. The efficiency of the panel depends on the panel temperature
TPV, and the power produced can be obtained by [
31]:
where
Wpeak is given in kW and
TPV in °C. Furthermore,
IPV is the radiation on the panel surface,
Wpeak is the peak power of the PV field, defined as the output power produced with a radiation of 1000 W/m
2 on the panel surface at temperature
Tnoct,
K is the temperature coefficient of the cell and
A is an additional loss parameter;
Tnoct,
K, and
A are supplied by the manufacturer. The temperature
TPV of the panel can be estimated as
The following values are assumed as input data for the simulations:
Tnoct = 45 °C,
K = −0.37 °C
−1,
A = 4. The only remaining parameter needed to calculate the output power is the incident radiation
IPV on the panel surface. The radiation has three components: the direct radiation
Idir, the diffuse radiation
Idiff, and the radiation reflected from the ground
Iref. The panels have an orientation defined by the angles (β, Λ), where β and Λ are the Zenith and the Azimuth of the normal vector to the surface, respectively. Meteorological input data include: hourly data of DNI, global horizontal irradiation (GHI), and diffuse horizontal radiation (Dfh). The component
Idir is the product of DNI by the cosine of the incidence angle:
The component
Idiff, under the hypothesis of isotropic diffuse radiation, is obtained by multiplying D
fh by the sky view factor:
The reflected component is obtained by multiplying GHI by the ground albedo
a and the ground view factor:
The radiation incident on the panel is the sum of the three components:
The angles β and Λ are chosen to maximize the annual production of the PV field.
For the calculation of the power produced by PV field, a DC/AC conversion efficiency is set to 0.95.
The direct integration between PV and CSP plants takes place discharging the excess of PV electric production in the conveyor system, in order to pre-heat the particles stream before entering the solar receiver. The conversion of electricity into heat is conservatively assumed equal to 0.70.
3.4. Efficiency of the Power Block
Although the proposed CSP configuration may be associated to highly efficient innovative sCO
2 cycle [
32,
33], the thermodynamic cycle here assumed is a typical two-stage super-heated steam Rankine cycle, which currently is a conventional and cost-effective power block solution [
33]. The scheme and working principles of the adopted power block are shown in
Figure 6. The maximum working temperature is assumed to be 580 °C, the inlet pressures are 90 bar (high-pressure turbine) and 6 bar (low-pressure turbine); the capacity of the power block is set to 10 MW. The characteristics of this power block configuration were obtained in the literature [
34] and lead to an overall heat-to-electricity conversion efficiency of 39%. It is worth noticing that, in the perspective of a future optimization of this technology, the use of a sCO
2 cycle working at the same temperature levels, would result in a cycle efficiency in the range 44–48% [
33], and even 55–60% for more complex cycles at higher operating temperature (950–1150 °C) [
30].
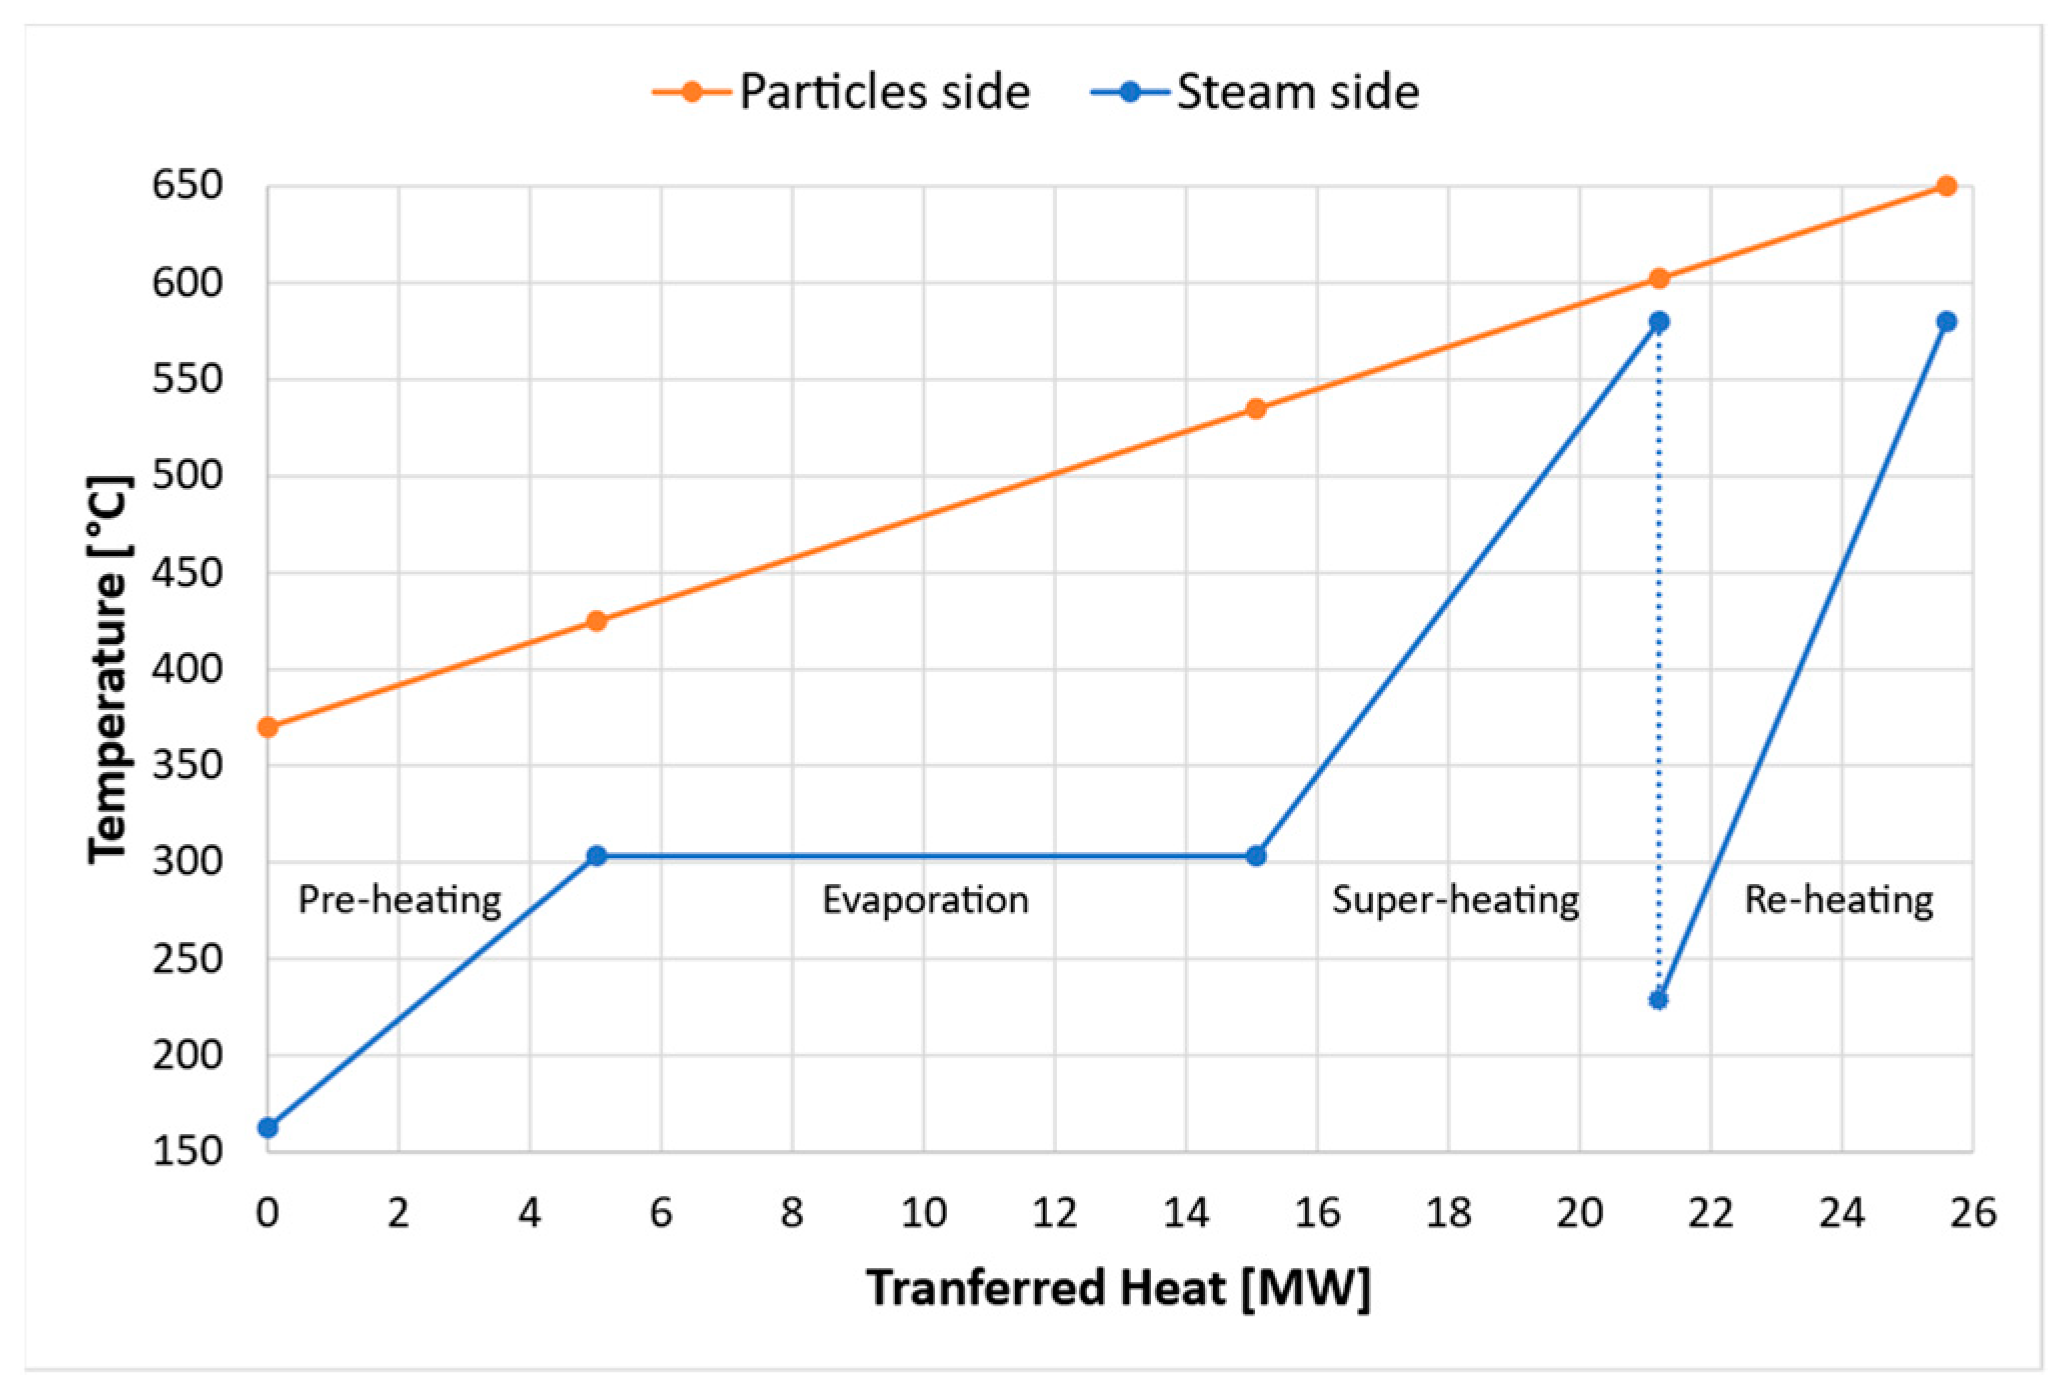
The power block here considered is fed by a solid particles/water counter-current heat exchanger. In the exchanger, water is pre-heated, evaporated, heated to 580 °C and sent to the high-pressure turbine and then in part re-heated to 580 °C for the second part of the cycle. In the process, the solid particles cool down from 650 °C to 370 °C and are sent to the cold tank. The efficiency of the heat exchanger, which is meant to work in close-to-nominal operating conditions over time, thanks to its coupling with the hot storage tank, is assumed constant and equal to 0.98, taking into account thermal loss to the environment.
In
Figure 7, the temperature profiles as a function of the transferred heat for the particle-side and for steam-side under the nominal conditions are shown. The inlet and outlet temperatures for the particles are 650 °C and 370 °C, respectively; on the other side, the water/steam enters at 160 °C, is pre-heated to around 303 °C, then the phases of evaporation, super-heating, and re-heating up to 580 °C follow.
4. Simulation
The CSP and PV plants are assumed to work alternatively, with PV supplying the daily energy demand and CSP covering the night load. Such a hypothesis excludes the simultaneous collection of sun energy and production of electric power at the power block. This is an advantage for the operation of the power block, since the hot tank can be stabilized to the target temperature before the activation of the solid particles/water heat exchanger; however, this choice necessarily reduces the working flexibility of the plant. This logic of “alternating” operation represents a possible promising control strategy but not necessarily the best option and was selected considering a short-time exploitation of the proposed technology: indeed, the recent developments in steam turbine technology, capable of withstanding frequent (even daily) start-up and shut-down demands [
35,
36], pave the way to a possible application of the technology in the near future. The operational strategy is very straightforward, simple to implement and achievable with current power-block technologies, and the control is simplified due to the predictability of the start-up operations. Of course, more refined strategies can be devised (such as the daily operation of the power block to assist PV generation) and the strategy optimization is surely an interesting (and vast) research topic. On the other hand, the analysis of more complex operating strategies would require a modelling approach heavily dependent on a series of assumptions, mostly for the power block (power range, change in efficiency), and is difficult to assess and verify, leading to possibly unrealistic solutions. Therefore, in the context of future research activities, alternative hybridization strategies, with an overlapping operation of the CSP and PV plants, will be analyzed and optimized, adopting standard methodologies and tools, like System Advisory Model, properly adapted and customized to take into account the peculiarities of the proposed technology.
With the aim of simulating the integration of the CSP and PV systems, some rules and decision criteria have been imposed for shifting from PV production to power block production or vice-versa, for managing low-radiation conditions and/or situations of empty/full energy storage. These rules are necessarily schematic and aimed at the simulation of the plant performance; in a real plant, each of the transitions should be operated adopting specific control strategies for transitory regimes.
For the CSP plant, four operating regimes are hypothesized:
On-sun storage: The solar radiation is collected by the receiver and the energy is absorbed by the cold particle stream and transferred to the hot tank. The power block is not active.
On-sun pre-heating: The radiation is collected by the receiver and absorbed by the solid particles contained in the receiver itself. The particles are gradually heated up the target working temperature of 650 °C. The power block is not active.
Off-sun generation: The solar radiation is not collected by the receiver. Energy is transferred from the thermal storage to the power block and electric energy is generated. The hot tank is discharged, and the cold tank is charged.
Off-sun standby: The CSP plant is inactive. The radiation is not collected, and the power block is not active.
The PV field does not require the definition of different working regimes: it is a static PV field that instantaneously produces electric power according to the incident radiation.
The working regimes of the CSP plant are set according to the following set of rules:
Regarding the destination of the energy produced by the PV field, the following possibilities are considered:
PV output requested is >instantaneous load and CSP storage is not full: the required power is consumed by the load, while the excess of PV production is used to pre-heat the cold particle stream;
PV output requested is >instantaneous load, storage is full: the required power is is consumed by the load, while excess of PV electric production is wasted;
PV output requested is <instantaneous load: all the power produced is consumed by the load.
This set of rules, together with the efficiency functions presented in
Section 3, allows to implement a step-by-step simulation of the system, according to the flowchart in
Figure 8. Additionally, it is assumed that, apart from the heat losses of the receiver, the heat losses of other plant sections are negligible. At each simulation step, date and time are given and the sun position (
z, Γ) is computed [
37]; the sun position is then used to calculate the power output of the heliostat field and of the PV field. The inputs required are the meteorological time series (containing the radiation values and temperature required to compute the PV cell efficiency) and the time series of the required energy load.
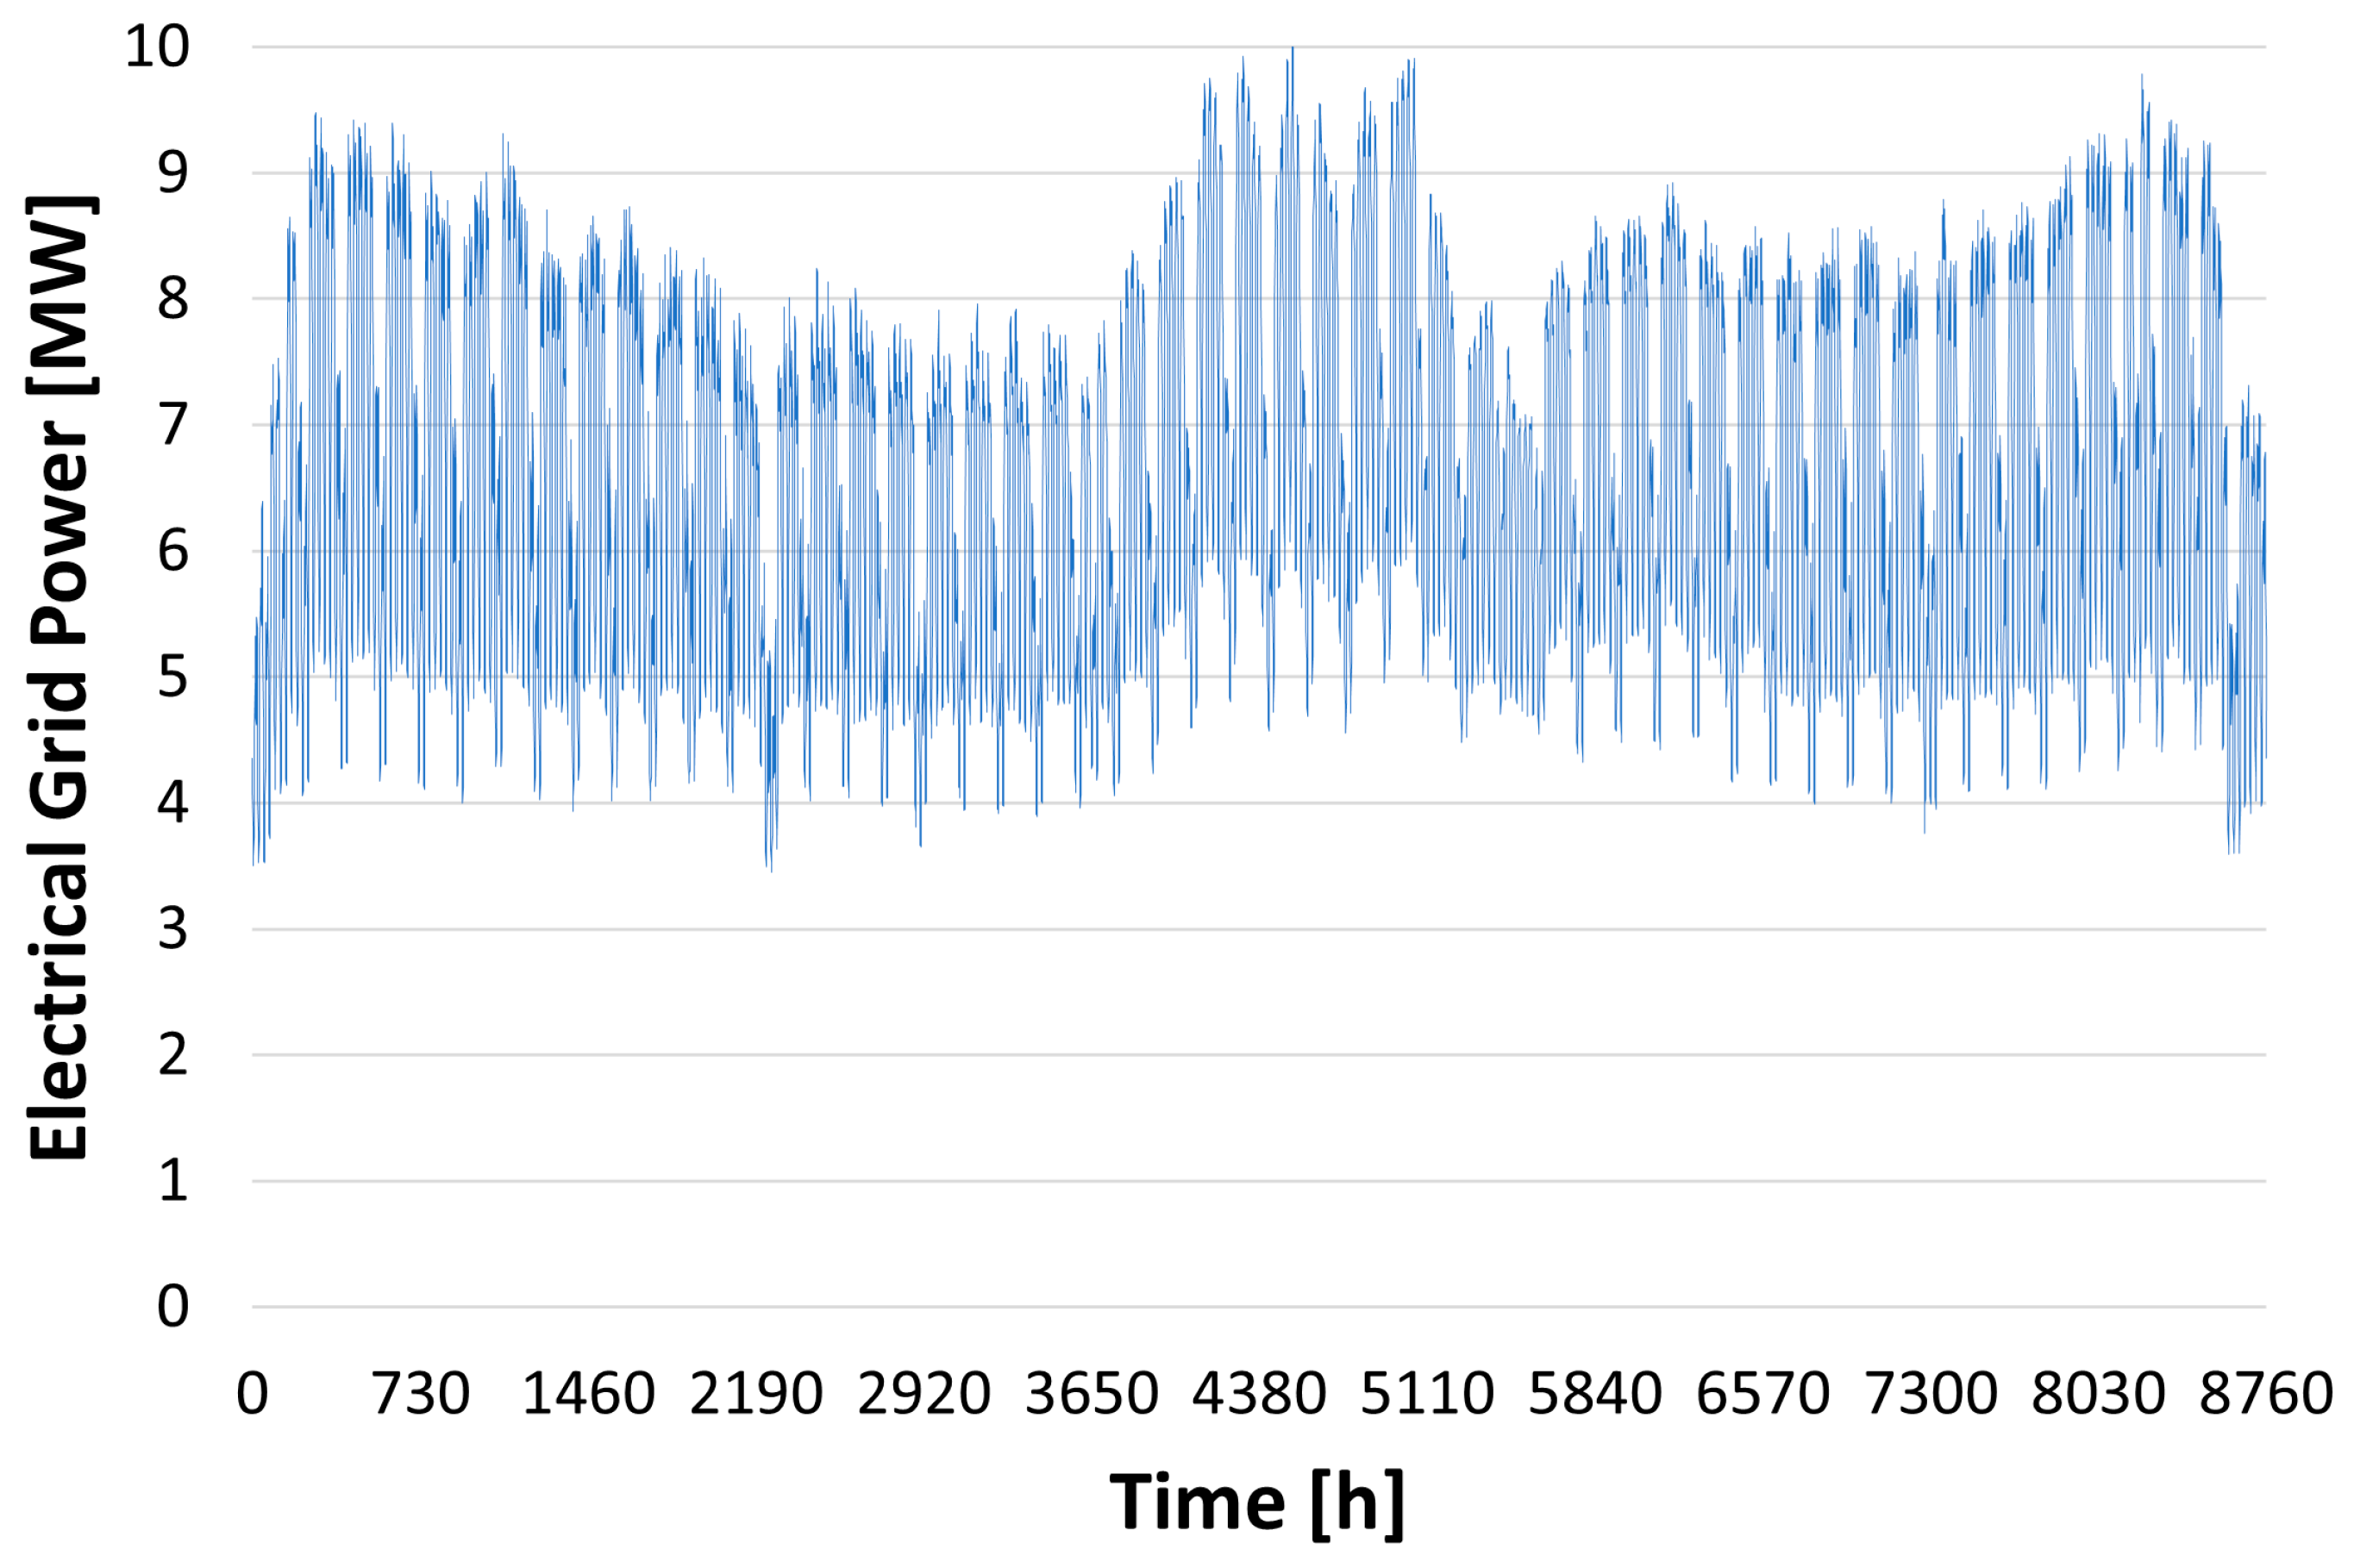
As already mentioned, the meteorological hourly series of the two chosen locations (Spain and Australia) for the year 2005 are used. Concerning the load time sequence, a plausible load profile was built from the data in [
38] relative to an Italian region (Sicily). The grid load profile includes the energy demands from residential and industrial districts and tertiary sectors. The resulting electrical grid load on an annual basis is shown in
Figure 9, while in
Figure 10 the typical load of winter and summer days is reported.
5. Results
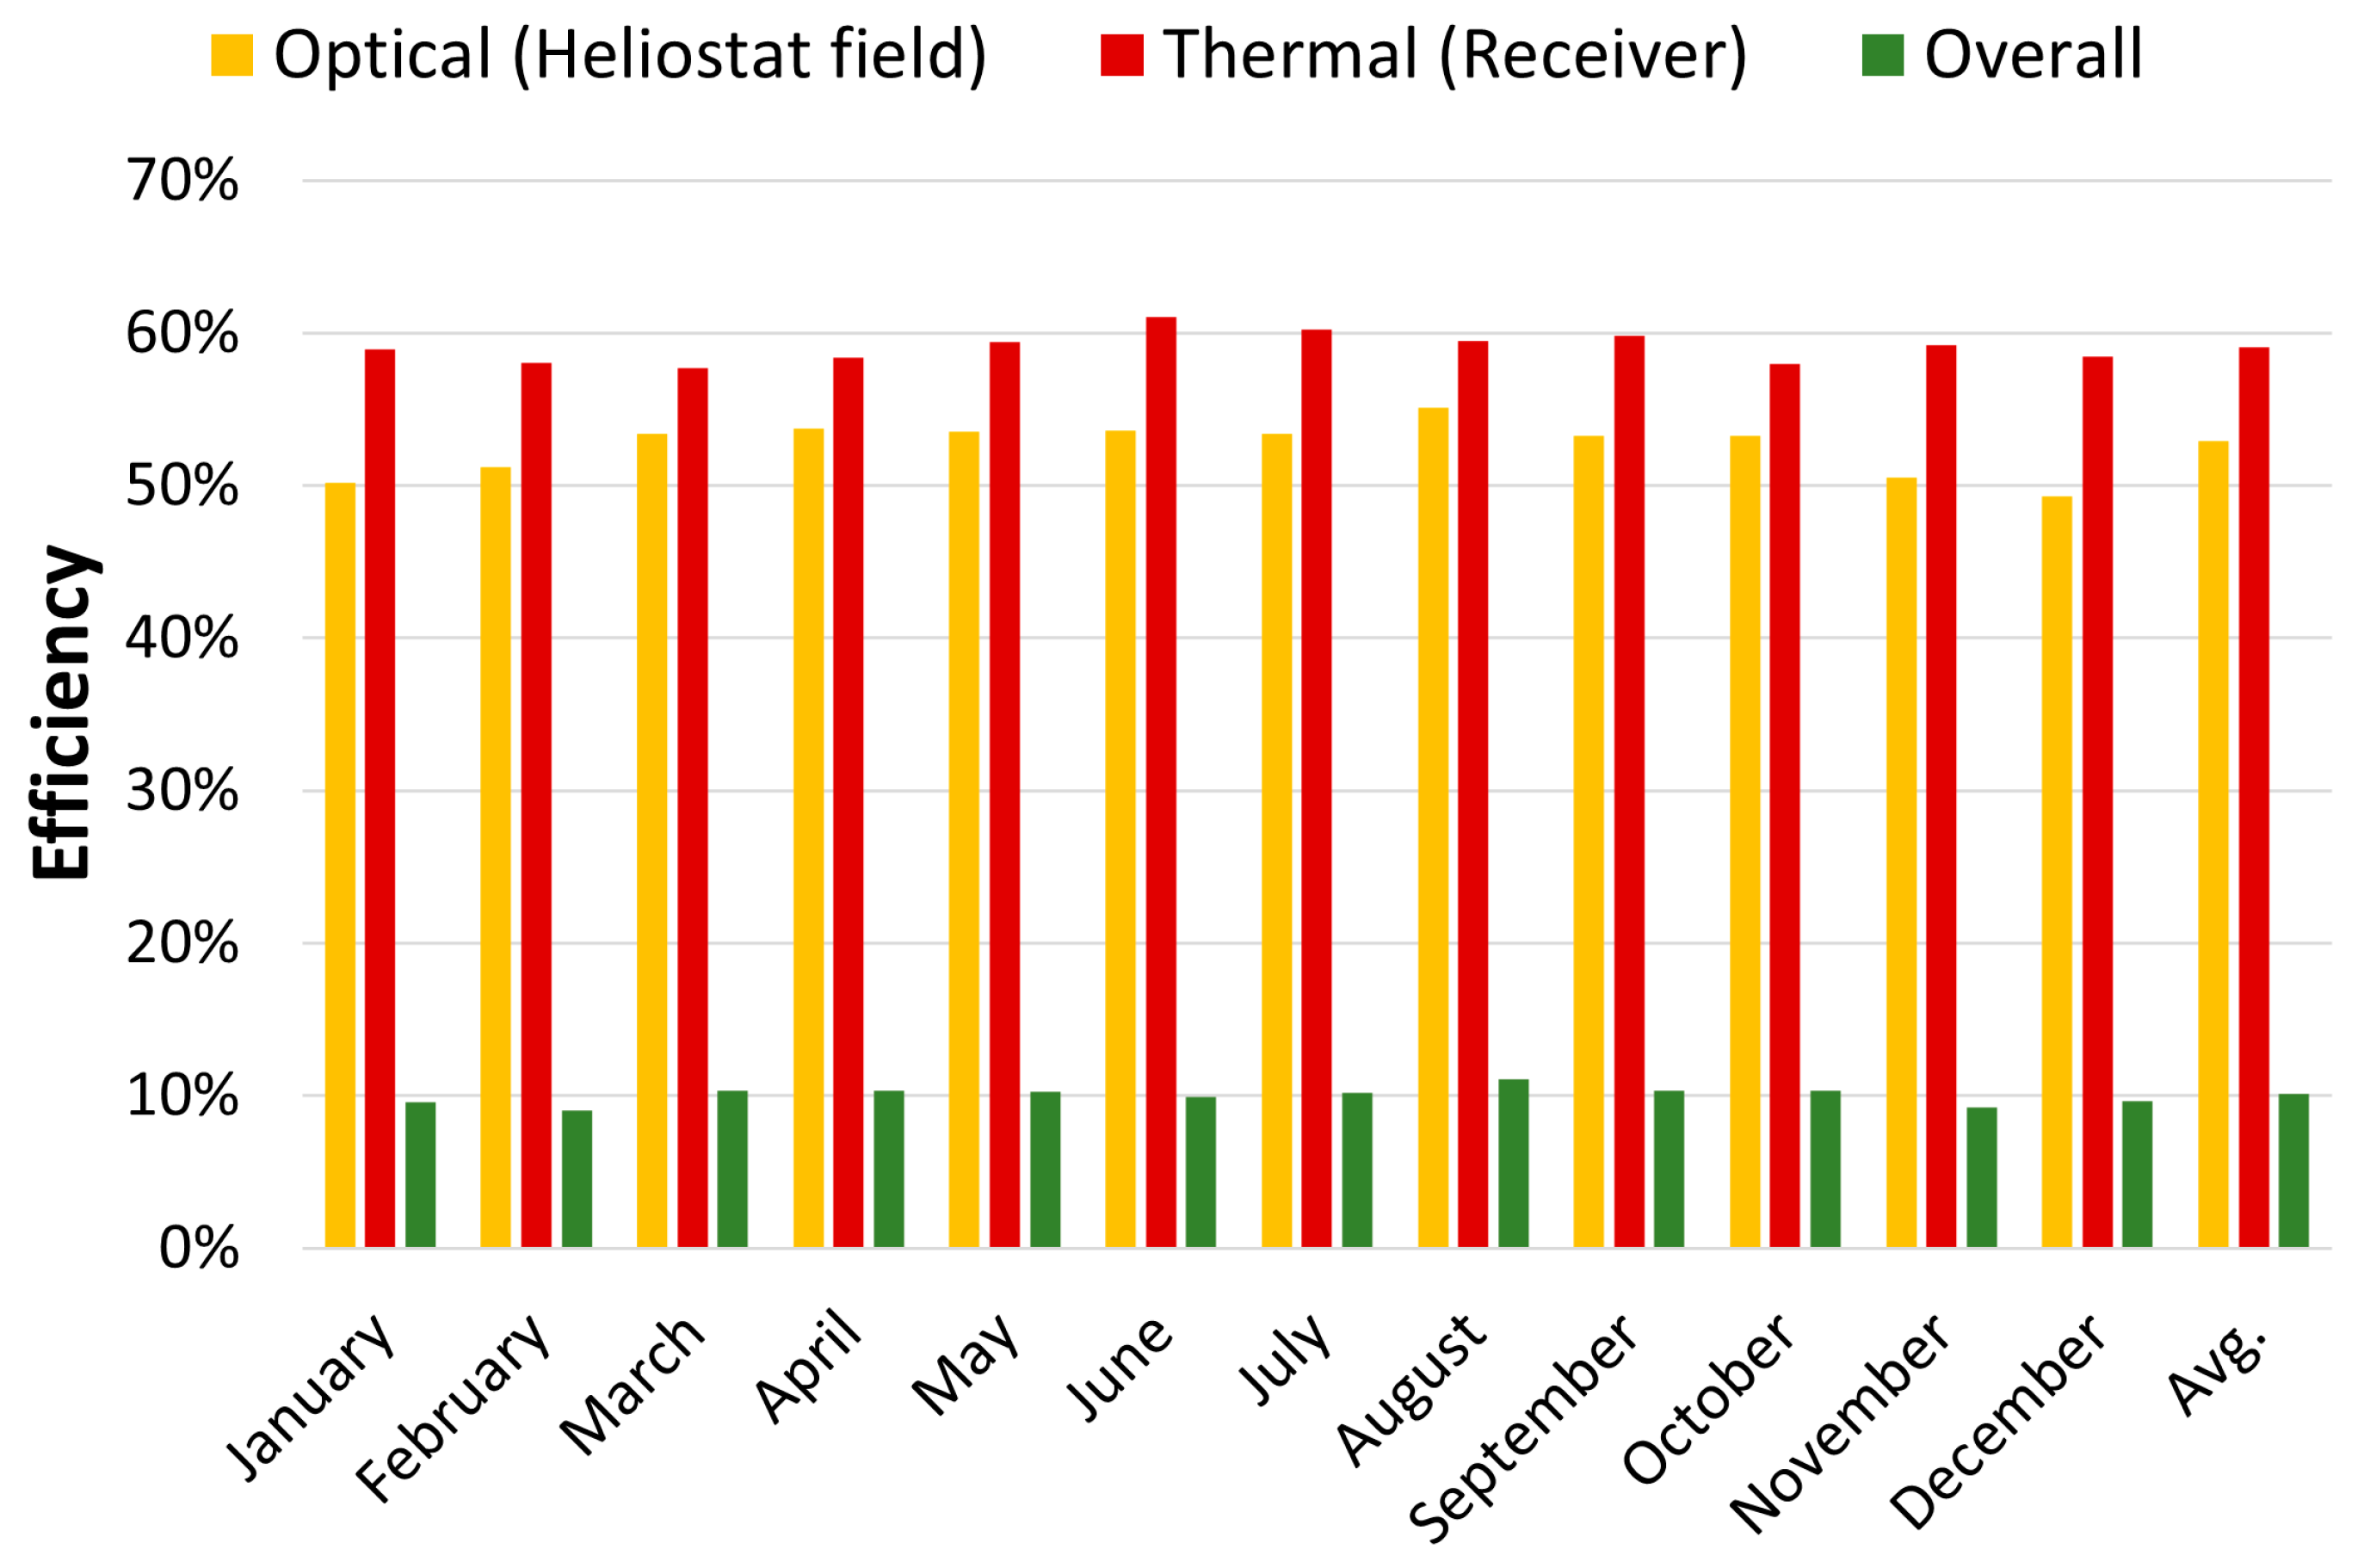
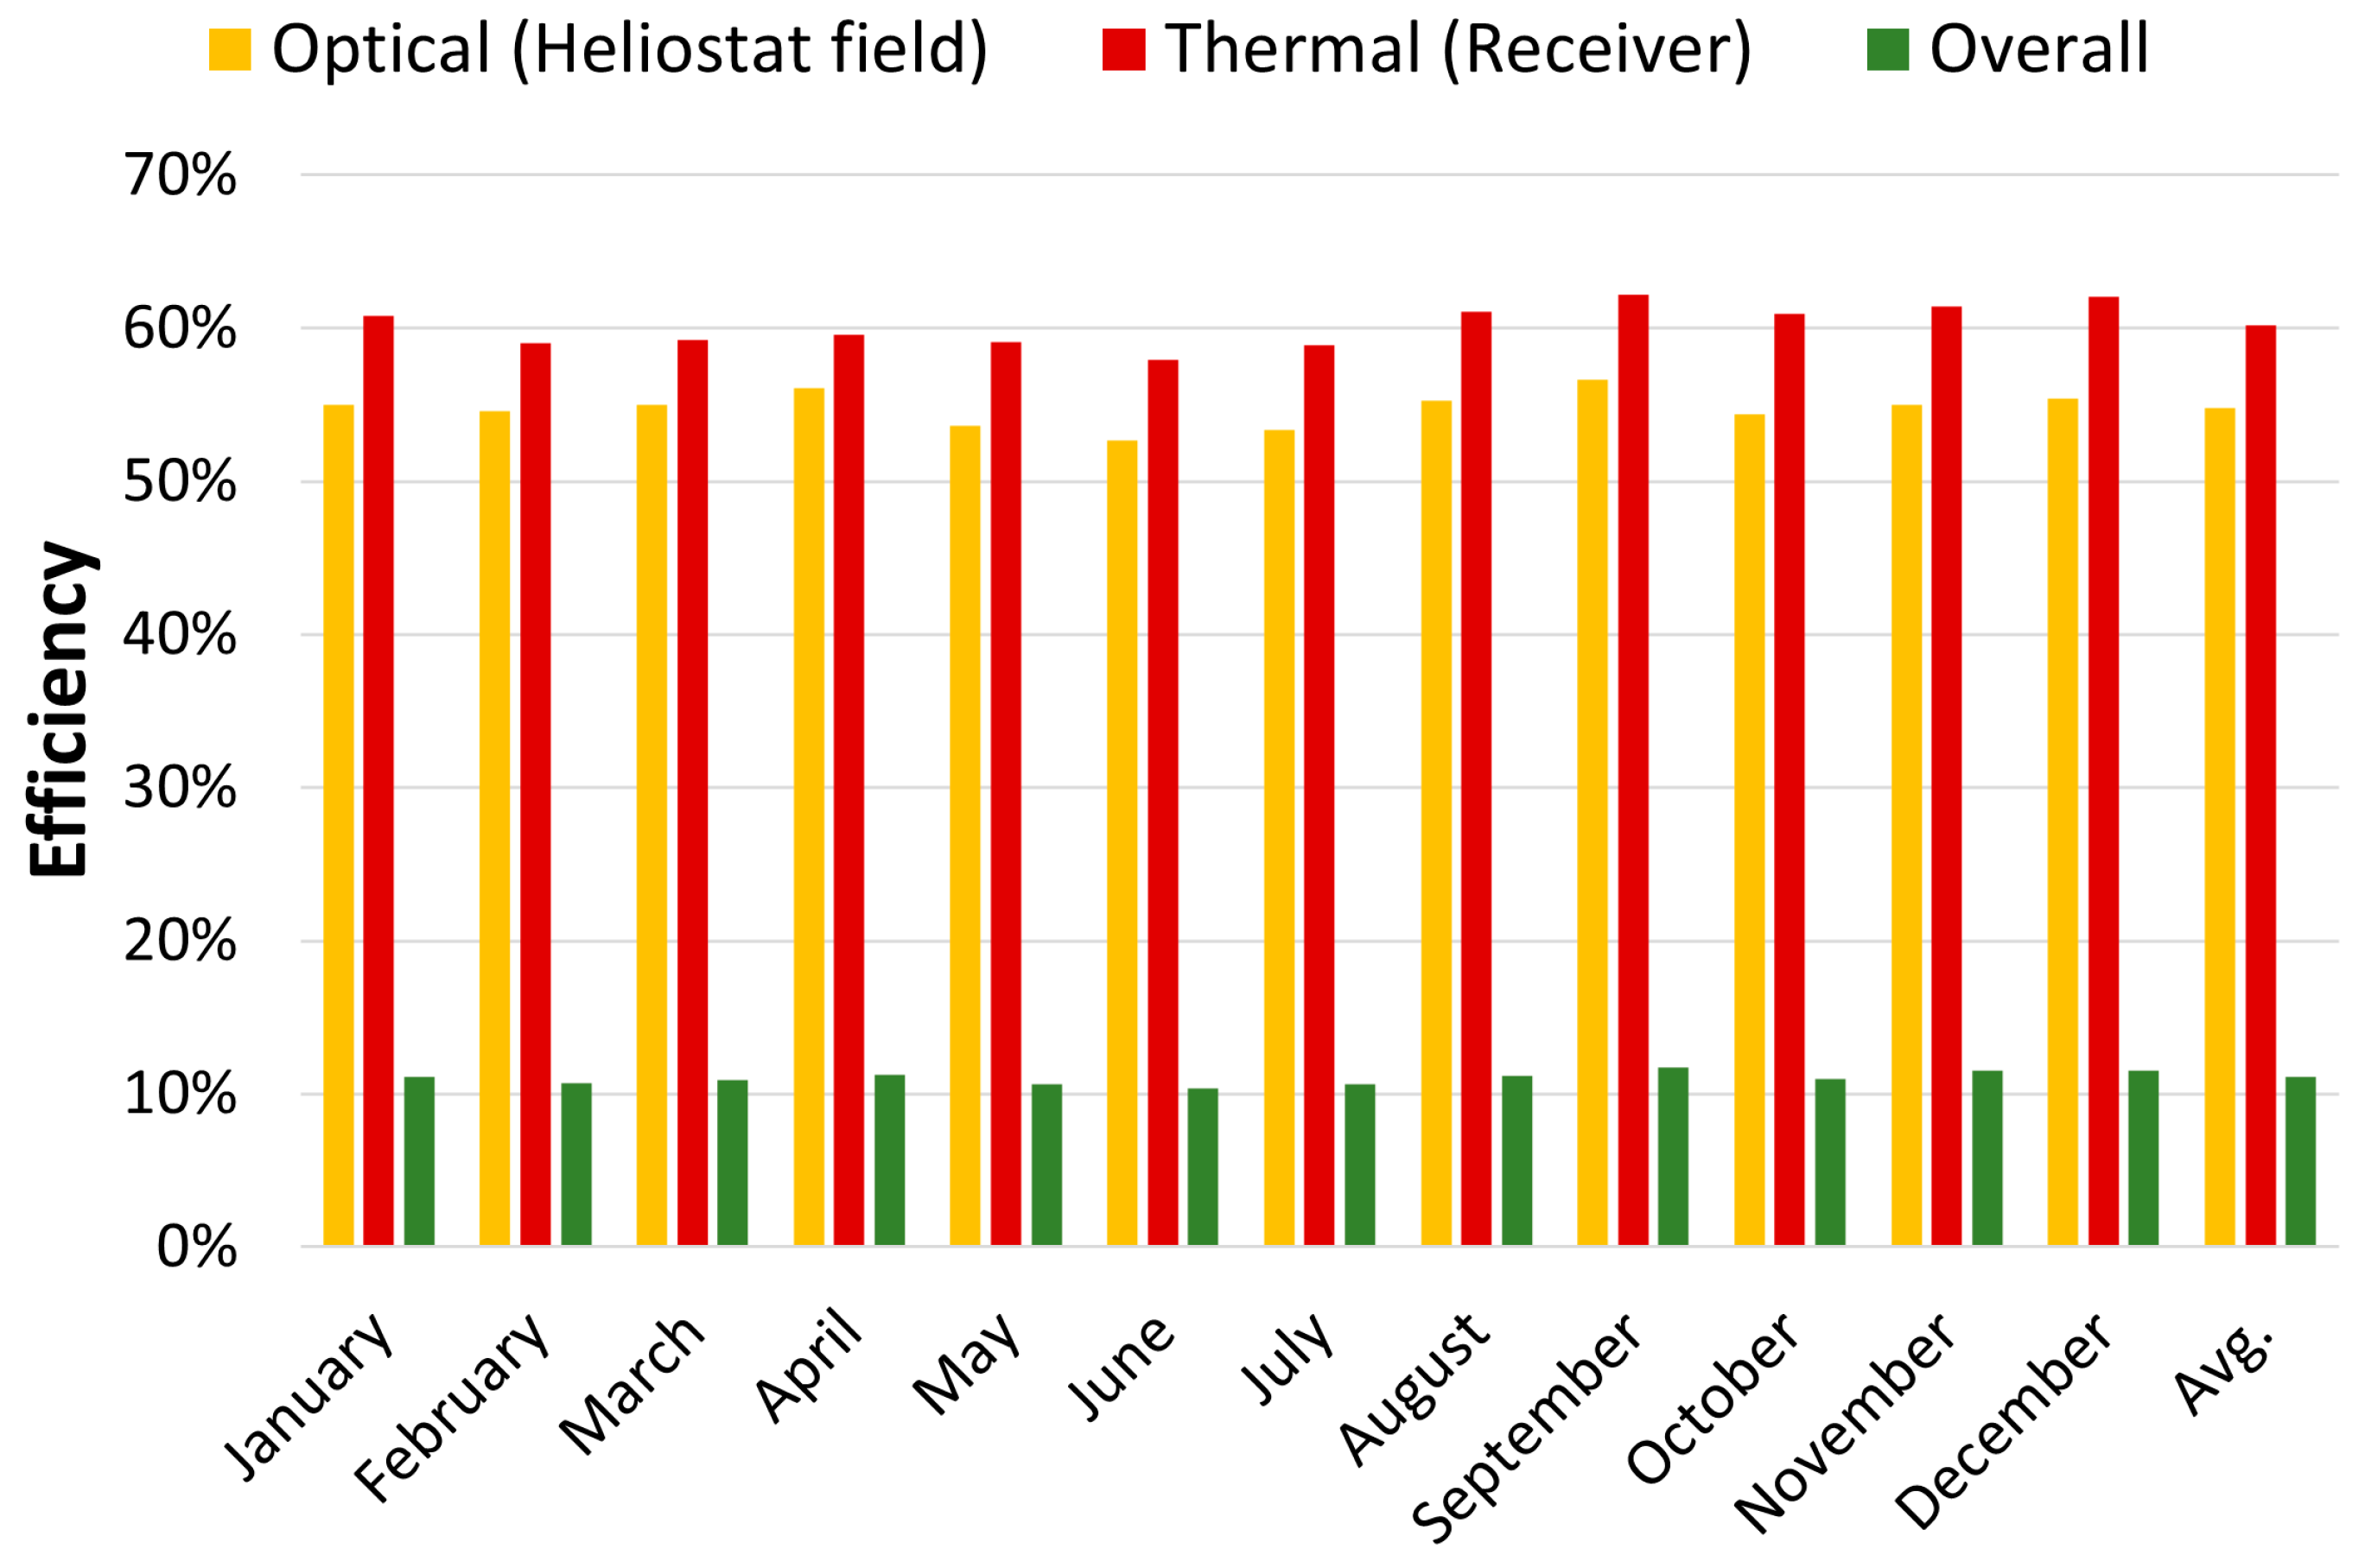
Referring to the analysis of the CSP system alone,
Figure 11 and
Figure 12 show the calculated optical efficiency of the heliostat field, the thermal efficiency of the receiver and the overall efficiency (from available solar energy to electrical energy) in Spain and Australia, respectively. The optical efficiency on a yearly basis is 53% and 55% for the Spanish and Australian sites, respectively. The calculated receiver efficiency on a yearly basis is 59% and 60%, respectively, for Spain and Australia. Overall, the calculated solar-to-electricity conversion efficiency on a yearly basis is 10% and 11% for the Spanish and Australian sites, respectively. The energy produced by the CSP represents 20% and 24% of the load for Spain and Australia, respectively.
The above-mentioned process figures can be further increased considering the replacement of the conventional steam Rankine cycle with a sCO
2 cycle working at the same temperature levels: as already mentioned, the adoption of a sCO
2 cycle could push the cycle efficiency from 39% to 44–48% [
33]. As an example, assuming a power cycle efficiency of 46%, the resulting solar-to electricity conversion efficiency, on a yearly basis, would increase by 1.7%, whereas the resulting load fraction would increase by 3% and 4%, for Spain and Australia, respectively. Therefore, the proposed technology, which is based on process solutions already developed and tested by Magaldi in different fields of application (high-temperature particles handling [
23,
24], particles-based fluidized thermal energy storage [
20,
21]), can be further optimized to increase the overall solar-to-electricity conversion.
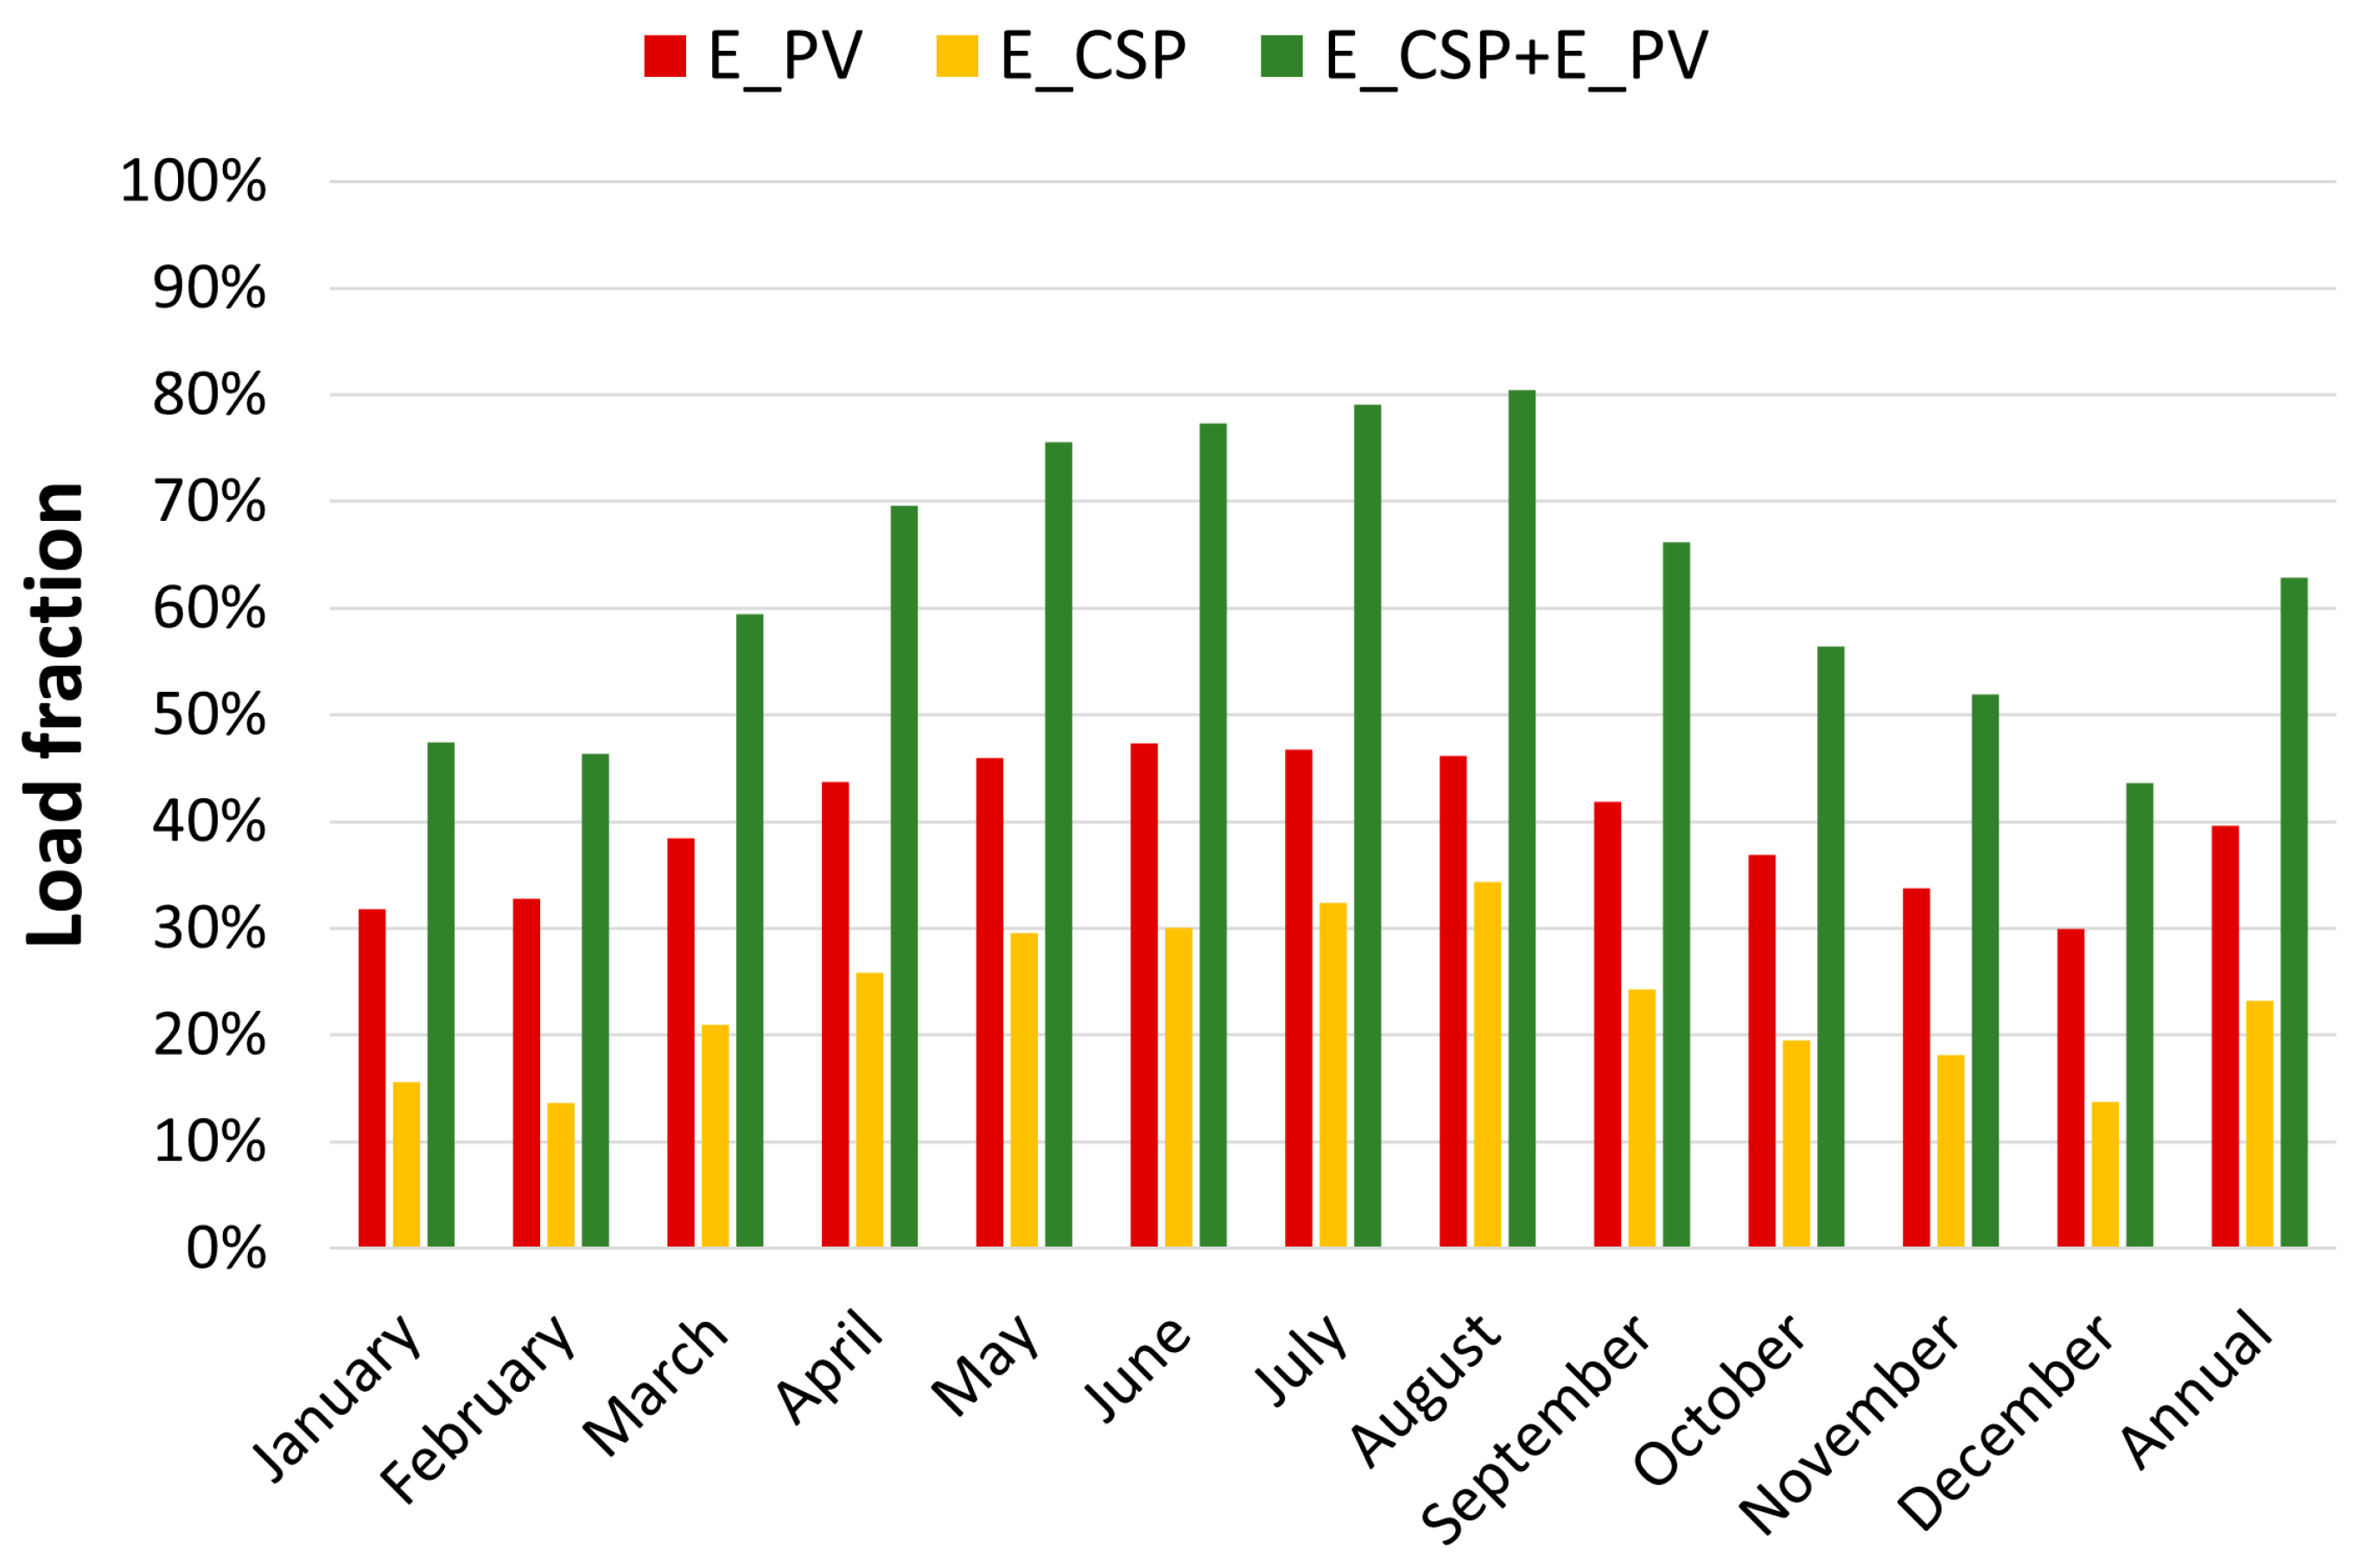
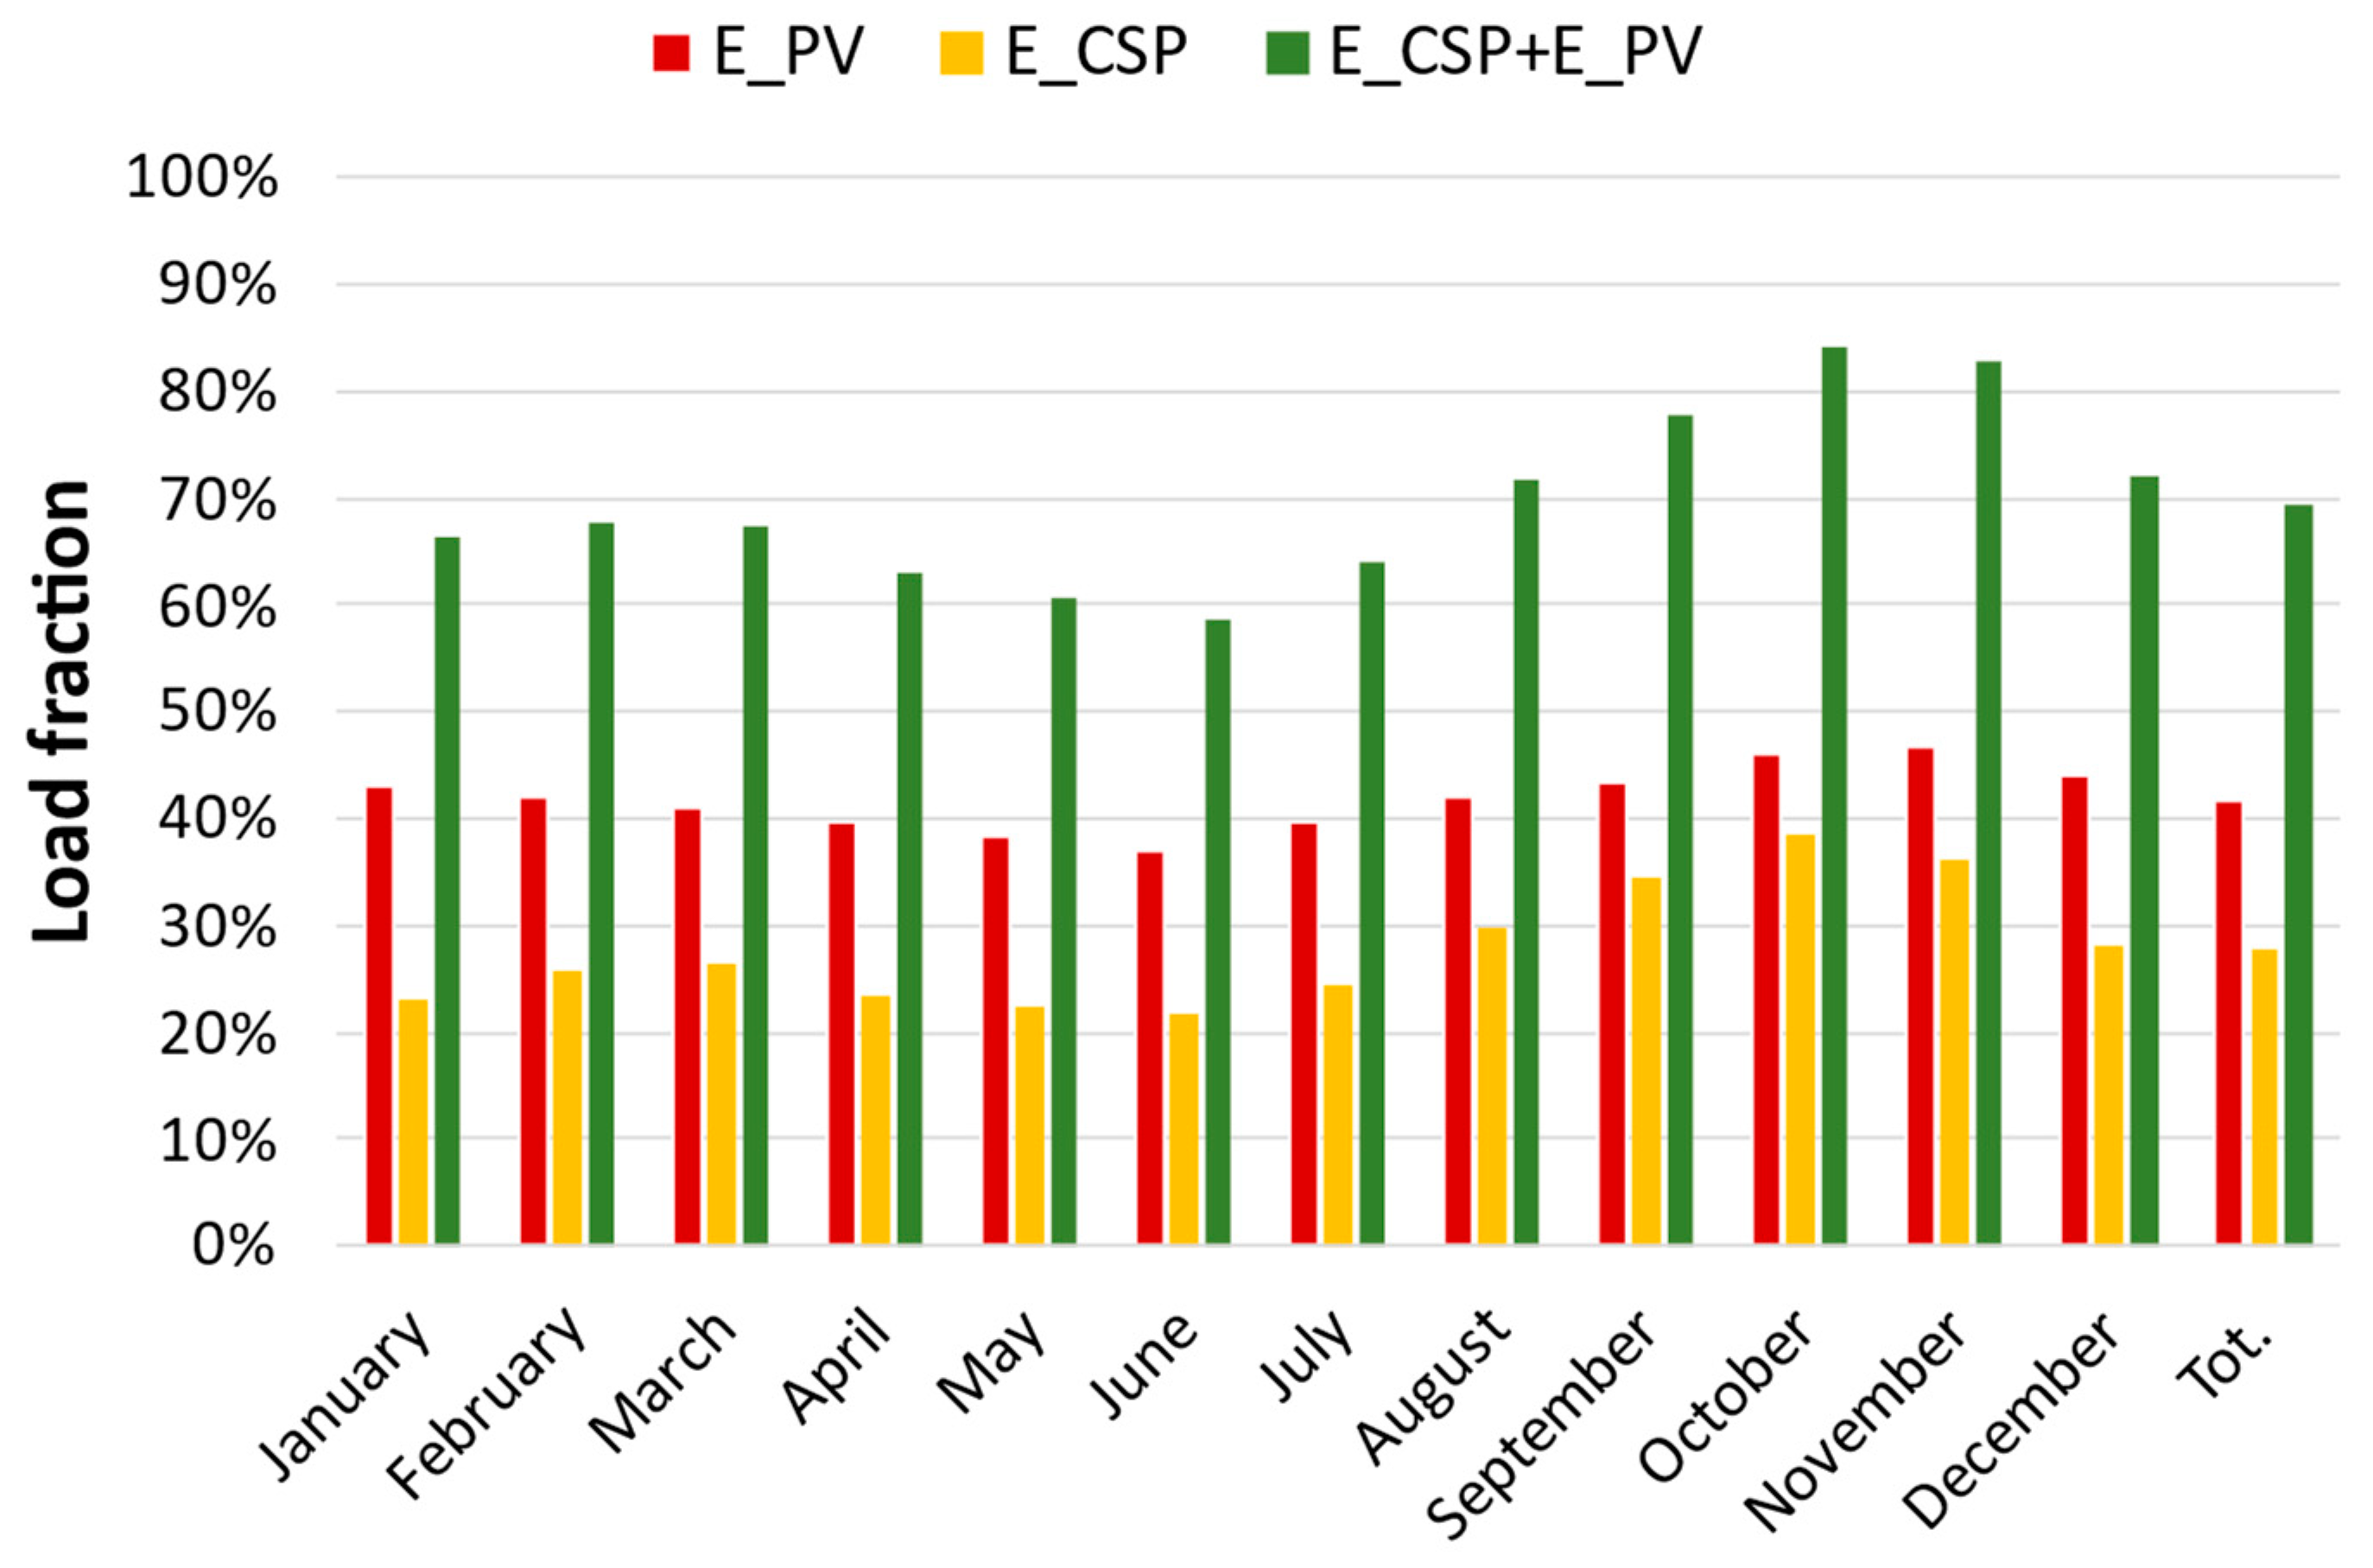
The monthly supply of energy that the two plants usefully deliver to the grid is shown in
Figure 13 (Spain) and
Figure 14 (Australia). The delivered energy is given as a percentage of the load. Results shown in the figures assume a convective loss of 20% of the overall receiver thermal losses: the other two hypotheses (0% and 35%) produce, respectively, a gain of 10% and a loss of 14% in the CSP production (E_CSP), with respect to the shown case.
The overall supply of energy obtained by the integrated PV + CSP plant is 63% of the load for the Spanish site and 69% of the load for the Australian site, on the yearly basis. The load covered by the operation of the power block is 23% and 28%, respectively, while the energy supplied directly by the PV field is 40% and 41%, respectively. Thus, the detailed analysis of the energy production showed that the energy directly supplied by the PV field is comparable for both sites, and the difference in terms of load fraction between the two sites mostly depends on the better exploitation of the CSP system in the winter months for the Australian site.
With the aim of illustrating the complementarity of the two technologies and the advantages of their integration, it is worth comparing the calculated performance of the integrated systems with the results obtained for the PV-only system (currently the less costly choice) with an equivalent overall peak power. To this purpose, an additional simulation of a stand-alone PV system with a peak power of 25 MW was performed. Results show that the stand-alone PV system can supply only 45% (Spain) and 47% (Australia) of the required electric load, with an energy surplus (which is wasted) of 41% and 49%, respectively. So, the integration of CSP/PV allows the dispatchability of the produced energy to be increased by about 40% with respect to the current standard technology.
An insight to the working regimes of the CSP is given by
Figure 15, which shows the time (in hours) incidence the four possible CSP working phases, month by month. In the Spanish site, the stand-by time fraction (in which the system is completely inactive) for the assumed case is up to 60% in winter, and less than 12% in summer. In the Australian site, the fraction of the stand-by time is between 14% and 45%.
An example of the operation of the integrated plant is given in
Figure 16, where the time sequence over two days for PV and CSP fields production, power block production, level of the storage, and surplus energy from PV discharged in the CSP system are shown. PV and power block production alternate on a day/night basis, and the surplus of PV production is present but quite limited, as it should be.
6. Conclusions
In this paper, with the aim of analyzing the possible performance of a new CSP tower technology under development, mainly based on the use of a fluidized bed receiver coupled to a two-tank storage system, a theoretical model describing the overall system was implemented and applied. The new technology here proposed is based on process solutions already developed by the Magaldi company in different fields of application and is characterized by a robust fluidized bed receiver design, that can guarantee a stable and controllable energy collection and conversion, as well as a two-tank particle storage system handled by highly efficient mechanical conveyors produced by Magaldi.
Based on the overall system modelling and simulation, and referring to two different geographical locations (Spain and Australia), the calculated solar-to-electricity conversion efficiency of the proposed technology, under the assumed conservative hypothesis on the components efficiencies, is 10% and 11% for Spain and Australia, respectively, on the yearly basis. Furthermore, the load fraction that can be covered by the CSP system (10 MWe capacity) on a variable electrical load profile, with a peak of 10 MWe typical of residential/commercial districts or tertiary sectors, is 20% and 24% for Spain and Australia, respectively. These figures can be further increased considering the replacement of the conventional steam Rankine cycle with a sCO2 cycle working at the same temperature levels: the resulting solar-to electricity conversion efficiency would increase by 1.7%, for Spain and Australia, whereas the load fraction would increase by 3% and 4%, respectively.
Furthermore, this model was also applied for the evaluation of the integrated CSP/PV technology, in order to increase the load coverage on a yearly basis.
The simulation discussed in this paper shows that the integrated CSP/PV system (capacity: 10 MWe + 15 MWe, respectively) with a shared thermal storage, considering the more straightforward integration scheme (alternate operation of CSP and PV plants), can supply a significant fraction of the typical annual electric load above-mentioned; in the two chosen locations, the computed fraction of solar supply is 63% (Spain) and 69% (Australia). The load covered by the power block is 23% and 28%, respectively, while the energy directly supplied by the PV field is 40% and 41%, respectively. It is worth noticing that the increase in the load coverage with respect to the CSP stand-alone system depends on the PV surplus electricity discharged on the thermal storage.
The simulation of a stand-alone PV system with a peak power of 25 MWe, corresponding to the total capacity of the abovementioned CSP–PV plant, showed that the PV system alone can supply only 45% (Spain) and 47% (Australia) of the required electric load, with an energy surplus (which is wasted) of 41% and 49%, respectively. Therefore, the integration CSP/PV allows the dispatchability of the produced energy to be increased by about 40% with respect to the current standard technology. It is worth noting that, in the present work, the CSP and PV plants are meant to work alternatively, with PV supplying the daily energy demand and CSP covering the night load; alternative hybridization strategies can be considered, aimed at guaranteeing the stability of electricity generation, both during the day and at night, with an overlapping of operation of the CSP and PV plants. In this regard, additional operating strategies of the integrated CSP–PV system, along with CSP coupling with upcoming highly efficient conversion cycles (sCO2) and investigation on higher absorbance solid particles, will be analyzed in the future to propose optimized solutions for improving dispatchable power generation, grid stability and penetration of renewables by combining the technical and economic advantages of both technologies.


 ,
, 


