Abstract
Using daily data, we investigate the relationship between European LNG prices, carbon prices (CO2), electricity wholesale prices and changes in the electricity sector’s energy mix in Greece, using a vector error correction model (VECM). The results indicate that an increase in the daily average price of natural gas has the expected impact on Greece’s wholesale electricity price. As expected, gas and other fossil fuels act as substitute goods, while higher imports of electricity lower prices and have a negative impact on fossil fuel shares. Interestingly, carbon prices do not appear to have any significant impact on any variables, while the higher production of electricity from renewable sources pushes wholesale electricity prices down.
JEL Classification:
G11; G12; G13; G20
1. Introduction
Since the outbreak of the COVID-19 pandemic, changes in the energy sector are structural. EU legislation for further emissions reduction combined with the excess growth of renewable sources have changed the energy landscape. Considering the continuous fluctuating demand for energy in accordance with the rising oil and gas prices after the Russian invasion in Ukraine, the energy sector has become the cornerstone in the global economy and a major concern for both state governments and international fora. The increased energy costs, in addition to inflation, have caused social upheavals in many countries. At the European level, the energy dependence on cross-border energy producers makes EU countries vulnerable to fluctuations in international energy prices in the short term.
Hence, despite the increasing share of electricity production by renewable energy sources (RES), there are increased concerns about the dependency on imported fuels. Earlier studies demonstrated that in Europe, gas, coal and CO2 prices are associated with the electricity price, as cost elements, and a large part of the electricity price is formed by its cost elements [1,2]. This correlation is expected to be stronger in markets where a particular fuel has a larger share in the electricity mix [3], and could impact the European competitiveness. According to [3], input prices for electricity generation should be reflected in electricity prices in cost-reflective markets, and the correlation should be stronger in markets where a specific fuel has a larger proportion in the electricity production mix.
Long-run dynamics of electricity prices are expected to reflect fuel price developments. Due to the significant RES penetration, electricity mixes are reshaped. Consequently, the electricity wholesale price dynamics are changing. As wholesale electricity prices should be converging due to market coupling, further RES penetration can decrease the level of Europe’s fuel price dependency [4]. Mahler et al. referred that electricity price dynamics are influenced by the demand for electricity, the electricity production mix, the market structure and the strategic behavior of market participants [5]. Regarding the mix, in interconnected markets, the electricity-fuel price nexus has been found to be weaker due to cross-border trading which can manage supply and demand in a more flexible way [4].
Liberalized energy markets engage in trading activities on energy exchange platforms, where they aggregate purchases and sell orders. Additionally, trading occurs via bilateral contracts over the counter. Each transaction relates to a not necessarily disclosed price. The price observed in the day-ahead auction market is unique for each individual hour and functions as a common and transparent price indicator that is publicly disclosed by power exchanges [6].
Yet, to our knowledge, there has been no systematic attempt in the past to examine the impact of fossil fuels’ prices and their participation to the Greek electricity production mix, under the target model. The aim of this paper is to fill this gap in the literature, by investigating the first two years of operation of the Greek electricity market. Our study can be beneficial for electricity stakeholders such as producers and suppliers, traders, investors, regulators and policy makers.
This paper is structured as follows. Section 2 reviews briefly the energy markets in Europe and the Greek wholesale market. Section 3 introduces the literature review focusing on respective studies for other European markets. Section 4 describes the data profile. Section 5 presents the methodology. Section 6 presents the empirical results. Section 7 concludes the paper.
2. Energy Markets in Europe
Since 1996, the European Union has pursued the establishment of an internal energy market via the implementation of a series of policies known as the “Single European Energy Market”. The driving force for the establishment of the Single European Energy Market emerged from the need to enhance competition, resulting in creating benefits for end customers in the form of reliable and transparent prices. The target model serves as the official instrument for the complete implementation of the single market by the member states. Before the liberalization of the European electricity and gas markets, many of the countries operated their wholesale electricity markets under a mandatory pool model, where monopolies and oligopolies dominated the national markets, resulting in high prices and a lack of investment. The EU target model is founded upon two broad principles. Firstly, the establishment of integrated regional wholesale markets based on a zonal framework is crucial for facilitating efficient pricing mechanisms that may effectively guide generators’ operational and investment choices. Secondly, market coupling is reliant on the ‘flow-based’ capacity calculation, a method that takes into account the several pathways via which energy might flow in interconnected grids and aims to maximize the accurate depiction of available capacities.
The purpose of the target model is to achieve competitive prices by market forces [7,8], ensure the security of energy supply [7], enable the convergence of energy prices with the prices of neighboring countries, facilitate interconnections and enhance cross-border trading, improve liquidity and coordinate the use of transmission system capacity [8].
The integration of the energy market might be realized by the complete liberalization of power markets. The First Energy Package, encompassing Directive 96/92/EC for electricity and Directive 98/30/EC for gas, established standardized regulations for the internal market [9,10]. These regulations aimed to facilitate third-party access to the network, disentangle the trading of electricity and gas from their physical availability within a specific network and create a clear distinction between generation and supply, and transmission and distribution. The implementation of the Second Energy Package (2003/54/EC) resulted in further regulatory measures aimed at the separation of energy-related activities [11]. The legislation implemented the creation of the National Energy Regulators (NRAs) and included enhanced measures pertaining to the segregation of transmission and distribution. The Third Energy Package (2009/72/EC) established the legal basis for the separation of ownership in energy-related activities, specifically distinguishing between production and supply on one hand, and transmission and distribution on the other [12]. This regulatory measure was implemented with the aim of fostering competition within the energy sector. ACER and ENTSO-E were established with the implementation of network codes, which serve to provide standardized regulations for the administration of electricity within the shared market [13,14]. Regulation (EU) 2019/943 provides a framework of regulations aimed at ensuring the effective operation of the internal electricity market [14]. Market coupling is a fundamental element of the target model, referring to the interconnected cross-border electricity market within the European Union member states. Its primary objective is to optimize the level of interconnectivity between countries or bidding zones and facilitate the efficient matching of electricity supply and demand across the entire coupled area through implicit auctions. The objective is to decrease prices by the transfer of energy from regions with lower costs to those with higher prices. Market coupling is a mechanism that incorporates price coupling of regions (PCR), flow-based market coupling and the cross-border intraday (XBID) [15]. The cross-border electricity trade aims for a common European market coupling and convergence towards a single price among EU member states [16].
The EU electricity market design is influenced both by policy goals and by the characteristics of electricity. Firstly, markets should be ‘liquid’ in the notion of sufficient buyers and sellers. Furthermore, prices are formed by demand and supply, ensuring the optimal market outcome. In regulated electricity markets, such as those with price caps, issues of concern include the security of supply or market exits. Moreover, the current electricity market design takes into consideration the carbon emission pricing signal from the ETS (the European Emission Permits Scheme is a cap-and-trade system that is implemented across 30 counties, including the 27 EU member states as well as Iceland, Liechtenstein, and Norway. The European Union Emissions Trading System (EU ETS) enables governments to establish a limit on greenhouse gas (GHG) emissions for companies, allowing them to engage in the trading of emission allowances within the market), which can make coal more expensive due to the ETS price. Overall, market design should reflect the fundamental characteristics of electricity as a commodity, the evolving system that incorporates increased RES penetration, the different needs of market participants and the policy objectives. While the EU market design looks at the cross-border integration of all electricity market timeframes, short-term markets (day-ahead and intraday markets) are the cornerstone of EU market integration [17].
In the Greek market, the Independent Power Transmission Operator S.A. (IPTO) is the Greek electricity transmission system operator (TSO), which operates, maintains and develops the electricity transmission system and the cross-border interconnections. The Greek state holds 76%, while the Chinese company State Grid holds 24% (ADMIE Holding, 2022). The Hellenic Electricity Distribution Network Operator S.A. (HEDNO) is the Greek electricity distribution system operator (DSO). It operates, maintains and develops the electricity distribution systems in mainland Greece and in the interconnected islands. PPC holds 51%, while 49% is owned by Macquarie Asset Management (HEDNO S.A., 2022). The Operator of Renewable Energy Sources and Guarantees of Origin (DAPEEP S.A.) is responsible for overseeing the subsidy programs for renewable energy sources (RES) and high-efficiency co-generation, as well as the auctioning of permits under the European Union Emissions Trading System (ETS). Additionally, it has the responsibility of serving as the ultimate aggregator for providers of renewable energy [18]. Since February 2017, the framework of the electricity market has structurally changed. The market operator (LAGIE) and Athens Stock Exchange (ATHEX) have entered into a memorandum of cooperation, aiming to establish the Hellenic Energy Exchange (HEnEx) to replace the mandatory pool system. In June 2018, HEnEx established and undertook all the responsibilities that were formerly held by LAGIE [19].
The day-ahead market (DAM) refers to the wholesale trading activities that occur on the day before to the actual delivery day (referred to as D − 1). Supply contracts are auctioned off for each market time unit, with the intention of facilitating physical delivery on day D. The delivery day consists of 24 purchased time units, starting at 01:00 Eastern Europe Time (EET) on calendar day D and ending at 01:00 EET on the next calendar day D + 1. The trading products consist of hourly contracts with a specific value (EUR/MWh) and volume (MWh). The hourly bids contain several attributes such as the price, quantity, type of bid (sale or purchase), participant’s details and the specific hour of the day. These bids are collected in the transaction system until the set closing time. An hourly clearing price is determined via a defined auction algorithm process [19]. Since 2017, the reference value of RES in Greece was determined by an auction system that has been launched by the Regulatory Authority for Energy (RAE). In the target model, the market clearing price (MCP) of DAM is formed at the point where the supply curve meets the demand curve. Greece has completed several reforms to integrate with the European common electricity market, such as joining the intraday market coupling in December 2022 [18]. Thermal generators are required to participate in the day-ahead market. Participants are allowed to submit orders between −500 EUR/MWh and 3000 EUR/MWh. The day-ahead market (DAM) is interconnected with other European markets via the Greece–Bulgaria and Greece–Italy interconnections.
In September 2021, the Greek government established a one-time fee on windfall profits between 1 October 2021 and 30 June 2022. The revenues were directed to the Energy Transition Fund to subsidize the final consumers. In July 2022, the government introduced a new temporary mechanism which is valid until 31 December 2023 (https://www.e-nomothesia.gr/energeia/kya-upend-ee-80965-1519-2023.html, accessed on 27 August 2023) and introduces a revenue cap on each power generation sources. The caps are based on fuel costs and ETS allowance regarding natural gas and lignite, respectively. The cap for large hydropower and other renewables is fixed and they are 112 EUR/MWh and 85 EUR/MWh, respectively. In December 2022, a price cap of 240 EUR/MWh was implemented for gas-fired power, while lignite-fired generation was subject to a price limit of 200 EUR/MWh (IEA, 2023).
Despite the reforms to liberalize the energy market, the Greek market remains extremely concentrated. More specifically, the Herfindahl–Hirschman Index (HHI) has fallen from 7820 in 2015 to 4888 in 2021 [18]. The implementation of the target model, until nowadays, has provided mixed results. The electricity wholesale price has more than doubled since the beginning of November 2020. However, market participants and regulators reported that the market was not totally prepared for that reform shift [20,21,22]. The presence of monopoly or oligopoly structures within the wholesale energy market, coupled with a limited capacity for connection with neighboring countries, tends to result in increased electricity prices [18]. Recent research suggests that the implementation of the target model in Greece has been rather successful, as shown by the effective resolution of pricing disorders mostly met in the balancing market [8].
3. Literature Review
The effect of oil and gas prices on electricity price in European domestic markets has been extensively studied. In 2001, Gjolberg investigated the correlation between electricity and fuel oil prices over both medium and long periods in Europe and found that the prices of natural gas, crude oil and electricity were co-integrated. Between 1995 to 1998 (after the liberalization of the UK gas market in 1995), crude oil had the most distinguished impact on this relationship [23]. Asche et al. (2006) employed monthly wholesale prices of crude oil, natural gas and electricity for the same period as Gjolberg and observed differences in the relationship between the prices and the time period through a co-integration analysis [1]. Regarding the Spanish electricity market, Munoz and Dickey (2009) found that there was co-integration among Spanish electricity spot prices, USD/Euro exchange rates, and oil prices [24]. Moutinho et al. (2011) showed that the natural gas price could explain the electricity price by analyzing long-term relation and the short-term dynamics between 2002 and 2005 [25]. Furio and Chulia (2012) examined the causal relationship between the Spanish electricity, Brent crude oil and Zeebrugge (Belgium) natural gas 1-month-ahead forward prices, using data from 2005 to 2011. They demonstrated that Brent crude oil and Zeebrugge natural gas forward prices influence the electricity prices, while Brent crude oil and natural gas forward markets cause, both in price and volatility, the Spanish electricity forward market [3]. They employed the Johansen co-integration test, a vector error correction model (VECM) and a GARCH model. Lastly, Bosco et al. (2010) revealed strong evidence of common long-run dynamics between electricity and natural gas prices for six European electricity markets between 1999 and 2007 [26].
Other studies focused on the effects of coal and gas on electricity prices. Crapmes and Fabra (2005) showed that in the Spanish market, the fluctuation of oil and coal prices affected the electric power industry as the fuel costs constituted about 70% of the variable costs for thermal power plants [27]. Sensfub et al. (2008) revealed that wind and photovoltaic penetration tended to decrease prices as their production cost was nearly negligible compared to fuel costs such as coal, gas, oil or uranium which formed the electricity prices [28]. Mohammadi (2009) used annual data from 1960 to 2007 in the U.S. market. He studied the long-run relations and short-run dynamics between retail electricity prices and fossil fuels. He demonstrated a stable long-term relation, as well as a bi-directional long-term causality between coal and electricity prices. He also revealed an insignificant long-term relation between crude oil and/or natural gas and electricity prices [29]. Ferkingstad et al. (2011) explored the interactions between Nordpool and German electricity prices, with major fuel sources; oil, natural gas and coal, from 2002 through 2008. They confirmed the strong correlation between natural gas and electricity prices, in contrast with coal prices [30].
Simpson and Abraham’s (2012) assessed the electricity market and energy sector decoupling from 2000 to 2011. They argued that the progress of electricity market liberalization could be assessed by the strength of the association between fuel and electricity prices. They argued that stronger relationships between fuel and electricity prices were identified in larger economies, implying greater progress in deregulation because of reduced price manipulation under monopolies. They also stated that the use of RES and their regulatory cost reduced convergence [31]. Menezes et al. (2016) examined the co-movements between electricity spot prices and fuel inputs to generation from the British, French and Nordpool markets from December 2005 to October 2013. The findings of their study revealed a significant correlation between British power spot prices and gasoline costs, even when considering the price trends in related markets. Contrary results were seen in the Nordpool and French day-ahead markets [4]. Lagarde and Lantz (2018) examined if renewable production decreases electricity prices in Germany. They employed a two-regime Markov switching model to differentiate the impact of wind and solar generation on the price. They noticed that renewable production had a negative marginal effect, during periods of relative high prices. They also stated that the increased RES share in the energy mix and the availability of storage facilities can lead to lower electricity prices [32].
The effects of CO2 emission permits’ prices (as they formed at ETS) on electricity prices have also been studied. Zachmann and Hirschhausen (2008) showed that in the German market, the positive cost shocks in EU emissions allowances were transmitted more strongly to the electricity retail prices in contrast with negative shocks [33]. Similarly, Kara et al. (2008) examined the carbon pass through to electricity prices in the Nordic countries and showed that an increase in the price of CO2 permit results in a pass-through of approximately 74% [34]. Pinho and Madaleno (2011) employed a VECM model to investigate the associations between carbon, electricity and fuel prices in Germany, France, and Nordpool, from 2005 to 2009. They revealed that the impact of carbon prices depended on each country’s energy mix [35]. Aatola et al. (2013) employed Granger causality, correlation and co-integration analysis to examine the effect of carbon prices on the integration of European electricity markets. They also supported that the effect was not consistently uniform and was related to the energy mix. They noted that carbon prices exhibited a positive impact on electricity market integration [36]. Fabra and Reguant (2014) showed that in the Spanish market, there was experienced an average pass-through rate above 80% as a 1 EUR increase in carbon permit prices corresponded to an average 1 EUR increase in wholesale electricity prices [37]. Dagoumas and Polemis (2020) performed an econometric analysis on the carbon pass-through in the Greek electricity sector. They collected hourly data for 24 thermal power plants from January 2014 through December 2017. They indicated an almost complete pass-through, as retailers were found to fully internalize the CO2 permit costs. They also noticed the possibility for short-term inflation on wholesale electricity prices due to the mandatory auctioning of tradable permits under the third period of the EU ETS [38].
More recently, Mahler et al. (2022) demonstrated that wholesale electricity price fluctuation is based on the equilibrium between supply and demand considering the technical and economic constraints of power system assets, as well as the regulatory framework which defines the market structure [5].
4. Data Profile
In order to examine the relationship between gas prices and Greece’s energy mix, data from HEnEx, which are publicly available, are collected. In particular, the Energy Exchange Group includes data related with power, natural gas, environmental markets and global commodities for Greece. We also use investing.com to collect daily data for the Dutch TTF Natural Gas Future and for prices of CO2 emission allowances. Table A1 in Appendix A includes more details about the data and their sources. The sample period spans from 1 November 2020 through 31 December 2022.
According to data from HEnEx, the electricity production mix in 2021 consisted of 40% natural gas, 28% RES and 14.5% imports. The remaining covered by hydro (7.5%) and lignite (9%). As for 2022, natural gas has deteriorated to 33.5% depicting the efforts to reduce the dependence on Russian natural gas. RES have increased to 32% from 28%. It is also noticed that the penetration of lignite presents an upward trend, as a consequence of the efforts to replace natural gas in the short-term. Imports have increased, while hydro has been reduced by 2.5%. Figure 1 depicts the electricity production mix.
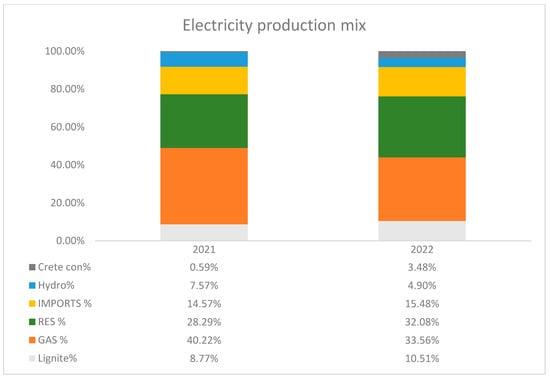
Figure 1.
Electricity production mix, source: HEnEx.
Descriptive statistics are reported in Table A2. The DAM price ranges between 28 and 647.4 EUR/MWh with an average price of 194 EUR/MWh. The volatility is 122.5 EUR/MWh, which is higher than those of the TTF and CO2 price and can be attributed to the non-storable nature of the asset. The average prices for TTF and CO2 emissions are 84 EUR/MWh and 64 EUR/t CO2, respectively. The respective volatilities are 62 EUR/MWh and 19.4 EUR/t CO2. As for the production technology, RES produced an average of 46,860 MWhs on a daily basis, while the mean production from natural gas and lignite is 61,919 and 16,258 MWhs, respectively. It is worth noting that there were days with zero lignite production.
Regarding the measures of asymmetry, the skewness of the RES, DAM and TTF price lies between 0.5 and 1, indicating a moderate positive skewness. However, for the other variables, the skewness lies between −0.5 and 0.5. Hence, the respective variables can be characterized as approximately skewed. As for kurtosis, the DAM and TTF price exhibit an excess kurtosis (above 3), while the variables referring to production technology present a kurtosis between 2.3 and 2.7. Lastly, the Jarque and Bera (1980) test indicated that the null hypothesis of normal distribution can be rejected for all variables, as the p-value is less than the significance level of 5%.
Figure 2 depicts the prices of DAM, TTF (on left axis) and CO2 emission permits (on right axis). Regarding the DAM and TTF price, there is an upward trend coinciding with the “price crunch” across Summer and Fall 2021 [17] when gas supply deterioration led to a price increase across Europe. From late 2021 to early 2022, during a period which is called a “market response from LNG” [17], there is a peak in prices. Then, a period of new peaks and high volatility follows which is referred as the “war emergency”, lasting from late February 2022 with the Russian invasion to Ukraine [17]. It can be noticed as a proximity of the DAM and TTF price. The Pearson’s correlation between the DAM and TTF price is 93.7%.
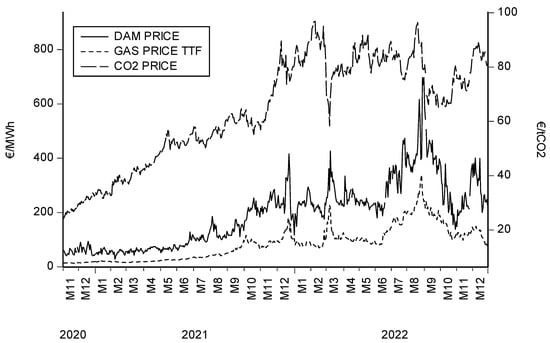
Figure 2.
Electricity wholesale price (DAM), TTF price, and CO2 emission permits’ price, source: HEnEX, investing.com.
5. Methodology
Consider a vector error correction (VEC) model, under the standard Johansen and Juselius setup [39],
where the total number of variables is K, and is the natural logarithm of variable j. In particular, it includes the price of the Dutch TTF Natural Gas Future (Gas Price TTF), the price of CO2 emission allowances (CO2 Price) and the average price in the Greek wholesale electricity market (DAM Price). To assess how the production of electricity can affect the electricity price, we also use the share of MWhs produced by natural gas (Gas Share), the share of MWhs produced via renewable energy sources (RES), the share of MWhs imported in the Greek wholesale market (Imports Share) and the share of MWhs produced by lignite (Lignite Share). All variables are found to be I(1), i.e., to follow a unit root process, which allows us to specify the co-integrating setup. The results are available upon request.
is a matrix that contains all variables included in the estimation, other than variable j. is the first difference operator, while and refer to the own and other variable coefficient values in each of the K equations. Again, j signifies that the coefficient refers to the equation identified with variable j, while k refers to the specific variable within matrix . is a matrix of the exogenous variables potentially included in the estimation, with being the equation-specific estimates of the coefficients, and refers to the error processes in each equation.
As per the standard methodological requirements of the VEC model, all variables need to follow a unit root process. Thus, before estimating our model, we test for stationarity using the augmented Dickey–Fuller (ADF) and the Phillips–Perron (PP) tests. The results, available upon request, suggest that all variables are I(1), and thus follow the unit root process. As such, we can further continue with the long-term part. The long-run relationship between the K variables is within the brackets of Equation (1) with determining the speed of adjustment to the long-run equilibrium. As usual, the term is expected to be negative in order for a return to the equilibrium to be ensured after a shock [40]. In total, we employ six variables (i.e., K = 6), which will form the equilibrium equation.
The reason behind the use of said variables lies in our research question. In particular, we employ the TTF price as a proxy for gas price, and the CO2 emissions permits’ price as a proxy for lignite cost. We also employ the MWhs produced by RES and natural gas as these two energy sources dominate the Greek electricity production mix. Moreover, we use the imported MWhs of electricity which lies at the heart of target model, and the lignite which counts for about 10% of electricity production.
The identification scheme follows the standard Cholesky decomposition, with a lower triangular structure imposed on the variables, as defined by the variable order. In this case, natural gas prices are ordered first since they are exogenous to the Greek economy, given their global determination. Following this, the CO2 prices are ordered next, given that these are determined at a European level. The share of renewable sources comes next, given that this also depends on exogenous factors (i.e., weather conditions), while the natural gas, lignite and electricity imports shares are ordered next. The wholesale electricity price is ordered last, as it is determined by all the previously mentioned factors. While the model setup allows for the use of exogenous variables, we do not use any the estimation as this is not warranted. As per the Johansen test, one co-integrating factor is found (results are available upon request) and a lag length of two is used on the basis of the Akaike and Schwarz information criteria. Robustness checks using alternative lag lengths are available upon request. Section 6 below offers the estimation results from the analysis.
6. Estimation Results
Following the estimation of the VEC model, the impulse response functions are shown in Figure 3, Figure 4, Figure 5, Figure 6, Figure 7 and Figure 8. The responses of the system variables to an exogenous rise in the price of natural gas are shown in Figure 3. As expected, an increase in the daily average price of natural gas increases the price of wholesale electricity in Greece, in accordance to the proportion of other fossil fuels in the energy mix. In particular, a (normalized) shock that causes the TTF price to rise by 1% results in an approximately 0.28% rise in the wholesale electricity price. This finding is in line with Zakeri et al. 2022, indicating that natural gas has become the main electricity price-setter in Europe as a result of the energy transition [41].
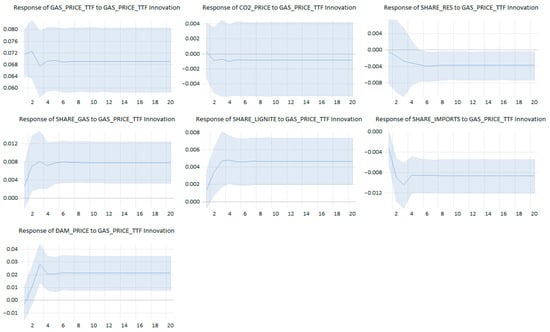
Figure 3.
Impulse responses following a gas TTF price shock.
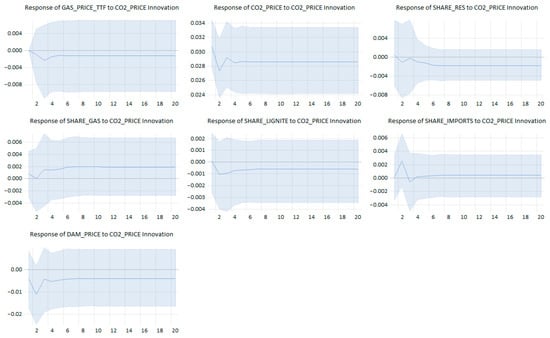
Figure 4.
Impulse responses following a CO2 price shock.
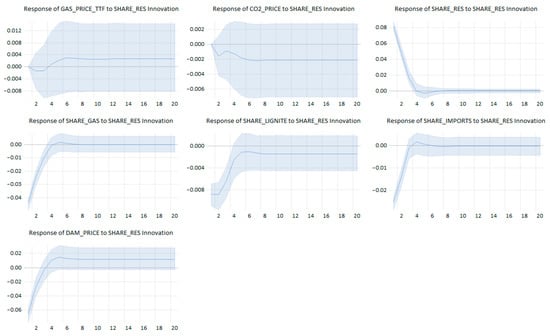
Figure 5.
Impulse responses following a RES share shock.
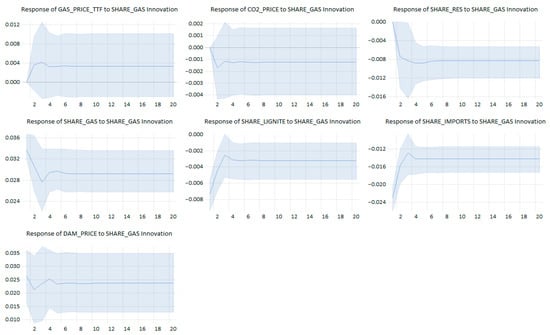
Figure 6.
Impulse responses following a gas share shock.
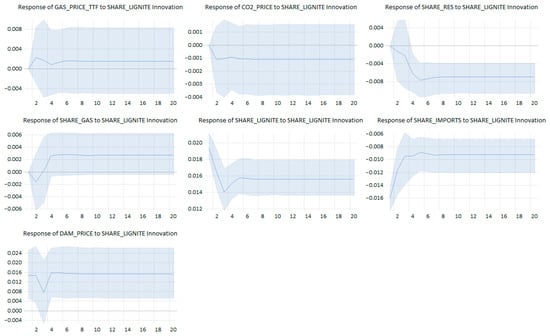
Figure 7.
Impulse responses following a lignite share shock.
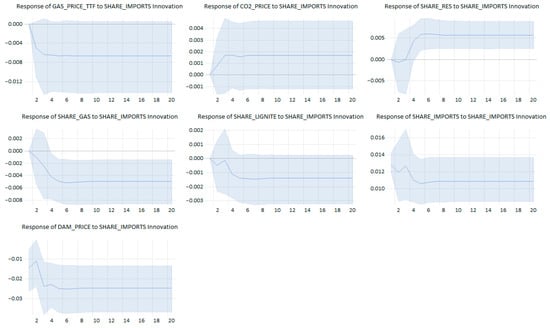
Figure 8.
Impulse responses following an import share shock.
As a side effect, the importance of natural gas for energy security has also increased. Thus, the geopolitical risk [42] associated with gas supply and natural gas price volatility, as well as the economic risk associated with the marked increases in energy prices, can affect more than electricity prices in Greece, as well as in Europe. The spillover of energy to more social issues is naturally a topic not directly related to this paper; however, it is one that could be of interest for future research.
Returning to our model estimates, interestingly, the share of lignite also increases, albeit to a lower extent, with a (normalized) 1% shock resulting in a 0.05% increase in the share. In contrast, the share of imported electricity declines, perhaps signifying that such imports are costlier than before, given that other countries are also reliant on natural gas.
The impulse responses to a carbon dioxide (CO2) price shock are depicted in Figure 4. No statistically significant response is observed, and this suggests that carbon dioxide emissions pricing does not have a material impact in Greece’s energy mix or its pricing. This is a policy-oriented result, which suggests that increases in CO2 pricing can be disregarded by the market and poses significant questions with regards to the effectiveness of carbon pricing when it comes to the green transition. This can also be attributed to the low penetration of lignite in the Greek electricity production mix.
Figure 5 shows the responses from an increase in the share of renewable energy in electricity production. An exogenous shock in this case could either be an increase in renewable energy capacity or an increase in production due to good weather conditions. In this case, the latter is more likely the case, given that the shock is short-lived and dies out after four days. As such, this could be interpreted as a one-off increase in the available electricity from renewable sources. Following this increase, the share of fossil fuels in the electricity mix declines, with a (normalized) 1% shock in the share of renewable sources resulting in a 0.5% decrease in the share of gas and a 0.1% decrease in the share of lignite. Similarly, imported electricity declines by around 0.25%.
Perhaps the most important point that stems from the renewables shock is that the wholesale price of electricity declines by around 0.75% following a 1% shock. This highlights the importance of renewable energy in lowering electricity costs, something that could protect consumers from oil and gas price shocks. This point is in line with the paper [32] in which they demonstrated that RES penetration depresses electricity prices in the German market.
Continuing the analysis with the share of MWhs produced by natural gas, in Figure 6 we observe that for a 1% (normalized) increase in the amount of gas-generated electricity, there is an approximately 0.8% increase in the wholesale electricity price. This finding is in line with the higher cost of fossil fuels compared to renewables, something that is in line with the literature on the topic, and hence highlights the need for a speedier energy transition.
When the percentage of MWhs produced by lignite increases (Figure 7), the renewables and the import share of MWhs expectedly decrease, while the response of the share of gas is insignificant. If the lignite share increases by around 1%, the renewables share seems decrease by 0.45%, whereas the imports share decreases by 0.75%. Electricity prices also increase, with an around one-to-one relationship observed, i.e., a 1% increase in the share of lignite raises wholesale electricity prices by 1%. This reaction is quite similar to increase in the share of natural gas. As such, it appears that natural gas is more cost-effective than lignite, especially before the “price crunch” across the summer and fall of 2021, despite the abundance of lignite in Greece.
Figure 8 shows the impulse response functions after a positive shock in the daily percentage of MWhs that are imported in the Greek wholesale market. For a 1% increase in the amount of electricity imported in the Greek market, there is around a 0.5% decrease in the amount of electricity produced by natural gas, while the response of lignite appears to be insignificant. Once more, the average price of the wholesale electricity market decreases following an innovation in the imports share, by around 2% per 1% increase in the share of imports. Compared to the other shocks, it appears that imported electricity has the greatest potential for a decline in the price.
Finally, the responses to a positive shock to the daily average price in the Greek wholesale energy market (DAM price) are shown in Figure 9, with most of the relationships, as expected, being insignificant. Particularly, an exogenous increase in the price of electricity mostly increases the quantity of electricity produced by burning lignite, even though this is to a small extent (approximately 0.04% per 1% shock). No other variable appears to change in this case, given that an exogenous shock in this case refers to items such as higher taxation or other ad hoc increases, for which the market cannot regulate itself.
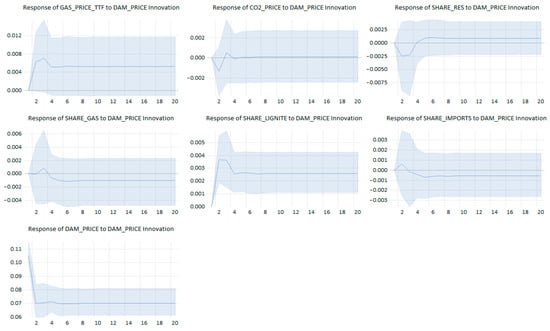
Figure 9.
Impulse responses following an electricity price shock.
Overall, the results suggest that a higher share of renewables would be beneficial for wholesale electricity prices in Greece. However, without an additional meaningful increase in renewables capacity, this is only going to have a short-lived effect. At the same time, prices appear not to react to changes in CO2 prices, suggesting that carbon taxes may be an inefficient mechanism to support the green transition.
7. Conclusions
This paper uses daily data to examine the relationship between European LNG prices (Dutch TTF), carbon prices (CO2), electricity wholesale prices and changes in the electricity sector’s energy mix in Greece. We use a co-integrating setup, given the strong long-run relationship between the variables and, in particular, a vector error correction model (VECM).
The results indicate that an increase in the daily average price of natural gas has the expected impact on Greece’s wholesale electricity price. More specifically, our findings suggest that increased natural gas penetration might increase the electricity wholesale price, which is in line with the literature review. On the other hand, a higher production of electricity from renewable sources deceases the price. As expected, gas and other fossil fuels act as substitute goods, while higher imports of electricity lower prices and have a negative impact on fossil fuel shares. Interestingly, carbon prices do not appear to have any significant impact on any variables, while an exogenous increase in electricity prices increases the share of fossil fuels in the energy mix.
Hence, our paper’s main results can be summarized in two important conclusions: first, a higher share of renewables would reduce wholesale electricity prices in Greece, providing support to households and businesses, as well as providing more energy security to the country. However, as the effect of RES penetration on prices dies after four days, it is crucial to develop storage technologies, e.g., batteries, in order to fully utilize the production of clean and cheap energy. Second, CO2 pricing does not appear to have a strong (or significant) impact on the wholesale price of electricity in Greece, suggesting that carbon taxes may be an inefficient mechanism to support the green transition.
While the findings of this paper bear important implications, there is, however, much room for future research to proceed. For example, our model setup does not allow for any interaction effects between variables, something that could potentially have important implications for the conclusions reached. At the same time, an analysis with regards to how potential shifts in energy technologies and market dynamics could also provide interesting insights with regards to the future of the Greek market.
Author Contributions
Conceptualization C.B.; Methodology, N.A.M.; Software, K.G.L. and N.A.M.; Validation, N.A.M.; Formal analysis, K.G.L.; Investigation, K.D.M.; Resources, C.B.; Data curation, C.B.; Writing—original draft, C.B., K.G.L., K.D.M. and N.A.M.; Writing—review & editing, D.K.; Supervision, D.K.; Project administration, K.D.M.; Funding acquisition, D.K. and K.D.M. All authors have read and agreed to the published version of the manuscript.
Funding
This research received no external funding.
Data Availability Statement
All data are publicly available. Please see Table A1 for details on the sources.
Conflicts of Interest
The authors declare no conflict of interest.
Appendix A

Table A1.
List of variables.
Table A1.
List of variables.
| Variable | Description | Source | Units of Measurement |
|---|---|---|---|
| DAM price | The daily average price, in the Greek wholesale electricity market, of the 24 h of each day. | Energy Exchange Group | €/MWh |
| Lignite | The daily amount of MWhs produced by lignite | Energy Exchange Group | MWhs |
| GAS | The daily amount of MWhs produced by natural gas | Energy Exchange Group | MWhs |
| RES | The daily amount of MWhs produced by renewable energy sources | Energy Exchange Group | MWhs |
| Imports | The daily amount of MWhs imported in the Greek wholesale market | Energy Exchange Group | MWhs |
| Lignite% | The daily percentage of MWhs produced by lignite | Energy Exchange Group | % |
| GAS% | The daily percentage of MWhs produced by natural gas | Energy Exchange Group | % |
| RES% | The daily percentage of MWhs produced by renewable energy sources | Energy Exchange Group | % |
| Imports% | The daily percentage of MWhs imported in the Greek wholesale market | Energy Exchange Group | % |
| Gas Price TTF | The daily price of Dutch TTF Natural Gas Future | www.investing.com | €/MWh |
| CO2 Price | The daily price of CO2 emission allowances | www.investing.com | €/t CO2 |

Table A2.
Descriptive statistics.
Table A2.
Descriptive statistics.
| DAM Price | TTF Price | CO2 Price | RES (MWh) | GAS (MWh) | Lignite (MWh) | Imports (MWh) | |
|---|---|---|---|---|---|---|---|
| Mean | 193.85 | 84.04 | 64.06 | 46,860 | 61,919 | 16,258 | 21,927 |
| Maximum | 697.41 | 339.19 | 96.93 | 96,573 | 105,350 | 38,904 | 46,056 |
| Minimum | 28.02 | 12.89 | 24.15 | 15,591 | 14,994 | 0 | 3342 |
| Std. Dev. | 122.50 | 61.97 | 19.37 | 16,108 | 18,042 | 8330 | 9015 |
| Skewness | 0.845 | 0.935 | −0.335 | 0.597 | −0.207 | 0.470 | 0.073 |
| Kurtosis | 3.808 | 3.671 | 1.916 | 2.711 | 2.368 | 2.512 | 2.406 |
| Jarque–Bera | 80.65 | 90.88 | 37.36 | 34.74 | 13.15 | 25.80 | 8.62 |
| Probability | 0.000 | 0.000 | 0.000 | 0.000 | 0.0013 | 0.000 | 0.013 |
| Observations | 552 | 552 | 552 | 552 | 552 | 552 | 552 |
References
- Asche, F.; Osmundsen, P.; Sandsmark, M. The UK Market for Natural Gas, Oil and Electricity: Are the Prices Decoupled? Energy J. 2006, 27, 27–40. [Google Scholar] [CrossRef]
- Castagneto-Gissey, G. How competitive are EU electricity markets? An assessment of ETS Phase II. Energy Policy 2014, 73, 278–297. [Google Scholar] [CrossRef]
- Furió, D.; Chuliá, H. Price and volatility dynamics between electricity and fuel costs: Some evidence for Spain. Energy Econ. 2012, 34, 2058–2065. [Google Scholar] [CrossRef]
- De Menezes, L.; Houllier, M.; Tamvakis, M. Time-varying convergence in European electricity spot markets and their association with carbon and fuel prices. Energy Policy 2016, 88, 613–627. [Google Scholar] [CrossRef]
- Mahler, V.; Girard, R.; Kariniotakis, G. Data-driven structural modeling of electricity price dynamics. Energy Econ. 2022, 107, 105811. [Google Scholar] [CrossRef]
- Alasseur, C.; Féron, O. Structural price model for coupled electricity markets. Energy Econ. 2018, 75, 104–119. [Google Scholar] [CrossRef]
- Glachant, J.-M.; Ruester, S. The EU internal electricity market: Done forever? Util. Policy 2014, 31, 221–228. [Google Scholar] [CrossRef]
- Ioannidis, F.; Kosmidou, K.; Andriosopoulos, K.; Everkiadi, A. Assessment of the Target Model Implementation in the Wholesale Electricity Market of Greece. Energies 2021, 14, 6397. [Google Scholar] [CrossRef]
- European Union. Directive 96/92/EC, Concerning Common Rules for the Internal Market in Electricity; European Union: Brussels, Belgium, 1996. [Google Scholar]
- European Union. Directive 98/30/EC on Common Rules for the Internal Market in Natural Gas; European Union: Brussels, Belgium, 1998. [Google Scholar]
- European Union. Directive 2003/54/EC Concerning Common Rules for the Internal Market in Electricity and repealing Directive 96/92/EC; European Union: Brussels, Belgium, 2003. [Google Scholar]
- European Union. Directive 2009/72/EC Concerning Common Rules for the Internal Market in Electricity and repealing Directive 2003/54/EC; European Union: Brussels, Belgium, 2009. [Google Scholar]
- Fernandez, R. Conflicting energy policy priorities in EU energy governance. J. Environ. Stud. Sci. 2018, 8, 239–248. [Google Scholar] [CrossRef]
- Next Kraftwerke. Next Kraftwerke. 2020. Available online: https://www.next-kraftwerke.com/knowledge/liberalization-energy-markets (accessed on 27 August 2023).
- Cepeda, M.; Finon, D. Generation capacity adequacy in interdependent electricity markets. Energy Policy 2011, 39, 3128–3143. [Google Scholar] [CrossRef]
- Hyland, M. Restructuring European electricity markets—A panel data analysis. Util. Policy 2016, 38, 33–42. [Google Scholar] [CrossRef]
- ACER. ACER’s Final Assessment of the EU Wholeshale Electricity Market Design; European Union Agency for the Cooperation of Eenrgy Regulators: Ljubljana, Slovenia, 2022. [Google Scholar]
- IEA. Greece 2023: Energy Policy Review; International Energy Agency: Paris, France, 2023. [Google Scholar]
- Ioannidis, F.; Kosmidou, K.; Makridou, G.; Andriosopoulos, K. Market design of an energy exchange: The case of Greece. Energy Policy 2019, 133, 110887. [Google Scholar] [CrossRef]
- Dagoumas, A. Impact of Bilateral Contracts on Wholesale Electricity Markets: In a Case Where a Market Participant Has Dominant Position. Appl. Sci. 2019, 9, 382. [Google Scholar] [CrossRef]
- Koltsaklis, N.; Dagoumas, A. Policy Implications of Power Exchanges on Operational Scheduling: Evaluating EUPHEMIA’s Market Products in Case of Greece. Energies 2018, 11, 2715. [Google Scholar] [CrossRef]
- Papaioannou, G.; Dikaiakos, C.; Dagoumas, A.; Dramountanis, A.; Papaioannou, P. Detecting the impact of fundamentals and regulatory reforms on the Greek wholesale electricity market using a SARMAX/GARCH model. Energy 2018, 142, 1083–1103. [Google Scholar] [CrossRef]
- Gjolberg, O. When (and How) will the Markets for Oil and Electricity Become Integrated? Econometric Evidence and Trends 1993–99; Working Paper; Norwegian University of Life Sciences: As, Norway, 2001. [Google Scholar]
- Muñoz, M.; Dickey, D. Are electricity prices affected by the US dollar to Euro exchange rate? The Spanish case. Energy Econ. 2009, 31, 857–866. [Google Scholar] [CrossRef]
- Moutinho, V.; Vieira, J.; Moreira, A. The crucial relationship among energy commodity prices: Evidence from the Spanish electricity market. Energy Policy 2011, 39, 5898–5908. [Google Scholar] [CrossRef]
- Bosco, B.; Parisio, L.; Pelagatti, M.; Baldi, F. Long-run relations in European electricity prices. J. Appl. Econom. 2010, 25, 805–832. [Google Scholar] [CrossRef]
- Crampes, C.; Fabra, N. The Spanish Electricity Industry: Plus ca change. Energy J. 2005, 26, 127–154. [Google Scholar] [CrossRef]
- Sensfuß, F.; Ragwitz, M.; Genoese, M. The merit-order effect: A detailed analysis of the price effect of renewable electricity generation on spot market prices in Germany. Energy Policy 2008, 36, 3086–3094. [Google Scholar] [CrossRef]
- Mohammadi, H. Electricity prices and fuel costs: Long-run relations and short-run dynamics. Energy Econ. 2009, 31, 503–509. [Google Scholar] [CrossRef]
- Ferkingstad, E.; Løland, A.; Wilhelmsen, M. Causal modeling and inference for electricity markets. Energy Econ. 2011, 33, 404–412. [Google Scholar] [CrossRef]
- Simpson, J.; Abraham, S.M. Financial convergence or decoupling in electricity and energy Markets? a dynamic study of OECD, Latin America and Asian countries. Int. J. Econ. Financ. 2012, 4, 1–14. [Google Scholar] [CrossRef][Green Version]
- De Lagarde, C.; Lantz, F. How renewable production depresses electricity prices: Evidence from the German market. Energy Policy 2018, 117, 263–277. [Google Scholar] [CrossRef]
- Zachmann, G.; Hirschhausen, C. First evidence of asymmetric cost pass-through of EU emissions allowances: Examining wholesale electricity prices in Germany. Econ. Lett. 2008, 99, 465–469. [Google Scholar] [CrossRef]
- Kara, M.; Syri, S.; Lehtilä, A.; Helynen, S.; Kekkonen, V.; Ruska, M.; Forsström, J. The impacts of EU CO2 emissions trading on electricity markets and electricity consumers in Finland. Energy Econ. 2008, 30, 193–211. [Google Scholar] [CrossRef]
- Pinho, C.; Madaleno, M. CO2 emission allowances and other fuel markets interaction. Environ. Econ. Policy Stud. 2011, 13, 259–281. [Google Scholar] [CrossRef]
- Aatola, P.; Ollikainen, M.; Toppinen, A. Impact of the carbon price on the integrating European electricity market. Energy Policy 2013, 61, 1236–1251. [Google Scholar] [CrossRef]
- Fabra, N.; Reguant, M. Pass-Through of Emissions Costs in Electricity Markets. Am. Econ. Rev. 2014, 104, 2872–2899. [Google Scholar] [CrossRef]
- Dagoumas, A.S.; Polemis, M.L. Carbon pass-through in the electricity sector: An econometric analysis. Energy Econ. 2020, 86, 104621. [Google Scholar] [CrossRef]
- Johansen, S.; Juselius, K. Maximum likelihood estimation and inference on cointegration—With appucations to the demand for money. Oxf. Bull. Econ. Stat. 1990, 52, 169–210. [Google Scholar] [CrossRef]
- Enders, W. Applied Econometric Time Series; Wiley Series in Probability and Mathematical Statistics; Wiley: Hoboken, NJ, USA, 1995. [Google Scholar]
- Zakeri, B.; Staffell, I.; Dodds, P.; Grubb, M.; Ekins, P.; Jääskeläinen, J.; Samuel, C.; Kristo, H.; Castagneto-Gissey, G. Energy Transitions in Europe—Role of Natural Gas in Electricity Prices; SSRN: Rochester, NY, USA, 2022. [Google Scholar]
- Michail, N.A.; Melas, K.D. Geopolitical risk and the LNG-LPG trade. Peace Econ. Peace Sci. Public Policy 2022, 28, 243–265. [Google Scholar] [CrossRef]
Disclaimer/Publisher’s Note: The statements, opinions and data contained in all publications are solely those of the individual author(s) and contributor(s) and not of MDPI and/or the editor(s). MDPI and/or the editor(s) disclaim responsibility for any injury to people or property resulting from any ideas, methods, instructions or products referred to in the content. |
© 2023 by the authors. Licensee MDPI, Basel, Switzerland. This article is an open access article distributed under the terms and conditions of the Creative Commons Attribution (CC BY) license (https://creativecommons.org/licenses/by/4.0/).