Article

Hydration Absorption and Thermal Effects of Outcrop Porous Sandstone Based on Intelligent Experimental and Infrared Thermography Techniques

1
State Key Laboratory for Geomechanics and Deep Underground Engineering, China University of Mining and Technology (Beijing), Beijing 100083, China
2
School of Mechanics and Civil Engineering, China University of Mining and Technology (Beijing), Beijing 100083, China
3
Research Institute for Deep Underground Science and Engineering, China University of Mining and Technology (Beijing), Beijing 100083, China
4
State Key Laboratory of Coal Resources and Safe Mining, China University of Mining and Technology (Beijing), Beijing 100083, China
*
Author to whom correspondence should be addressed.
Energies 2023, 16(22), 7540; https://doi.org/10.3390/en16227540
Submission received: 27 September 2023 / Revised: 3 November 2023 / Accepted: 7 November 2023 / Published: 12 November 2023
(This article belongs to the Section J: Thermal Management)

Abstract

:
Sandstones are enriched in deep energy reservoirs and also exist as outcrop rocks, where the pore characteristics of sandstone are influenced by hydration absorption and thermal effects. To study the influence of the initial temperature on the hydration absorption characteristics of outcrop porous sandstone in the Mogao Grottoes, China, an intelligent experimental device for rock hydration was used. The hydration absorption characteristics and temperature effects of sandstone were analyzed by using infrared thermography techniques to monitor the infrared radiation characteristics of the sandstone’s surface during hydration absorption. The experimental results show that the higher the initial temperature of the rock samples, the shorter the time it takes for the sandstone to absorb enough water to reach saturation. The temperature variation of sandstone with different initial temperatures was also determined; the variation in the hydration absorption of sandstone conforms to certain rules, which can be expressed by formulae containing certain parameters. The changing trend of hydration absorption in outcrop porous sandstone shows that the hydration absorption increases rapidly at first, and then the rate of increase slows down until the hydration absorption remains unchanged after saturation. The experimental technique and method provide feasible means and techniques to evaluate the hydration absorption and thermal effects of outcrop porous sandstone, for further detecting the weathering degree of rock grottoes and revealing the damage mechanisms.

1. Introduction

Rock is a typical porous medium, in which the coupling of fluid and solid matrices will affect the surface temperature of the rock and make it participate in more environmental reactions and geological movement processes. Hydration absorption will change with the deformation of the rock and changes in the external environment, which will affect the performance and structure of rock materials [1,2]. The interaction between rock and water makes rock vulnerable to various types of damage and causes various forms of hydration disasters. Therefore, the hydration absorption of rock is an important factor affecting the mechanical properties of the rock [3]. The initial temperature change is the key factor affecting the hydration absorption characteristics of rock, and the temperature will significantly affect the temperature-sensitive structure. For cultural relics of high importance, the study of the moisture absorption characteristics of rock hydration and the influence of temperature is the basis for their protection.
The hydration absorption of rock has been studied in some research on mechanical behaviors and mechanisms. To study the expansion pressure, expansion amount, and hydration adsorption capacity of rock at different initial temperatures, nuclear magnetic resonance, uniaxial compression experiments, and a self-developed rock hydration adsorption experiment system were used to study rock at different temperatures [4]. To study the weathering mechanism of sandstone in the Dunhuang Mogao Grottoes, based on a self-developed hydrodynamic test system under the coupling of temperature, humidity, and the stress of the surrounding rock, a previous study carried out liquid water adsorption tests and gaseous water adsorption tests on the surrounding rock of the support body of the Mogao Grottoes and carried out strength softening tests on rock samples that had adsorbed liquid water [5]. To study the influence of different water contents on the mechanical properties, porous texture, and failure-precursory symptoms of coal–rock systems, uniaxial compression experiments were carried out on a coal–rock combination under dry, natural water, and saturated conditions, and acoustic emission (AE) and infrared radiation (IR) data were measured [6]. To study the influence of water–rock interaction on the properties of sandstone in deep roadways, a pressureless water absorption experiment was carried out. The mechanical evolution law of sandstone in the process of water absorption has been studied [7]. To describe the occurrence state of water in the rammed earth of the Mogao Grottoes, the relationship between the water absorption increment and the infrared radiation temperature in different stages of water absorption was studied using infrared thermal imaging technology; it was found that before the infiltration of all rock samples, the unit mass water absorption increment of dry rock was positively correlated with the infrared radiation temperature, but there was no obvious regular difference in each water absorption stage [8]. To study the effect of high-temperature dry–wet cycles on shaly sandstone, the shaly sandstone samples were heated at 200 °C after water saturation and 120 dry–wet cycles were carried out to study the damage characteristics of rocks under high temperature dry–wet cycles [9]. To study the strength softening and microscopic mechanisms of sandstone with different water contents, nuclear magnetic resonance, scanning electron microscopy (SEM), X-ray diffraction (XRD), and computer tomography (CT) were used to determine the mass and spectral area of fine sandstone [10]. To understand the effects of the loading rate and water saturation on the rock fragmentation and energy absorption of sandstones with three different pore sizes (red, Berea, and buff), core samples were prepared according to the ASTM standard for compressive strength tests. The results showed that the size of the rock fragments usually decreases with the increase in the loading rate and water content [11]. To study the geological, physical, and mechanical properties of deep soft rock, the mineral composition, microstructure, and porosity characteristics of 13 clay-bearing soft rock samples collected from a deep coal mine in China were studied by X-ray diffraction (XRD) analysis, scanning electron microscopy (SEM), and mercury intrusion porosimetry. Water vapor absorption and uniaxial compression experiments were also carried out to investigate the water absorption characteristics and water-induced strength degradation effects of deep soft rock samples [12]. In order to study the water absorption rate of soft rock and prevent engineering disasters, a prediction model for the water absorption rate of soft rock was established by combining water absorption testing of soft rock and an aqueous solution, compared with the water absorption characteristics of natural rock to verify the reliability of the model. The results showed that the variations in the water content and water absorption rate of soft rock with time obey the second-order exponential decay function and the linear function (double-logarithmic coordinate axis), respectively [13].
Moreover, the temperature will change the rock’s structure and mechanical properties. In order to study the pore characteristics and deformation characteristics of sandstone after high-temperature treatment, mercury intrusion porosimetry (MIP), uniaxial compression tests, P-wave velocity, and AE tests were used to study high-temperature sandstone samples [14]. In order to study the fatigue characteristics of red sandstone after heat treatment, the stress–strain curve, deformation, energy, and damage were analyzed. When the temperature was lower than 400 °C, the brittleness, failure stress, and stiffness of sandstone were enhanced [15]. In order to study the effects of different temperature treatments on the porosity of sandstone in the creep stage, researchers used NMR and cyclic loading–unloading creep tests to determine the effect of temperature on the creep deformation of sandstone. The temperature promotes an increase in sandstone’s porosity in the creep stage. The greater the loading ratio, the more sensitive the porosity is to the increase in temperature, and the greater the effect of temperature on the creep damage to sandstone samples [16,17]. In order to study the deformation and damage process of rock under high-temperature and high-stress coupling, a rock damage model under high-temperature load coupling was established based on the Mohr–Coulomb strength criterion and damage mechanics theory. The results show that the higher the temperature, the lower the strength of the sandstone, the lower the peak stress, and the higher the peak strain [18].
In order to conduct further behavior analysis, this study focuses on the hydration absorption and thermal effects of outcrop porous sandstone based on intelligent experimental and infrared thermography techniques. Using an intelligent experimental device for rock hydration, the hydration absorption characteristics and temperature effect of sandstone were analyzed by using infrared thermography techniques to monitor the infrared radiation characteristics of sandstone’s surface during hydration absorption. The experimental results show that the higher the initial temperature of the rock samples, the shorter the time it takes for the sandstone to absorb enough water to reach saturation. The temperature variation of sandstone with different initial temperatures was also determined; the variation in the hydration absorption of sandstone conforms to certain rules, which can be expressed by formulae containing certain parameters. The experimental technique and method provide feasible means and techniques to evaluate the hydration absorption and thermal effects of outcrop porous sandstone, for further detecting the weathering degree of rock grottoes and revealing their damage mechanisms.

2. Experiments and Procedures
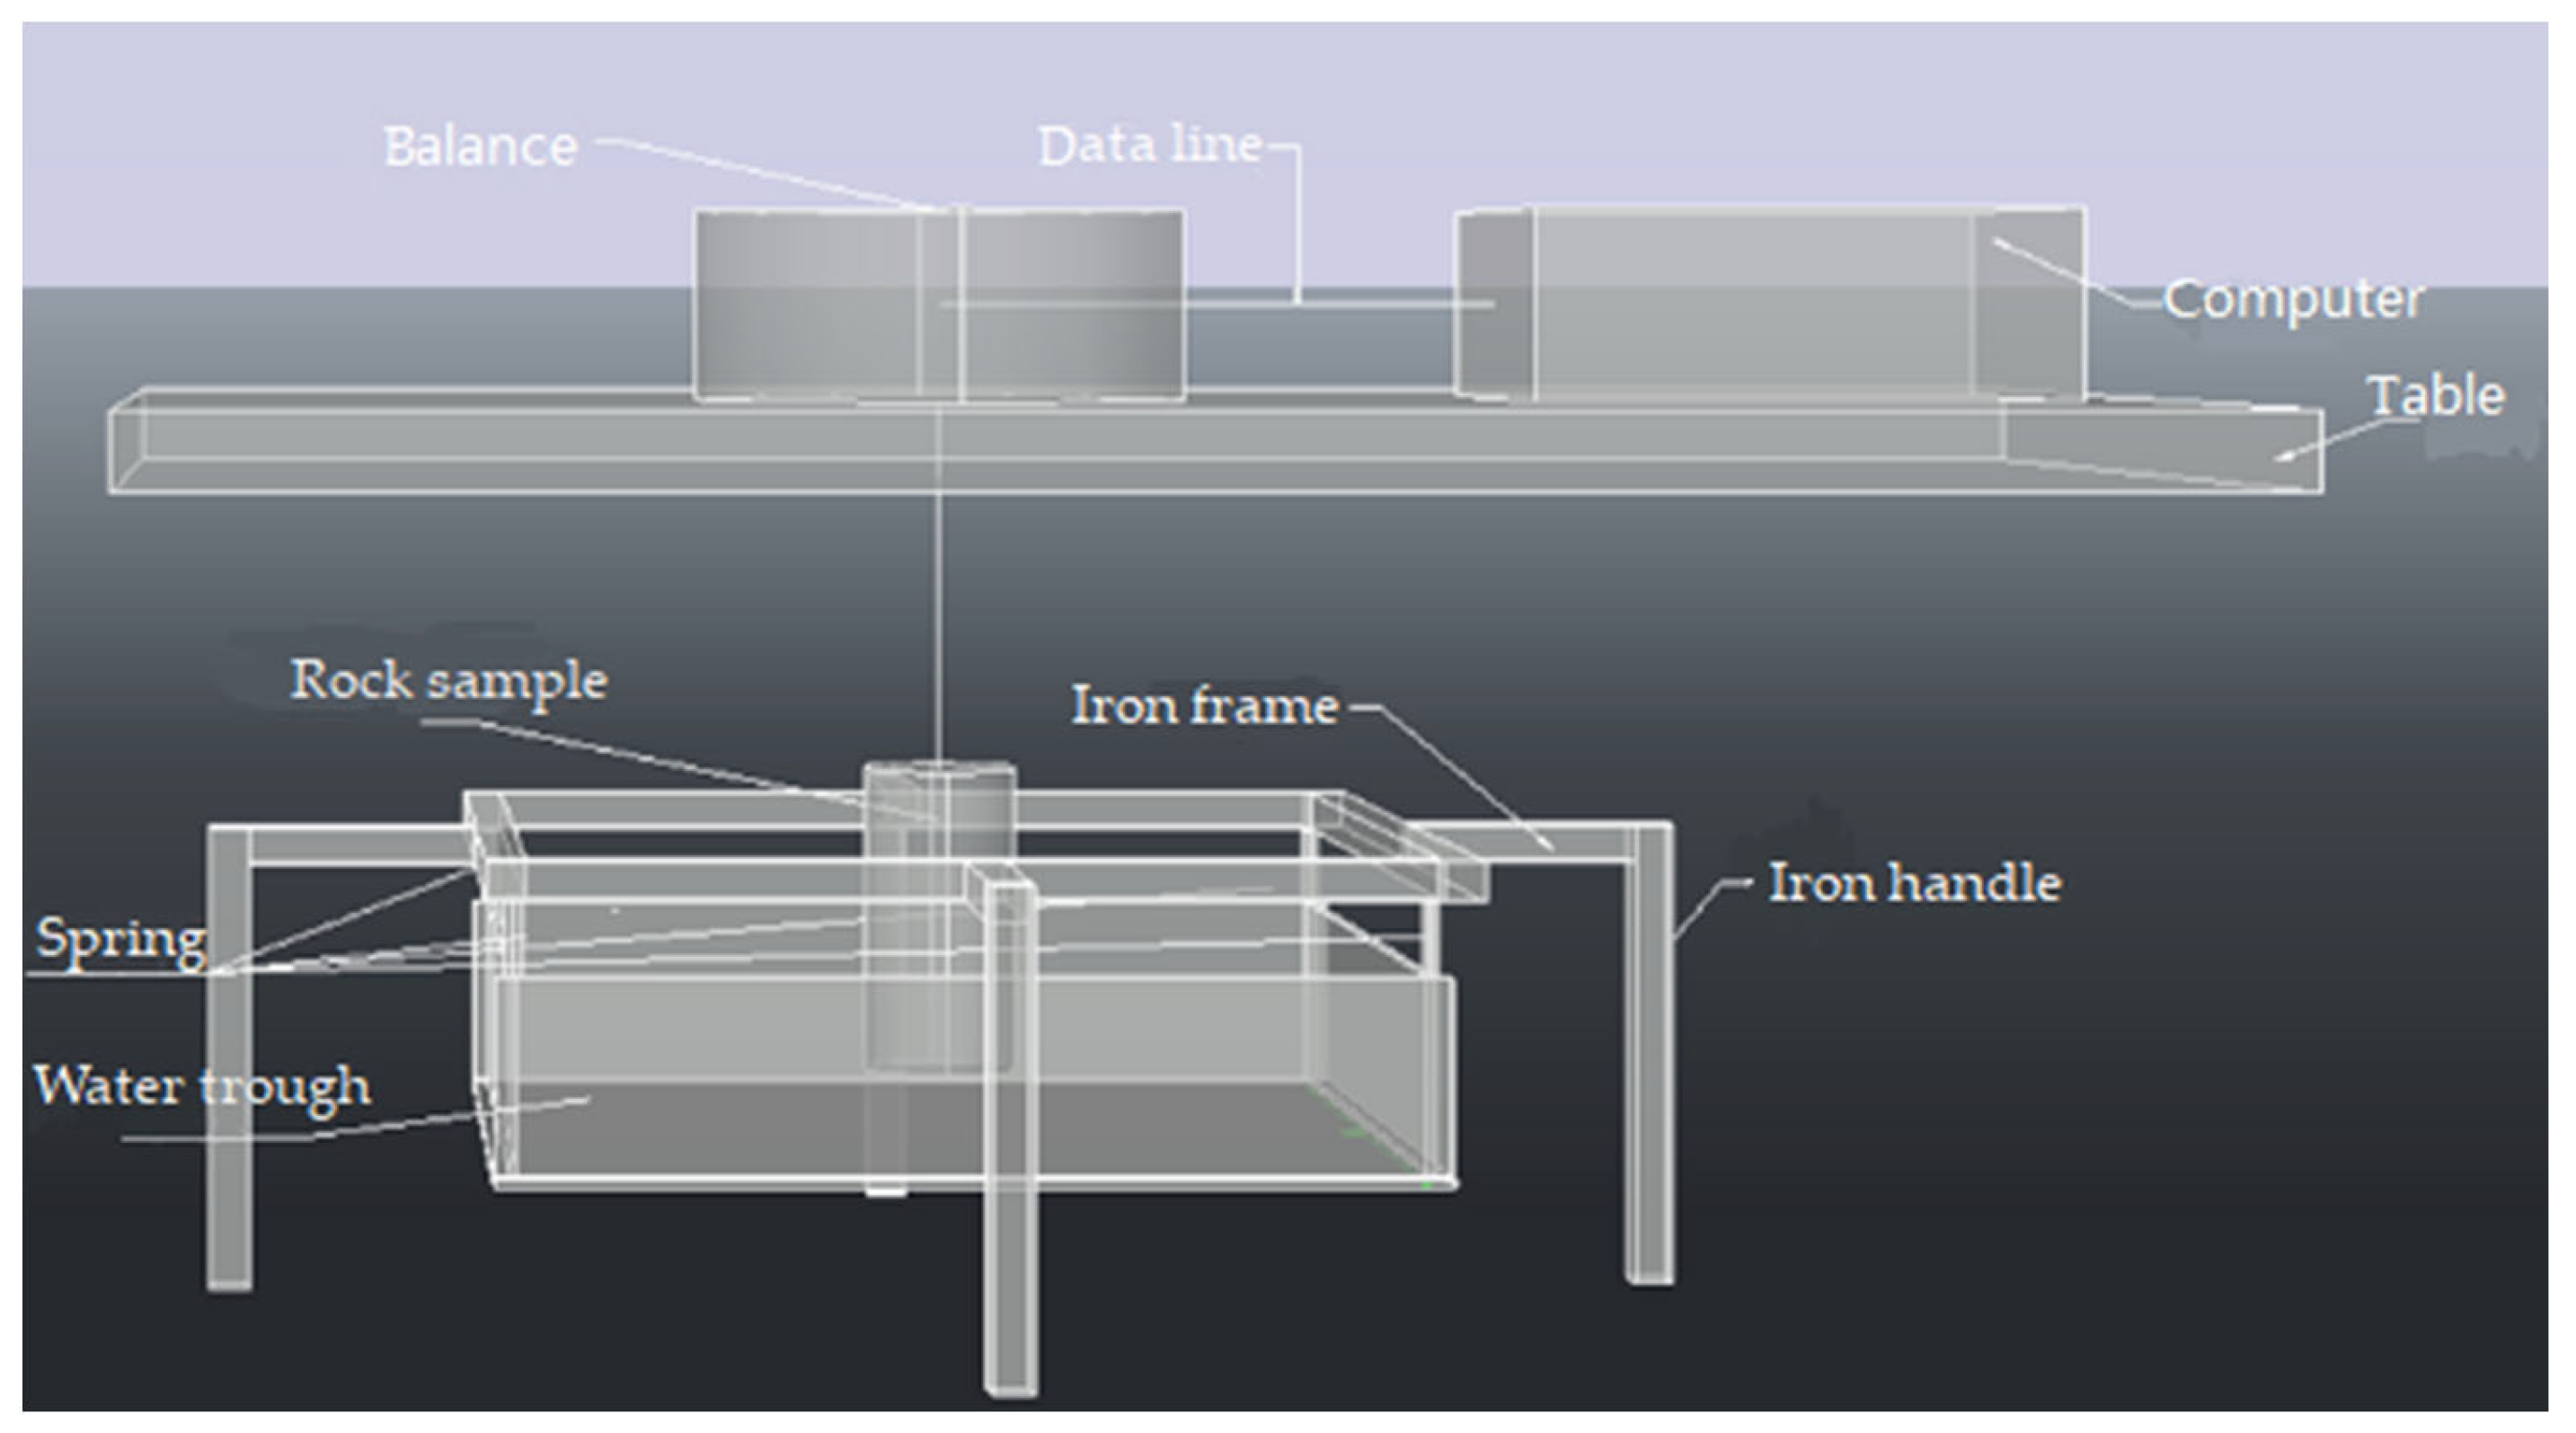
2.1. Test Equipment

The hydration absorption equipment used in the test was a self-developed intelligent test system for rock hydration, as shown in Figure 1. The upper end of the sample was suspended below the electronic balance, the lower end of the sample was in contact with the water surface of the sink, and the four corners of the sink were connected to the iron frame by springs. By setting the cross-sectional area of the water tank and the stiffness coefficient of the spring, the rock can absorb water on one side and the contact area between the rock and water remains unchanged during the process of hydration absorption.
The infrared equipment used in the test was the X6901sc infrared thermal imager produced by the FLIR Company in the United States, as shown in Figure 2. This device can be used to measure the radiation temperature distribution of the surface of an object in a non-contact and rapid way, and it can make use of its characteristic parameters, such as average surface temperature, maximum temperature, etc., to obtain more abundant temperature information. Therefore, this study used the infrared thermal imager to study the characteristics of temperature field changes, and its basic parameters are shown in Table 1.

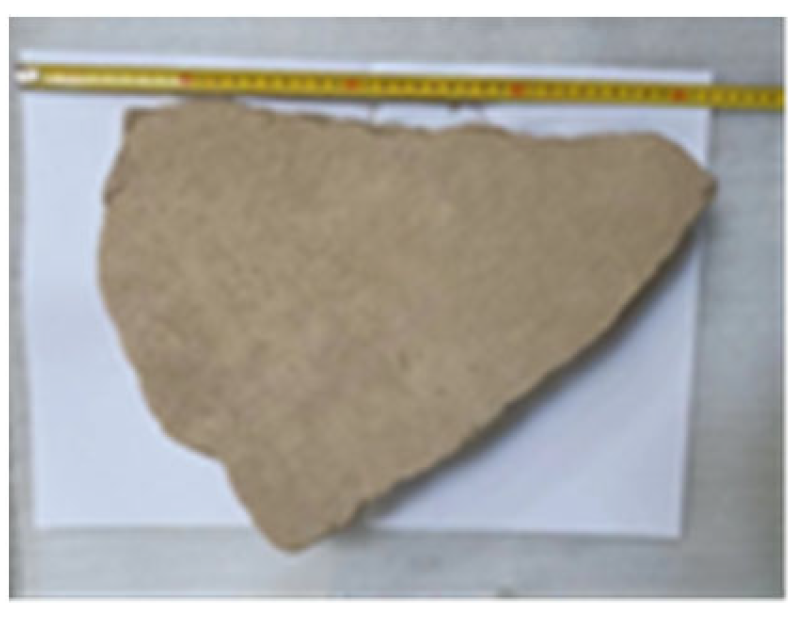
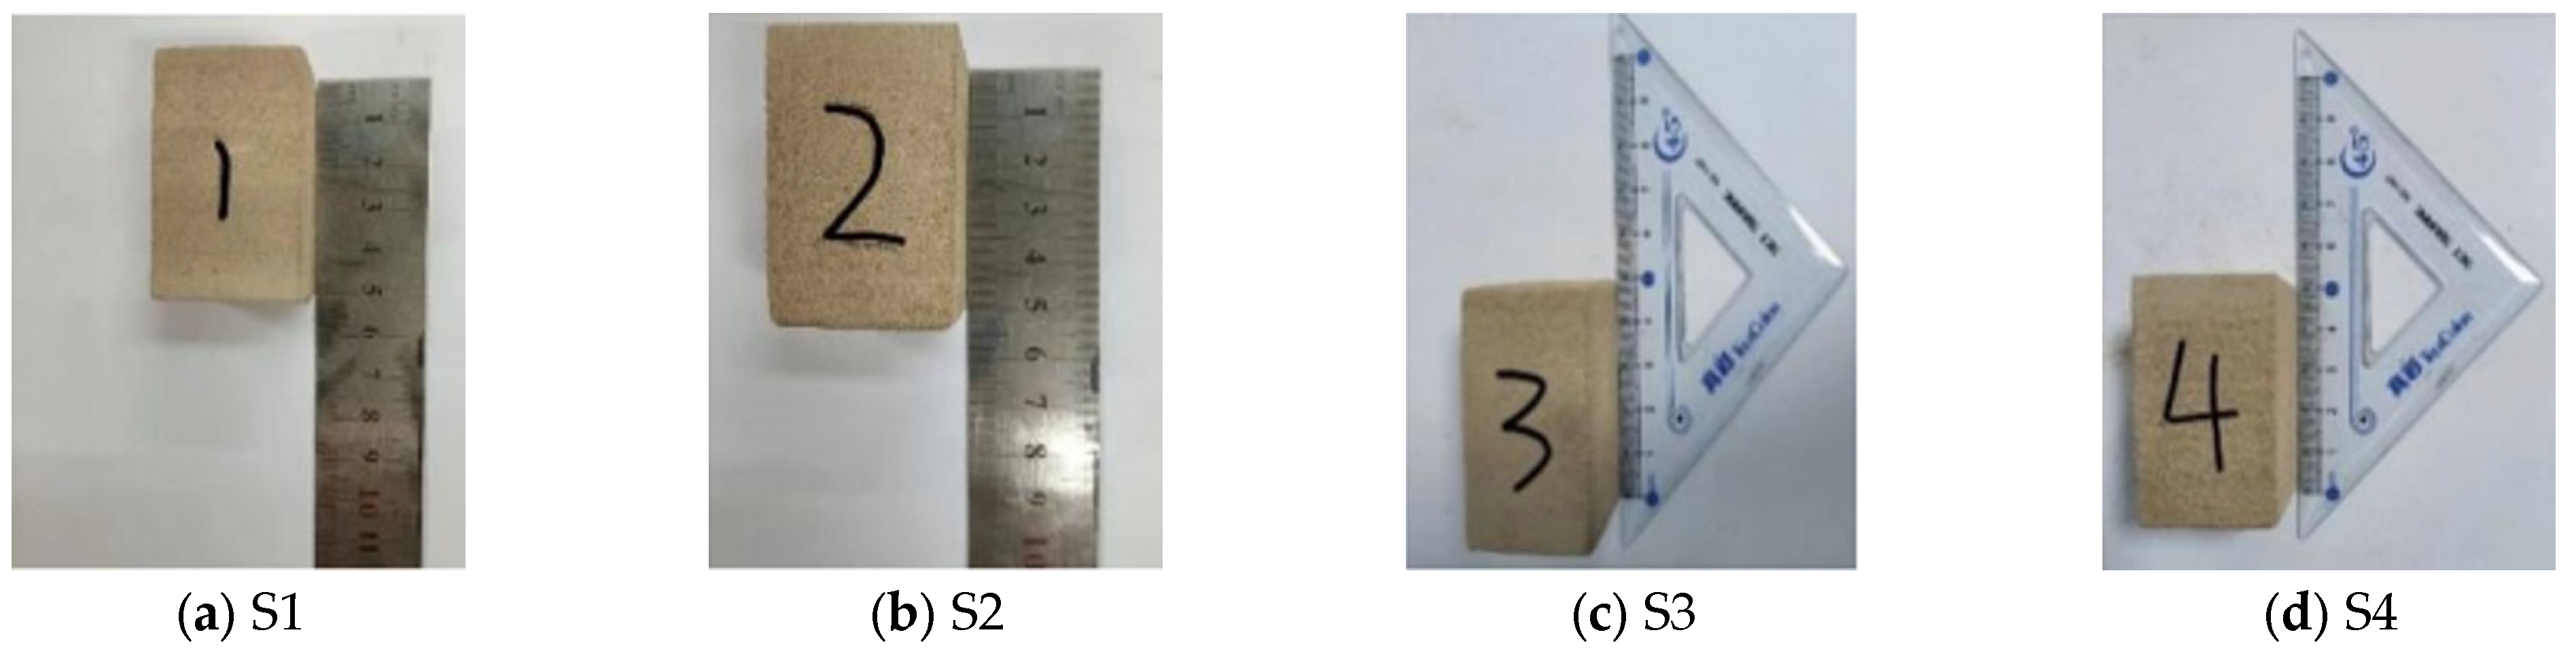
2.2. Sample Preparation

The sampling site was located in the north part of the Mogao Grottoes, where lithology is sandstone. A massive sample was retrieved from the site, as shown in Figure 3, and processed into a sample size of 30 mm × 30 mm × 50 mm, as shown in Figure 4. The specific size and quality (mass) of each rock sample are shown in Table 2, where Sample 1 is represented by S1, and so on for the other samples. The X-ray diffraction analysis of the rock’s mineral contents is shown in Table 3, in which plagioclase holds a large proportion.

2.3. Experimental Design

The system diagram of temperature changes during the hydration absorption process, monitored by the infrared thermal imager is shown in Figure 5. The above 4 samples were taken into a drying oven at 105 °C and 65 °C. After drying, the samples were taken out and immediately absorbed water in two groups of experiments. In each group, the first three samples absorbed water while the fourth sample did not absorb water (as the control). In the third group, 4 samples were dried and cooled to 25 °C for hydration absorption experiments. As the control group, filter paper was placed on the tray where the samples were placed to ensure that the bottoms of the samples were in more uniform contact with water. At the same time, data were derived to obtain the hydration absorption data of the sandstone samples. The establishment of each control group is shown in Table 4 below. According to the data obtained from the above hydration absorption experiments, the fitting curves of the hydration absorption characteristics of sandstone samples at different initial temperatures were drawn, fitting formulae were obtained, and the effects of different initial temperatures on the hydration absorption characteristics of sandstone were summarized. The infrared thermal imager was connected to the computer and set to shoot 10 infrared images per second. The angle was adjusted to monitor the hydration absorption process of each sandstone sample in real time until the temperature no longer changed, and the infrared imaging was finished. Subsequently, the average temperature and maximum temperature data were derived for analysis. Fitting curves were drawn to obtain the fitting formula, and the infrared images of the temperature of the rock samples at each timepoint of hydration absorption were taken to obtain the test results. Finally, the temperature variation law of the hydration absorption process of sandstone at different initial temperatures was analyzed and summarized.

3. Results and Analysis

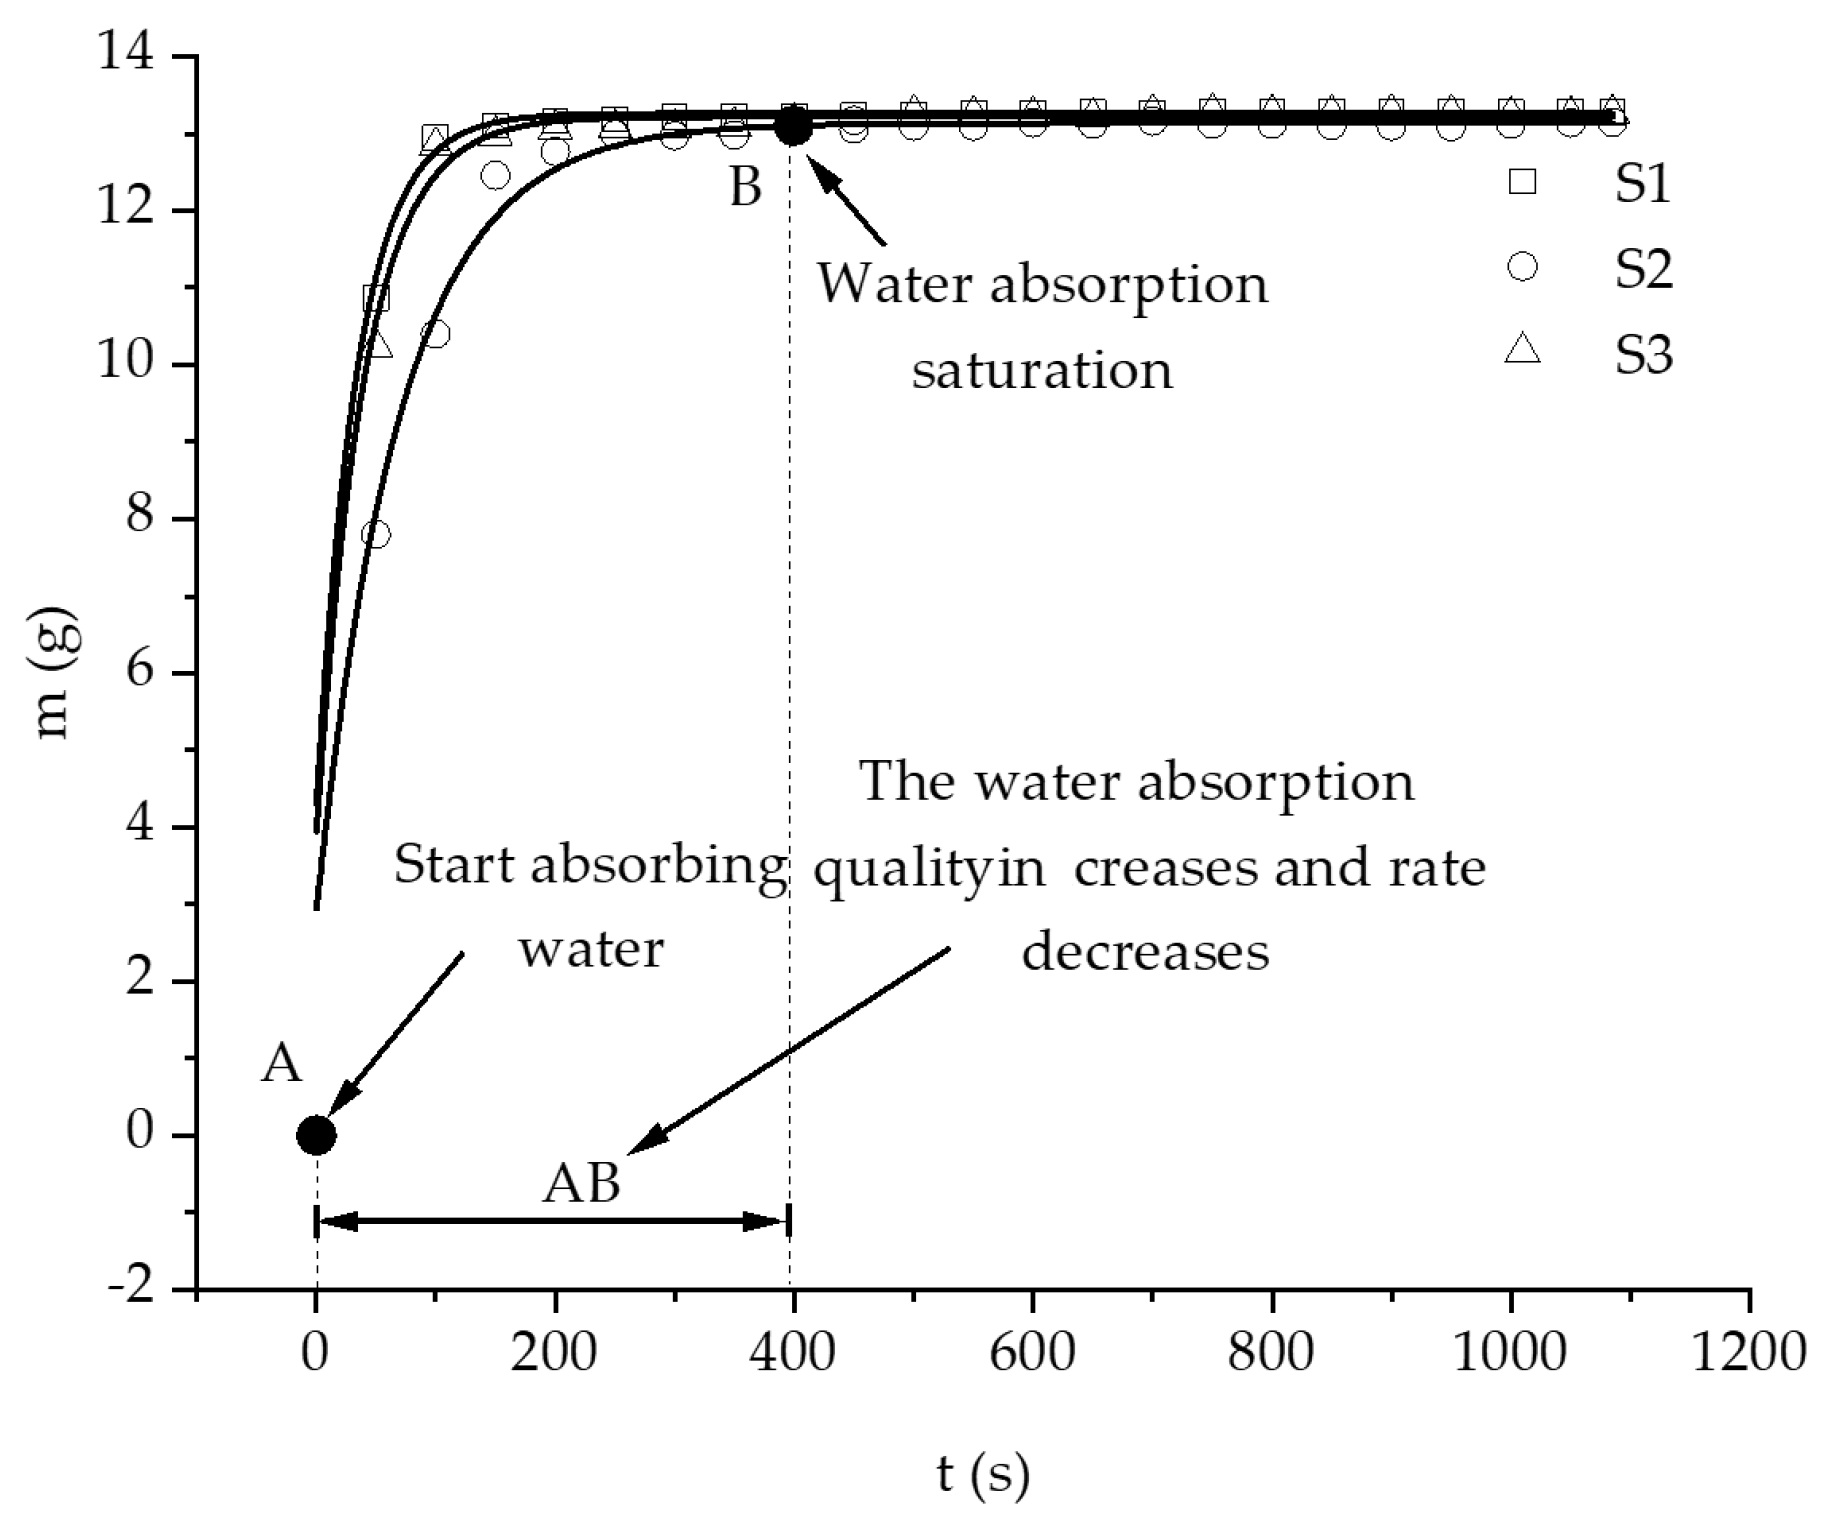
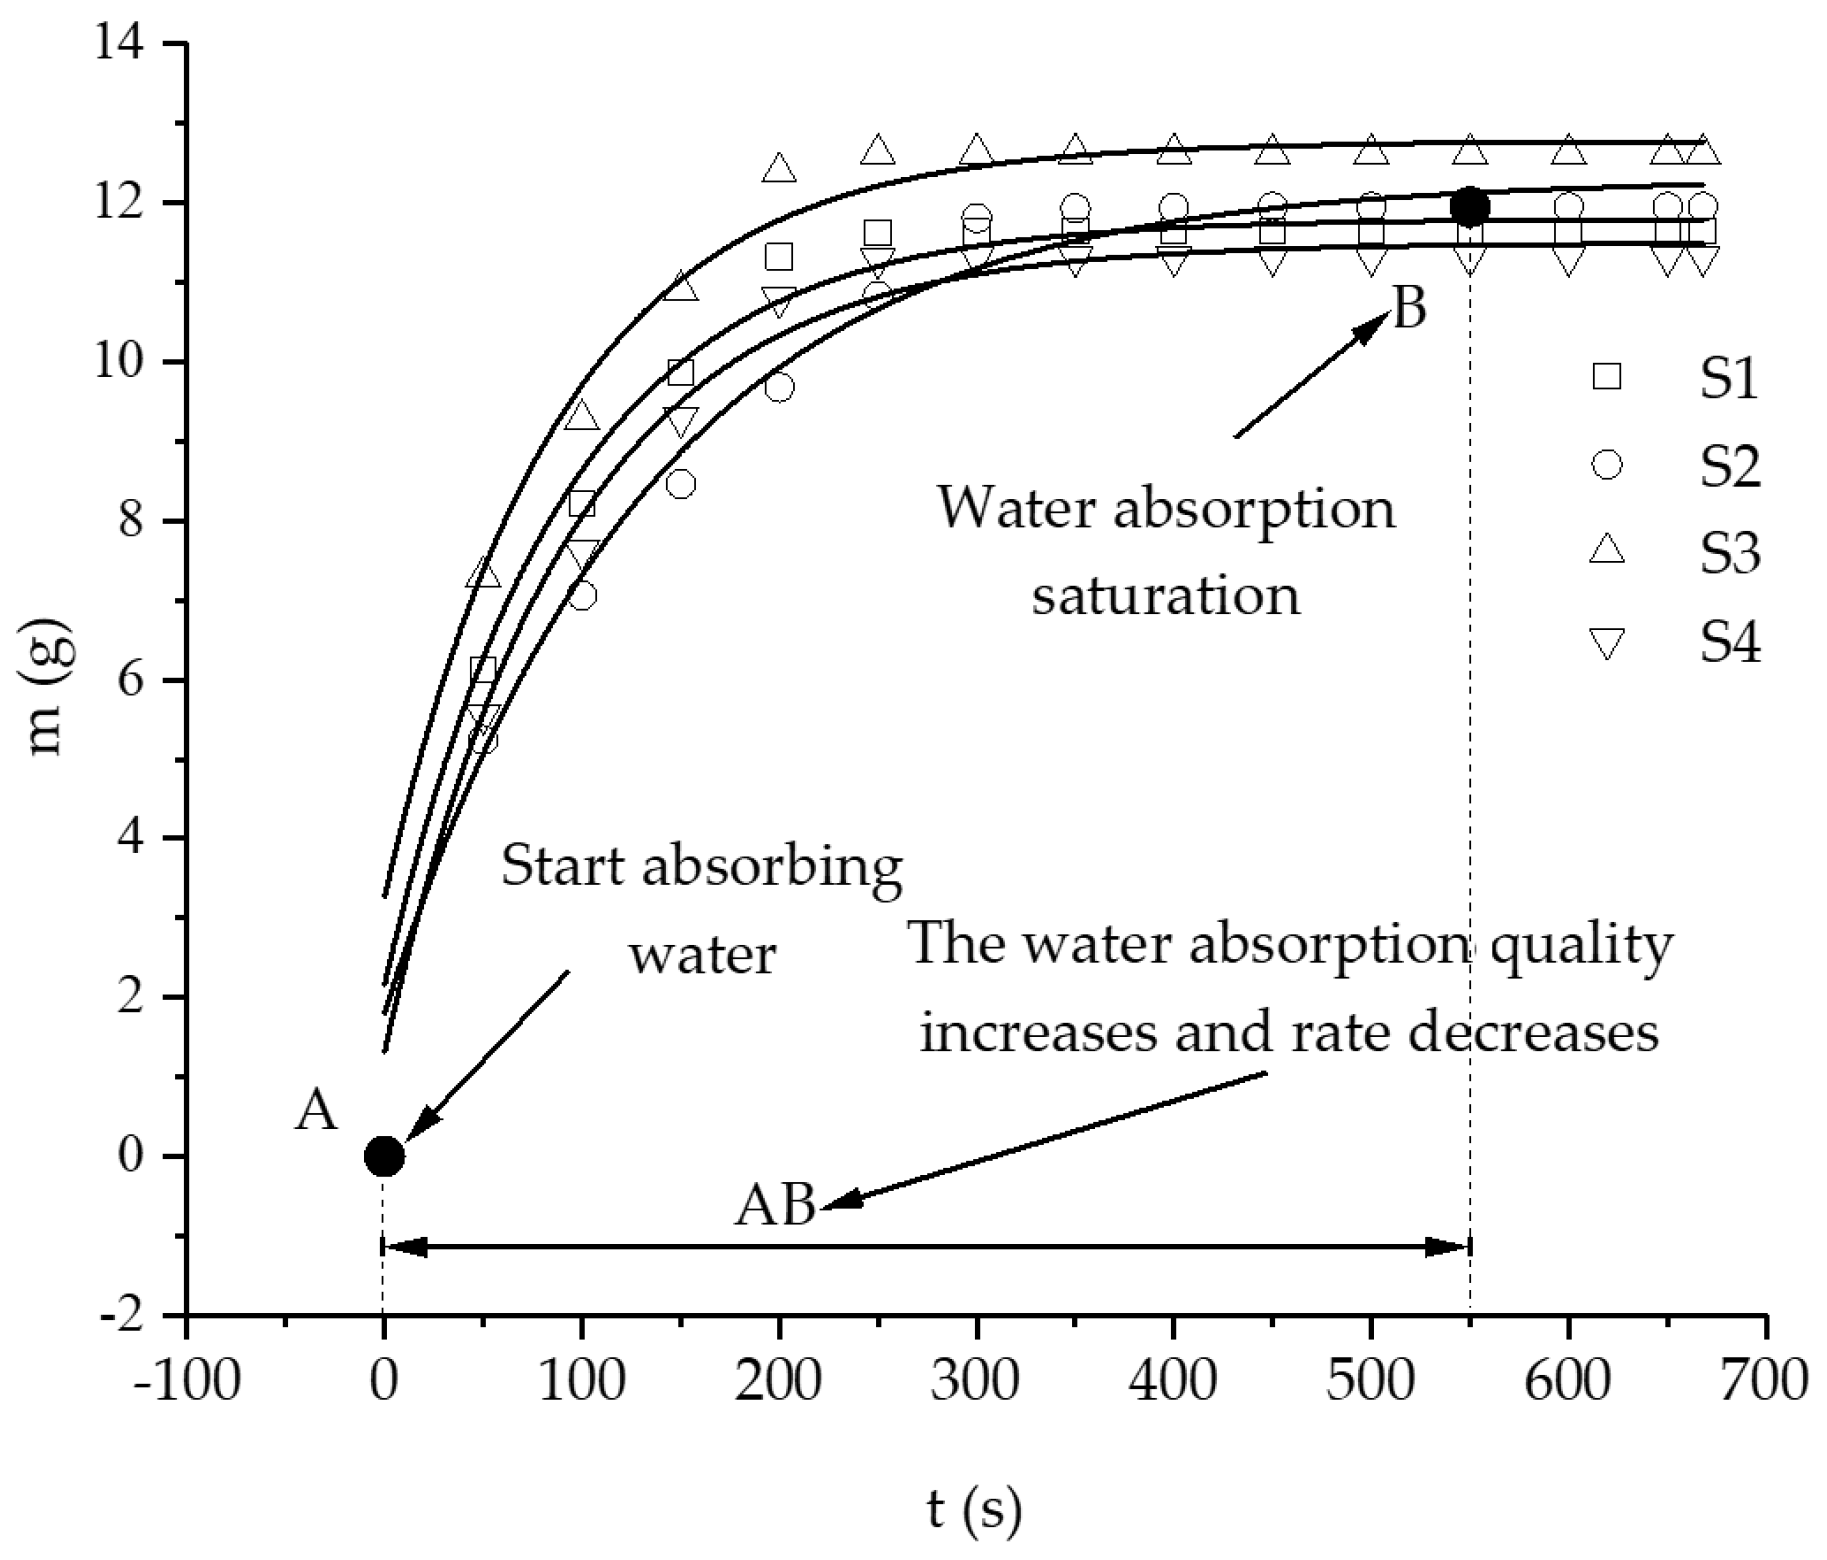
3.1. Hydration Absorption of Sandstone Samples at Different Initial Temperatures

The hydration absorption capacity data derived from the hydration absorption of the rock samples were processed, and the fitting curves were drawn with Origin software. The hydration absorption of each rock sample at initial temperatures of 105 °C, 65 °C, and 25 °C and the change curves of the average hydration absorption at each temperature are shown in Figure 6, Figure 7 and Figure 8, where t and m represent the absorption time and quality, respectively. The exponential function shown in Equation (1) was used to fit the hydration absorption mass data points, and the results of the fitting curve parameters are shown in Table 5, Table 6 and Table 7.
m ( t ) = a · e x p ( t / b ) + m 0
where a, b, and m0 are parameters, m(t) is the hydration absorption capacity (g) of sandstone at time t, and t is the hydration absorption time (s). These water absorption characteristics are also reflected in other materials, becoming important influencing factors on the permeability of porous media [19,20,21].
The derivative of Formula (1) is obtained as follows:
V   = d m ( t ) d t = a b e t b
This represents the hydration absorption rate. According to the data in the fitting parameter table, this value must be positive. With the increase in time t, the hydration absorption rate gradually decreases. It can be seen from Figure 6, Figure 7 and Figure 8 that the fitting curves of the hydration absorption changes of rock samples at different initial temperatures are consistent with certain rules. In addition, the trend of change is first rapidly increased, then slowly increased, and finally remains unchanged. This may be because the wetting peak of the rock samples rises continuously during the period of hydration absorption at the beginning, and water is first filled with large and connected pores, showing a rapid increase in hydration absorption. When the wetting peak rises to the top surface, water begins to penetrate into the smaller or more closed pores, showing that the hydration absorption increases slowly for a certain period until it remains unchanged after saturation.

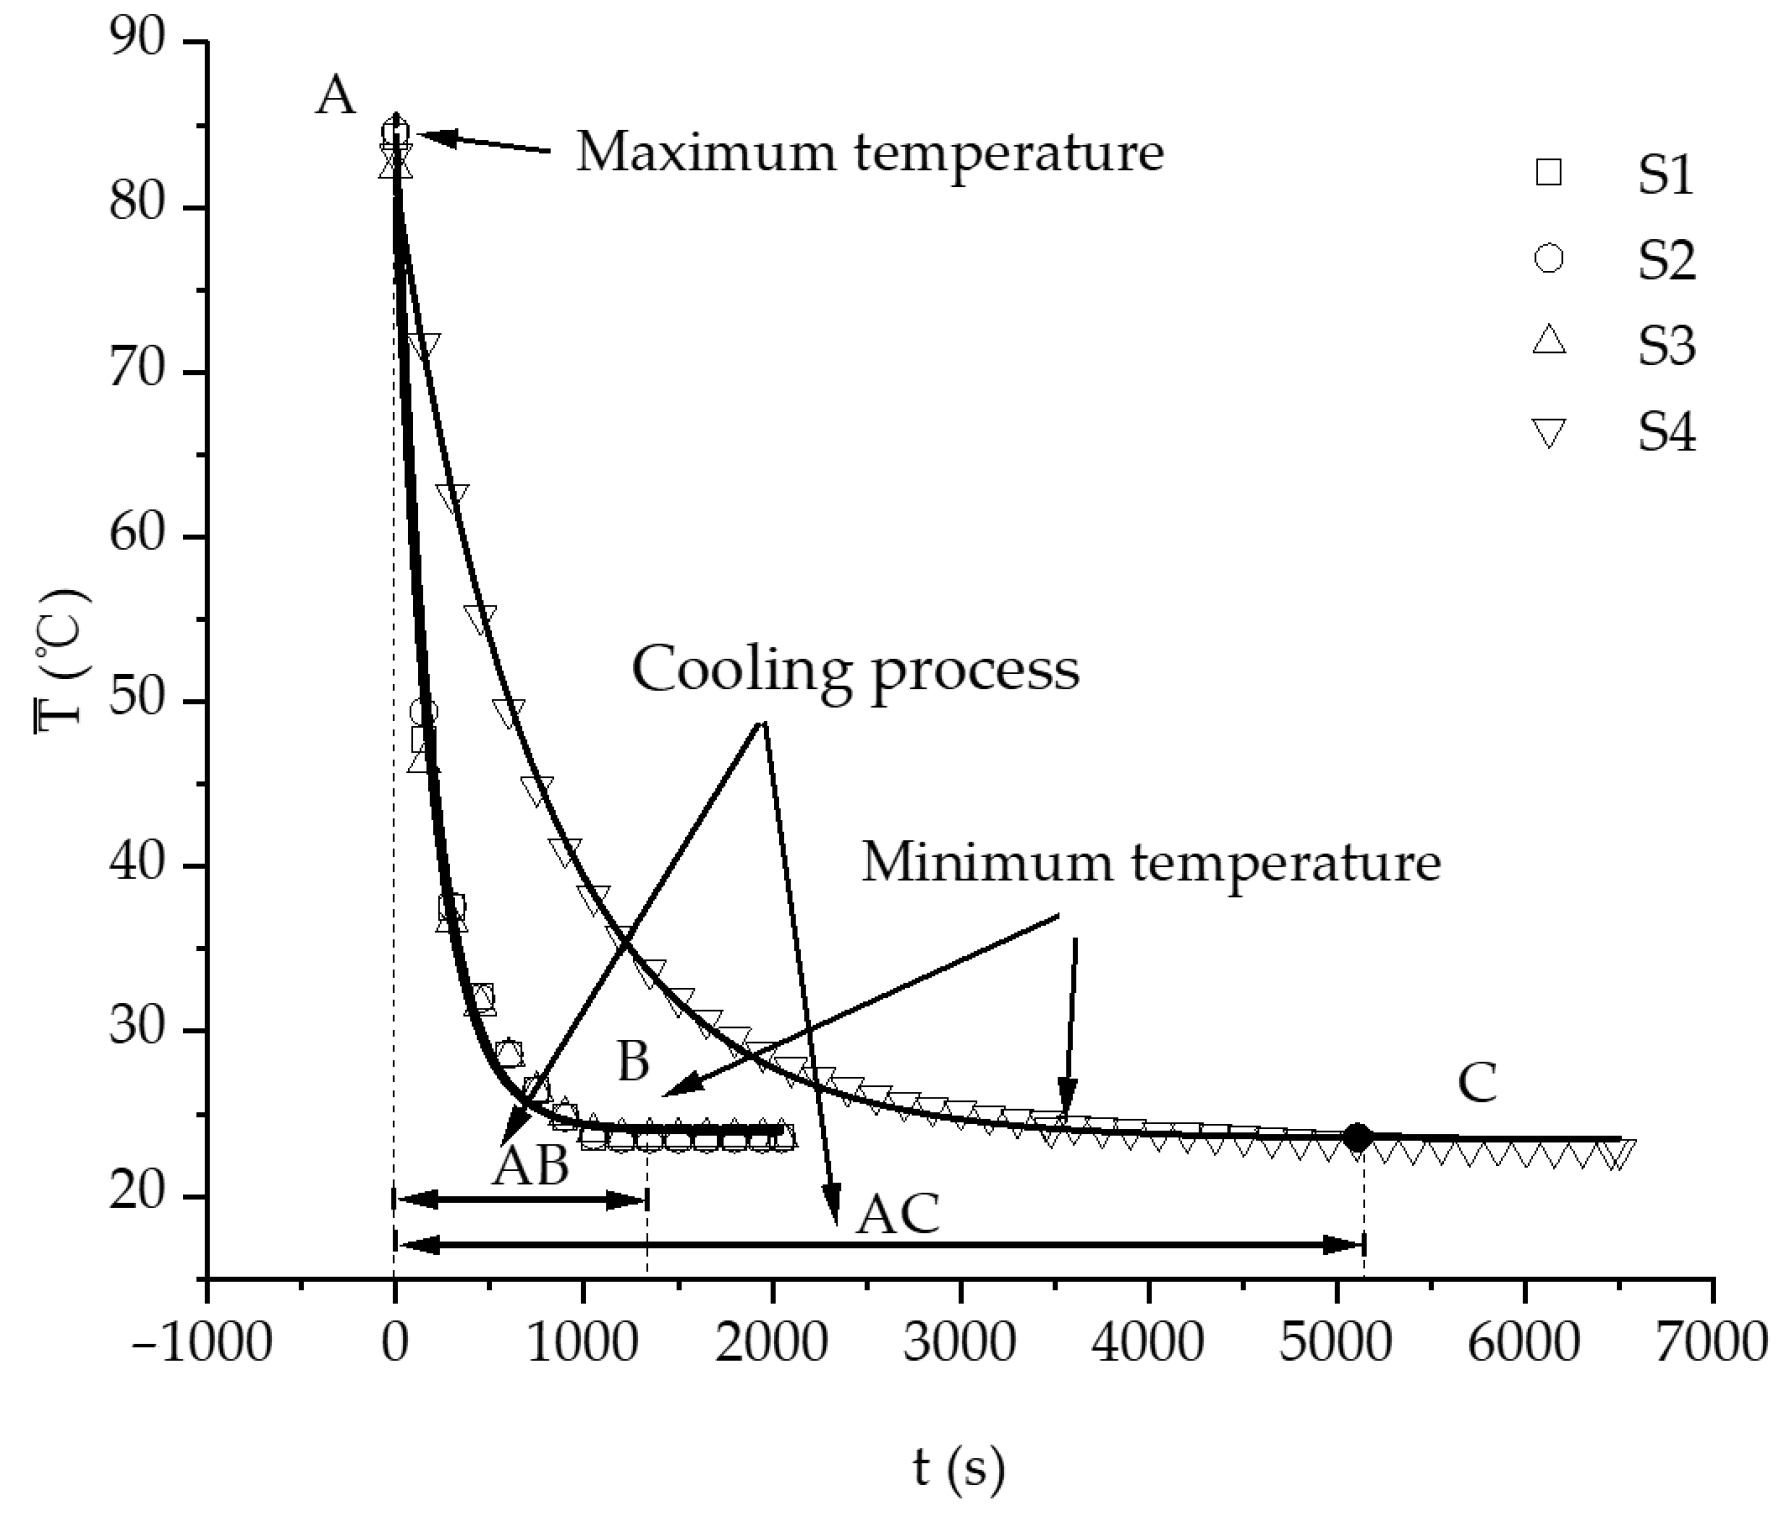
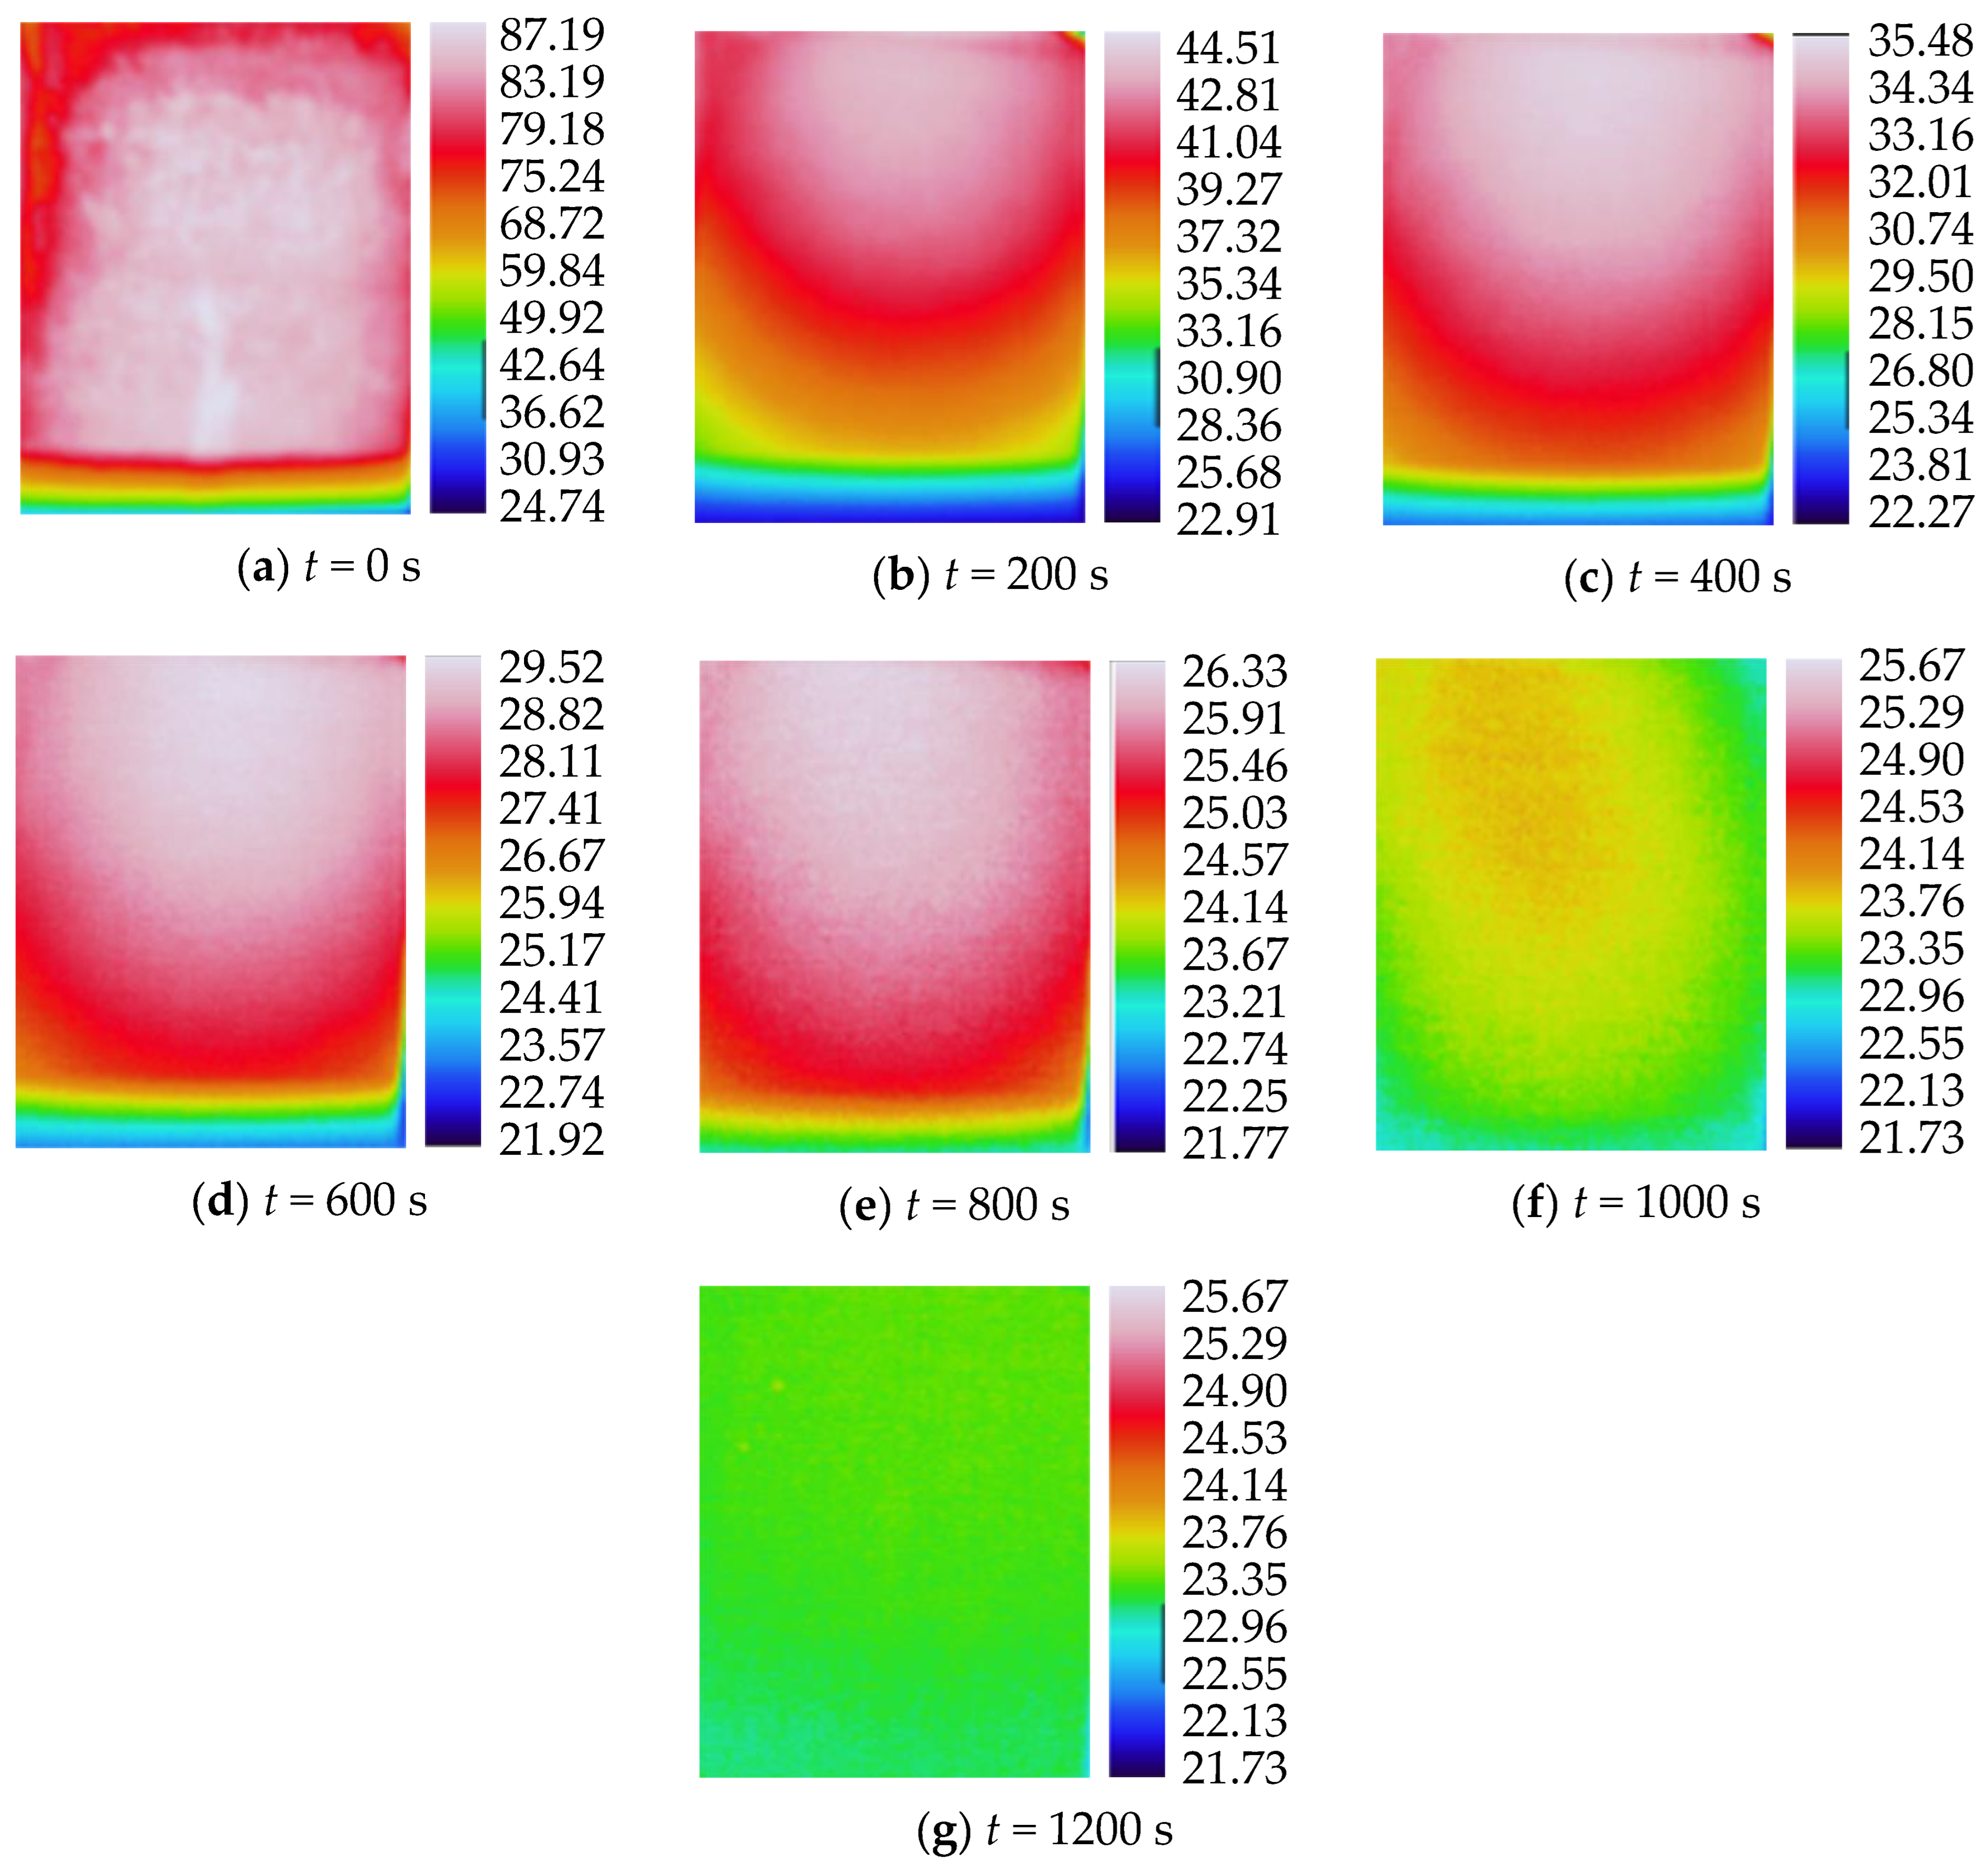
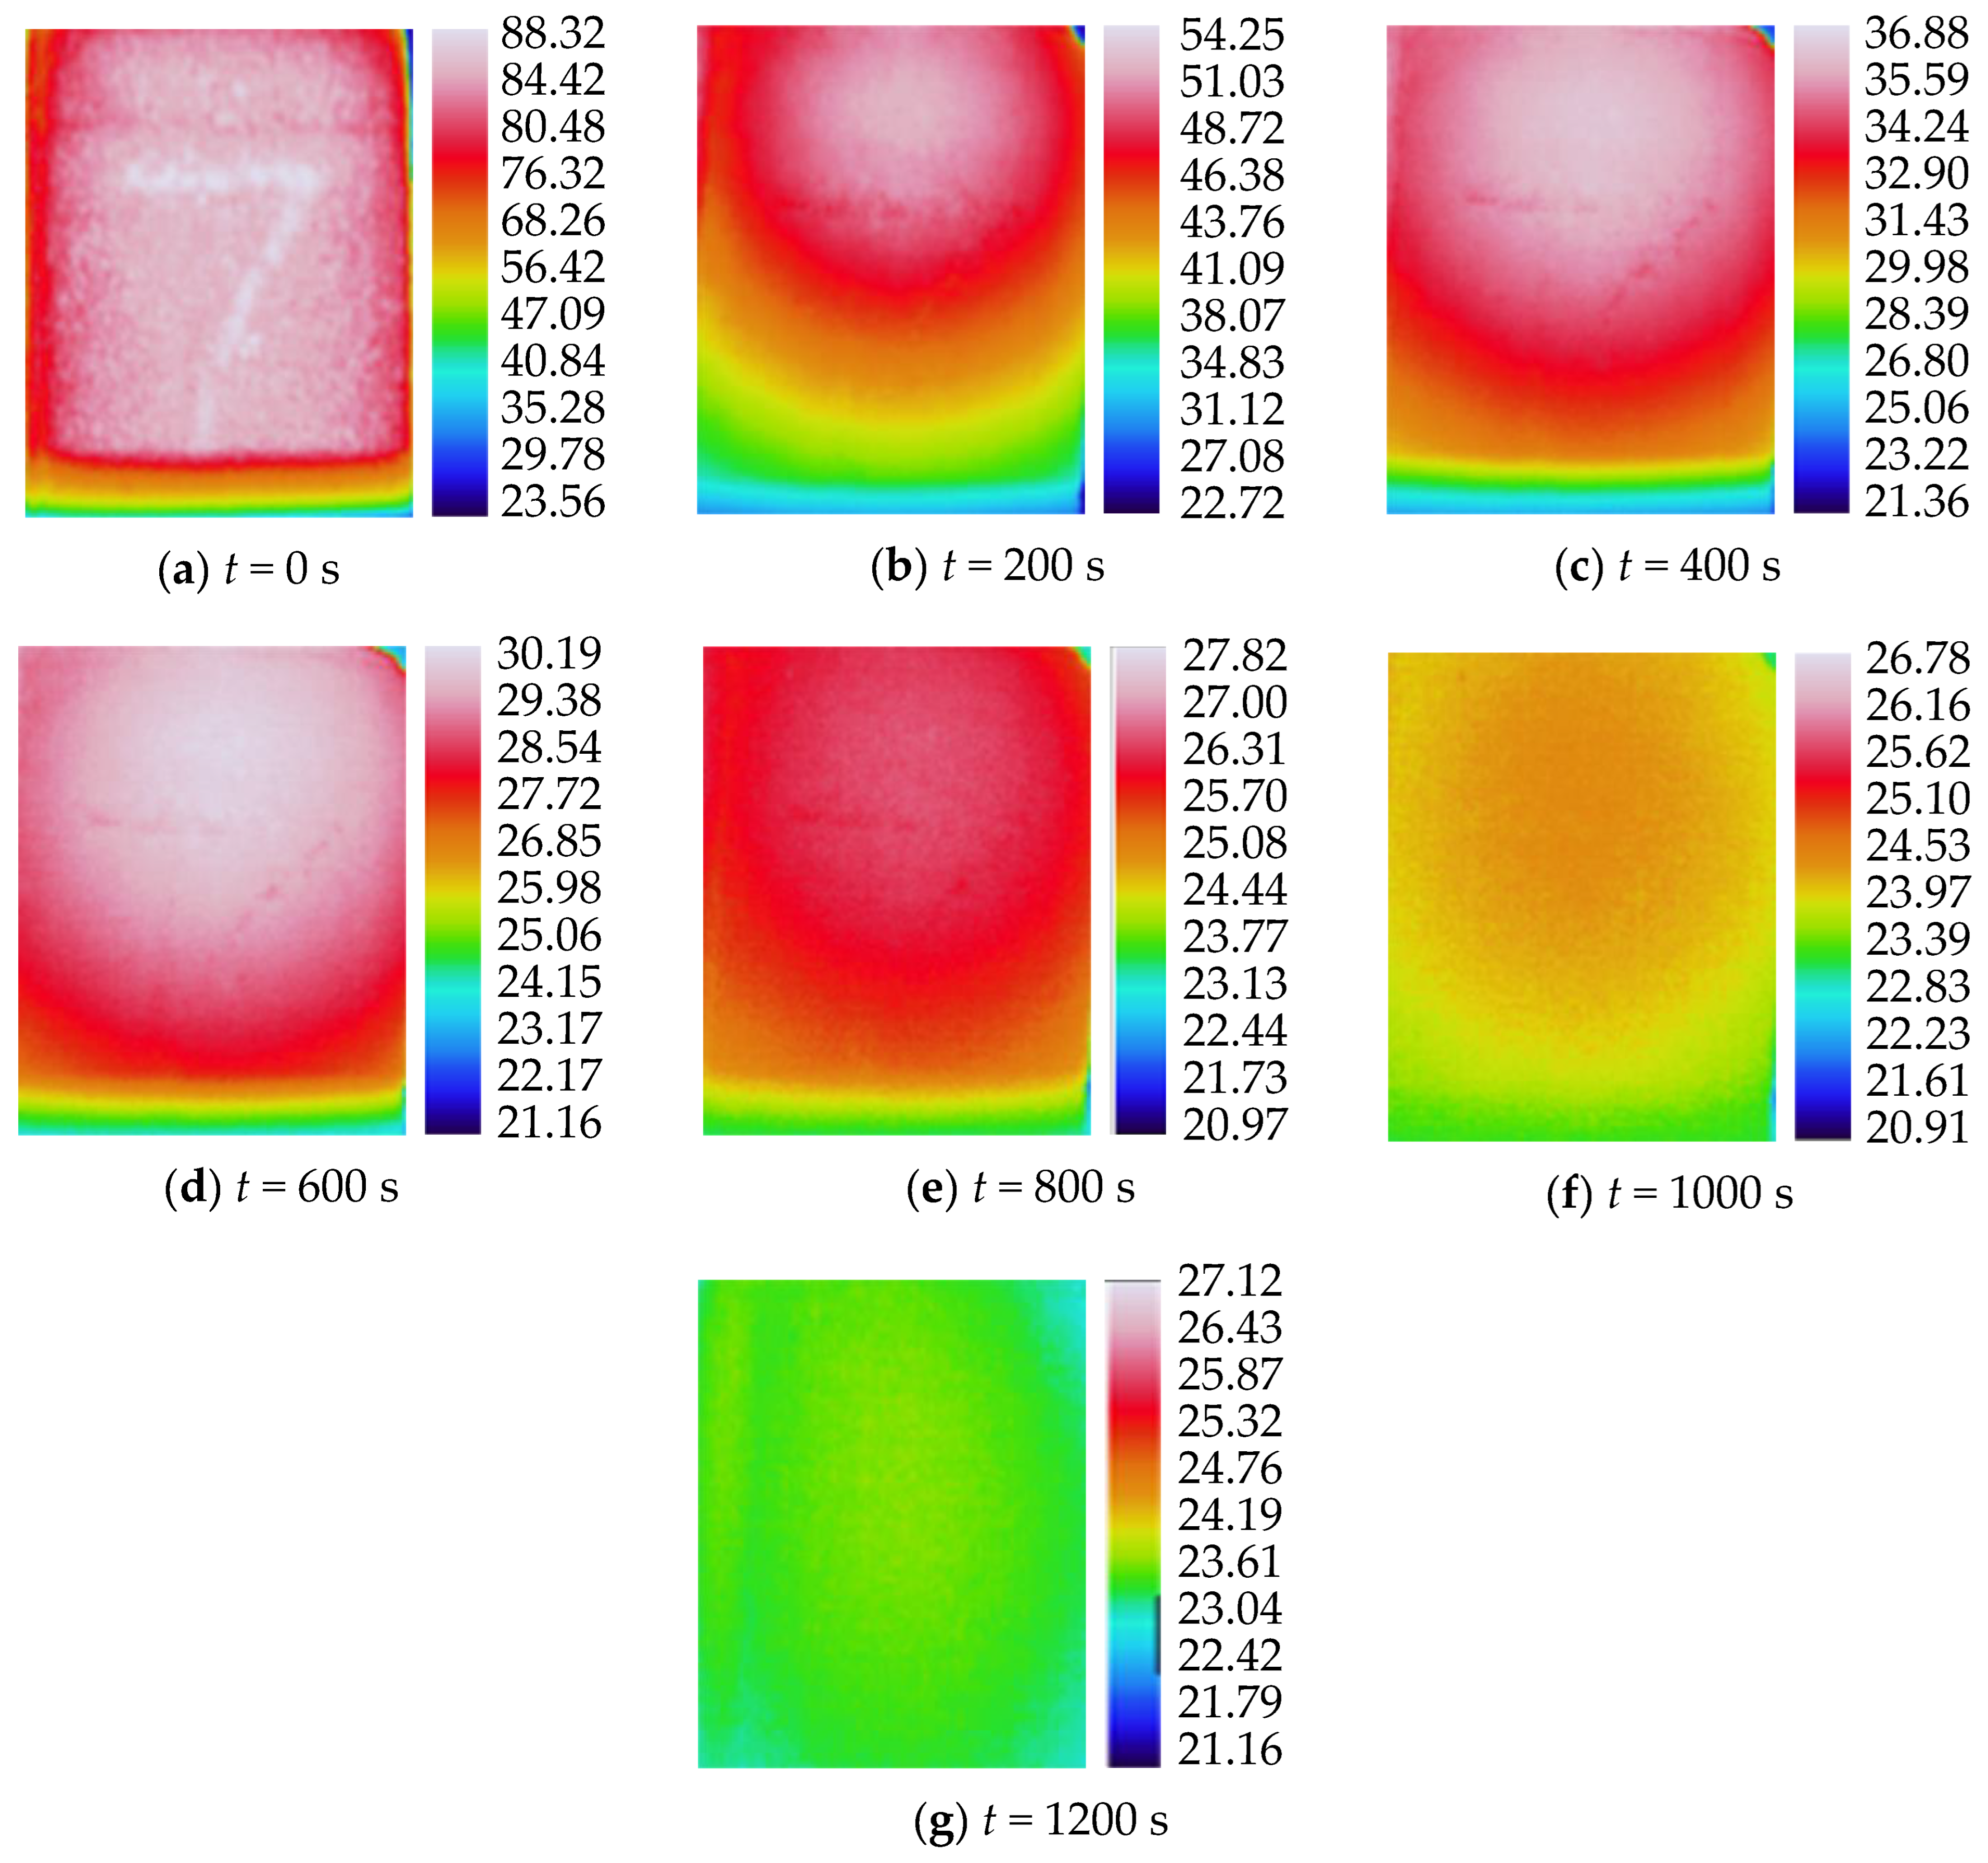
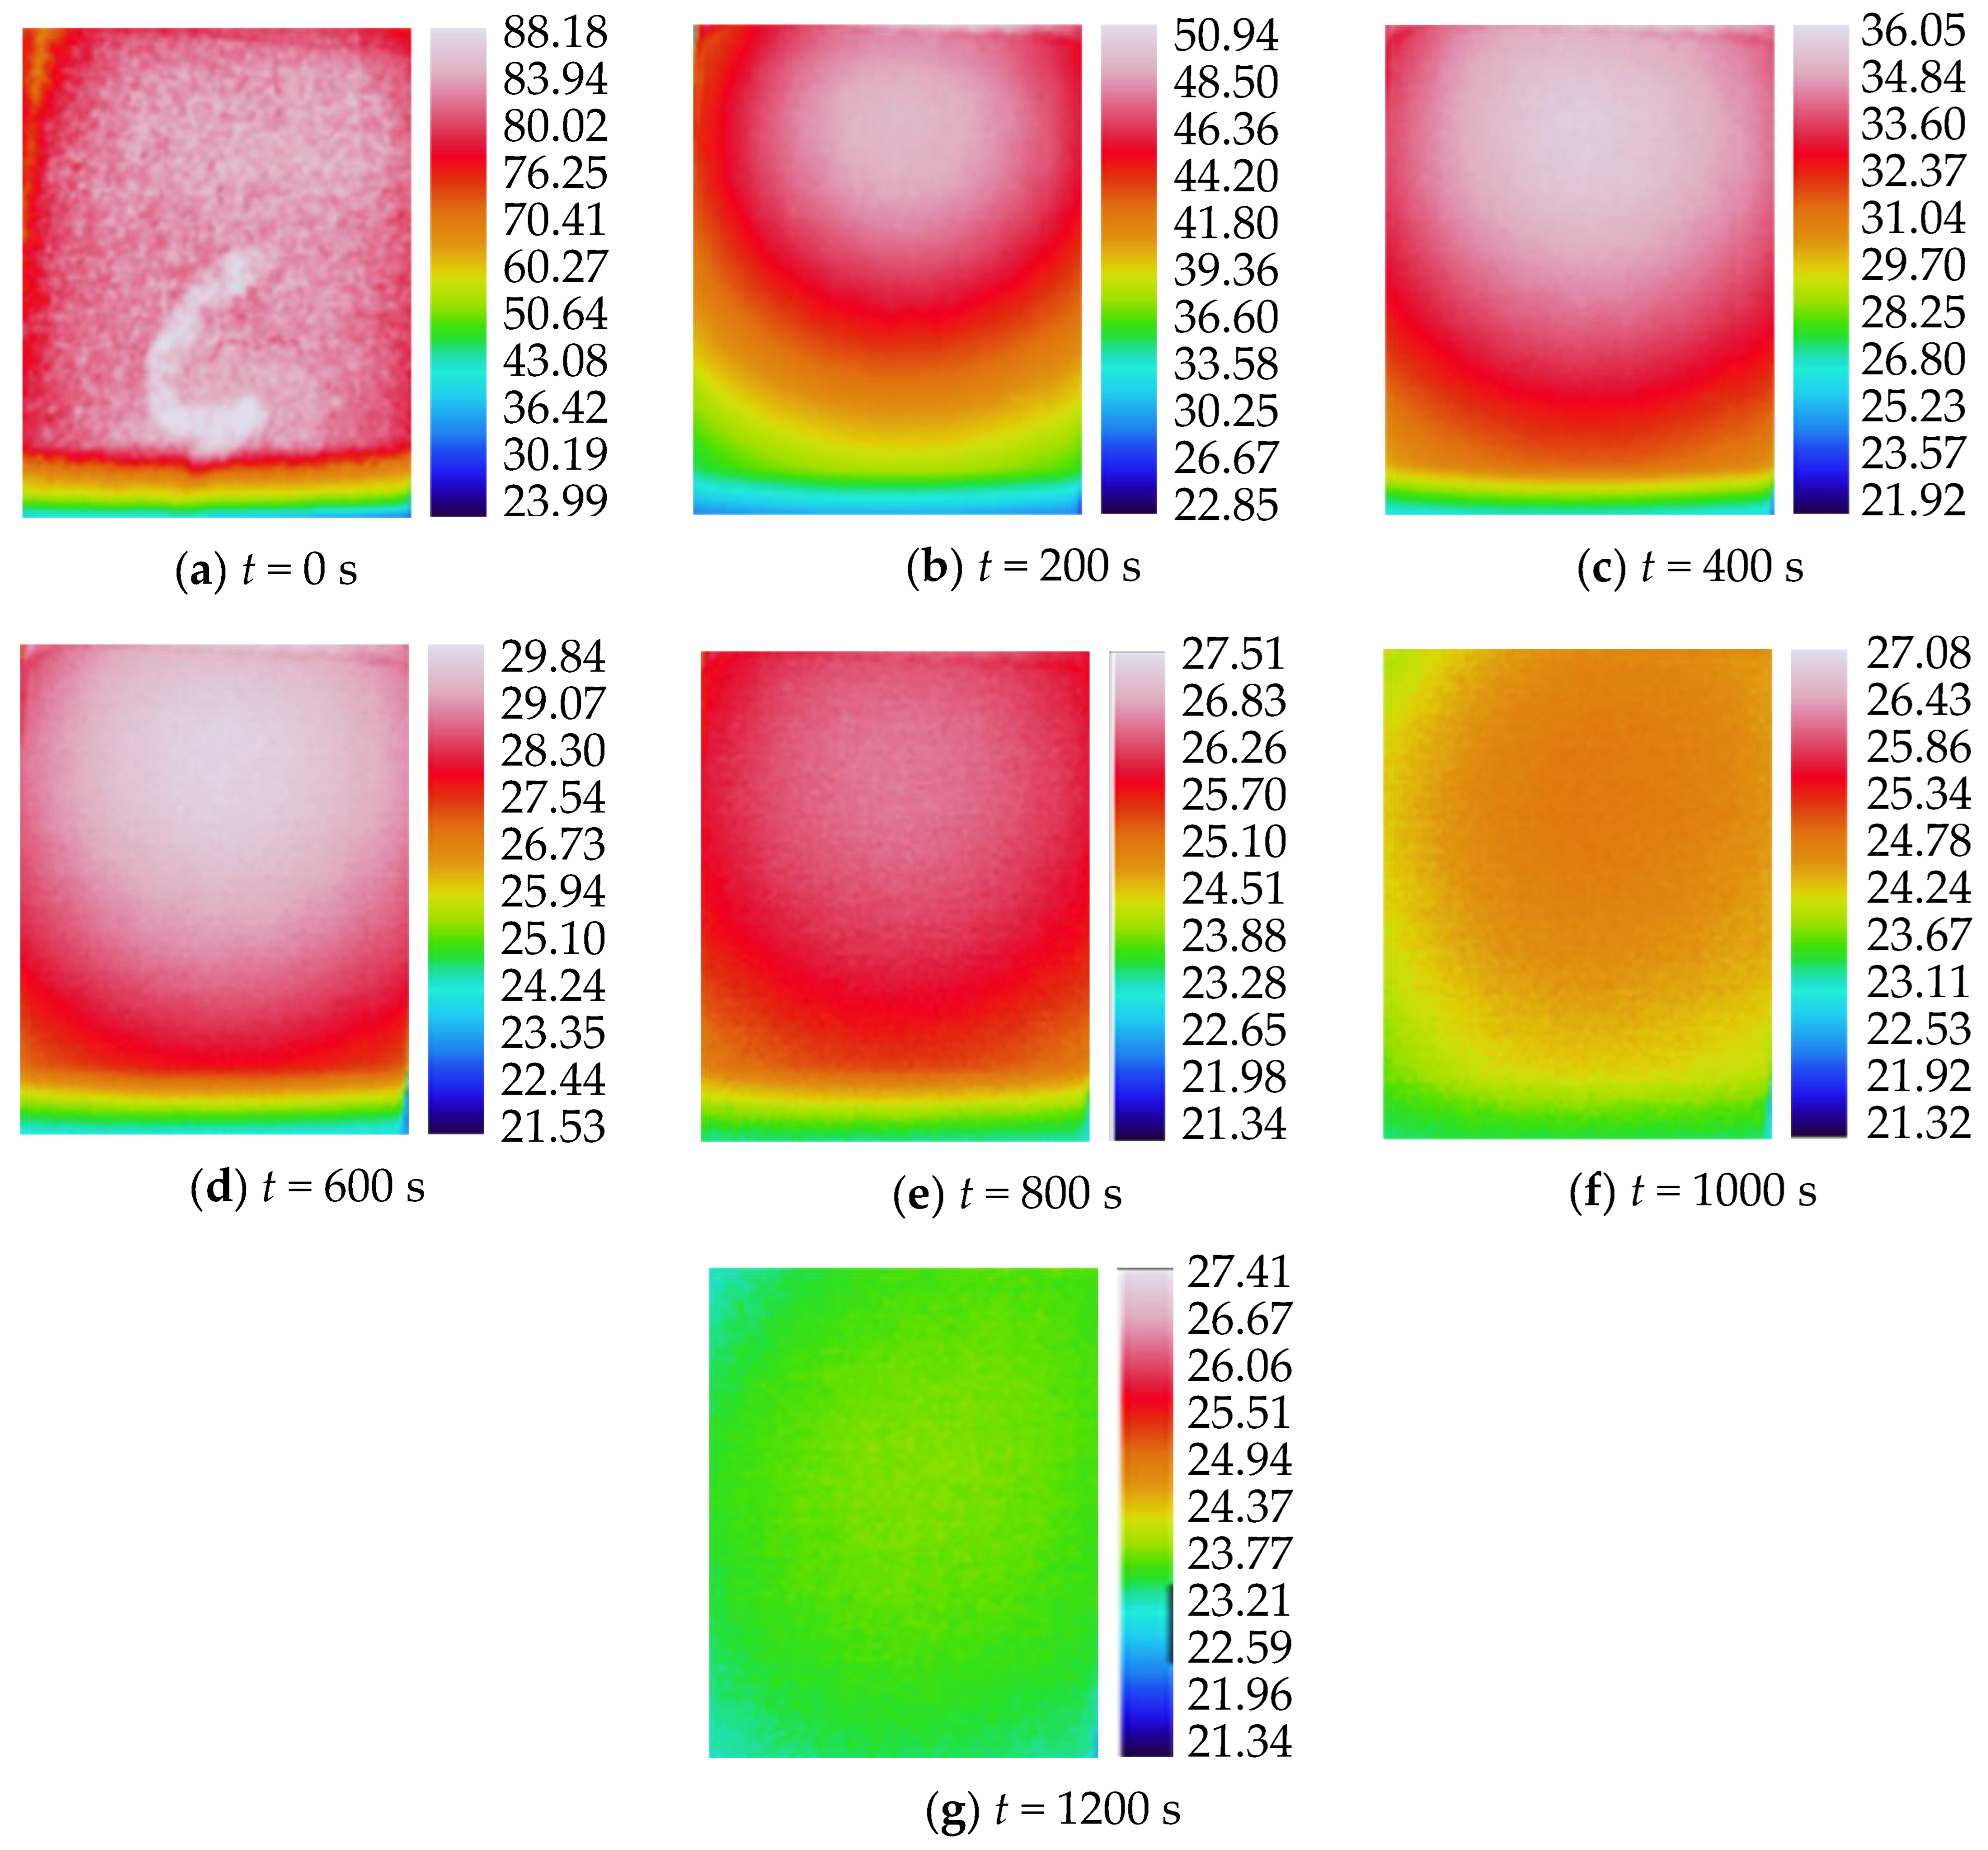
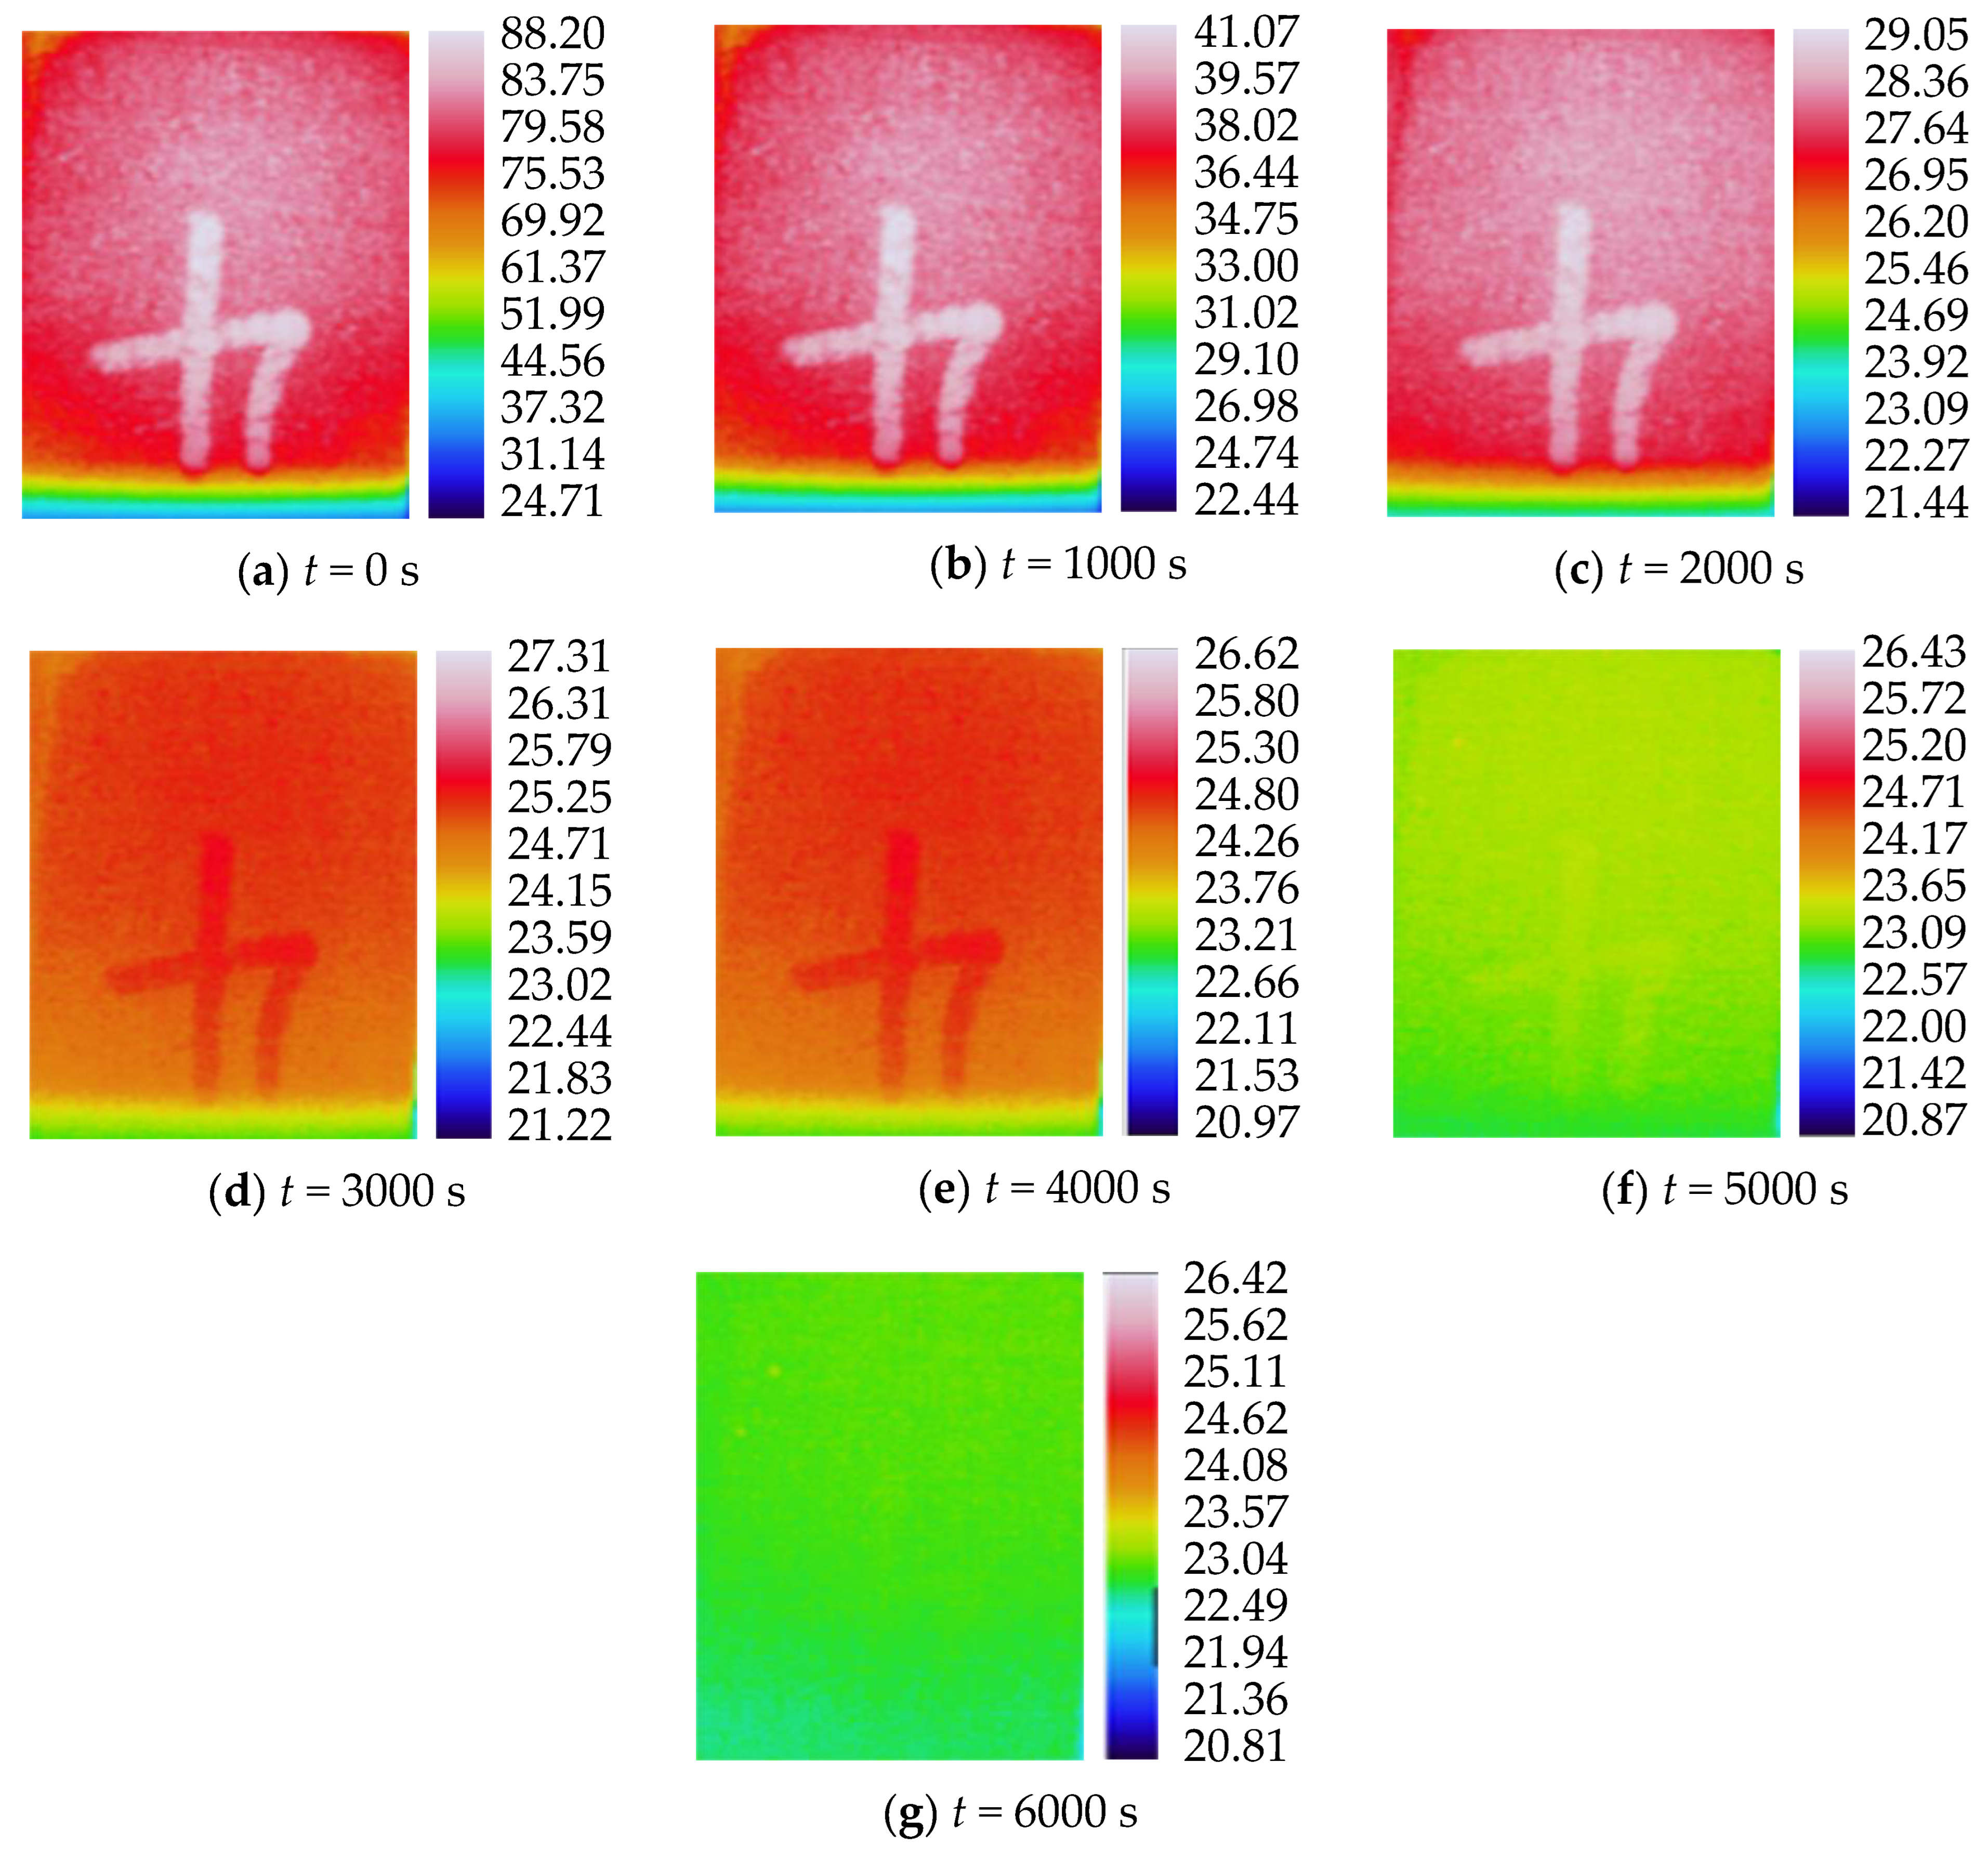
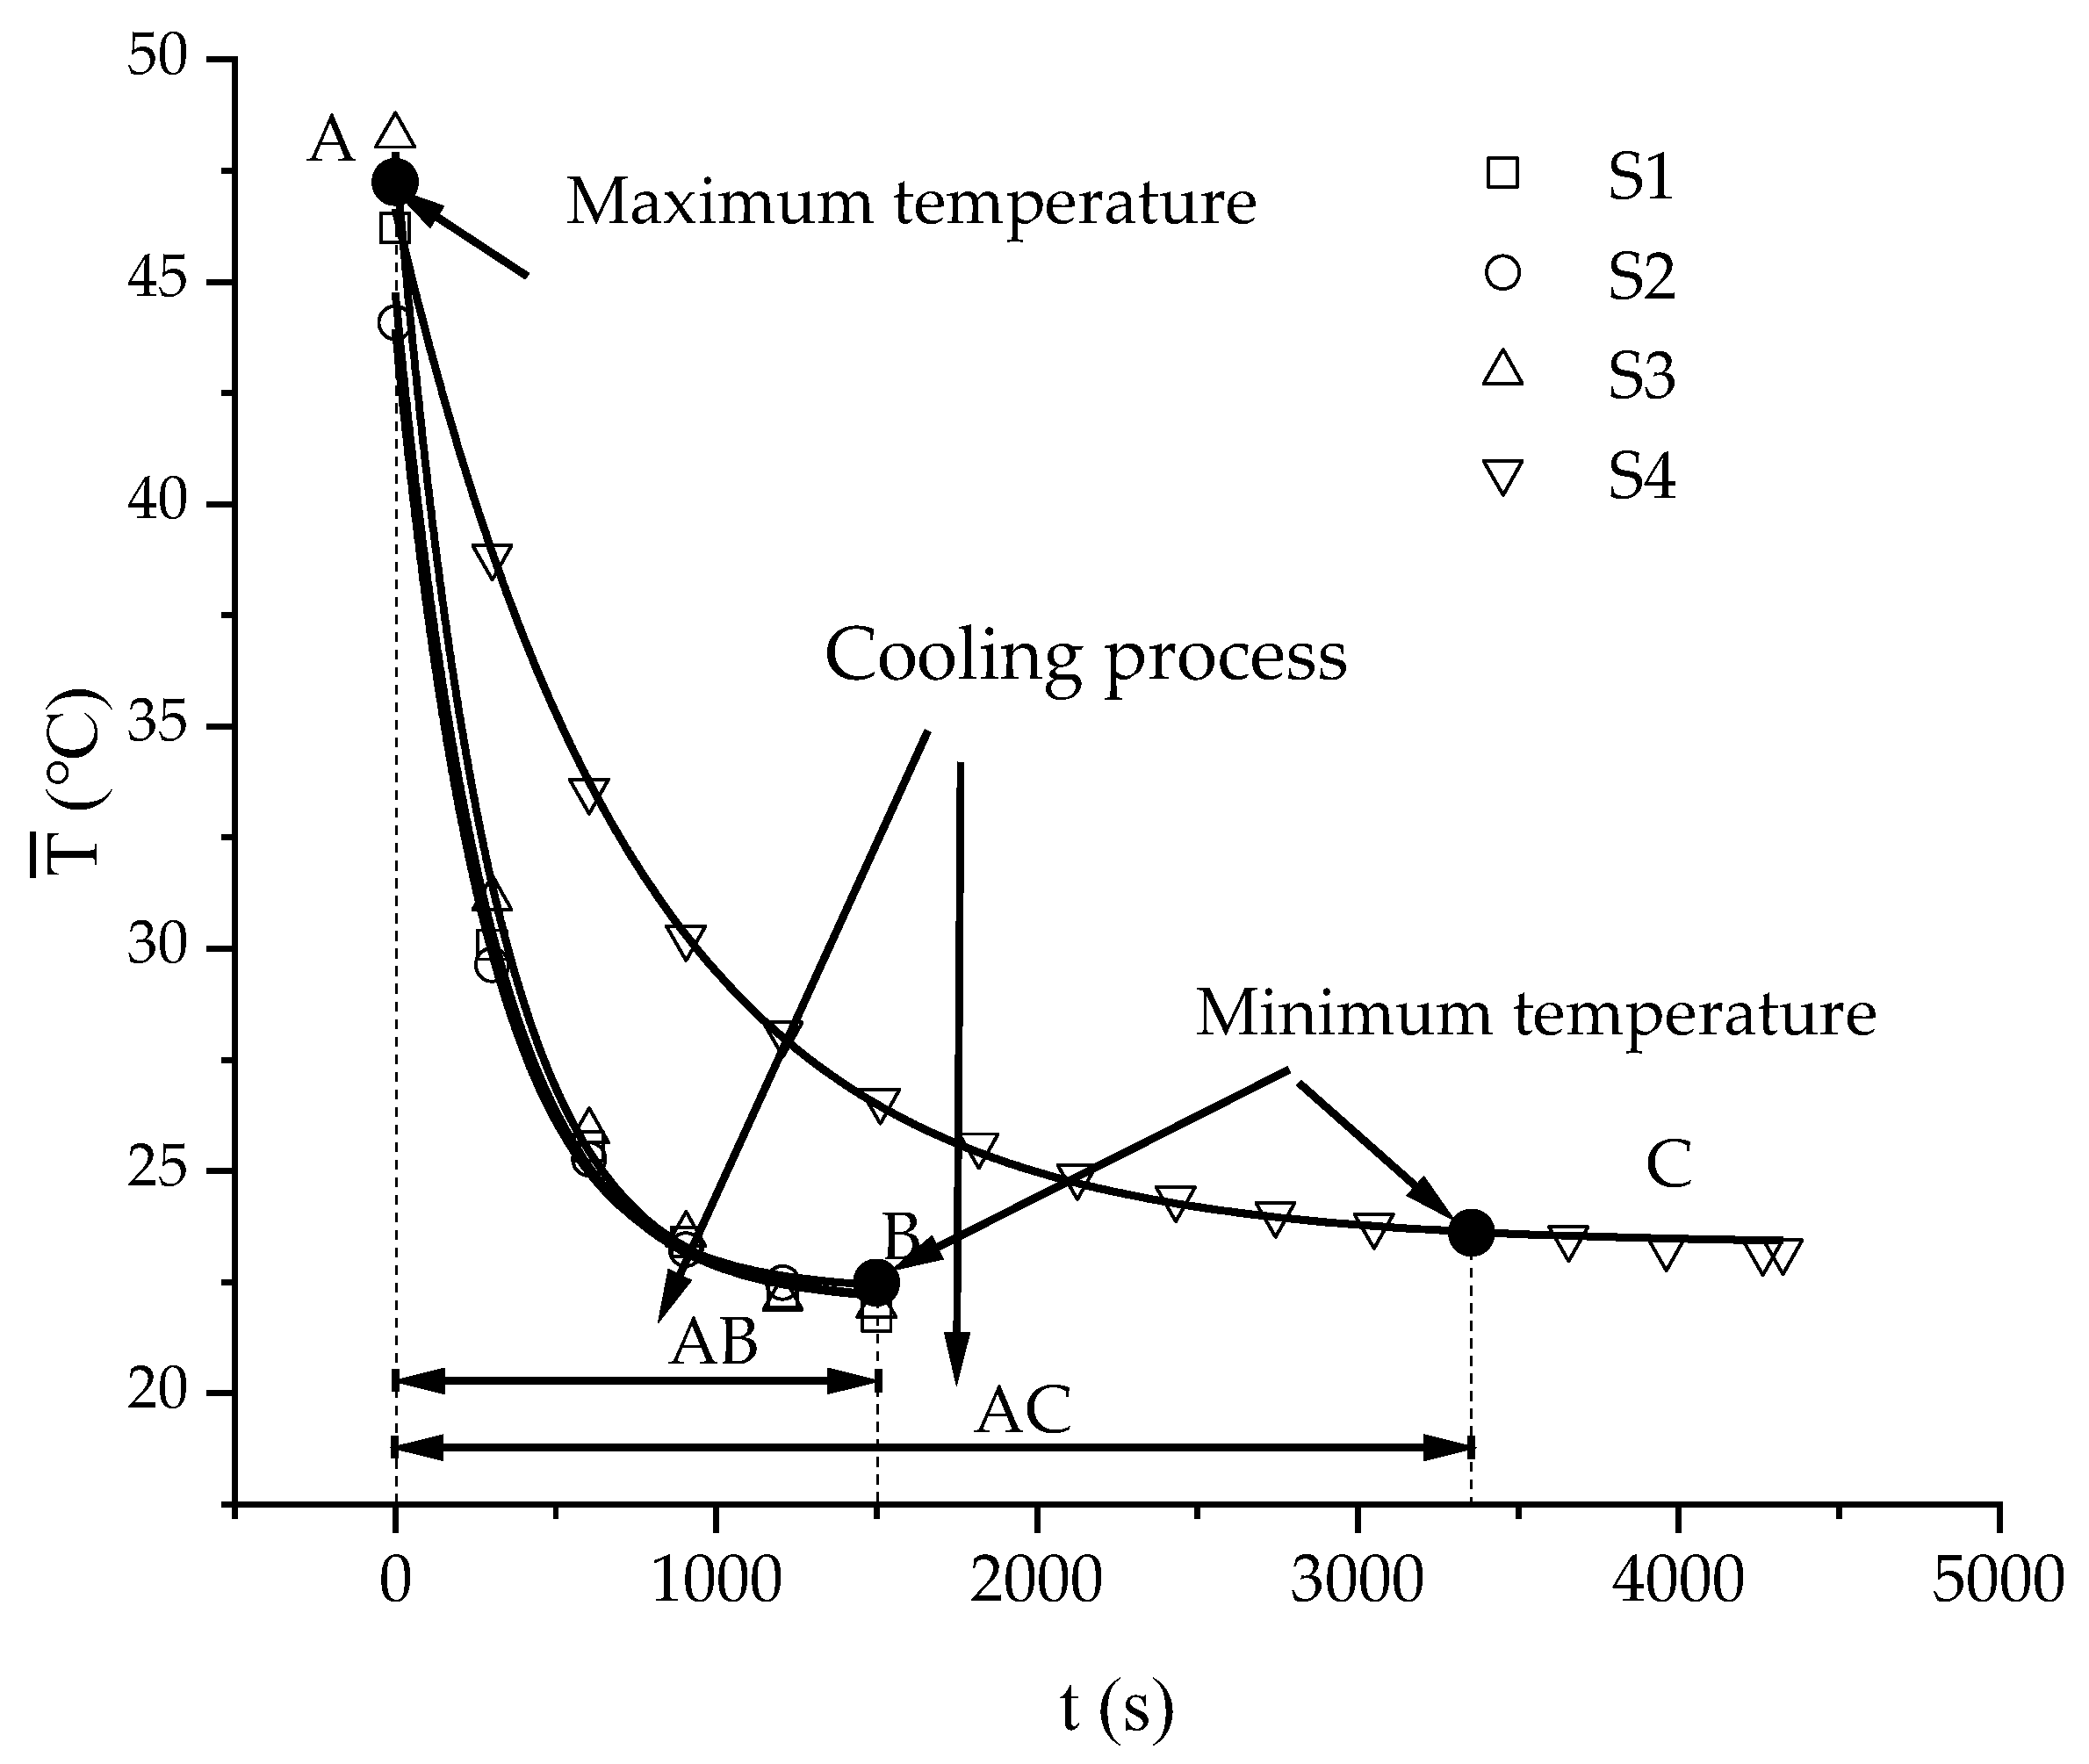
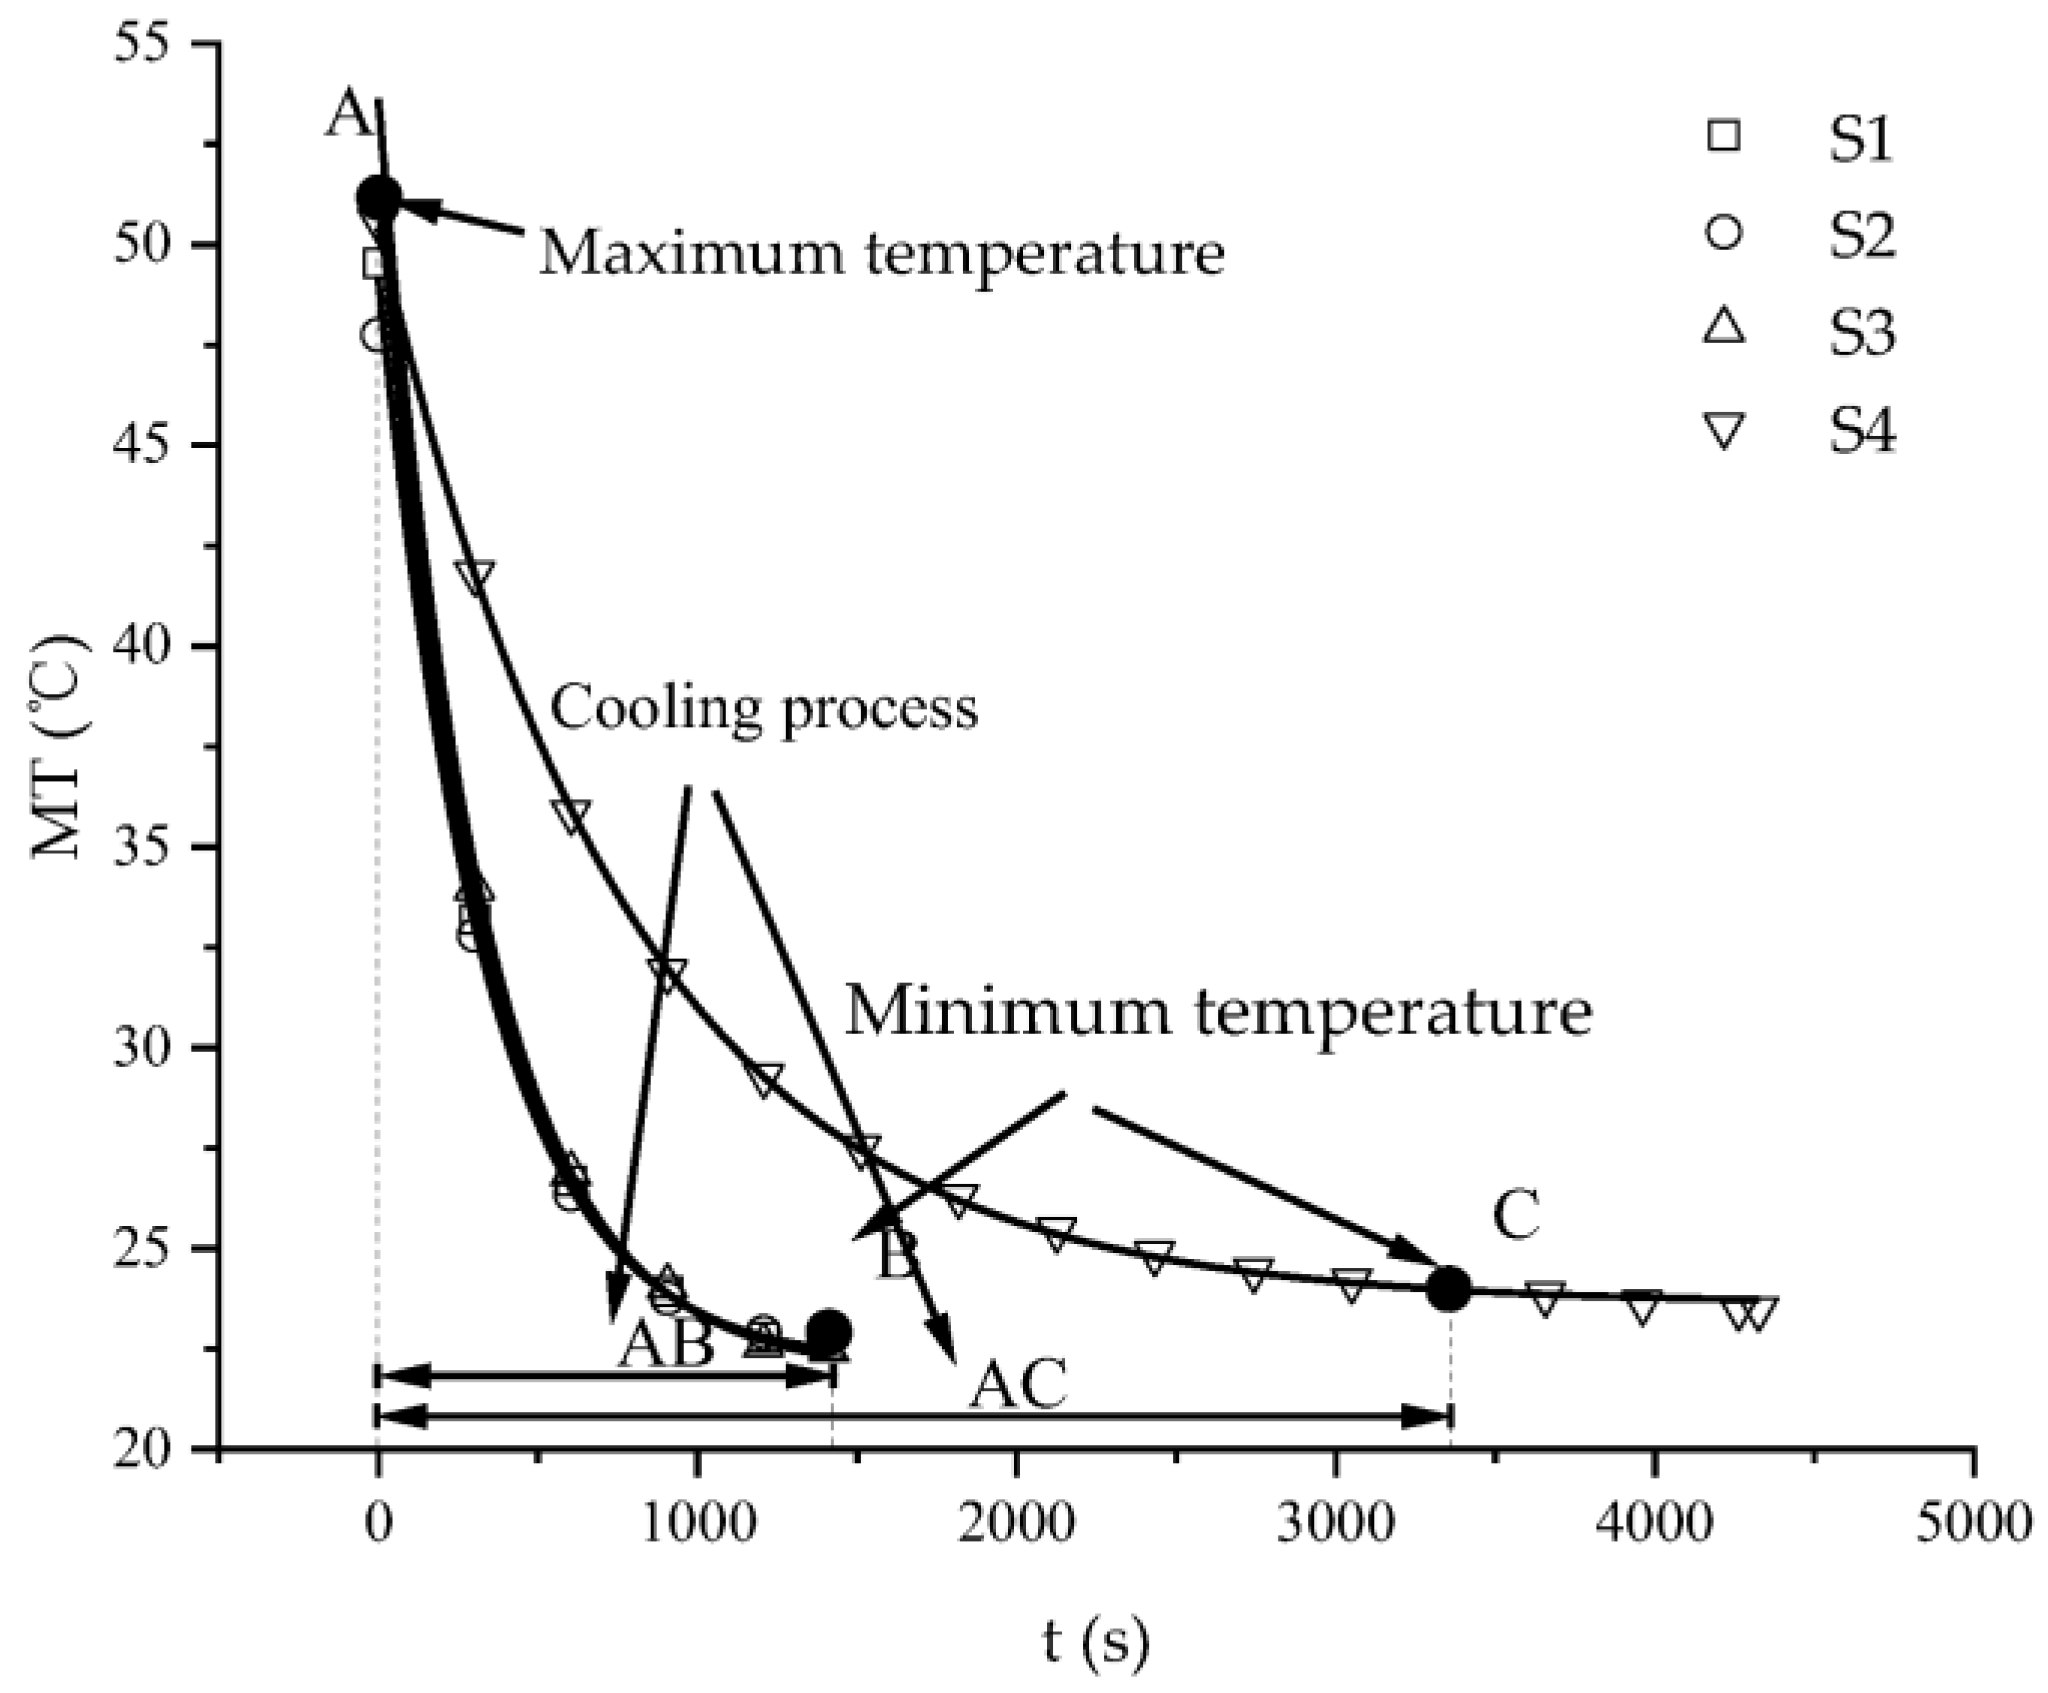
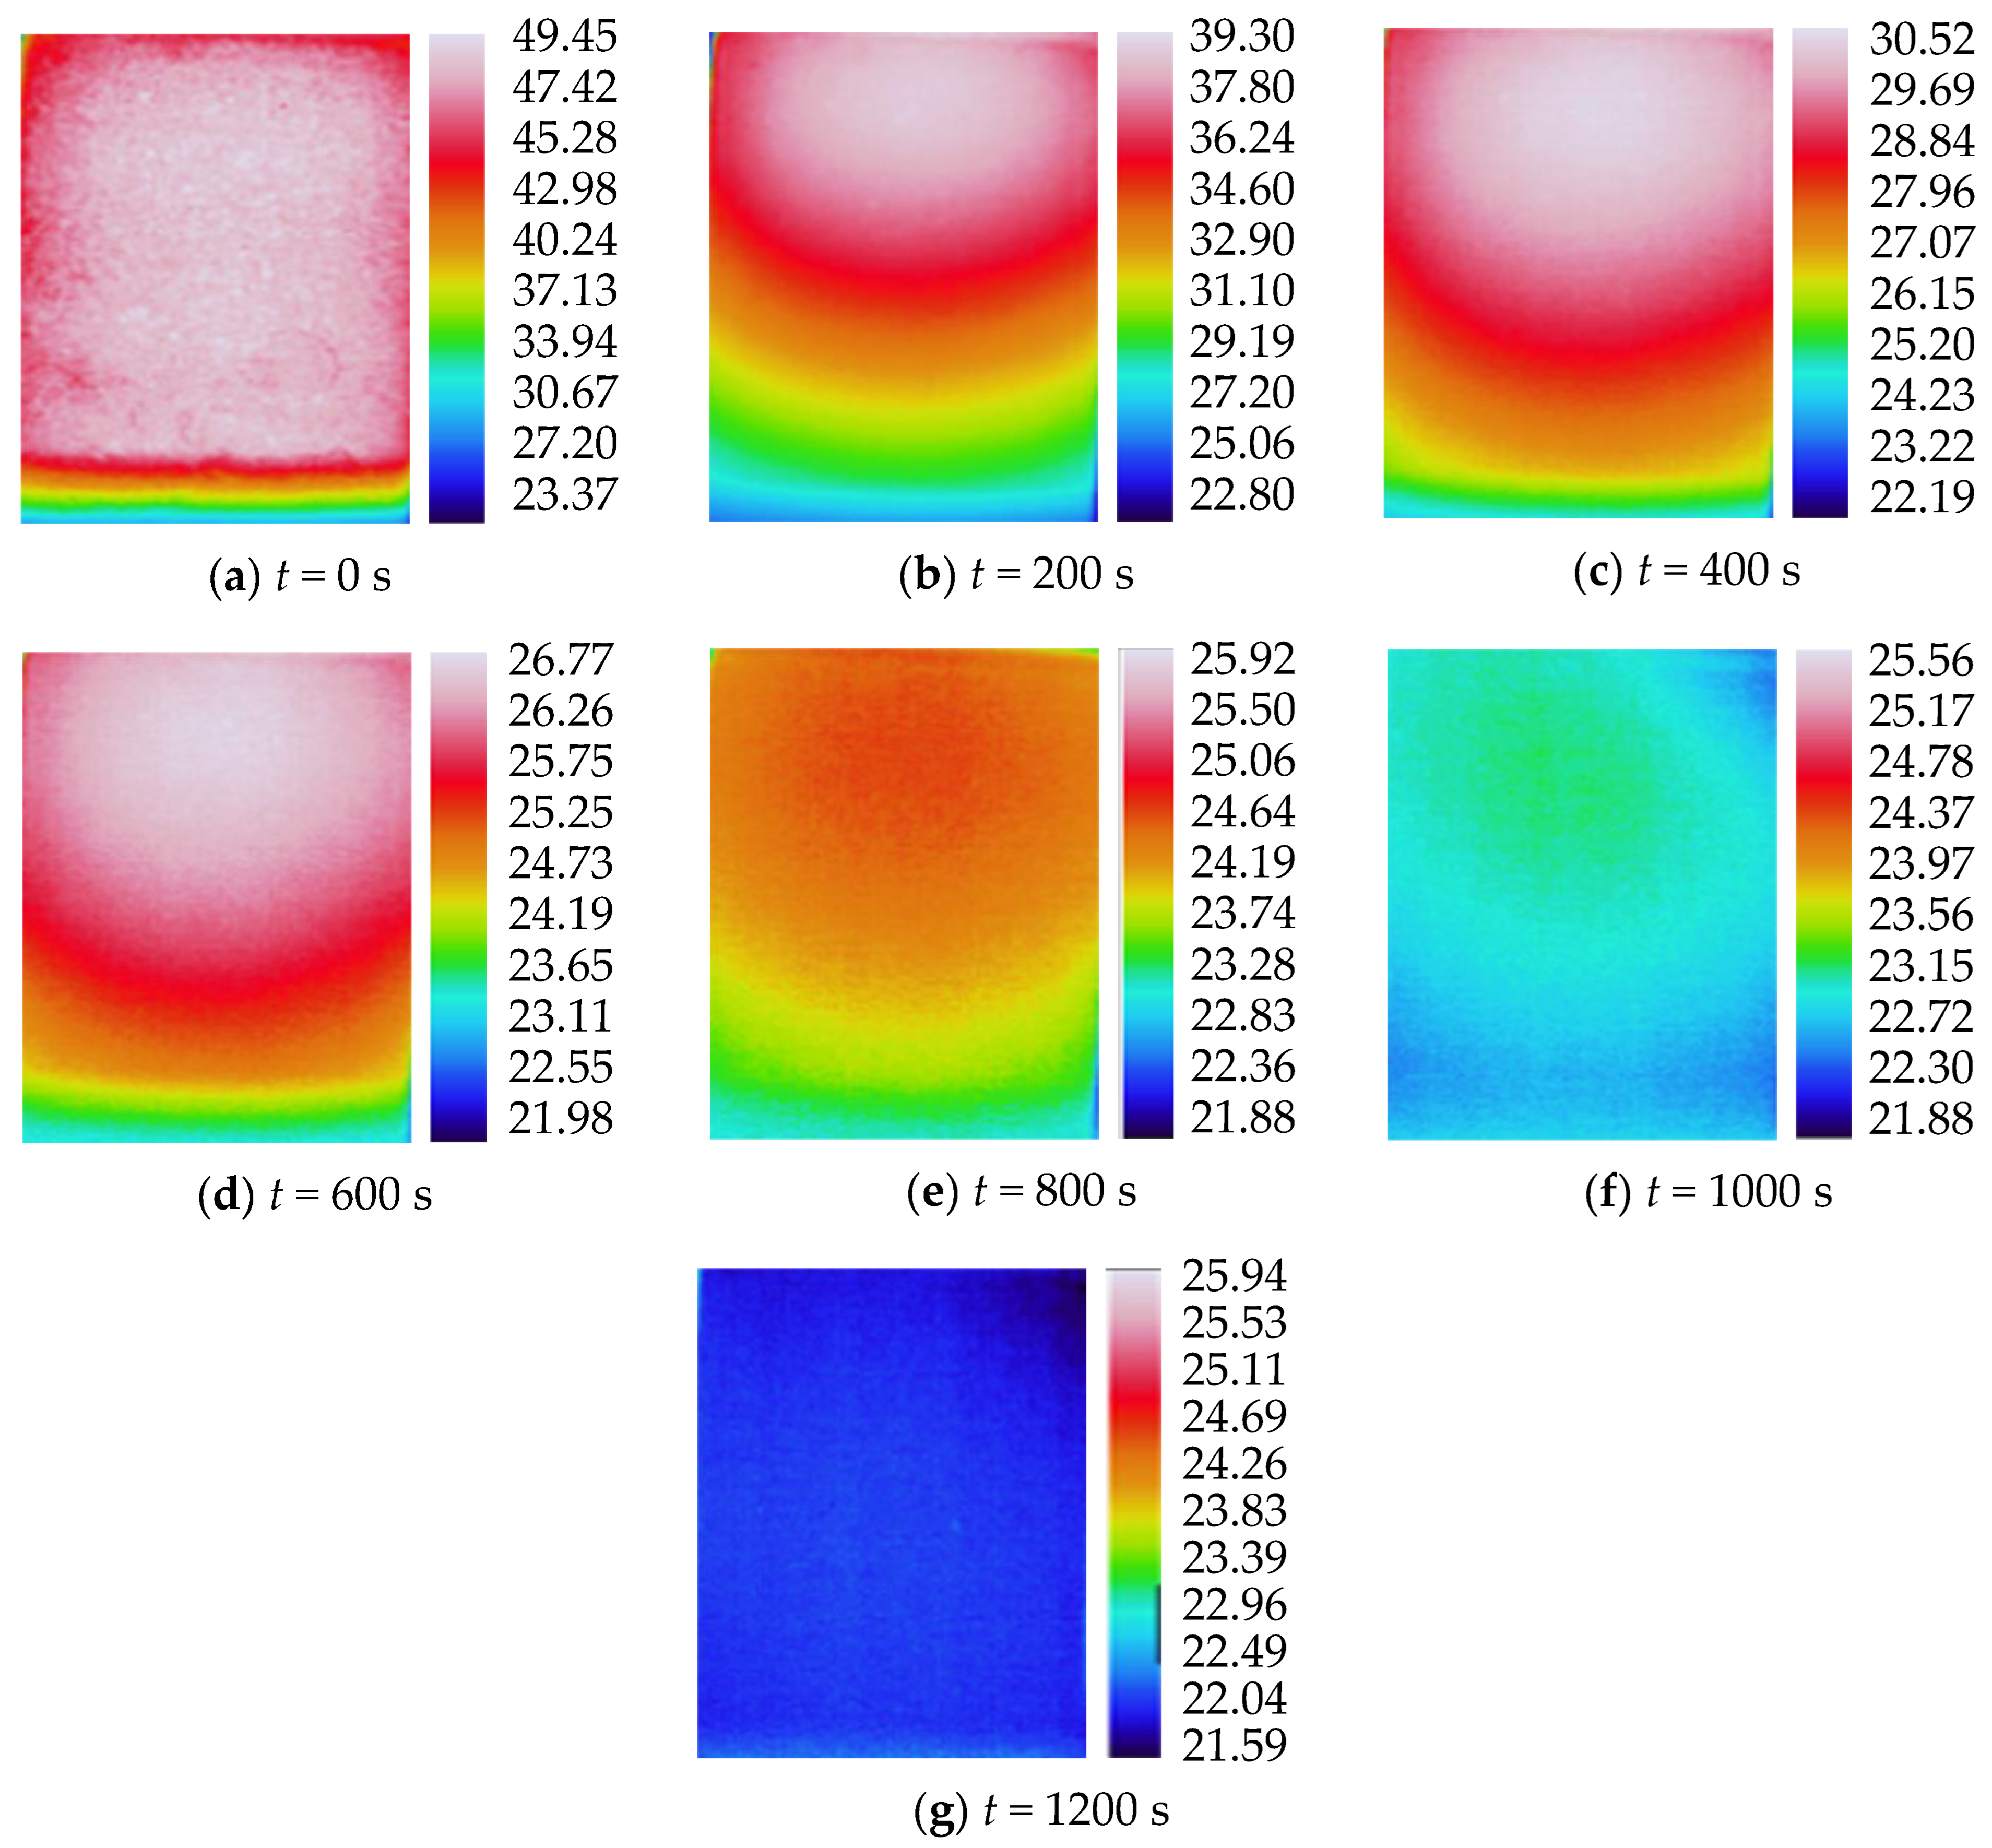
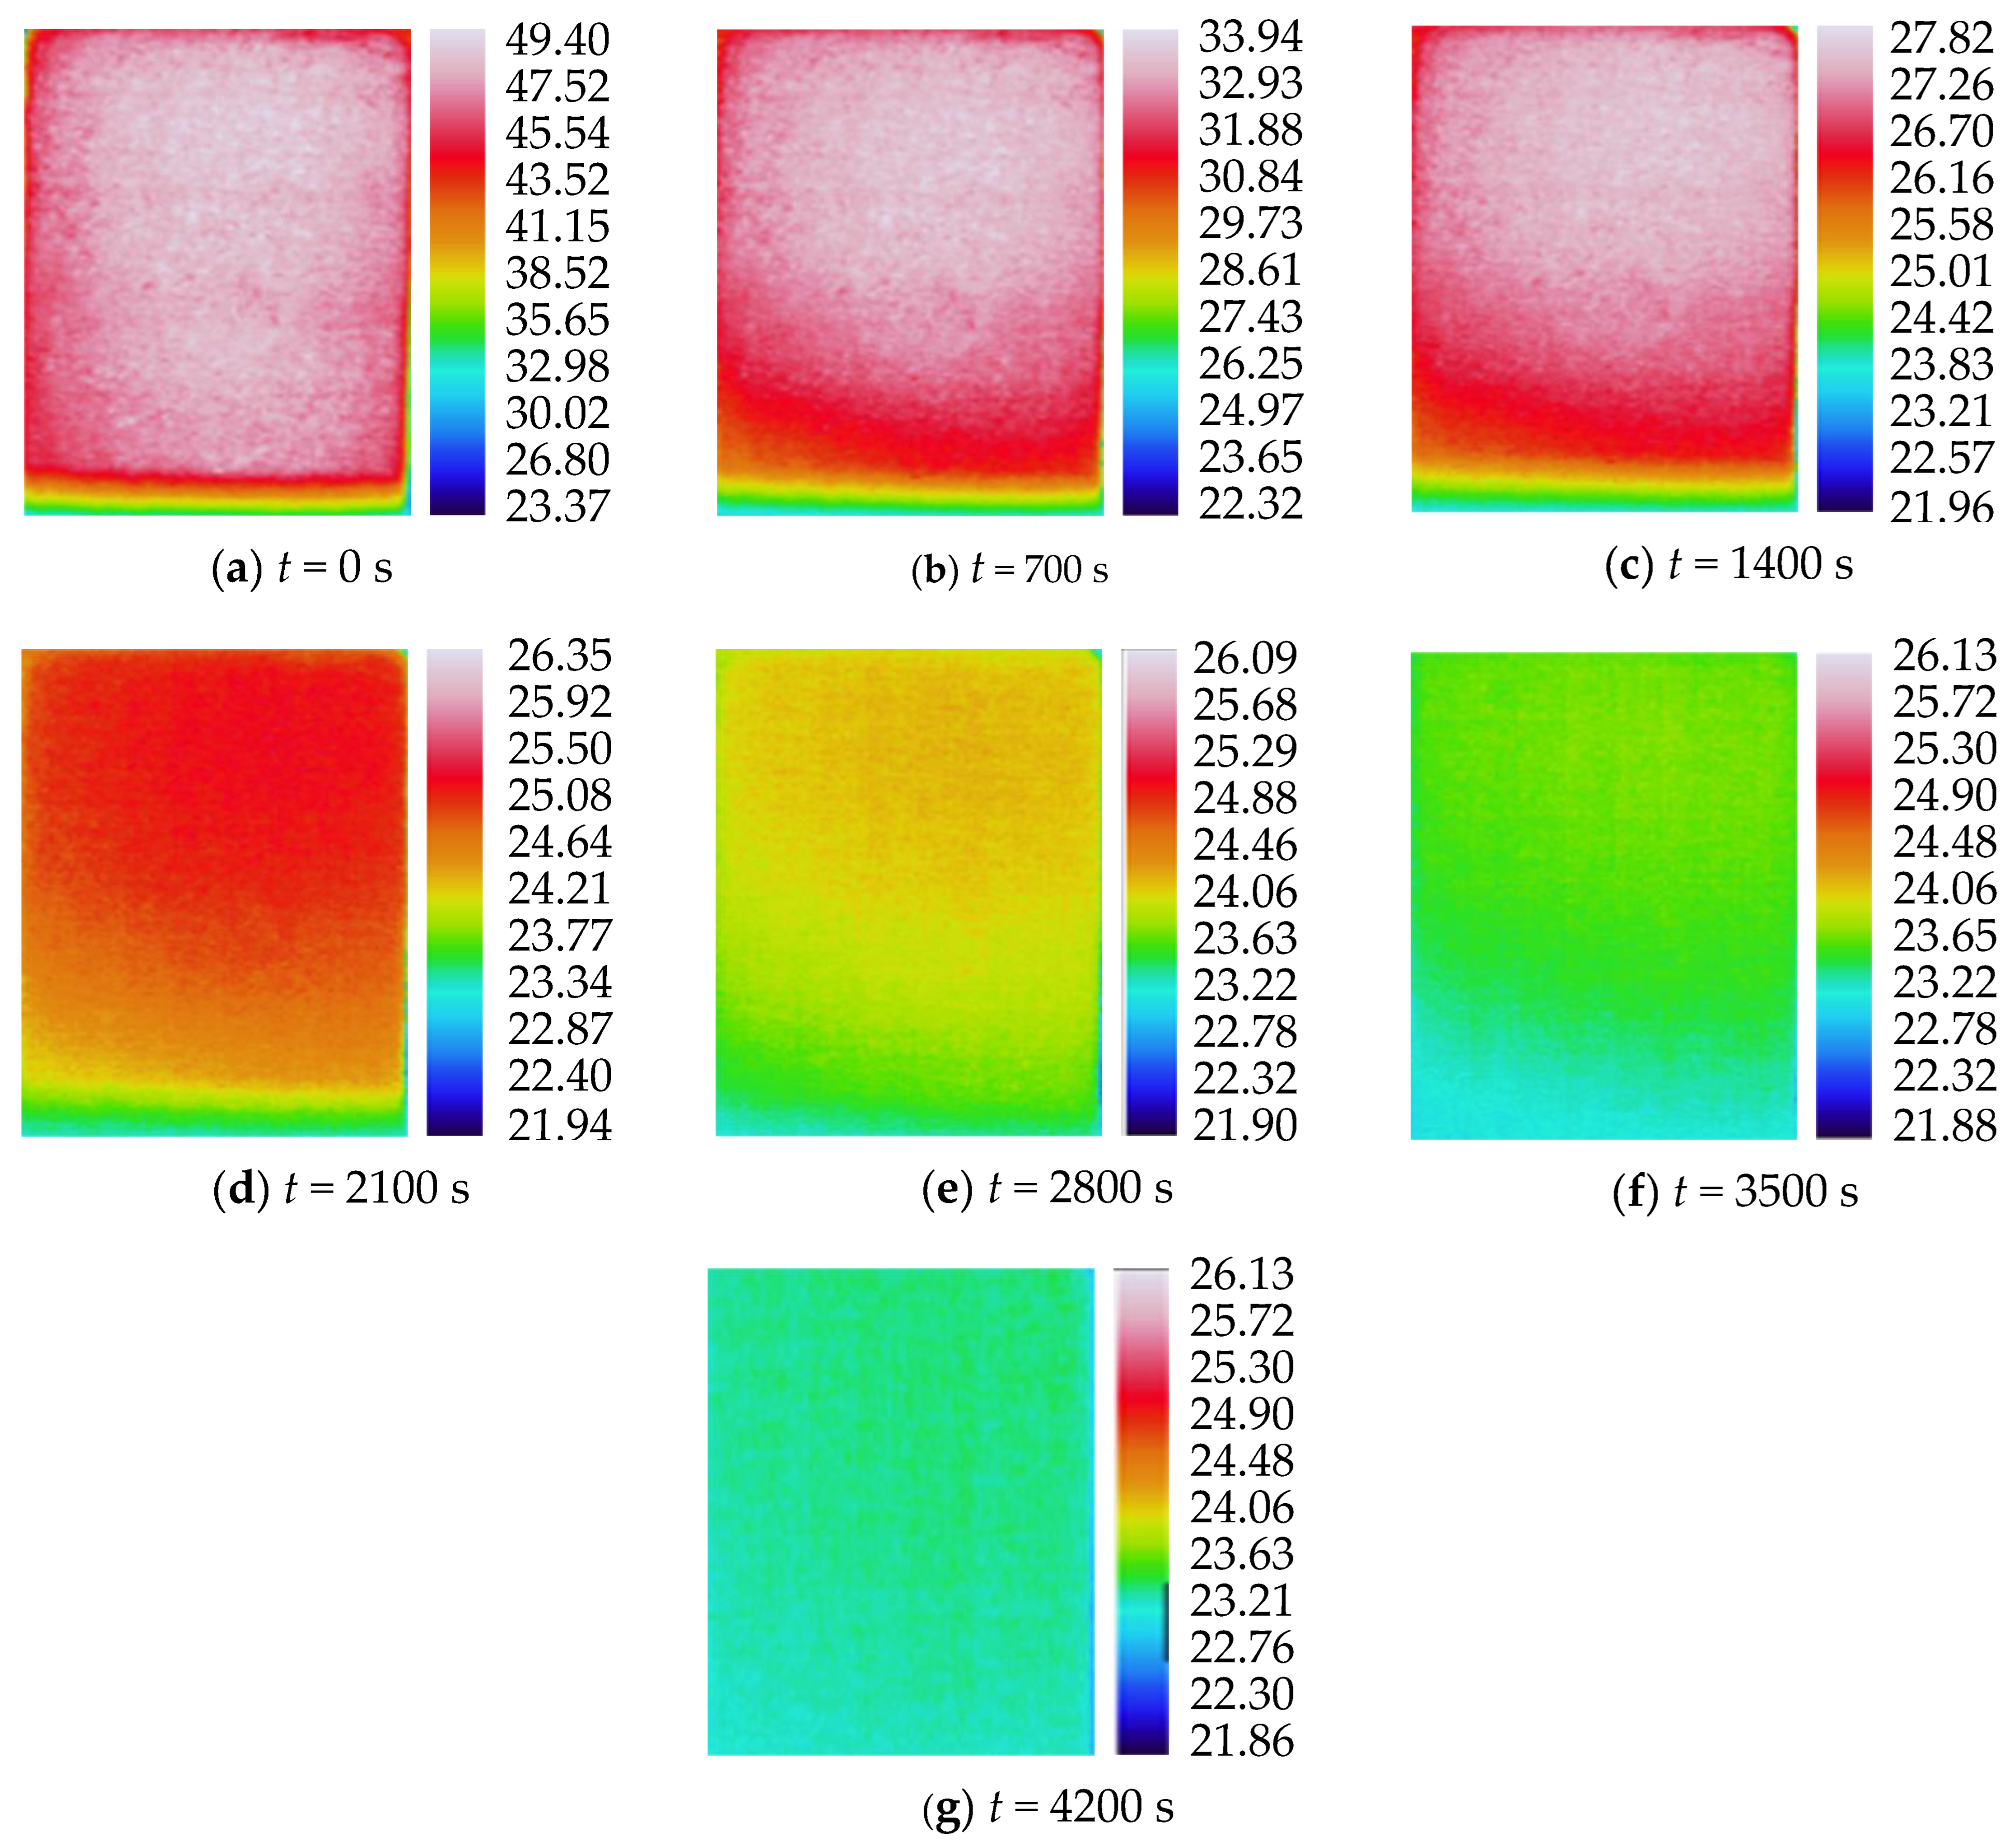
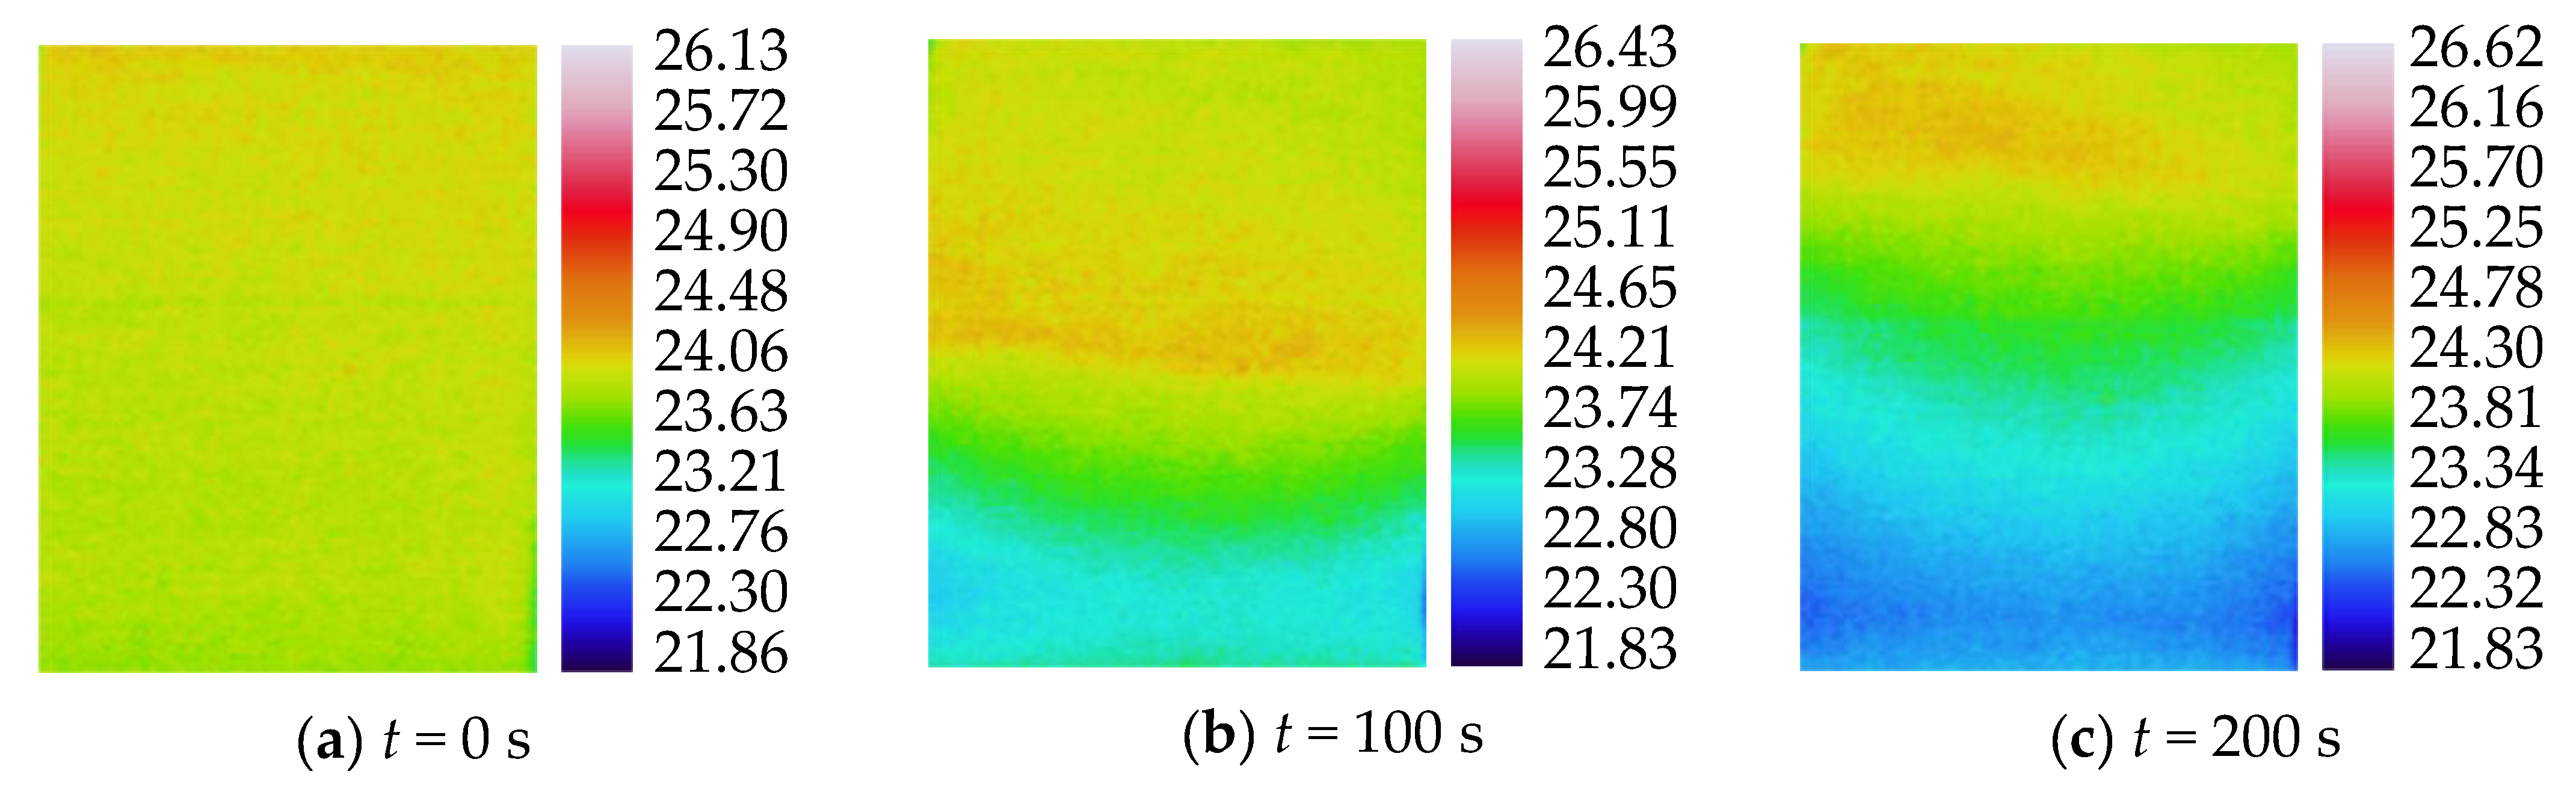
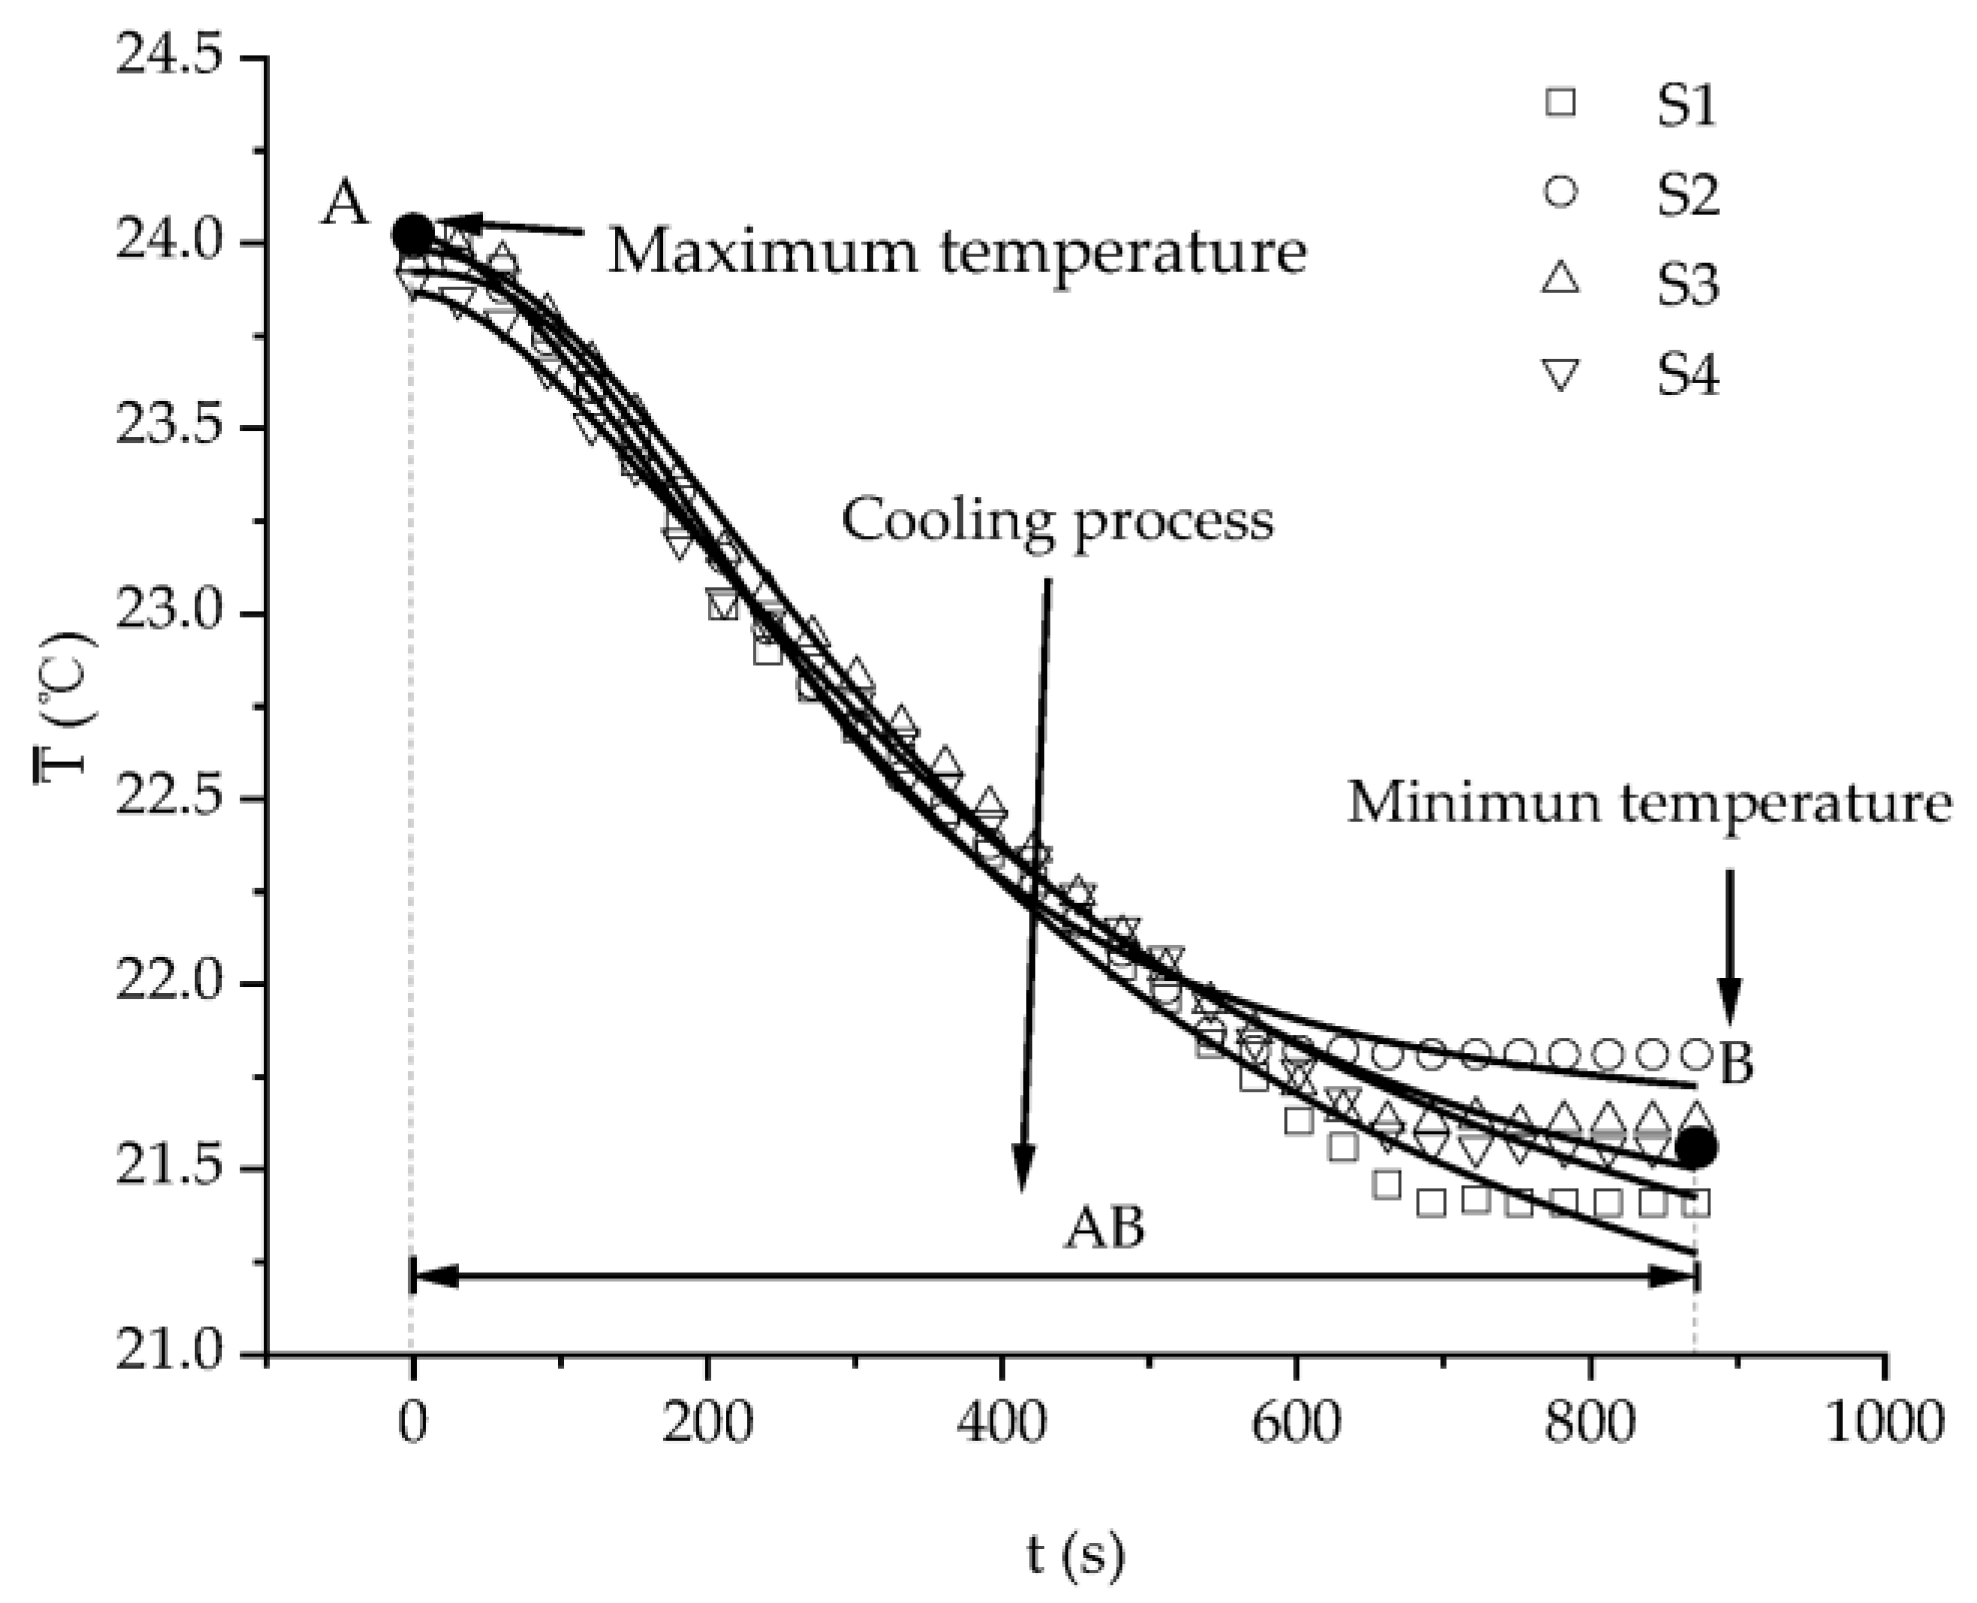
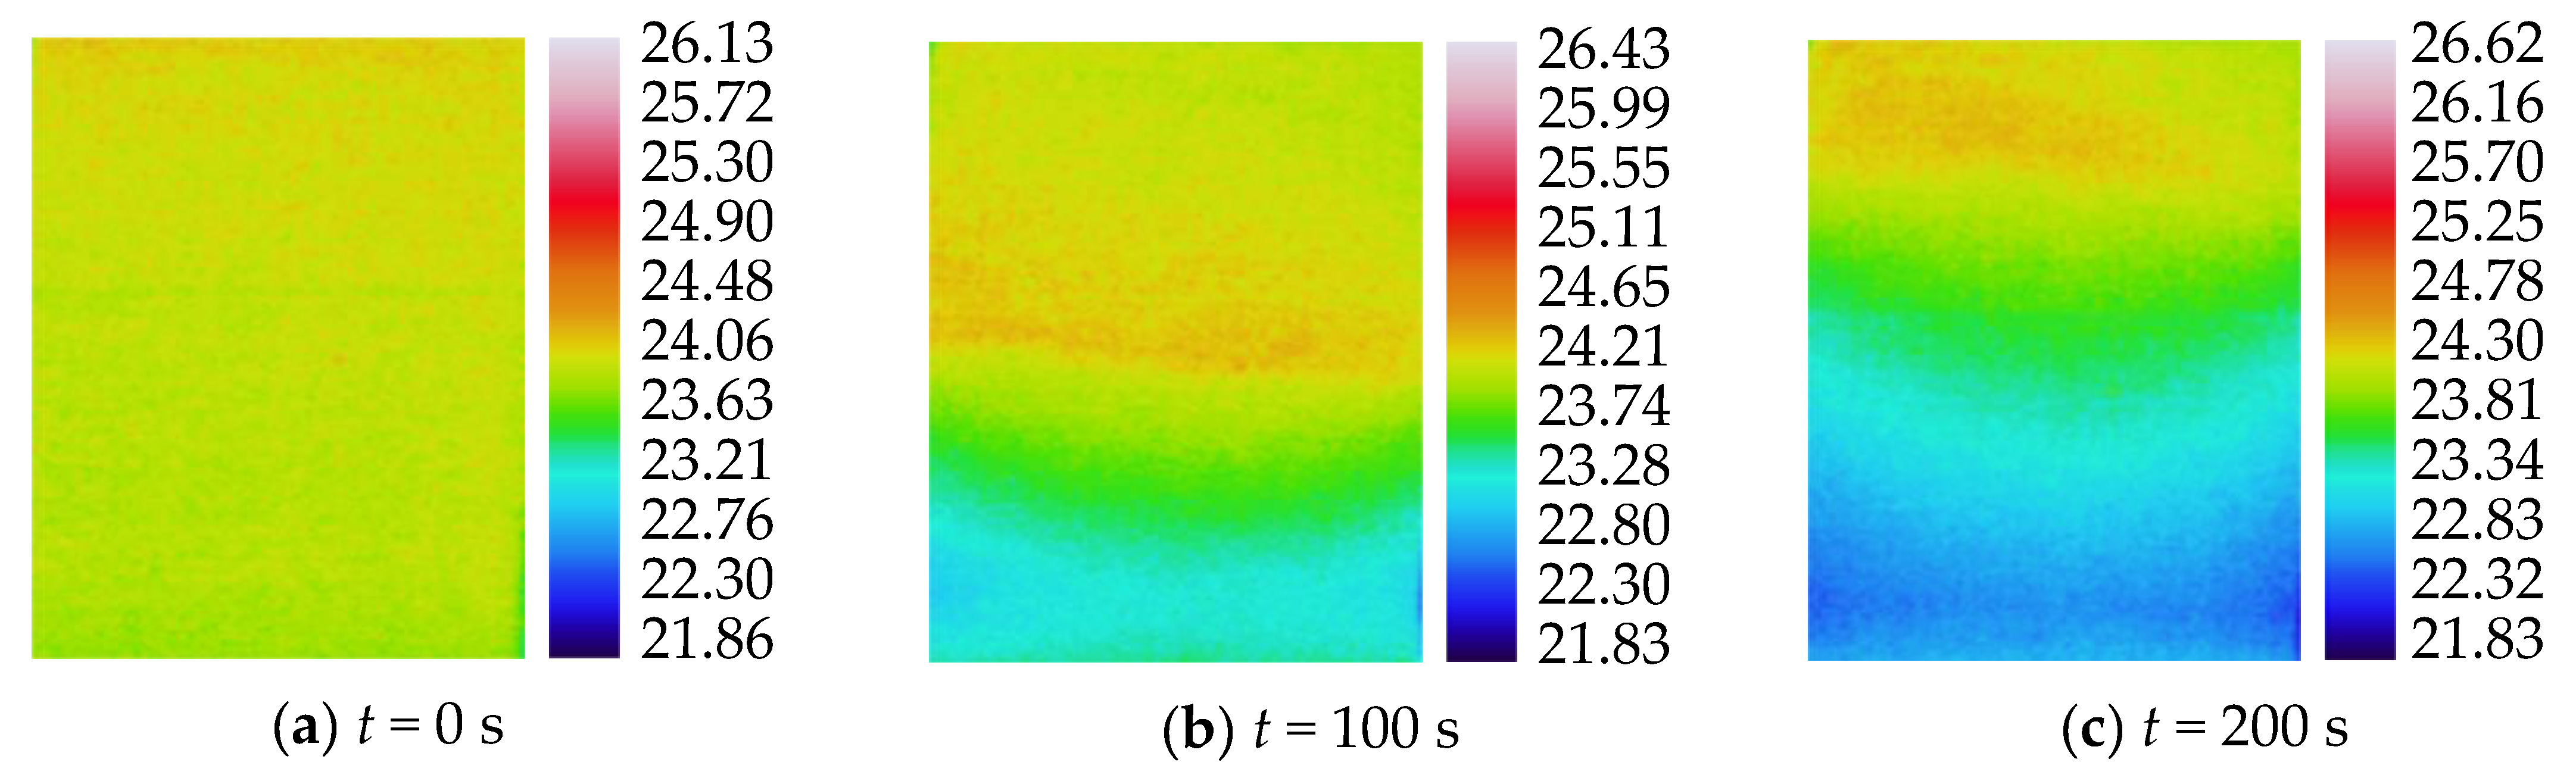
3.2. Characteristics of Temperature Variation during Hydration Absorption of Sandstone Samples

(1)
Surface temperature change during hydration absorption of samples at 105 °C
The infrared thermal imager was used to monitor the temperature change of the surface of the rock samples in the process of hydration absorption in real time, and the infrared image obtained was derived. The average and maximum temperature data measured and derived by the infrared instrument during the hydration absorption of sandstone samples were analyzed, and the temperature curve was drawn using Origin software. The curve of the average surface temperature change of the rock samples at different times is shown in Figure 9 and Figure 10. The exponential function shown in Equation (3) was used to fit the average temperature data points, and the parameters of the fitting curve are shown in Table 8. The maximum temperature change curve is shown in Figure 9. The exponential function shown in Equation (3) was used to fit the maximum temperature data points, and the parameters of the fitting curve are shown in Table 9.
T ( t ) = a · e x p ( t / b ) +   t 0
where a, b, and t0 are parameters, T(t) is the temperature of the sandstone at time t (°C), T   ¯ and MT are the average temperature and maximum temperature, respectively, and t is the hydration absorption time (s).
The change curves of the mean temperature and maximum temperature of the rock samples are shown in Figure 9. It can be seen from the comparison curves that the mean temperature of each water-absorbing rock sample with an initial temperature of 105 °C was consistent with the change in the maximum temperature, which shows that the temperature change curves of the three water-absorbing rock samples essentially coincide, so the three water-absorbing rock samples had roughly the same properties in terms of temperature change characteristics. In addition, the comparison between the water-absorbing rock samples and the non-water-absorbing rock sample S4 shows that the temperature reduction rate of the non-water-absorbing rock sample S4 was significantly lower than that of the water-absorbing rock samples, which shows that the change curve slope of the non-water-absorbing rock sample was small and the change was gentler, and that the experience time was much longer than that of the water-absorbing rock samples, where t and m represent the absorption time and quality, respectively.
The surface infrared images of S1 with an initial temperature of 105 °C at different times are shown in Figure 11. With the increase in the hydration absorption time, the surface temperature of the sample presents non-uniform changes. As the sample starts to absorb water from the bottom, the wetting peak gradually rises from the bottom to the top, and from the time of t = 0 s to t = 800 s it can be seen that the high-temperature area gradually decreases while the low-temperature area gradually increases. And the temperate zone presents a concave arc until the final sample’s surface temperature becomes uniform and close to the water temperature.
The surface infrared images of S2 with an initial temperature of 105 °C at different times are shown in Figure 12, and the change process of the infrared radiation images of S1 and S2 is essentially the same.
The surface infrared images of S3 with an initial temperature of 105 °C at different times are shown in Figure 13, and the change process of the infrared radiation images of S1, S2, and S3 is essentially the same.
The surface infrared images of S4 with an initial temperature of 105 °C at different times are shown in Figure 14. With the increase in the hydration absorption time, the surface temperature of the sample shows a non-uniform change. As the sample begins to absorb water from the bottom surface, the wetting peak gradually rises from the bottom surface to the top surface. From t = 0 s to t = 3000 s, it can be seen that the high-temperature area gradually decreases, the low-temperature area gradually increases, and the isothermal zone is roughly horizontal until the surface temperature of the sample becomes uniform and close to the water temperature.
(2)
Surface temperature changes during hydration absorption of samples at 65 °C
The curve of the average surface temperature change of rock samples at different times is shown in Figure 15. The exponential function shown in Equation (2) was used to fit the average temperature data points, and the parameters of the fitting curve are shown in Table 10. The maximum temperature change curve is shown in Figure 16. The exponential function shown in Equation (2) was used to fit the maximum temperature data points, and the parameters of the fitting curve are shown in Table 11.
The curves of the mean temperature and maximum temperature are essentially the same as those at 105 °C. The difference is that it takes less time for the samples to be cooled to 25 °C.
The surface infrared images of S1 with an initial temperature of 65 °C at different times are shown in Figure 17. From the time of t = 0 s to the time of t = 800 s, the changes in the infrared images are essentially the same as those at 105 °C. The difference is that from the time of t = 1000 s to the time of t = 1200 s, the temperature is slightly lower than the temperature of the 105 °C rock samples in the same period.
The surface infrared images of S2 with an initial temperature of 65 °C at different times are shown in Figure 18, and the change process of the infrared radiation images of S1 and S2 is essentially the same.
The surface infrared images of S3 with an initial temperature of 65 °C at different times are shown in Figure 19, and the change process of the infrared radiation images of S1, S2, and S3 is essentially the same.
The surface infrared images of S4 with an initial temperature of 65 °C at different times are shown in Figure 20. With the increase in the hydration absorption time, the surface temperature of the sample shows a non-uniform change. As the sample begins to absorb water from the bottom surface, the wetting peak gradually rises from the bottom surface to the top surface. From t = 0 s to t = 2100 s, it can be seen that the high-temperature area gradually decreases, the low-temperature area gradually increases, and the isothermal zone is roughly horizontal until the surface temperature of the sample becomes uniform and close to the water temperature.
(3)
Surface temperature change during hydration absorption of samples at 25 °C
The average temperature change curves of the surface of rock samples at different times are shown in Figure 21, the average temperature data points were fitted with the functions shown in Equation (4), and the parameters of the fitting curve are shown in Table 12. The maximum temperature change curve is shown in Figure 22, the maximum temperature data points were fitted with the functions shown in Equation (4), and the parameters of the fitting curve are shown in Table 13.
T ( t ) = a b 1   + ( t / t 0 ) c + b
where a, b, and t0 are parameters, T(t) is the average/maximum temperature (°C) of the sandstone at time t, and t is the hydration absorption time (s).
The average temperature change curve of the rock samples shows that the average temperature change of the water-absorbing rock samples is consistent with that of the non-water-absorbing rock samples. It can be seen that whether the rock samples are water-absorbing or not has essentially no influence on the average temperature change of the rock samples. However, although the trend of the maximum temperature curve of each rock sample is roughly the same, there are great differences. At the same time, it can be seen that the maximum temperature of the four rock samples first remained unchanged for a period of time, then continued to decrease, and finally remained unchanged.
The surface infrared images of S1 with an initial temperature of 25 °C at different times are shown in Figure 23. The change rule of the infrared images is the same as above, but the difference is that the high-temperature region decreases faster than the previous two. When t = 400 s, the high-temperature area of the rock samples almost dissipates, and the temperature of the rock samples is almost unchanged thereafter.
The surface infrared images of S2 with an initial temperature of 25 °C at different times are shown in Figure 24, and the change process of the infrared radiation images of S1 and S2 is essentially the same.
The surface infrared images of S3 with an initial temperature of 25 °C at different times are shown in Figure 25, and the change process of the infrared radiation images of S1 and S2 is essentially the same.
The surface infrared images of S4 with an initial temperature of 25 °C at different times are shown in Figure 26, and the change process of the infrared radiation images of S1, S2, and S3 is basically the same.
(4)
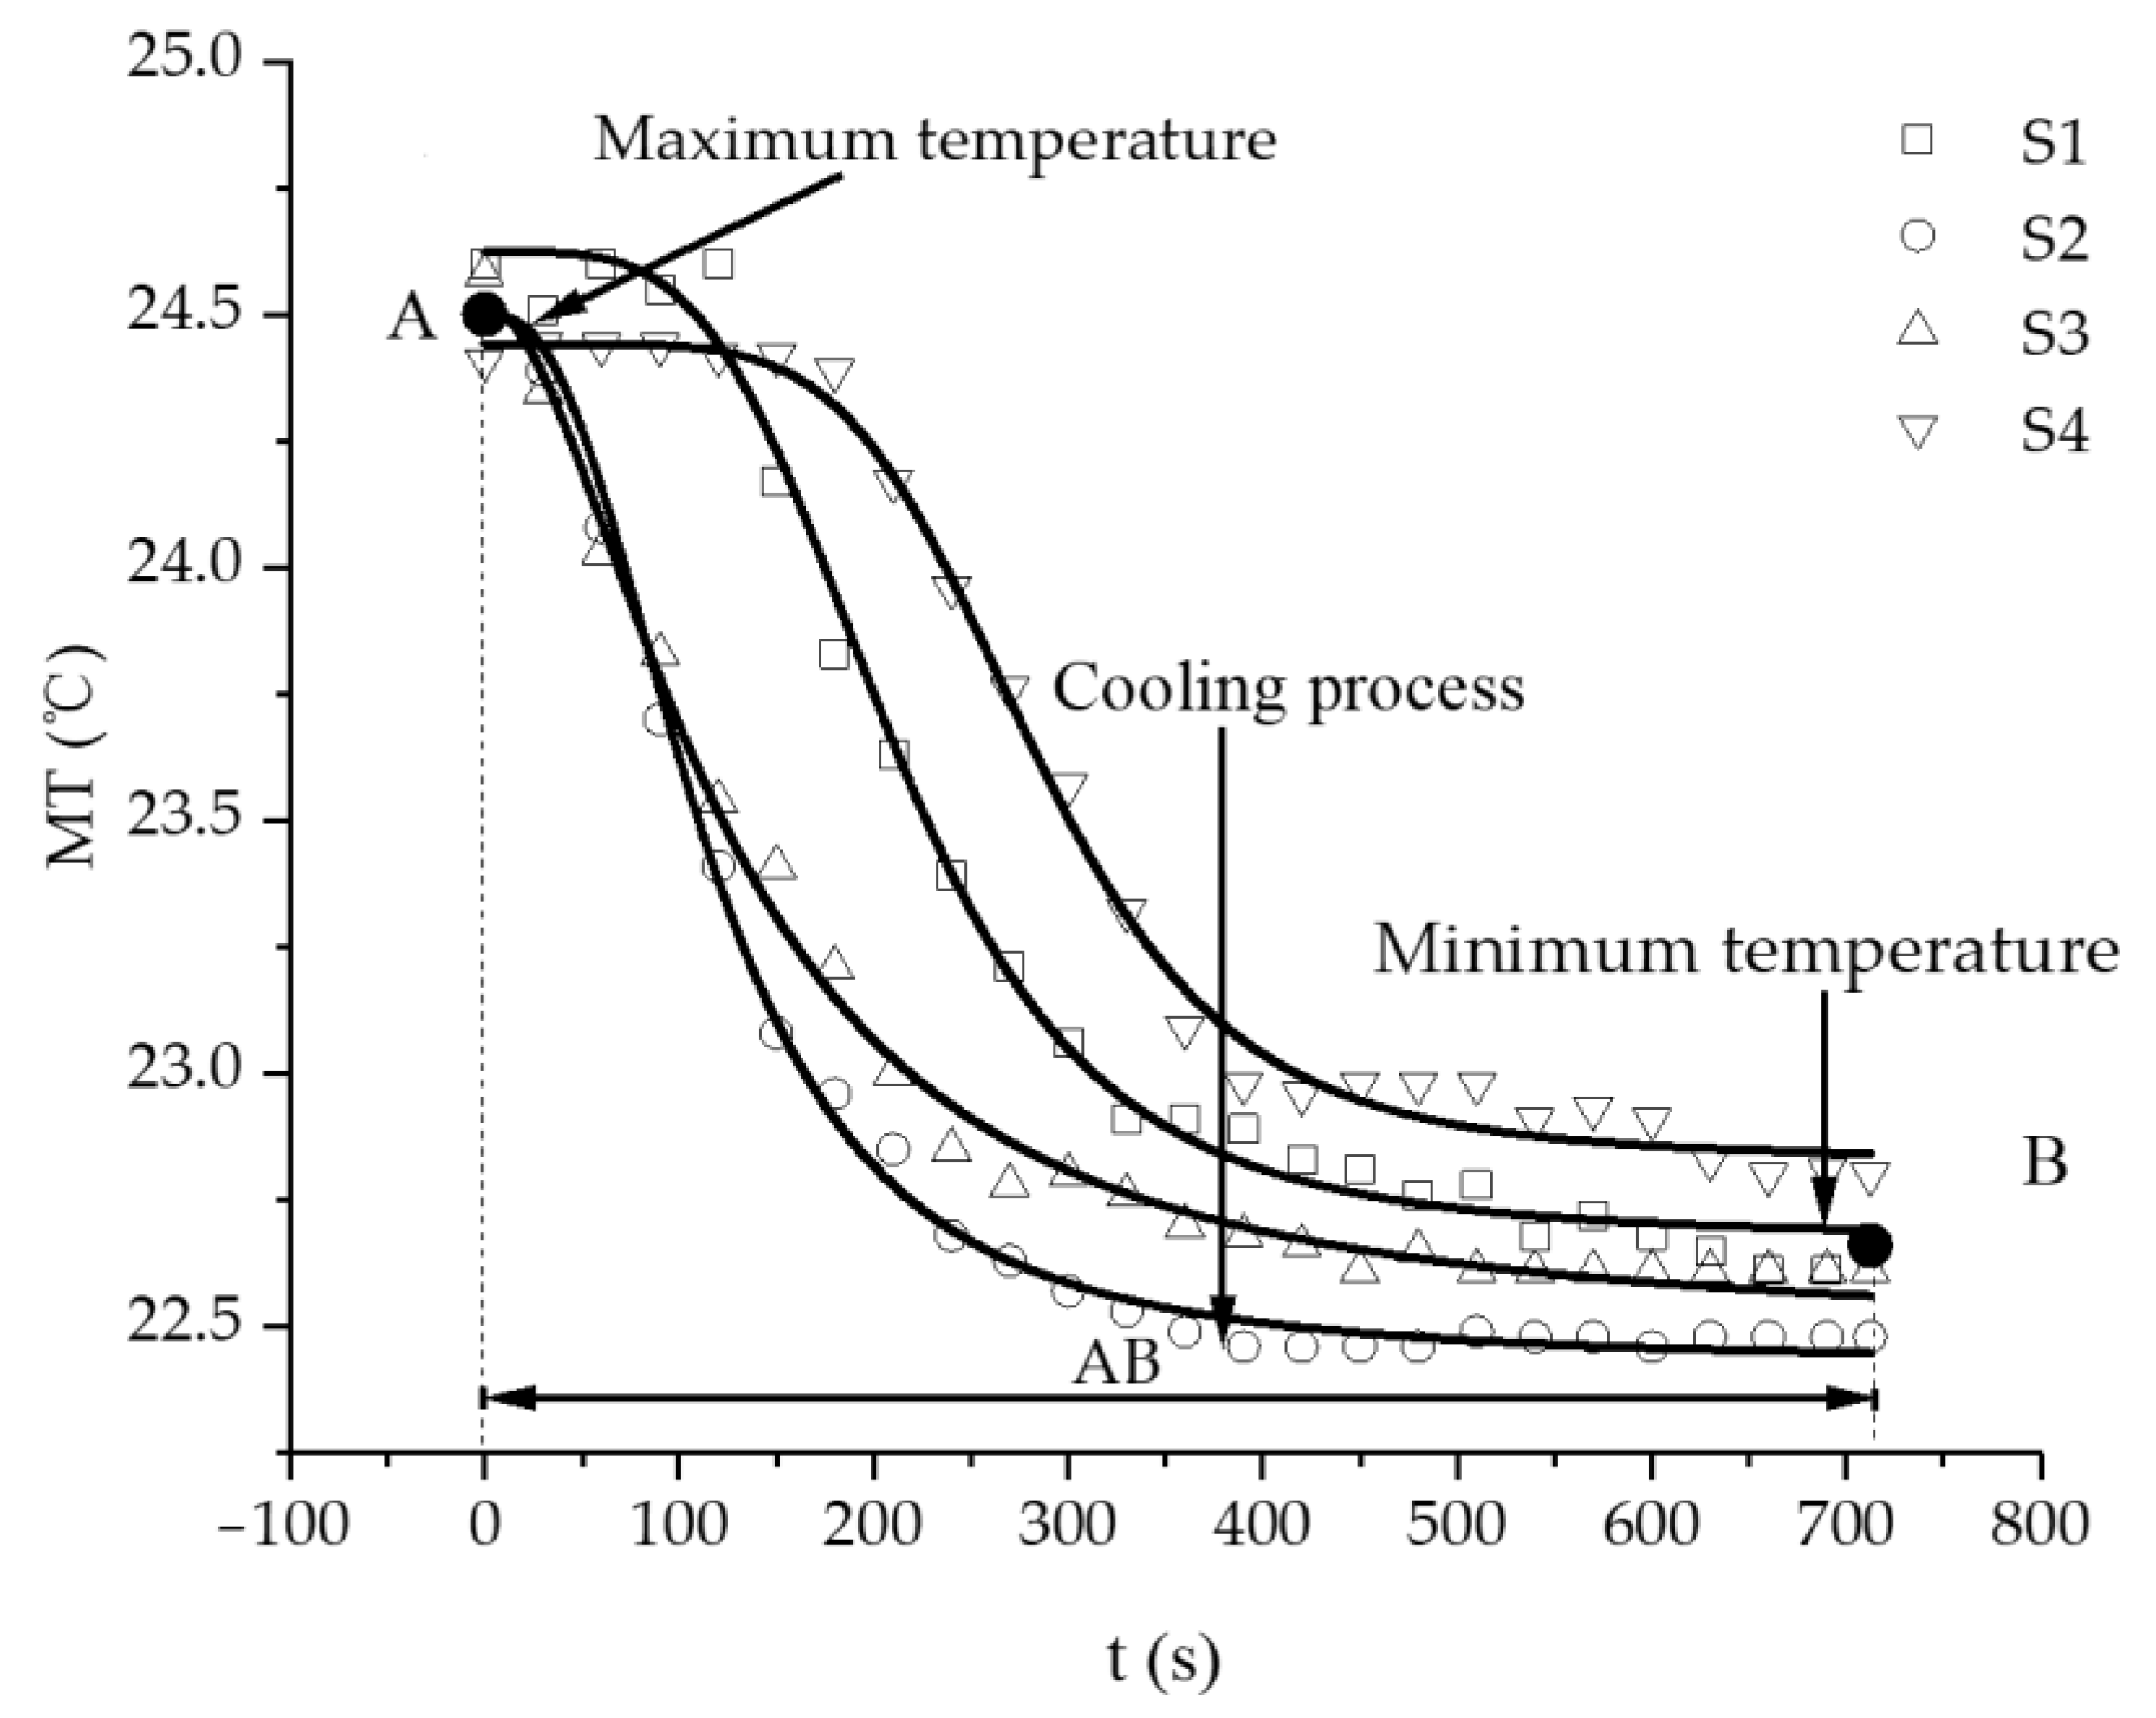
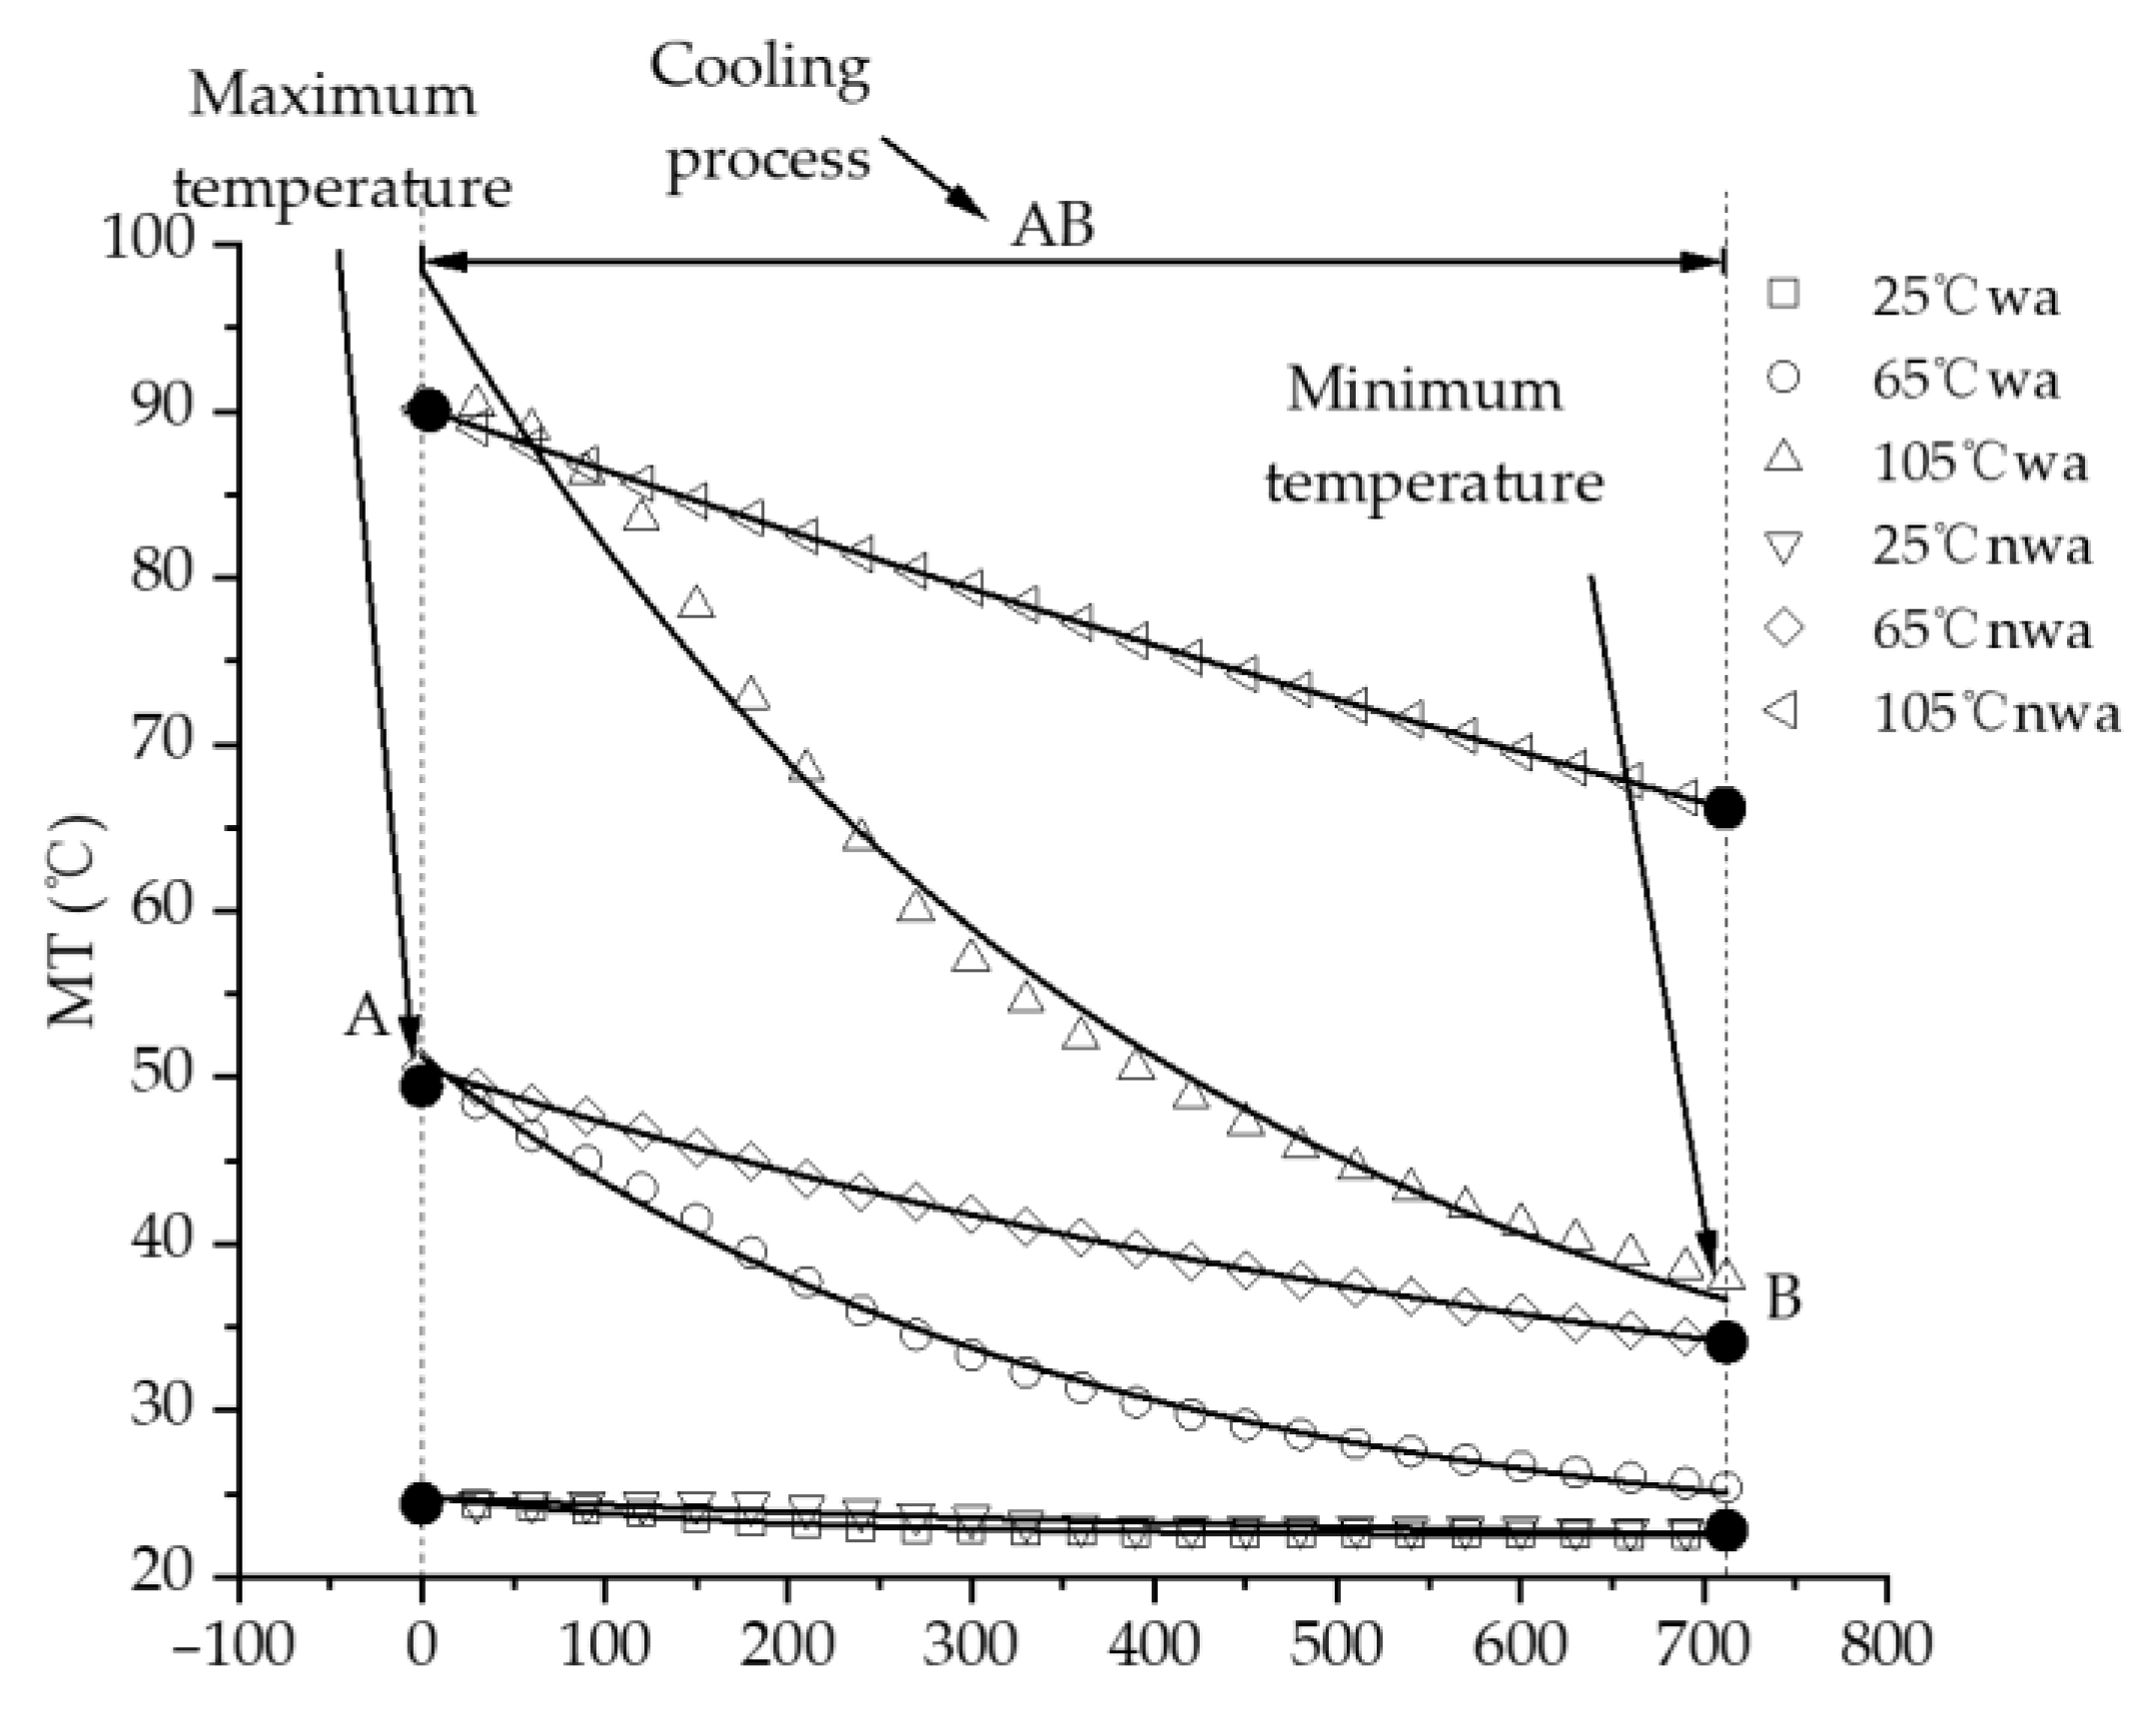
Average and maximum surface temperature of rock samples.
The average and maximum surface temperatures of the rock samples are shown in Figure 27 and Figure 28, respectively. The exponential function shown in Equation (3) was used to fit the maximum temperature data points, and the fitting curve parameter results are shown in Table 14 and Table 15. The derivative of Formula (3) was obtained as follows:
V   = d T ( t ) d t = a b e t b
This represents the rate of the temperature decrease. According to the data in the fitting parameter table, this value must be negative. As time t increases, the rate of temperature decrease gradually decreases. It can be seen from Figure 27 and Figure 28 that the variation trends of the mean temperature curve and the maximum temperature curve of the rock samples are essentially the same, where wa stands for hydration absorption and nwa stands for no hydration absorption. The hydration absorption of rock samples at 105 °C and 65 °C has a significant effect on the temperature reduction, while the hydration absorption of rock samples at 25 °C has little effect on the temperature reduction. The higher the initial temperature, the longer it takes for the sample to cool to room temperature.
Based on the current experimental results, some explanations for the quantitative and qualitative results are provided here, along with the hydration behavior results and statistical curves, but without analyzing the mechanisms. Because we currently lack more detailed microstructural results, micro-experimental tests, and water chemical reactions, the mechanisms and evolutionary process of hydration have not been captured, which will be the focus of our next research work.

4. Conclusions

The following conclusions were reached:
(1)
The intelligent test system of rock hydration independently developed in this study can provide different hydration absorption test environments and accurate real-time measurements. This test system can be used to study the behaviors of surrounding rock with obvious hydration (such as in the Dunhuang Mogao Grottoes) and provide a powerful research and development means and equipment guarantee for the evaluation of protection technology schemes.
(2)
In this study, the self-developed intelligent test system for rock hydration combined with an infrared thermal imager was used to conduct liquid water adsorption experiments on rock samples at different initial temperatures. The curve of the hydration absorption process could be fitted with an exponential function, and the change trend of the curve of the hydration absorption characteristics of the rocks first rapidly increased, then slowly increased, and finally remained unchanged.
(3)
According to the self-developed intelligent test system for rock hydration, the stage of rapid increase in the hydration absorption of rock samples is the stage when the wetting peak rises from the bottom surface to the top surface. The average time required for this stage for rock samples at 25 °C was 211 s, for rock samples at 65 °C it was 158 s, and for rock samples at 105 °C it was 96 s. As the initial temperature increases, the effect of hydration absorption on the sandstone’s temperature increases. The faster the hydration absorption rate of the samples before reaching saturation, the shorter the time it takes to reach saturation.
(4)
By using the self-developed intelligent rock hydrology test system and combining it with an infrared thermal imager, the mean temperature and maximum temperature of each rock sample in the Mogao Grottoes showed a nonlinear change trend when the temperature of the sandstone decreased; the higher the initial temperature, the greater the influence of hydration absorption on the temperature of the sandstone, and the longer the time required for the rock samples to cool to room temperature.
With the increase in the initial temperature of the rock, the time for the rapid-increase stage—that is, the time for the wetting peak to rise to the top of the samples—decreases continuously. However, the phase of slow increase in hydration absorption after the wetting front rises to the top does not show the same law, which is speculated to be related to the changes in the pores of the rock samples due to the rapid decrease in temperature after hydration absorption. Further experiments on the hydration absorption of rock at constant and different temperatures are needed for further research.

Author Contributions

N.H.: Conceptualization, Methodology, Resources. Y.W.: Conceptualization, Methodology, Resources, Writing—Review and Editing, Supervision, Project Administration, Funding Acquisition. H.C.: Methodology, Software, Formal Analysis, Investigation, Data Curation, Writing—Original Draft Preparation, Visualization. X.W. and Y.Z.: Formal Analysis, Investigation, Data Curation. All authors have read and agreed to the published version of the manuscript.

Funding

The authors gratefully acknowledge financial support from the State Key Laboratory for GeoMechanics and Deep Underground Engineering, China University of Mining and Technology (Beijing) (grant SKLGDUEK202209), the Fundamental Research Funds for the Central Universities, Ministry of Education of China (grants 2023ZKPYSB01 and 2023JCCXLJ04), the Innovation Training Program for College Students, China University of Mining and Technology (Beijing) (grants 202206005, 202206024, and 202306058), the Beijing Natural Science Foundation (grant L212016), and the China National Petroleum Corporation (CNPC) Innovation Fund (grant 2022DQ02-0204).

Data Availability Statement

Data are contained within the article.

Conflicts of Interest

The authors declare that they have no known competing financial interests or personal relationships that could have appeared to influence the work reported in this study.

References

  1. Wang, Y.; Wang, J.; Li, L. Dynamic propagation behaviors of hydraulic fracture networks considering hydro-mechanical coupling effects in tight oil and gas reservoirs: A multi-thread parallel computation method. Comput. Geotech. 2022, 152, 105016. [Google Scholar] [CrossRef]
  2. Wang, Y. Adaptive Analysis of Damage and Fracture in Rock with Multiphysical Fields Coupling; Springer Press: Berlin/Heidelberg, Germany, 2021. [Google Scholar]
  3. Hao, N.; Wang, Y.; Wu, X.; Duan, Y.; Li, P.; He, M. Real-time experimental monitoring for hydration absorption evolution behaviors of sandstone in Mogao Grottoes, China. Energies 2022, 15, 8504. [Google Scholar] [CrossRef]
  4. Meng, L.; Han, L.; Zhu, H.; Dong, W.; Li, W. Study on the influence of formation temperature on the water absorption and weathering of swelling rock in marine coal mines. KSCE J. Civ. Eng. 2021, 25, 4207–4220. [Google Scholar] [CrossRef]
  5. Tao, Z.; Xu, H.; Peng, H.; Liu, W. Experimental system of hydrodynamic action of dunhuang mogao grottoes under temperature-humidity-mechanical (THM) coupling. Geofluids 2020, 2020, 8831284. [Google Scholar]
  6. Alonso-Buenaposada, I.D.; Calvo, E.G.; Montes-Morán, M.; Narciso, J.; Menéndez, J.A.; Arenillas, A. Desiccant capability of organic xerogels: Surface chemistry vs porous texture. Microporous Mesoporous Mater. 2016, 232, 70–76. [Google Scholar] [CrossRef]
  7. Miao, C.; Zhu, M. Experimental study on the evolution of micropore structure softened by non-pressure water absorption strength of sandstone. J. Porous Media 2022, 26, 73–86. [Google Scholar]
  8. Zhang, F.; Liu, W.; Wang, Z.; Fu, Y.; Wang, S.; Liu, R.; He, M. The Influence of Water Absorption Increment on Infrared Radiation Characteristics of Rammed Earth; Springer: Singapore, 2018. [Google Scholar]
  9. Wang, J.; Sun, Q.; Xue, S.; Yang, X.; Guo, H.; Geng, J. Study on the effect of high-temperature dry-wet cycles on argillaceous sandstone. Bull. Eng. Geol. Environ. 2023, 82, 318. [Google Scholar] [CrossRef]
  10. Sun, X.; Shi, F.; Ding, J.; Tao, Z.; Zhang, Y.; Miao, C.; Cui, L. Study on Microscopic mechanism and failure mode of water-rock coupling in fine sandstone under uniaxial compression. Rock Mech. Rock Eng. 2023, 56, 6823–6842. [Google Scholar] [CrossRef]
  11. Kim, E.; Garcia, A.; Changani, H. Fragmentation and energy absorption characteristics of Red, Berea and Buff sandstones based on different loading rates and water contents. Geomech. Eng. 2018, 14, 151–159. [Google Scholar]
  12. Zhang, N.; Liu, L.; Hou, D.; He, M.; Liu, Y. Geomechanical and water vapor absorption characteristics of clay-bearing soft rocks at great depth. J. Mater. Sci. Technol. 2018, 24, 811–818. [Google Scholar] [CrossRef]
  13. Cui, G.; Zhou, C.; Liu, Z. Prediction method of water absorption of soft rock considering the influence of composition, porosity, and solute quantitatively. Appl. Sci. 2022, 12, 5938. [Google Scholar] [CrossRef]
  14. Zhang, W.; Wang, Z.; Du, Y.; Zhang, S.; Shi, Z.; Li, F. Effect of high temperature on pore characteristics, yield stress, and deformation property of sandstone. Bull. Eng. Geol. Environ. 2022, 81, 43. [Google Scholar] [CrossRef]
  15. Wang, M.; Li, J.; Tan, H.; Wang, J.; Shi, Z.; Li, K. Study on fatigue characteristics and thermal damage mechanism of red sandstone under high temperature-cyclic load coupling. Int. J. Fatigue 2023, 168, 107405. [Google Scholar] [CrossRef]
  16. Pan, X.; Zhou, X. Damage analysis of sandstone during the creep stage after high-temperature heat treatment based on NMR technology. Rock Mech. Rock Eng. 2022, 55, 7569–7586. [Google Scholar] [CrossRef]
  17. Liu, X.; Li, D.; Li, C. Laboratory testing and modeling of creep deformation for sandstone including initial temperature damage. Rock Mech. Rock Eng. 2023, 56, 2479–2495. [Google Scholar] [CrossRef]
  18. Luo, J.; He, J. Constitutive model and fracture failure of sandstone damage under high temperature–cyclic stress. Materials 2022, 15, 4903. [Google Scholar] [CrossRef] [PubMed]
  19. Caccia, M.; Camarano, A.; Sergi, D.; Ortona, A.; Narciso, J. Chapter Wetting and Navier-Stokes Equation—The Manufacture of Composite Materials. In Wetting and Wettability; InTechOpen: London, UK, 2015. [Google Scholar]
  20. Narciso, J.; Ramos-Fernandez, E.V.; Delgado-Marín, J.J.; Affolter, C.W.; Olsbye, U.; Redekop, E.A. New route for the synthesis of Co-MOF from metal substrates. Microporous Mesoporous Mater. 2021, 324, 111310. [Google Scholar] [CrossRef]
  21. Molina, J.; Rodriguezguerrero, A.; Bahraini, M.; Weber, L.; Narciso, J.; Rodriguezreinoso, F.; Louis, E.; Mortensen, A. Infiltration of graphite preforms with Al–Si eutectic alloy and mercury. Scr. Mater. 2007, 56, 991–994. [Google Scholar] [CrossRef]
Figure 1. Intelligent test system for water–rock interaction.
Energies 16 07540 g001
Figure 2. Thermal infrared imager.
Energies 16 07540 g002
Figure 3. Original block rock before processing.
Energies 16 07540 g003
Figure 4. Rock samples after processing.
Energies 16 07540 g004
Figure 5. System diagram of temperature changes during the hydration absorption process, monitored by the infrared thermal imager.
Energies 16 07540 g005
Figure 6. Curve of hydration absorption of rock samples at 105 °C.
Energies 16 07540 g006
Figure 7. Curve of hydration absorption of rock samples at 65 °C.
Energies 16 07540 g007
Figure 8. Curve of hydration absorption of rock samples at 25 °C.
Energies 16 07540 g008
Figure 9. Curve of the average surface temperature change of rock samples at different times with an initial temperature of 105 °C.
Energies 16 07540 g009
Figure 10. Maximum temperature variation curve of the rock samples’ surfaces at different times with an initial temperature of 105 °C.
Energies 16 07540 g010
Figure 11. Temperature changes on the surface of S1 at different times with an initial temperature of 105 °C.
Energies 16 07540 g011
Figure 12. Temperature changes on the surface of S2 at different times with an initial temperature of 105 °C.
Energies 16 07540 g012
Figure 13. Temperature changes on the surface of S3 at different times with an initial temperature of 105 °C.
Energies 16 07540 g013
Figure 14. Temperature changes on the surface of S4 at different times with an initial temperature of 105 °C.
Energies 16 07540 g014
Figure 15. Curve of the average surface temperature change of rock samples at different times with an initial temperature of 65 °C.
Energies 16 07540 g015
Figure 16. Maximum temperature variation curve of the rock samples’ surfaces at different times with an initial temperature of 65 °C.
Energies 16 07540 g016
Figure 17. Temperature changes on the surface of S1 at different times with an initial temperature of 65 °C.
Energies 16 07540 g017
Figure 18. Temperature changes on the surface of S2 at different times with an initial temperature of 65 °C.
Energies 16 07540 g018
Figure 19. Temperature changes on the surface of S3 at different times with an initial temperature of 65 °C.
Energies 16 07540 g019
Figure 20. Temperature changes on the surface of S4 at different times with an initial temperature of 65 °C.
Energies 16 07540 g020
Figure 21. Curve of the average surface temperature change of rock samples at different times with an initial temperature of 25 °C.
Energies 16 07540 g021
Figure 22. Maximum temperature variation curve of the rock samples.
Energies 16 07540 g022
Figure 23. Temperature changes on the surface of S1 at different times with an initial temperature of 25 °C.
Energies 16 07540 g023aEnergies 16 07540 g023b
Figure 24. Temperature changes on the surface of S2 at different times with an initial temperature of 25 °C.
Energies 16 07540 g024aEnergies 16 07540 g024b
Figure 25. Temperature changes on the surface of S3 at different times with an initial temperature of 25 °C.
Energies 16 07540 g025aEnergies 16 07540 g025b
Figure 26. Temperature changes on the surface of S4 at different times with an initial temperature of 25 °C.
Energies 16 07540 g026aEnergies 16 07540 g026b
Figure 27. Average image of the average temperature of rock samples.
Energies 16 07540 g027
Figure 28. Images of the average maximum temperature of rock samples.
Energies 16 07540 g028
Table 1. Basic parameters of the infrared thermal imager.
Temperature
Sensitivity (mk)
Measure PrecisionImage Resolution (pixel)Frame Frequency
(Hz)
Emissivity
18±1 °C, ±1%640 × 51210040.92
Table 2. Samples’ size and mass.
Sample NumberLong
(mm)
Wide
(mm)
High
(mm)
Mass (g)
S129.729.350.079.26
S230.029.849.480.04
S330.029.749.579.31
S430.029.649.879.24
Table 3. X-ray diffraction analysis of the rock’s mineral contents (%).
QuartzPotassium FeldsparPlagioclaseCalciteDolomiteHornblendeClay Mineral
29.04.131.912.37.64.910.2
Table 4. Establishment table of each rock sample control group.
Temperature (°C)S1S2S3S4
105Absorb waterAbsorb waterAbsorb waterNo water
65Absorb waterAbsorb waterAbsorb waterNo water
25Absorb waterAbsorb waterAbsorb waterAbsorb water
Table 5. Fitting parameters of the hydration absorption curve of rock samples at 105 °C.
Sample NumberParameters of Hydration Absorption Curve Fitting at 105 °C
abm0R2
S1−8.96834.43013.2620.977
S2−10.19970.63013.1390.989
S3−9.27439.86213.2210.978
Table 6. Fitting parameters of the hydration absorption curve of rock samples at 65 °C.
Sample NumberParameters of Hydration Absorption Curve Fitting at 65 °C
abm0R2
S1−9.73466.55110.6170.991
S2−9.324101.51010.8040.987
S3−9.92868.47511.2180.988
Table 7. Fitting parameters of the hydration absorption curve of rock samples at 25 °C.
Sample NumberParameters of Hydration Absorption Curve Fitting at 25 °C
abm0R2
S1−9.62889.73811.7970.985
S2−10.487134.47512.3020.986
S3−9.50088.39412.7740.981
S4−10.16892.11811.4940.986
Table 8. Fitting parameters for rock samples with an average temperature of 105 °C.
Sample NumberThe Average Temperature of 105 °C
Fitting Parameters
abt0R2
S156.471203.31523.9920.984
S261.721198.93023.9010.991
S355.279195.28424.0990.983
S458.020773.03323.4730.999
Table 9. Maximum temperature fitting parameters for 105 °C rock samples.
Sample NumberThe Maximum Temperature Fitting
Parameter of 105 °C
ABt0R2
S168.304206.54424.6460.992
S276.245219.70424.0460.989
S372.583199.92024.8050.990
S466.485794.46923.7320.999
Table 10. Fitting parameters for rock samples at an average temperature of 65 °C.
Sample NumberThe Average Temperature of 65 °C
Fitting Parameters
abt0R2
S122.701300.82822.0440.994
S221.604287.66422.3190.998
S325.861297.54122.0500.996
S423.264748.68023.3680.999
Table 11. Fitting parameters for rock samples with a maximum temperature of 65 °C.
Sample NumberThe Maximum Temperature Fitting Parameter of 65 °C
abt0R2
S129.424321.01622.1330.998
S227.084332.61822.0890.998
S331.715325.88421.9180.996
S426.791776.58823.6211.000
Table 12. Fitting parameters for rock samples at an average temperature of 25 °C.
Sample
Number
The Average Temperature of 25 °C Fitting Parameters
abt0cR2
S124.02320.499403.4851.6440.994
S223.92321.583281.8572.4230.996
S323.98121.105356.9222.0470.995
S423.86720.688427.3591.6800.995
Table 13. Maximum temperature fitting parameters for rock samples at 25 °C.
Sample
Number
The Maximum Temperature Fitting Parameter of 25 °C
abt0cR2
S124.62522.678210.3424.0630.991
S224.50122.430112.7722.5620.996
S324.52122.487121.7781.8560.992
S424.44322.833282.5455.5320.995
Table 14. Mean temperature mean fitting parameter.
Sample
Environments
Mean Temperature Mean Fitting Parameter
abt0cR2
Hydration absorption at 25 °C3.425481.48720.8713.4250.982
Hydration absorption at 65 °C22.971252.33623.29422.9710.996
Hydration absorption at 105 °C56.564247.50731.70856.5640.987
25 °C; does not absorb water3.644636.91420.4463.6440.916
65 °C; does not absorb water3.425481.48720.8713.4251.000
105 °C; does not absorb water22.971252.33623.29422.9711.000
Table 15. Maximum temperature average fitting parameter.
Sample
Environments
Maximum Temperature Average Fitting Parameter
abt0cR2
Hydration absorption at 25 °C2.412172.82322.4732.4120.982
Hydration absorption at 65 °C29.949342.08121.32429.9490.996
Hydration absorption at 105 °C73.790390.83224.74373.7900.987
25 °C; does not absorb water3.223608.85321.6053.2230.916
65 °C; does not absorb water27.090759.41523.50927.0901.000
105 °C; does not absorb water108.9992854.339-18.789108.9991.000
Disclaimer/Publisher’s Note: The statements, opinions and data contained in all publications are solely those of the individual author(s) and contributor(s) and not of MDPI and/or the editor(s). MDPI and/or the editor(s) disclaim responsibility for any injury to people or property resulting from any ideas, methods, instructions or products referred to in the content.

