Abstract
This paper proposes a microgrid optimal scheduling strategy based on the reactive power compensation of electric vehicles to address the issue of interactive fluctuation of voltage and power resulting from a high proportion of new energy integration into the grid. Firstly, for accurate prediction of electric vehicle charging and discharging behavior, the Monte Carlo simulation method was employed for day-ahead prediction. Secondly, an optimization method for reactive power compensation was developed, considering distributed sources such as wind turbines, photovoltaics, and electric vehicles, with the objective of minimizing network loss and power generation costs. Additionally, user-side prices and electric vehicle charging prices were taken into consideration. Finally, utilizing the IEEE14 bus simulation, a comparison was made between the microgrid with and without electric vehicle reactive support capacity. Results demonstrated that, while maintaining a power factor greater than 0.95, the proposed method reduced the average daily generation cost by 0.35%, average daily network loss by 7.0%, average daily bus voltage fluctuation by 48.60%, average electricity price by 2.88%, and EV user charging cost by 21.29%. These findings illustrate that the proposed reactive power compensation optimization method effectively mitigates voltage and power fluctuations resulting from new energy integration, ensuring system safety, reliability, and economic efficiency.
1. Introduction
To address the increasingly prominent issues of the global energy crisis and climate change, the large-scale application of distributed renewable energy has become a reliable solution in the world’s energy strategic deployment because of its economic benefits, environmental protection, and flexibility. With the development of clean renewable energy generation technology and the increasing penetration rate of new energy in the grid power system, the challenge of how to economically and reliably schedule distributed energy is gaining particular interest from researchers.
1.1. Related Works
There are many types of distributed energy, such as wind power and photovoltaic power generation. Numerous studies have shown the necessity of adopting optimization technology to control the energy management of a distributed power supply when it is connected to the grid on a large scale. Zhang (2022) proposed an economic operation study that provided a scheduling scheme to address the voltage and power interaction fluctuations caused by the large-scale grid connection of photovoltaic and wind power [1]. Hussain (2017) conducted a study on optimal operation, which demonstrated that the resilience of the power system can be improved by supplying local and non-local loads in a distribution microgrid [2]. However, it was found that only the scheduling scheme and reactive power compensation device could not produce the expected effects on voltage and power interaction fluctuations during peak load periods [3]. With the development of Vehicle-to-Grid (V2G) technology for electric vehicles (EVs), using EVs as distributed power supply offers a new solution to address the above issues. Similar to most cases of distributed power generation, the large-scale integration of electric vehicles into the grid can provide energy support to the power grid. However, what distinguishes electric vehicles is that they also act as loads, constantly drawing energy from the grid. Therefore, in addition to the impact on the grid from the large-scale charging of EVs, the EV load should also be considered. Hu (2012) proposed that the large-scale integration of electric vehicles into the power grid would exacerbate load fluctuations, increase voltage fluctuations, and pose challenges to optimizing power grid operations and control [4].
In addition to conventional scheduling studies, research on utilizing a portion of distributed power generation capacity to provide reactive power support to the power grid and achieve voltage regulation objectives is increasingly becoming a hot topic. Li (2022) has shown that photovoltaic systems can actively support voltage regulation in the distribution network [5]. Wu (2022) proposed different active and reactive power control methods for photovoltaic grid-connected inverters based on network loss and network voltage, effectively improving reactive power and voltage control capabilities [6]. Yang (2022) conducted a study on variable-speed wind turbines, considering the reactive power generation limit of the generator, the reactive power loss of the wind power plant, and the capacity of compensation equipment to propose a more comprehensive wind reactive power capacity model [7]. When a high proportion of wind power is connected to the grid, ensuring the stability and safety of the power system requires the wind turbine to maintain grid connection and inject certain reactive power when the grid voltage drops sharply [8].
However, in the field of distributed power generation scheduling that considers reactive power support, there is limited consideration given to electric vehicles (EVs) as distributed power sources. Based on the charging and discharging characteristics of EVs, even on a large scale, EVs can play a role in reactive power regulation for the power grid. In [9], a bidirectional EV Ultra-Fast charger station technology was proposed, which can be used for reactive power compensation or any other grid support function. Mao (2022) studied the interaction and integration technology of EVs, CPs, and the power grid to enhance power grid flexibility and stability, promoting clean and low-carbon energy transformation, and cultivating electricity [10]. Zeng (2017) designed a coordinated control strategy of ‘Source-load-grid’ to maximize the reactive power support capability of EVs [11]. Ding (2017) used the master-slave control technique to restore loads in a microgrid, mentioning the joint use of a distributed power supply [12].
These studies neglected the uncertainty of renewable energy resources and consumed loads. To reasonably account for the aforementioned uncertainty, Zhang (2018) suggested a V2G reactive power compensation mode using double-layer dispatching EVs, proposed by employing Monte Carlo simulations of vehicle charging behavior [13]. In [14], Fady (2018) introduced a math-heuristic algorithm to address robustness problems in optimizing energy management in smart grids. Seyed (2019) presented a method for handling the level of conservatism in the robust control algorithm for microgrid day-ahead energy scheduling [15]. In addition to robustness optimization, distributed energy management solutions have also garnered significant attention. Mosaddek (2018) proposed real-time decentralized demand-side management to mitigate the intermittent nature of renewable energy sources and reduce the time required to generate scheduling plans in the field of renewable energy, including EV charging and discharging [16]. Yang (2021) introduced a three-layer cyber-physical integration-modeling framework containing a physical device layer for a centralized control microgrid, which can be used to depict the state transition process under specific optimization objectives [17]. Nicola (2023) put forward a noncooperative distributed control framework and defined a rolling horizon control strategy based on quadratic optimization for optimal scheduling of vehicle-to-everything in a distributed fashion [18]. Centralized dispatch decision-making is suitable for situations requiring global optimization and comprehensive consideration, despite information exchange overhead and single points of failure risks. Decentralized dispatch decision-making is suitable for situations requiring low information exchange and quick response but may not achieve the global optimum strategy. Therefore, in practical applications, one can select the appropriate dispatch decision-making strategy based on specific circumstances or combine the two to achieve efficient energy dispatch in microgrids.
1.2. Contributions
Aiming to address voltage and power fluctuations caused by the high proportion of distributed new energy connected to the grid, this paper proposes an energy dispatcher strategy considering the reactive power support capability of EVs. The key contributions of this study are outlined as follows:
We propose a microgrid scheduling strategy that efficiently utilizes the reactive power support provided by electric vehicles. A significant number of electric vehicles are employed to enhance the microgrid’s reactive power capacity. This approach ensures the safety and reliability of the power grid while improving economic benefits and energy utilization rates.
We predict the behavior of electric vehicles using Monte Carlo analysis. This reliable method effectively captures the uncertainty associated with electric vehicles, which is vital for power and vehicle-to-grid (V2G) interaction calculations. In comparison to previously proposed EV behavior models, this paper considers the multiple charging behaviors of EVs.
We propose a pricing strategy for electric vehicle charging based on the degree of reactive power support from V2G. This strategy reflects changes in electric vehicle charging prices in response to variations in node power quality, ultimately reducing the charging costs for electric vehicle users.
In this paper, turbines, photovoltaic systems, and wind power are considered part of the centralized power grid, while EV energy scheduling is approached from the perspective of distributed energy storage.
1.3. Organization of the Paper
The remaining sections of this paper are organized as follows:
Section 2: This section introduces the mathematical models for scheduling different components of the microgrid, including the microgrid structure, the distributed power sources, the electricity price calculation, and the optimal power flow calculation.
Section 3: This section provides a Monte Carlo behavior planning for electric vehicles.
Section 4: In this section, the proposed model is subjected to simulation analysis. Based on the optimal power flow calculation results, factors such as power factor, voltage fluctuations, and power interactions between nodes are analyzed for safety and reliability. Furthermore, an economic analysis is conducted on the overall electricity price and EV charging price.
Section 5: The final section encompasses the summary of the work conducted in this paper and provides conclusions based on the findings.
2. Problem Formulation
The outline of the proposed model, which considers the reactive power compensation of EVs in microgrid scheduling for safety, reliability, and economic efficiency, is depicted in Figure 1 and Figure 2.
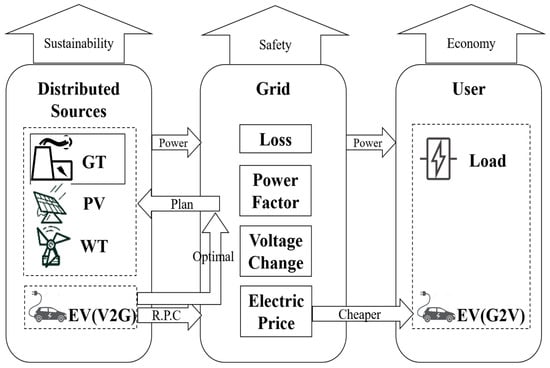
Figure 1.
Structure of Source-Grid-User.
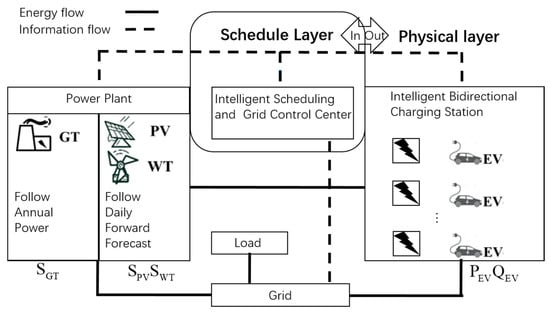
Figure 2.
Layered System Scheme.
In Figure 1 and Figure 2, the intelligent scheduling and grid control center receives information from each component and feeds back the results after calculating and processing, including power factor and voltage change for ensuring power quality, 24 h electricity price for trading electricity, and energy scheduling from distributed renewable resources. Also, EV charging electricity price, which is associated closely with EV behavior, is an important key to proving the feasibility of economic efficiency. After the electric vehicle enters the intelligent bidirectional charging station, the station provides the state of charge (SOC) and driving plan to the grid. The center feeds back the EV reactive power scheduling scheme and EV charging price according to its information. In terms of power plants, a gas turbine (GT) is responsible for most active power generation tasks and needs to generate power according to the annual load plan. Wind turbines (WT) and photovoltaic power generation (PV) are new renewable power sources, and the power generation is predictable.
The proposed approach depicted in Figure 3 applied the problems of active and reactive power management. Firstly, management conformed to safety, reliability, and economic efficiency considering power cost from GT, and distributed power exchange from PV, WT, and EV in the V2G model. After receiving the initial plan from power flow calculation, the economic objective was considered to improve the optimal power flow results. The initial plan and follow-up plan were linked through a programming model to minimize the grid cost and EV user charging cost.
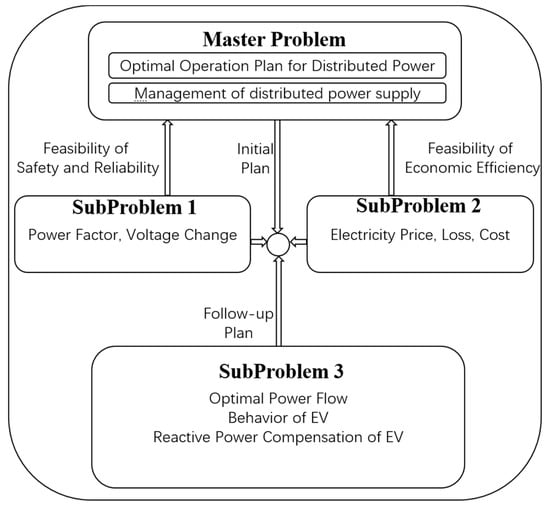
Figure 3.
Proposed model for the power management.
2.1. GT Capacity Model
While the proportion of gas turbine power generation has been gradually declining, it still represents the dominant portion of the total power generation. Hence, in this study, the gas turbine was designated as the primary power supply source. The output model of the gas turbine is defined as follows:
where is the apparent power generation of GT, is the conversion efficiency of gas to electricity, and is the power conversion constant of gas to electricity with a value of 9.7 .
The active and reactive power output of GT should meet:
where is the active power output of GT, is the lower limit of GT active power output, is the upper limit of GT active power output, is the reactive power output of GT, is the lower limit of GT reactive power output, is the upper limit of GT reactive power output.
It is important to highlight that GT is the primary power plant responsible for generating the majority of electricity in the microgrid. Consequently, the cost of power generation from the GT represents a significant portion of the overall cost. This cost is primarily determined by the fuel expense associated with the operation of the GT. On the other hand, it is worth mentioning that the generation costs of WT and PV sources are mainly dependent on natural elements such as wind and sunshine, making their generation costs negligible. Additionally, the generation cost of EVs can be considered negligible due to the reactive power support in V2G mode, which has minimal adverse impacts on the EV battery. As a result, the power generation cost of the GT was viewed as the representative cost for the entire microgrid system.
2.2. PV Capacity Model
PV power generation is a widely adopted renewable energy source. In this microgrid system, PV was installed at buses 2 and 3 to provide electrical power and also contribute to reactive power compensation within the system. The primary generation of PV power is influenced by factors such as solar radiation levels and the operating temperature of the power generation equipment. The apparent power output of a typical PV system is represented as follows:
where is the test power of PV under standard test conditions, is the solar elevation angle, is the solar azimuth, is the power temperature coefficient, take −0.05 °C, is the actual working temperature of the PV module, is the standard reference temperature of PV modules, taking 25 °C.
and can be expressed as a trigonometric function with time t as a variable, is generally a fixed value in a specific area, so the apparent power of PV output can also be written as:
where, is the basic apparent power of PV, is the upper limit of the apparent power of PV, is PV angular power frequency, and is the phase difference between PV and grid.
The active and reactive power output of a PV grid-connected inverter needs to meet:
where, is the reactive power output of PV, is the active power output of PV, is the upper limit of PV active power output, is the upper limit of PV reactive power output.
2.3. WT Capacity Model
WT, as a clean and renewable energy source, possesses a significant power generation potential comparable to that of PV. In this microgrid system, WT was installed at bus 6 to provide a power supply and contribute to reactive power compensation within the system. The apparent power of WT is:
where is the apparent power of the wind turbine, is the cut-in wind speed, is the rated wind speed, is the cut-out wind speed, and is the rated power of the wind turbine. The parameters a, b, c, and d were derived from the wind speed-power fitting curve.
Wind power with the battery can provide active and reactive power to the grid, which is:
where is the active power of WT, is the reactive power of WT, is the upper limit of WT active power output, and is the upper limit of WT reactive power output.
2.4. EV Capacity Model
EVs have the capability to function as new power sources due to the bidirectional charging and discharging characteristics of charging infrastructure. With the increasing popularity of EVs and advancements in battery technology and charging infrastructure, their potential as energy reserves is also expanding. In this microgrid system, the EV was positioned at bus 8, functioning as a load unit while also contributing to reactive power compensation within the system.
In Section 3 of the paper, the behavior of EV was simulated using the Monte Carlo method. The daily charging and discharging patterns of a specific number of EVs were determined based on the simulated distribution. At time t, the charging requirements for each electric vehicle and the active power requirements for the charging infrastructure were as follows:
where is the EVs’ max daily driving distance, n represents the number of EV (No.n), represents that the SOC of EV No.n when EV leaves the charge station, is the max SOC of EV No.n, is the SOC of EV No.n for user setting, represents the SOC of EV No.n when EV enters the charge station, is the charge time of EV, is EV’s active power required at time t, and is the number of EV which is fitting predicted. In particular, Formula (15) is the planned Soc for EV out-charging, and formula 16 is the actual Soc after EV is used for reactive power support.
The reactive power that can be provided in the V2G mode of the EV, which is:
where, is the reactive power from EV to charging pile in V2G mode, is the nominal apparent power of charging pile, is the upper limit of EV reactive output in V2G mode, and is the lower limit of EV reactive output in V2G mode.
2.5. Electricity Price Model
Typically, the grid applies a time-of-use electricity price strategy for active power consumption, but the pricing adjustment for reactive power has often been neglected. Prior studies conducted by Wang (2004), Cai (2013), and Lu (2020) proposed various reactive power charging models to address issues such as low grid voltage and unstable operation. In this paper, a new real-time electricity price framework is proposed, incorporating their reactive power reward-penalty models [19,20,21]. This electricity price mechanism considers the power quality of the power grid as the evaluation standard and considers the degree of reactive power support provided by EV to reward V2G. Finally, the weight of price change was obtained after quantification of . This approach combined the peak-valley electricity price model, establishing the overall electricity price for the microgrid. Specifically, when the electric vehicle was solely utilized as an electricity load, the standard electricity price was applied as follows:
After the V2G application of EV for reactive power regulation, the overall electricity price of the power grid and the electricity price of EV node 8 were:
where is the generation cost of the microgrid system mainly from GT, is the loss of the microgrid system mainly from active loss, is the variance of bus voltage indicating the magnitude of the voltage fluctuation, is the weighted calculation method of electricity price change coefficient, a is the weight, b is input parameter, and are the system parameters after reactive power compensation of EV and when EV is only used as electrical load.
2.6. Optimal Power Flow (OPF)
The optimization problem in the power system, which requires a solution that considers security, stability, and economic factors, is depicted in Figure 4. In Figure 4, considering the hierarchical control of the microgrid for the day-ahead initial plan model, based on the power prediction models of GT, PV, WT, and load, a nonlinear power flow planning with the goal of safety and reliability was established, and the basic control group of system operation was given. After connecting the EV reactive power support, considering the lowest cost of power generation and the increase of the income of EV users as the optimal power flow calculation target, the power flow distribution of each node of the microgrid and the power dispatching expectation of the distributed power supply were obtained by the Newton-Raphson iterative calculation.
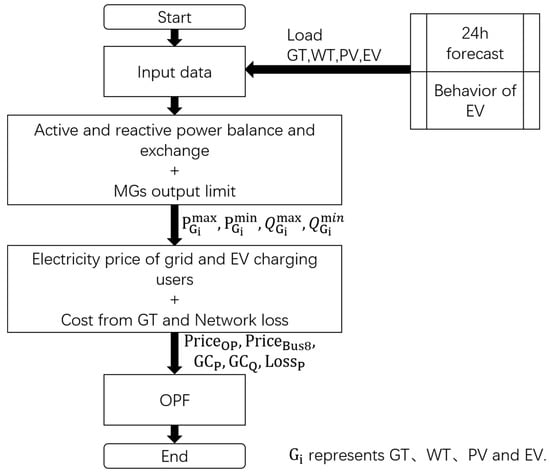
Figure 4.
Proposed algorithm flowchart.
The calculation of optimal power flow offered a suitable approach to address this problem, as it involved a multi-variable, multi-objective, non-linear, and multi-constrained optimization framework. In other words, the optimal power flow calculation aimed to optimize various variables while satisfying multiple objectives, nonlinear relationships, and a set of constraints.
2.6.1. Objective Function
The objective function includes generation cost (GC) and loss.
where t is time, n is the number of EVs, bus is node number of the power grid model, is total generation cost; is the GC of active power, is the GC of reactive power, is the loss of active power, is the number of power source, is the GC of the active power of source , is the active power of source , is the GC of reactive power of source , and is the active power of source .
Then the objective function of the system is formulated as follows:
The objective of this function is to minimize grid generation costs and network losses.
Meanwhile, there is also a secondary objective function as follows to minimize the cost of EV users, which is namely to reduce the price of charging electricity. In particular, function 32 is a part of the underlined item in Formula (31).
2.6.2. Constraints
The power balance constraints of optimal power flow calculation are as follows:
where is the active power of the bus, is the demand of system active power, is the connection matrix, is the active power output of the source, is the reactive power of the bus, is the demand of system reactive power, is the reactive power output of the source, is the phase angle of Bus voltage, and is the bus voltage.
Of course, at bus 1, 2, 3, 6, 8, you also need to consider the constraints of the generation model mentioned in Section 2.
In addition to the constraints mentioned in Section 2, the distributed generation within the microgrid must also adhere to Box Constraints for both the active and reactive power injections into the system. The actual P-Q curve, illustrating the relationship between active and reactive power, is depicted in Figure 5. The shaded portion in the figure represents the feasible operating region for the unit.
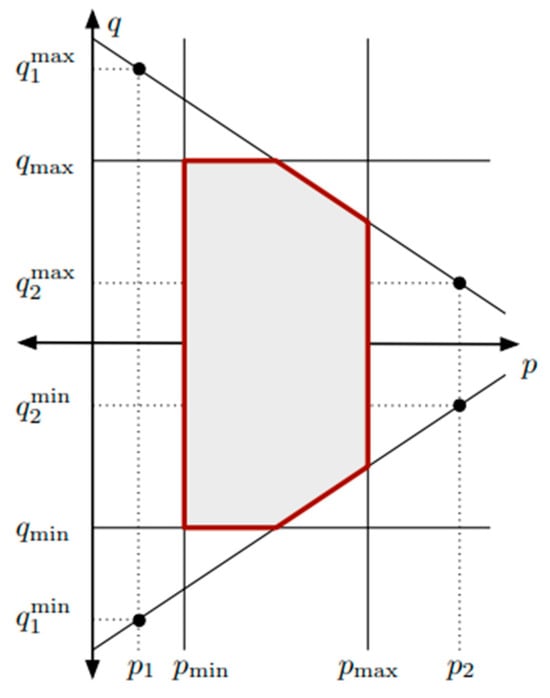
Figure 5.
Box Constraints of the active and reactive power injection system.
By incorporating the variable into the MatPower7.1 program, linear boundary constraints for active and reactive power injections with a slope of ±1 were established according to the dots trajectory. This approach enabled the definition of a more realistic and scientifically grounded power generation area for generators, which is surrounded by red line. However, it should be noted that these area constraints might occasionally conflict with the constraints imposed by the active and reactive power curve, as expressed in Formula (7) for distributed power supply in Section 2. The process of OPF is shown in Figure 6. When conducting the optimal power flow (OPF), excessively strict constraints often result in non-convergence of the results. In Figure 6, the OPF was performed considering the most stringent P-Q non-linear Box constraints first, followed by the consideration of P-Q linear Box constraints. If the results still did not converge, the constraint of power limits was considered without the Box constraints. In the case of non-convergence, the calculation results were determined based on the limited number of iterations.
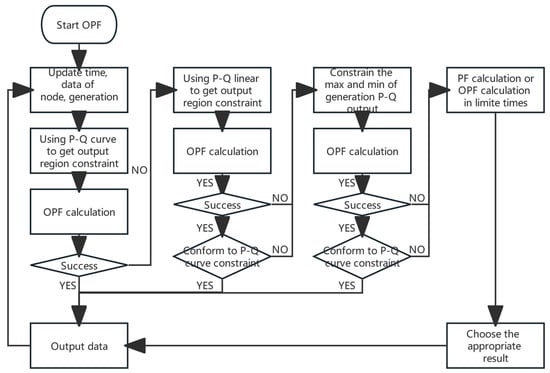
Figure 6.
Process of OPF.
3. Monte Carlo Simulation of EV
The number of EVs can be predicted by statistics from the Ministry of Public Security of the People‘s Republic of China from 2017 to 2023. The quantity of the EV-Year curve, shown in Figure 7, is obtained according to the fitting function :
where the fitting coefficients of a, b, , , c, are 0.1741, −351.4, −181.5, −716.4, −0.3089, and 0.4636 respectively, is the number of county-level administrative regions in the country with a value of 2844, and Y is the forecast year.
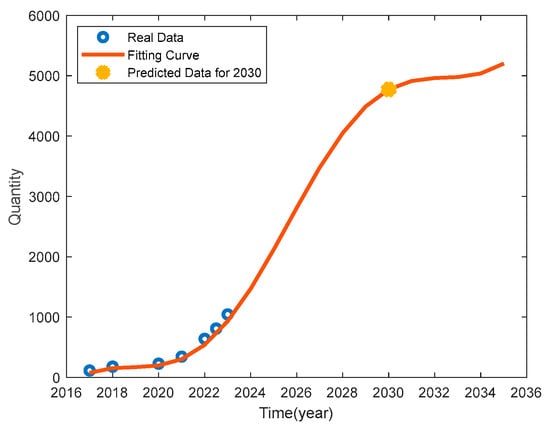
Figure 7.
Quantity of EV-Year curve.
It is expected that in 2030, China will have an average of 16,789 EVs in each county-level administrative region.
According to the description of the electric vehicle capacity model in Section 2.4, the daily charge and discharge of the charging station can be obtained by the accumulation of the charge and discharge of the electric vehicle entering the station in a day, which can be regarded as a probabilistic model given by the charging time, charging time and daily driving distance. Therefore, the Monte Carlo simulation was introduced to correlate the above parameters with the charge and discharge amount of the charging station.
To comprehensively analyze the uncertainty associated with electric vehicle (EV) charging behavior, it was essential to examine the randomness of the charging time and daily mileage of EVs. In this study, the EV was subjected to charging twice a day. A 60KVA charging pile was utilized for fast charging between 6:00 and 18:00, while a 7KVA onboard charger was employed for slow charging from 18:00 to 6:00 the next day. The battery capacity of the EV was 68.3571 KW, and this value came from the average of the top ten EV batteries [22]. Considering that EV charging time followed a normal distribution, the SOC had a strong correlation with daily mileage, and daily mileage followed a lognormal distribution [23]. The EV charging distribution Table 1 was obtained by comprehensively considering the above distribution model and the data provided in the literature [11,24,25].

Table 1.
Distribution of EV behavior.
According to Table 1, after Monte Carlo planning of 16,789 EVs, Figure 8, Figure 9 and Figure 10 are obtained. According to the calculation formula in Section 2.4, EV charging time and Soc are obtained in Figure 9 and Figure 11.
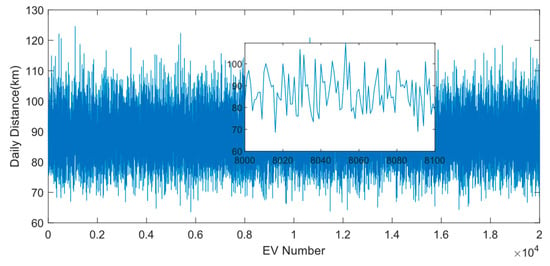
Figure 8.
Daily driving distance of 16,789 EVs (The subgraph shows EV No.8000 through No.8100).
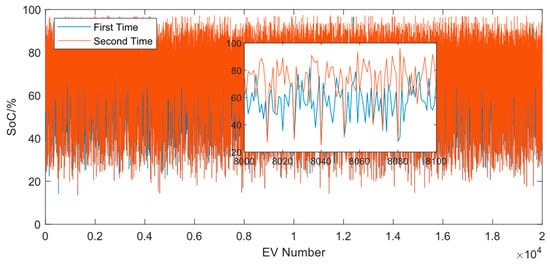
Figure 9.
Soc of EVs (The subgraph shows EV No.8000 through No.8100). The addition of the first and second values is equal, indicating that the EV is only charged once.
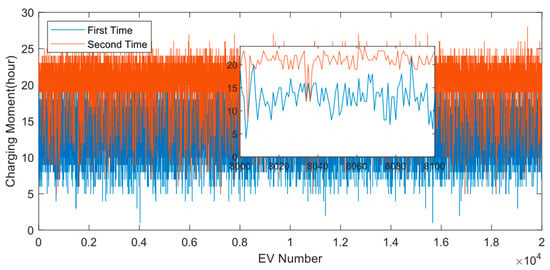
Figure 10.
Every EV’s charging moment (The subgraph shows EV No.8000 through No.8100). The addition of the first and second values is equal, indicating that the EV is only charged once.
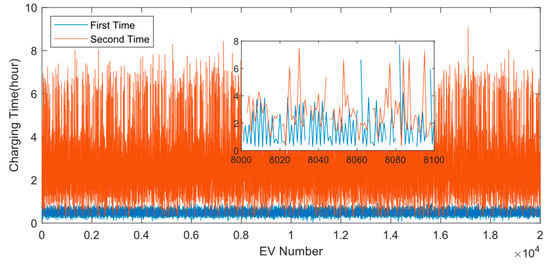
Figure 11.
Charging time of Evs (The subgraph shows EV No.8000 through No.8100). The addition of the first and second values is equal, indicating that the EV is only charged once.
Figure 12 is obtained by counting the number of incoming EVs per moment in Figure 10 and comparing it with the probability distribution function of two charges. For the two-charge model proposed in this paper, firstly, the single-charge distribution is split based on time. Then, by extending the time scale (from 24 h to 48 h) and recombining (reintegrated to a 24 h scale), the probability distribution of EV charging twice per day is calculated. Sampling for single charging was performed for two time periods, and it was observed that the trend roughly conformed to the calculated probability distribution, as shown in Figure 12. Therefore, the two-charge time model is also accurate. According to the experiment, when the number of EVs increases, the daily EV charging quantity tends to be closer to the distribution function, which accords with the Monte Carlo principle and large number theorem.
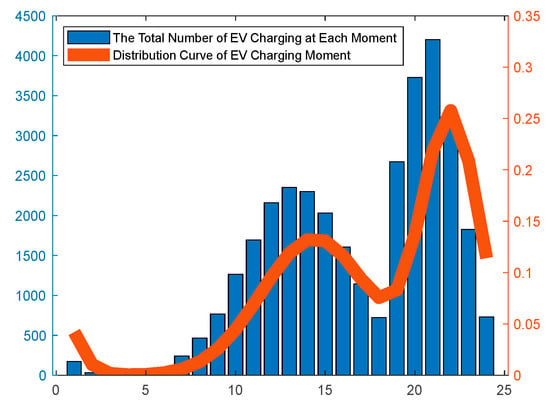
Figure 12.
Total EV charging quantity every hour.
4. Numerical Simulations
4.1. Data of Network
An improved IEEE14 node network system is depicted in Figure 13. The system consisted of various components, including GT connected to bus 1, PV connected to bus 2 and bus 3, WT connected to bus 6, EV connected to bus 8, and electric loads connected to the remaining buses in the test case of medium and low voltage microgrid. Low base voltages and ample voltage control capabilities, featuring 14 buses, 20 branches, 3 transformer device branches, and 5 generators, characterized the system. It is important to note that, in order to accurately represent the impact of distributed generation on the microgrid, the power generation capacity of the sources had been adjusted using daily data.
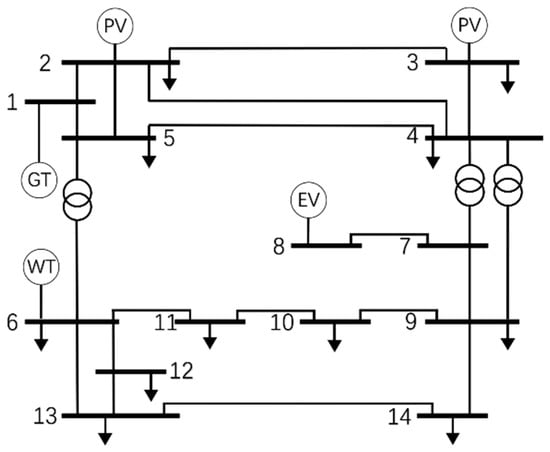
Figure 13.
Analysis model of improved IEEE14 node system.
The branch data is reported in Table 2, while the load input data is reported in Table 3 [26]. The loads were assumed to vary throughout the day based on a stepped profile, which was derived from data collected in a region in southeast China, as depicted in Figure 14. Additionally, in Table 3, the symbol “x” on bus 8 indicates that the active and reactive power demand changes depending on the behavior of EV.

Table 2.
Branch data.

Table 3.
Load Input data.
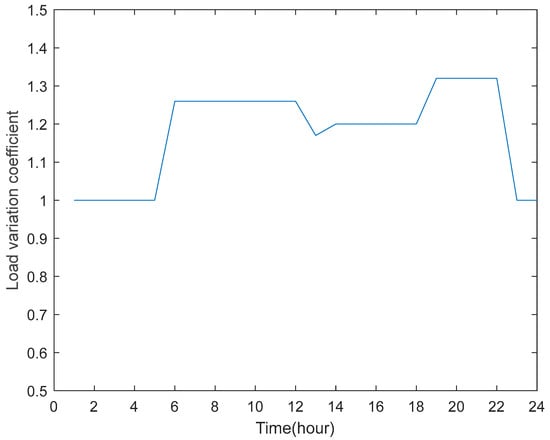
Figure 14.
Daily profile of load variation coefficient.
4.2. Analysis of Simulations
In order to conduct a precise analysis of the influence of reactive power compensation with electric vehicles (EVs) on microgrid operation, this paper will examine two specific scenarios:
Case 1: EVs are utilized solely as loads without reactive power compensation after being connected to the grid network.
Case 2: EVs are required to compensate for reactive power when fulfilling their charging requirements.
These two cases were thoroughly examined to establish a comprehensive understanding of the influence of reactive power compensation by EVs on microgrid operation. By studying the scenarios where EVs were used solely as loads without reactive power compensation and when they were required to compensate for reactive power during charging, we better assessed the overall impact on the functioning of the microgrid.
4.2.1. Economic Analysis
The economic analysis in this study utilized the reactive power capacity of electric vehicles to compensate for reactive power in the grid lines. This approach helps reduce network losses and generation costs in the microgrid. The comparison of network voltage loss between Case 1 and Case 2 is presented in Figure 15. Additionally, the comparison of system operation costs between Case 1 and Case 2 is displayed in Figure 16. These results provided insights into the effectiveness of using EVs for reactive power compensation and its impact on network efficiency and economic performance in the microgrid.
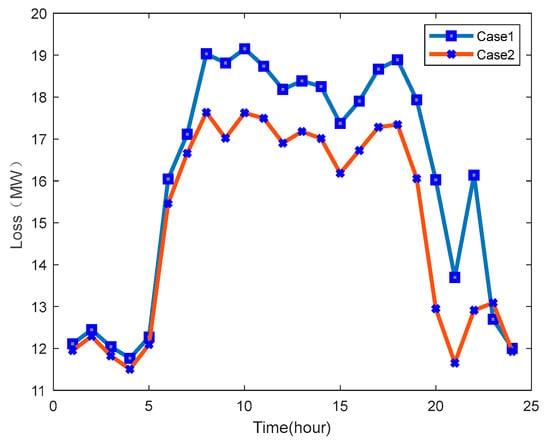
Figure 15.
Network voltage loss change of case 1 and case 2.
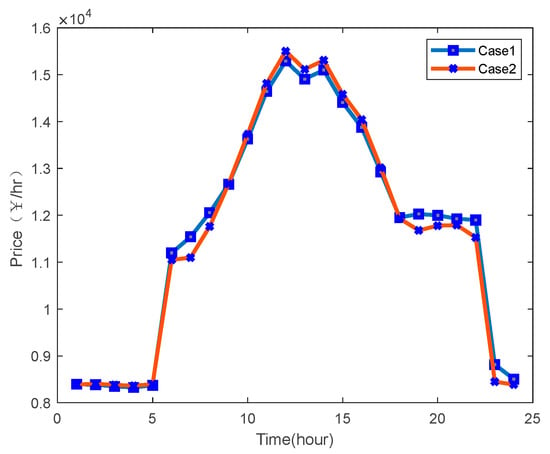
Figure 16.
System operation cost change of case 1 and case 2.
The analysis of Figure 15 revealed that in Case 2, the overall system network loss decreased, leading to a 7.07% reduction in the daily average system network loss. The largest decrease in system network loss occurred at 22:00, with a significant reduction of 20.35%.
Figure 16 illustrates that in Case 2, the generation cost increased from 9:00 to 18:00, showing an average increase of 0.93%. However, in other time periods, the generation cost decreased by an average of 1.61%. As a result, the daily average generation cost experienced a reduction of 0.35%.
Furthermore, considering the electricity price, it can be observed from Figure 17 that when using the conventional method of only considering the active electricity price charging, users on the electricity side needed to pay more for electricity. However, by applying the reactive power capacity scheduling method of EVs to the microgrid, the electricity price on the power side was reduced by an average of 2.88%. Additionally, the charging cost for EV users was reduced significantly by 21.29% on average. These results highlight the benefits of implementing the reactive power capacity scheduling method for EVs in terms of reducing both electricity prices for consumers and the charging costs for EV users.
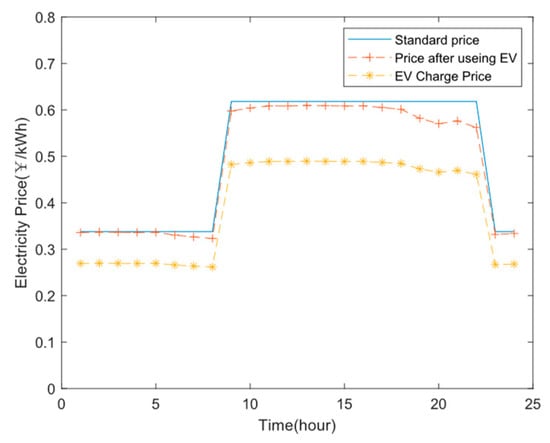
Figure 17.
Microgrid selling electricity price.
As the penetration rate of electric vehicles (EVs) providing reactive power support to microgrid increased, the impact of EVs on reducing grid generation costs and network losses became more prominent. This trend led to higher and more significant economic benefits. By utilizing EVs as distributed power sources that contribute to reactive power support in microgrids, the overall efficiency of the grid improved, resulting in reduced generation costs and network losses. As a result, the economic advantages of incorporating EVs into microgrid systems became more pronounced and increasingly advantageous.
4.2.2. Safety and Reliability Analysis
Figure 18 and Figure 19 present the variations in system power factor and bus voltage, respectively, with changes in the charging and discharging modes of electric vehicles.
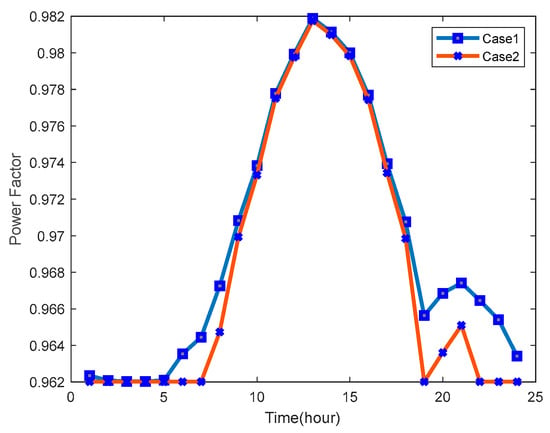
Figure 18.
Hourly power factor of case 1 and case 2.
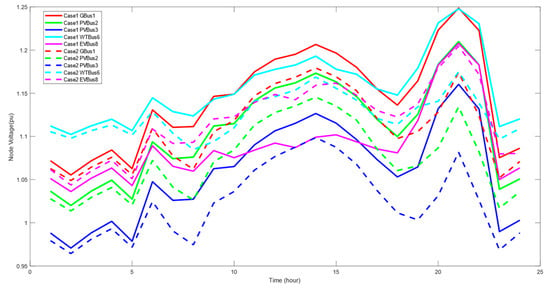
Figure 19.
Source Bus voltage change of case 1 and case 2.
In the daytime scenario (Case 2), the system power factor was slightly lower compared to Case 1, showing a reduction of approximately 0.084%. During the nighttime, the system power factor in Case 2 was lower than in Case 1 by about 0.28%.
Regarding bus voltage, the overall bus voltage in Case 2 is slightly lower than in Case 1. However, Case 2 exhibits lower bus voltage fluctuations compared to Case 1.
These findings suggested that the changes in charging and discharging modes of electric vehicles could influence the system power factor and bus voltage in microgrids. Although a slight decrease in power factor and bus voltage was observed in Case 2, the overall impact was minimal, and the stability of the system was enhanced due to reduced voltage fluctuations.
From Figure 18, it is evident that the power factor in Case 2 was lower than in Case 1. The power factor gap between day and night was more significant. The lower overall power factor in Case 2 can be attributed to the fact that in Case 1, the charging pile injects its apparent power into electric vehicles as active power, resulting in a higher active load in the power grid. On the other hand, in Case 2, part of the apparent power from the charging pile was used to charge electric vehicles as active power, while the remaining portion was injected into the power grid as reactive power to compensate for reactive power, resulting in a reduced active load on the power grid. According to the power factor calculation method, this led to a decrease in the power factor in Case 2. The power factor difference near the start and end times of photovoltaic output and the rated power change of the charging pile (6:00 and 18:00) is influenced by uncertainties, contributing to an increased power factor difference during these time points. However, even though the power factor decreased in Case 2, it still remained above 0.95, meeting the requirements for microgrid security and reliability.
From Figure 19, it can be observed that the bus voltage fluctuated with time in both cases. The higher power factor indicates that the voltage in both cases was maintained in a relatively stable state. When comparing the two cases, it was evident that the bus voltage in Case 2 was generally lower than in Case 1, with an average reduction of 2.02% per bus. This indicates that Case 2 experienced slightly lower bus voltage levels compared to Case 1. Despite the slight reduction, the voltage remained within an acceptable range, ensuring the stability of the microgrid system.
To provide a more accurate and detailed analysis of the system bus voltage, this study calculated the variance of the daily average voltage for each bus. This approach effectively describes the voltage fluctuation, and the results are depicted in Figure 20. The variance values quantify the extent of voltage fluctuations experienced by each bus in the system, allowing for a more comprehensive understanding of the overall voltage stability in the microgrid.
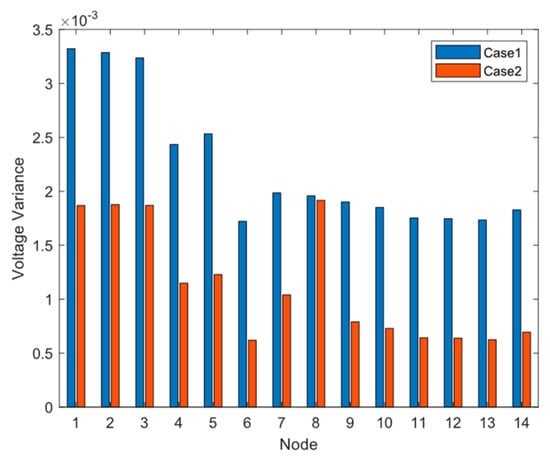
Figure 20.
Changes of voltage variance in case 1 and case 2.
The analysis of Figure 20 reveals that, when electric vehicles provide reactive power support to the microgrid (Case 2), the voltage fluctuation of each bus was significantly reduced compared to Case 1. On average, there was a notable reduction of 48.60% in voltage fluctuation. This finding indicates that the utilization of electric vehicles as distributed energy sources for reactive power compensation effectively mitigates voltage fluctuations, resulting in improved safety and stability of the power grid. The reduced voltage fluctuation in Case 2 contributed to a more reliable and secure operation of the microgrid system.
According to the reactive voltage control theory, the voltage of node 8 will be stable in a certain range when the reactive power capacity is supported. At the same time, according to the theory of power flow and voltage equalization in the power grid, reactive power injection or absorption can reduce the risk of voltage reduction and voltage imbalance and ensure the voltage balance of each node in the power grid.
4.2.3. Power Output Analysis
The active and reactive power capacities of each case are depicted in Figure 21, Figure 22, Figure 23 and Figure 24 as derived from the optimal power flow calculations.
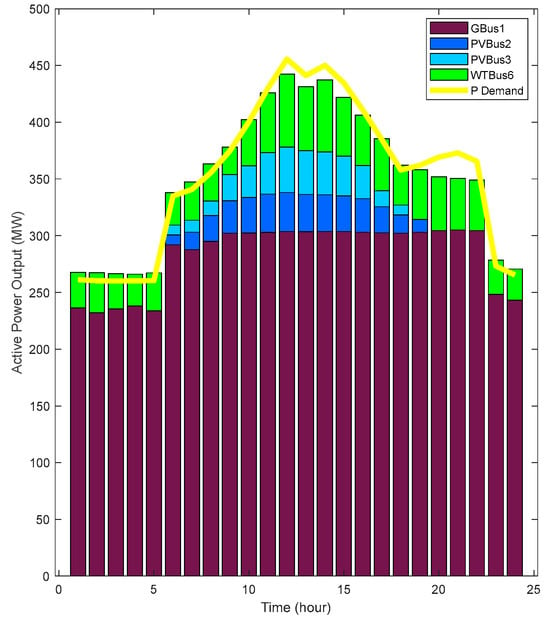
Figure 21.
Source active power in case 1.
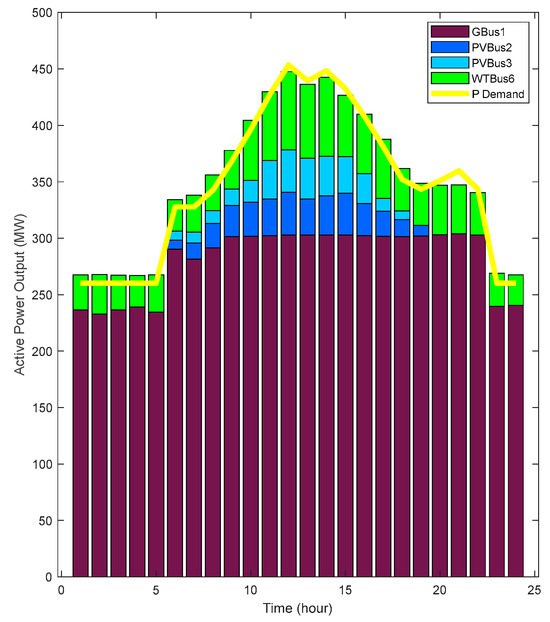
Figure 22.
Source active power in case 2.
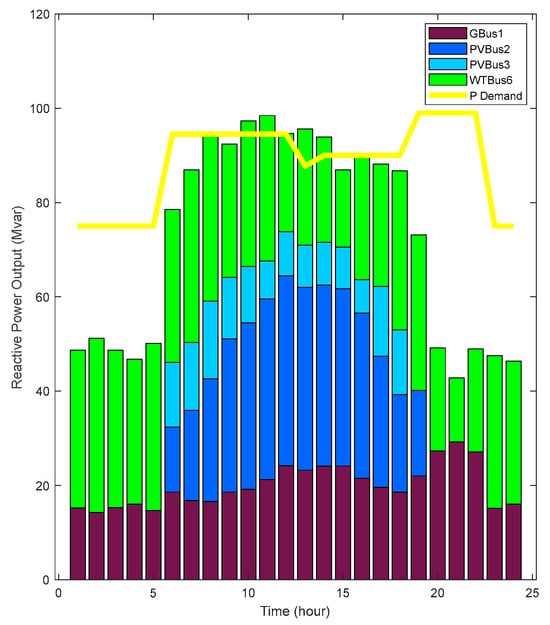
Figure 23.
Source reactive power in case 1.
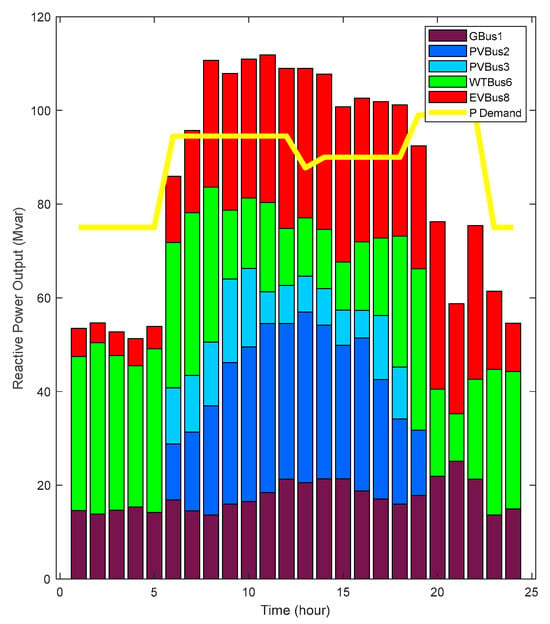
Figure 24.
Source reactive power in case 2.
After comparing the active and reactive power outputs of the power supply in each scenario from Figure 21 to Figure 24, it was evident that the power capacity of case 2 was significantly better in meeting the load demand of the power grid.
During the daytime period of 6:00–18:00, the reactive power capacity of each power supply in case 2 greatly surpassed the reactive power required by the system. However, this excess reactive power is unnecessary in practice. Therefore, the reactive power capacity provided by electric vehicles can be utilized to replace a portion of the reactive power capacity needed for wind and solar power. As a result, the reduced reactive power output of wind and solar power can be increased to match their active power capacity. This surplus active power can then fulfill the excess load active power demand in the power grid, potentially replacing part of the active power output of the gas turbine for cost reduction. Additionally, it can be stored in the energy storage system for secondary utilization.
From 18:00 at night to 6:00 the following day, both case 1 and case 2 struggled to compensate for the system’s reactive power capacity. However, while ensuring the system’s power factor and voltage fluctuation, case 2 was able to compensate for a larger portion. During the period of 19:00–22:00, the active power output of the power supply in case 1 failed to meet the load demand. By appropriately utilizing the excess wind and solar capacity stored in the energy storage system during the day, not only can the active power demand of the nighttime system load be met, but also the night operation costs can be reduced by up to 2.59% compared to case 1.
5. Conclusions
In this paper, an energy dispatching model based on EVs as a distributed power supply was proposed to solve the problem of voltage fluctuation and power interaction fluctuation caused by a large number of distributed grid-connections and the widespread application of EVs. At the same time, the comprehensive influence of the EV reactive power support model was considered from the perspective of economy and safety. The numerical results showed that the energy scheduling decision considering EV reactive power supporting ability could improve the power quality of the grid, reduce the power generation cost of the power plant, and reduce the cost of electricity consumption. This work provides a flexible yet robust planning method for distribution systems with numerous PEVs in tend of V2X.
At present, the V2G mode of EV is gradually being widely accepted. However, the proposed model still has limitations, such as the small scale of the power grid structure in this paper, the type and behavior of EV models are not complete enough to describe the multi-stage dynamic uncertainty, and the parameter analysis index is only relatively basic in power system analysis. This represents one of our future research focuses.
Author Contributions
Writing—original draft, Y.F.; Writing—review & editing, J.Y. and W.J. All authors have read and agreed to the published version of the manuscript.
Funding
This research was funded by Shanghai Technology Innovation Project (21010501000).
Data Availability Statement
The data presented in this study are available on request from the first author.
Conflicts of Interest
The authors declare no conflict of interest.
References
- Zhang, M.; Chen, J.; Du, Z.; Wang, S.; Sun, H. Economic Operation of Micro-grid Considering Regulation of Interactive Power. Proc. CSEE 2014, 34, 1013–1023. [Google Scholar] [CrossRef]
- Hussain, A.; Bui, V.-H.; Kim, H.-M.J. Optimal operation of hybrid microgrid for enhancing resiliency considering fea-sible islanding and survivability. IET Renew Power Gener. 2017, 11, 846–857. [Google Scholar] [CrossRef]
- Ning, X.; Wang, T.; Chen, H.; Feng, D.; Han, L.; Wang, H.; Li, L. Reactive Power Voltage Optimization of Distribution Network Based on Goal Planning. Power Capacit. React. Compens. 2022, 43, 1–7. [Google Scholar] [CrossRef]
- Hu, Z.; Song, Y.; Xu, Z.; Luo, Z.; Zhan, K.; Jia, L. The Impacts and Utilization of Electric Vehicle Integration into the Power Grid. Proc. Chin. Soc. Electr. Eng. 2012, 32, 1–10+25. [Google Scholar]
- Zheng, L.; Wenbin, W.; Shengfeng, H.; Lijuan, L. Voltage adaptability of distributed photovoltaic access to a distribution network considering reactive power support. Power Syst. Prot. Control 2022, 50, 32–41. [Google Scholar] [CrossRef]
- Wu, X.; Sun, F.; Tian, W. Research on Reactive Power Optimization of Distribution Network with Distributed Generation. In Proceedings of the 2022 IEEE 6th Information Technology and Mechatronics Engineering Conference (ITOEC), Chongqing, China, 4–6 March 2022. [Google Scholar] [CrossRef]
- Yang, G.; Wang, Y.; Jia, Y.; Xu, G. Real-Time Reactive Power Regulation Capacity Assessment of DFIG Wind Farms. In Proceedings of the 2022 4th Asia Energy and Electrical Engineering Symposium (AEEES), Chengdu, China, 25–28 March 2022; pp. 974–978. [Google Scholar] [CrossRef]
- GB/T 36995-2018; Voltage Ride-Through Capability Test Procedures for Wind Power Units. National Standard of the People’s Republic of China: Beijing, China, 2018.
- Di Noia, L.P.; Mottola, F.; Proto, D.; Rizzo, R. Real Time Scheduling of a Microgrid Equipped with Ultra-Fast Charging Stations. Energies 2022, 15, 816. [Google Scholar] [CrossRef]
- Mao, L.; Zhang, Z.; Zhao, J.; Qu, K.; Li, F. Research Status and Prospects of Fusion Technology of Vehicle-Charging Pile-Power Grid. Trans. China Electrotech. Soc. 2022, 37, 6357–6371. [Google Scholar] [CrossRef]
- Zeng, B.; Li, Y.; Feng, J.; Zhang, J.; Liu, Z. A Combinatorial Planning Method for Distributed Generation and Intelligent Parking Lots Considering Reactive Supporting Capability of Electric Vehicles. Trans. China Electrotech. Soc. 2017, 32, 185–197. [Google Scholar] [CrossRef]
- Ding, T.; Lin, Y.; Bie, Z.; Chen, C.J. A resilient microgrid formation strategy for load restoration considering master-slave distributed generators and topology reconfiguration. Appl. Energy 2017, 199, 205–216. [Google Scholar] [CrossRef]
- Zhang, K.; Yin, Z.; Yang, X.; Yan, Z.; Huang, Y. Reactive Power Compensation of Power Grid Based on V2G Reactive Power Dispatching. Electr. Power Constr. 2018, 39, 40–47. [Google Scholar]
- Melhem, F.Y.; Grunder, O.; Hammoudan, Z.; Moubayed, N. Energy Management in Electrical Smart Grid Environment Using Robust Optimization Algorithm. IEEE Trans. Ind. Appl. 2018, 54, 2714–2726. [Google Scholar] [CrossRef]
- Hosseini, S.M.; Carli, R.; Dotoli, M. Robust Day-Ahead Energy Scheduling of a Smart Residential User Under Uncertainty. In Proceedings of the 2019 18th European Control Conference, Naples, Italy, 25–28 June 2019; pp. 935–940. [Google Scholar] [CrossRef]
- Tushar, M.H.K.; Zeineddine, A.W.; Assi, C. Demand-side management by regulating charging and discharging of the EV, ESS, and utilizing renewable energy. IEEE Trans. Ind. Inform. 2018, 14, 117–126. [Google Scholar] [CrossRef]
- Yang, Y.; Yang, P. The Hierarchical Modeling Approach for Centralized Control Microgrid Cyber Physical System. Trans. China Electrotech. Soc. 2022, 42, 7088–7102. [Google Scholar] [CrossRef]
- Mignoni, N.; Carli, R.; Dotoli, M. Distributed Noncooperative MPC for Energy Scheduling of Charging and Trading Electric Vehicles in Energy Communities. IEEE Trans. Control Syst. Technol. 2023, 31, 2159–2172. [Google Scholar] [CrossRef]
- Wang, J.; Yang, R. On the procurement and pricing of reactive power service in the electricity market environment. Electr. Power 2004, 3, 65–68. [Google Scholar]
- Cai, H.; Yang, J.; Feng, D.; Liu, J.; Zhong, J.; Zhang, L. Proposal for Reactive Power Pricing Policies at Demand Side. Autom. Electr. Power Syst. 2013, 37, 203–207. [Google Scholar] [CrossRef]
- Lu, Z.; Liu, Y.; Yang, F.; Geng, L.; Liu, M. Active power and reactive power optimal dispatch of microgrid considered reactive power rewards and penalties charge. Acta Energiae Solaris Sin. 2020, 41, 51–59. [Google Scholar]
- 2023 New Energy Electric Vehicle Sales Ranking. Available online: https://www.modiauto.com.cn/rank/ (accessed on 27 February 2023).
- Chang, X.; Song, Z.; Wang, J. Electric Vehicle Charging Load Prediction and System Development Based on Monte Carlo Algorithm. High Volt. Appar. 2020, 56, 1–5. [Google Scholar] [CrossRef]
- Qian, K.; Zhou, C.; Allan, M.; Yuan, Y. Modeling of load demand due to EV battery charging in distribution systems. IEEE Trans. Power Syst. 2011, 26, 802–810. [Google Scholar] [CrossRef]
- Yao, W.; Chung, C.Y.; Wen, F.; Qin, M.; Xue, Y. Scenario-based comprehensive expansion planning for distribution systems considering integration of plug-in electric vehicles. IEEE Trans. Power Syst. 2016, 31, 317–328. [Google Scholar] [CrossRef]
- 14 Bus Power Flow Test Case. Power Systems Test Case Archive. Available online: https://labs.ece.uw.edu/ (accessed on 6 October 2023).
Disclaimer/Publisher’s Note: The statements, opinions and data contained in all publications are solely those of the individual author(s) and contributor(s) and not of MDPI and/or the editor(s). MDPI and/or the editor(s) disclaim responsibility for any injury to people or property resulting from any ideas, methods, instructions or products referred to in the content. |
© 2023 by the authors. Licensee MDPI, Basel, Switzerland. This article is an open access article distributed under the terms and conditions of the Creative Commons Attribution (CC BY) license (https://creativecommons.org/licenses/by/4.0/).