Abstract
Understanding and controlling the combustion of clean and efficient fuel blends, like methane + hydrogen, is essential for optimizing energy production processes and minimizing environmental impacts. To extend the available experimental database on CH4 + H2 flame speciation, this paper reports novel measurement data on the chemical structure of laminar premixed burner-stabilized CH4/H2/O2/Ar flames. The experiments cover various equivalence ratios (φ = 0.8 and φ = 1.2), hydrogen content amounts in the CH4/H2 blend (XH2 = 25%, 50% and 75%), and different pressures (1, 3 and 5 atm). The flame-sampling molecular-beam mass spectrometry (MBMS) technique was used to detect reactants, major products, and several combustion intermediates, including major flame radicals. Starting with the detailed model AramcoMech 2.0, two reduced kinetic mechanisms with different levels of detail for the combustion of CH4/H2 blends are reported: RMech1 (30 species and 70 reactions) and RMech2 (21 species and 31 reactions). Validated against the literature data for laminar burning velocity and ignition delays, these mechanisms were demonstrated to reasonably predict the effect of pressure and hydrogen content in the mixture on the peak mole fractions of intermediates and adequately describe the new data for the structure of fuel-lean flames, which are relevant to gas turbine conditions.
1. Introduction
High efficiency and low pollutant emissions are key benchmarks for the development of modern combustion devices. Unfortunately, these two aspects often appear to be mutually exclusive [1]. The solution seems impossible without transitioning to new types of fuel. The hydrogen enrichment of methane or natural gas (NG) is considered one of the most promising and viable alternative strategies to meet these complex goals in gas turbines and internal combustion (IC) engines [2,3,4]. The combination of methane/NG and hydrogen as a fuel can synergistically enhance their performance [5,6]. The addition of hydrogen results in reduced carbon emissions and an extended stability range. Methane/NG addition to pure hydrogen, in turn, mitigates the challenges associated with the rapid combustion rate of hydrogen, low ignition energy and susceptibility to premature ignition [7]. Alongside rapidly emerging technologies for fuel production from biomass, hydrogen admixing can noticeably reduce our carbon footprint and expedite the transition to carbon-neutral energy [8].
Decades of engineering have attuned combustion devices to operate only on specific fuel types. Gas-operated devices often experience increased sensitivity when hydrogen blending rates are raised, necessitating, therefore, technical adaptation. In this regard, investigations are needed to optimize and reconfigure combustors for the new fuels, and numerical simulations are indefeasible in predicting inherent physico-chemical effects in complex technical devices [2,9]. Despite the leading role of physical processes in such systems, combustion chemistry significantly affects the overall performance, and thus should be thoroughly implemented during simulation [10,11]. Numerous kinetic studies on methane–hydrogen combustion have been performed in recent decades, which is reflected in several overviewing papers [4,12,13], but a comprehensive review is beyond the scope of this paper. First of all, the main focuses were laminar burning velocities (e.g., [14,15,16]), ignition delay times (e.g., [12,17,18]), and flammability limits (e.g., [19,20,21,22]), since these parameters are crucial for the device engineering. Significant attention has also been paid to the influence of hydrogen addition on the concentrations of key intermediates and final products during methane combustion/oxidation [23,24,25]. However, there have been significantly fewer experimental studies in this direction, which is likely due to experimental difficulties. Wang et al. [23] investigated the low-pressure flames of premixed methane/hydrogen mixtures with variable hydrogen fractions from 0% to 80% by means of the molecular-beam mass spectrometry (MBMS) technique with tunable synchrotron vacuum ultraviolet (VUV) photoionization. The authors measured the mole fraction profiles of labile intermediates and indicated the effects of additional H radical production on the peak concentrations of C1–C2 species. The mole fraction profiles of reactants, formaldehyde (CH2O) and ethylene (C2H4) were obtained during the oxidation of methane (50%)/hydrogen (50%) mixtures in a jet-stirred reactor (JSR) by Le Cong and Dagaut [24]. The authors found that the kinetic mechanism GRIMech 3.0 [26] overestimates the reactivity of the mixtures, particularly, at a high pressure, and provided a new detailed kinetic scheme. Katoh et al. [25] separated the distributions of OH radicals produced during either methane or hydrogen combustion using the isotope shift effect in planar laser-induced fluorescence spectroscopy (IS/PLIF). Due to the lack of experimental investigations, several numerical studies on chemical speciation in hydrogen-doped methane flames were conducted (e.g., [27,28,29,30]). These works were focused mostly on the concentration and pressure effects during combustion. The main effects are associated with the complex production of the key radicals, since different methane-based and hydrogen-based reactions are triggered [31]. The increased H radical transport from the reaction zone was also pointed out.
Notwithstanding progressing numerical methods and the growth of computing performance, a detailed calculation of chemical-kinetic processes in combustion chambers remains a difficult task. Taking into account detailed kinetic schemes implies solving stiff systems of hundreds and thousands of differential equations, which makes calculations not feasible at present [32]. In this regard, implementing reduced chemical kinetics mechanisms proves to be an optimal and reliable method for achieving a balance between essential chemical representation and saving computational costs [10,33]. Conventionally, mechanism reduction is usually carried out based on a set of targets, such as ignition delay times (IDT), laminar burning velocities (LBV), burnt gas temperature, heat release rate and concentrations of the main products (CO, CO2 and H2O). However, the specifics of hydrogen-enriched combustion are driven by the complex dynamics of radical chemistry and transport, and, therefore, a reduced mechanism should be able to effectively mimic the radical pool development. A certain interest is paid to the OH radical, which, along with formaldehyde, is commonly used for the LIF visualization of a flame front in complex combustion devices [34,35,36]. In this regard, a reduced kinetic mechanism suitable for large eddy simulation (LES) or direct numerical simulation (DNS) and able to quantitatively reproduce the distributions of H, OH, CH3 and CH2O is desirable.
Conventionally, chemical speciation in flames is an important object of study for the development and validation of detailed kinetic mechanisms. Information on the concentrations of individual intermediates enables an in-depth analysis of the formation and consumption pathways for specific flame components, such as radicals or pollutants. Along with global combustion parameters (like LBVs and IDTs), the chemical structure of flames reflects the system’s response to changes in external parameters, such as ambient pressure. It is well known that pressure can significantly influence flame chemistry, specifically the fate of a radical pool. In this context, explicit information about the mole fractions of individual radicals and intermediates is highly valuable. However, as illustrated above, the existing literature provides limited data on chemical speciation in the flames of methane and hydrogen mixtures. Although the impact of elevated pressure on chemical speciation has been studied in an ideal mixing reactor, there is no literature data on the influence of pressure on the formation of intermediates during combustion.
Therefore, the first goal of this work is to provide a set of experimental data on the chemical speciation of hydrogen + methane-fueled flames at various fuel-to-oxidizer ratios, hydrogen dilutions and elevated pressures. The second goal is to develop reduced kinetic mechanisms adequately reproducing the literature data available for combustion macroparameters (LBVs and IDTs) and the new flame structure measurements.
2. Experimental Methods
The chemical structures and temperature profiles of premixed CH4/H2/O2/Ar flames were measured experimentally using a molecular-beam mass spectrometric setup (MBMS). Combustible mixtures of three methane/hydrogen ratios (25/75, 50/50 and 75/25 by mol) were prepared at slightly lean (equivalence ratio of φ = 0.8) and rich (φ = 1.2) proportions. The argon dilution in all mixtures was 75%. Each flame of the corresponding mixture was investigated at 1, 3 and 5 atm. Therefore, 18 flames in total were scanned. Table 1 displays the composition of the unburnt gas blends.

Table 1.
Molar composition of the combustible mixtures in the experiments at 1, 3 and 5 atm.
A comprehensive description of the experimental setup and data processing is available in our previous works [37], and thus only the crucial details are presented in the present paper. The flames were stabilized on a flat-flame burner (Botha–Spalding type [38]) made of a perforated brass disc (9.7 mm in diameter and 1.5 mm thick) incorporated in a brass housing. The diameter of the burner holes was 0.2 mm, and the distance between their centers was 0.28 mm. The burner housing was equipped with a water-cooling jacket; the burner temperature was maintained constant at 368 K. During the experiments, the burner moved in the vertical direction with a micro-screw mechanism. The distance between the burner surface and the probe tip, i.e., the height above the burner (HAB), was controlled visually by a cathetometer; the accuracy of the HAB measurements was ±0.01 mm.
Gas flows were set using mass flow controllers (Bronkhorst). The linear velocity of the unburnt gas on the burner surface was chosen to provide a visually flat and stable flame surface and to ensure the temperature values in the post-flame zone of the flames studied were as close as possible.
To measure flame structures at 3 and 5 atm, the burner was placed in a high-pressure chamber pressurized with nitrogen. The chamber construction enabled the maintenance of the pressure values up to 10 atm. For optical access, the high-pressure chamber was equipped with a window that was fixed in a side flange. Nitrogen, used for pressurizing the chamber, was supplied through this flange to prevent water condensation on the window and, therefore, ensure its transparency during the experiments. A diaphragm pressure regulator, placed on the outlet line, was used to control the pressure inside the chamber with an accuracy of 1%. The chamber was equipped with a safety valve and a pressure gauge. The upper flange of the chamber was attached to the sampling probe flange of the MBMS setup.
After sampling, the gas probe formed a molecular beam that passed through the skimmer, modulator, and collimator before entering the ion source of the quadrupole mass spectrometer. The ion source performed soft and tunable electron-impact ionization, which minimized ion fragmentation for the majority of measured peaks. A specially designed tungsten cathode with a voltage drop compensation system provided an electron beam with a narrow energy spread (±0.25 eV). The energy of the ionizing electrons was selected individually for each species to ensure an optimal signal-to-noise ratio and to prevent interference from the fragmentation of other species.
Table 2 provides the measured species together with the values of the ionizing electrons energy as well as the calibration method for each species.
Table 2.
Measured species. IE—ionization energy [39]. E—energy of the ionizing electrons.
To convert the signal intensity (Ii) of i-th species to its mole fraction (Xi), an energy-dependent calibration coefficient (Si) is required. Argon dilution can vary between the experimental and calibration mixtures, and therefore, argon-normalized values were utilized for data processing. In this regard, a simple relation between Ii and Xi can be defined:
where Ii and Si should be chosen at the same energy of ionizing electrons.
Ii/IAr = Si/SAr ∙ Xi/Xar,
For the reactants (H2, CH4 and O2) and some stable intermediates (C2H2, C2H4, C2H6 and H2O2), calibration coefficients were obtained during direct calibration experiments with gas mixtures of known compositions. During the calibration experiments, the gas mixtures were preheated to avoid argon clustering. The values of the direct calibration coefficients were quasi-constant in the pressure range from 1 to 5 atm. The calibration coefficients for H2, H2O, CO and CO2 were obtained from the signals in the post-flame zone and O-element balance equations. To calculate the calibration coefficients for the remaining intermediate species (H, CH3, OH, CH2O and HO2), the method of relative ionization cross-section (RICS) was applied [40]. This method is based on the fact that the calibration coefficient is proportional to the ionization cross-section σi (E) at a certain electron energy E. Therefore, there is a proportional relation between the unknown calibration coefficient of an intermediate species (i) and the known calibration coefficient for the stable species, having the nearest molecular weight (j):
Si/Sj = σi(Ei)/σj(Ej),
The values of ionization cross-sections at a certain electron energy were taken from the NIST database [39].
Experimental errors for each species are also provided in Table 2. For such species as H2, CH4, H2O, CO, O2 and CO2, the uncertainty values were estimated as ±20% of their maximum mole fraction. For other species, the uncertainty values did not exceed ±50%. There are two main factors contributing to the uncertainty value: the measurement error of the mass peak intensity and the accuracy of calibration coefficient determination. The uncertainty of the mass peak measurements is mainly statistical and depends on factors such as background signal, the mole fraction of a certain species and setup sensitivity to a certain species. For the calibration coefficients obtained in the direct calibration experiments, the uncertainty values are lower due to similar sampling and detecting conditions. The calibration coefficients evaluated by the RICS method are less precise since the accuracy of ionization cross section determination is lower at energies close to the ionization potential of a certain compound.
Self-constructed S-type thermocouples (Pt/Pt + 10%Rh) were utilized for the temperature measurements [41,42]. The thermocouples were made from wires of 30 µm in diameter. The thermocouple surface was coated with a thin layer of SiO2 in order to prevent catalytic reactions. The junction of the thermocouple was fixed 0.2 mm upstream of the sampling probe, obtaining the “disturbed” flame temperature profiles. To account for radiation heat loss, corrections of the thermocouple readings were performed according to the procedure from Shaddix et al. [43]. The absolute experimental error did not exceed ±40 K. All the temperature profiles obtained were used as input data during the chemical kinetics simulations.
3. Modeling Details
3.1. Chemical Kinetics Simulations
To simulate the combustion parameters, the Ansys Chemkin-Pro v.17.0 [44] software was utilized. The ignition delay times were calculated using 0-D closed homogeneous reactor model, which considers the time-resolved chemical process proceeding in a closed reactor with a uniform distribution of all concentrations under a constant volume or pressure conditions. Laminar flame speed and flame structure calculations were performed with 1-D premixed laminar flame models, which solve the set of governing differential equations that describe the flame dynamics in the model with a uniform inlet flow, using different mathematical methods and provide a steady-state solution. In the case of a burner-stabilized flame, two boundary conditions were set: a fixed gas flow through the surface of the burner and its surface temperature. A burner-stabilized flame requires additional information on heat losses, and for this purpose, each flame was simulated using the experimentally measured temperature profile obtained for each experimental condition. In the case of a freely-propagating flame, the model considers a front-moving flame with a constant velocity toward the unburned mixture of a fixed composition and temperature. In this case, there are no heat losses (by definition), and thus the temperature profiles should be computed from the energy equation. The transport properties as well as thermodynamic parameters were obtained from the AramcoMech 2.0 mechanism [45]. All the computed solutions were mesh-independent.
3.2. Reduction in Kinetics Mechanism
For the development of a reduced mechanism suitable for various CH4/H2 fuel compositions, the modern and well-tested mechanism AramcoMech 2.0 with the corresponding conditions was selected [46]. The mechanism reduction was performed using the Mechanism Workbench v.1.0 software from Kintech Lab. [47], which utilizes an optimized iterative combination of several methods: directed relation graph (DRG), rate of production (ROP), and computational singular perturbation (CSP). The reduction procedure was performed using an adiabatic constant-pressure reactor, with various initial conditions: pressure—1, 3, 5 and 20 atm; temperature—varied between 1000 and 2000 K, with a step of 200 K; equivalence ratio of φ = 0.8, 1.0, 1.2; and hydrogen molar fraction in the fuel mixture—25%, 50% and 75%. To ensure the efficiency of the reduced mechanism after automated processing, careful attention should be paid to assigning reduction targets: these targets should be a set of reference parameters whose deviation range is limited by a relative or absolute value (tolerance). Firstly, to keep the general reactivity at the same level, two macro-parameters were added to the reduction targets: the ignition delay time (with a relative tolerance of 10%) and the maximum reactor temperature (with an absolute tolerance of 50 K). Secondly, since the interaction of the fuels in a two-component mixture occurs mainly through a radical pool, it is important to keep concentrations of these species at the same levels. Thus, for our purpose, we controlled the maximum values of following intermediates: H (5%), OH (10%), HO2 (10%), CH3 (20%), HCCO (20%), CO (10%) and CH2O (20%). After the application of the reduction procedure, a reduced kinetic mechanism named RMech1 was obtained. It comprises 30 components and 70 reactions, striking an optimal balance between size and the quality of the simulation results.
However, most computational fluid dynamic (CFD) simulations require even smaller kinetic mechanisms to minimize the demand on computational resources. To fulfill this goal, a comprehensive analysis of reaction rates and sensitivity coefficients for the mechanism RMech1 was performed, and the following measures were taken:
- (1)
- A set of species and reactions that are only important during low-temperature oxidation, namely, CH3O2H and CH3O2, were removed;
- (2)
- According to our previous studies [48], there are two most important reaction pathways of methane transformation in flames: CH4 → CH3 → CH3O → CH2O → HCO → CO → CO2, and CH4 → CH3 → C2H6 → C2H5 → C2H4 → C2H3 → C2H2 → HCCO → CO → CO2. The second pathway becomes important only in fuel-rich flames and was therefore removed. This included C2 hydrocarbons, singlet CH2(s) and all reactions involving them;
- (3)
- Since several paths of CH3 consumption in the previous modification were deleted, the concentration of CH3 concentration increased considerably. This resulted in higher flame speed values, particularly at elevated pressures. To compensate this effect, the pre-exponential factors of 3 reactions, identified via a sensitivity analysis, were modified. The rate constant of reaction CH3 + HO2 ↔ CH4 + O2 (R14) was increased 2 times, while the rate constant of CH3 + HO2 ↔ CH3O + OH (R19) were reduced by a factor of 2. Also, for the reaction CH3 + OH ↔ CH2OH + H (R17), the rate constants were reduced by a factor of 2, but only for pressures above 1 atm;
- (4)
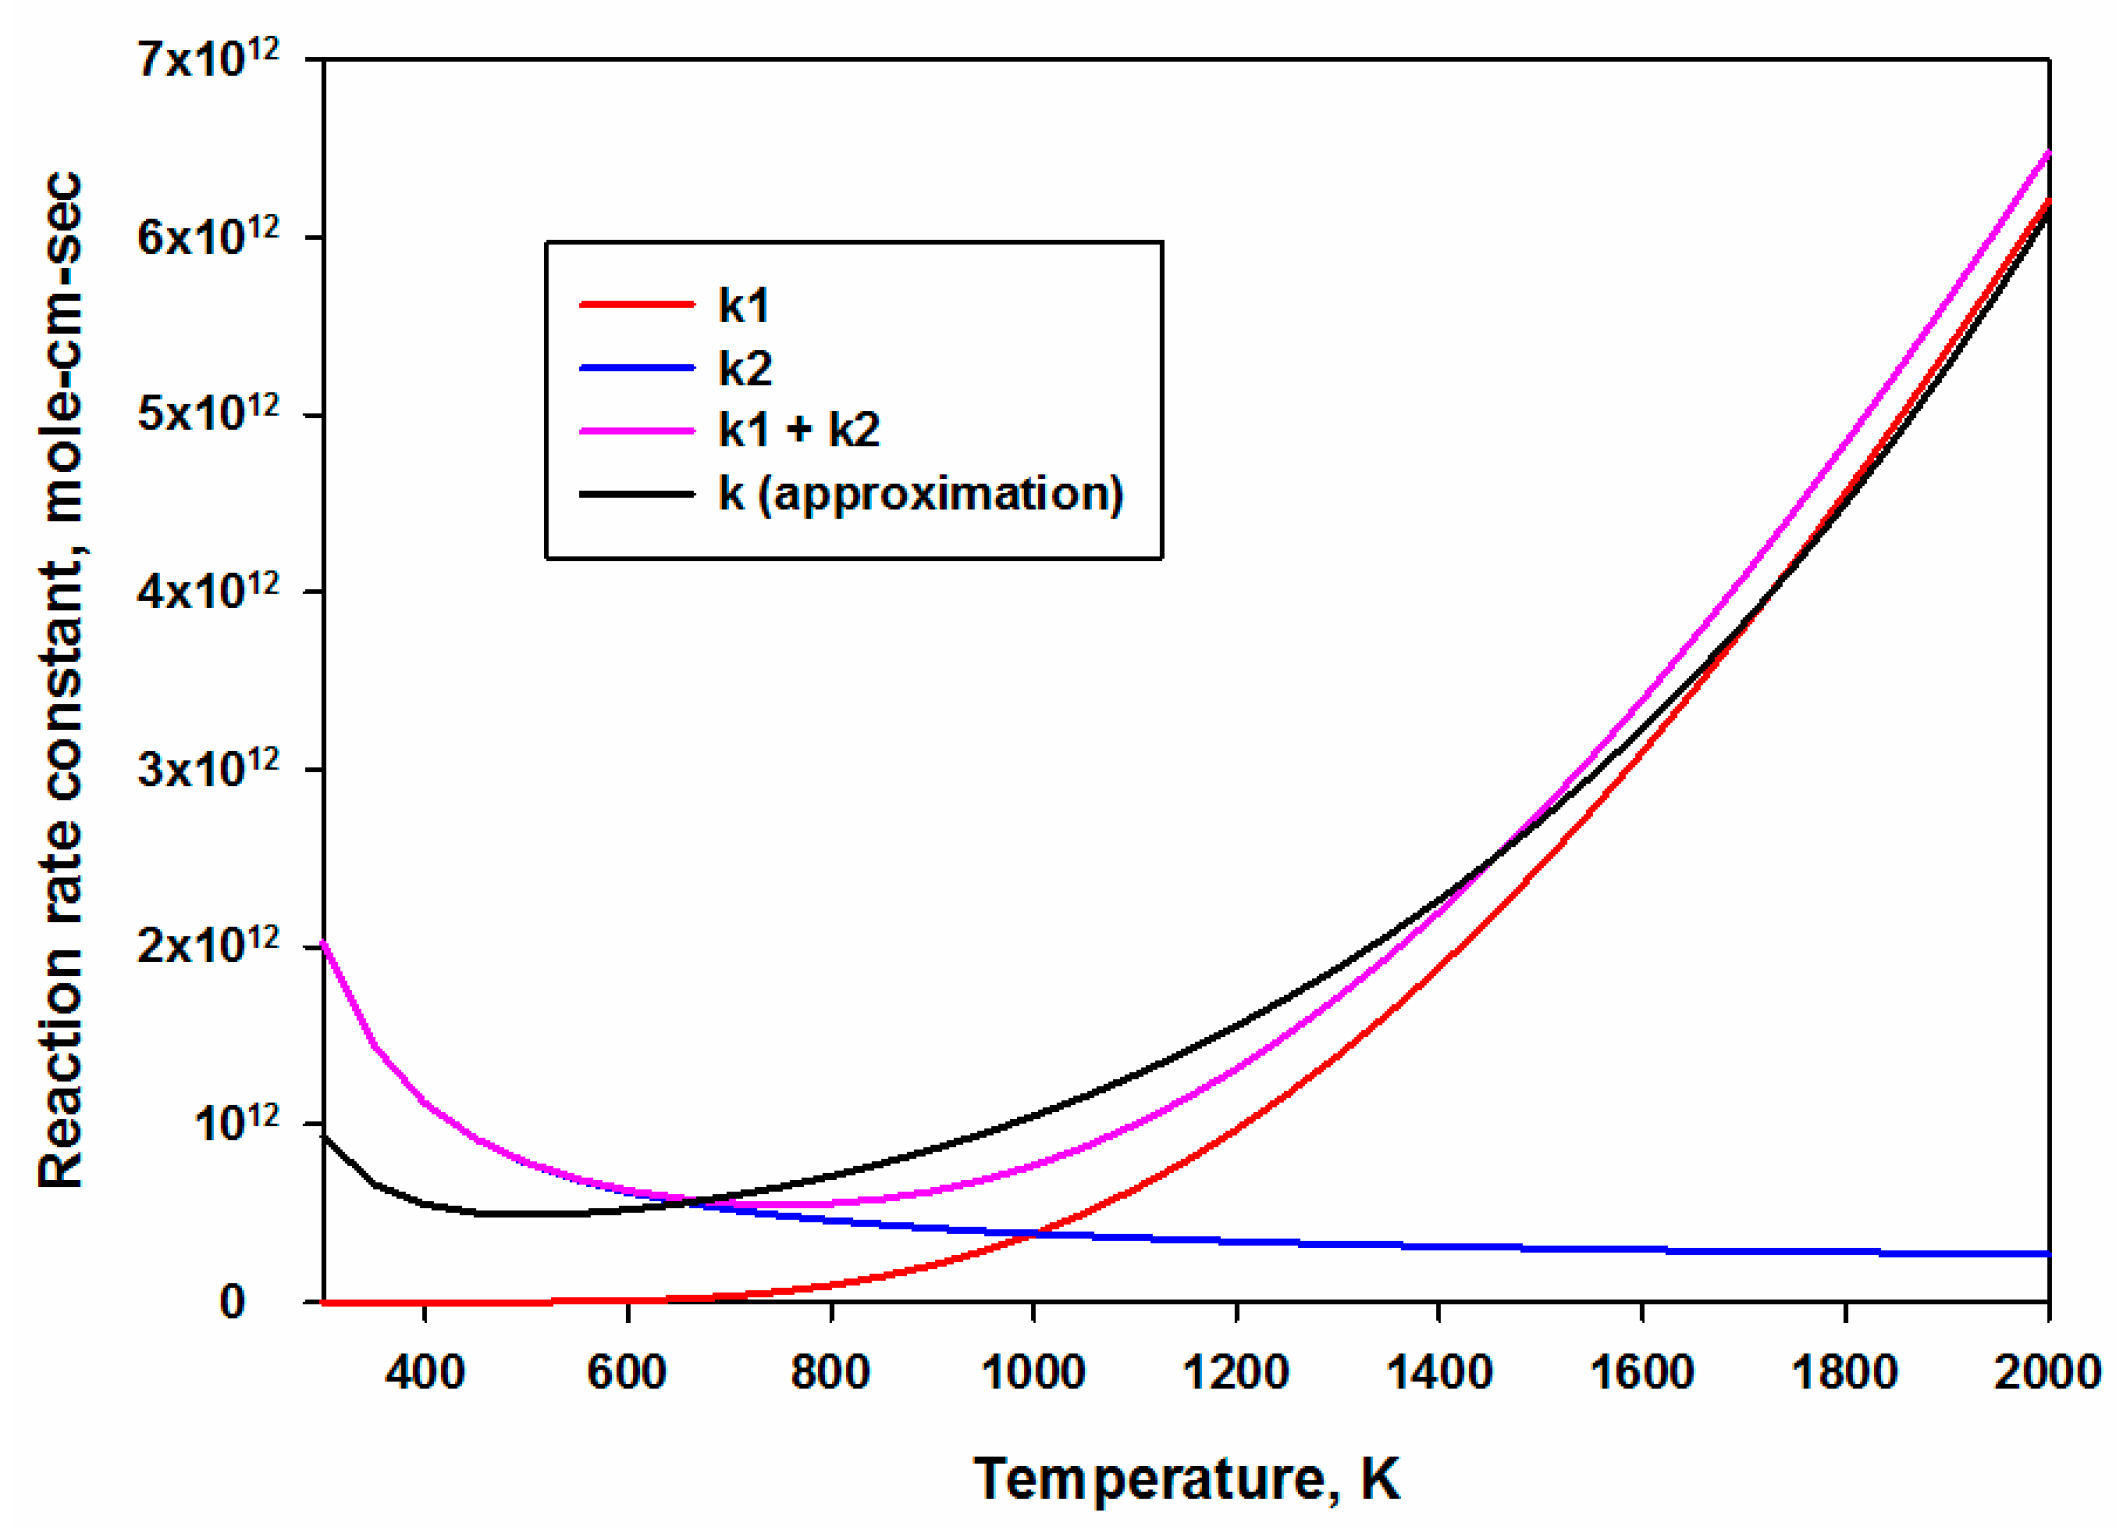
- The reaction rate constant of HO2 + HO2 ↔ H2O2 + O2 (R7) was initially expressed by two sets of reaction rate parameters, responsible for low and high temperature ranges. Both sets were merged and then approximated as a single set of reaction rate constants. Figure 1 shows the comparison between the sum of original reaction rates and the new approximated reaction rate.
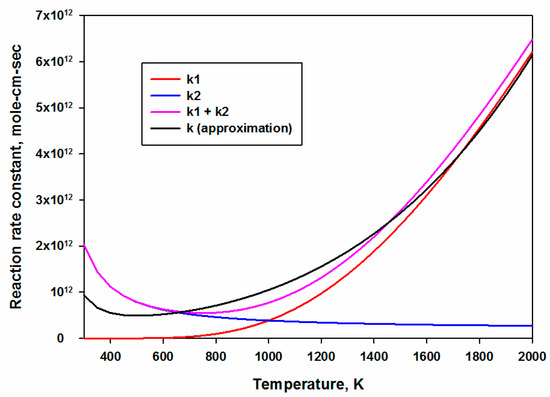 Figure 1. Reaction rate parameters of the reaction R7. The black curve corresponds to the resulting approximation.
As a result, the final version of the reduced combustion mechanism RMech2 consisted of 21 species and 31 reactions, presented in Table 3. Both reduced combustion mechanisms, RMech1 and RMech2, are available in CHEMKIN format in the Supplementary Materials.
Table 3.
The reduced mechanism RMech2 for the combustion of CH4/H2 fuel mixtures in near-stoichiometric conditions at 1–18 atm pressures. Rate constants are expressed in the form k = A∙Tb∙exp(−E/RT).
3.3. Validation of the Reduced Models against LBV and IDT
For the comprehensive validation of the reduced models, the flame structure measurements presented in this paper were supplemented with a range of literature-known experimental data, which were obtained at similar experimental conditions. This included the laminar burning velocity (LBV) measurements published by Moccia et al. [49] and Dirrenberger et al. [50] as well as the ignition delay time (IDT) measurements in a shock tube published by Zhang et al. [17] and by Cheng et al. [51]. For validation purposes, only the measurements corresponding to fuel mixtures with equivalence ratios ranging from 0.8 to 1.2 and hydrogen content in the fuel mixture between 25% and 75% were chosen from these publications.
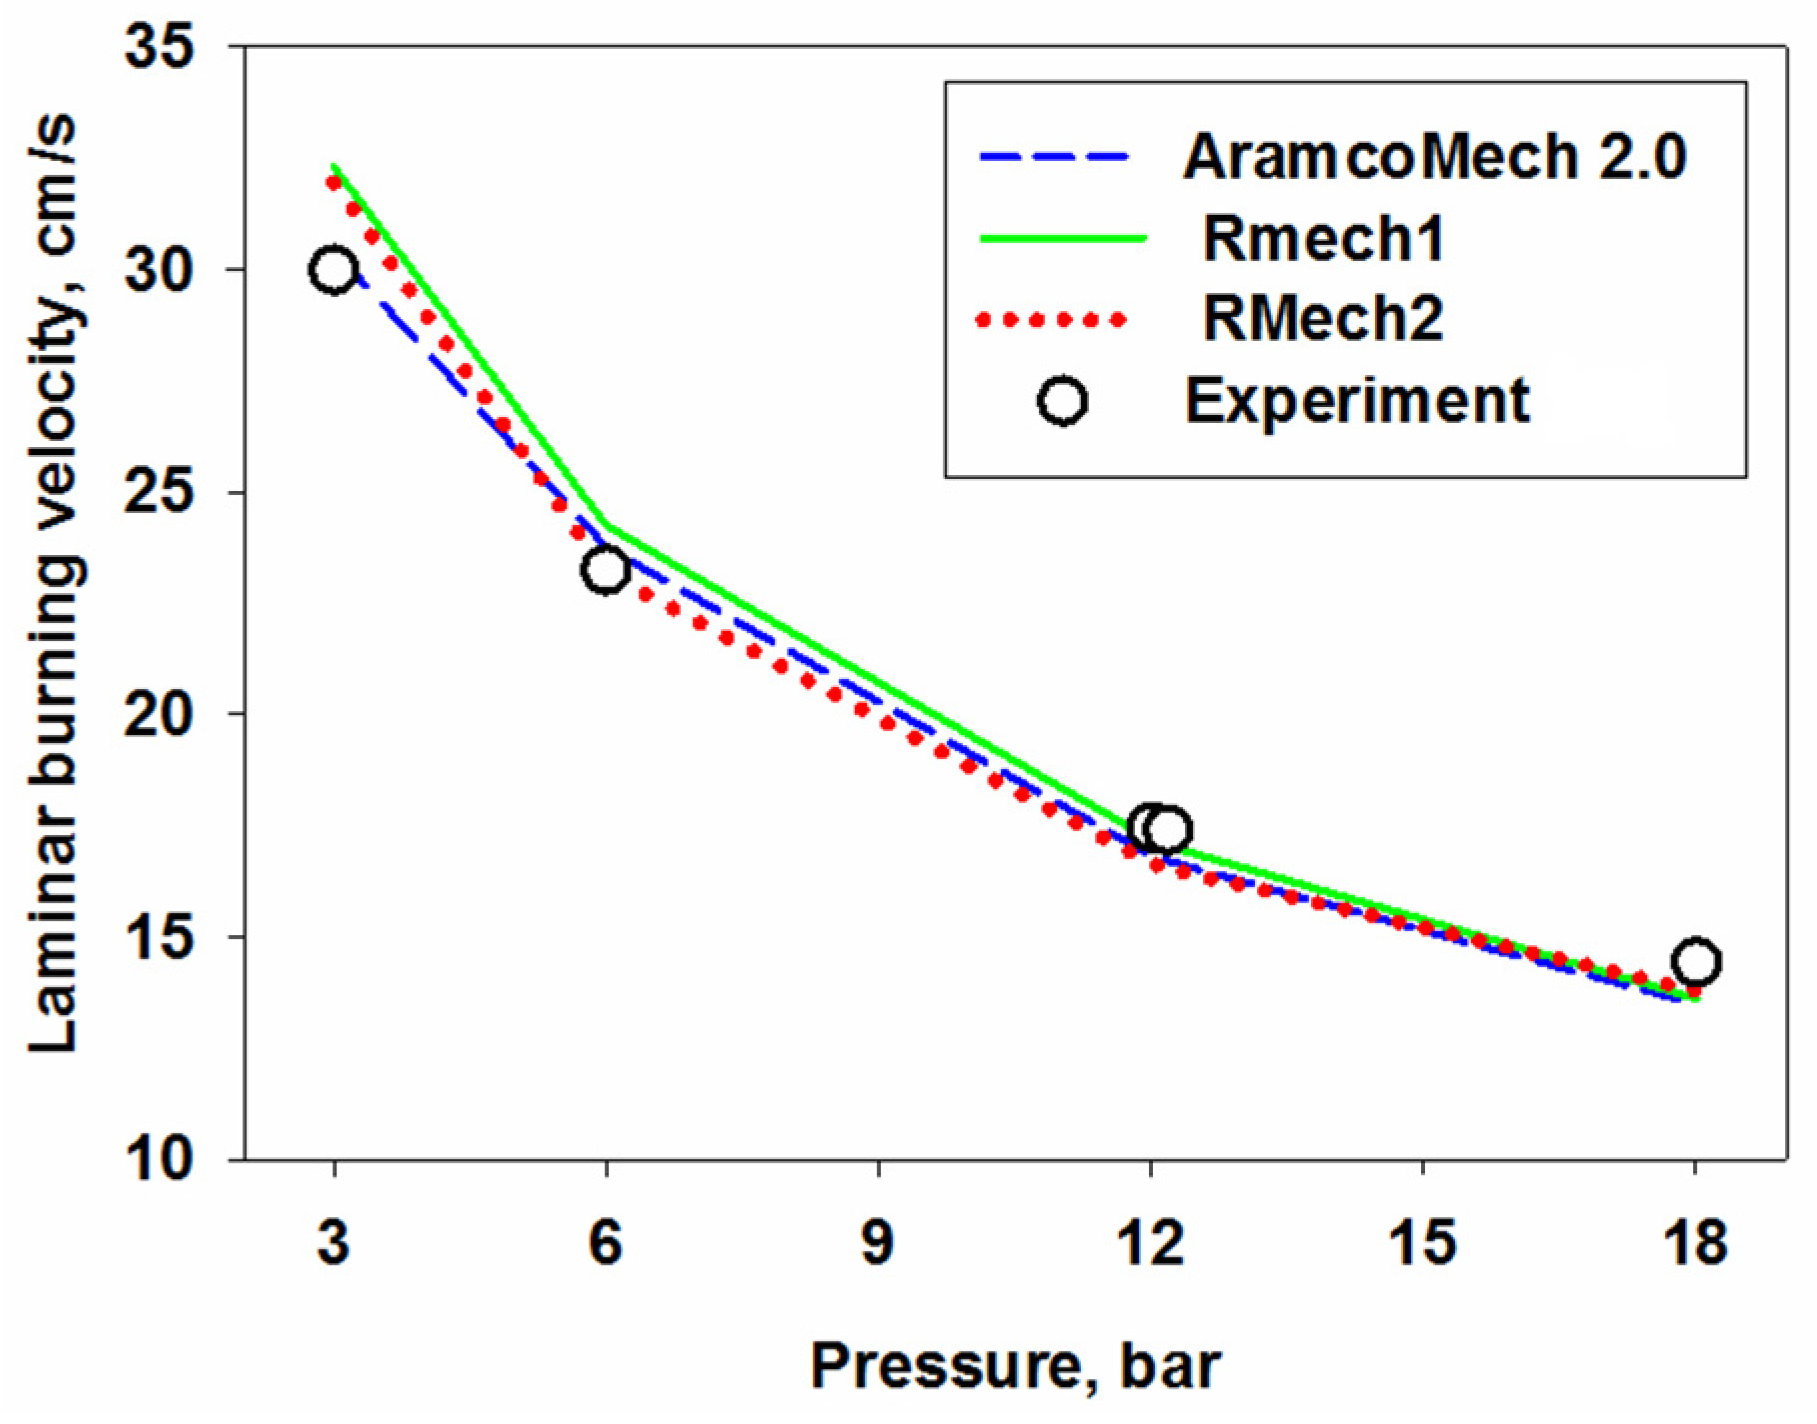
Figure 2 compares the LBV predictions of the reduced mechanisms RMech1 and RMech2 with those of the full-set mechanism AramcoMech 2.0 and corresponding experimental data from [49]. These data were obtained for the stoichiometric air-fuel mixture with 30% of hydrogen. The initial temperature was T0 = 293 K. As it can be seen, both reduced models effectively capture the trend of LBV variation with the increase in pressure. Only a slight overestimation was observed for the case of 3 bars.
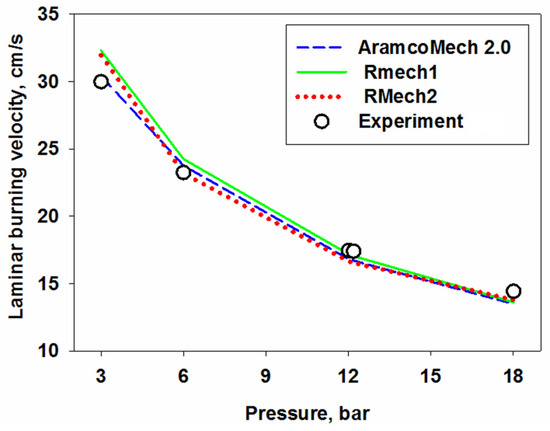
Figure 2.
Comparison between LBVs predicted by the reduced models RMech1 and RMech2, full-set model AramcoMech 2.0 and the experimental data from [49]: XH2 = 30%, T0 = 293 K, stoichiometric air-fuel mixtures.
The effect of the hydrogen concentration was examined on the dataset from [50], obtained at atmospheric pressure. Three hydrogen concentrations from 30% to 67% at three stoichiometric conditions in the range of 0.8–1.2 were targeted. The comparison of the experimental values with the LBV predictions by AramcoMech 2.0, RMech1 and RMech2 is listed in the Table 4.
Table 4.
Comparison between LBVs predicted by the reduced models RMech1 and RMech2, full-set model AramcoMech 2.0 and experimental data from [50].
Both reduced schemes demonstrated a good performance against the full mechanism AramcoMech 2.0. All the values predicted by RMech1 and RMech2 did not deviate more than 5% from the AramcoMech predictions. However, the predictive capability of AramcoMech itself has been called into question for several data points, namely, for rich conditions and high hydrogen concentrations. This fact indicates the necessity of additional kinetic studies on hydrogen-enriched combustion.
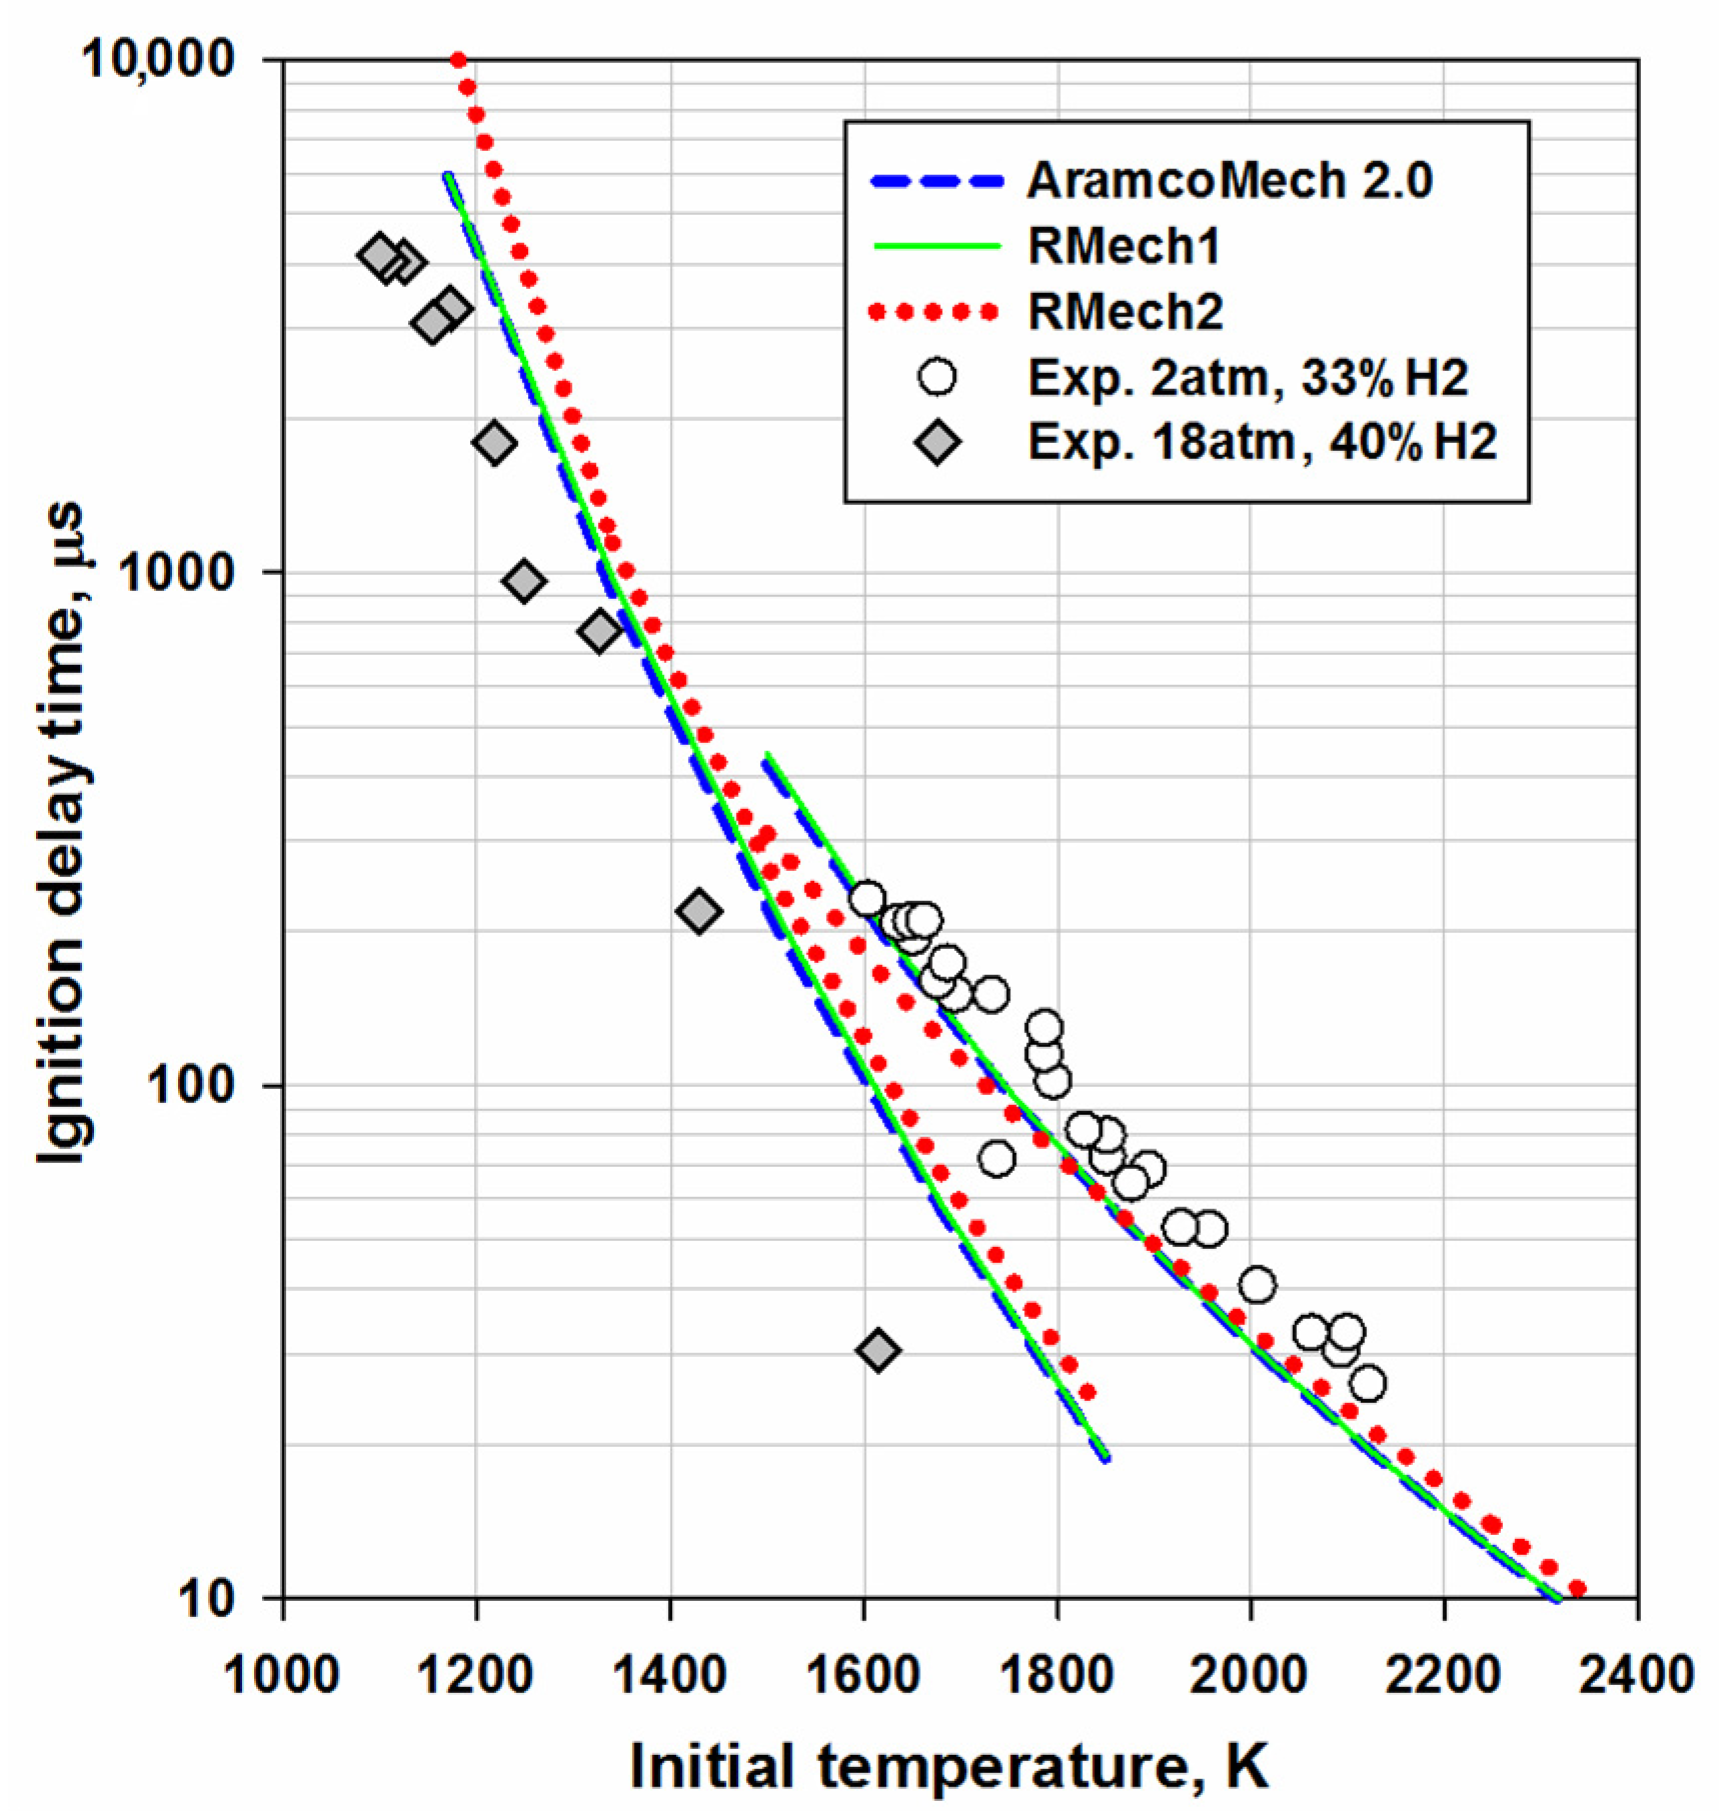
Figure 3 demonstrates the comparison between the IDT predictions of RMech1 and RMech2 and those of the AramcoMech 2.0, as well as the experimental data from [17,51]. The experimental data from Cheng et al. [51], corresponding to 50% of hydrogen and a pressure of 2 atm, were reproduced accurately by both the full mechanism AramcoMech 2.0 and the reduced model RMech1. The IDTs simulated by RMech2 turned out to be slightly underpredicted at temperatures below 1750 K. This outcome is evidently associated with the substantial contraction of the low-temperature reaction set.
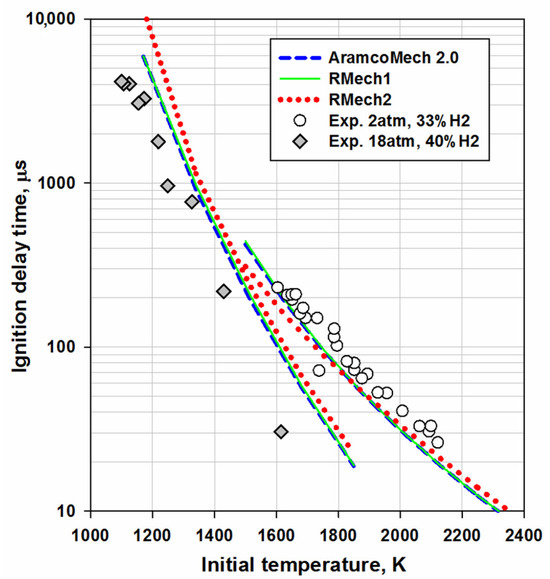
Figure 3.
Comparison between IDTs predicted by the reduced models RMech1 and RMech2, full-set model AramcoMech 2.0 and experimental data from [17,51].
IDTs from the work of Zhang et al. [17] were derived at the engine-relevant pressure of 18 atm. All simulations appeared to be moderately overestimated against the experimental measurements in the whole temperature diapason. For the mixture with 40% of hydrogen, the IDT predictions of AramcoMech 2.0 and RMech1 were consistent over the entire temperature range. The RMech2 predictions somewhat differed from the more complete models for temperatures over 1300 K. At lower temperature regimes, RMech2 diverged from the other models more markedly. Similar comparison figures for different concentrations of hydrogen in the mixture are provided in the Supplementary Materials.
4. Results and Discussion
The primary objective of this work was to systematically obtain new experimental data on the flame structure of CH4/H2 blends across a wide range of different parameters. Such data are very useful for the development and validation of kinetic models. In this section, the new experimental data for the structures of CH4/H2/O2/Ar flames at different equivalence ratios, hydrogen content and pressures are presented. The performances and deficiencies of the reaction mechanisms considered in this work in their ability to capture the experimental observations and tendencies are discussed. The species mole fraction and temperature profiles measured in all 18 flames are provided in the Supplementary Materials (Table S1).
4.1. Flame Temperature and Mole Fraction Profiles of Major Flame Species
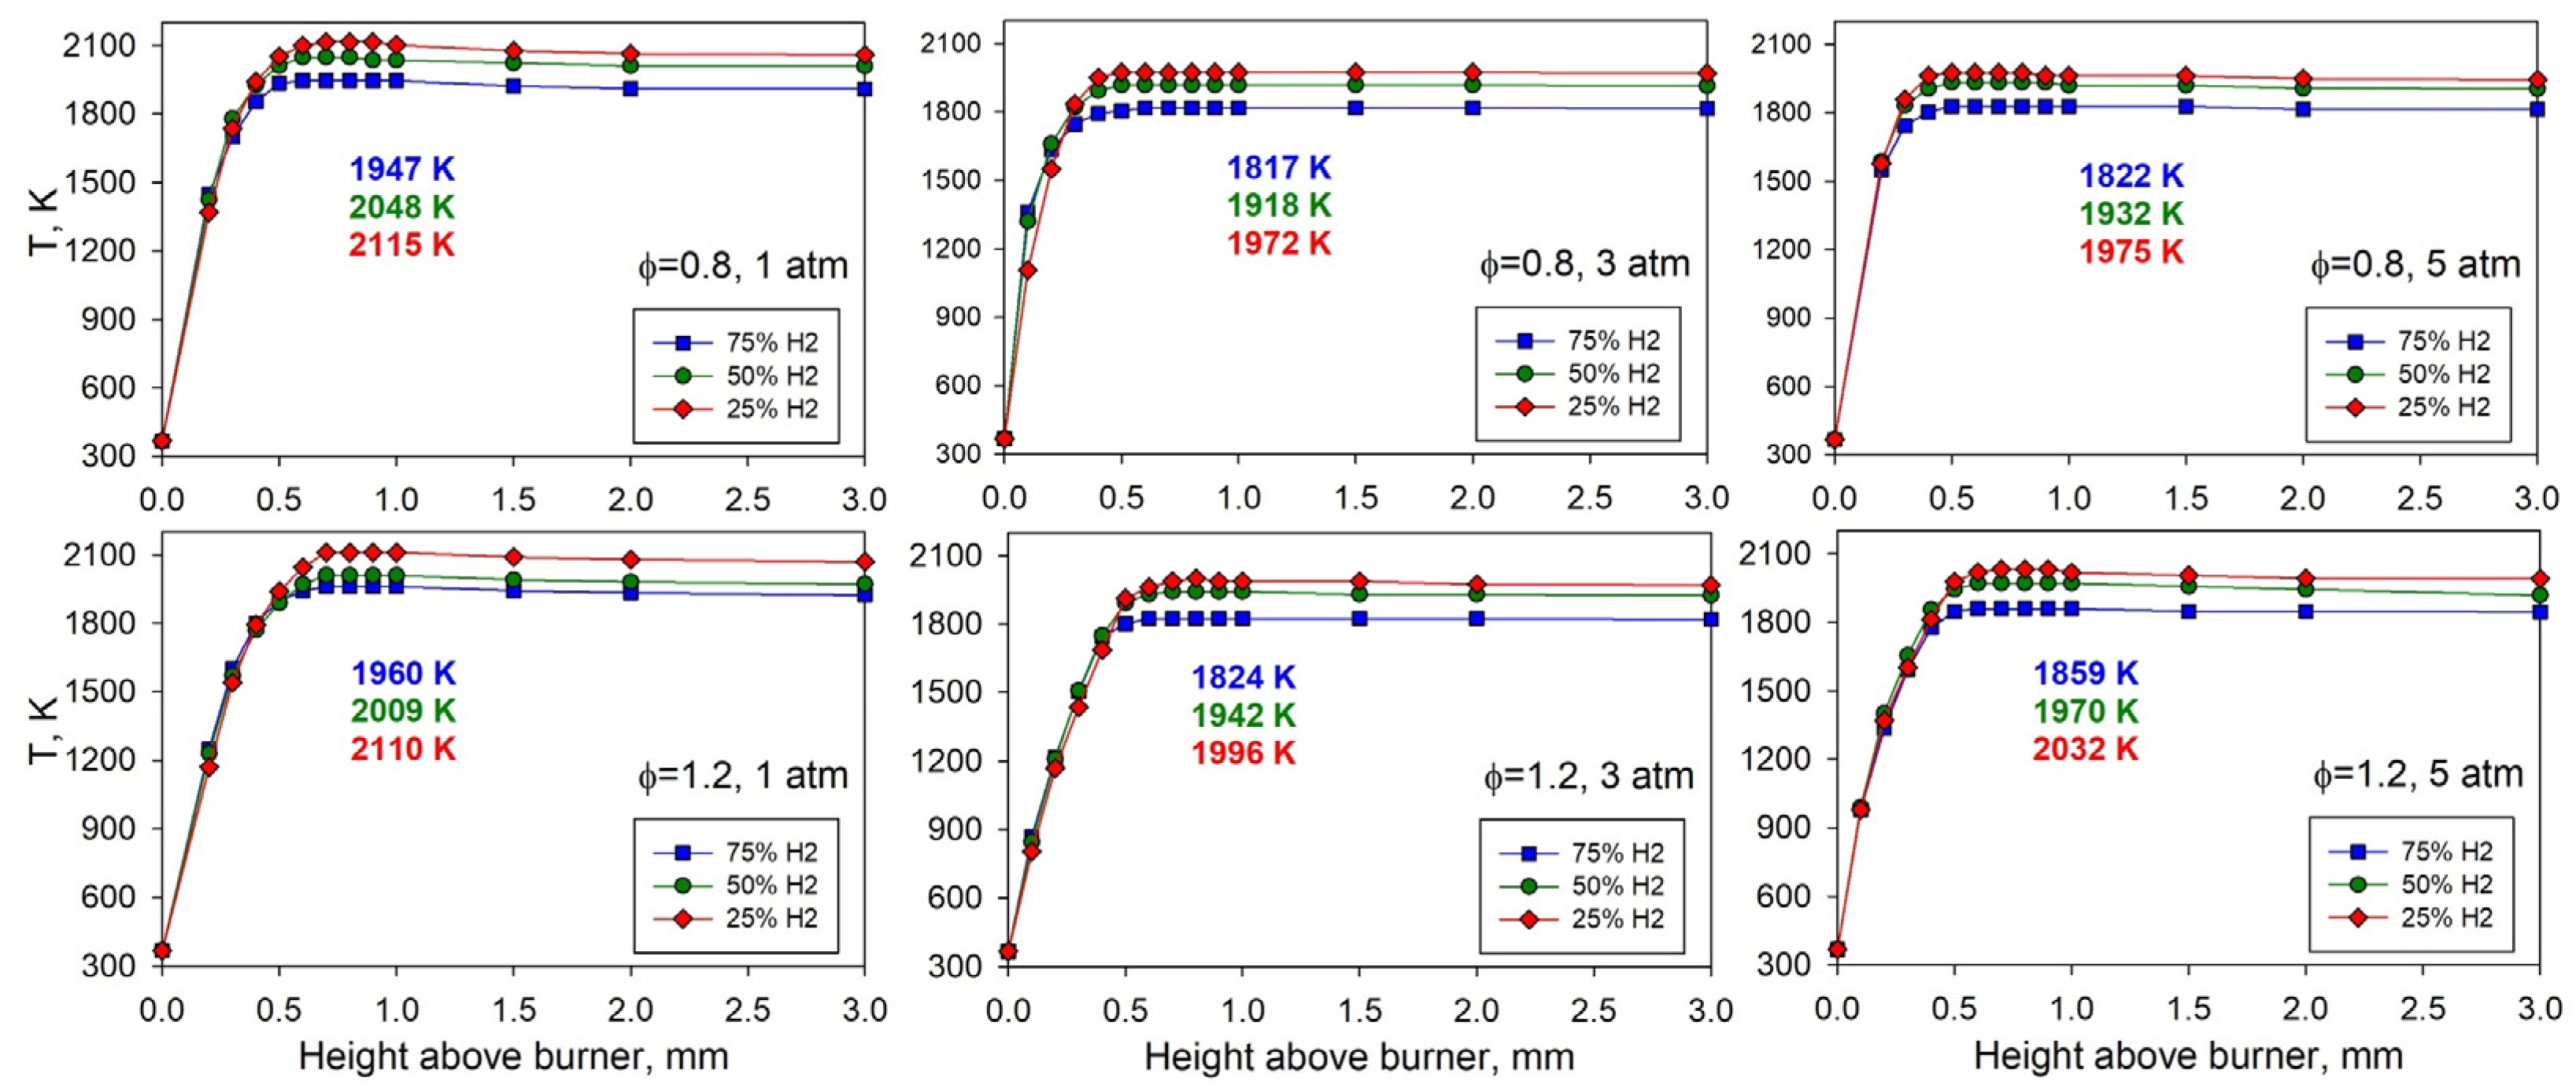
The temperature profiles measured in all CH4/H2/O2/Ar flames are presented in Figure 4. They are divided into six groups. Three temperature profiles in each group correspond to the flames with three different hydrogen contents (XH2) with all other conditions constant (pressure, total flow rate and equivalence ratio). The point with HAB = 0 mm was assigned a temperature equal to 368 K, corresponding to the temperature of the burner surface.
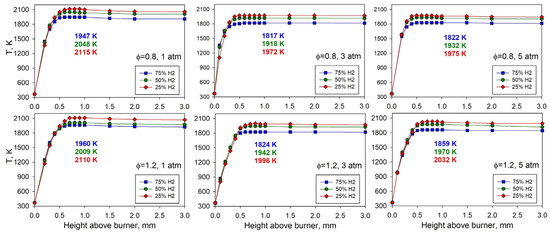
Figure 4.
Temperature profiles measured in all CH4/H2/O2/Ar flames. Numeric values show the maximum temperature reached in each flame.
It can be seen that the maximum temperature reached in the flame varies in the range of about 1820–2120 K, i.e., in some cases, it exceeds the maximum temperature that the S-type thermocouple can withstand (~2020 K for short-term exposure). However, it should be noted that the thermocouple junction experiences a lower temperature than the surrounding gas due to heat loss to radiation. The latter is taken into account as discussed in Section 2. The temperature correction for radiative losses in the flame reaches ~200 K due to the power dependence (~T4).
The following tendencies can be seen from the temperature profile measurements. First, contrary to what one might expect, a higher is hydrogen content in the fuel mixture shows a lower maximum flame temperature (with other constant conditions). This is, however, not surprising since the more hydrogen in the mixture, the higher the flame speed, and, therefore, the flame comes closer to the burner, which is also seen in Figure 4. This, in turn, results in the flame losing more heat into the burner, and as a consequence, the flame temperature decreases.
Second, the higher the pressure, the closer the flame is to the burner (in other words, the flame reaction zone narrows), i.e., the position where the maximum flame temperature is attained shifts toward the burner. This is especially notable when the pressure rises from 1 atm to 3 atm. For example, the reaction zone width of the lean flame with XH2 = 25% reduces from 0.7 to 0.5 mm when switching between these pressures. This is because the linear velocity of the unburnt gas decreases with a decrease in pressure (~1/p), since the mass flowrate of the unburnt mixtures is kept constant at different pressures (with other parameters fixed), thus causing the flame to be pressed against the burner surface.
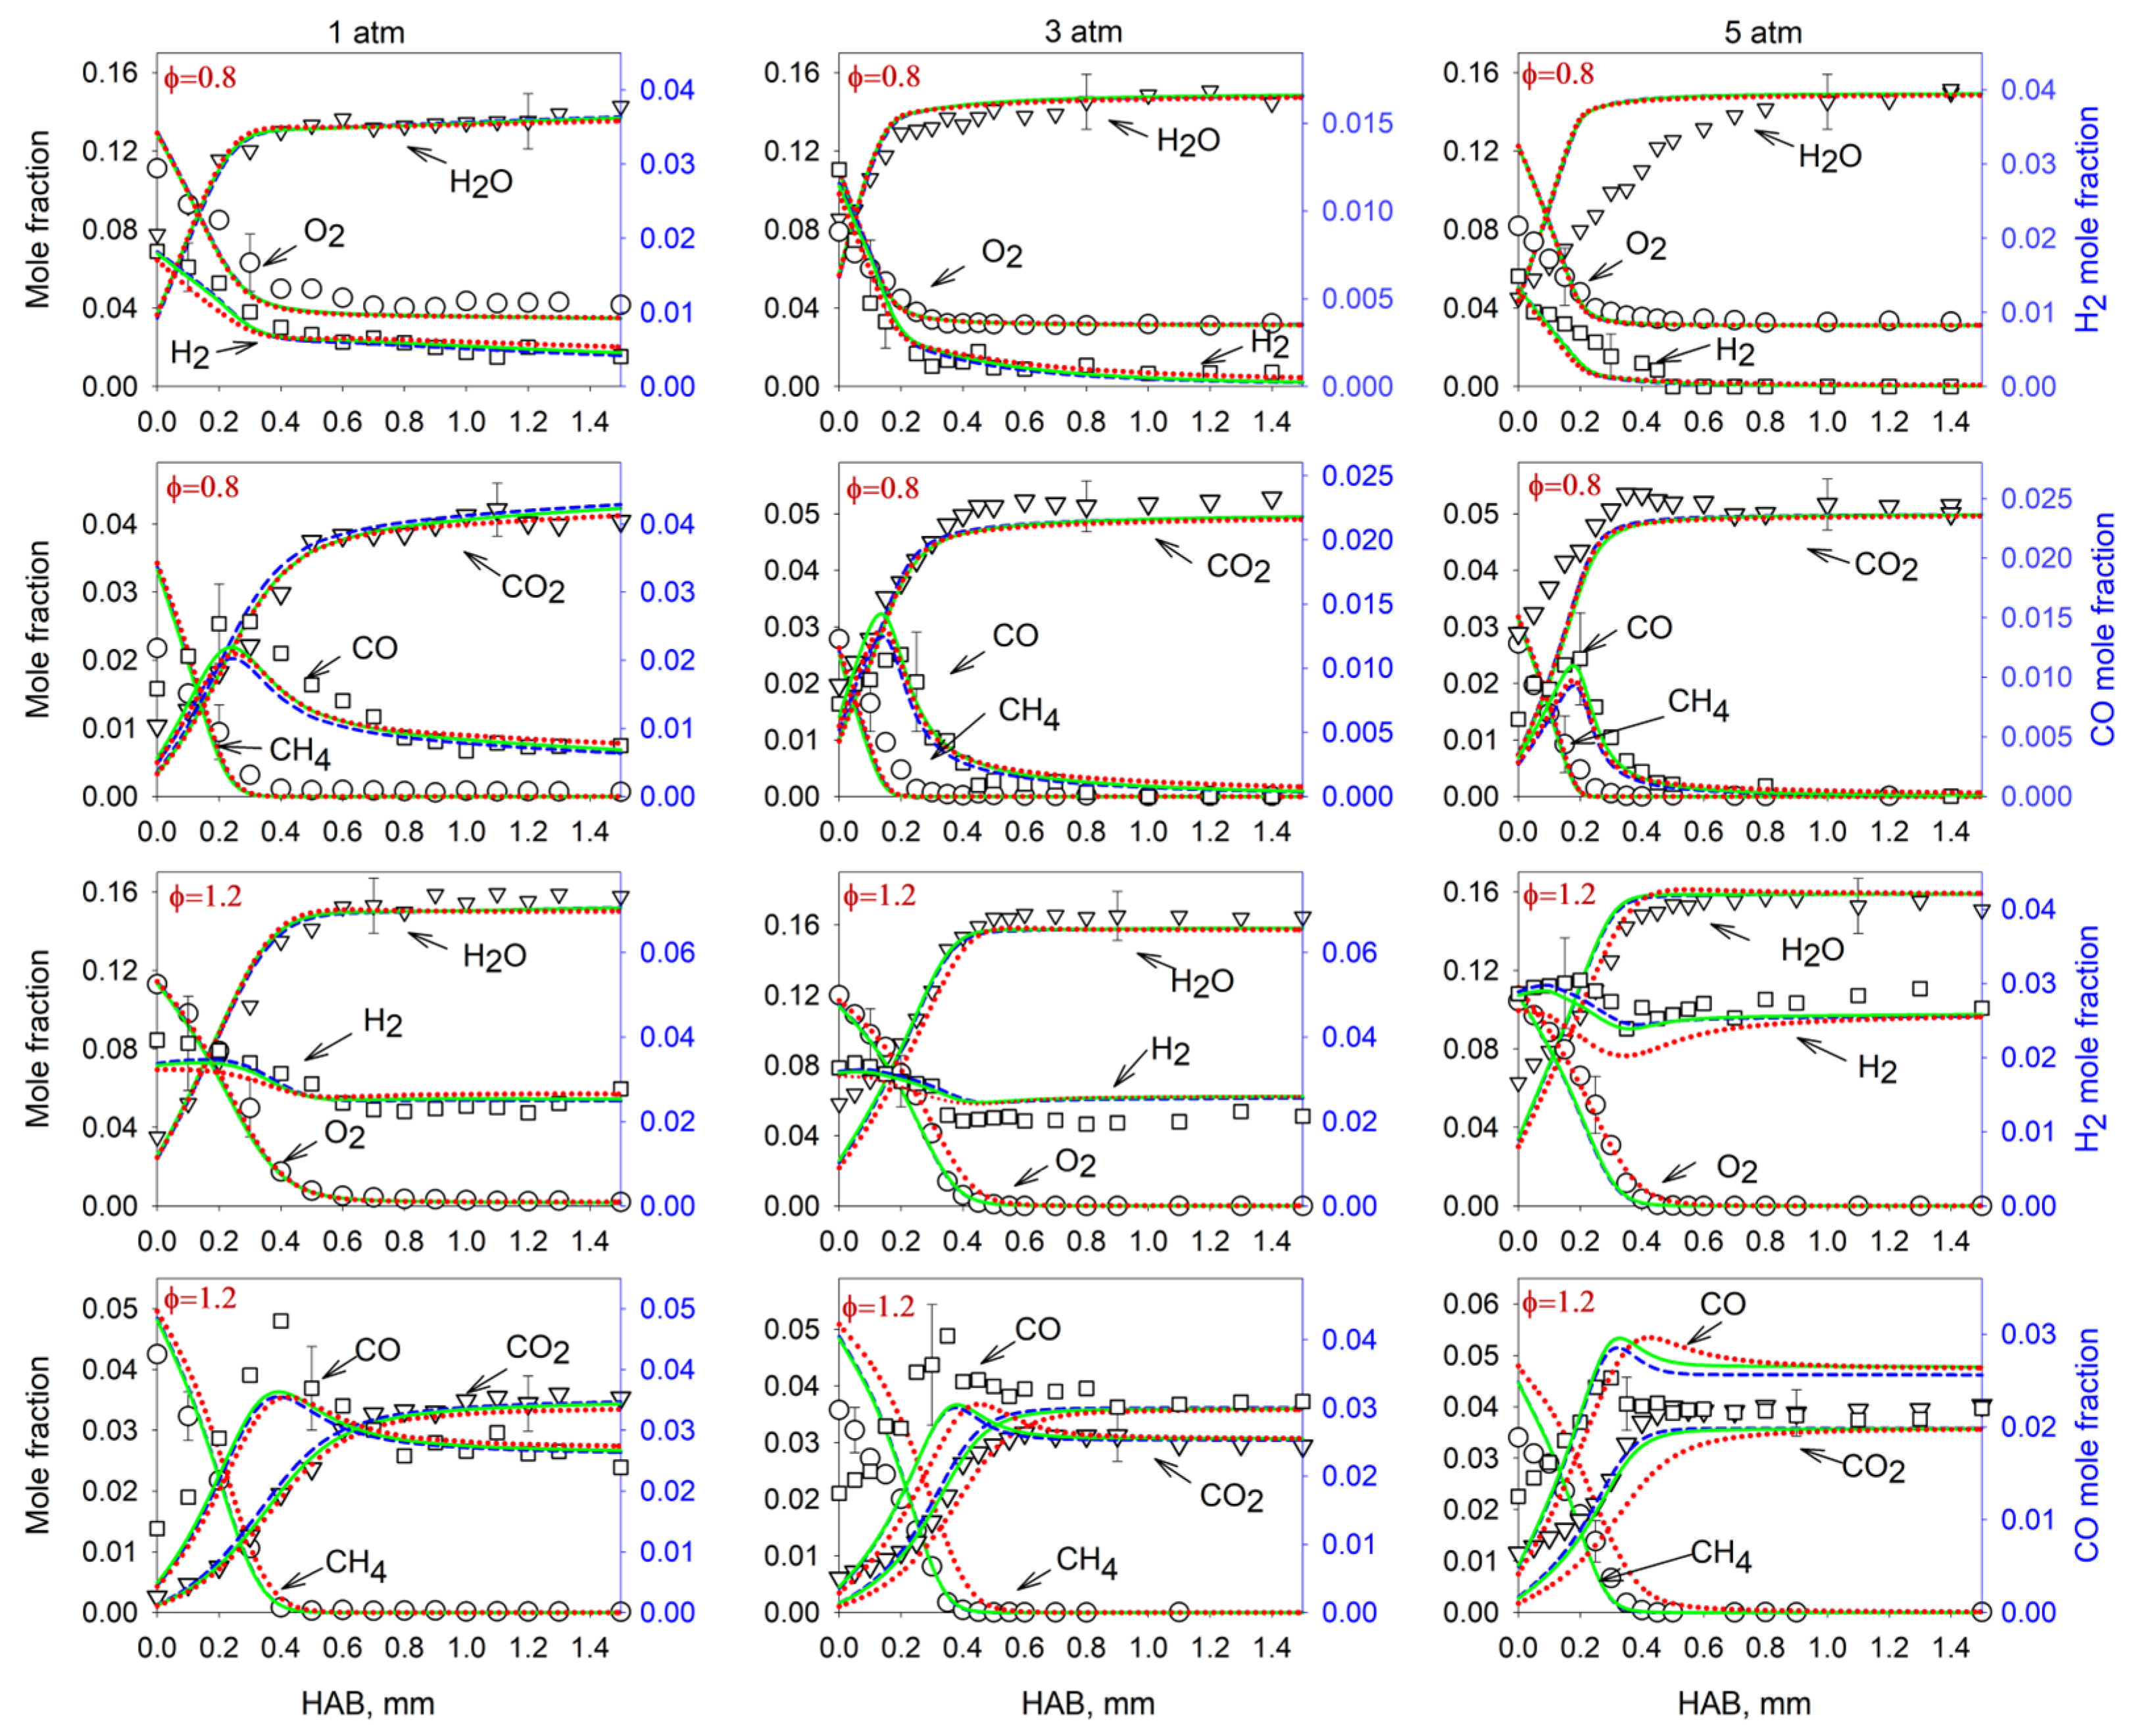
Very similar tendencies with pressure and hydrogen content in the fuel mixture are also observed in the measurements and predictions of the spatial distributions of mole fractions of reactants (methane, hydrogen and oxygen) and major flame products (water, CO and CO2). A comparison of the experimental and simulated mole fraction profiles of these species in the flames with XH2 = 50% (p = 1, 3 and 5 atm; φ = 0.8 and 1.2) is shown in Figure 5 as a representative case. For the flames with XH2 = 25% and XH2= 75%, similar data are provided in Appendix A (Figure A1). The profiles predicted by all three kinetic mechanisms are presented in the abovementioned figures.
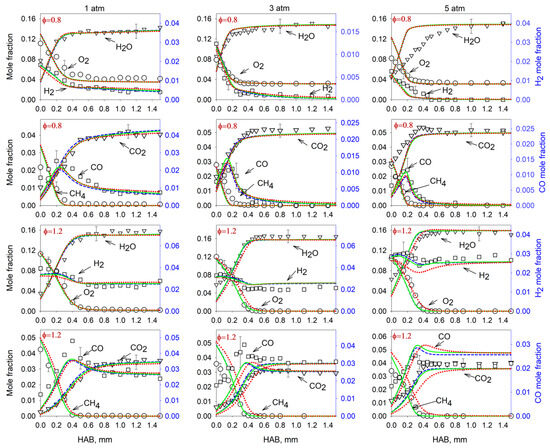
Figure 5.
Spatial mole fraction profiles of the major species in the flames with XH2 = 50% at the pressures of 1, 3 and 5 atm and φ = 0.8 and 1.2 (6 flames in total). Symbols: measurements; lines: simulation. Dashed (blue) line: AramcoMech 2.0; solid (green) line: RMech1; dotted (red) line: RMech2.
Figure 5 (as well as Figure A1) clearly show that all three models are quite adequate in predicting the measured mole fraction profiles of the major flame species. Nevertheless, it is worth noting that the predictions of AramcoMech 2.0 and the RMech1 model are identical for all conditions and throughout the flame zone, whereas the profiles predicted by the RMech2 mechanism within the flame zone are somewhat different in the flames with φ = 1.2. Furthermore, the discrepancy becomes greater with the pressure rise. This is obviously due to the reaction of CH3 recombination (CH3 + CH3(+M) ↔ C2H6(+M), included in both AramcoMech 2.0 and RMech1) increasingly contributing to the overall process of methane oxidation with the increase in the equivalence ratio and pressure (its rate constant is pressure-dependent). Since this reaction is missing from the RMech2 model, as it is the major pathway initiating the formation of C2 hydrocarbons, its predictive ability for the slightly rich flame is not quite adequate. However, it should be noted that, at atmospheric pressure, RMech2 provides a good fit to the experimental data and predictions of the models with a higher degree of detail. Therefore, the mechanism RMech2 can be expected to be quite reliable in predicting the distribution of major species under the fuel lean conditions that are typically experienced in gas turbines (φ ≤ 0.8).
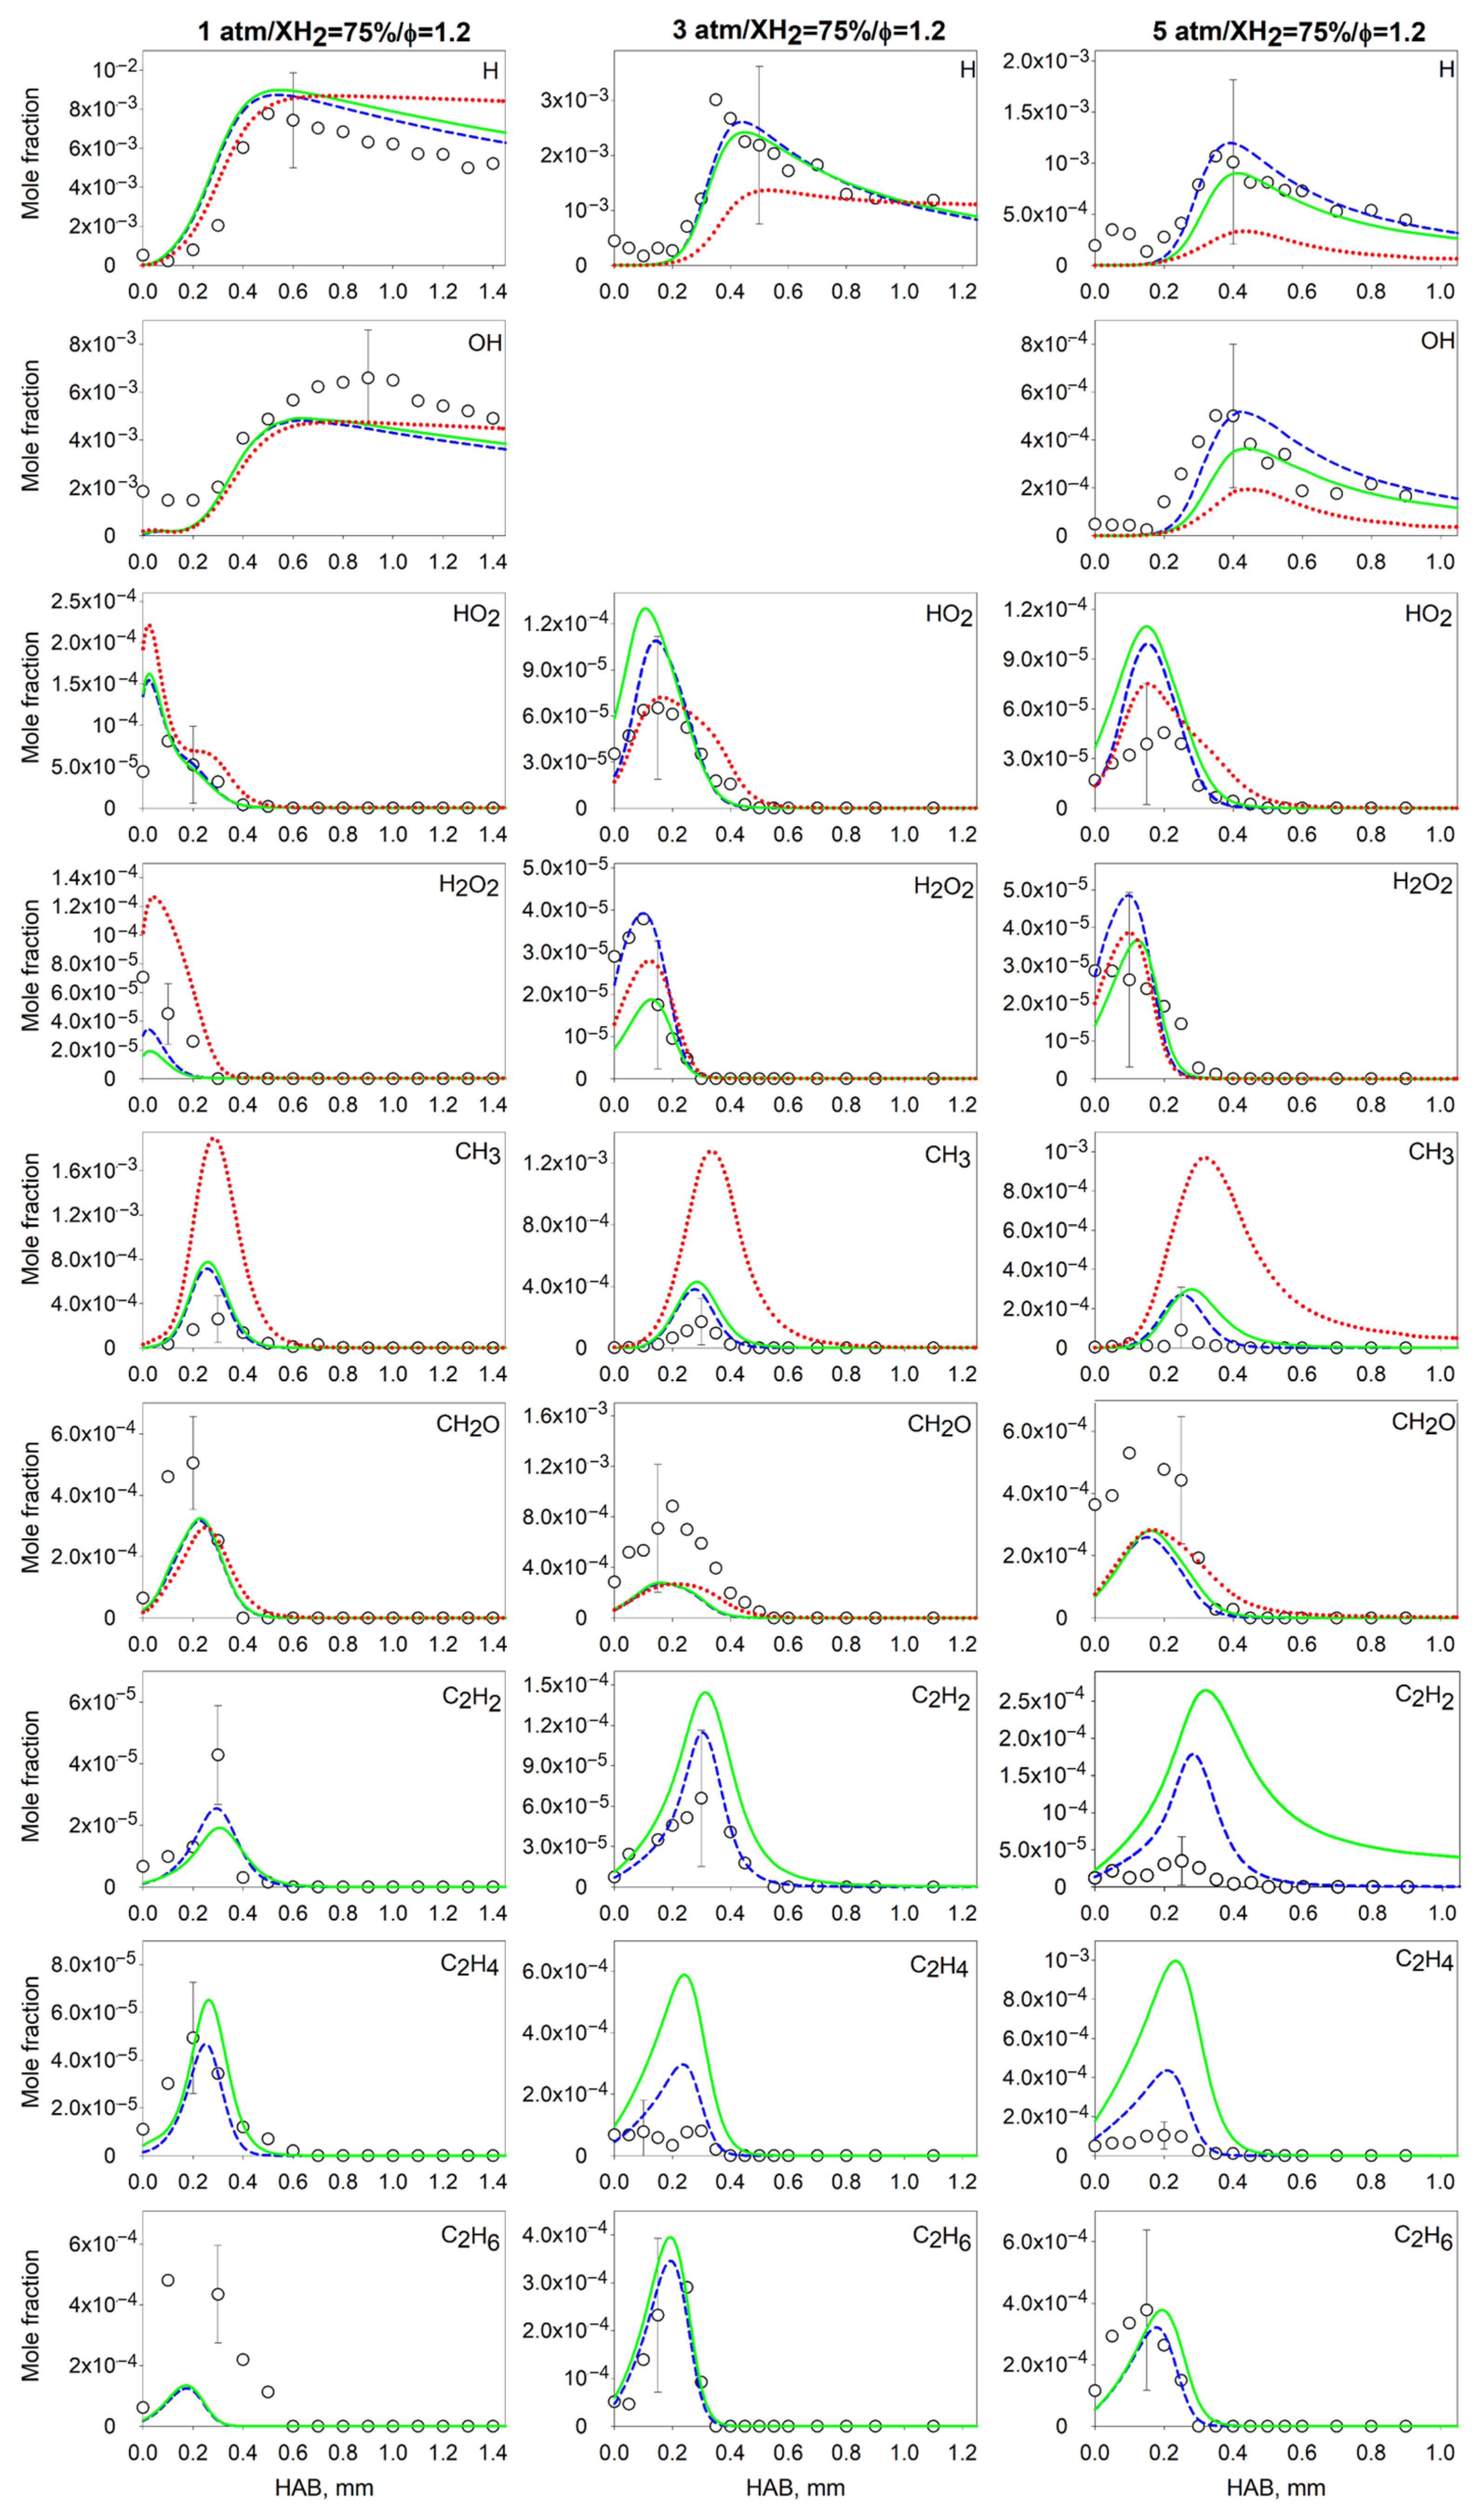
4.2. Measurements and Predictions of the Mole Fractions of Intermediates
Since a large number of mole fraction profiles for the intermediates were obtained experimentally in this work (six intermediates in nine fuel-lean flames and nine intermediates in nine fuel-rich flames; therefore, 134 spatial profiles in total), their comparison with the predictions by three kinetic models is presented in Figure A2, Figure A3, Figure A4, Figure A5, Figure A6 and Figure A7 in Appendix A. From these data, we derived the measured and simulated values of the peak mole fraction of the intermediates, as they are key parameters for the validation of the kinetic models. In this section, we first discuss how AramcoMech 2.0, the base detailed kinetic model considered in this work, captures the relevant experimental values. Then, we present an analysis of how the reduced model predictions deviate from the predictions of the detailed kinetic mechanism.
To assess the predictive ability of AramcoMech 2.0, for each measured intermediate species in the flames, we calculated a percentage deviation D of the predicted value of the peak mole fraction (Xsim) from the relevant experimental value (Xexp) using the following relation:
The resultant D-values are listed in Table 5 and Table 6 for the fuel-lean and fuel-rich flames, respectively. It should be noted that, in lean conditions the concentration of C2-hydrocarbons is much lower compared to fuel-rich conditions. Therefore, Table 5 contains no data for C2H2, C2H4 and C2H6. These tables also include the data for CO, which also peaks in the reaction zone in all flames studied, as seen in Figure 5 and Figure A1. Positive and negative D-values indicate that the model overpredicts and underpredicts the measurement data, respectively.
Table 5.
Percent deviation (D) of the peak mole fractions simulated with AramcoMech 2.0 from the measured values in the fuel-lean flames (φ = 0.8). The D-values were rounded to the nearest whole number.
Table 6.
Percent deviation (D) of the peak mole fractions simulated with AramcoMech 2.0 from the measured values in the fuel-rich flames (φ = 1.2). The D-values were rounded to the nearest whole number.
Table 5 and Table 6 clearly show that the predictions of the H, OH, HO2 and H2O2 peak mole fractions agree with the experimental data, in general, within the measurement uncertainty. While CO post-flame mole fractions in the flames are in reasonable agreement with the experimental data (see Figure 5 and Figure A1), its peak mole fraction is underpredicted, especially in fuel-rich conditions. We assumed that this is related to the fact that experimental values were overestimated due to the contribution of C2H4 to the mass peak m/z = 28 at 15.4 eV. Although this contribution was subtracted, the associated additional uncertainty in the pure CO signal in the reaction zone was inevitable.
It is noteworthy that, in all the 18 flames, AramcoMech 2.0 systematically overpredicts CH3 and underpredicts the formaldehyde peak mole fraction, with discrepancies for the latter significantly exceeding the experimental error (in some cases, greater than 200%). It is clear that the abundances of these species mutually influence each other in the flames of methane, since there are two major pathways of CH3 consumption: reaction with atomic oxygen to form formaldehyde, which plays a key role in fuel-lean conditions, and CH3 self-recombination to form ethane, predominating in fuel-rich flames.
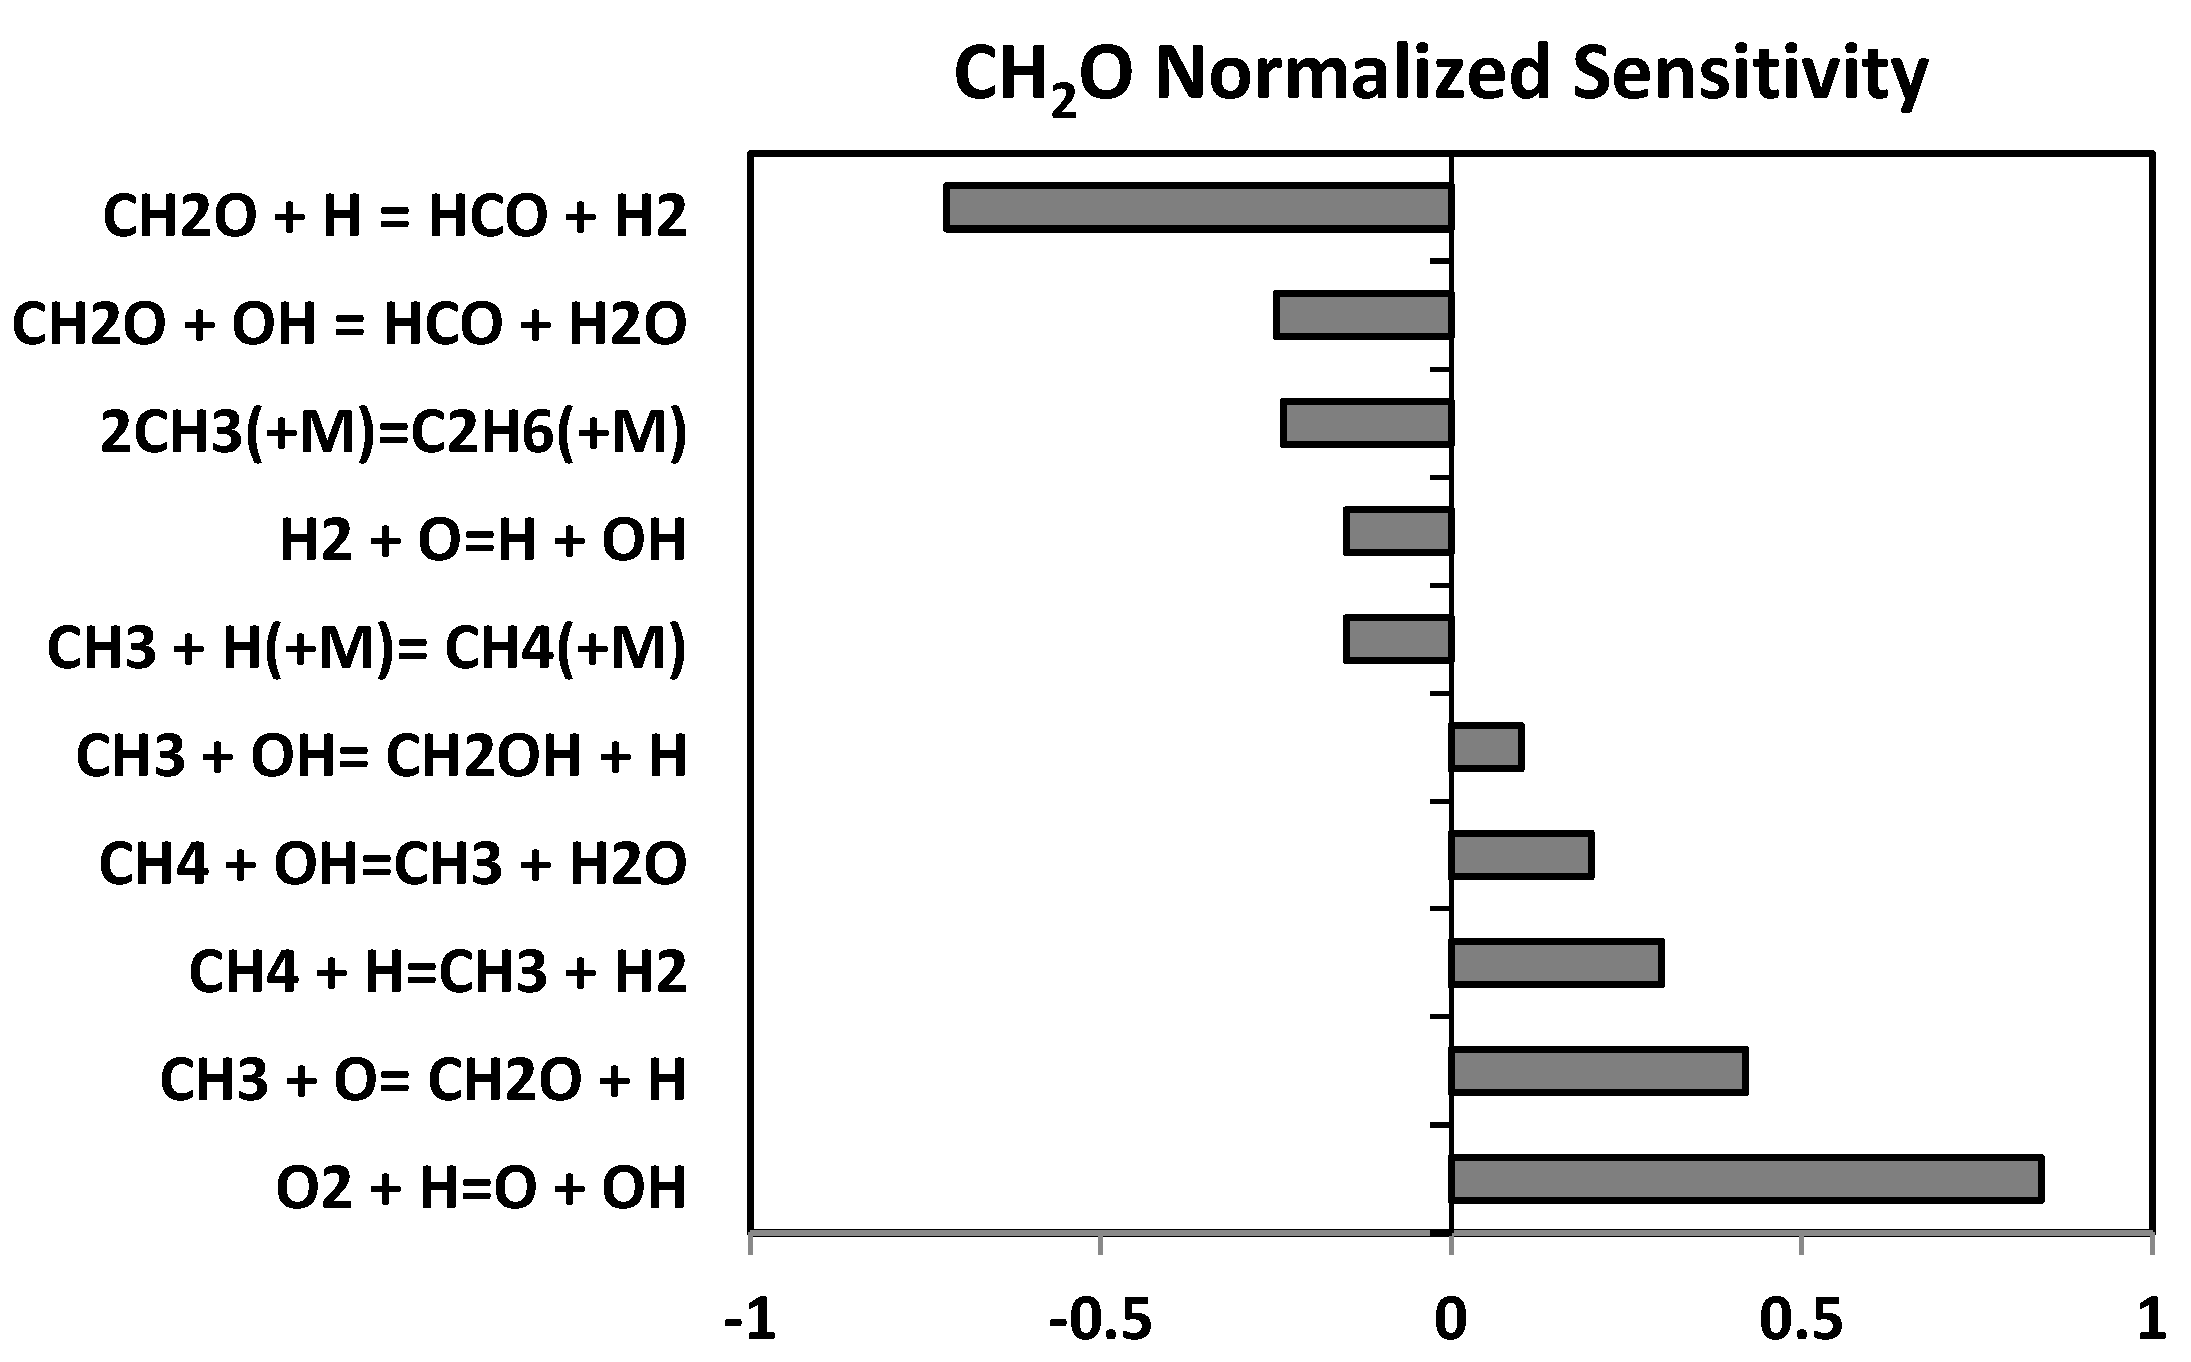
To reveal the reactions whose rates determine the formation and consumption of formaldehyde, we carried out a sensitivity analysis for HAB, where its maximum abundance was attained in the flame φ = 0.8/1 atm/XH2 = 50%. Figure 6 shows the resultant CH2O sensitivity coefficients calculated using AramcoMech 2.0. As it can be seen, there are two key reactions, one of which (responsible for its consumption) is H-abstraction from CH2O by the hydrogen atom to form a formyl radical, and the other one is the chain-branching reaction that plays a dominant role in the general combustion process. The abovementioned reaction of CH2O formation via the interaction of CH3 and O radicals, as observed, exhibits a lower sensitivity. Therefore, to improve the prediction of CH2O concentration in the flames, the rate constant of the reaction CH2O + H ↔ HCO + H2 needs to be revised.

Figure 6.
Sensitivity coefficients of the CH2O mole fraction calculated using AramcoMech 2.0 in the flame φ = 0.8/1 atm/XH2 = 50% at HAB, where its peak mole fraction is reached (at 1400 K).
As for C2-intermediate hydrocarbons, they were measured with an appropriate signal-to-noise ratio in the fuel-rich flames only, since their abundance is higher in these conditions. One can see from Table 6 that acetylene and ethylene peak mole fractions are, at most, systematically overpredicted by AramcoMech 2.0. it is noteworthy that this deficiency of AramcoMech 2.0, as well as of other detailed kinetic models, was also pointed out earlier for the premixed flames fueled by methane [48], propene [52], propane and propane/methane/hydrogen blends [53].
Therefore, we can conclude that the AramcoMech 2.0 mechanism provides a reasonable prediction of our measurements for H, OH, HO2, H2O2 and CO peak mole fractions in both fuel-lean and fuel-rich conditions; however, it fails to capture the mole fractions of CH3 and C2 hydrocarbons in fuel-rich conditions. This indicates that the mechanism is expected to be good in describing the chemistry in the fuel-lean flames occurring in gas-turbine conditions.
To trace the changes in the predictive ability of the flame structure by the reduced mechanisms from that provided by AramcoMech 2.0, we analyzed the corresponding percentage deviations Dreduced for different flames determined using the following relation:
where Xreduced and XAramco are the values of the peak mole fraction predicted by the reduced model and AramcoMech 2.0, respectively.
Table 7 shows the resultant Dreduced values for the mechanism RMech1. One can clearly see that this reduced model is as good as AramcoMech 2.0 in predicting H, OH and CH3 concentrations in the flames. More specifically, for these species, the Dreduced values do not exceed ±10% for most flames, except for the fuel-rich flames with XH2 = 75% at p = 3 and p = 5 atm. It is noteworthy that the CO and CH2O peak mole fractions are predicted by RMech1 in the same way as by AramcoMech 2.0 for the fuel-rich flames, and only slightly overpredicted in fuel-lean conditions. For CO, this indicates that the RMech1 mechanism is better in capturing its mole fraction in the flames with φ = 0.8 than AramcoMech 2.0, since the latter one underpredicts the experimental values, as was mentioned above.
Table 7.
Percent deviation (Dreduced) of the peak mole fractions simulated with the reduced mechanism RMech1 (30 species and 70 reactions) from those predicted by AramcoMech 2.0.
RMech1, however, is not as accurate as AramcoMech 2.0 in the reproduction of the mole fractions of peroxy species (HO2 and H2O2) and C2 hydrocarbons (C2H2, C2H4 and C2H6). More specifically, as it can be seen in Table 7, the greatest deviations from AramcoMech 2.0 predictions are for ethylene in the flames with both equivalence ratios. This can be explained by the fact that the low-temperature chemistry and hydrocarbon chemistry are subjected to reduction when building RMech1.
The performance of RMech2 can also be analyzed in terms of Dreduced values, which are listed in Table 8. As it can be seen, this mechanism retains a good predictive ability for CO in all flames. For H and OH radicals, the predictions are close to those by the detailed model only for fuel-lean conditions (for all XH2 and pressures) and for atmospheric-pressure fuel-rich flames. The deviations (underestimation) from the AramcoMech 2.0 predictions for the radicals increase with pressure. Table 8 clearly shows that RMech2 provides values for the CH2O peak mole fraction close to those provided by the detailed model in the flames with a high hydrogen content (XH2 = 75%); however, in other flames, their inessential overestimation takes place. The discrepancies with the predictions by AramcoMech 2.0 for HO2, and specifically for H2O2, are fairly high due to the same reason as in the case of RMech1. The methyl radical peak mole fraction is markedly overestimated by RMech2 because it lacks the CH3 self-recombination reaction (to form ethane) and further C2 chemistry subset in this model. As a consequence, the overestimation is more notable in the fuel-rich flames.
Table 8.
Percent deviation (Dreduced) of the peak mole fractions simulated with the reduced mechanism RMech2 (21 species and 31 reactions) from those predicted by AramcoMech 2.0.
4.3. Effect of the Pressure on the Flame Intermediates
In this section, the effect of the pressure on the peak mole fractions of the key intermediates is discussed. To explain the observed tendencies, we performed the analysis of the rates of production of relevant intermediates in the flames using the three kinetic mechanisms, which showed very similar results. However, for the sake of brevity, the plots of the rate-of-production profiles for the species of interest in the flames are not presented, and only the significant points are discussed below.
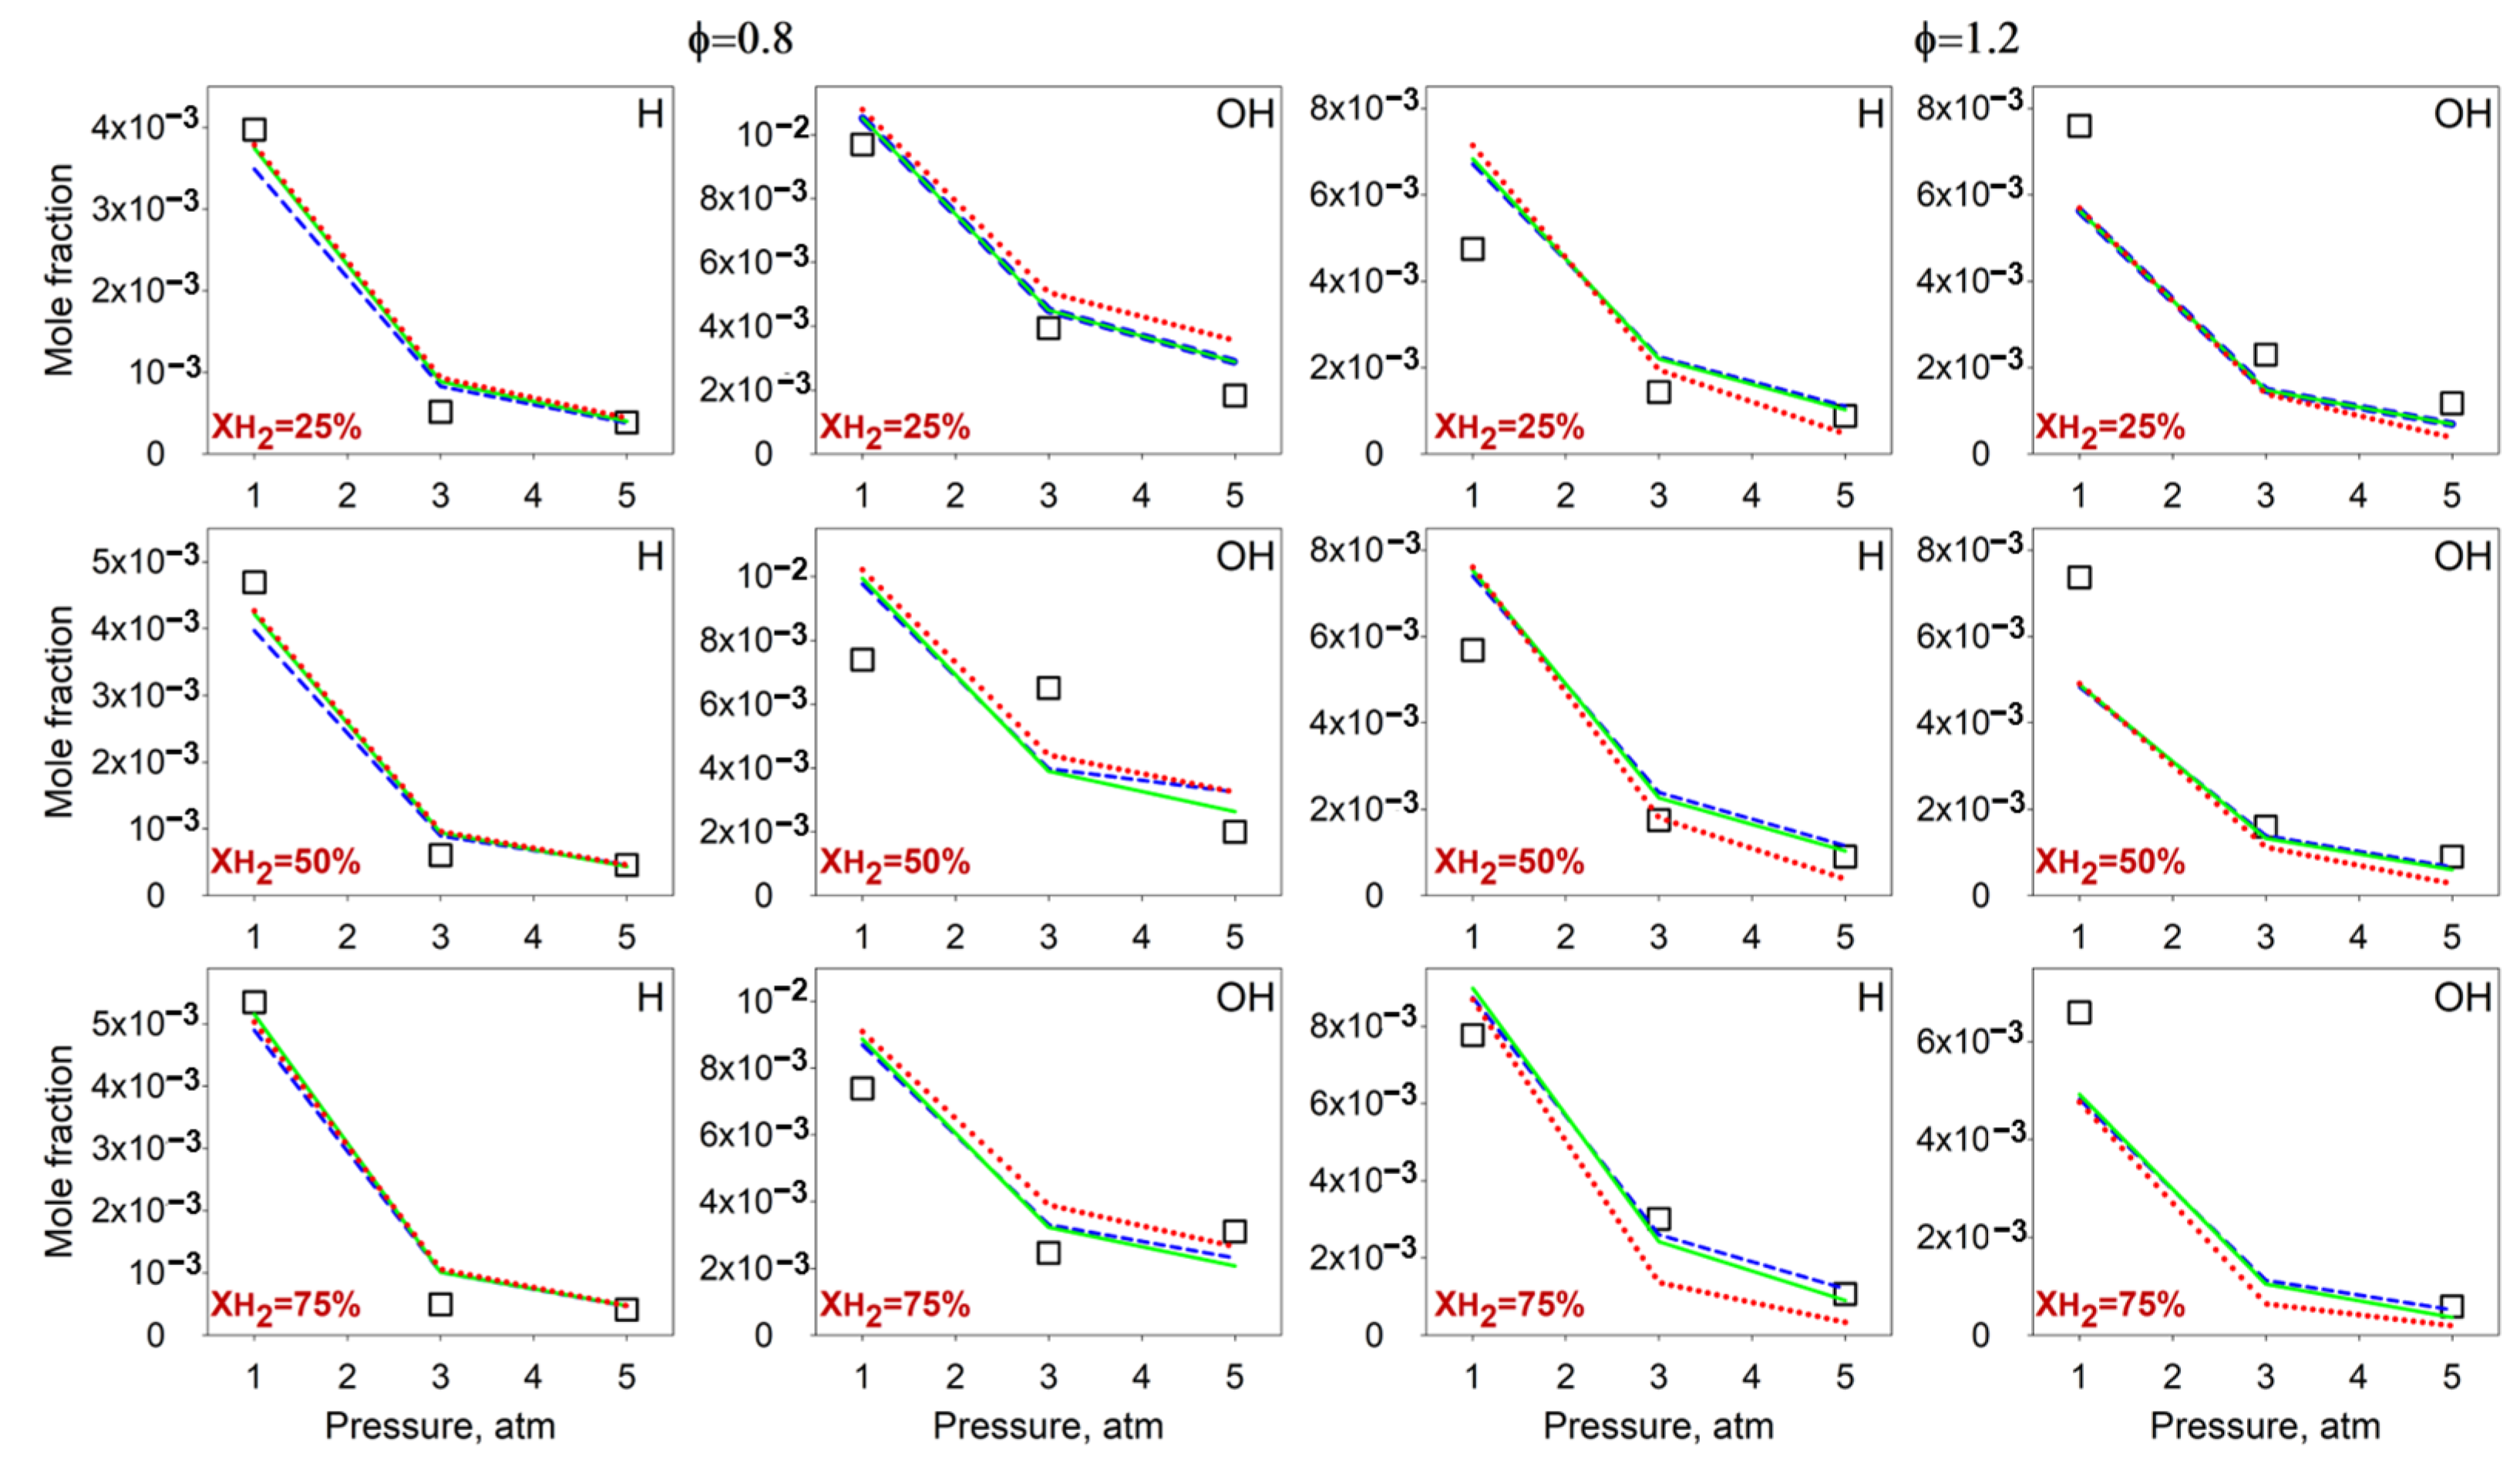
Figure 7 depicts a comparison of the measurements and simulations of the maximum mole fractions of the major flame radicals (H and OH) at different pressures. It should be first noted that all the kinetic mechanisms provide a good fit to the experimental data. The plots provided clearly demonstrate that the pressure rise results in decreasing H and OH peak mole fractions, as was observed in the flames of pure hydrogen [54] and methane [48]. This occurs primarily due to the rate constant of the reaction H + O2(+M) ↔ HO2(+M), the main responsible for chain termination, being pressure-dependent. HO2 radicals, in turn, take part in the OH consumption reaction HO2 + OH ↔ H2O + O2. Elevated pressure conditions facilitate more frequent collisions, which accelerate the transformation of H and OH into HO2 and H2O, respectively. The partial substitution of methane with hydrogen results in the higher production of H radicals and, as a consequence, in a higher rate of the major chain-branching reaction H + O2 ↔ O + OH.
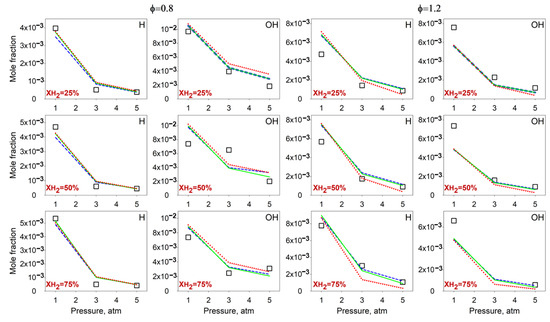
Figure 7.
Pressure dependence of the peak mole fractions of H and OH radicals. Symbols: experiment; lines: simulation. Dashed (blue) line: AramcoMech 2.0; solid (green) line: RMech1; dotted (red) line: RMech2.
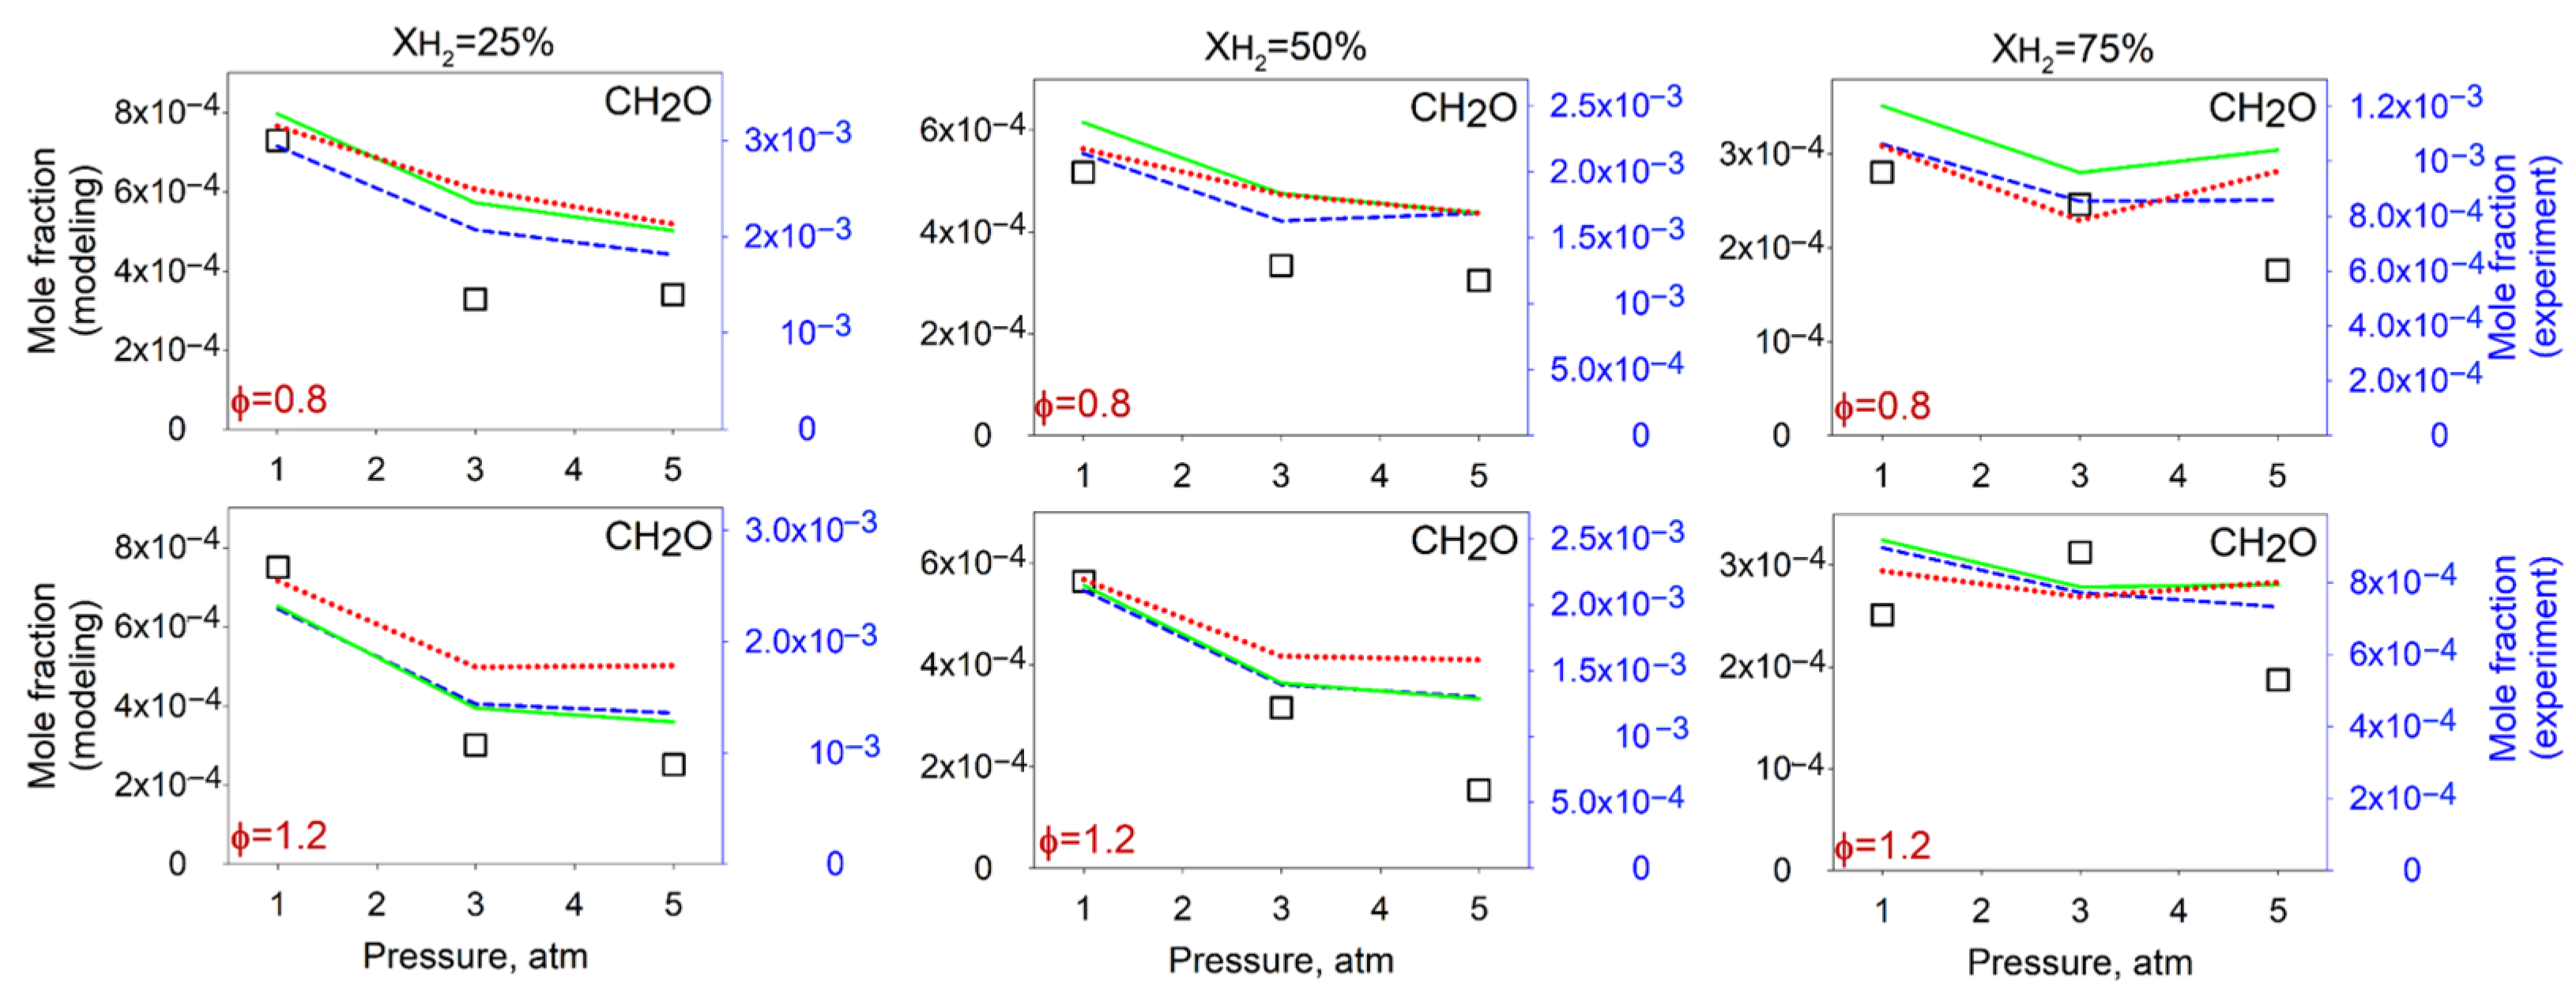
Figure 8 compares the simulated peak mole fractions of formaldehyde with the corresponding experimental points in the flames. Although all mechanisms are not quite accurate in predicting the measured values, as already was discussed in Section 4.2, they provide reasonable trends with pressure. In particular, in all flames at a higher pressure, the CH2O peak mole fraction becomes lower.
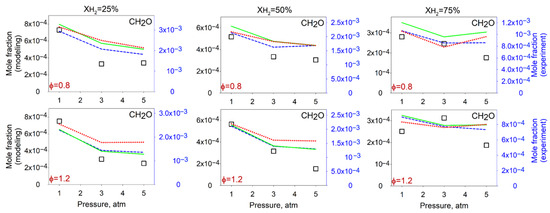
Figure 8.
Pressure dependence of the peak mole fractions of formaldehyde. Symbols: experiment; lines: simulation. Dashed (blue) line: AramcoMech 2.0; solid (green) line: RMech1; dotted (red) line: RMech2.
This behavior of formaldehyde abundance with pressure is explained by a decrease in the methyl peak mole fraction with pressure (see Figure A2, Figure A3, Figure A4, Figure A5, Figure A6 and Figure A7), which is the main CH2O precursor in the flames via the reaction with O radicals: CH3 + O ↔ CH2O + H. The consumption of methyl radicals, in turn, enhances with the pressure since the rate constant of their recombination to form ethane (CH3 + CH3(+M) ↔ C2H6(+M)) increases with the pressure.
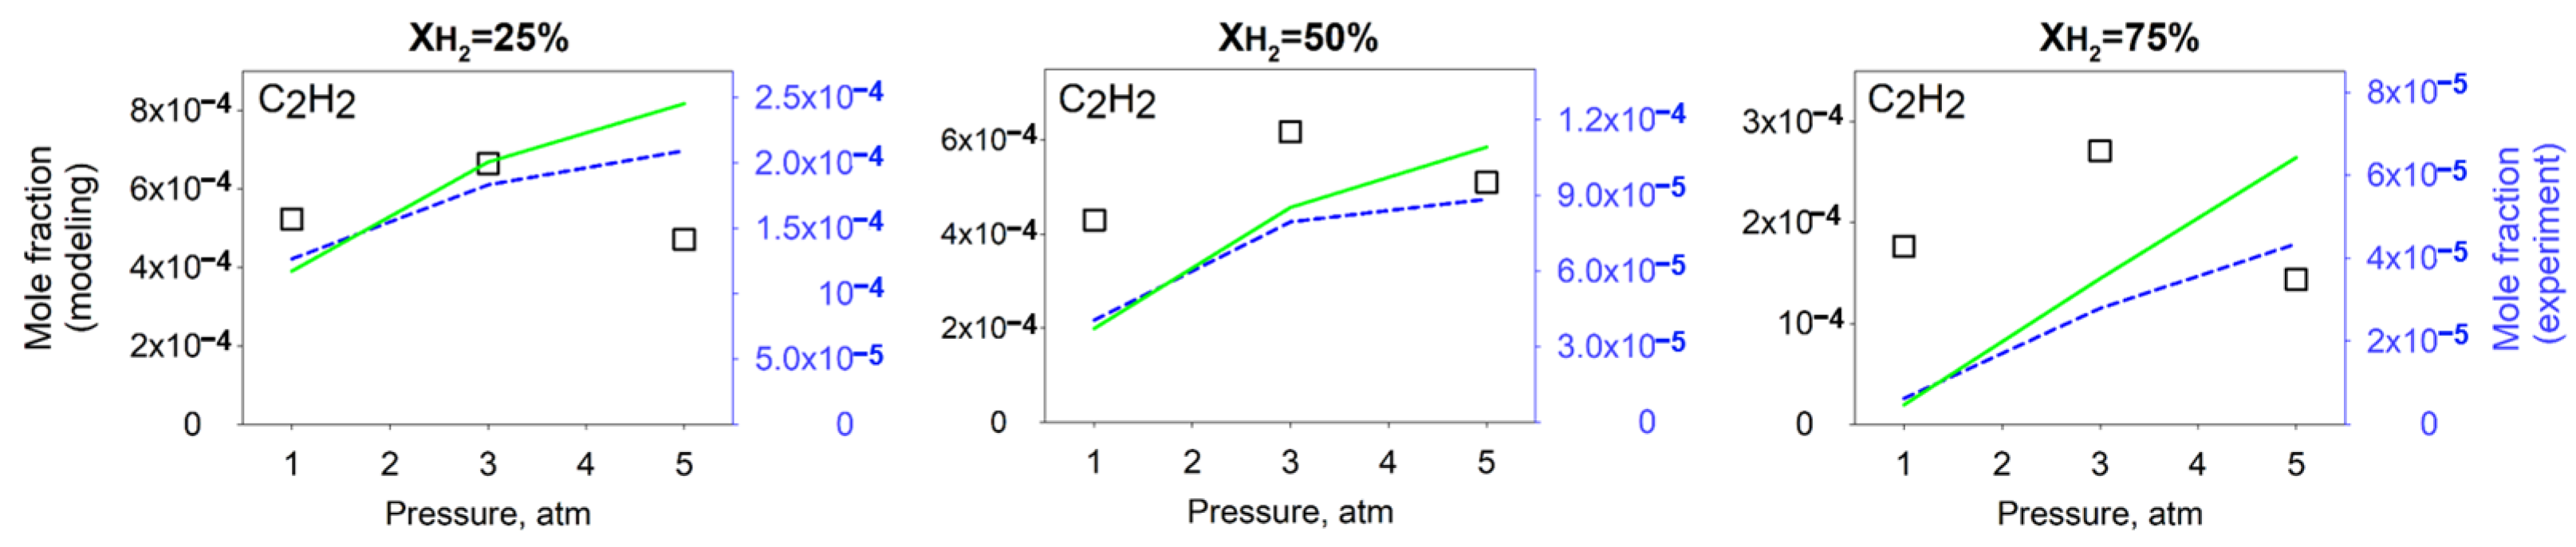
The measured and calculated peak mole fraction of acetylene (key C2 intermediate) in the fuel-rich flames as a function of pressure is shown in Figure 9. As it can be seen, the kinetic mechanisms AramcoMech 2.0 and RMech1 predict an increase in its mole fraction in the whole range of pressures. Additionally, according to both mechanisms, the higher hydrogen content in the reactant mixture, the stronger the pressure dependence. However, the experiment demonstrates that the C2H2 mole fraction is nearly the same at all pressures (within the measurement errors), as was also observed in other works [48,53,55].

Figure 9.
Pressure dependence of the peak mole fractions of acetylene. Symbols: experiment; lines: simulation. Dashed (blue) line: AramcoMech 2.0; solid (green) line: RMech1.
The difference in the predicted and observed trends with the pressure can be explained by inaccuracies in the pressure-dependent rate constants of reactions responsible for acetylene formation. In particular, according to AramcoMech 2.0, the major reaction pathway of acetylene production is H-abstraction from the vinyl radical by H attack: C2H3 + H(+M) ↔ C2H2 + H2(+M). The acetylene mole fraction is very sensitive to the rate parameter of this reaction [56]. Its value, used in AramcoMech 2.0, was suggested by Miller and Klippenstein [57]. However, more recent studies of this reaction are also available, see, e.g., [58], and should be considered to further improve the detailed models for the combustion of hydrocarbons. Hopefully, the experimental data presented in this paper will serve as targets for the validation of these models.
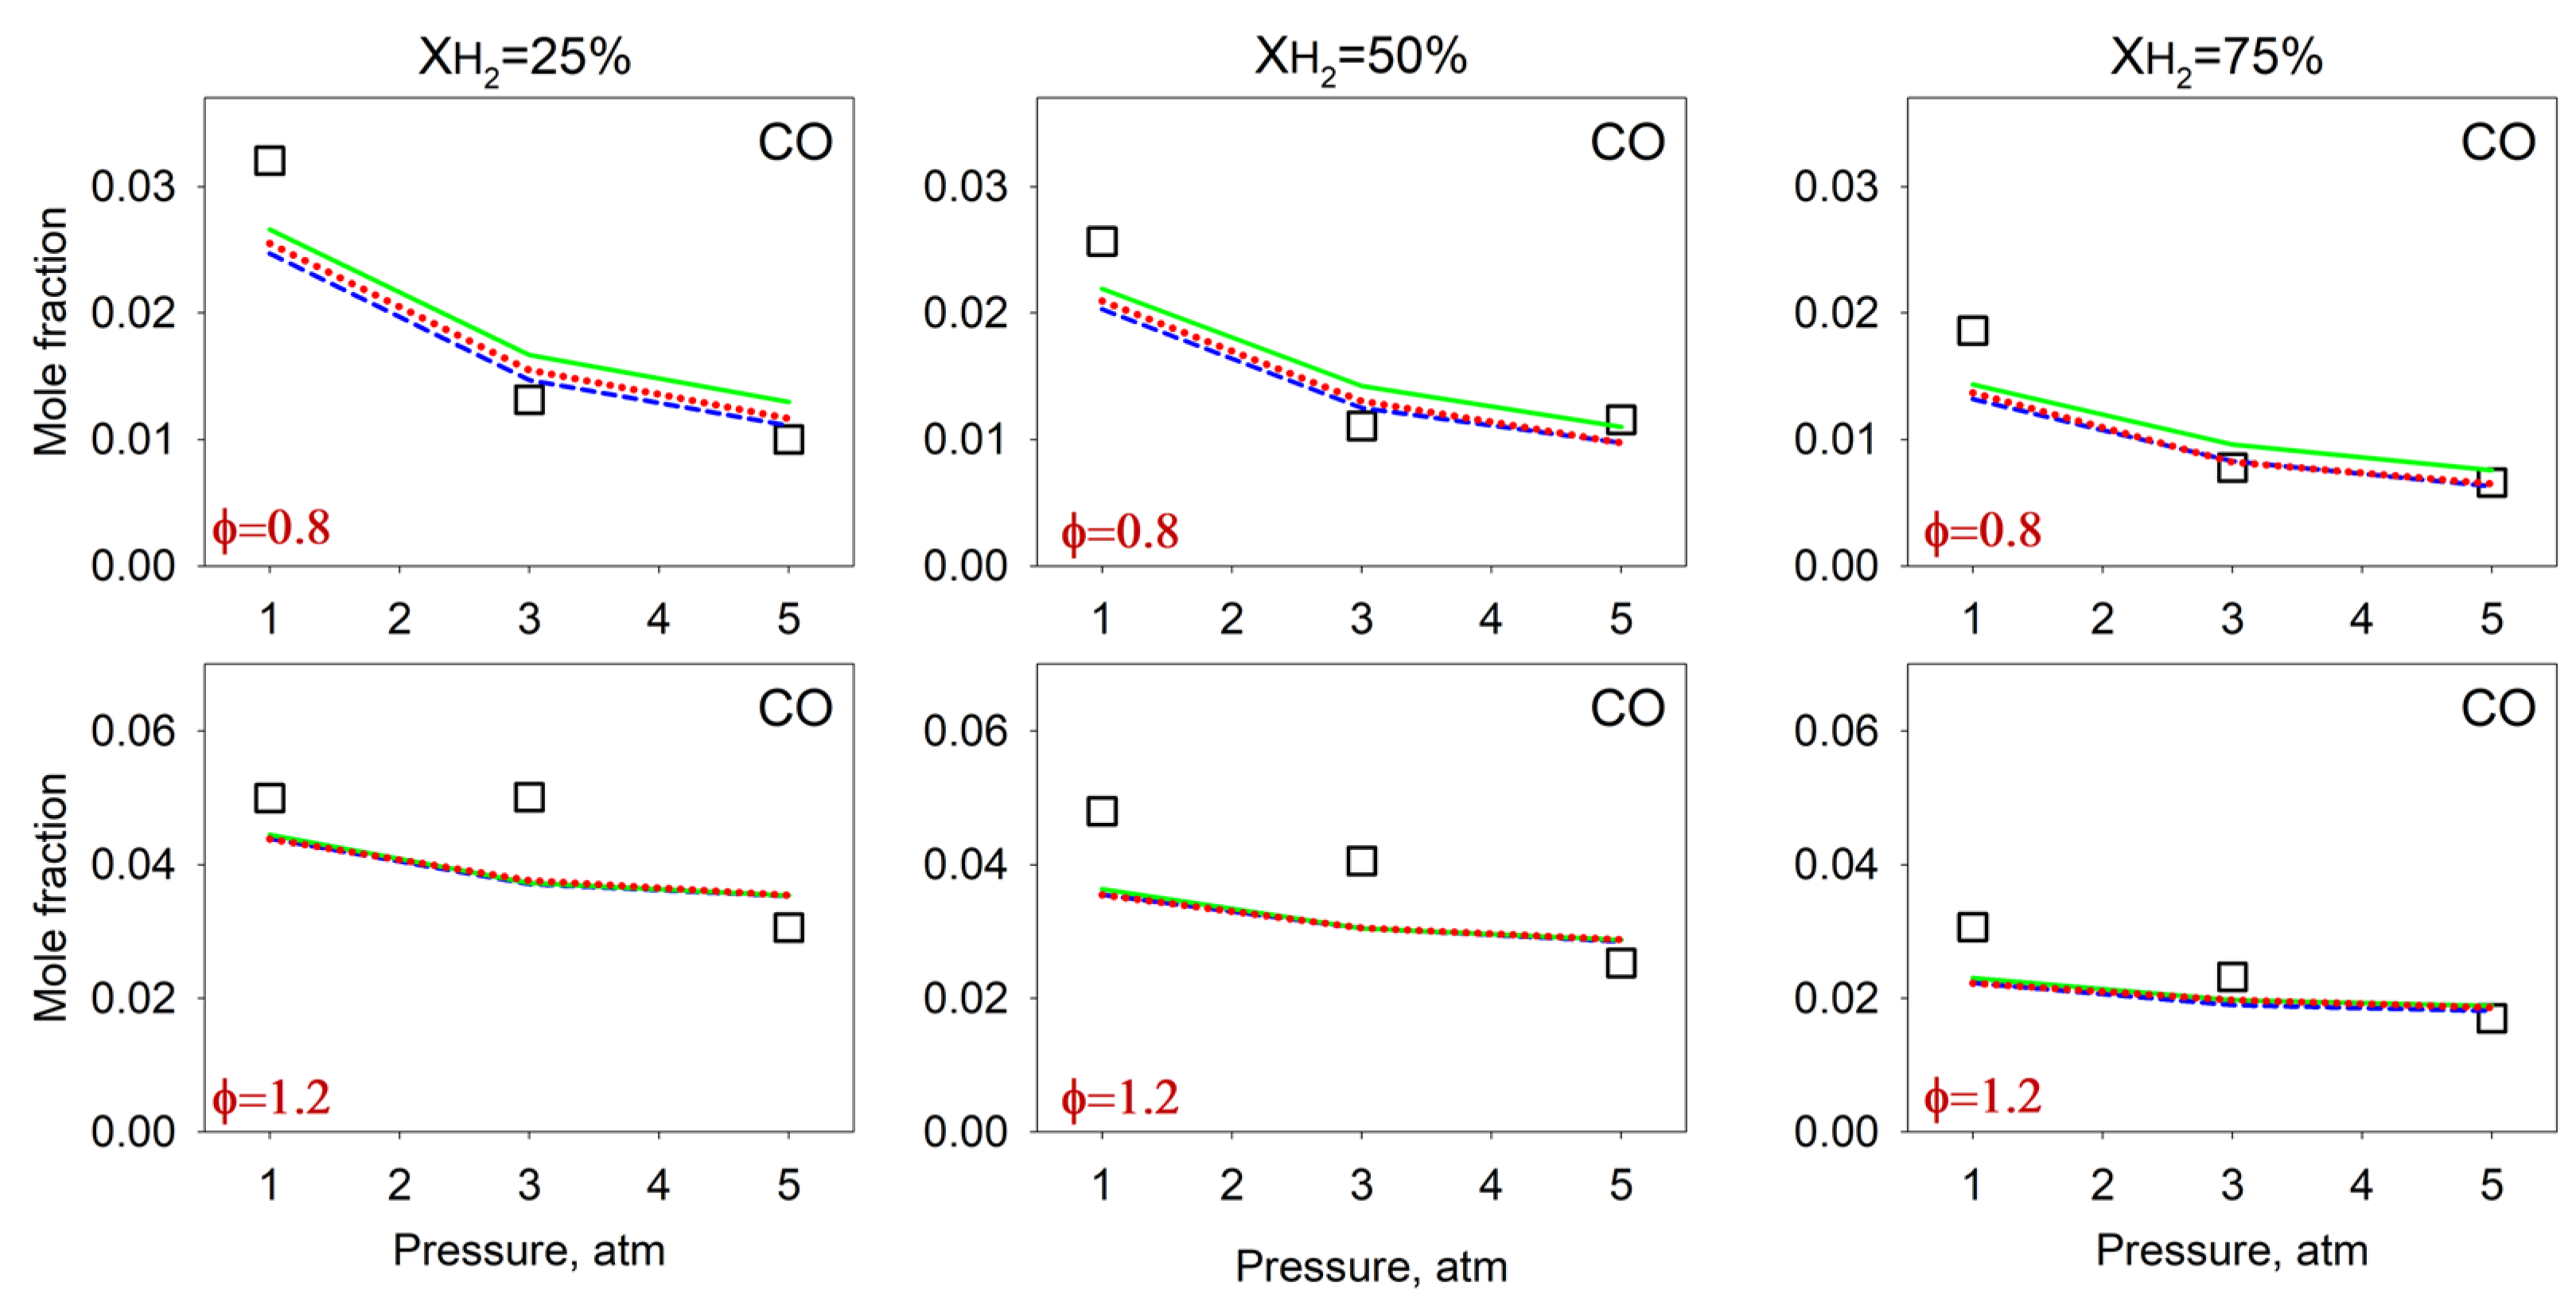
As it can be seen in Figure 5, the CO mole fraction has a distinguished maxim in the reaction zone of the flames, and the peak mole fraction also depends on the pressure. Figure 10 compares its measured values with those predicted by the three models in all flames. One can see that the models quite reasonably capture the observations: the CO peak mole fraction decreases gradually with the pressure in the fuel-lean flames, and practically does not depend on the pressure in fuel-rich conditions. The analysis of the sensitivities of different reactions to the production/consumption of CO in different flames revealed two key pathways: OH + CO ↔ H + CO2 and H + O2 ↔ O + OH. They are both responsible for CO consumption and involve the major flame radicals H and OH. Obviously, the effect of the pressure on CO is related to the effect of the pressure on the ratio of OH/H. Using the data presented in Figure 7, we derived the OH/H ratio in different flames and found that it increases by ~2.8 times (according to AramcoMech 2.0) when the pressure changes from 1 to 5 atm in the fuel-lean flames (at any XH2), whereas it remains almost unchanged with the pressure in fuel-rich conditions. This tendency correlates with the CO content behavior with the pressure. Indeed, increasing OH/H results in a higher rate of CO oxidation to CO2.
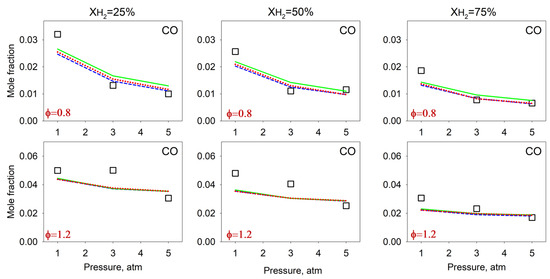
Figure 10.
Pressure dependence of the peak mole fractions of CO. Symbols: experiment; lines: simulation. Dashed (blue) line: AramcoMech 2.0; solid (green) line: RMech1; dotted (red) line: RMech2.
5. Conclusions
An extensive set of experimental data for chemical speciation and thermal structure of laminar premixed burner-stabilized CH4/H2/O2/Ar flames at different equivalence ratios (φ = 0.8 and φ = 1.2), hydrogen contents in the CH4/H2 blend (XH2 = 25%, 50% and 75%) and pressures (1, 3 and 5 atm) was reported in this work. The mole fraction profiles of the reactants, major products and some key intermediates (H, OH, CH3, HO2, H2O2, formaldehyde, acetylene, ethylene and ethane) were measured by the MBMS technique. The experimental profiles of the species mole fractions were utilized to validate the detailed chemical kinetic mechanism AramcoMech 2.0, along with two reduced mechanisms with different levels of detail (RMech1 and RMech2) for the combustion of CH4/H2 blends, which were also presented in this work.
Starting with the AramcoMech 2.0 model, the reduced mechanism RMech1 (30 species and 70 reactions) was developed employing a combination of several methods (DRG, ROP and CSP) and using ignition delays, maximum temperature and concentrations of important intermediates as targets. The even compact kinetic mechanism RMech2 (21 species and 31 reactions) was obtained starting with RMech1 and using ROP and sensitivity analyses. Both mechanisms were demonstrated to reasonably capture numerous literature data for the laminar burning velocity values and ignition delays of methane/hydrogen fuel blends.
In general, all three kinetic mechanisms adequately predict the spatial distributions of mole fractions of the major stable species in flames (CH4, H2, O2, CO, CO2 and H2O) and major flame radicals (H and OH). However, the prediction of methyl, HO2 and H2O2 abundance in the flames worsens as the number of reactions in the models decreases. Possible reasons for the observed discrepancies for CH2O and C2 hydrocarbons are assumed to be due to inaccuracies in the rate parameters of the relevant reaction pathways used in AramcoMech 2.0. The corresponding shortcomings are inherited by the reduced models from the predecessor mechanism. Despite the indicated drawbacks, the reduced models, as well as AramcoMech 2.0, adequately describe the effect of the pressure and hydrogen content in the mixture on the peak mole fractions of the intermediates.
RMech1 captures well the trends of species mole fractions with the increase in the pressure. Substantial inaccuracies begin to be observed at pressures from 5 atm in rich conditions at high concentrations of hydrogen in the fuel mixtures (XH2~75%). The shortest mechanism RMech2 does not include the C2 chemistry subset; therefore, it can be useful when low computational costs are of higher priority than the accurate prediction of relevant intermediates. However, the predictive ability of RMech2 is worse than that of RMech1, and decreases significantly with the increase in the pressure. So, the mechanism RMech2 performs the best in slightly lean conditions and at a moderate pressure of 1–3 atm.
It is worthy of note that both reduced mechanisms, as well as the detailed mechanism, demonstrated a good predictive ability of the structure of fuel-lean flames (φ = 0.8), which is close to the desirable gas-turbine conditions. This suggests that these mechanisms have good prospects to be used for the CFD calculations of processes in realistic combustion devices. Both reduced mechanisms do not include a reaction subset for NOx formation, which can be added by future users depending on their requirements for the detail of nitrogen chemistry.
The experimental data presented in this work extend the available experimental database for the chemical speciation of flames fueled by CH4/H2 mixtures at elevated pressures and can be used for the validation of relevant chemical kinetic models.
Supplementary Materials
The following supporting information can be downloaded at: https://www.mdpi.com/article/10.3390/en16227489/s1, Figure S1: Comparison between IDTs predicted by the reduced models RMech1 and RMech2, the full-set model AramcoMech 2.0 and experimental data from Cheng et al. [51]; Figure S2: Comparison between IDTs predicted by the reduced models RMech1 and RMech2, the full-set model AramcoMech 2.0 and experimental data from Zhang et al. [17]; Table S1: The species mole fraction and temperature profiles measured in all 18 flames.
Author Contributions
Conceptualization, A.G.S.; Methodology, I.E.G. and T.A.B.; Software, T.A.B.; Validation, A.M.D.; Formal analysis, I.E.G., T.A.B. and K.N.O.; Investigation, D.A.K.; Data curation, K.N.O., D.A.K. and A.G.S.; Writing—original draft, A.M.D. and D.A.K.; Visualization, I.E.G., K.N.O. and A.M.D.; Supervision, A.G.S.; Project administration, A.G.S. All authors have read and agreed to the published version of the manuscript.
Funding
The authors are grateful for the funding support from the Ministry of Science and Higher Education of the Russian Federation (project no: 075-15-2020-806).
Data Availability Statement
Data is contained within the article and supplementary material.
Conflicts of Interest
The authors declare no conflict of interest.
Appendix A
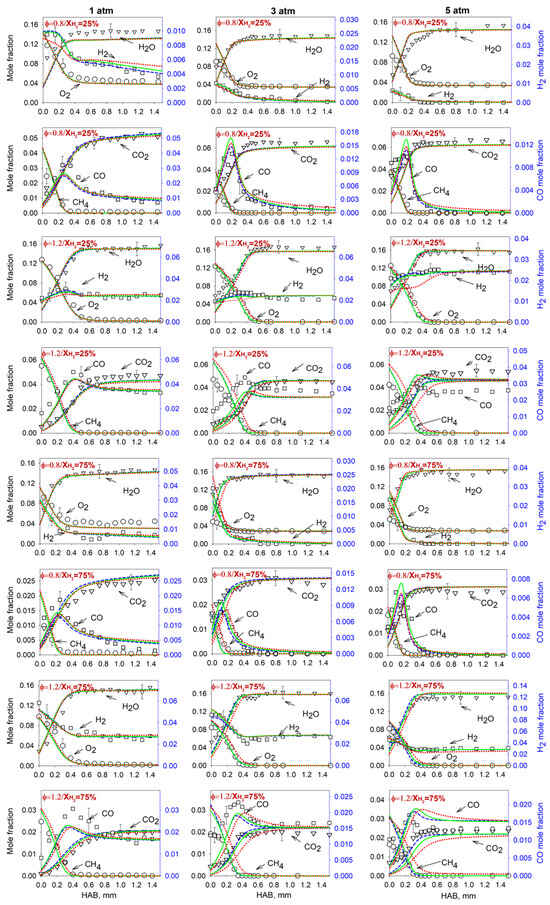
Figure A1.
Spatial mole fraction profiles of the major species in the flames with XH2 = 25% and 75% at pressures of 1, 3 and 5 atm and φ = 0.8, 1.2 (12 flames in total). Symbols: measurements; lines: simulation. Dashed (blue) line: AramcoMech 2.0; solid (green) line: RMech1; dotted (red) line: RMech2.
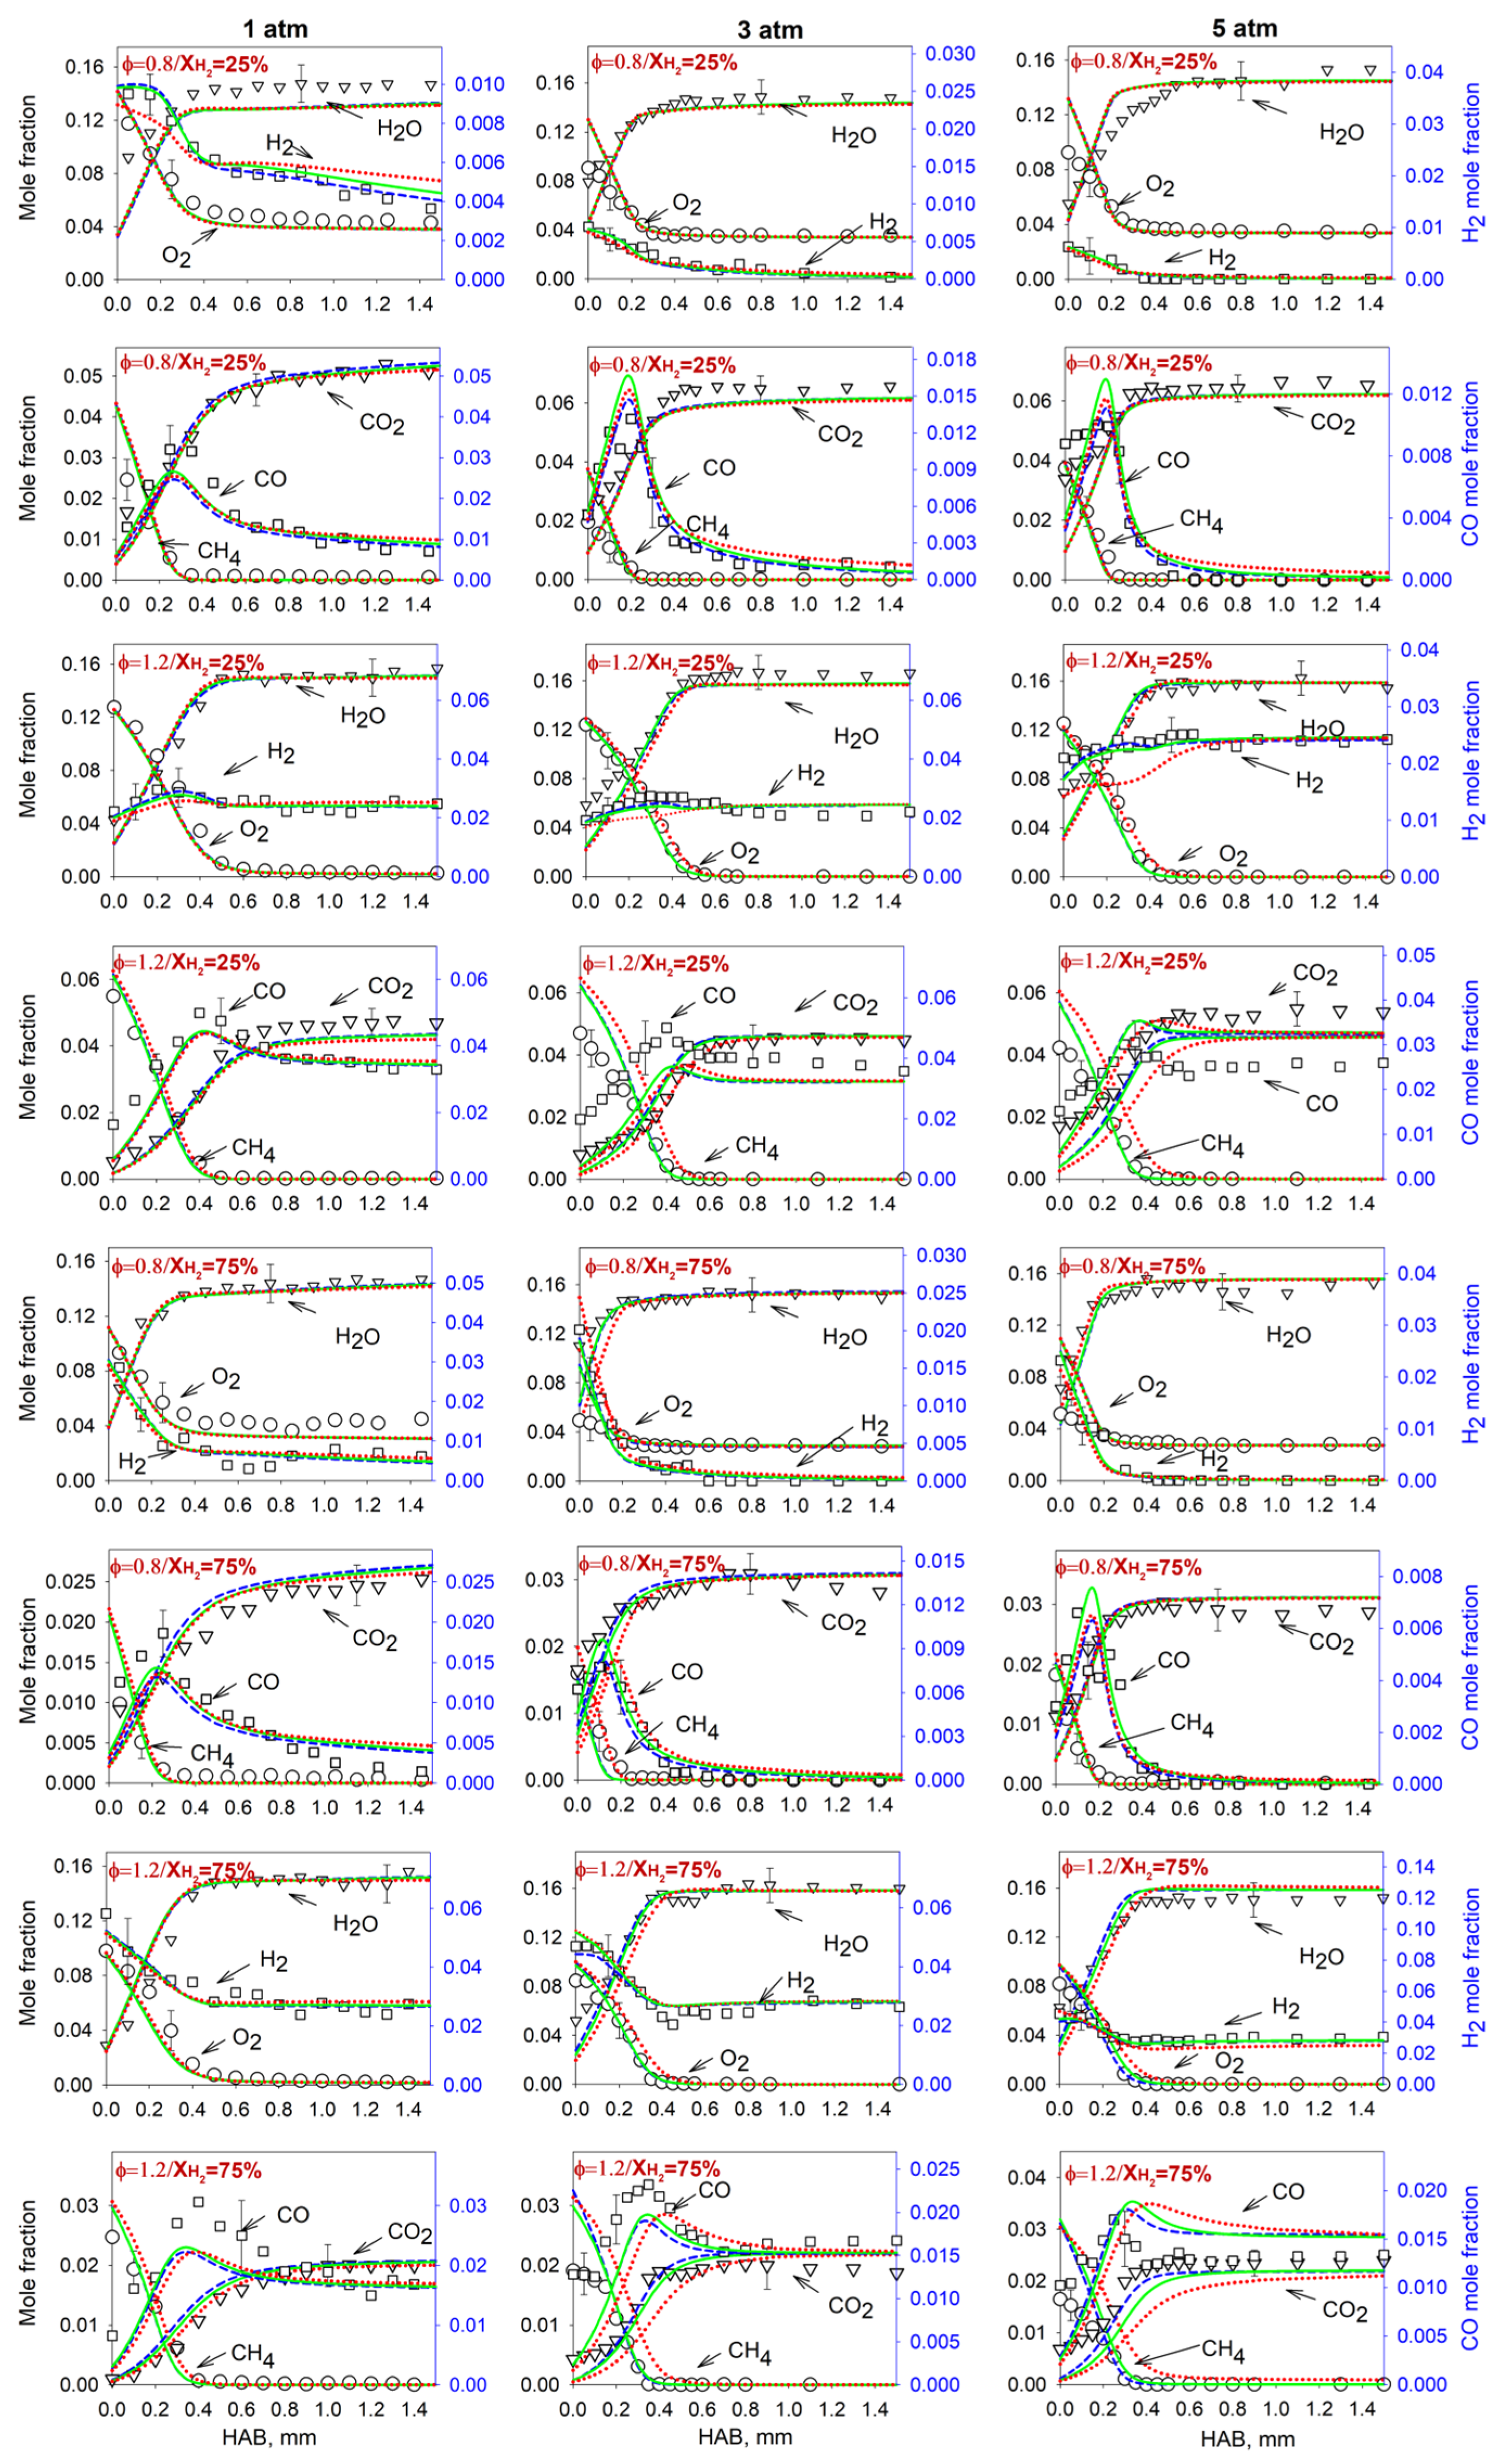
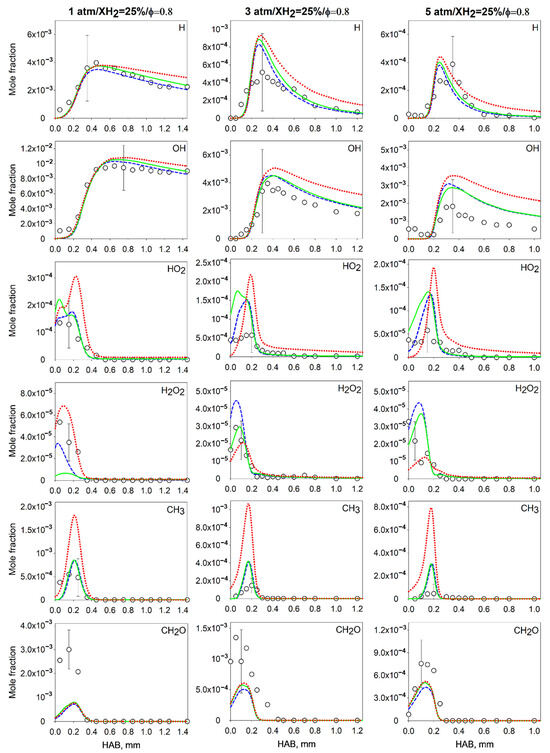
Figure A2.
Spatial mole fraction profiles of the intermediates measured in the flames with XH2 = 25% at pressures of 1, 3 and 5 atm and φ = 0.8. Symbols: experiment; lines: simulation. Dashed (blue) line: AramcoMech 2.0; solid (green) line: RMech1; dotted (red) line: RMech2.
Figure A2.
Spatial mole fraction profiles of the intermediates measured in the flames with XH2 = 25% at pressures of 1, 3 and 5 atm and φ = 0.8. Symbols: experiment; lines: simulation. Dashed (blue) line: AramcoMech 2.0; solid (green) line: RMech1; dotted (red) line: RMech2.
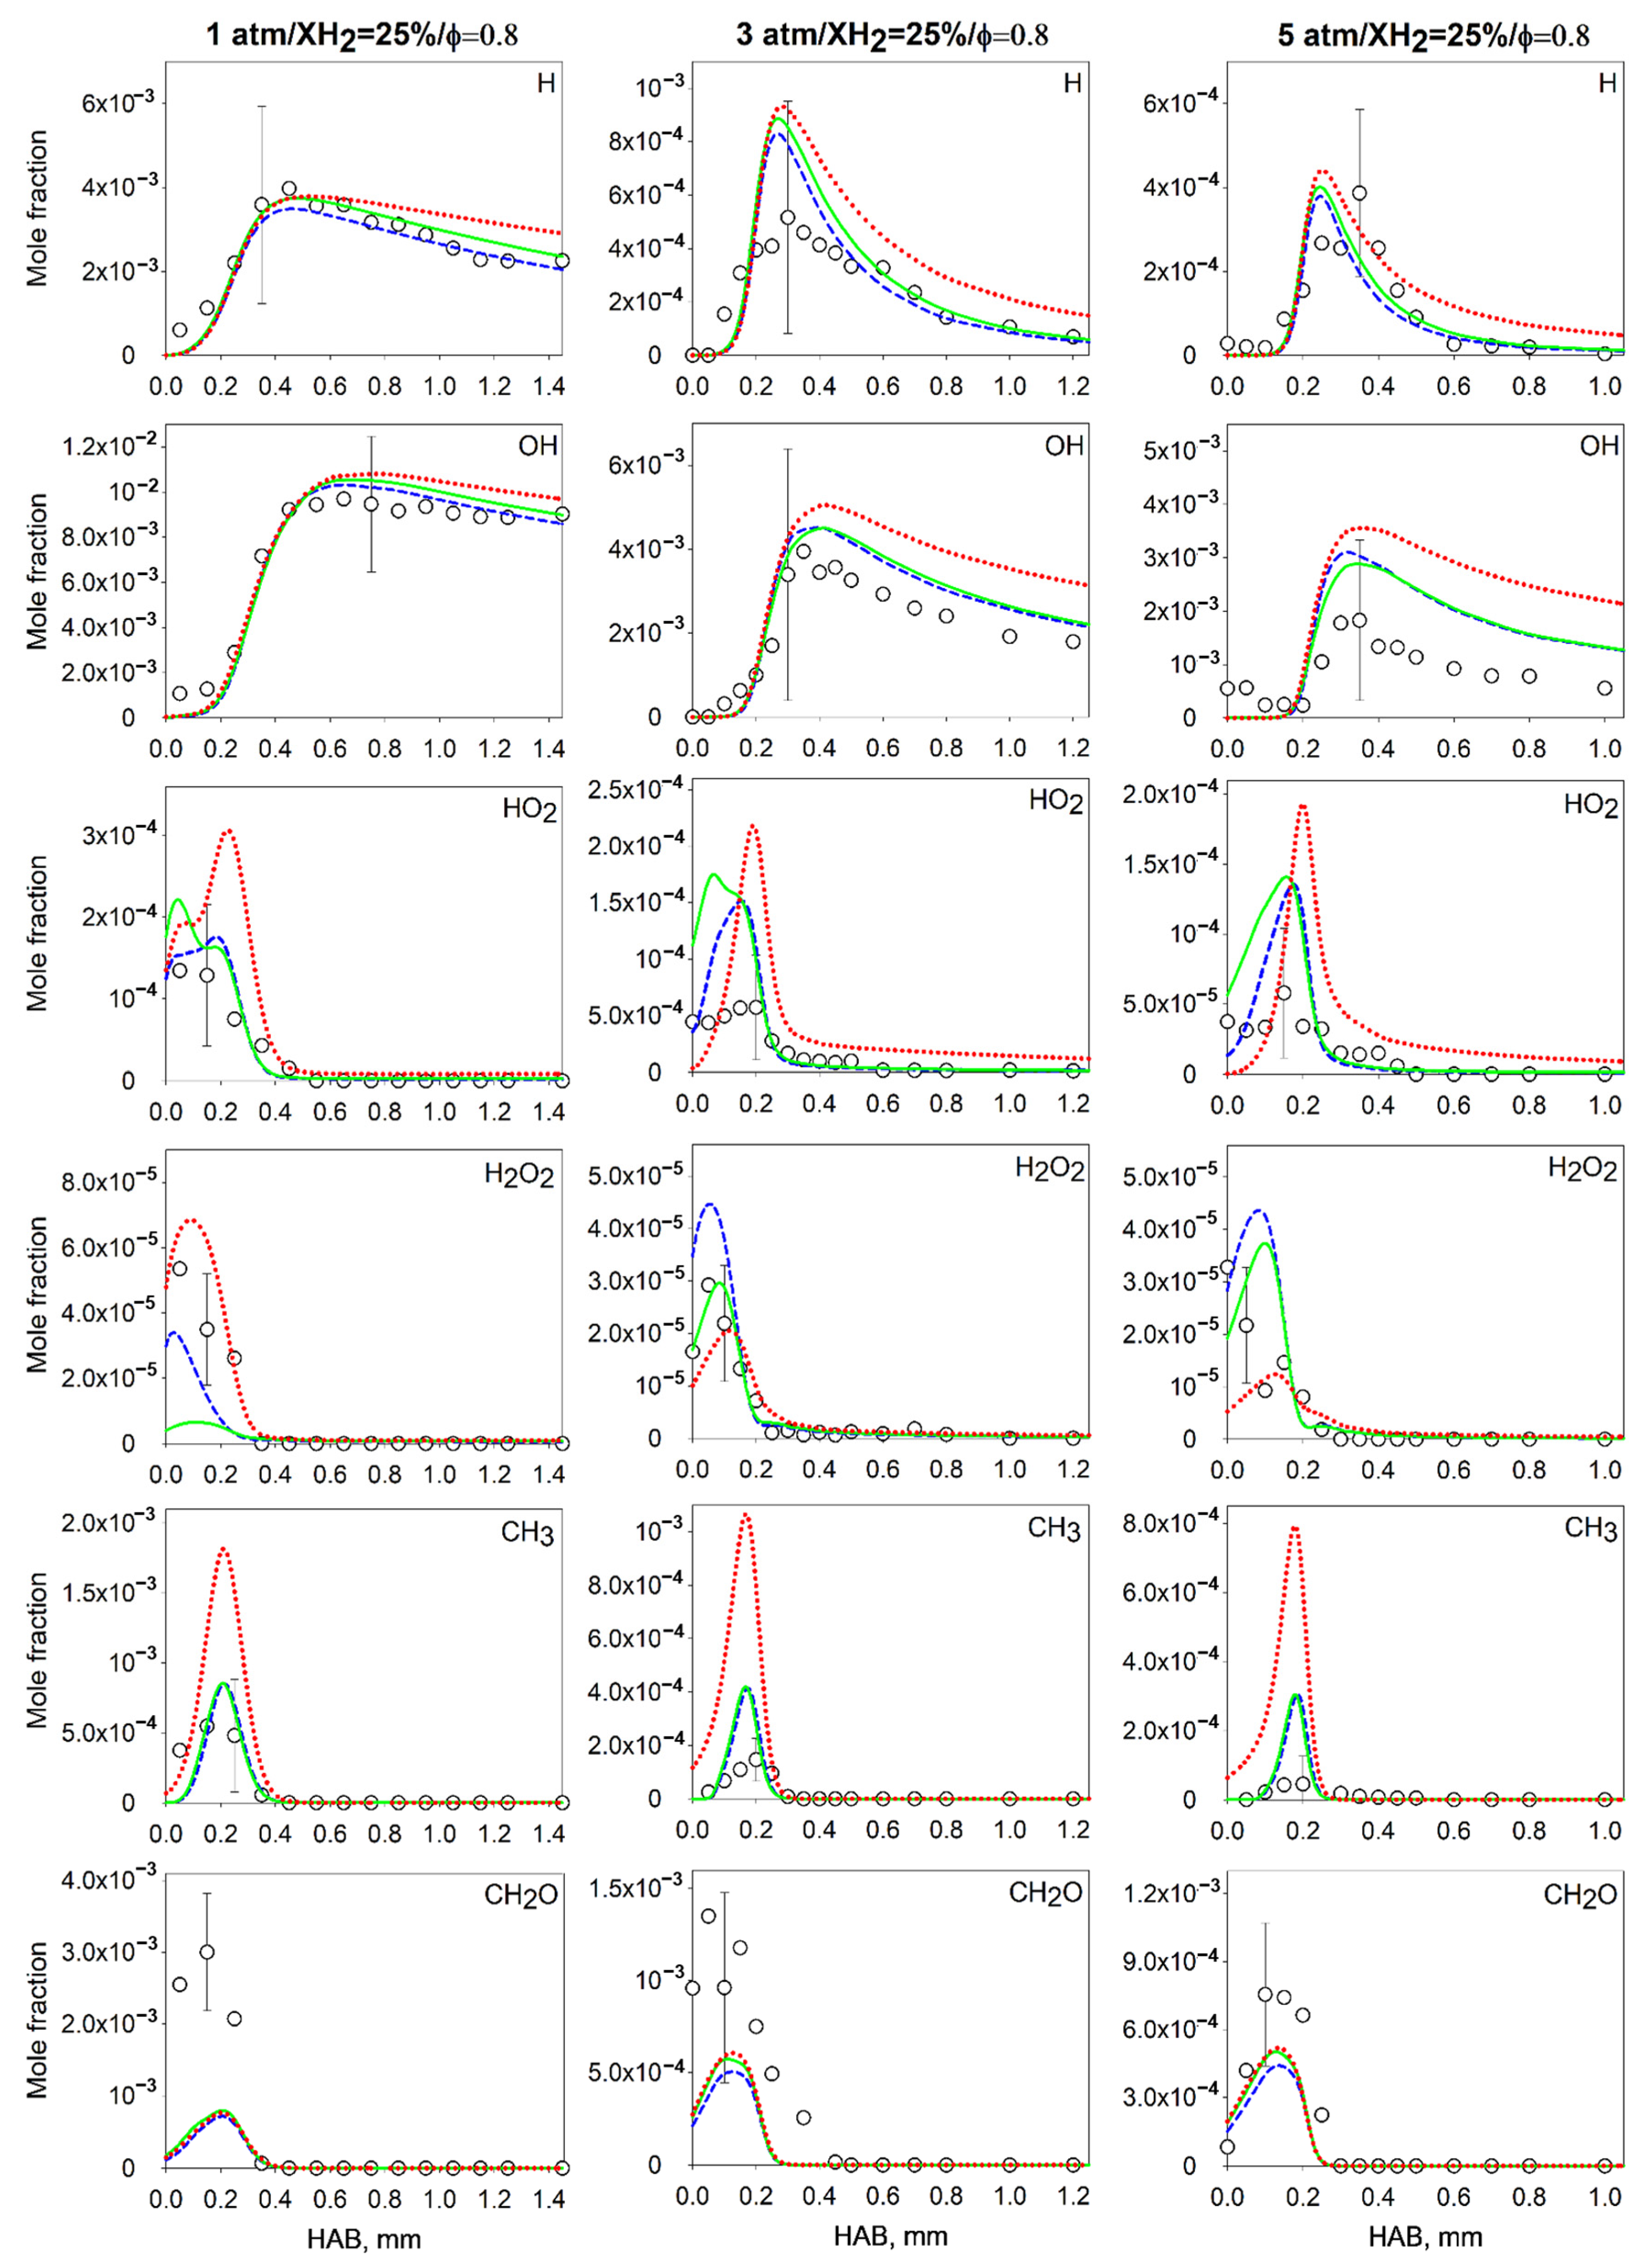
Figure A3.
Spatial mole fraction profiles of the intermediates measured in the flames with XH2 = 50% at pressures of 1, 3 and 5 atm and φ = 0.8. Symbols: experiment; lines: simulation. Dashed (blue) line: AramcoMech 2.0; solid (green) line: RMech1; dotted (red) line: RMech2.
Figure A3.
Spatial mole fraction profiles of the intermediates measured in the flames with XH2 = 50% at pressures of 1, 3 and 5 atm and φ = 0.8. Symbols: experiment; lines: simulation. Dashed (blue) line: AramcoMech 2.0; solid (green) line: RMech1; dotted (red) line: RMech2.
Figure A4.
Spatial mole fraction profiles of the intermediates measured in the flames with XH2 = 75% at pressures of 1, 3 and 5 atm and φ = 0.8. Symbols: experiment; lines: simulation. Dashed (blue) line: AramcoMech 2.0; solid (green) line: RMech1; dotted (red) line: RMech2.
Figure A4.
Spatial mole fraction profiles of the intermediates measured in the flames with XH2 = 75% at pressures of 1, 3 and 5 atm and φ = 0.8. Symbols: experiment; lines: simulation. Dashed (blue) line: AramcoMech 2.0; solid (green) line: RMech1; dotted (red) line: RMech2.
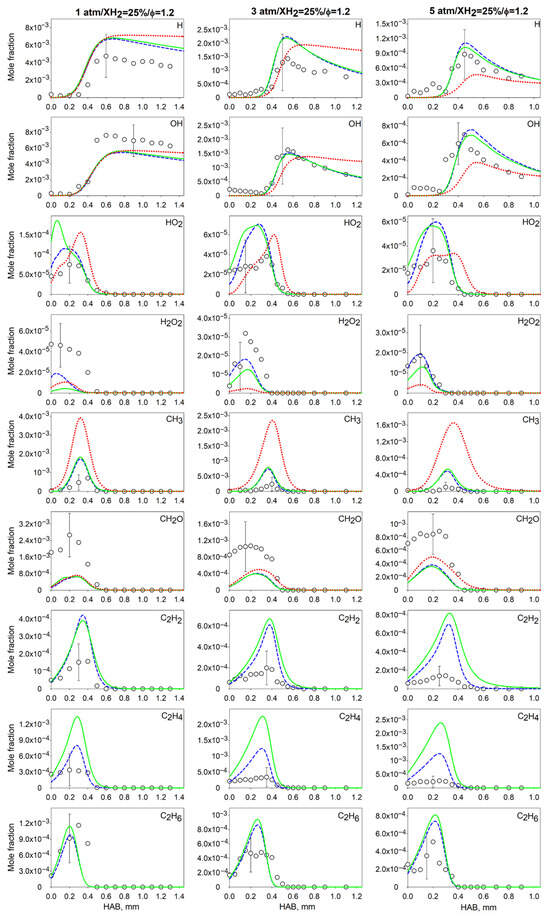
Figure A5.
Spatial mole fraction profiles of the intermediates measured in the flames with XH2 = 25% at pressures of 1, 3 and 5 atm and φ = 1.2. Symbols: experiment; lines: simulation. Dashed (blue) line: AramcoMech 2.0; solid (green) line: RMech1; dotted (red) line: RMech2.
Figure A5.
Spatial mole fraction profiles of the intermediates measured in the flames with XH2 = 25% at pressures of 1, 3 and 5 atm and φ = 1.2. Symbols: experiment; lines: simulation. Dashed (blue) line: AramcoMech 2.0; solid (green) line: RMech1; dotted (red) line: RMech2.
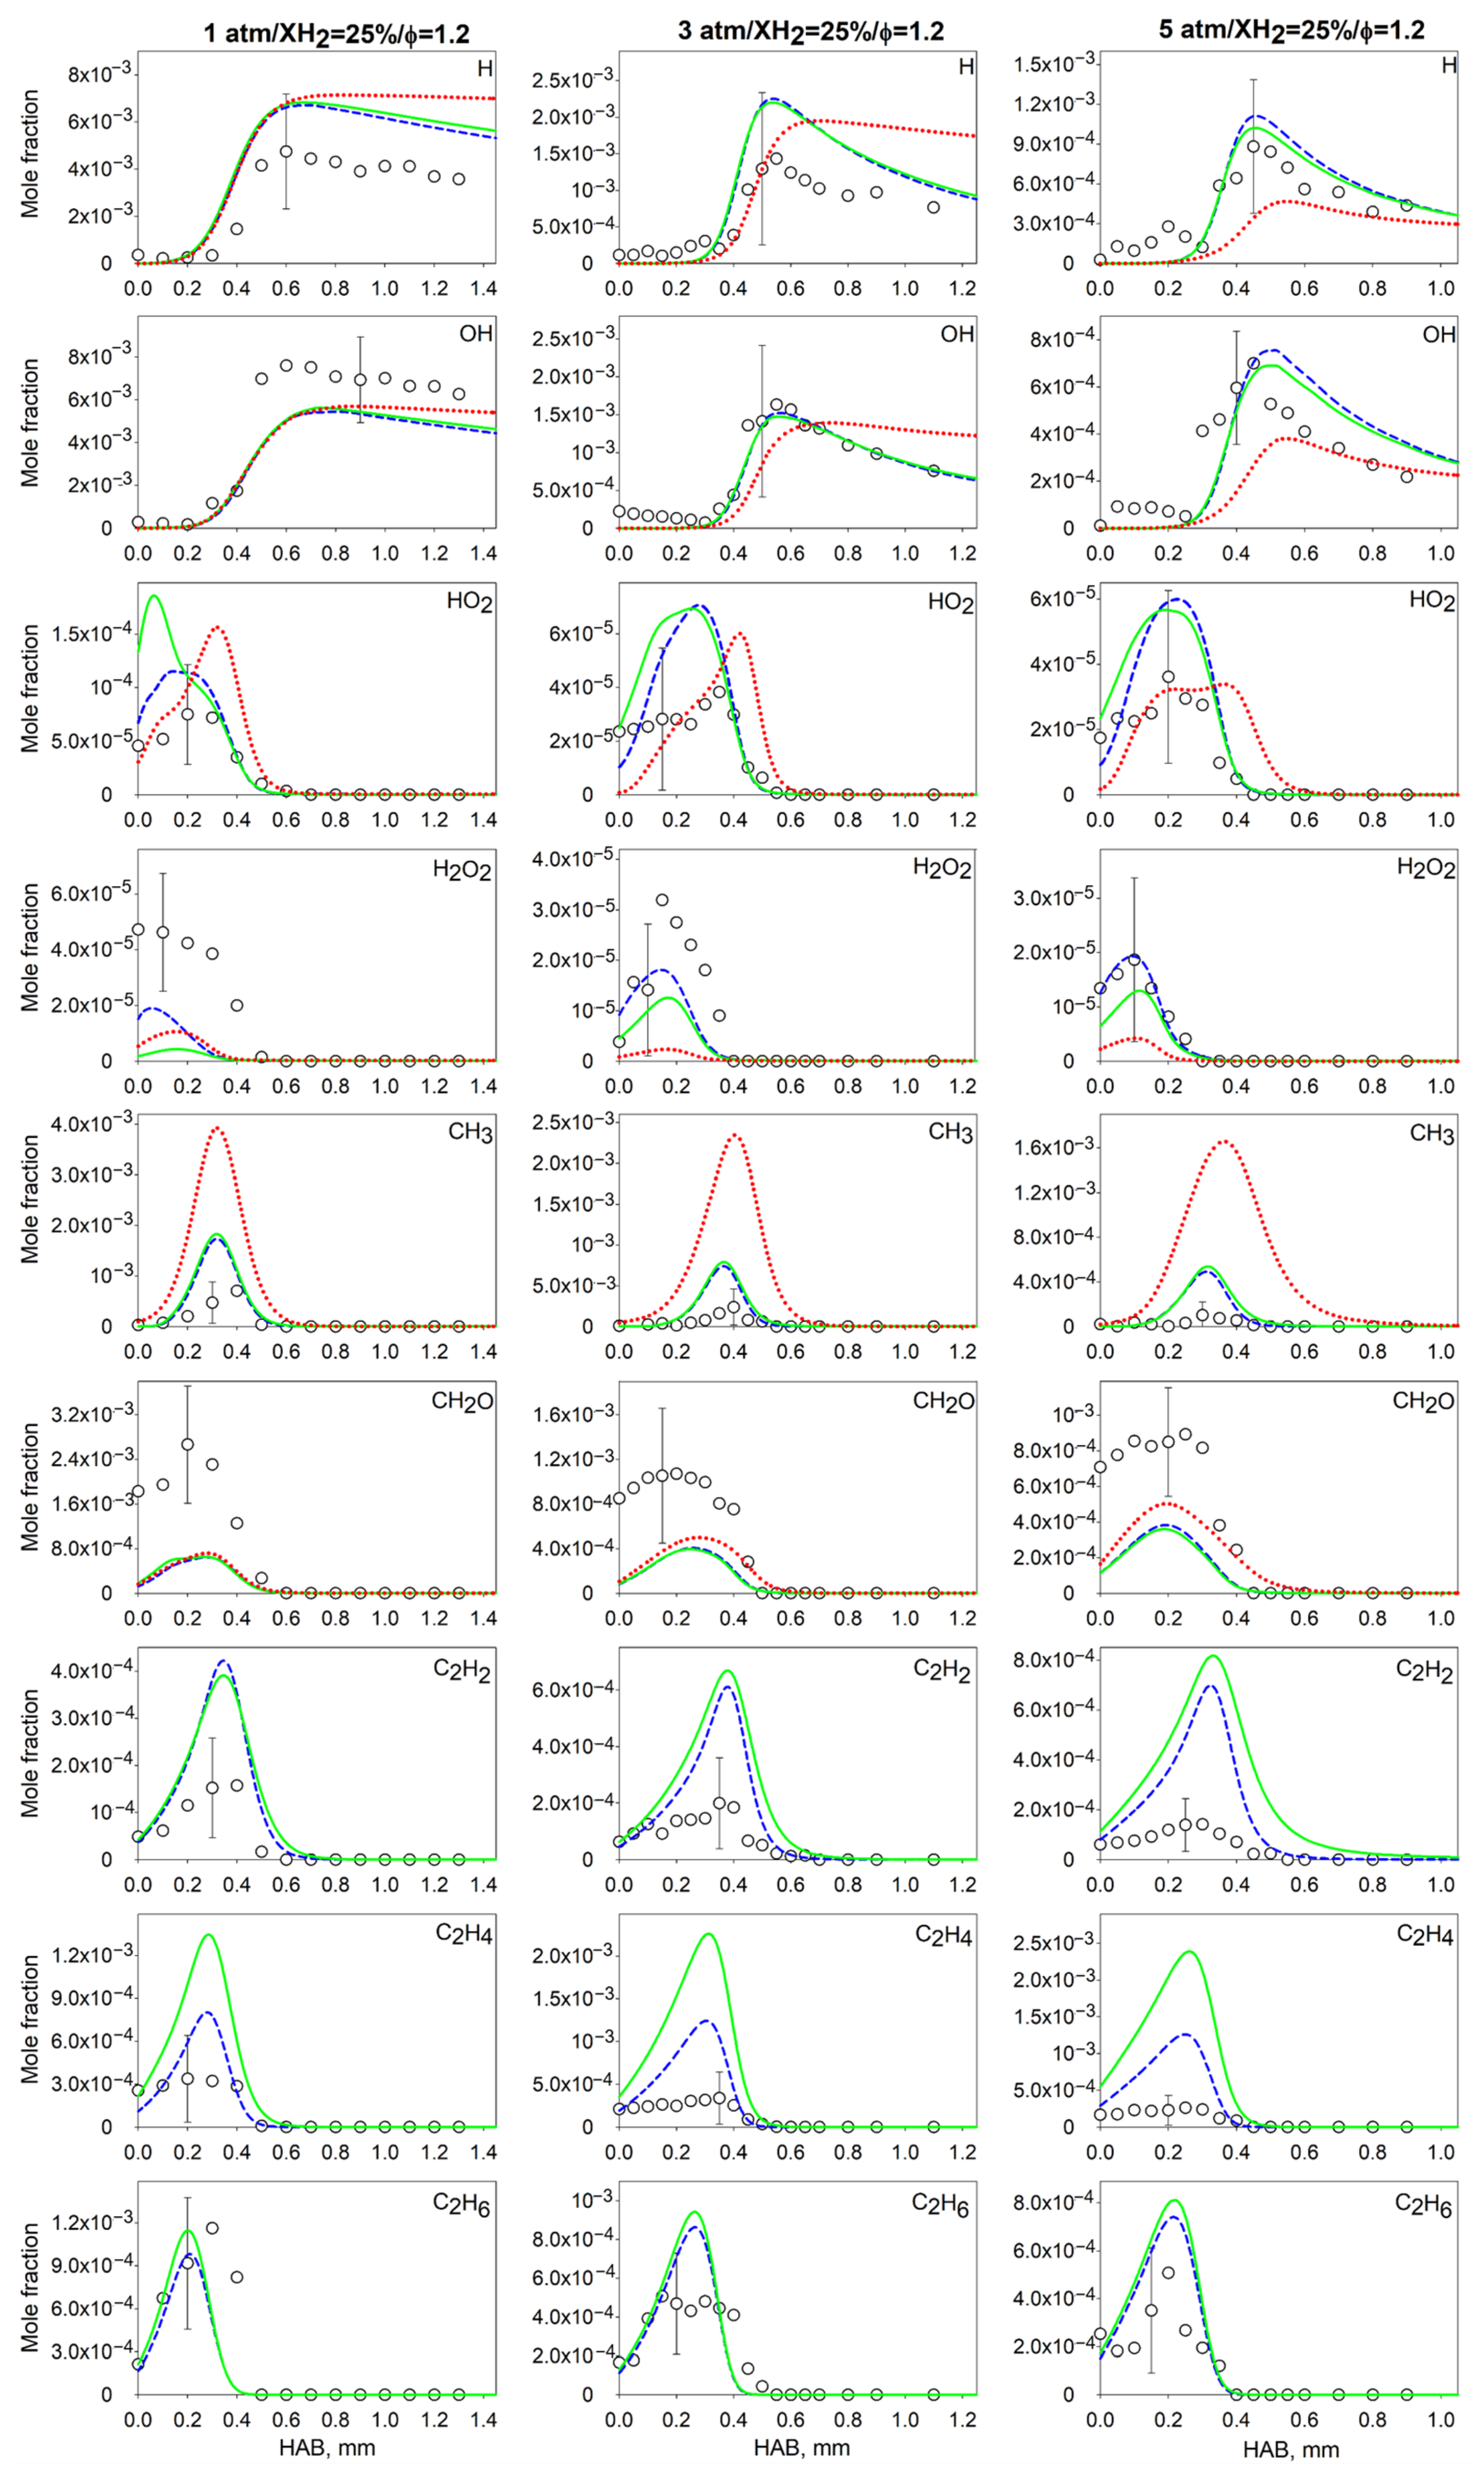
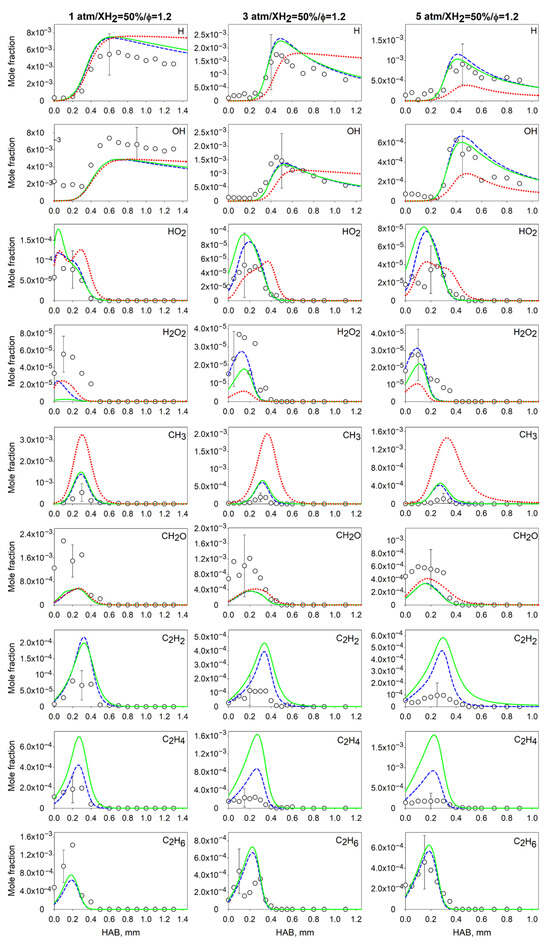
Figure A6.
Spatial mole fraction profiles of the intermediates measured in the flames with XH2 = 50% at pressures of 1, 3 and 5 atm and φ = 1.2. Symbols: experiment; lines: simulation. Dashed (blue) line: AramcoMech 2.0; solid (green) line: RMech1; dotted (red) line: RMech2.
Figure A6.
Spatial mole fraction profiles of the intermediates measured in the flames with XH2 = 50% at pressures of 1, 3 and 5 atm and φ = 1.2. Symbols: experiment; lines: simulation. Dashed (blue) line: AramcoMech 2.0; solid (green) line: RMech1; dotted (red) line: RMech2.
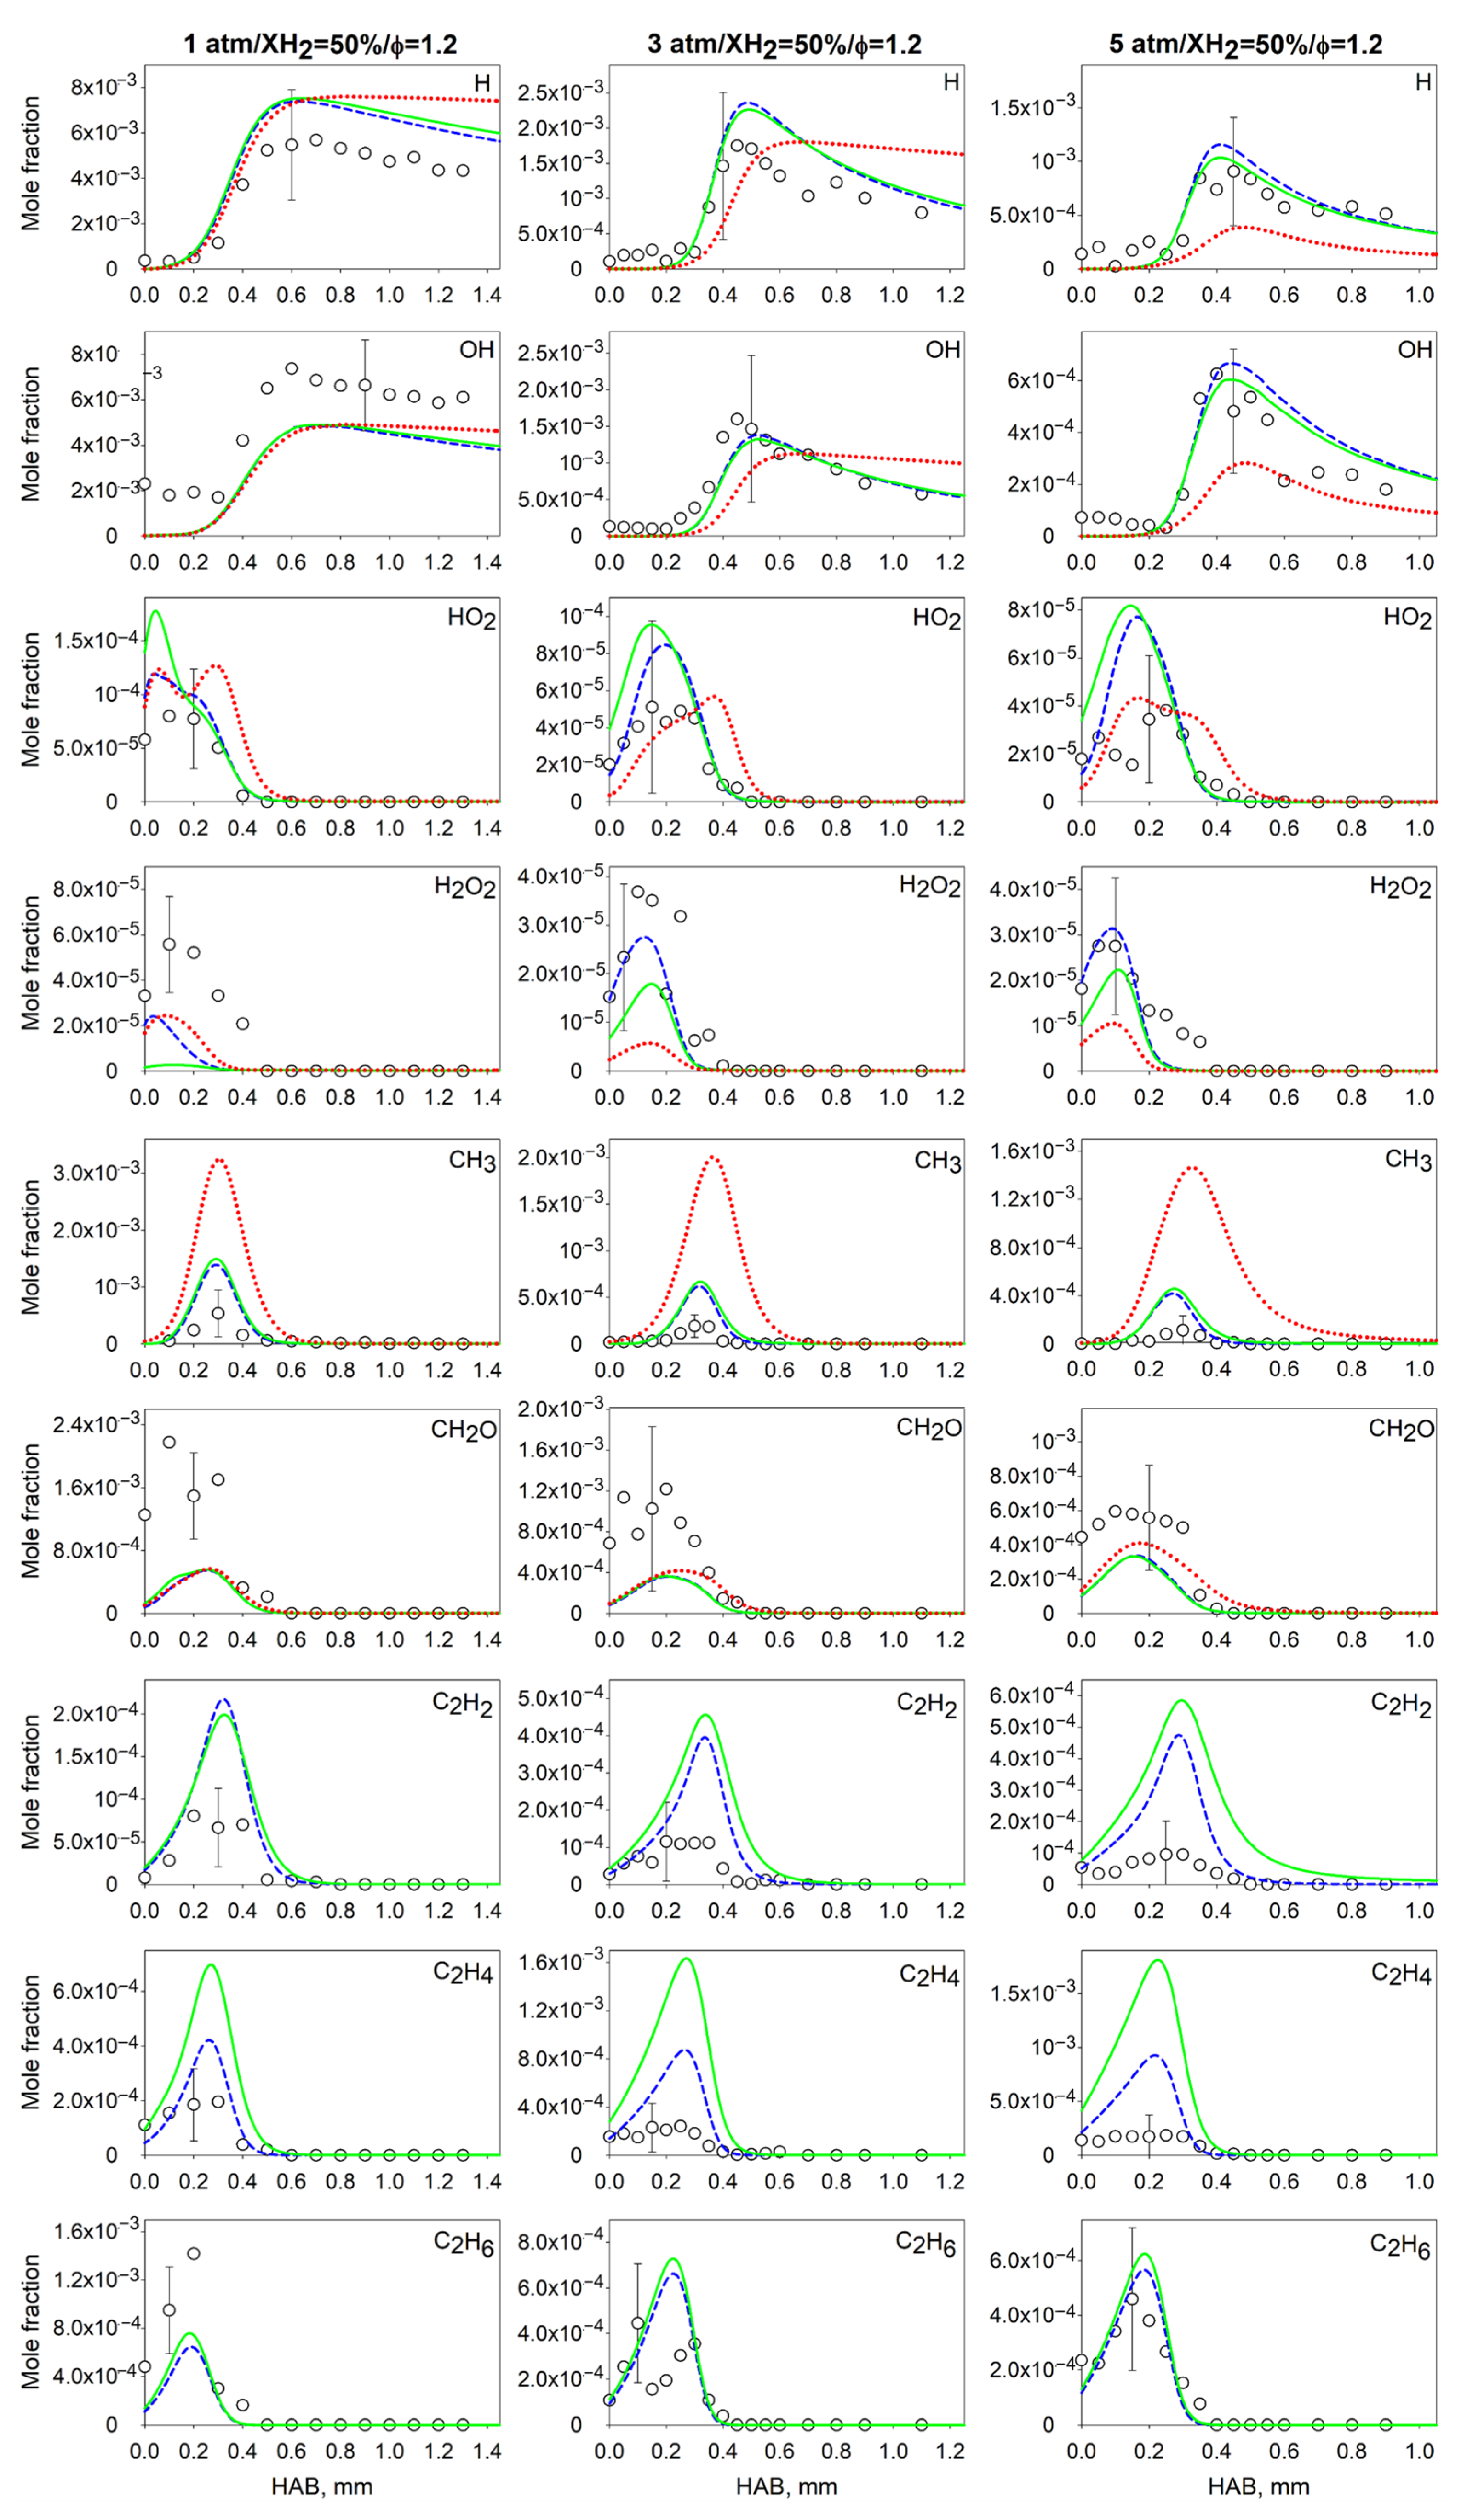
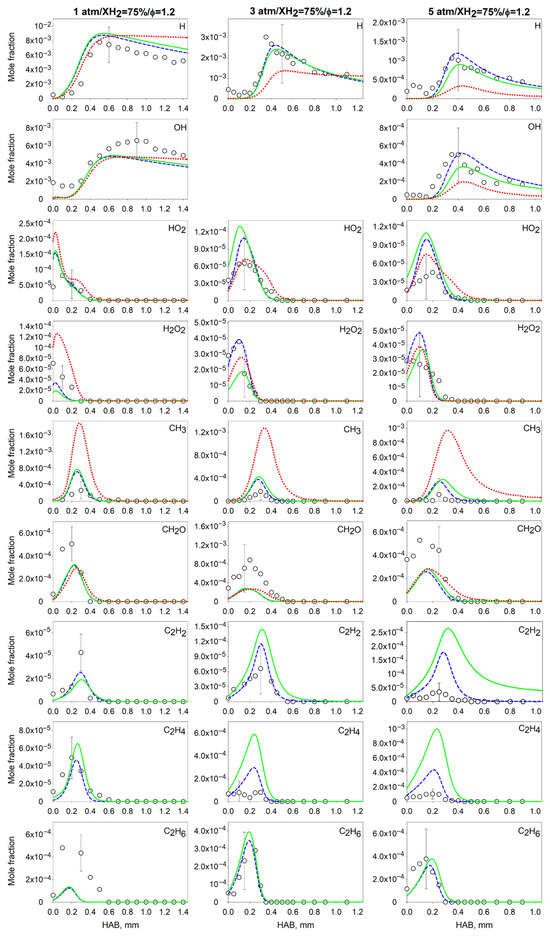
Figure A7.
Spatial mole fraction profiles of the intermediates measured in the flames with XH2 = 75% at pressures of 1, 3 and 5 atm and φ = 1.2. Symbols: experiment; lines: simulation. Dashed (blue) line: AramcoMech 2.0; solid (green) line: RMech1; dotted (red) line: RMech2.
Figure A7.
Spatial mole fraction profiles of the intermediates measured in the flames with XH2 = 75% at pressures of 1, 3 and 5 atm and φ = 1.2. Symbols: experiment; lines: simulation. Dashed (blue) line: AramcoMech 2.0; solid (green) line: RMech1; dotted (red) line: RMech2.
References
- Lefebvre, A.H.; Ballal, D.R. Gas Turbine Combustion: Alternative Fuels and Emissions, 3rd ed.; CRC Press: Boca Raton, FL, USA, 2010; ISBN 978-1-4200-8605-8. [Google Scholar]
- Taamallah, S.; Vogiatzaki, K.; Alzahrani, F.M.; Mokheimer, E.M.A.; Habib, M.A.; Ghoniem, A.F. Fuel Flexibility, Stability and Emissions in Premixed Hydrogen-Rich Gas Turbine Combustion: Technology, Fundamentals, and Numerical Simulations. Appl. Energy 2015, 154, 1020–1047. [Google Scholar] [CrossRef]
- Ozturk, M.; Dincer, I. System Development and Assessment for Green Hydrogen Generation and Blending with Natural Gas. Energy 2022, 261, 125233. [Google Scholar] [CrossRef]
- Makaryan, I.A.; Sedov, I.V.; Salgansky, E.A.; Arutyunov, A.V.; Arutyunov, V.S. A Comprehensive Review on the Prospects of Using Hydrogen–Methane Blends: Challenges and Opportunities. Energies 2022, 15, 2265. [Google Scholar] [CrossRef]
- Yan, F.; Xu, L.; Wang, Y. Application of Hydrogen Enriched Natural Gas in Spark Ignition IC Engines: From Fundamental Fuel Properties to Engine Performances and Emissions. Renew. Sustain. Energy Rev. 2018, 82, 1457–1488. [Google Scholar] [CrossRef]
- Xiang, L.; Jiang, H.; Ren, F.; Chu, H.; Wang, P. Numerical Study of the Physical and Chemical Effects of Hydrogen Addition on Laminar Premixed Combustion Characteristics of Methane and Ethane. Int. J. Hydrogen Energy 2020, 45, 20501–20514. [Google Scholar] [CrossRef]
- Dong, H.; Li, R.; Zhao, W.; Zhang, Y.; Chen, X.; Zhang, Q.; Cao, M.; Liu, F. Chemical Kinetics Properties and the Influences of Different Hydrogen Blending Ratios on Reactions of Natural Gas. Case Stud. Therm. Eng. 2023, 41, 102676. [Google Scholar] [CrossRef]
- Ghenai, C. Combustion of Sustainable and Renewable Biohythane Fuel in Trapped Vortex Combustor. Case Stud. Therm. Eng. 2019, 14, 100498. [Google Scholar] [CrossRef]
- Agostinelli, P.W.; Laera, D.; Chterev, I.; Boxx, I.; Gicquel, L.; Poinsot, T. Large Eddy Simulations of Mean Pressure and H2 Addition Effects on the Stabilization and Dynamics of a Partially-Premixed Swirled-Stabilized Methane Flame. Combust. Flame 2023, 249, 112592. [Google Scholar] [CrossRef]
- Lu, T.; Law, C.K. A Directed Relation Graph Method for Mechanism Reduction. Proc. Combust. Inst. 2005, 30, 1333–1341. [Google Scholar] [CrossRef]
- Franzelli, B.; Riber, E.; Cuenot, B. Impact of the Chemical Description on a Large Eddy Simulation of a Lean Partially Premixed Swirled Flame. Comptes Rendus Mécanique 2013, 341, 247–256. [Google Scholar] [CrossRef]
- Drost, S.; Eckart, S.; Yu, C.; Schießl, R.; Krause, H.; Maas, U. Numerical and Experimental Investigations of CH4/H2 Mixtures: Ignition Delay Times, Laminar Burning Velocity and Extinction Limits. Energies 2023, 16, 2621. [Google Scholar] [CrossRef]
- Davazdah Emami, S.; Kasmani, R.M.; Hamid, M.D.; Che Hassan, C.R.; Mokhtar, K.M. Kinetic and Dynamic Analysis of Hydrogen-Enrichment Mixtures in Combustor Systems—A Review Paper. Renew. Sustain. Energy Rev. 2016, 62, 1072–1082. [Google Scholar] [CrossRef]
- Eckart, S.; Zsély, I.G.; Krause, H.; Turányi, T. Effect of the Variation of Oxygen Concentration on the Laminar Burning Velocities of Hydrogen-Enriched Methane Flames. Int. J. Hydrogen Energy 2023, in press. [CrossRef]
- AL-Khafaji, M.; Yang, J.; Tomlin, A.S.; Thompson, H.M.; de Boer, G.; Liu, K.; Morsy, M.E. Laminar Burning Velocities and Markstein Numbers for Pure Hydrogen and Methane/Hydrogen/Air Mixtures at Elevated Pressures. Fuel 2023, 354, 129331. [Google Scholar] [CrossRef]
- Nilsson, E.J.K.; van Sprang, A.; Larfeldt, J.; Konnov, A.A. The Comparative and Combined Effects of Hydrogen Addition on the Laminar Burning Velocities of Methane and Its Blends with Ethane and Propane. Fuel 2017, 189, 369–376. [Google Scholar] [CrossRef]
- Zhang, Y.; Jiang, X.; Wei, L.; Zhang, J.; Tang, C.; Huang, Z. Experimental and Modeling Study on Auto-Ignition Characteristics of Methane/Hydrogen Blends under Engine Relevant Pressure. Int. J. Hydrogen Energy 2012, 37, 19168–19176. [Google Scholar] [CrossRef]
- Petersen, E.L.; Hall, J.M.; Smith, S.D.; de Vries, J.; Amadio, A.R.; Crofton, M.W. Ignition of Lean Methane-Based Fuel Blends at Gas Turbine Pressures. J. Eng. Gas Turbines Power 2007, 129, 937–944. [Google Scholar] [CrossRef]
- Jin, H.; Yuan, W.; Li, W.; Yang, J.; Zhou, Z.; Zhao, L.; Li, Y.; Qi, F. Combustion Chemistry of Aromatic Hydrocarbons. Prog. Energy Combust. Sci. 2023, 96, 101076. [Google Scholar] [CrossRef]
- Yang, X.; Wang, T.; Zhang, Y.; Zhang, H.; Wu, Y.; Zhang, J. Hydrogen Effect on Flame Extinction of Hydrogen-Enriched Methane/Air Premixed Flames: An Assessment from the Combustion Safety Point of View. Energy 2022, 239, 122248. [Google Scholar] [CrossRef]
- Long, A.E.; Burbano, H.; Speth, R.L.; Movaghar, A.; Egolfopoulos, F.N.; Green, W.H. An Apparatus-Independent Extinction Strain Rate in Counterflow Flames. Proc. Combust. Inst. 2019, 37, 1979–1987. [Google Scholar] [CrossRef]
- Fotache, C.G.; Kreutz, T.G.; Law, C.K. Ignition of Hydrogen-Enriched Methane by Heated Air. Combust. Flame 1997, 110, 429–440. [Google Scholar] [CrossRef]
- Wang, J.; Hu, E.; Huang, Z.; Ma, Z.; Tian, Z.; Wang, J.; Li, Y. An Experimental Study of Premixed Laminar Methane/Oxygen/Argon Flames Doped with Hydrogen at Low Pressure with Synchrotron Photoionization. Chin. Sci. Bull. 2008, 53, 1262–1269. [Google Scholar] [CrossRef]
- Cong, T.L.; Dagaut, P. Experimental and Detailed Kinetic Modeling of the Oxidation of Methane and Methane/Syngas Mixtures and Effect of Carbon Dioxide Addition. Combust. Sci. Technol. 2008, 180, 2046–2091. [Google Scholar] [CrossRef]
- Katoh, A.; Oyama, H.; Kitagawa, K.; Gupta, A.K. Visualization of OH Radical Distribution in a Methane-Hydrogen Mixture Flame by Isotope Shift/Planar Laser Induced Fluorescence Spectroscopy. Combust. Sci. Technol. 2006, 178, 2061–2074. [Google Scholar] [CrossRef]
- GRI-Mech 3.0. Available online: http://combustion.berkeley.edu/gri-mech/version30/text30.html#cite (accessed on 5 January 2022).
- Sun, Y.; Zhang, Y.; Huang, M.; Li, Q.; Wang, W.; Zhao, D.; Cheng, S.; Deng, H.; Du, J.; Song, Y.; et al. Effect of Hydrogen Addition on the Combustion and Emission Characteristics of Methane under Gas Turbine Relevant Operating Condition. Fuel 2022, 324, 124707. [Google Scholar] [CrossRef]
- Liu, J.; Zhang, X.; Wang, T.; Hou, X.; Zhang, J.; Zheng, S. Numerical Study of the Chemical, Thermal and Diffusion Effects of H2 and CO Addition on the Laminar Flame Speeds of Methane–Air Mixture. Int. J. Hydrogen Energy 2015, 40, 8475–8483. [Google Scholar] [CrossRef]
- Park, J.-W.; Oh, C.B. Flame Structure and Global Flame Response to the Equivalence Ratios of Interacting Partially Premixed Methane and Hydrogen Flames. Int. J. Hydrogen Energy 2012, 37, 7877–7888. [Google Scholar] [CrossRef]
- Wang, J.; Huang, Z.; Tang, C.; Miao, H.; Wang, X. Numerical Study of the Effect of Hydrogen Addition on Methane–Air Mixtures Combustion. Int. J. Hydrogen Energy 2009, 34, 1084–1096. [Google Scholar] [CrossRef]
- Stylianidis, N.; Azimov, U.; Birkett, M. Investigation of the Effect of Hydrogen and Methane on Combustion of Multicomponent Syngas Mixtures Using a Constructed Reduced Chemical Kinetics Mechanism. Energies 2019, 12, 2442. [Google Scholar] [CrossRef]
- Felden, A.; Esclapez, L.; Riber, E.; Cuenot, B.; Wang, H. Including Real Fuel Chemistry in LES of Turbulent Spray Combustion. Combust. Flame 2018, 193, 397–416. [Google Scholar] [CrossRef]
- Felden, A.; Pepiot, P.; Esclapez, L.; Riber, E.; Cuenot, B. Including Analytically Reduced Chemistry (ARC) in CFD Applications. Acta Astronaut. 2019, 158, 444–459. [Google Scholar] [CrossRef]
- Mulla, I.A.; Dowlut, A.; Hussain, T.; Nikolaou, Z.M.; Chakravarthy, S.R.; Swaminathan, N.; Balachandran, R. Heat Release Rate Estimation in Laminar Premixed Flames Using Laser-Induced Fluorescence of CH2O and H-Atom. Combust. Flame 2016, 165, 373–383. [Google Scholar] [CrossRef]
- Carter, C.D.; Skiba, A.W.; Boxx, I.; Allison, P.M. Optimal Approaches to Formaldehyde Planar Laser-Induced Fluorescence. Combust. Flame 2022, 246, 112431. [Google Scholar] [CrossRef]
- Wan, M.; Sun, M.; Wu, G.; Gao, Q.; Li, B.; Wang, H.; Sun, Y.; Zhu, J. Simultaneous CH3 and CH2O Imaging in Premixed Turbulent Flames for Instantaneous Flame Structure Visualization. Acta Astronaut. 2022, 191, 317–325. [Google Scholar] [CrossRef]
- Osipova, K.N.; Sarathy, S.M.; Korobeinichev, O.P.; Shmakov, A.G. Chemical Structure of Premixed Ammonia/Hydrogen Flames at Elevated Pressures. Combust. Flame 2022, 246, 112419. [Google Scholar] [CrossRef]
- Botha, J.P.; Spalding, D.B. The Laminar Flame Speed of Propane/Air Mixtures with Heat Extraction from the Flame. Proc. R. Soc. Lond. Ser. A Math. Phys. Sci. 1954, 225, 71–96. [Google Scholar] [CrossRef]
- Kim, Y.-K.; Irikura, K.K.; Rudd, M.E.; Ali, M.A.; Stone, P.M. Electron-Impact Cross Sections for Ionization and Excitation Database. Available online: https://www.nist.gov/pml/electron-impact-cross-sections-ionization-and-excitation-database (accessed on 26 October 2016).
- Cool, T.A.; Nakajima, K.; Taatjes, C.A.; McIlroy, A.; Westmoreland, P.R.; Law, M.E.; Morel, A. Studies of a Fuel-Rich Propane Flame with Photoionization Mass Spectrometry. Proc. Combust. Inst. 2005, 30, 1681–1688. [Google Scholar] [CrossRef]
- Dmitriev, A.M.; Agafontsev, M.V.; Loboda, E.L.; Knyazkov, D.A.; Korobeinichev, O.P. Measuring the Surface Temperature of a Molecular Beam Probe in the Flame Front at Pressures of 1–5 Atm. Combust. Explos. Shock Waves 2019, 55, 555–561. [Google Scholar] [CrossRef]
- Tereshchenko, A.G.; Knyazkov, D.A.; Skovorodko, P.A.; Paletsky, A.A.; Korobeinichev, O.P. Perturbations of the Flame Structure Due to a Thermocouple. I. Experiment. Combust. Explos. Shock Waves 2011, 47, 403–413. [Google Scholar] [CrossRef]
- Shaddix, C.R. Correcting Thermocouple Measurements for Radiation Loss: A Critical Review; Sandia National Labs.: Livermore, CA, USA, 1999. [Google Scholar]
- Ansys Chemkin-Pro: Combustion Simulation Software. Available online: https://www.ansys.com/products/fluids/ansys-chemkin-pro (accessed on 13 March 2020).
- Sarathy, S.M.; Thomson, M.J.; Togbé, C.; Dagaut, P.; Halter, F.; Mounaim-Rousselle, C. An Experimental and Kinetic Modeling Study of N-Butanol Combustion. Combust. Flame 2009, 156, 852–864. [Google Scholar] [CrossRef]
- Li, Y.; Zhou, C.-W.; Somers, K.P.; Zhang, K.; Curran, H.J. The Oxidation of 2-Butene: A High Pressure Ignition Delay, Kinetic Modeling Study and Reactivity Comparison with Isobutene and 1-Butene. Proc. Combust. Inst. 2017, 36, 403–411. [Google Scholar] [CrossRef]
- Mechanism Workbench—Kintech Laboratory—R&D Service and Software for Predicitve Physical Chemical Modeling. Available online: https://www.kintechlab.com/products/mechanism-workbench/ (accessed on 29 August 2023).
- Dmitriev, A.M.; Knyazkov, D.A.; Bolshova, T.A.; Tereshchenko, A.G.; Paletsky, A.A.; Shmakov, A.G.; Korobeinichev, O.P. Structure of CH4/O2/Ar Flames at Elevated Pressures Studied by Flame Sampling Molecular Beam Mass Spectrometry and Numerical Simulation. Combust. Flame 2015, 162, 3946–3959. [Google Scholar] [CrossRef]
- Moccia, V.; D’Alessio, J. Burning Behaviour of High-Pressure CH4-H2-Air Mixtures. Energies 2013, 6, 97–116. [Google Scholar] [CrossRef]
- Dirrenberger, P.; Le Gall, H.; Bounaceur, R.; Herbinet, O.; Glaude, P.-A.; Konnov, A.; Battin-Leclerc, F. Measurements of Laminar Flame Velocity for Components of Natural Gas. Energy Fuels 2011, 25, 3875–3884. [Google Scholar] [CrossRef]
- Cheng, R.K.; Oppenheim, A.K. Autoignition in Methane hydrogen Mixtures. Combust. Flame 1984, 58, 125–139. [Google Scholar] [CrossRef]
- Mei, B.; Zhang, J.; Ma, S.; Li, W.; Dmitriev, A.; Shmakov, A.; Bolshova, T.; Knyazkov, D.; Li, Y. Revisit Flame Chemistry of Propene at Elevated Pressures: Insight into Pressure Effects on Chemical Structure and Laminar Flame Propagation. Combust. Flame 2023, 251, 112725. [Google Scholar] [CrossRef]
- Knyazkov, D.A.; Dmitriev, A.M.; Shvartsberg, V.M.; Osipova, K.N.; Shmakov, A.G.; Korobeinichev, O.P. Study of the Chemical Structure of Laminar Premixed H2/CH4/C3H8/O2/Ar Flames at 1–5 Atm. Energy Fuels 2017, 31, 11377–11390. [Google Scholar] [CrossRef]
- Knyazkov, D.A.; Dmitriev, A.M.; Bolshova, T.A.; Shvartsberg, V.M.; Shmakov, A.G.; Korobeinichev, O.P. Structure of Premixed H2/O2/Ar Flames at 1–5atm Studied by Molecular Beam Mass Spectrometry and Numerical Simulation. Proc. Combust. Inst. 2017, 36, 1233–1240. [Google Scholar] [CrossRef]
- Abhinavam Kailasanathan, R.K.; Yelverton, T.L.B.; Fang, T.; Roberts, W.L. Effect of Diluents on Soot Precursor Formation and Temperature in Ethylene Laminar Diffusion Flames. Combust. Flame 2013, 160, 656–670. [Google Scholar] [CrossRef]
- Dmitriev, A.M.; Osipova, K.N.; Knyazkov, D.A.; Shmakov, A.G. Propylene Oxide Addition Effect on the Chemical Speciation of a Fuel-Rich Premixed n-Heptane/Toluene Flame. ACS Omega 2022, 7, 46900–46914. [Google Scholar] [CrossRef]
- Miller, J.A.; Klippenstein, S.J. The H + C2H2 (+M) ⇄ C2H3 (+M) and H + C2H2 (+M) ⇄ C2H5 (+M) Reactions: Electronic Structure, Variational Transition-State Theory, and Solutions to a Two-Dimensional Master Equation. Phys. Chem. Chem. Phys. 2004, 6, 1192–1202. [Google Scholar] [CrossRef]
- Wang, K.; Villano, S.M.; Dean, A.M. Experimental and Kinetic Modeling Study of Butene Isomer Pyrolysis: Part I. 1- and 2-Butene. Combust. Flame 2016, 173, 347–369. [Google Scholar] [CrossRef]
Disclaimer/Publisher’s Note: The statements, opinions and data contained in all publications are solely those of the individual author(s) and contributor(s) and not of MDPI and/or the editor(s). MDPI and/or the editor(s) disclaim responsibility for any injury to people or property resulting from any ideas, methods, instructions or products referred to in the content. |
© 2023 by the authors. Licensee MDPI, Basel, Switzerland. This article is an open access article distributed under the terms and conditions of the Creative Commons Attribution (CC BY) license (https://creativecommons.org/licenses/by/4.0/).