Article

An Analysis of Mechanical and Thermal Stresses, Temperature and Displacement within the Transparent Cylinder and Piston Top of a Small Direct-Injection Spark-Ignition Optical Engine

by
Ravi Velugula
1,
Balasubramanian Thiruvallur loganathan
2,
Lakshminarasimhan Varadhaiyengar
2,
Ramesh Asvathanarayanan
1 and
Mayank Mittal
1,*
1
Indian Institute of Technology Madras, Chennai 600036, India
2
TVS Motor Co., Ltd., Hosur 635109, India
*
Author to whom correspondence should be addressed.
Energies 2023, 16(21), 7400; https://doi.org/10.3390/en16217400
Submission received: 15 September 2023 / Revised: 3 October 2023 / Accepted: 4 October 2023 / Published: 2 November 2023
(This article belongs to the Section J: Thermal Management)

Abstract

:
Two- and three-wheeled vehicles account for a significant portion of the automobile market in several countries worldwide. In order to advance the capabilities of these vehicles, the integration of direct-injection (DI) technology is essential, given its potential benefits such as high thermal efficiency and low engine-out emissions. Direct injection in small-bore engines, however, further complicates the challenges involved (of DI technology) like fuel impingement and mixture inhomogeneity inside the engine cylinder, driving the need for an in-depth exploration of in-cylinder processes. Consequently, the necessity arises to develop a small-bore direct-injection spark-ignition (DISI) optical engine that incorporates a transparent cylinder and piston top. In this scenario, these transparent components are required to endure a combination of intricate loads and boundary conditions, hence the potential to result in failures. This work aims to assess numerically the effects of these loads and boundary conditions on the transparent components and optimize their thicknesses. For this purpose, a computer-aided design model of a small-bore DISI optical engine (displacement volume of 200 cm3) is developed. The mechanical and thermal loads are extracted from the experimental data and validated computational fluid dynamics model of the same engine configuration. A coupled temperature-displacement finite element analysis methodology is developed in ABAQUS/CAE, and simulations are performed under both steady and transient conditions. Temperature and combined stress distributions within the transparent cylinder and piston top are obtained and analyzed to find their optimum thicknesses. Knowing thermal gradients, combined stresses and displacements under actual conditions helped design the small optical engine with an improved factor of safety.

1. Introduction

Small automotive engines with port fuel injection are primarily employed in two- and three-wheeler vehicles, where prioritizing cost-effectiveness and economy of operation is paramount. Consequently, conducting research on these engines presents a challenge due to the need to improve power output while maintaining fuel economy, emissions and efficiency. All of these objectives must be met through the utilization of simple and cost-effective technologies. In recent times, automobiles (four-wheelers) equipped with direct-injection spark-ignition (DISI) engines have shown substantial potential in enhancing combustion efficiency and reducing emissions [1,2]. Conversely, given that fuel is directly injected into the cylinder in DISI engines, fuel can come into contact with the piston and cylinder surfaces, leading to potential impingement [3,4,5]. Moreover, a significant issue in DISI engines is the formation of an inhomogeneous mixture due to insufficient time for mixture preparation [6]. In conclusion, despite their advantages, DISI engines face challenges such as wall wetting, mixture inhomogeneity caused by limited time for mixture preparation and elevated hydrocarbon emissions at low loads, as well as increased NOx emissions at high loads. These challenges become more pronounced when dealing with two- and three-wheeler vehicles due to their smaller engine size [7,8]. Comprehensively, in DISI engines, charge motion and mixture preparation have been determined to have the greatest impact on engine efficiency and combustion stability [9,10]. As a result, comprehending the intricate in-cylinder processes becomes crucial for development of small DISI engines for two- and three-wheeler applications.
Optical engines have been useful by providing details of both temporal and spatial variations of in-cylinder processes. In optical engines, a transparent cylinder replaces the conventional metal cylinder to make the entire combustion chamber visible. In addition, the elongated piston has a transparent window at the top, allowing the laser sheet to illuminate the flow or access the camera for viewing purposes [11]. In contrast to conventional SI optical engines, optical engines incorporating DI technology demonstrate increased thermal loads, such as combustion and frictional heat fluxes, as well as elevated mechanical loads, like combustion and clamping pressures. Complex boundary conditions further compound these conditions. This is attributed to the enhanced thermal efficiency and in-cylinder pressure inherent to DISI technology. Therefore, the transparent components, such as the cylinder and piston top, are subjected to rigorous thermal and mechanical loads [12]. Given these circumstances, researchers are compelled to refine the design of these transparent components through a meticulous finite element analysis, thereby guaranteeing an enhanced factor of safety. Over the last few decades, numerous optical engines have been developed, integrating transparent components into their designs. A comprehensive discussion of optical engines integrating transparent components into their designs, along with limitations, is provided in the subsequent section.
Bowditch [13] made crucial advancements in optical engine design by placing a mirror with a 45° inclination in the slot of an extended piston. This arrangement made the mirror stationary irrespective of the engine operation. As a result, the transparent piston top window, via the mirror, allowed optical access to the interior of the engine cylinder. In the initial design, a transparent Pyrex disc between the cylinder and the head consistently fractured when the engine ran for more than a few minutes due to a differing thermal expansion coefficient with the metallic surfaces. Efforts to replace Pyrex with Vycor were also unsuccessful because of surrounding material distortions, leading to Vycor disc failure. To address this issue, a water-cooled laminated quartz-metal disc was adopted. However, preventing the chipping of the quartz piston crown proved to be a challenging task. The impact of thermal and mechanical loads on transparent parts has garnered significant attention from the research community engaged in the optical engine development field. Nakanishi et al. [14] employed L-head engines equipped with quartz windows to capture images of combustion events. These experiments were conducted at low engine speed (900 rpm) and under part load condition with an intake manifold pressure of 52 kPa. Holtman and McClure [15] conducted an observation of in-cylinder flows using a fused quartz cylinder with a thickness of 2.2 mm. They operated this engine in both motored and limited fired-cycle conditions. Richman and Reynold [12] developed an optical engine employing a transparent single-crystal sapphire cylinder. They applied a basic heat transfer model and analytical equations for a stress analysis in the transparent cylinder, making certain assumptions. The results showed that mechanical hoop stresses decreased as the cylinder wall thickness increased while thermal stresses increased. They determined that the wall thickness of 4.45 mm minimized the stress in the sapphire cylinder. Furthermore, the selection of a 0.5 mm cylinder-piston wall clearance was made without conducting a proper displacement analysis, whereas Bates [16] used a quartz cylinder because a sapphire is brittle and has a high coefficient of thermal expansion, resulting in higher thermal stress levels. Based on the analytical calculations of thermal and mechanical stresses, a 1.72 mm thick quartz cylinder was chosen for motoring investigations. The primary limitations of the aforementioned works are associated with the reliance on assumptions in the analytical equations, which resulted in approximate analyses instead of exact ones. Contrariwise, Lee and Assanis [17] developed a finite element approach for predicting the temperature and stress distributions in the quartz cylinder of an optical engine. In the course of conducting the finite element analysis (FEA), thermal and mechanical loads were subsequently introduced. However, the subsequent application of these loads onto the transparent components may not precisely indicate the actual loading conditions. To the authors’ best knowledge, no additional research has been undertaken to examine the combined analysis of thermal and mechanical stresses, temperature distributions and/or displacements in the transparent components of an optical engine simultaneously.
While numerous investigations in the literature have focused on a thermo-mechanical analysis using a finite element analysis for conventional engine parts during the design phase, the knowledge obtained from this literature work has been instrumental in framing the methodology employed in the present study. Lowe and Morel [18] developed a thermo-mechanical FEA tool for engine components. Thermal boundary conditions such as the temperature and heat transfer coefficient were calculated separately using commercial computational fluid dynamics’ (CFD) codes. Later, a thermal analysis was conducted using predicted thermal boundary conditions, and the results were subsequently applied to a structural analysis. Similarly, Roy et al. [19] employed commercial CFD software for a thermal analysis, while a stress analysis was conducted using FEA software. These analyses were subsequently executed, leading to a considerable time investment. Javanmardi and Rezvani [20] used a CFD study to predict the thermal boundary conditions that were applied to the cylinder liner segment by segment. In order to examine the deformation of a cylinder liner, Barbieri et al. [21] conducted a simplified finite element analysis on a turbocharged eight-cylinder V-type four-stroke engine, with each cylinder having a displacement volume of 487.5 cm3. Liu et al. [22] calculated the temperature and the heat transfer coefficient of a piston crown using analytical equations while performing a thermo-mechanical analysis of the piston. The literature referenced was constrained to engines of a larger size featuring more than two valves. The role of optical engines in advancing internal combustion engine development is worth acknowledging, including their diverse applications, which are discussed in the following section.
An optically accessible, single-cylinder, port-fuel-injection (PFI) engine with a displacement volume of 110 cm3 was used in [23,24], and the experiments were carried out employing particle image velocimetry (PIV) at various throttle openings. Recently, the flow field was measured in a 475 cm3 optical single-cylinder four-valve gasoline direct injection engine using a 2D digital PIV approach [25]. Research on a four-stroke single-cylinder optical engine with four valves has revealed that the swirling properties of in-cylinder airflow in a DISI engine play a role in influencing the dispersion of fuel spray and the speed of flame propagation [26]. Furthermore, Tornatore and Sjöberg [27] employed advanced optical diagnostic techniques, offering spatial and temporal precision, within a transparent engine configured to operate in the partial fuel stratification mode to stabilize overall lean combustion. In [28], the authors conducted experimental and numerical investigations to characterize mixture preparation, combustion and emissions in a direct-injection natural gas optical engine. Moreover, in [29], passively fueled pre-chamber spark plugs with varying geometries (three different types) were investigated in a single-cylinder direct-injection gasoline engine, utilizing high-speed in-cylinder imaging. The primary objective was to compare the flame propagation characteristics of these pre-chamber spark plugs with those of a traditional spark plug. Apart from the PFI and GDI engines, optical engines also find applications in the development of compression ignition engines [30]. However, no studies focusing on in-cylinder processes and their interactions have been conducted in small-sized DISI engines, primarily due to the challenges associated with their design. Also, there is a lack of comprehensive details regarding the design of transparent components employed in these engines.
The primary objective of this study is to comprehensively analyze the temperatures, combined stresses (i.e., mechanical and thermal stresses) and displacements experienced by the transparent components within the optical engine. This investigation is carried out through a coupled finite element analysis approach. First, the combined loads are derived from experimental data and a validated CFD model of the same engine configuration. These loads, along with their corresponding boundary conditions, are then transferred for application onto a finite element model within ABAQUS/CAE software. Subsequently, the coupled equations governing the FEA process are solved using the ABAQUS/CAE solver. This investigation specifically pertains to the selection of transparent components for small DISI optical engines. This approach ensures improved durability and enhanced thermal performance of these transparent parts. As a result, the main contribution of this paper can be outlined as follows:
  • A small DISI optical engine is designed while maintaining the bore and stroke dimensions of its conventional metal counterpart from which (and its validated CFD model) loads and measured boundary conditions are derived. This design’s geometric specifics serve as the initial dimensions for the transparent cylinder and piston top when initiating the coupled finite element analysis for thickness optimization.
  • A coupled finite element analysis methodology is developed to analyze the combined stresses, temperatures and displacements. This methodology is then applied to the transparent components of the small DISI optical engine.
  • The optimum thicknesses of both the transparent cylinder and piston top are determined to ensure their resilience against complex loads and boundary conditions, thereby ensuring an enhanced factor of safety.
  • The research methodology outlined in this study can be applied to the advancement of optical engines, including technologies such as PFI, DISI and CI, irrespective of the fuel type. This is achievable by utilizing thermal and mechanical load data obtainable from experimental data (along with validated CFD models) of their corresponding metal counterparts.
This paper is structured as follows: The coupled FEA methodology is outlined in Section 2. In Section 3, the methodology of the coupled finite element analysis for the quartz cylinder is detailed. This section comprises subsections that focus on assumptions (Section 3.1), thermal and mechanical loads (Section 3.2) and the FEA model of the transparent cylinder (Section 3.3). Section 4 covers the application of the coupled FEA methodology to the transparent piston top. The findings and discussions are presented in Section 5. This section is further subdivided to address several aspects, such as the analysis of temperature (Section 5.1), combined stress (Section 5.2) and displacement (Section 5.3). Additionally, a transient FEA analysis and determination of optimum thickness for the transparent materials are discussed in Section 5.4 and Section 5.5, respectively. Section 6 offers a summary and conclusions.

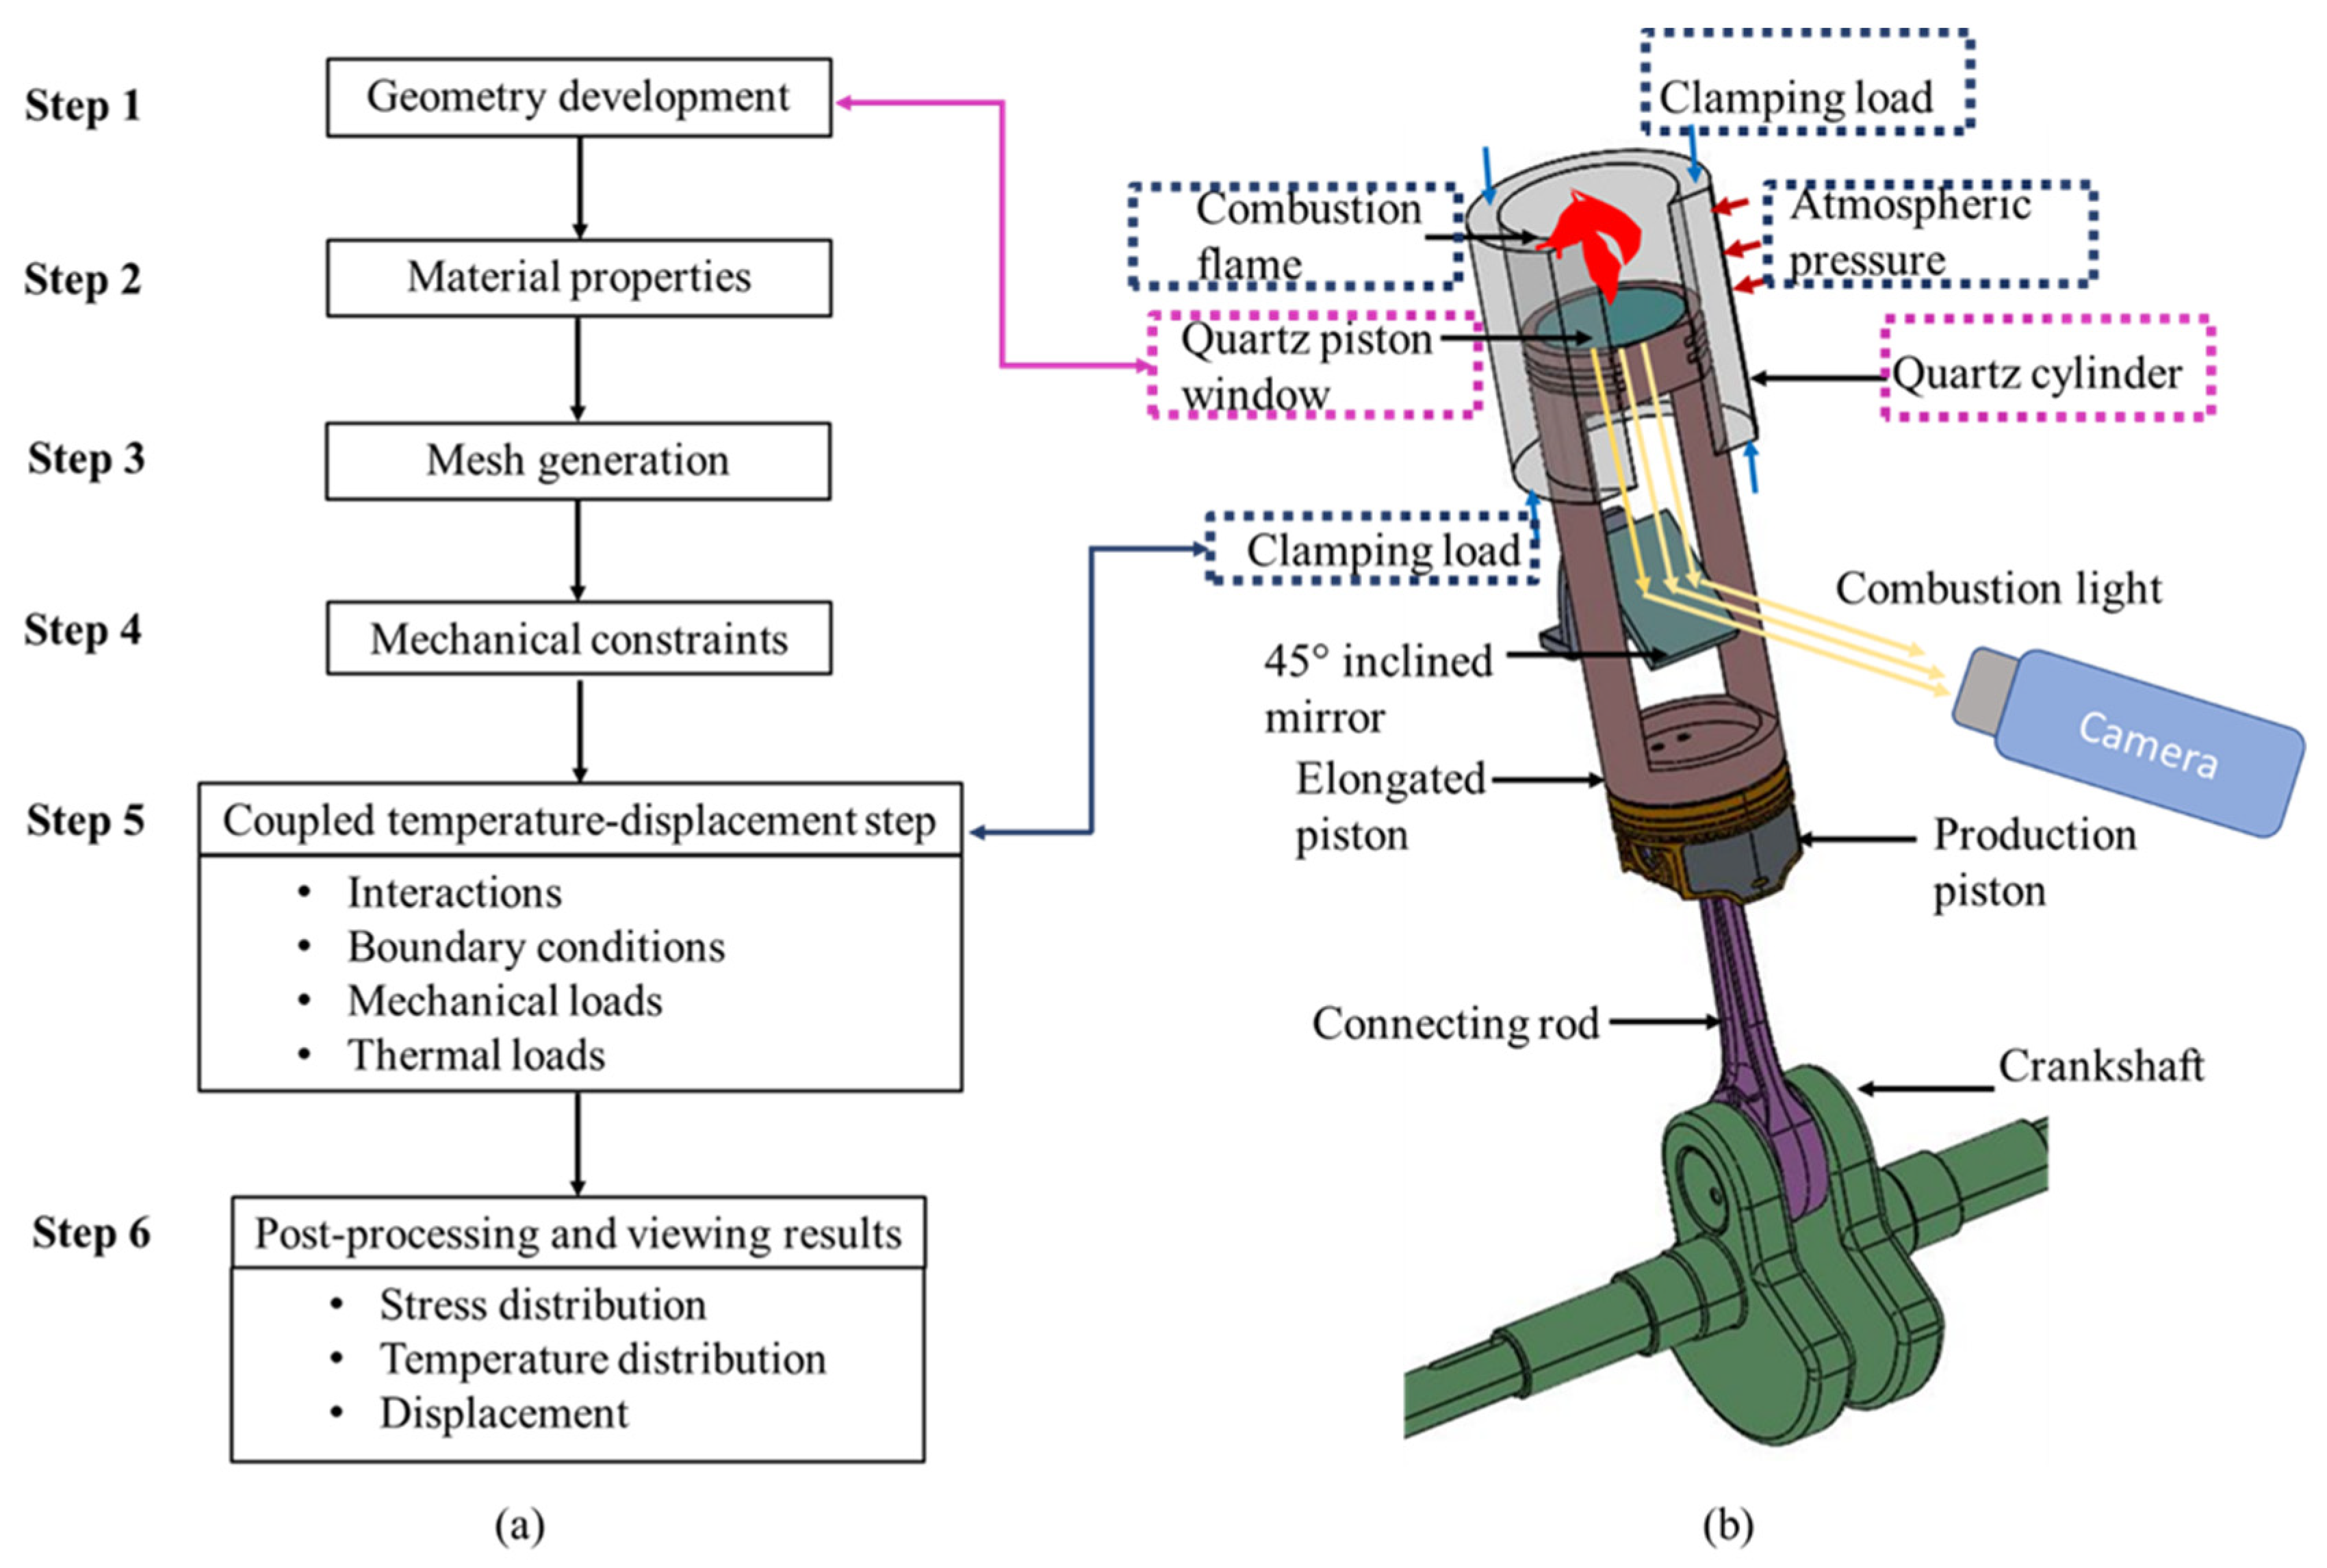
2. Methodology of Coupled Finite Element Analysis in ABAQUS/CAE

The temperature, stress and displacement fields are simultaneously solved using a combined temperature-displacement technique in which a coupled analysis is performed with interaction between thermal and mechanical solutions. This technique integrates temperatures with a backward-difference strategy. Moreover, a nonlinear coupled system is solved with Newton’s method. To implement Newton’s technique precisely, we need a coupled non-symmetric Jacobian matrix, as seen below in Equation (1) [31].
[ K u u K u θ K θ u K θ θ ] × [ Δ u Δ θ ] = [ R u R θ ] ,
where K i j are the submatrices of the fully coupled Jacobian matrix, Δ u and Δ θ are the respective corrections to the incremental displacement and temperature, while R u and R θ are the mechanical and thermal residual vectors, respectively. The governing equations, which include the above terms, were discussed in the literature [32]. The aforesaid technique allows for applying the combined loads on the quartz cylinder or piston top in a single step in the dedicated ABAQUS/CAE software, unlike the conventional methods wherein the results of a thermal stress analysis mapped with mechanical loads are used to obtain the combined stresses [17].
Figure 1a presents the exploded view of the optical engine’s computer-aided model featuring a displacement volume of 200 cm3. Figure 1b illustrates the experimental setup developed for the optical engine considering the present analysis. Both figures show the intricate environment, surrounding the transparent components within the optical engine. Furthermore, the initial dimensions of the transparent components are derived from the engine’s CAD model, serving as the basis for generating their FEA model in the context of the coupled finite element analysis.
Figure 2a presents the flow chart of the coupled finite element analysis steps. In Step 1, a computer-aided three-dimensional cylinder was created. Next, in Step 2, the developed model was applied with the properties of the quartz. Quartz properties employed for the FEA were extracted from reference [12], with essential properties repopulated in Table 1. Later, in Step 3, a 2 mm grid with a hexahedron shape was chosen for meshing. In Step 4, a fixed displacement boundary condition (mechanical constraints) was applied to the nodes at the top and bottom surfaces of the (cylinder) model. Step 5 involves the interaction between the quartz cylinder and the environment (at temperature T ) by providing a heat transfer coefficient to the outer surface. Also, both thermal and mechanical loads were applied in this step. Post-processing of temperature, combined stress (mechanical and thermal stresses) and displacement distributions, and their contours, was accomplished in the concluding step. Figure 2b depicts the various components of the optical engine. Also, it shows the different loadings on the transparent cylinder and piston top.

3. Application of the Coupled Finite Element Analysis for the Quartz Cylinder

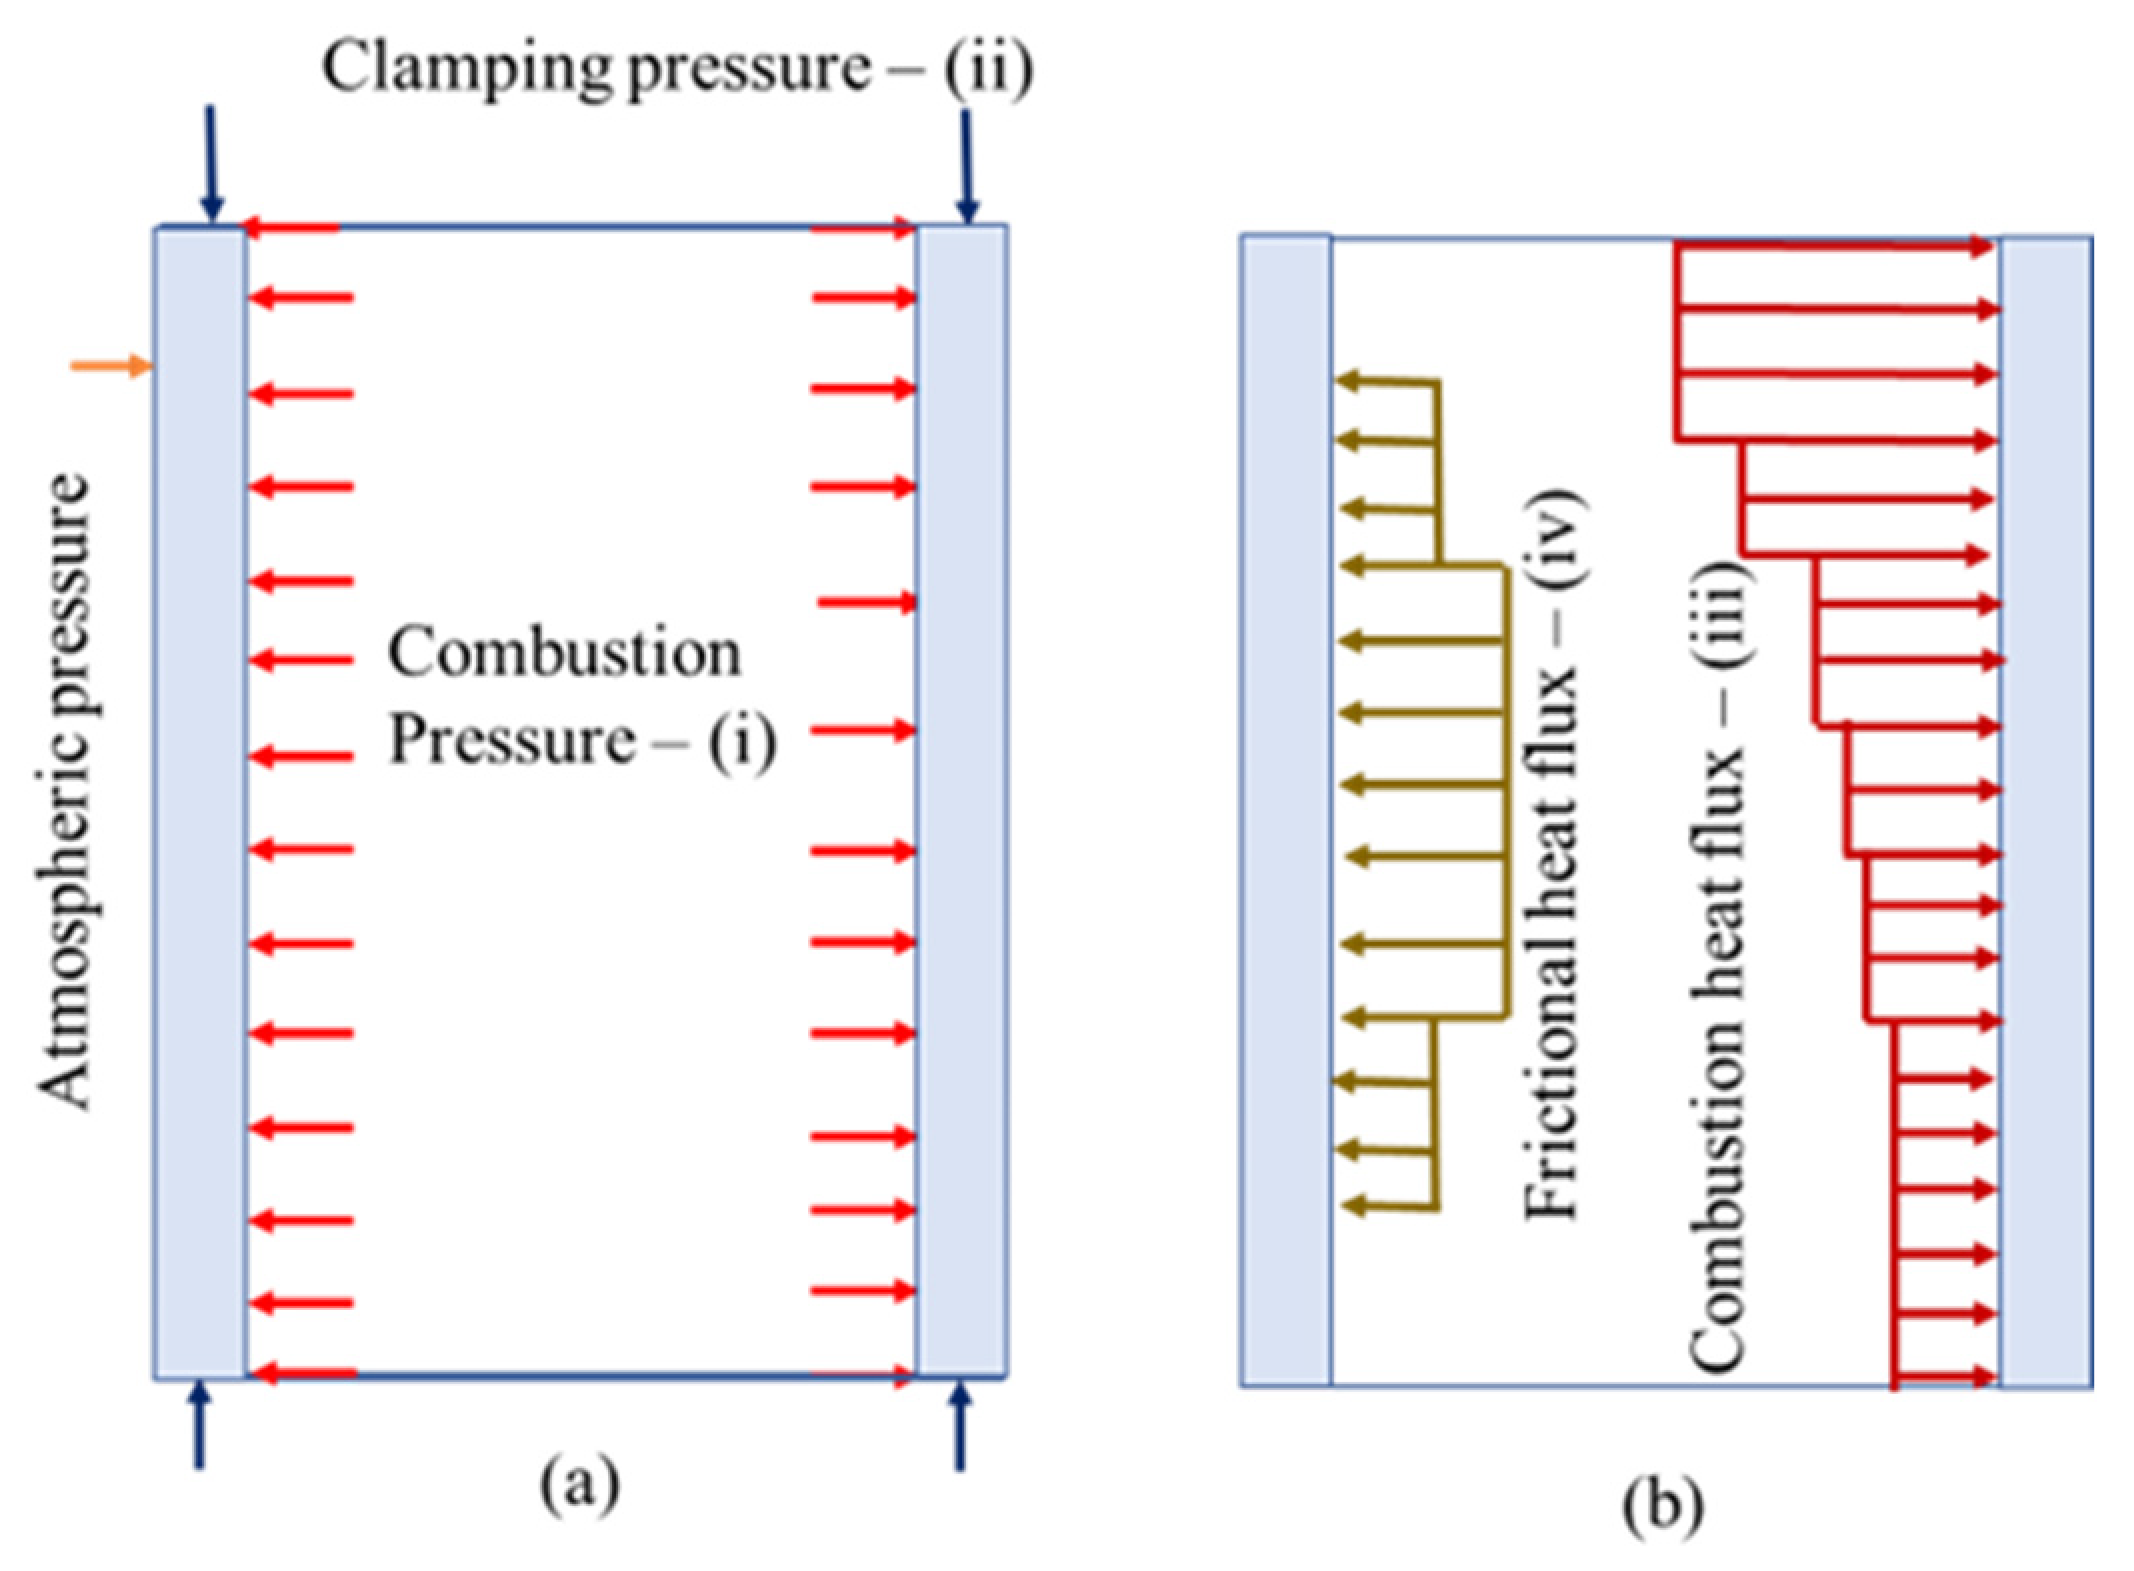
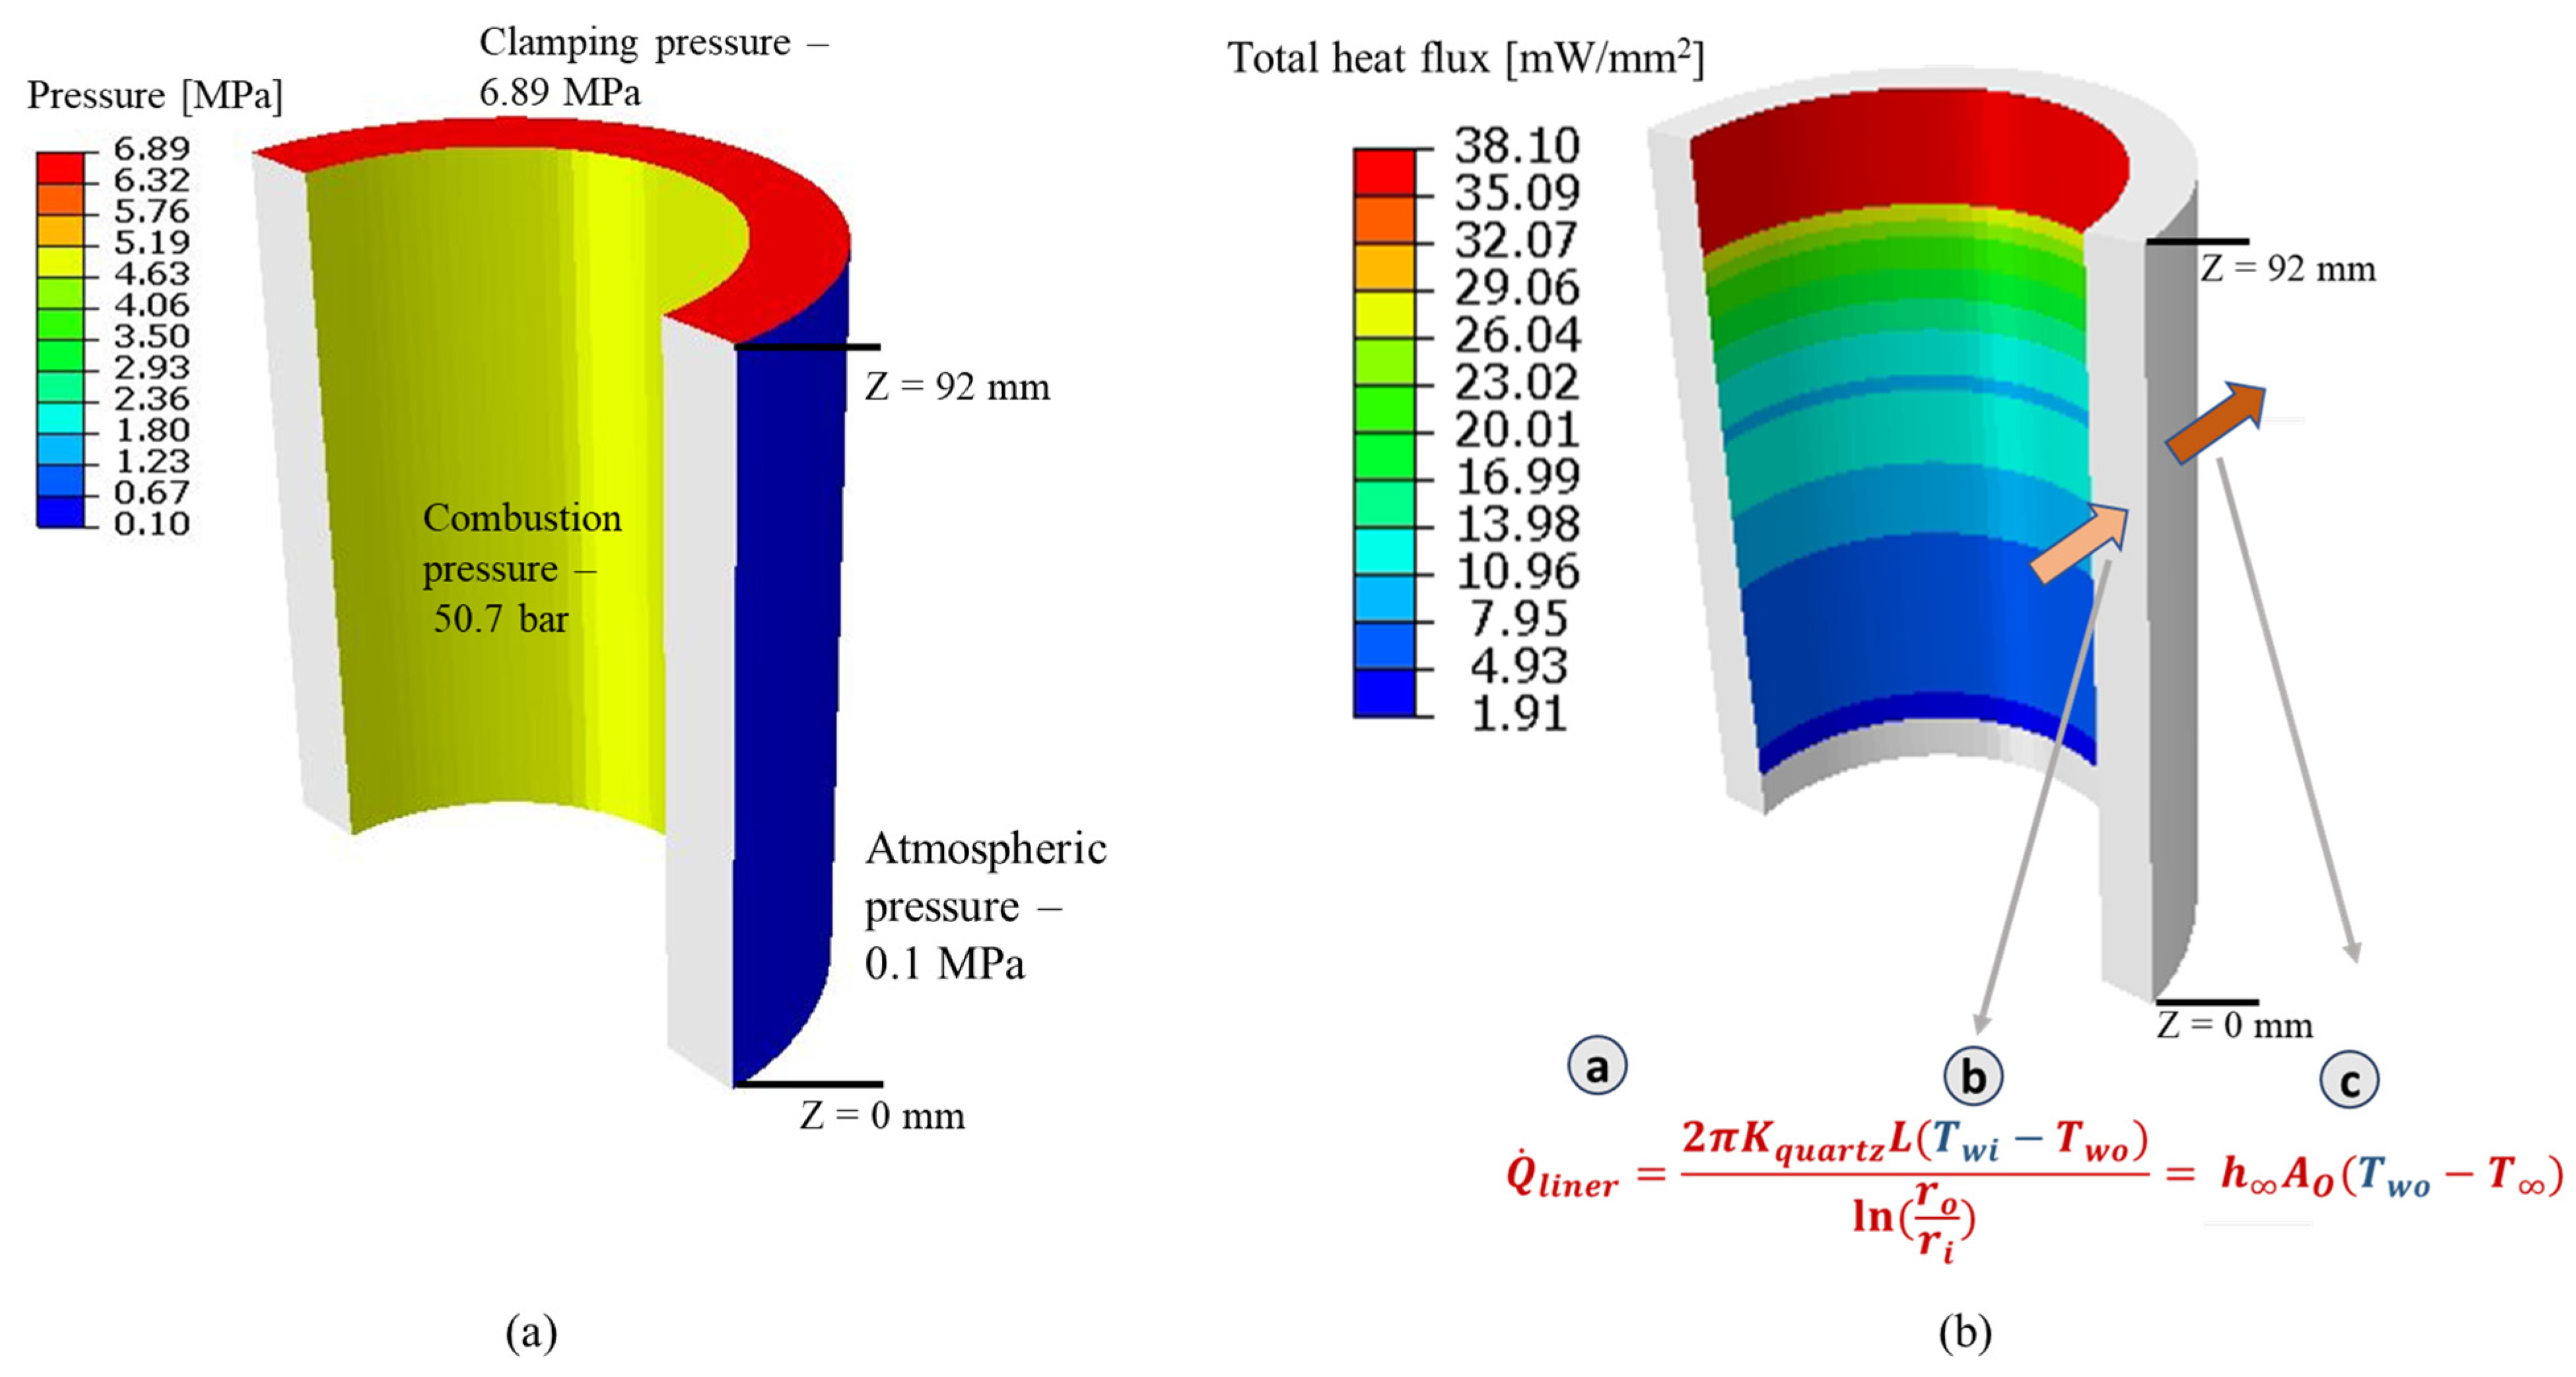
3.1. Basic Assumptions and Boundary Conditions

An internal combustion engine functions by igniting gasoline within the cylinder, leading to the generation of heat energy and subsequently generating elevated pressure within the cylinder. A portion of heat energy is utilized for the mechanical work, while the rest is lost to the environment through the cylinder, cylinder head, piston and exhaust. Consequently, the engine cylinder experiences thermal loads (consisting of combustion and frictional heat fluxes) and mechanical loads (consisting of combustion, clamping and atmospheric pressures). It is to be noted that frictional heat flux is due to the relative motion between the piston and the cylinder; also, clamping pressure is applied to secure a tight seal between the cylinder head, cylinder and crankcase. However, the lateral force on the cylinder due to the piston-connecting rod mechanism was neglected because of its lower value.
The subsequent assumptions were considered to represent realistic operating conditions of the engine during the combined stress analysis using ABAQUS/CAE (as depicted in Figure 3a,b):
  • Combustion pressure, applied to the inside surface of the cylinder, was assumed to be constant with respect to time and uniform over the axial length.
  • Clamping force was converted to pressure and was assumed to be applied uniformly at the top and bottom surfaces of the cylinder [17].
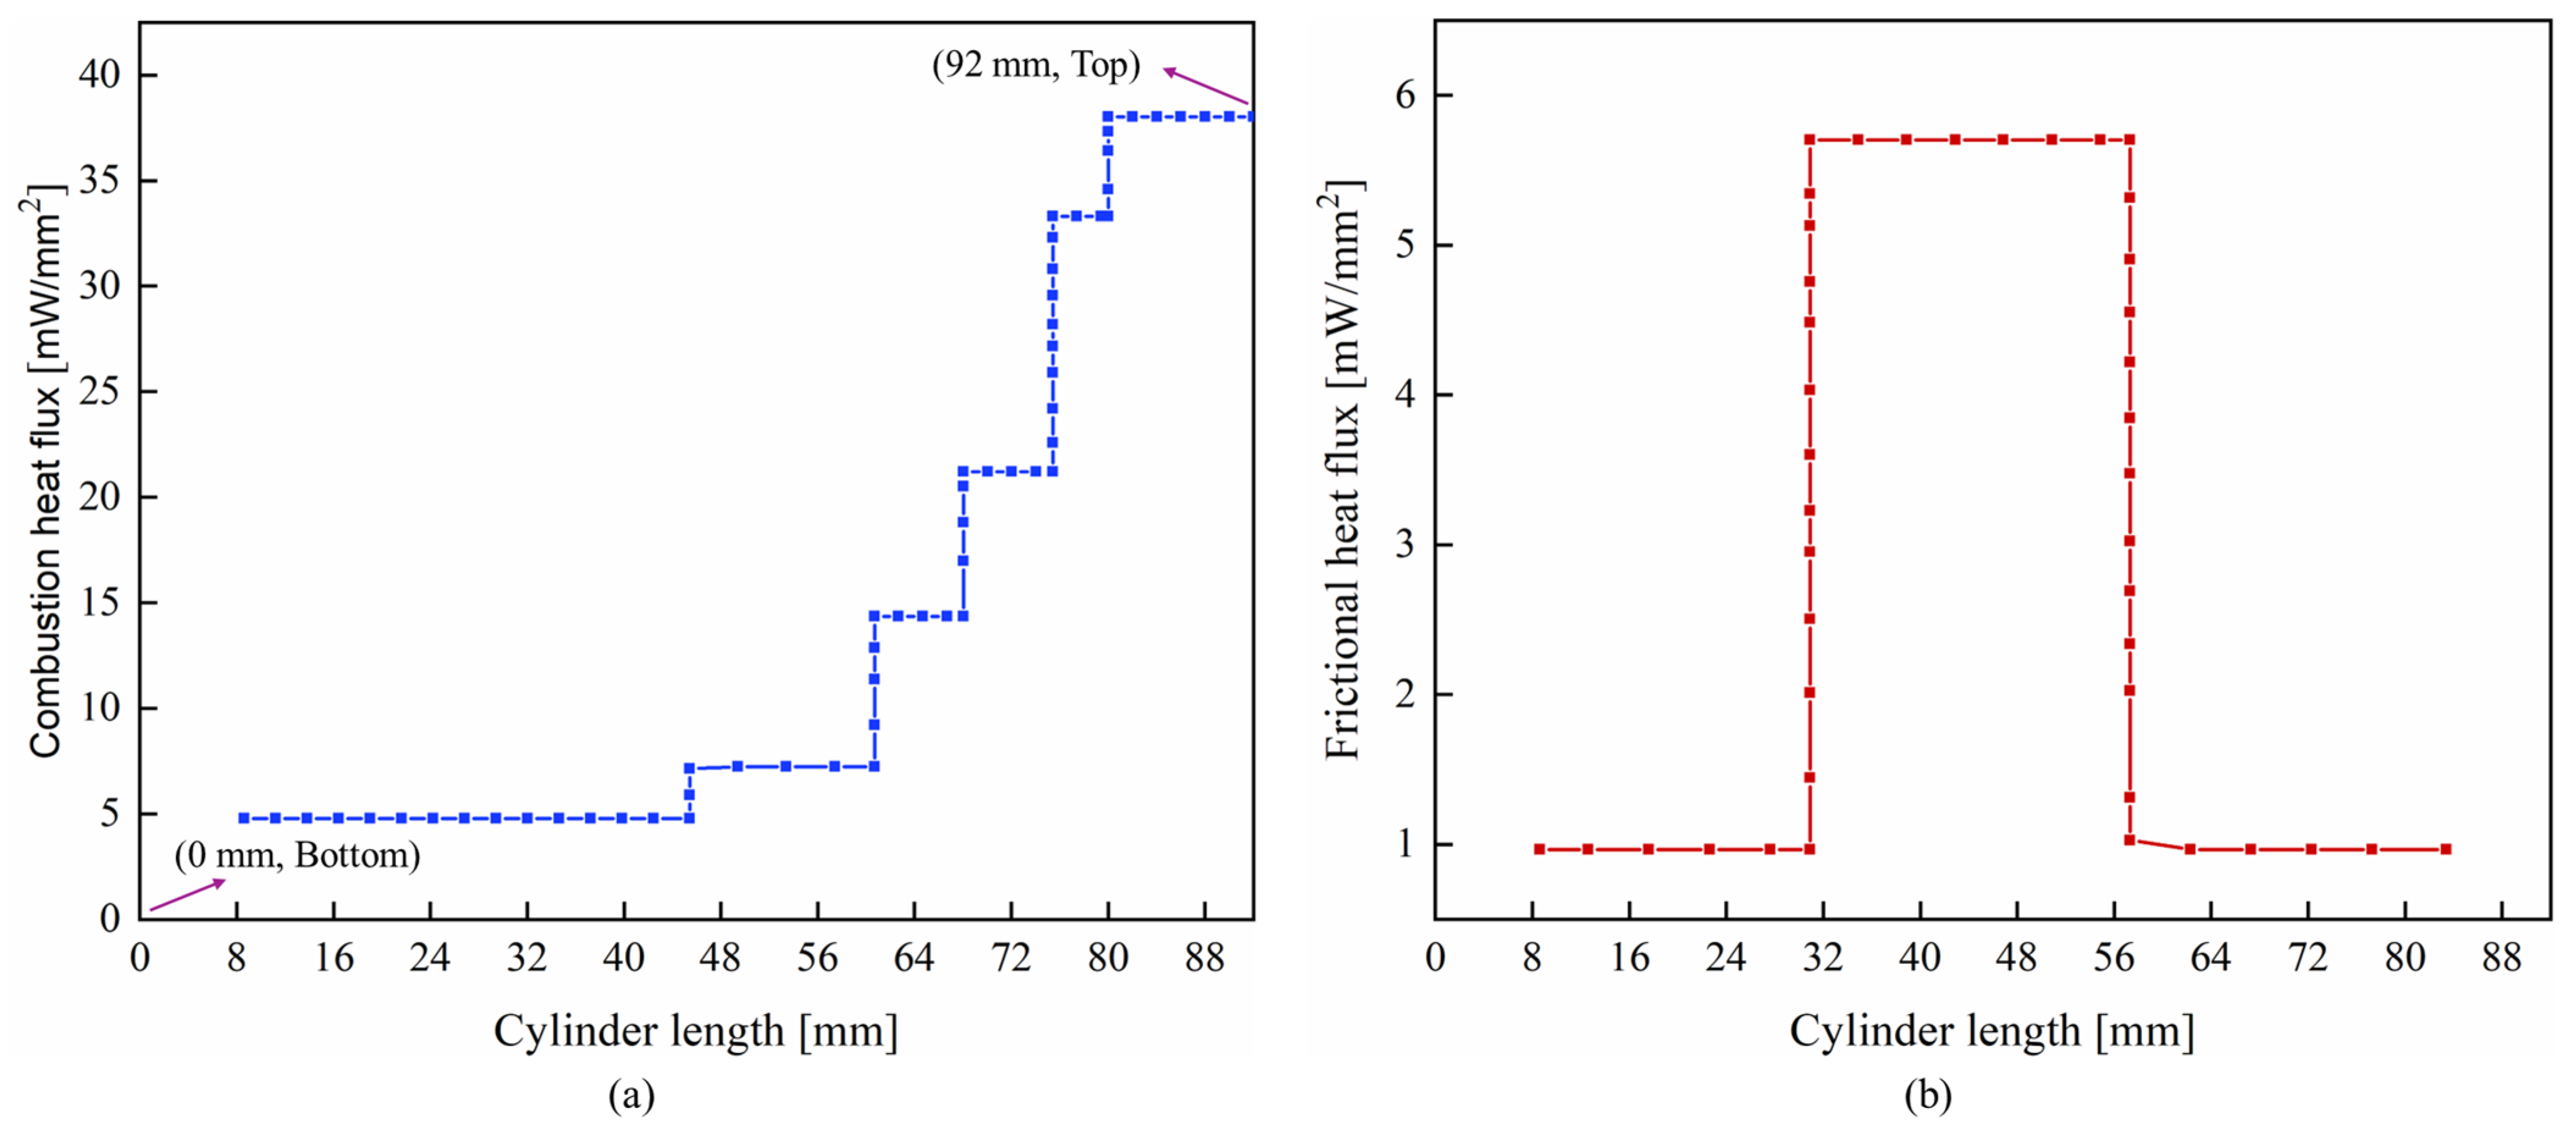
  • Combustion heat flux, applied to the inside surface of the cylinder, was assumed to be constant with respect to time but reduced from top to bottom along its longitudinal axis [17].
  • Frictional heat flux was assumed to be constant with respect to time and had a stepwise profile with maximum magnitude at the middle of the cylinder [17]. This is due to the greater lateral force present near the middle of the stroke, thus producing more frictional heat.
The outer surface of the quartz cylinder was applied under homogeneous boundary conditions in terms of the heat transfer coefficient and the environment temperature ( T ) of 298 K. This heat transfer coefficient was calculated using the empirical equation for a cylinder-shaped object [33]. Also, this study selected forced air cooling with a constant velocity of 5 m/s over the quartz cylinder [17].

3.2. Thermal and Mechanical Load Profiles

The specifications of the optical engine (Figure 1b) are shown in Table 2. As discussed in Section 1, thermal boundary conditions like the temperature and heat transfer coefficient (inside of the cylinder) have been commonly employed instead of focusing on thermal loads. However, determining these boundary conditions requires the use of a computational fluid dynamics analysis, which poses challenges during the initial design stages of the optical engines. With the availability of a validated CFD model in the present study, combustion pressure, however, was obtained from the CFD analysis [7]. On the other hand, combustion heat flux was taken from the total heat input based on the experiments conducted on its metal counterpart, operated at 3000 rpm with wide open throttle (WOT).
The power input per engine cycle is calculated using the following Equation (2):
Q ˙ i n p u t = m ˙ f   × L H V ,
where m ˙ f = Mass flow rate of the fuel (i.e., gasoline) supplied to the engine per cycle, and L H V = Lower heating value of gasoline.
In a conventional spark-ignition engine, heat loss comprising heat transfer from combustion chamber walls and ports, frictional losses and auxiliary energy dissipation accounts for roughly 17–26% of the Q ˙ i n p u t [34]. However, approximately 30% of this heat loss can be attributed to heat dissipation through the engine cylinder [17]. Conversely, in this study, it was assumed that 5% of the Q ˙ i n p u t is lost through the cylinder during firing (for example, 5.1% and 7.8% in the case of heat loss accounting for 17% and 26% of the Q ˙ i n p u t , respectively). This is because quartz has low thermal conductivity, which reduces the heat transfer as compared to that in the metal cylinder. Later, this heat loss is converted into heat flux by dividing it with the corresponding surface area. As stated in assumption (iii), the profile of the combustion heat flux was assumed to be reduced segment-wise from top to bottom of the cylinder, as shown in Figure 4a. A similar type of profile was used for boundary conditions such as the temperature and heat transfer coefficient instead of heat flux in [19,20]. Regarding frictional heat, about 3% of the Q ˙ i n p u t was considered as total frictional heat generated in the engine [35]. Out of this frictional heat, 15–20% was owing to the sliding motion of the piston and the cylinder, and was lost through the engine cylinder [36]. However, in the case of quartz cylinder, more than 15–20% of the total frictional heat could be lost because quartz has a higher coefficient of friction (0.1) [17] as compared to that of conventional cylinder materials (0.06) [37]. Therefore, 25% of the total frictional heat was selected in the present study as frictional heat lost through the cylinder. As mentioned in assumption (iv), this frictional heat flux inside the cylinder is considered as a step profile with a maximum value at the middle of its surface, as seen in Figure 4b. This profile shape is because of the maximum lateral force of the piston on the cylinder at this location.
As mentioned in assumption (i), the combustion pressure is uniformly distributed over the inner surface of the quartz cylinder, as shown in Figure 5a. The combustion pressure is predicted through the CFD model, validated with the measured pressure trace from the metal engine, as seen in Figure 5b. The peak combustion pressure is 50.7 bar, representing to the full load condition (engine speed of 3000 rpm with wide open throttle). The combustion pressure is applied either segment-wise [17] or in a sinusoidal pattern [20]. However, in the present study, the peak combustion pressure was applied uniformly over the length of the cylinder. As a result, a higher factor of safety could be achieved compared to other profiles. Further, it is to be noted that optical engines are mostly used for cold flow (motoring) and part load conditions, hence further improving the factor of safety. The clamping pressure in the cylinder head bolts was determined to be 6.9 MPa. This pressure was selected based on the tightening torque that was chosen. Furthermore, this pressure was evenly applied to the top and bottom surfaces of the cylinder. Also, atmospheric pressure (0.1 MPa) was applied to its outer surface. Note that a coupled finite element analysis was also conducted for motoring condition. In this case, the mechanical load consists of motoring peak pressure (i.e., 20 bar), clamping pressure and atmospheric pressure, whereas the thermal load consists of frictional heat flux only (i.e., combustion heat flux is ignored due to the motoring condition). The effect of motoring condition on the transparent cylinder is elaborated in Section 5.5.

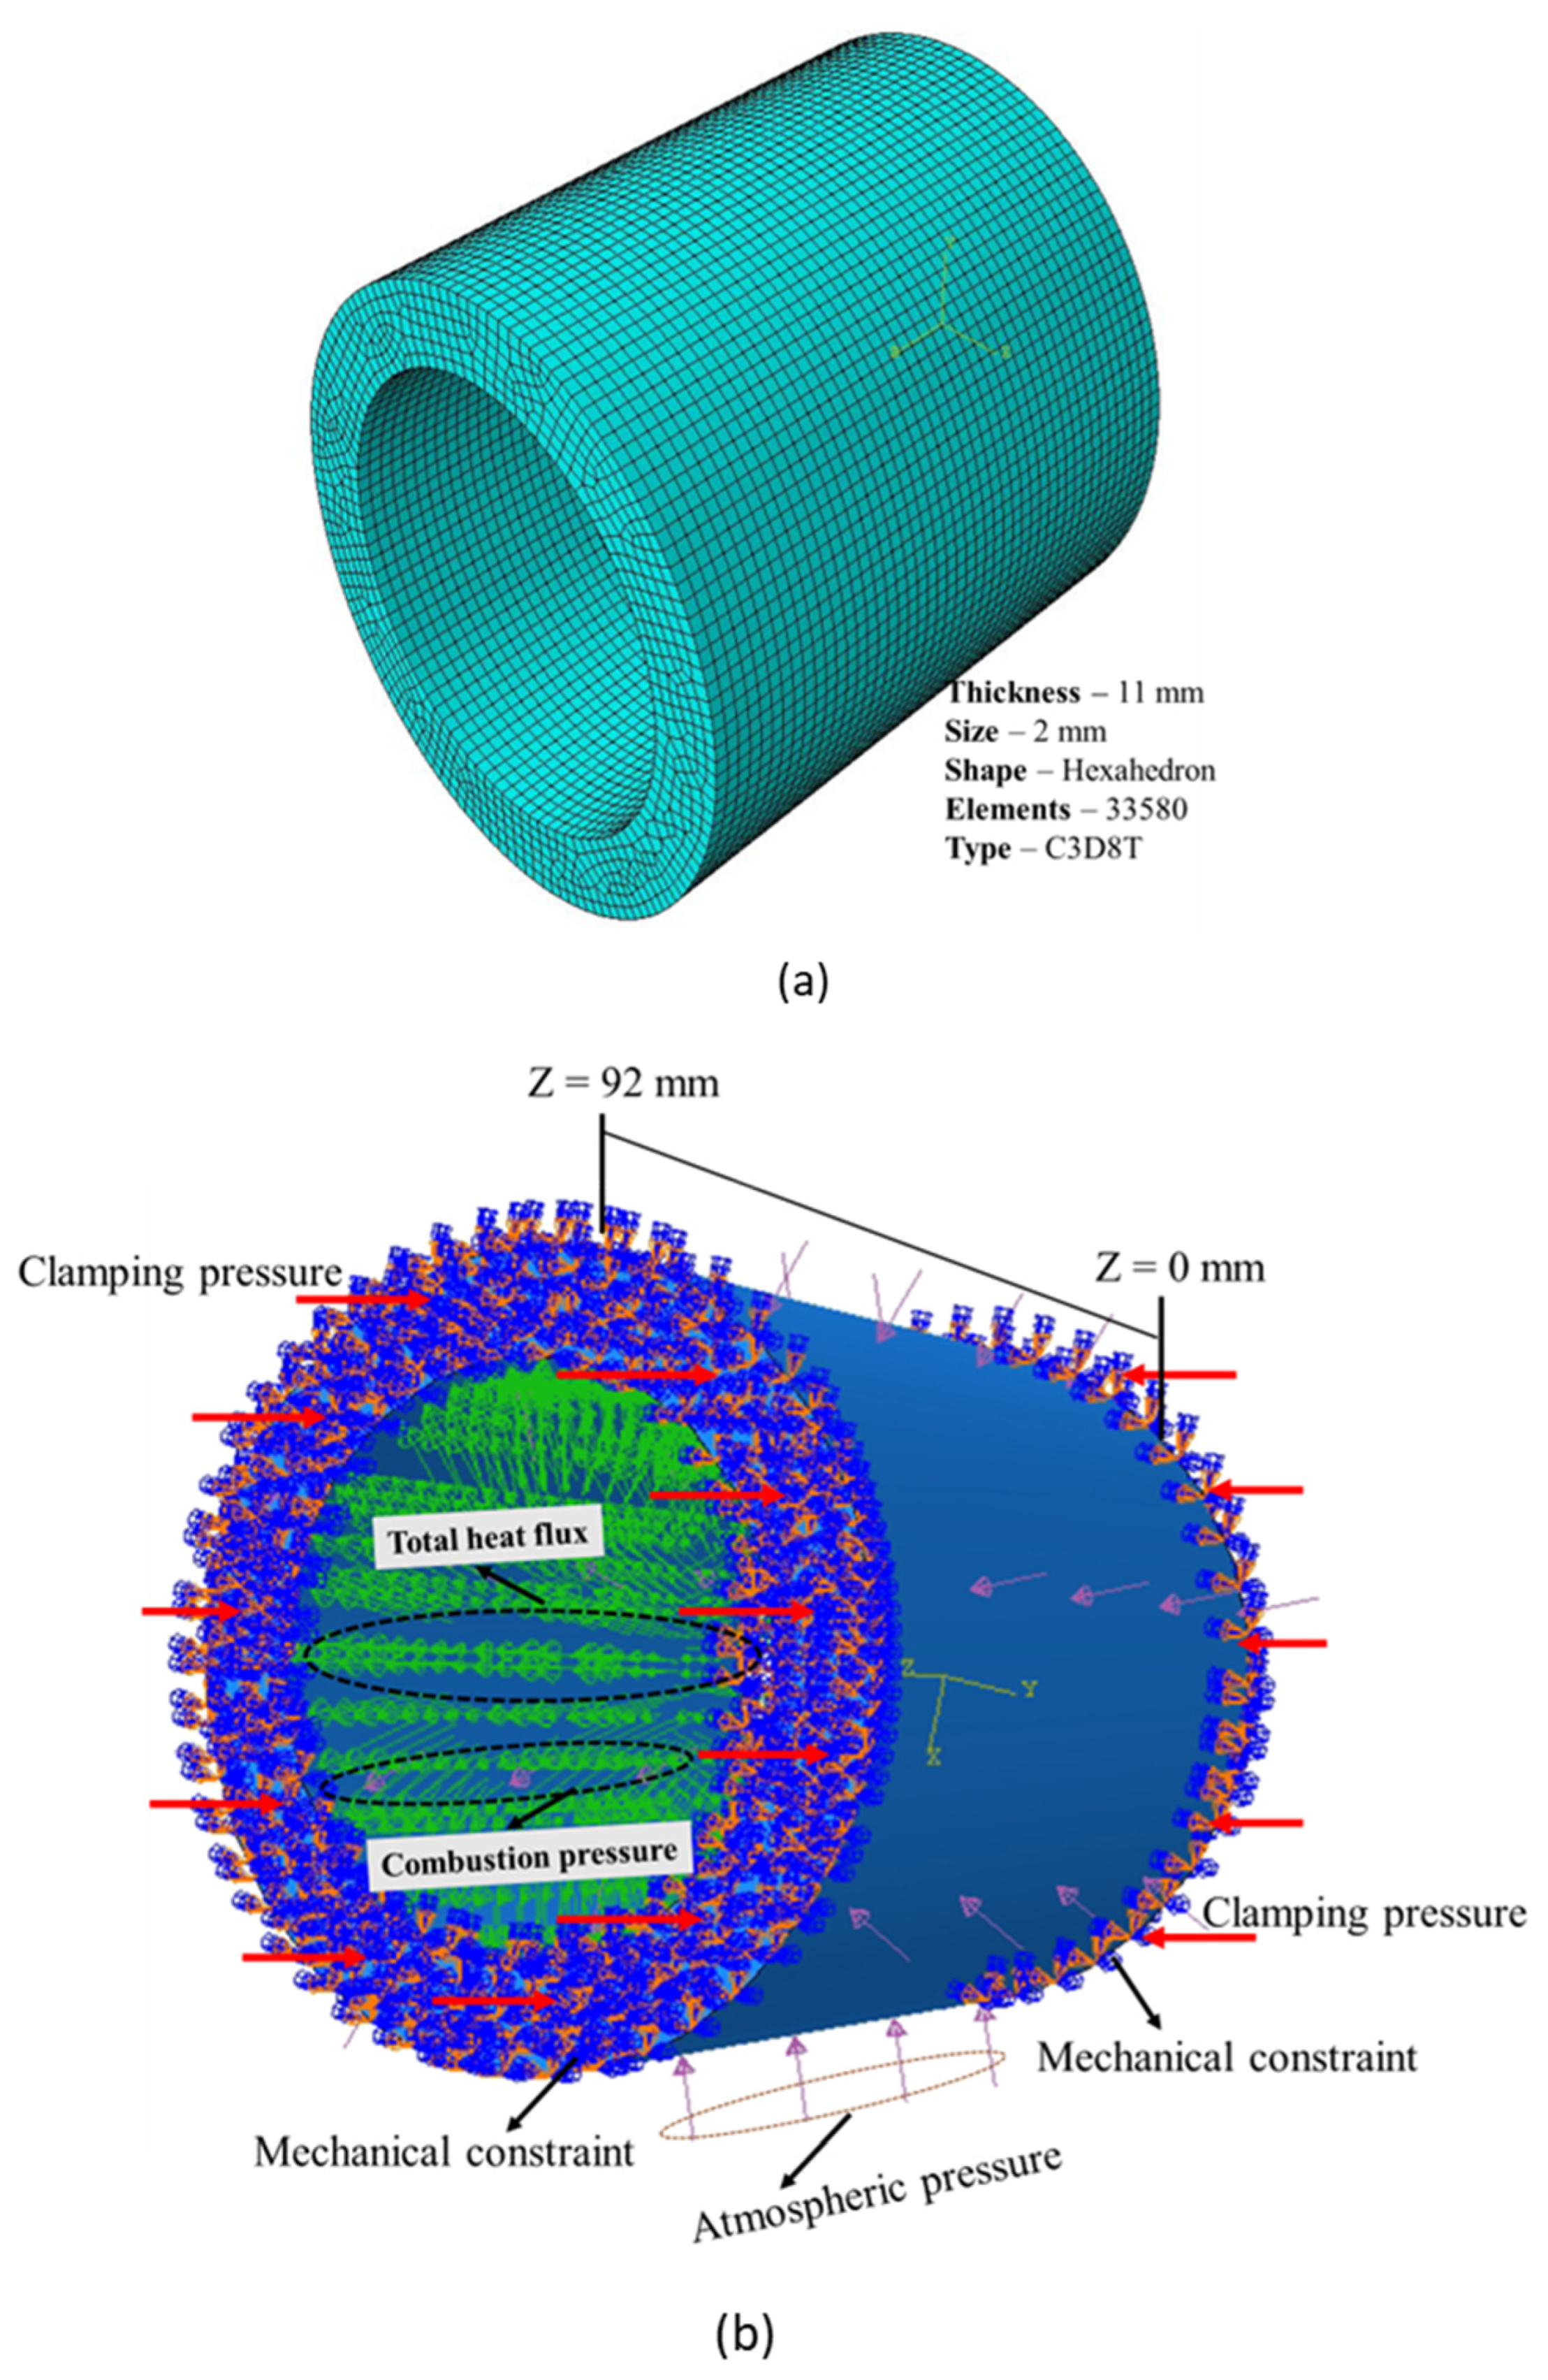
3.3. Finite Element Model of the Quartz Cylinder

Figure 6a depicts detailed information on the meshing of the 11 mm thick quartz cylinder. The mesh element type is C3D8T (8−node trilinear displacement and temperature). The different loadings and boundary conditions of the quartz cylinder in ABAQUS/CAE are shown in Figure 6b. In summary, at the inner surface of the cylinder, green arrows indicate the total heat flux load (i.e., the sum of combustion and frictional heat fluxes), and pink arrows indicate the combustion pressure load. Furthermore, pink arrows on the outer surface of the cylinder indicate the atmospheric pressure load, and red arrows on the top and bottom surfaces of the cylinder show the clamping pressure load.
Figure 7a,b illustrate the mechanical and thermal loads within the quartz cylinder, respectively. These figures serve to validate the accurate implementation of the combined loads. As mentioned, the total heat flux decreases from top (Z = 92 mm) to bottom (Z = 0 mm) while being applied to the inner surface of the cylinder. In addition, the steady-state conduction heat transfer equation is also shown in Figure 7b. This equation is used in the discussion of temperature distributions in Section 5.1.

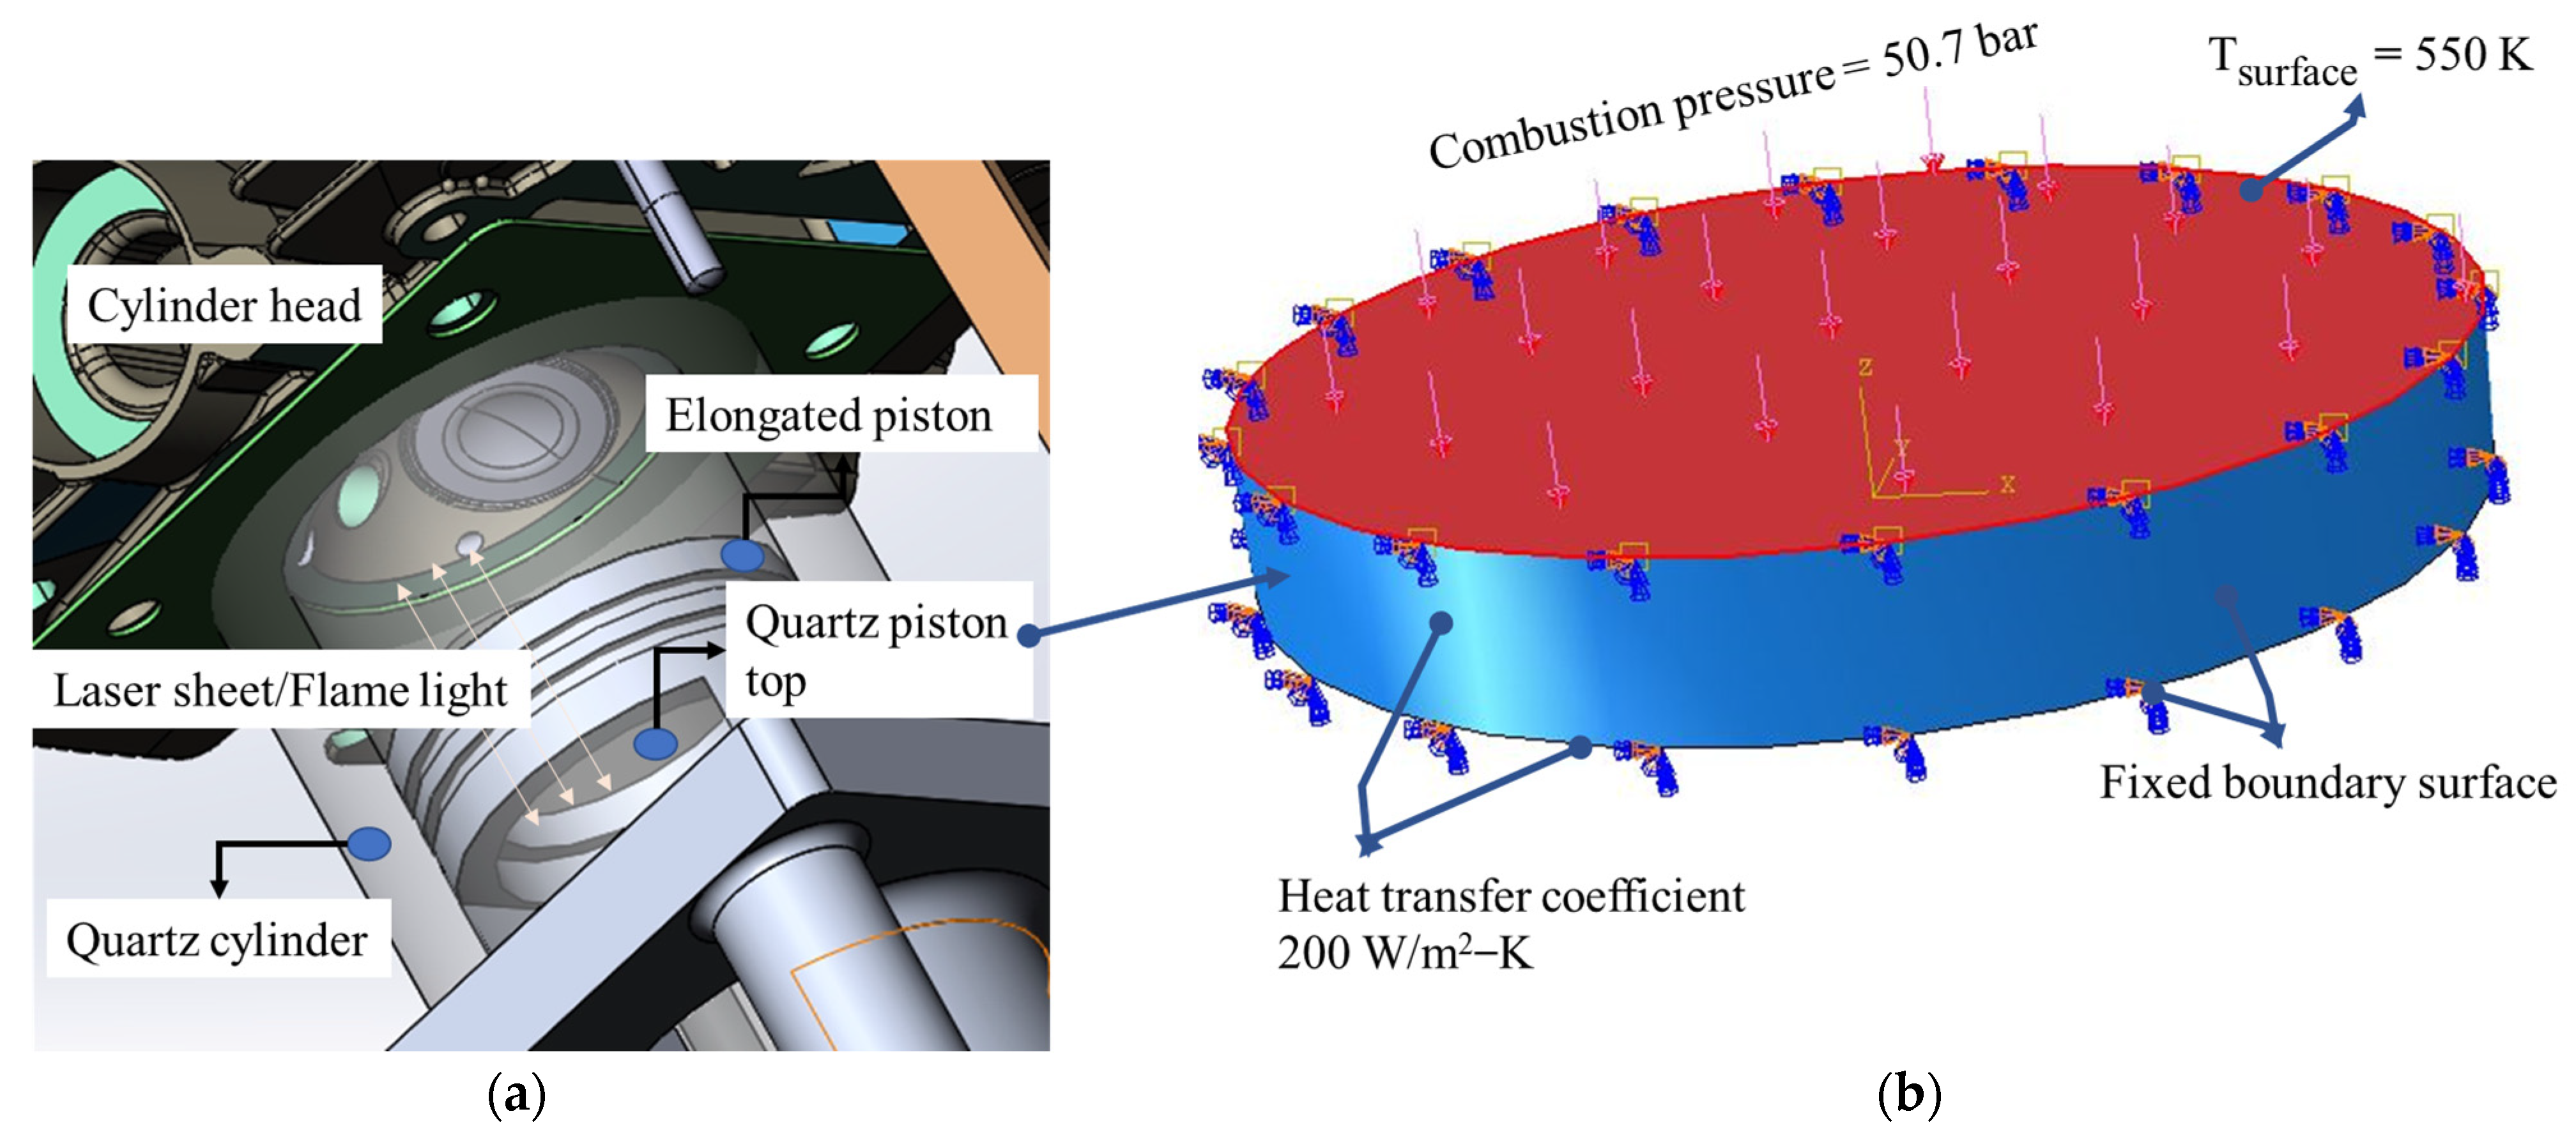
4. Application of the Coupled Finite Element Analysis Methodology for the Quartz Piston Top

The quartz piston top is commonly used in optical engines as it helps to visualize within the engine cylinder through the inclined mirror. Furthermore, this piston top allows the laser to illuminate the flow inside the cylinder in tumble flow studies [23,24]. Also, it is used to allow the combustion flames to be captured with a high-speed camera in the case of firing operations [38,39]. In optical engine design, the piston top is a necessary component. Therefore, a thermo-mechanical analysis of the piston top is critical during optical engine development. Figure 8a shows the location of the quartz piston top in the optical engine. The mechanical load consists of combustion pressure with the value of 50.7 bar, uniformly applied to the upper surface of the piston top. Simultaneously, the thermal load consists of a constant wall temperature (550 K) (applied on the top surface of the piston top) [40]. Both of these loads (as seen in Figure 8b) are taken from the CFD model of the same engine configuration.
The transparent piston top is assembled by bonding its side and part of the bottom surfaces to the elongated piston. Though the conduction heat transfer occurs through these contact surfaces, authors assumed applying a convection heat transfer coefficient of 200 W/m2−K (i.e., within the range reported in [40]) on both side and entire bottom surfaces of the transparent piston top. This assumption is reasonable because, as depicted in Figure 8b, most of the bottom surface of the transparent piston top is not in contact with the elongated piston (i.e., only a small bonding area at the bottom surface is in contact with the elongated piston). Also, the wall of the slot where the piston top is assembled in the elongated piston has a thickness of 6 mm only (considering bore and piston top diameters of 62 and 50 mm, respectively). This smaller wall thickness leads to a lower temperature drop across the wall, resulting in less temperature variation between the inner and outer (which lose heat through convection) surfaces of the wall. Also, a fixed displacement boundary condition (mechanical constraints) is imposed on the circumferential and bottom surfaces of the piston top [32].

5. Results and Discussion

The findings of the discussed methodology are outlined in the subsequent sections. First, predictions are made for temperatures, combined stresses and displacements within both the quartz cylinder and piston top. Subsequently, a transient analysis is introduced, focusing on the quartz cylinder’s behavior during various engine operating times. Next, the optimum thicknesses for both the quartz cylinder and piston top are determined. Finally, conclusions are drawn based on the comprehensive analyses conducted.

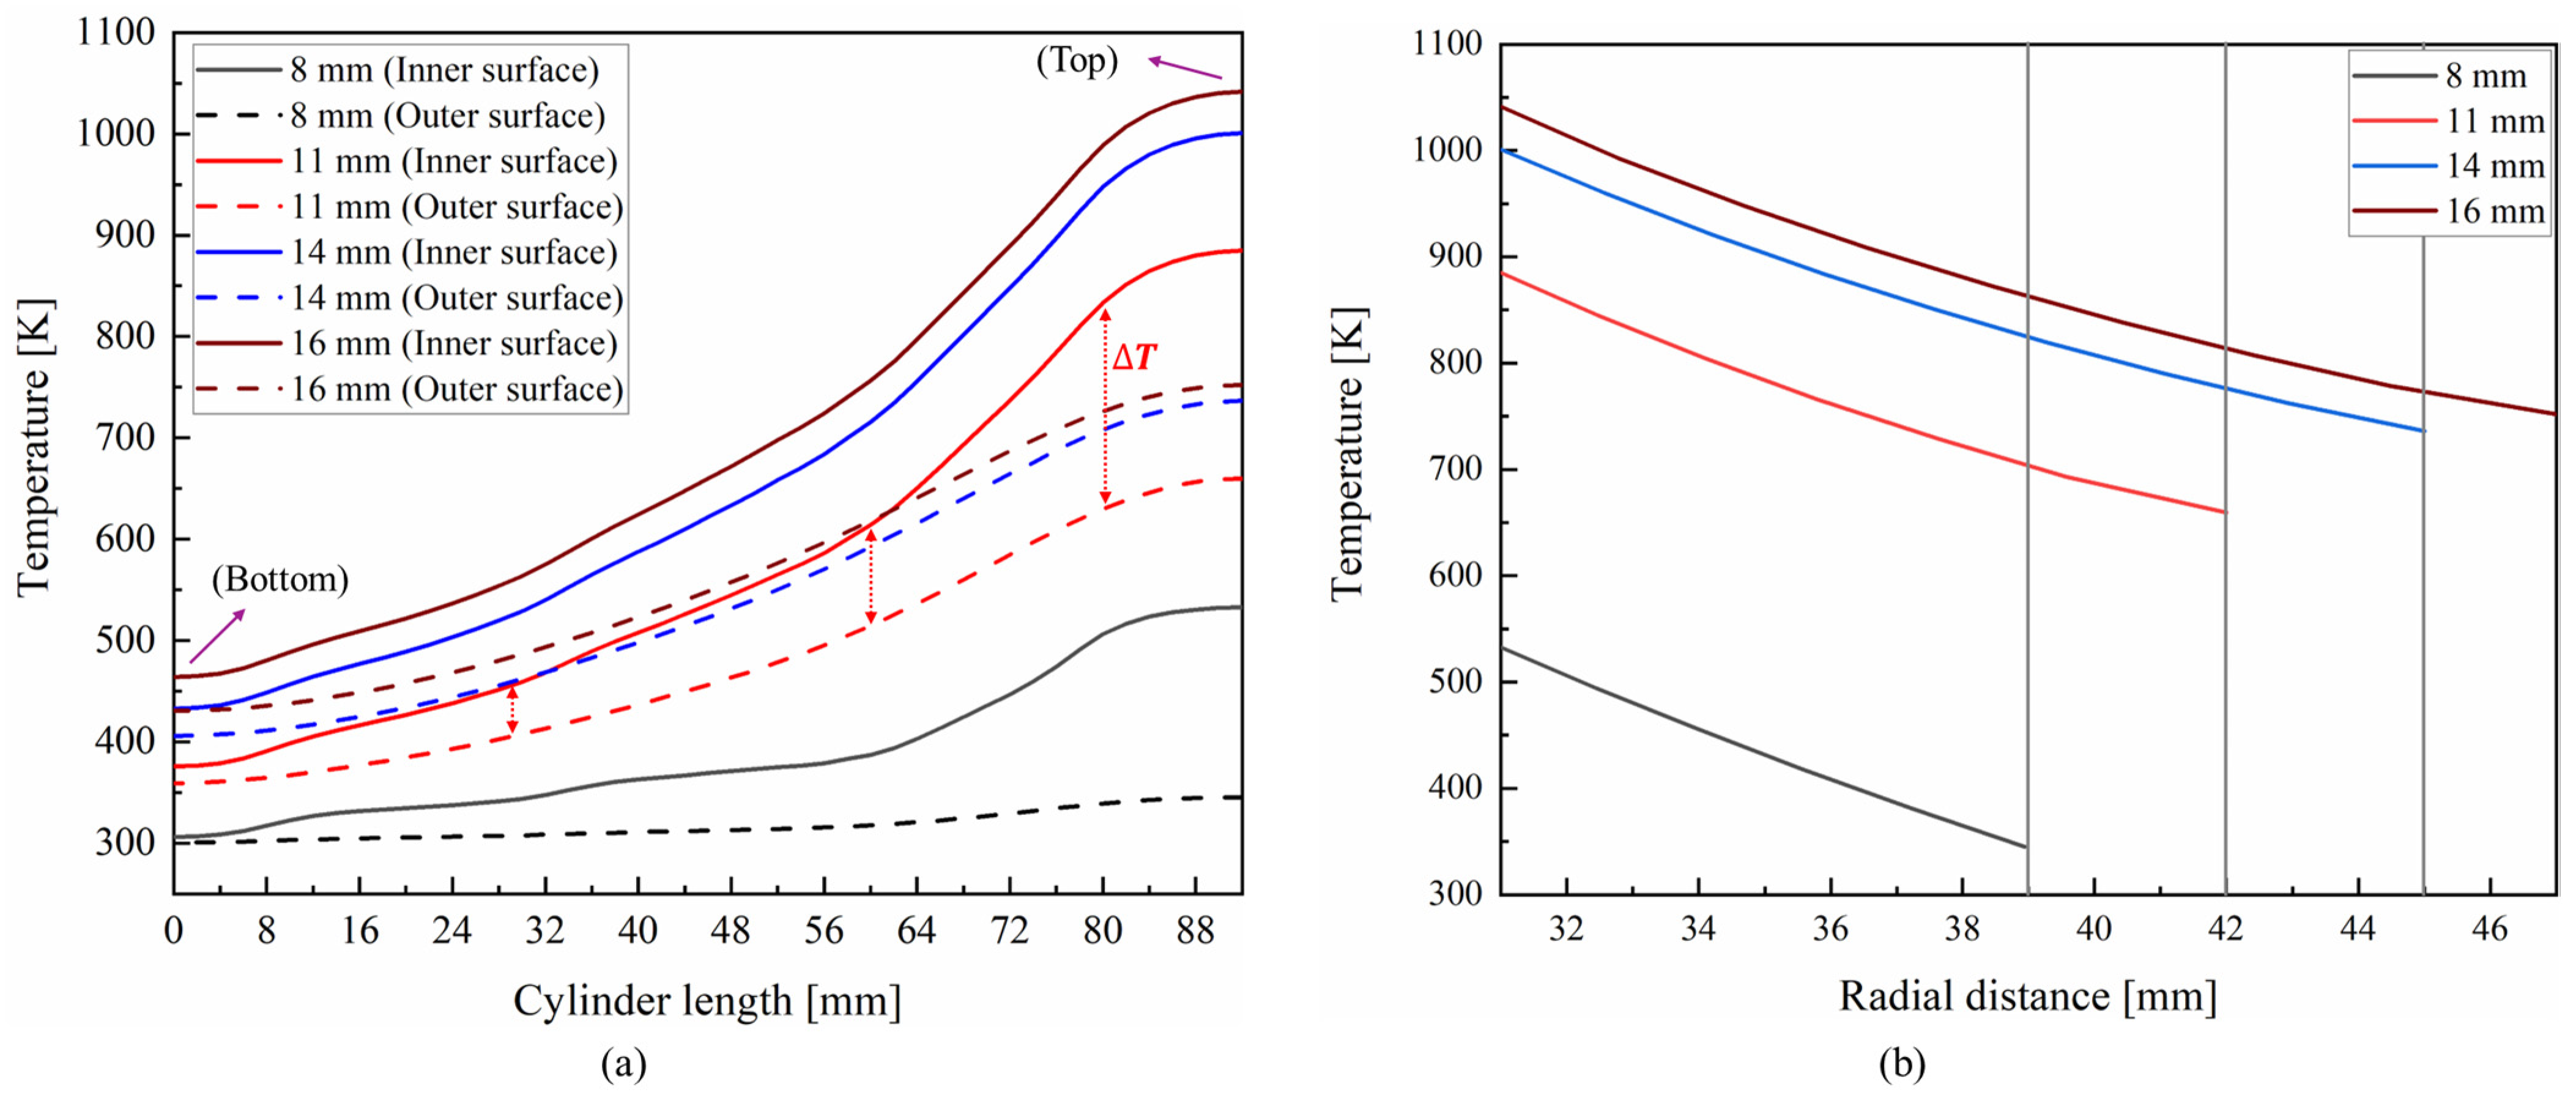
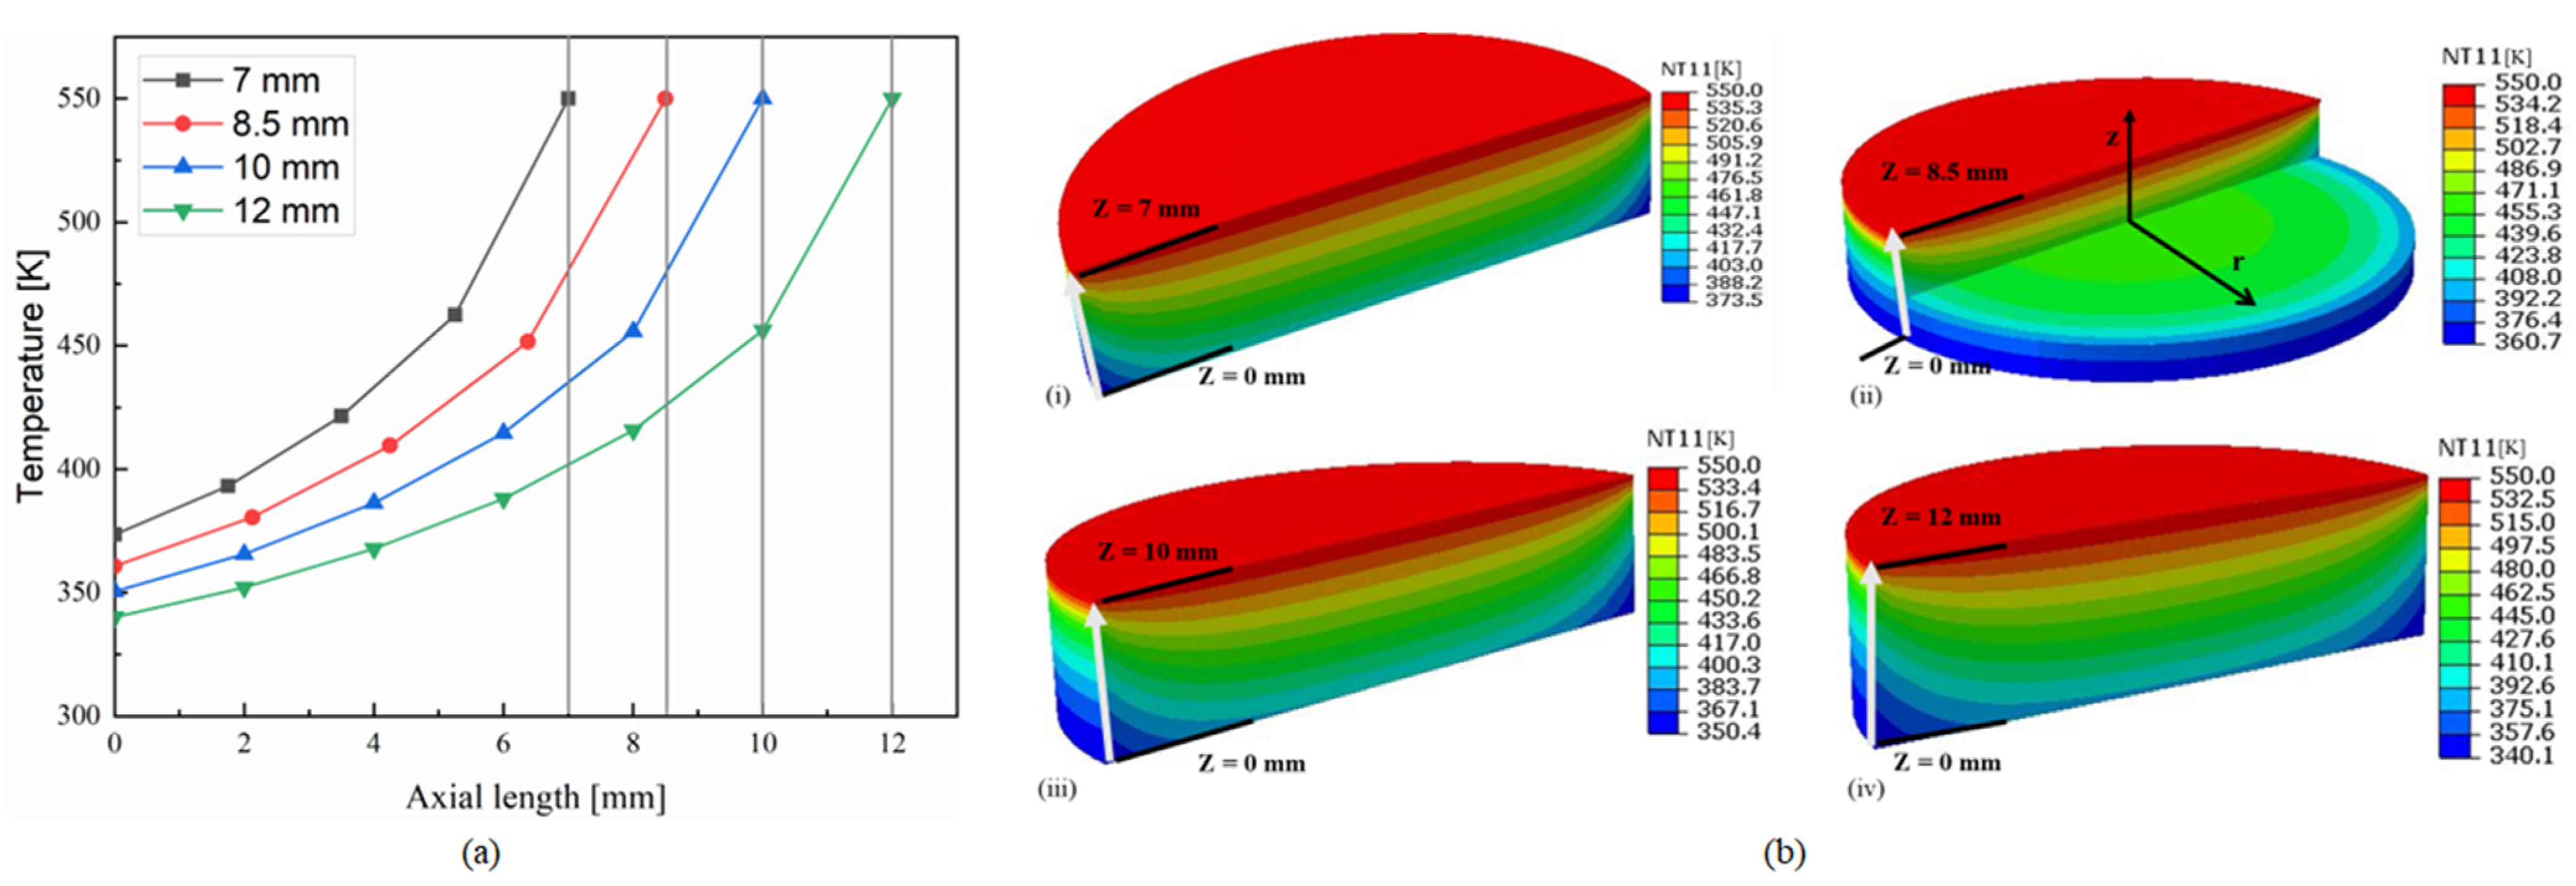
5.1. Temperature Distributions in the Quartz Cylinder and Piston Top under Combined Loading Conditions

Figure 9a shows the temperature variations in the quartz cylinder along its axial length at the inner and outer surfaces with solid and dashed lines, respectively. The maximum temperature, recorded at the upper region of the inner surface (Z = 92 mm), can be attributed to the higher total heat flux observed at this location. Furthermore, it is evident that temperatures decrease longitudinally due to the reduction in total heat flux along the length of the quartz cylinder from top to bottom (as depicted in Figure 7b). A similar trend is also reported in the literature [19], where the prediction of temperature distribution within a metal cylinder was performed. Consequently, the temperature gradient (the difference between temperatures of the inner and outer surfaces, ∆T) was maximum at the top dead center (Z = 92 mm). This gradient also increases with thickness, according to the Fourier law of heat conduction. Figure 9b presents the radial temperature variations at the top surface of the quartz cylinder for different thicknesses considered (i.e., 8, 11, 14 and 16 mm). The inner surface in the figure represents to 31 mm (i.e., cylinder bore of 62 mm); hence, each plot for a given thickness starts at 31 mm and extends to its respective thickness, for example, to 39 mm in the case of an 8 mm thick cylinder. This figure additionally illustrates the maximum temperature at the inner radius and the minimum temperature at the outer radius.
Figure 10 depicts the temperature contours for various thicknesses of the quartz cylinder in a half-cut view by taking advantage of the axis-symmetric plane. It is clear that for a given Z location, the total heat flux (input to the model) is constant, and there is no variation in temperature along the angular direction (θ) (see Figure 10). Hence, the temperature variation in the cylinder could be explained with a simple 1D steady-state heat transfer equation, which consists of the heat input (a), conduction term (b) and convection term (c), as represented in Figure 7b. With given heat flux as an input, known surface area, assumed heat transfer coefficient (at the outer surface) and environment temperature, one may calculate the outer wall temperature ( T w o ) using (a) and (c) terms, and then the inner wall temperature ( T w i ) using (a) and (b) terms. It is also evident that the inner top surface has the maximum temperature for all the thicknesses considered (as is also represented in Figure 9a). The recorded maximum temperatures are 532.7 K, 885 K, 1001 K and 1041 K for thicknesses of 8, 11, 14 and 16 mm, respectively. This location of the maximum temperature was also observed in [41] in the case of the metal cylinder. These elevated temperatures are a result of conducting the analysis under rated engine operating conditions. However, it is important to note that optical engines mostly operate under motoring or part load conditions. Therefore, the maximum temperature experienced in the quartz cylinder would be lowered (compared to the full load condition considered in the present analysis). Also, it is to be noted that inside the cylinder of an internal combustion engine, the peak temperature is limited by the adiabatic flame temperature (for example, it is about 2600 K for gasoline considering the constant volume combustion process). However, it is to be noted that the wall temperature of an engine cylinder is considerably lower because of the presence of a thermal boundary layer at the wall surface. The common metallic engine cylinders made of cast iron (with a melting point of 1473 K) and aluminum are engineered to function at temperatures ranging from 473 to 673 K [42], i.e., a significant reduction of temperature from gas to cylinder walls due to the thermal boundary layer. These relatively lower operating temperatures (compared to gas temperatures) ensure the durability of these materials and are helpful in preventing fatigue. Materials with lower thermal conductivity (such as quartz), however, tend to exhibit relatively higher wall temperatures (compared to the temperatures of in-cylinder surfaces in the case of cast iron and aluminum) because of their reduced heat transfer rates.
Figure 11a,b show the temperature variations (across the light grey arrow in the axial direction as indicated in Figure 11b) and its contours for the quartz piston top, respectively. As described in the methodology, a constant temperature of 550 K was applied to the top surface as the thermal load. Hence, the highest temperature within the quartz piston top corresponds to 550 K (on its top surface). Moreover, it is evident that greater thermal gradients exist at the circumferential area compared to the central region of the piston top. A similar temperature contour is also reported in [40] in the case of the metal piston. It is also worth noting that the differences in thermal gradients over the circumferential area (in the axial direction) of the quartz piston top for various thicknesses were relatively less, which is apparent from the slopes of the temperature lines depicted in Figure 11a. Furthermore, in Figure 11b, the overall thermal gradients (obtained by subtracting the minimum temperature from the maximum temperature) for thicknesses of 7, 8.5, 10 and 12 mm are calculated as 176.5 K, 189.3 K, 199.6 K and 209.9 K, respectively.

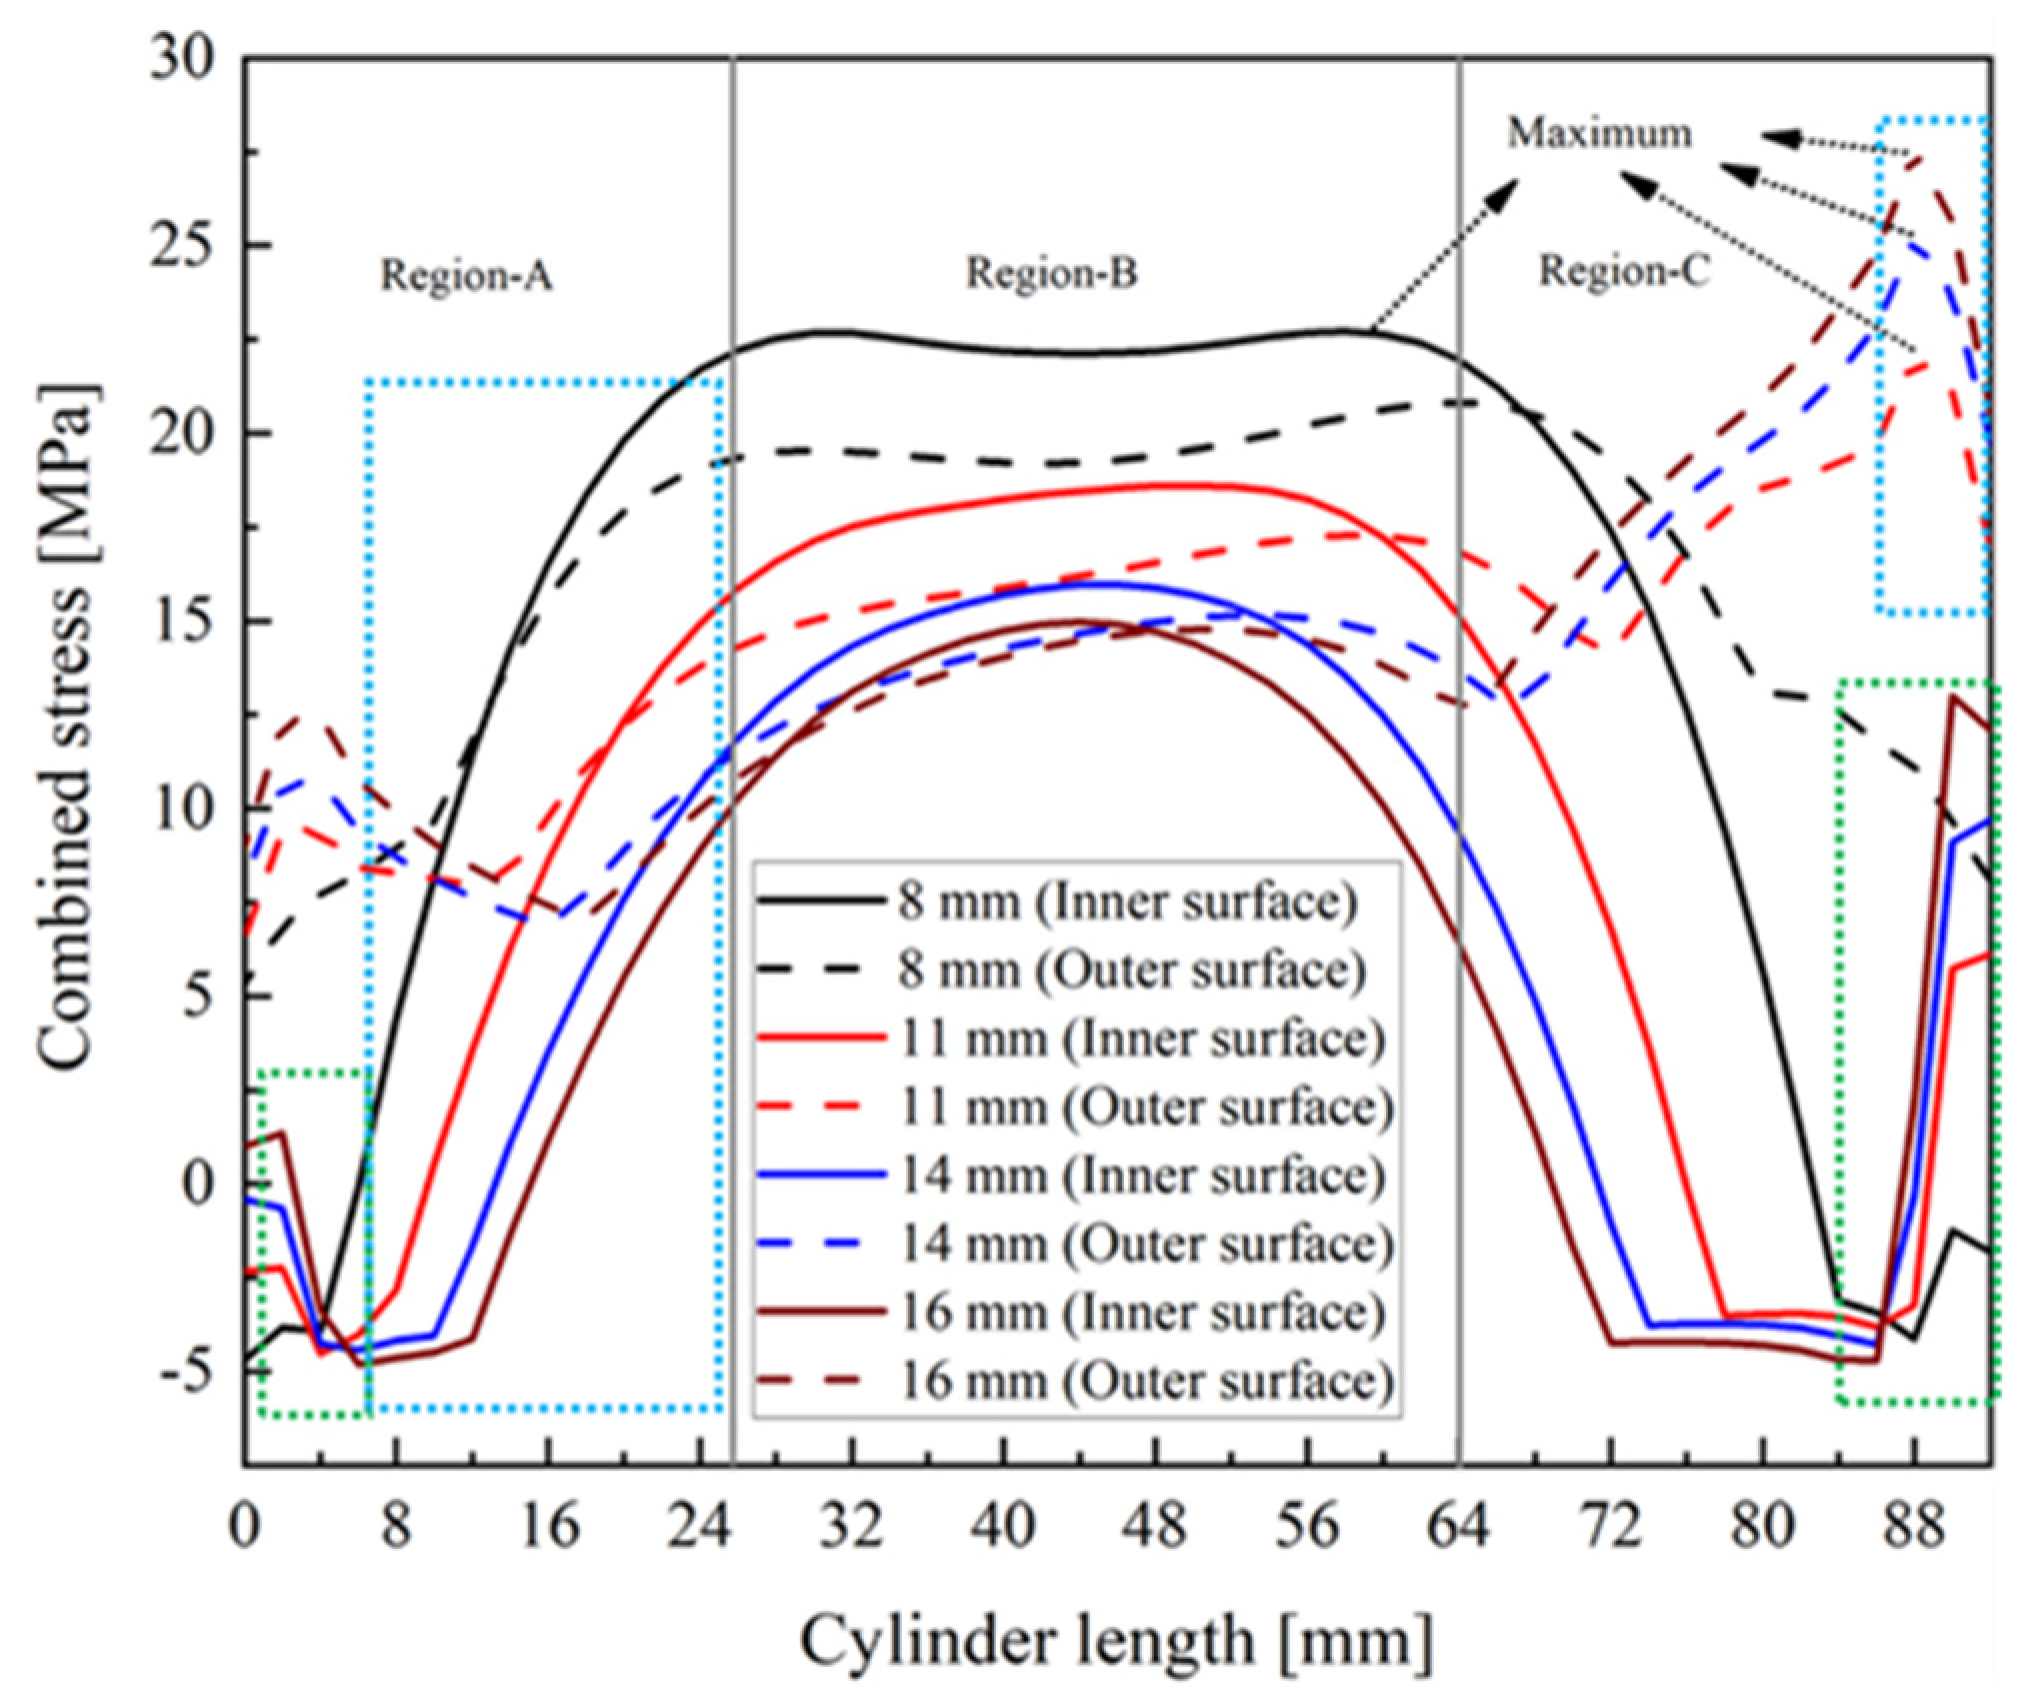
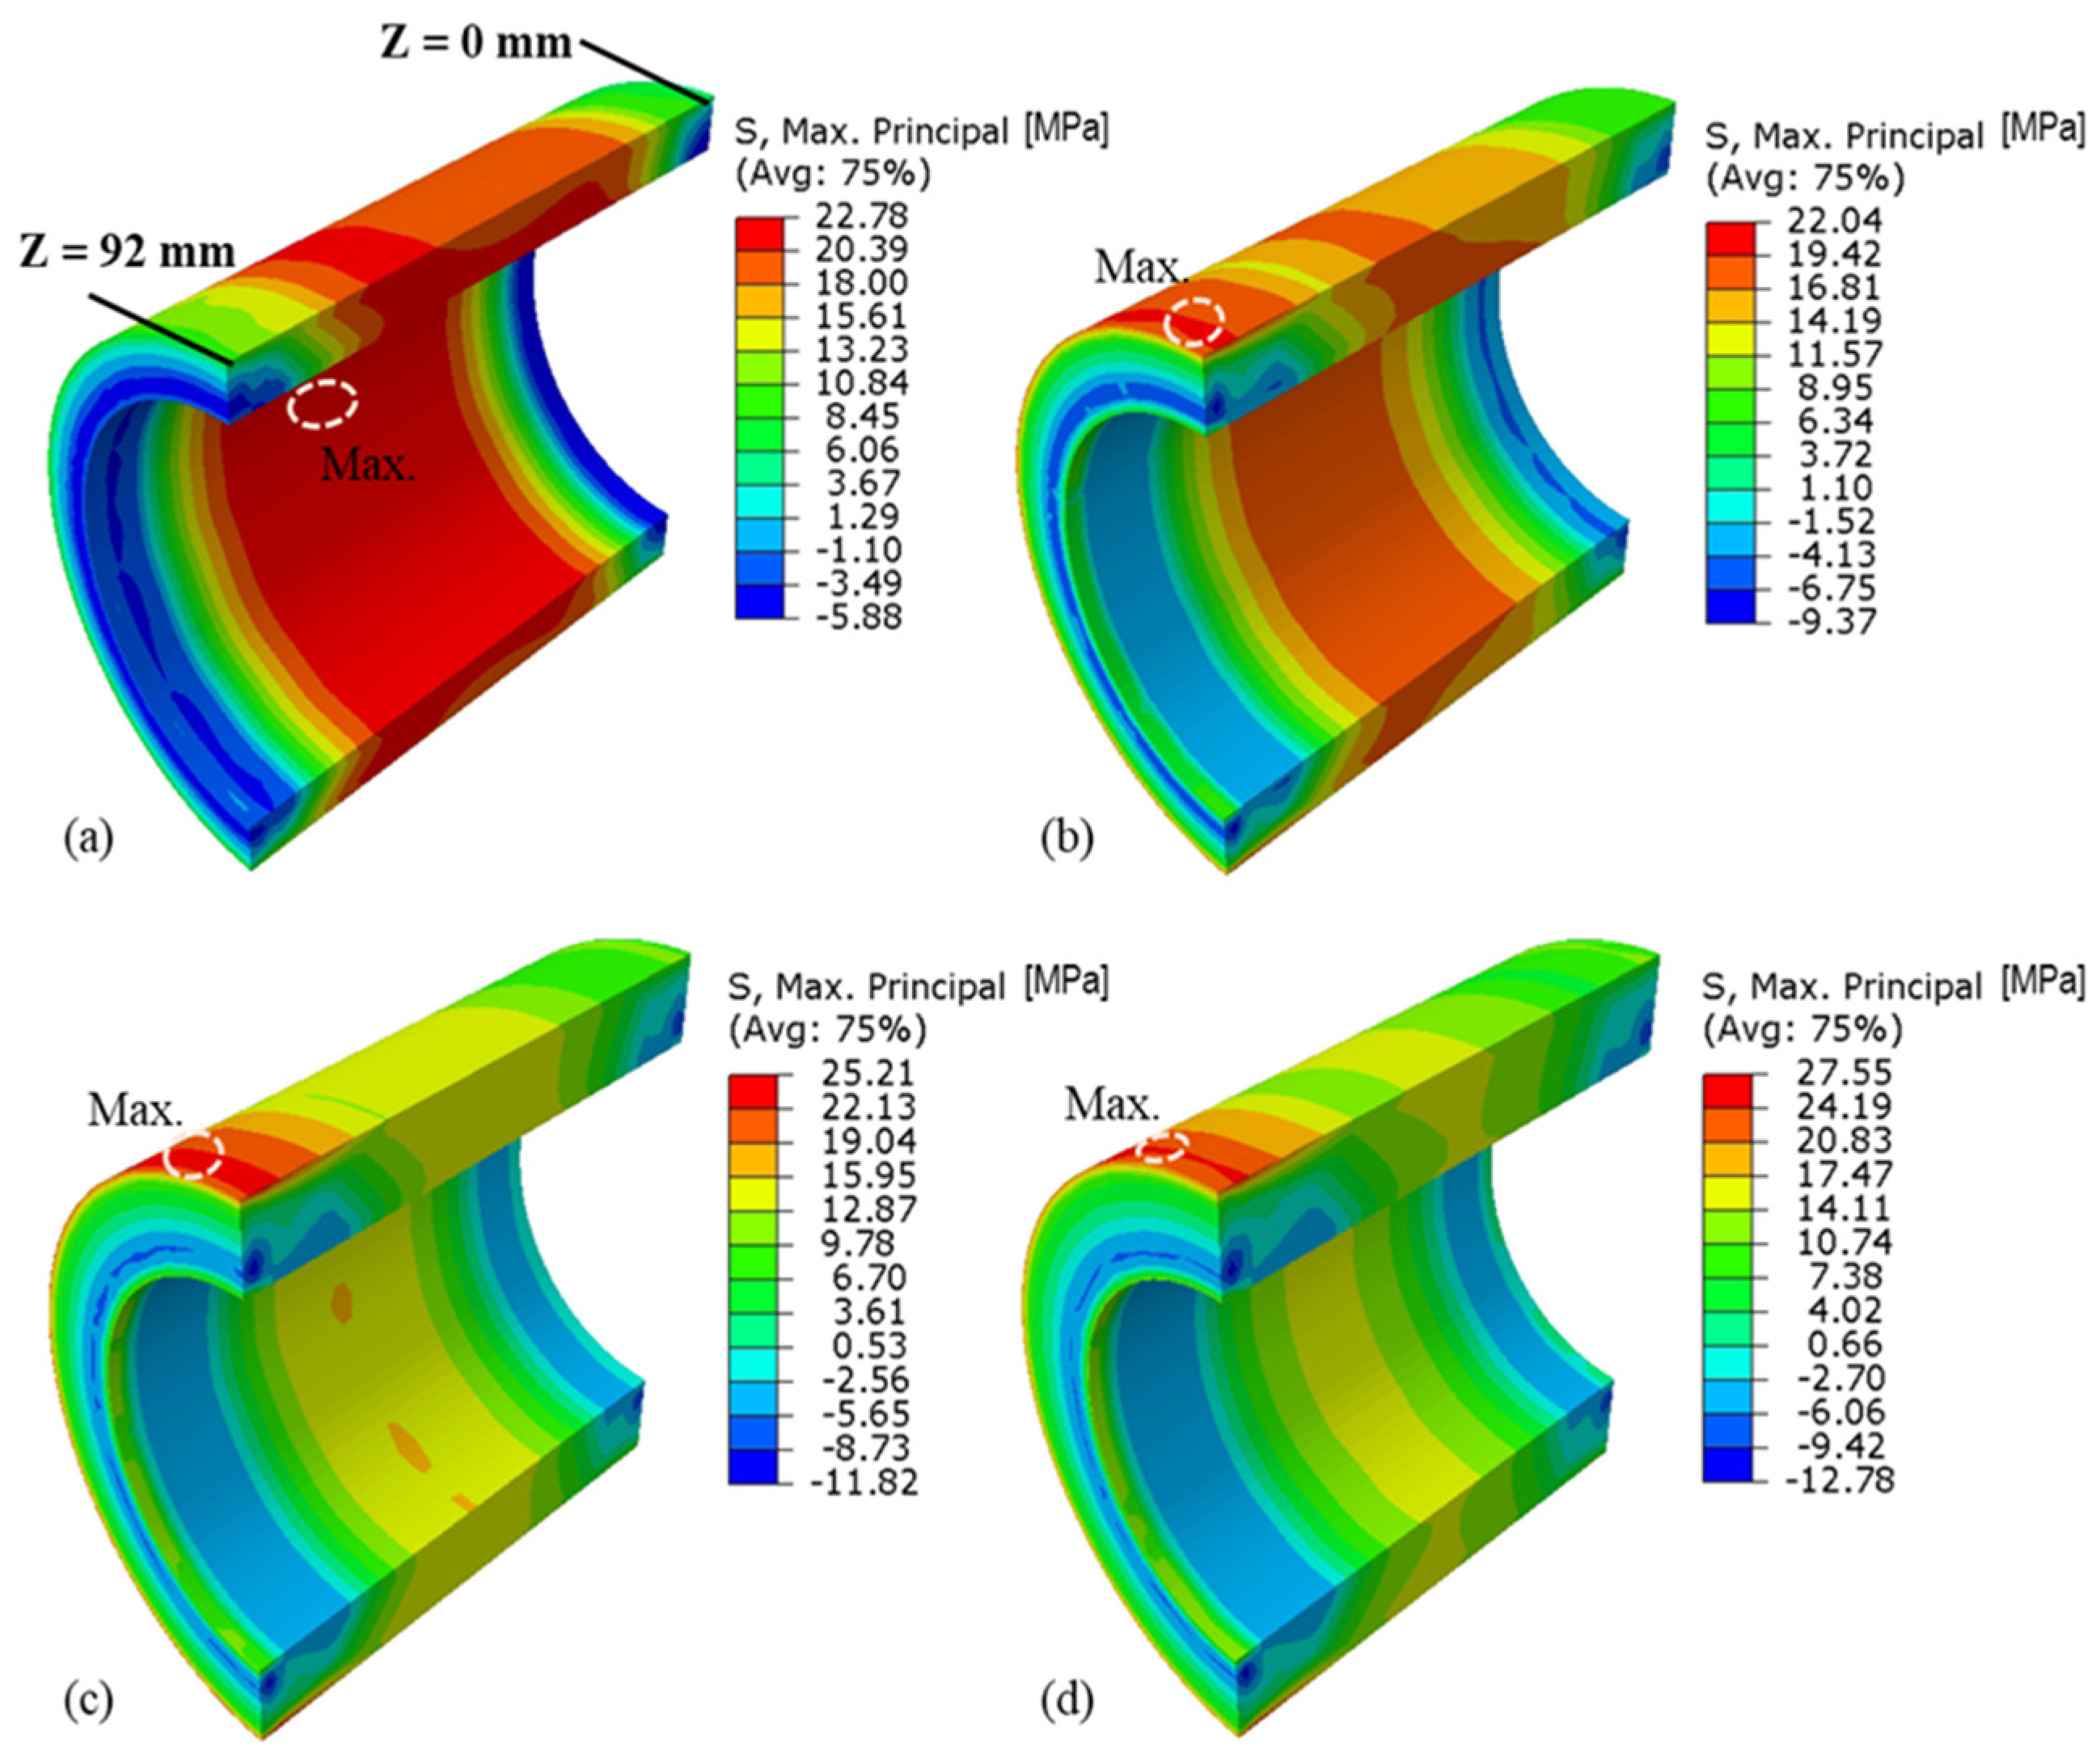
5.2. Combined Stress Distributions in the Quartz Cylinder and Piston Top under Combined Loading Conditions

Figure 12 depicts the variations in combined stress along the axial length of the quartz cylinder for different thicknesses, i.e., 8, 11, 14 and 16 mm. The solid lines represent to the inner surface, while the dashed lines correspond to the outer surface. This figure has three regions, namely, region-A (Z = 0, i.e., bottom of the cylinder, to 26 mm), region-B (Z = 26 to 64 mm) and region-C (Z = 64 to 92 mm, i.e., top of the cylinder). Also, Figure 13 presents the contours of the combined stress in the quartz cylinder under the steady-state condition for various thicknesses.
It is clear from Figure 12 that near the top of the cylinder (see dashed green box in region-C), the combined stresses (for the inner surface) are tensile in nature for thicknesses of 11, 14 and 16 mm due to the dominance of thermal load over mechanical load (however, separate thermal and mechanical finite element analyses are not shown to maintain conciseness). Also, the combined stress is higher for higher thickness (compared to the case with respect to lower thickness), which is expected due to higher temperature gradients for higher thickness. Further to be noted is that for the lower thickness of 8 mm, this stress (inner surface) (dashed green box in region-C) is compressive in nature, i.e., the dominance of mechanical load over thermal load. The combined stresses near the bottom of the cylinder (see dashed green box in region-A) (inner surface) are found to be compressive for all thicknesses. This is due to the dominance of mechanical load over thermal load (which is quite low at the bottom of the cylinder compared to the top; Figure 7b). These stresses are then increased (become tensile in nature) in the axial direction of the quartz cylinder (moving towards region-B) (see dashed blue box specifically in region-A). This is due to the tensile nature of both thermal and mechanical loads for higher thicknesses, i.e., 11, 14 and 16 mm, and the dominance of mechanical stress (tensile) over thermal stress (compressive) in the case of an 8 mm thickness. The maximum combined stress (for the inner surface) is noted in region-B for all the thicknesses considered (see Figure 13).
At the outer surface, the combined stresses are higher and more tensile in nature near the top of the cylinder (see dashed blue box in region-C for thickness of 11, 14 and 16 mm). This is due to the tensile nature of both mechanical and thermal loads at the outer surface and having higher thermal loads due to higher temperature gradients for higher thicknesses. This is also clear from relatively lower tensile stress (outer surface) for an 8 mm thick quartz cylinder, having lower temperature gradients compared to higher thicknesses. The combined stresses are maximum in region-C for all the thicknesses considered, and reduce moving towards region-A (bottom of the cylinder) due to the reduction in thermal load.
Figure 14a,b show the combined stress variations (across the light grey arrow in the axial direction as indicated in Figure 14b) and its contours for the quartz piston top, respectively. Figure 15a–d depict the contours of thermal stress, mechanical stress, combined stress with x and r axes cut view and combined stress with x, r and z axes cut view (see r and z axes in Figure 11b) for the piston top with an 8.5 mm thickness. With given constraints, the stresses in the piston top are compressive in nature (Figure 14a). This is due to a lower thermal stress (which is tensile in nature) compared to a relatively higher mechanical stress, which is compressive in nature. At Z = 0 mm, it is more compressive for lower thickness compared to its higher thickness counterpart. This is due to a lower thermal load for lower thickness compared to a relatively higher thermal load for higher thickness at the same location. As the thermal stress increases along the axial length (i.e., grey arrow in Figure 14b), see Figure 15a, the combined stress decreases moving from Z = 0 mm towards the top (for all the thicknesses considered) and reaching its minimum. With the reduction in thermal stress then (which is tensile in nature), the overall combined stress is increased (more compressive) and reaches its maximum at the top (for example, Z = 7 mm for the piston top with a 7 mm thickness).

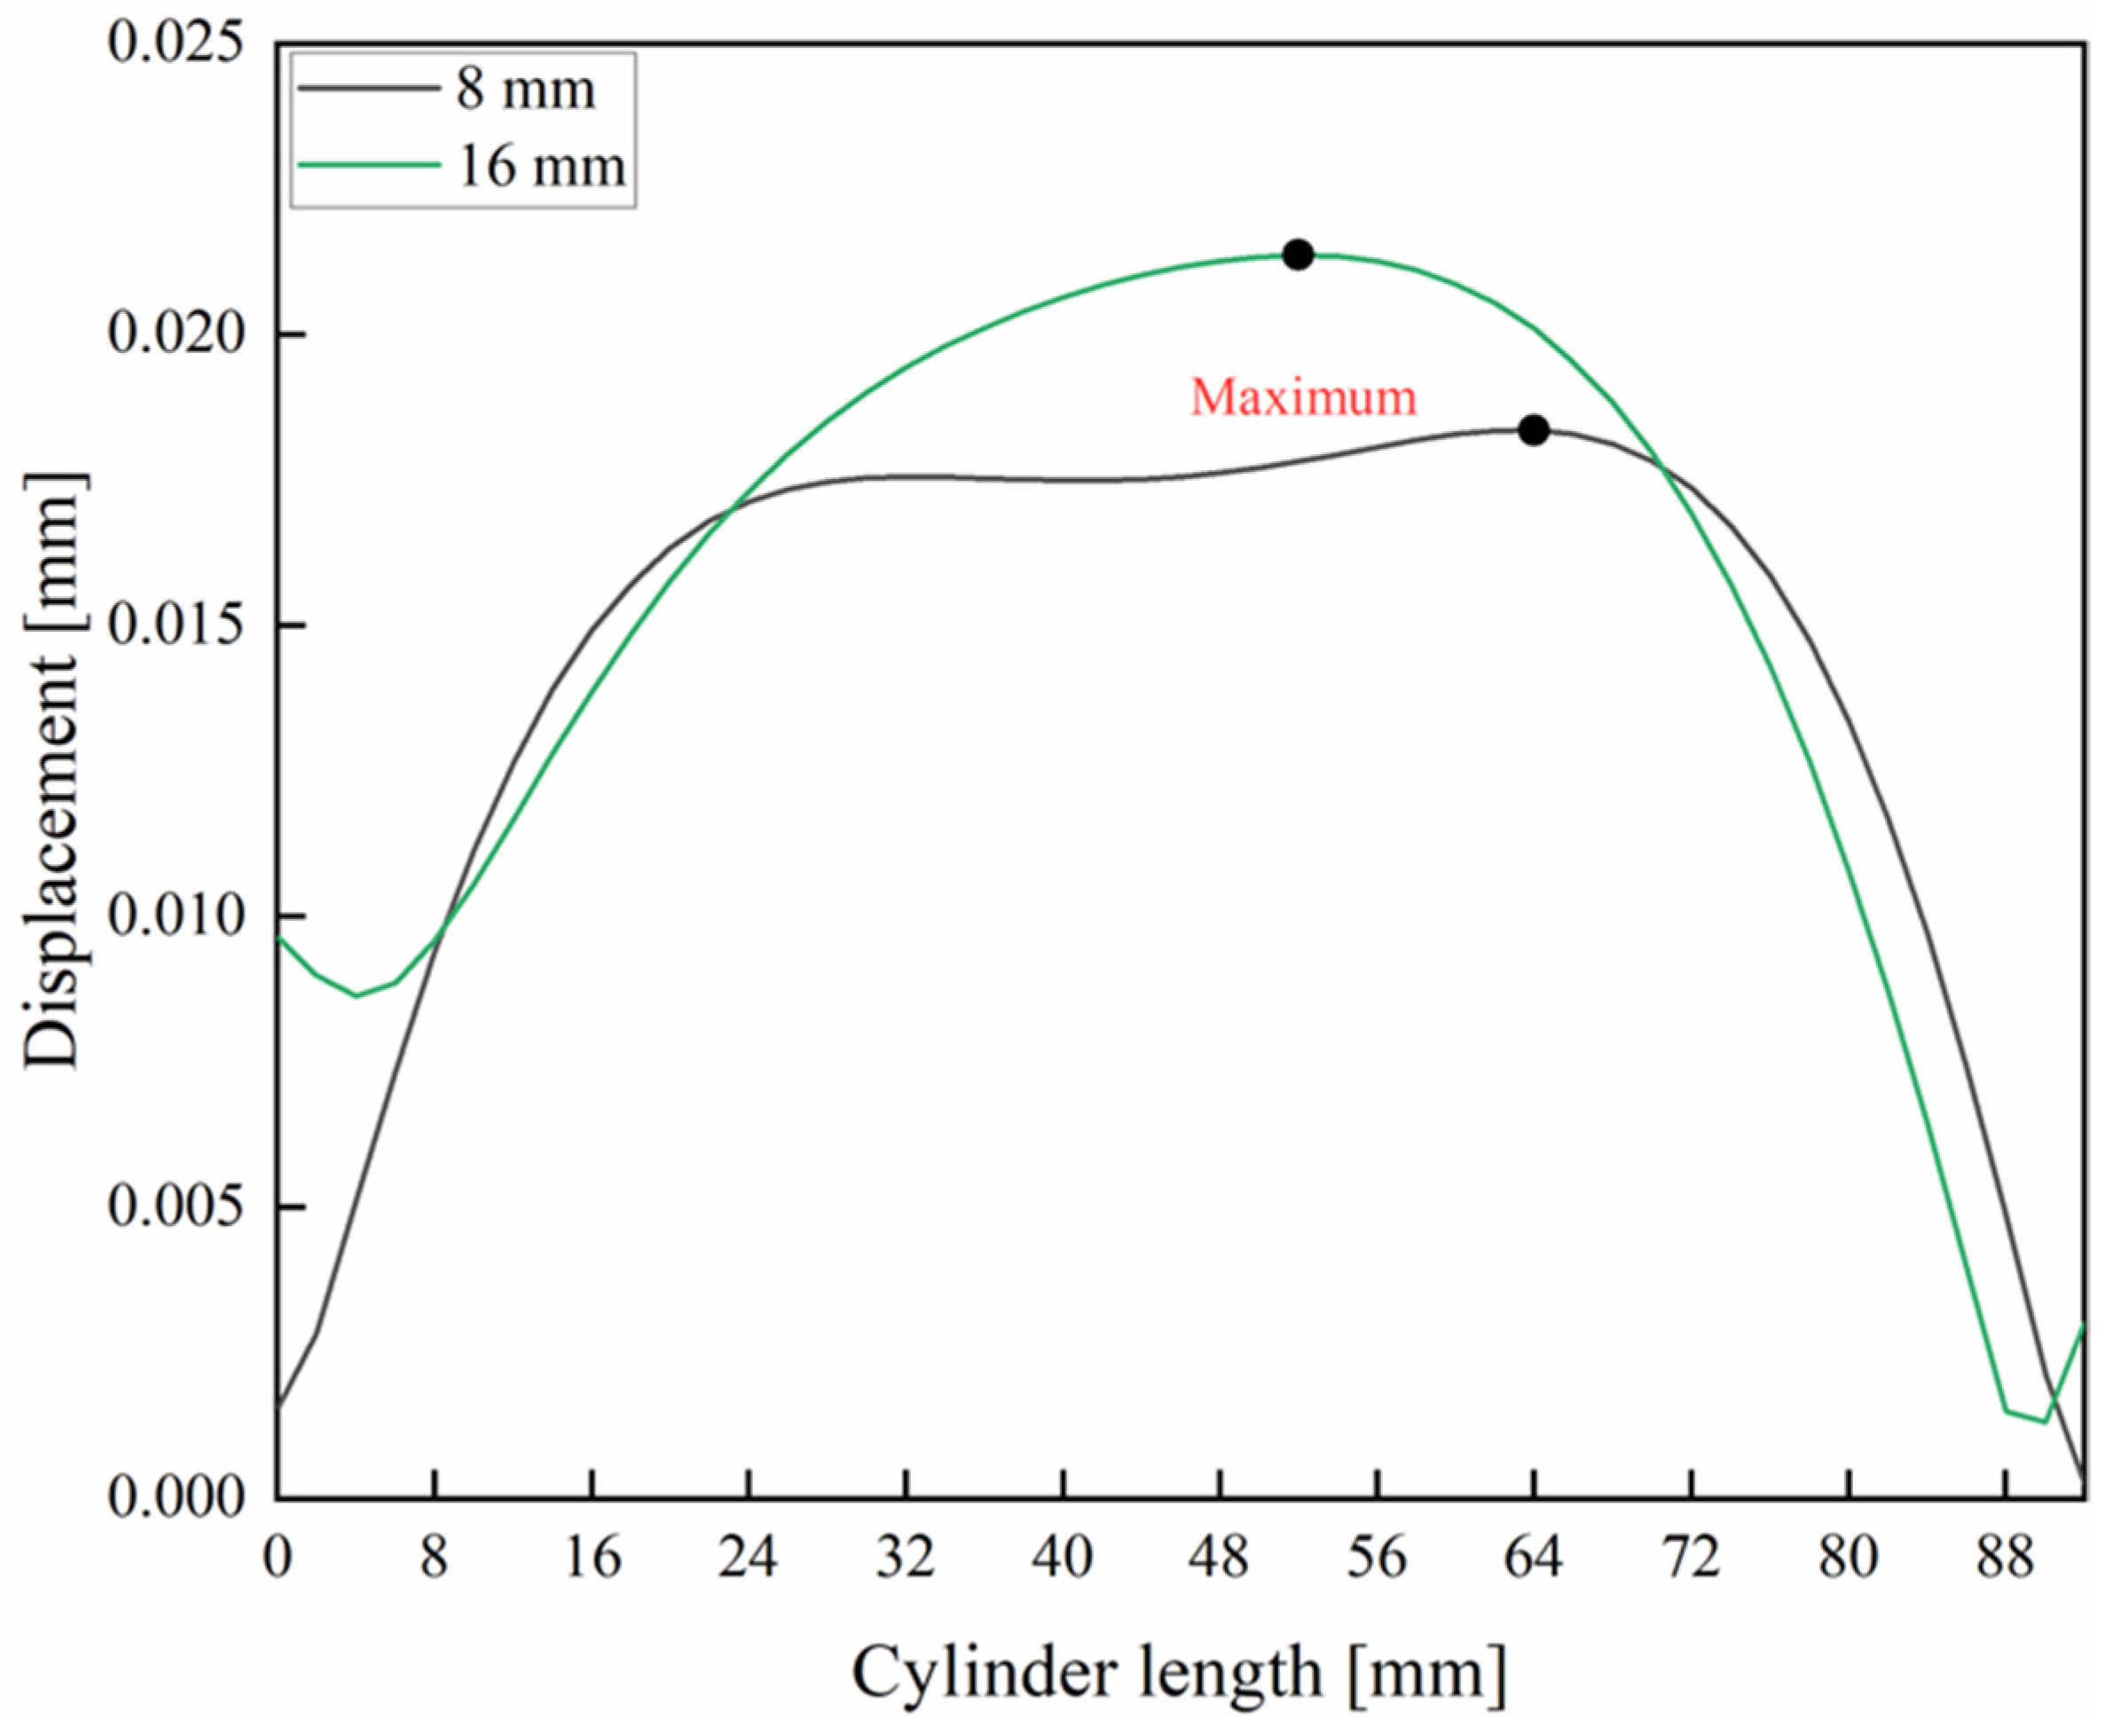
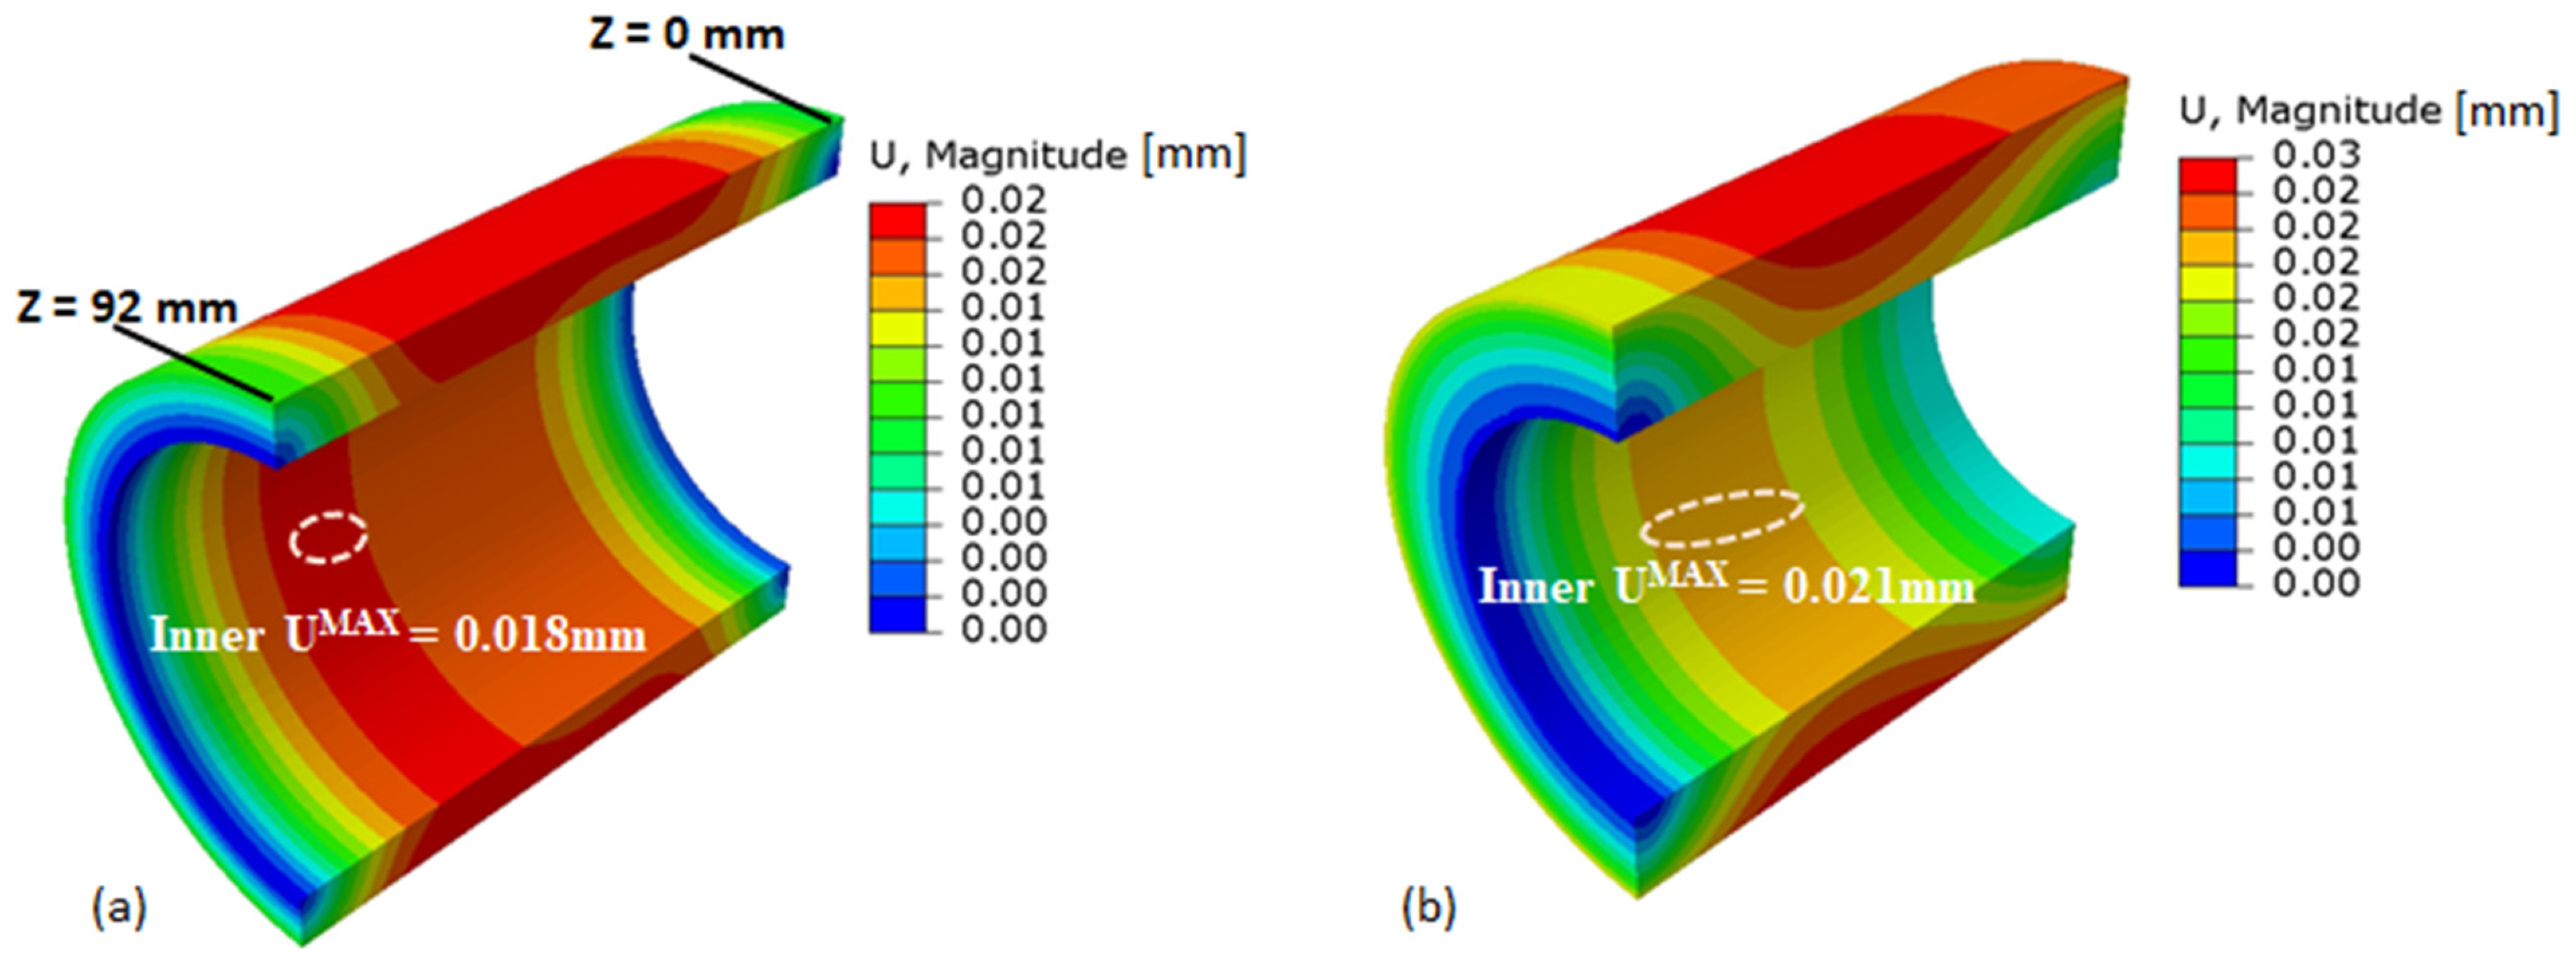
5.3. Displacement Distributions in the Quartz Cylinder and Piston Top under Combined Loading Conditions

Figure 16 depicts the variation in displacement (U) (radially outwards) at the inner surface of the quartz cylinder along the axial length for thicknesses of 8 and 16 mm. The displacement values first increased along the axial length from bottom to top, reached to their maximum, and then decreased. The locations of maximum displacements (inner surface) are 64 and 52 mm for 8 and 16 mm thicknesses, respectively.
Figure 17a,b show the displacement contours for the quartz cylinder with thicknesses of 8 and 16 mm, respectively. The maximum displacement at the inner surface is identified with a dashed white ellipse for the thicknesses shown. It is about 18 µm for the 8 mm thick cylinder, and 21 µm for the cylinder thickness of 16 mm.
Also, it is to be noted that the displacements in the piston top are not found to be significant. The maximum displacement for the piston top with an 8.5 mm thickness is 2.8 µm (however, it is not shown here for brevity).

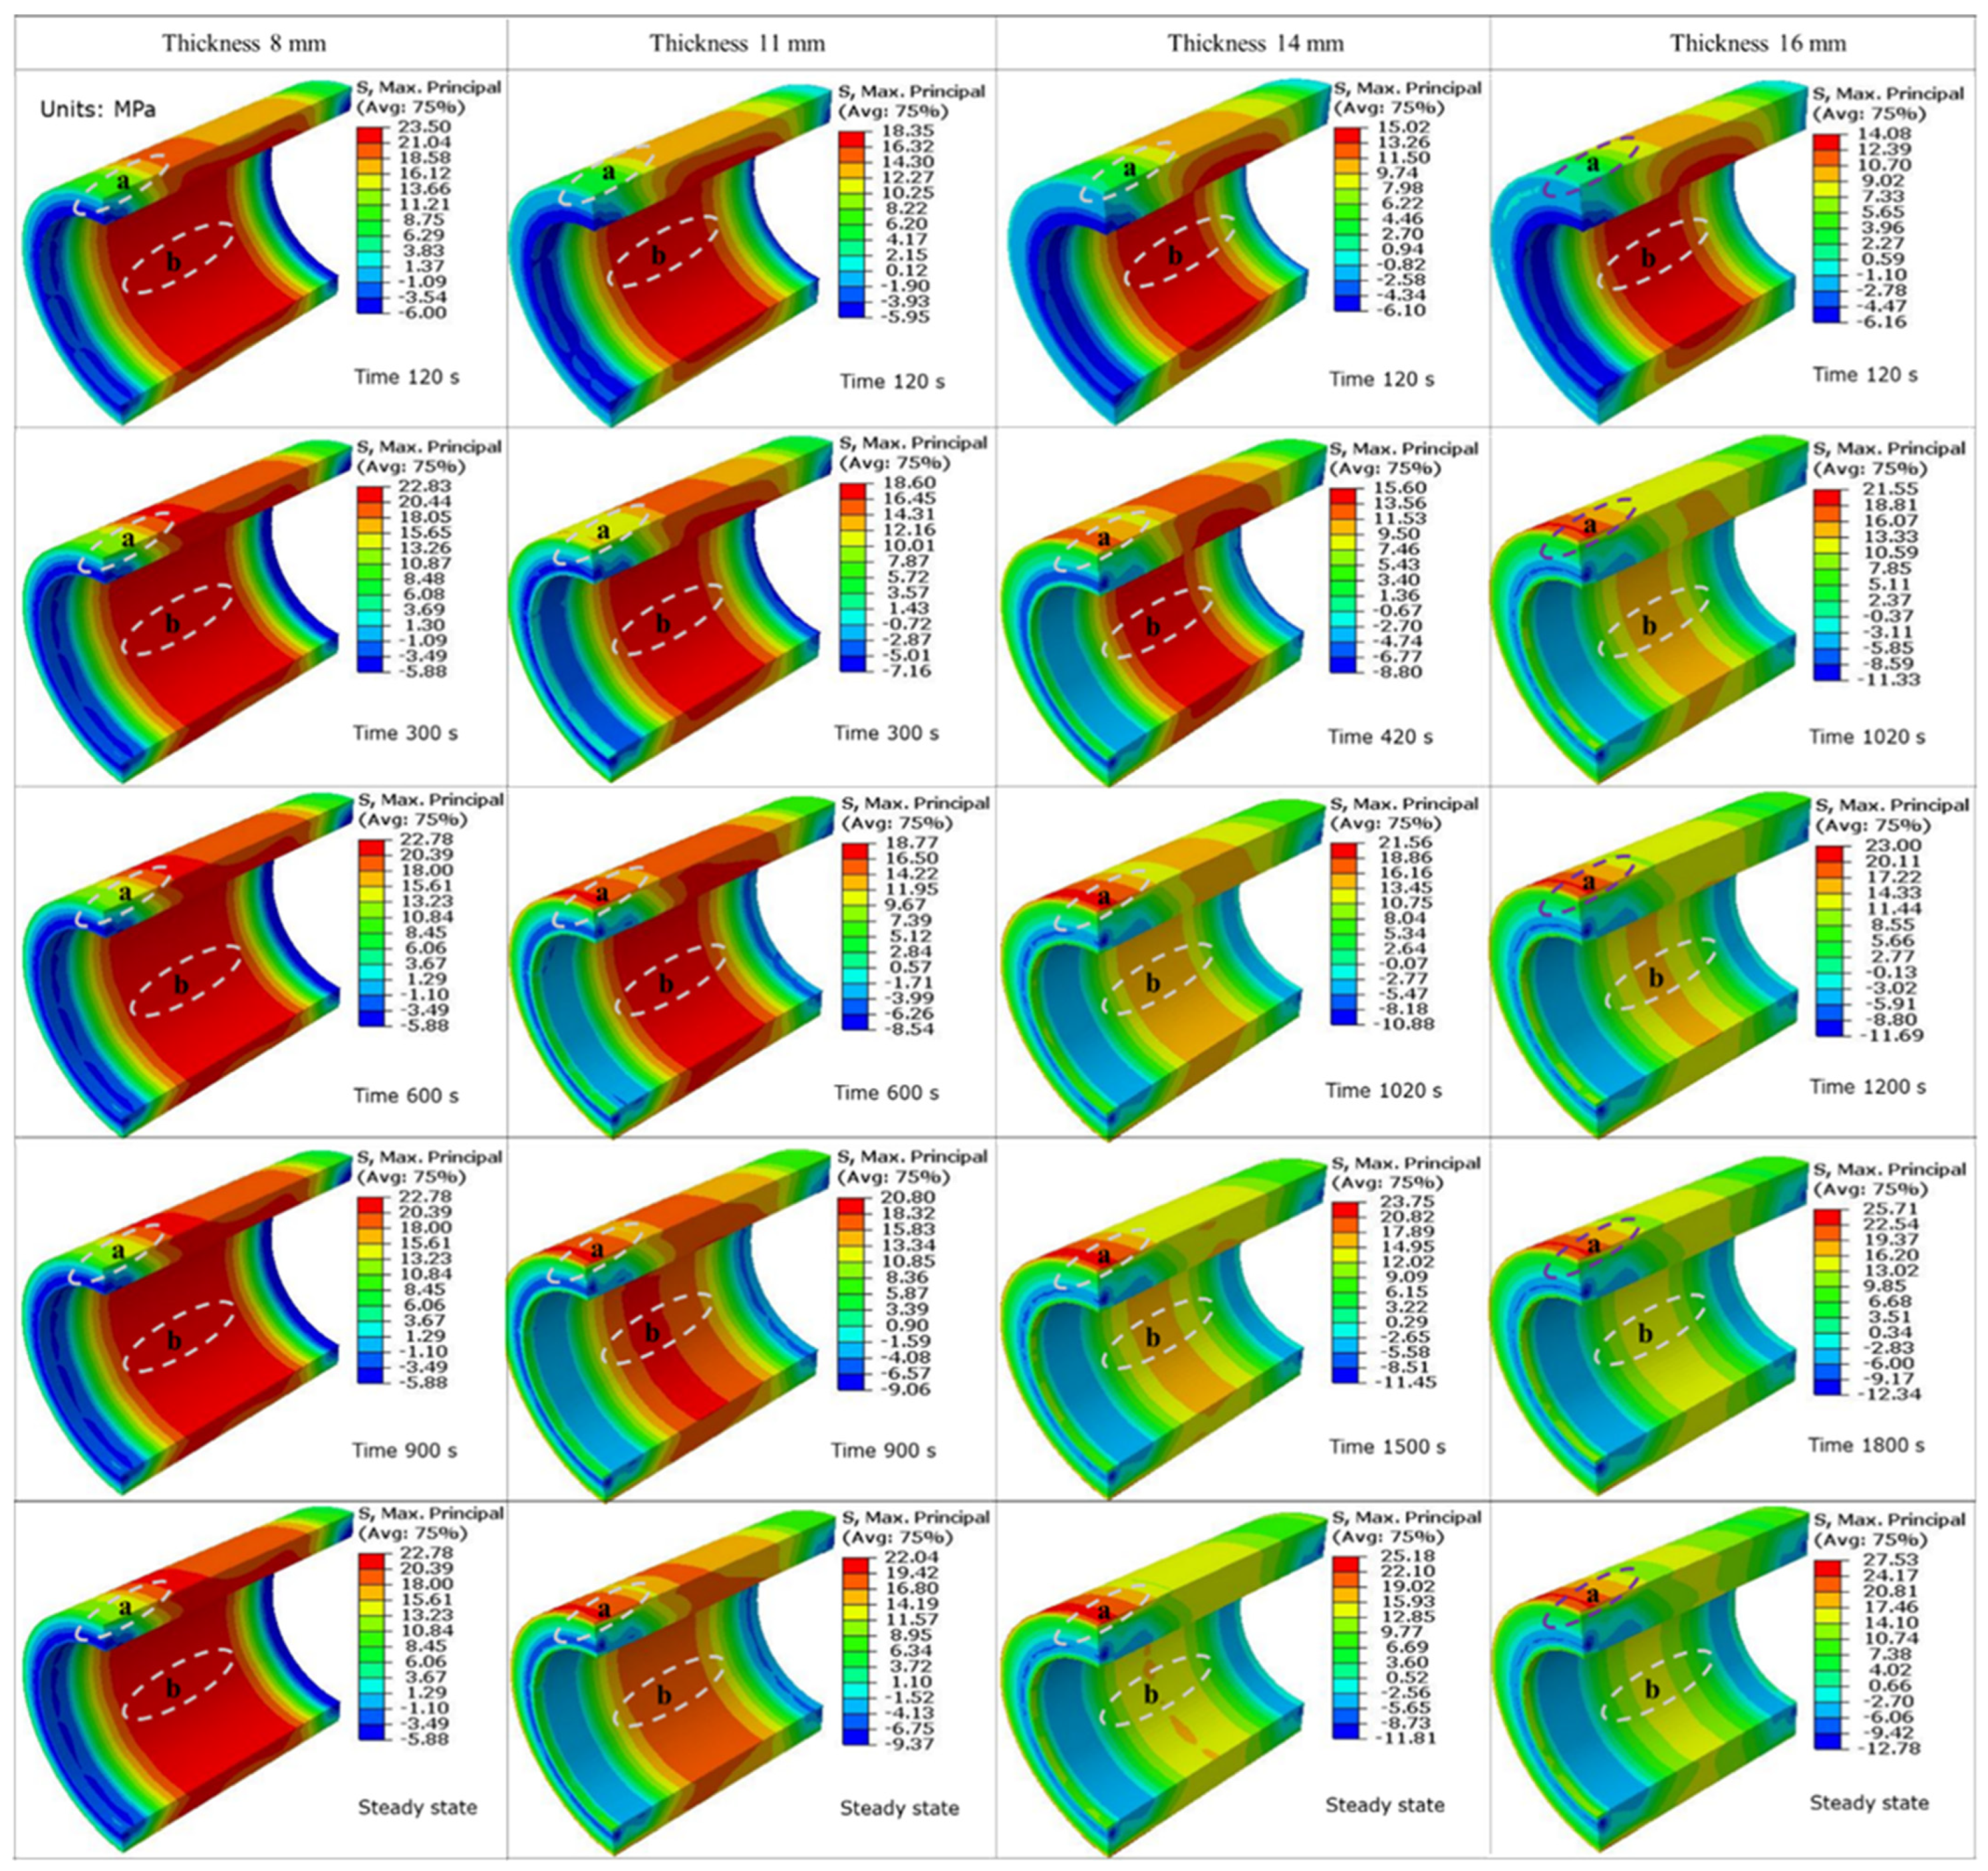
5.4. Effect of Different Engine Operating Times: Transient Analysis for the Quartz Cylinder

Figure 18a shows the variation of maximum temperature in the quartz cylinder (thicknesses of 8, 11, 14 and 16 mm) for different engine operating times. It is observed that the slope decreases with increasing operating times for all the thicknesses considered and eventually reaches to zero (steady state) due to the relative effects of the mean body temperature and temperature gradient. The temperature gradient dominates the mean body temperature at early operating times. In contrast, mean body temperature dominates the temperature gradient at later operating times [17]. This phenomena described above depend on the distance over which heat diffuses into the material during a time interval commonly called thermal penetration depth ( δ ), which in turn is approximately the square root of the product of thermal diffusivity ( ϑ ) and penetration time ( τ ), i.e., δ   ~   ϑ × τ [43]. Thus, the penetration timings for the respective thicknesses of 8, 11, 14 and 16 mm are 80, 151, 245 and 320 s, respectively. External cooling (forced convection) has no effect at operating times shorter than the thermal penetration time because the outer surface temperature equals the ambient temperature. Less thermal penetration time for low thickness values leads to a quicker steady state of the cylinder. As a result, the maximum temperature slope is steeper for low thicknesses. Furthermore, the durations necessary for the temperatures to achieve 90% of their steady-state values are 180, 660, 1080 and 1380 s for the various thicknesses (see the highlighted solid dots in Figure 18a).
Figure 18b illustrates the variation of maximum combined stress in the quartz cylinder for different engine operating times. For all thicknesses except 8 mm, these stress profiles showed similar trends to those of maximum temperature. This is because the stress due to thermal load depends on the temperature gradient and mean body temperature [44], which are time functions. The 8 mm thickness shows the maximum combined stress when the operating time ( τ ) is less than the corresponding thermal penetration time, as seen in Figure 18b. This is because a lower thickness leads to higher mechanical stress, which in turn is more dominant than thermal stress (due to a lower temperature gradient). With the increased operating time, thermal stress rises in the material, causing reduced combined stress. Higher thicknesses, on the other hand, cause decreased mechanical stress due to the reinforcing effect. For other thicknesses, increasing the operating time influences the thermal stress, which in turn raises the combined stress to eventually attain a steady state (hence, no change in temperature gradient or mean body temperature). The solid red dots in Figure 18b indicate the combined stresses at 600, 900 and 1500 s for the cylinder thickness of 11 mm. Table 3 gives a clear comparison of these stress values for various thicknesses. Thus, it can be seen that, compared to other thicknesses, the 11 mm thick cylinder has a lower combined stress at steady state because of the trade-off between thermal and mechanical stresses.
Figure 19 shows the contours of transient combined stress in the quartz cylinder for various thicknesses. Each distribution emphasized two regions: (a) and (b). These regions were selected because they experienced the highest combined stress. For the thickness of 8 mm, the maximum combined stress occurs at region (b). This is because, as mentioned earlier, the mechanical stresses are maximum at the inner surface and dominate the corresponding thermal values. The maximum combined stress for thicknesses of 11, 14 and 16 mm occurs in the inner surface, region (b), during early operational times because mechanical stress exceeds thermal stress, which is smaller due to a lower mean body temperature. Furthermore, with increased operating time, thermal stress exceeds mechanical stress due to the rise in mean body temperature. Therefore, at the later times, region (a) at the top outer surface experiences the maximum combined stress for higher thicknesses. There have been no studies that directly compare stress distributions of a transient analysis. However, these distributions of the transient analysis are attributed to the following principles: For smaller thicknesses, the maximum combined stress occurs at the inner surface of the cylinder [45]. With increased thickness, the thermal stress dominates the mechanical stress (at later operating times), and its maximum occurs at the outer surface.

5.5. Selection of Optimum Thickness for the Quartz Cylinder and Piston Top

Figure 20 illustrates the maximum temperature within the quartz cylinder for firing (at different engine operating times, including steady state) and motoring (only at steady state) cases. As was also noted earlier, the steady-state case is observed to have higher maximum temperature compared to other operating times and it increased with the increase in thickness. However, the maximum temperature for different thicknesses is found to be within the acceptable temperature limits outlined in [12].
The investigation of temperature alone, however, cannot lead us to the optimum thickness for the quartz cylinder. The quartz cylinder should also withstand different stress levels along with surface displacements that should be within the acceptable limits. The displacements, however, were not found to be significant in the present analysis (Section 5.3).
Figure 21 compares the maximum values of combined stress and thermal and mechanical stresses at the steady-state condition. As discussed, thermal stress rises with thickness due to a rise in the temperature gradient. However, the reinforcement of the cylinder reduces the mechanical stress. Consequently, this trade-off relationship should lead to a thickness where the combined stress in the cylinder is at a minimum. The lowest maximum combined stress is observed for 11 mm. Besides this, the combined stress depends on the engine operating times, which affects the thermal gradients, and in turn, the thermal stress.
Figure 22a shows the maximum combined stress within the quartz cylinder for firing (at different engine operating times, including steady state) and motoring (only at steady state) cases. The maximum combined stress is seen to decrease for engine operating times of 600 and 900 s with an increase in thickness. This is due to the effect of decreased mechanical stress being more dominant than increased thermal stress. It is to be noted that mechanical stress dominance is seen for a thickness of 8 mm, while thermal stress dominance happens for 14 and 16 mm thicknesses. Hence, the maximum combined stress is higher for these thicknesses compared to 11 mm. This is evident from Figure 22a; see the maximum combined stress for 11 mm for engine operating times of 1500 s and the steady-state condition. In the motoring case, the combined stresses for the cylinder thicknesses of 11 mm and 14 mm are comparable, i.e., 7.2 MPa and 7 MPa, respectively. However, the combined stresses for thicknesses of 8 mm and 16 mm are 9.4 MPa and 8 MPa, respectively.
Figure 22b illustrates the factor of safety (FOS) corresponding to the combined stress levels in the quartz cylinder for firing (at different engine operating times, including steady state) and motoring (only at steady state) cases. As discussed, the maximum combined stress varies with engine operating time, resulting in variation in FOS, which is higher for lower operating timings (600 and 900 s) compared to later timings including the steady-state case. The FOS increased with cylinder thickness for a lower operating time of 600 s. However, no significant difference in FOS is noted, i.e., 2.4, 2.43 and 2.46, for 11, 14 and 16 mm thicknesses, respectively, at 900 s. On the contrary, the FOS decreased for 14 and 16 mm thicknesses at operating times of 1500 s and steady state. Also, as expected, the FOS is higher for the motoring case when compared to the firing case, with a value of 6.9 for an 11 mm thickness. Therefore, taking engine operating timings and FOS into account, the thickness of 11 mm was selected as the optimum measure for the quartz cylinder, wherein the values of FOS are 2.6, 2.4, 2.29 and 2.27 for 600, 900 and 1500 s and at the steady-state condition, respectively. The quartz cylinder used in [17], which had undergone combined loadings without failure, had the FOS in the range of 2.6 to 2.7.
Considering the piston top, the maximum combined stress did not vary considerably for various thicknesses (7, 8.5, 10 and 12 mm) considered (Figure 14b). As a result, the authors employed Grashoff’s formula [46], which is represented with Equation (3), to determine the final thickness of the piston top.
t = 3 P D 2 16 S ,
where S is the tensile strength of the quartz material (50 MPa), D is the bore of the engine with a value of 62 mm and P is the peak in-cylinder combustion pressure, i.e., 50.7 bar. Solving this formula gives the thickness value of 8.5 mm. Therefore, this thickness is chosen as the final thickness for the quartz piston top.
The transient analysis for the piston top was not included in this paper. This is due to the fact that, at the steady-state condition, the maximum combined stress, which is always higher than that of different operating times, is seen to be very low compared to the design stress.

6. Conclusions

Firstly, a three-dimensional coupled finite element methodology is discussed, where simultaneous mechanical and thermal loads are applied to simulate the real-world loadings and constraints. Secondly, this coupled FEA is employed to examine the quartz cylinder and piston top of a small-bore DISI optical engine under investigation in this study. As a result, research is conducted to examine the temperature, combined stress and displacement distributions within the quartz cylinder and piston top, considering various thicknesses. This study draws the following major conclusions:
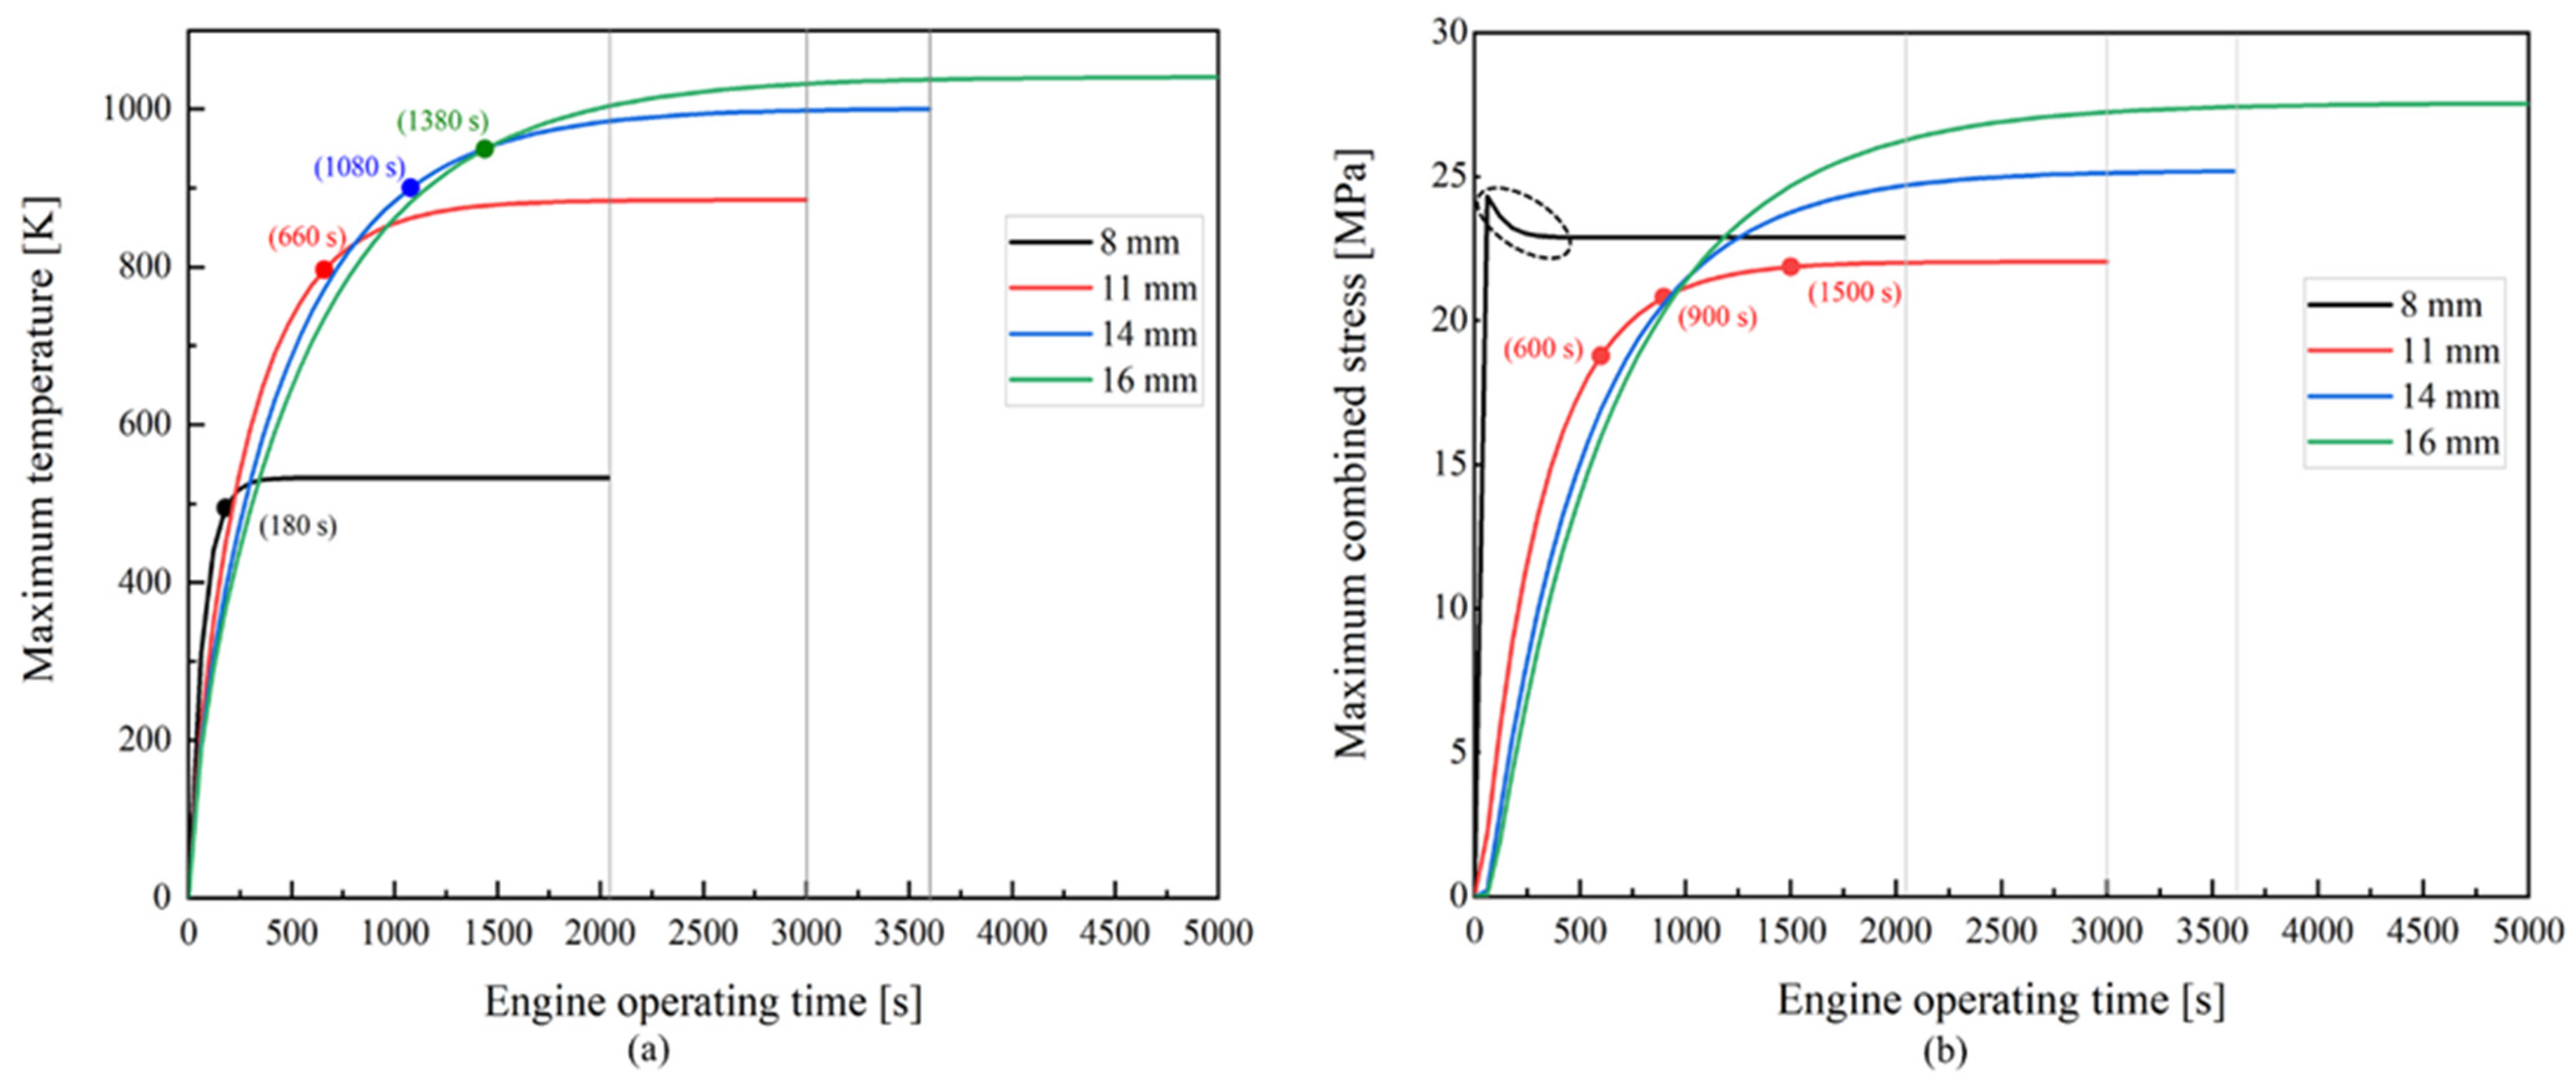
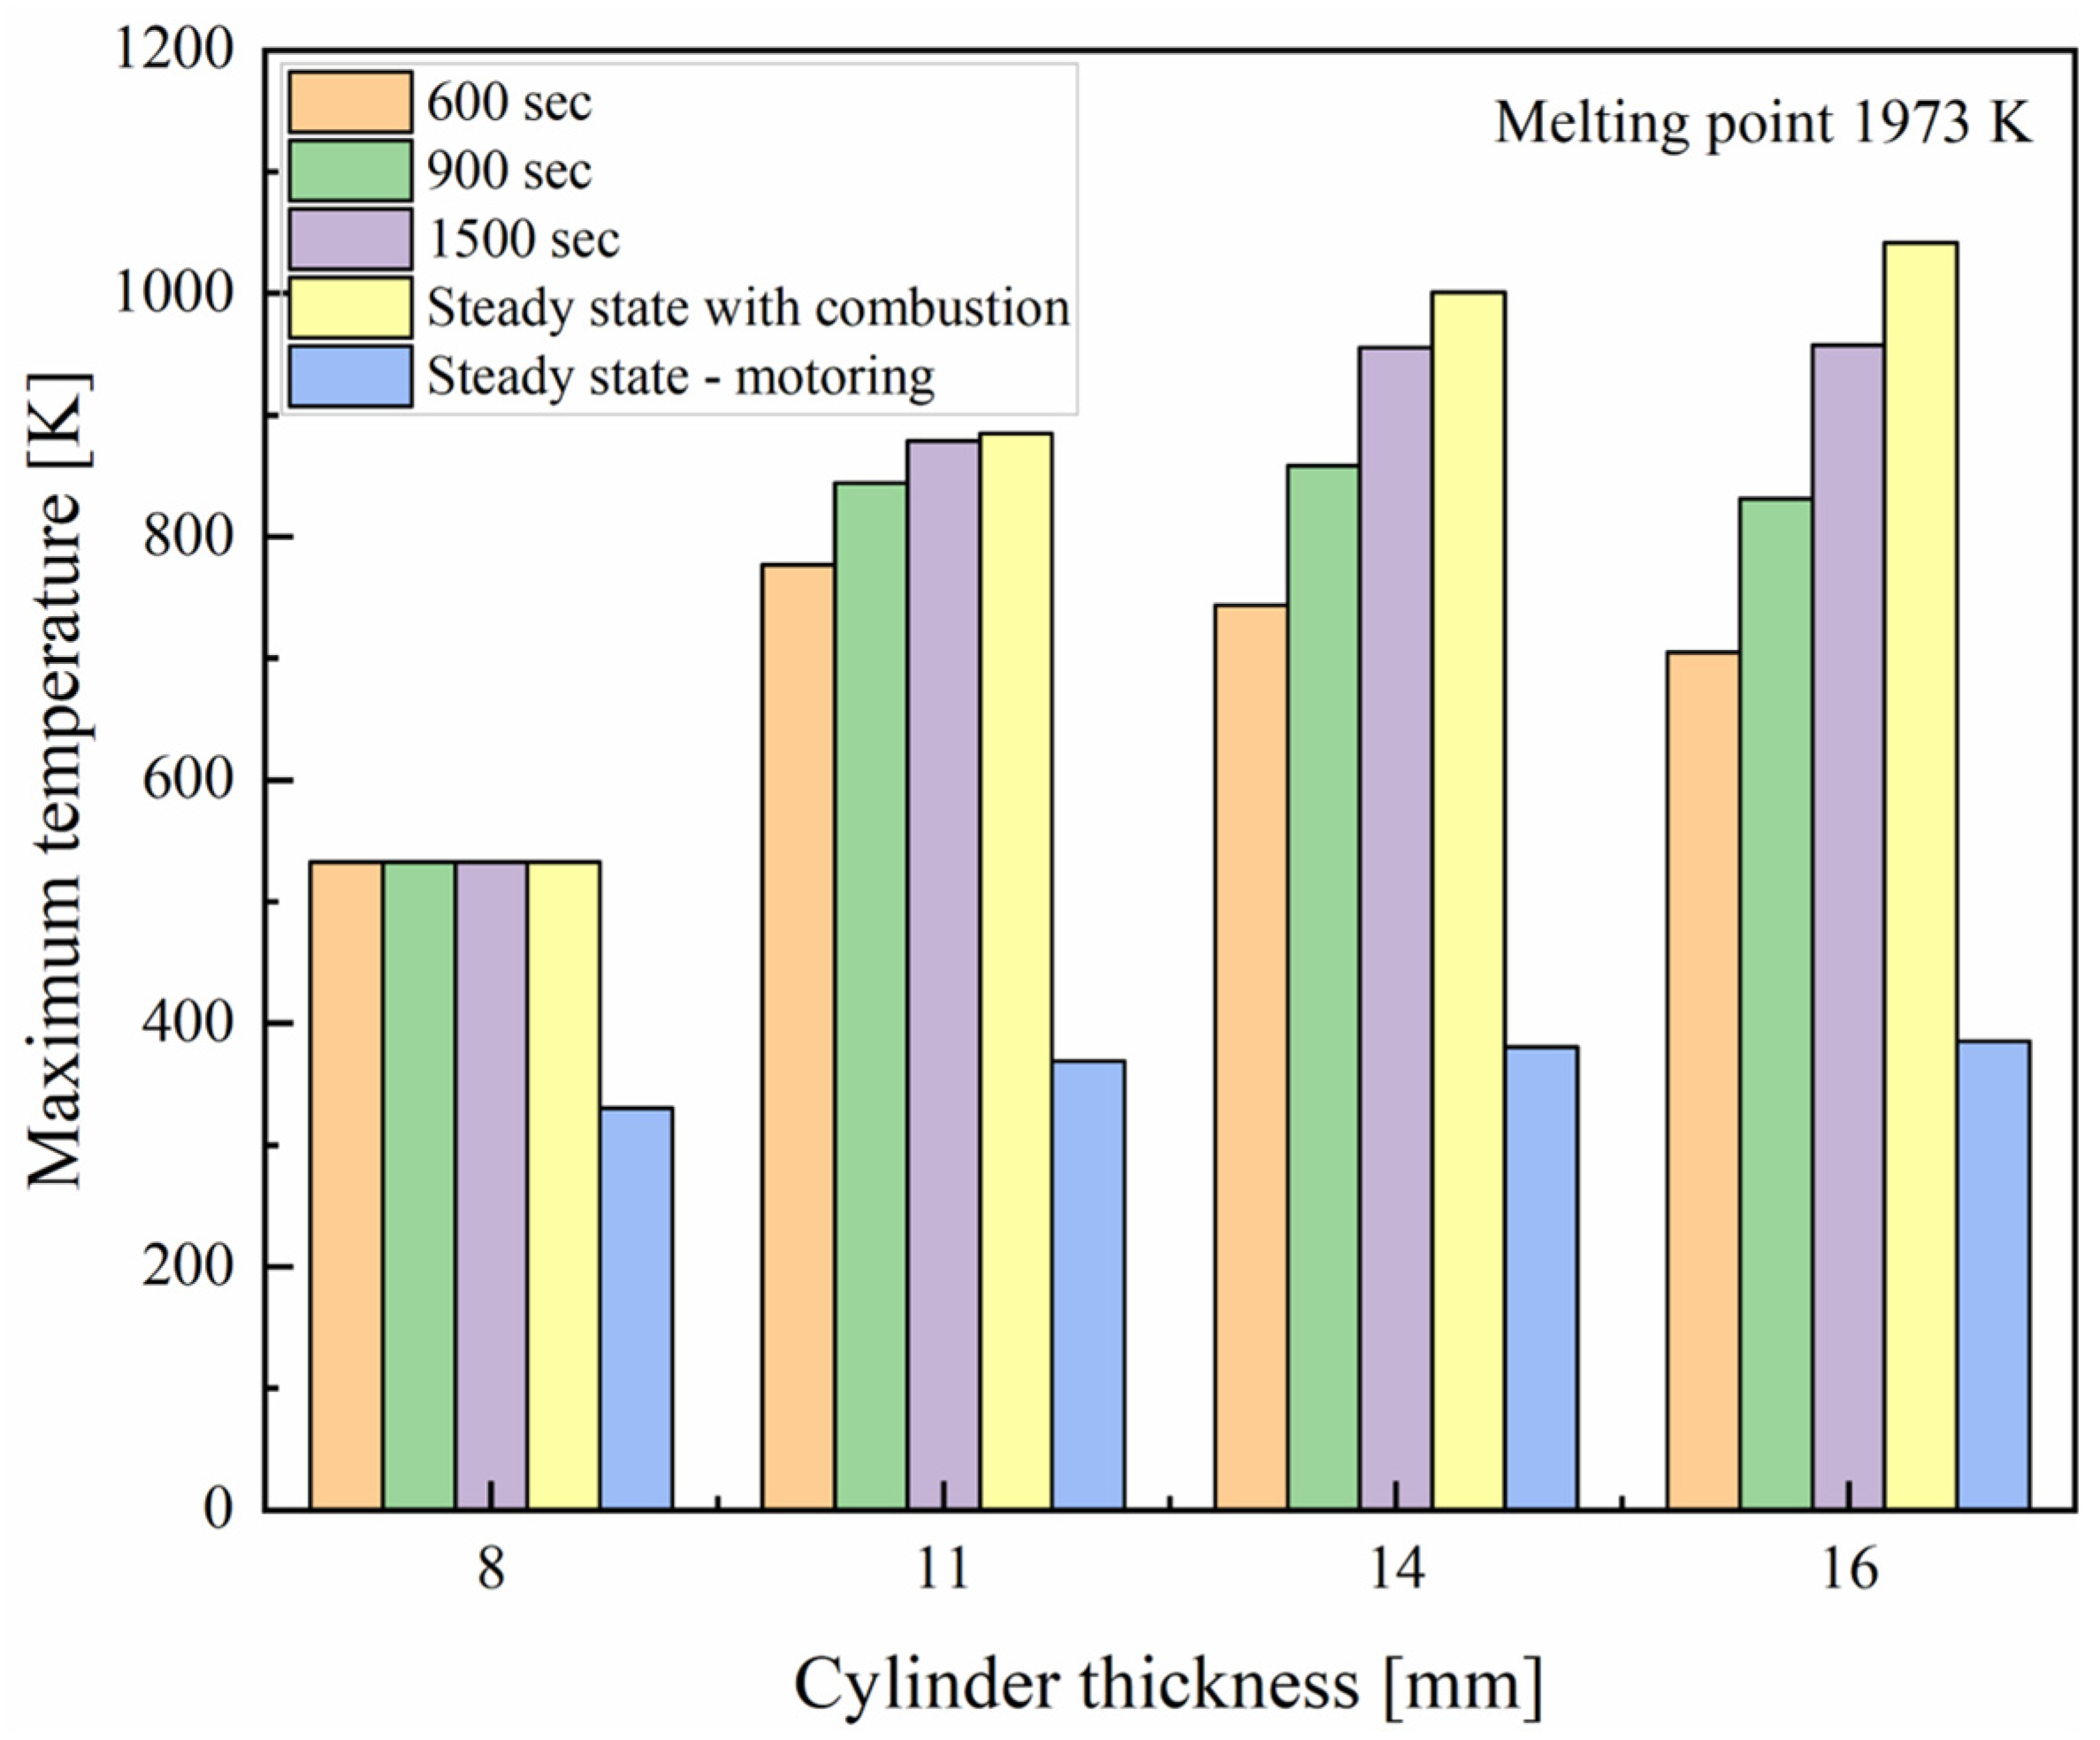
  • For the various thicknesses considered of the quartz cylinder, the maximum temperature occurs at the top inner surface. These maximum temperatures are noted to be 532.7 K, 885 K, 1001 K and 1041 K for thicknesses of 8, 11, 14 and 16 mm, respectively. Also, the maximum temperature reduced in the transient analysis with early engine operating times. In the motoring case, the maximum temperature is found to be in the range of 330 K to 390 K for different thicknesses considered.
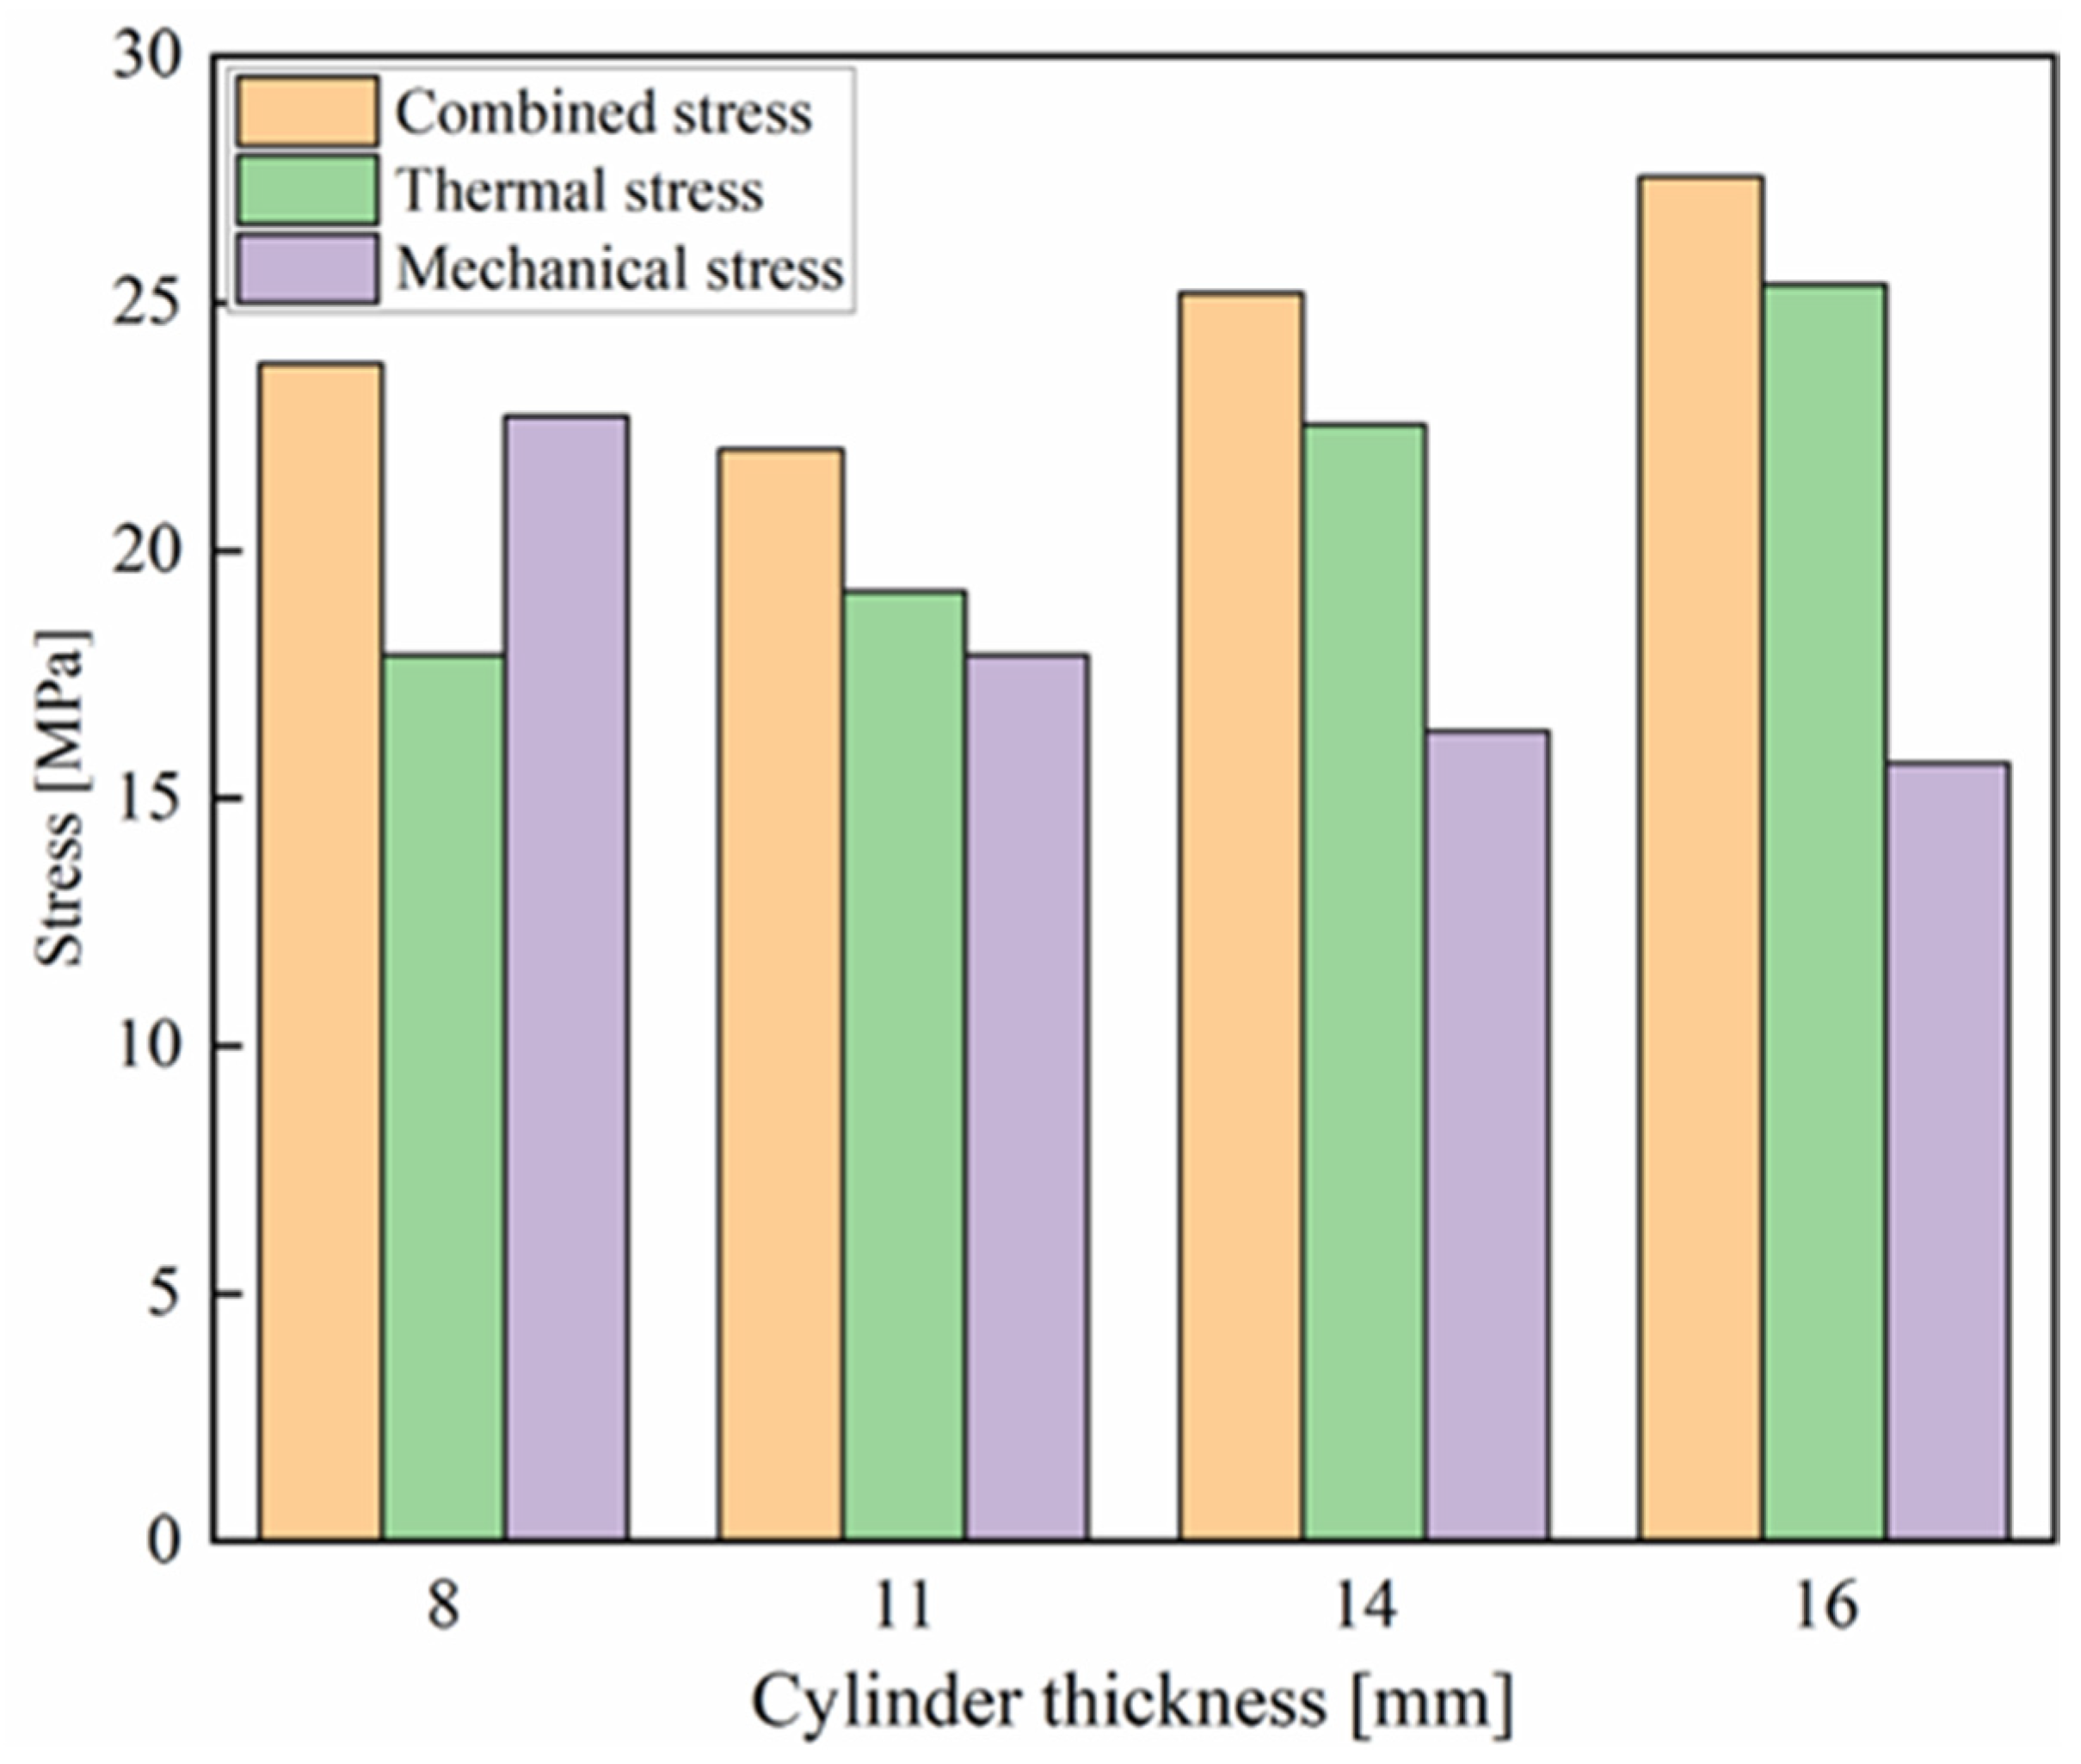
  • In the case of combustion, the maximum combined stress within the 8 mm quartz cylinder thickness is 23.78 MPa, located on the inner top surface. In contrast, for all other thicknesses, the maximum combined stress is situated at the outer surface because of the dominant thermal stresses. The lowest combined stress observed was 22.04 MPa in the 11 mm thick quartz cylinder, attributed to the trade-off between thermal and mechanical stresses.
  • Considering the case with combustion, the maximum combined stress within the 8 mm (thick) quartz cylinder is found to be 23.78 MPa, located at the inner top surface. In contrast, for all other thicknesses, the maximum combined stress is situated at the outer surface because of the dominant thermal stresses. The maximum combined stress (22.04 MPa) was lowest for the 11 mm thick cylinder compared to other thicknesses considered, attributed to the trade-off between thermal and mechanical stresses.
  • For all the thicknesses of the quartz cylinder considered, there is no substantial variation in the maximum displacement at the inner surface.
  • Lower combined stresses are reported during early engine operating times based on the transient study. As a result, a higher factor of safety occurs during lower operating times. Based on the steady-state and transient analyses, an 11 mm thickness was selected as the optimum thickness for the quartz cylinder.
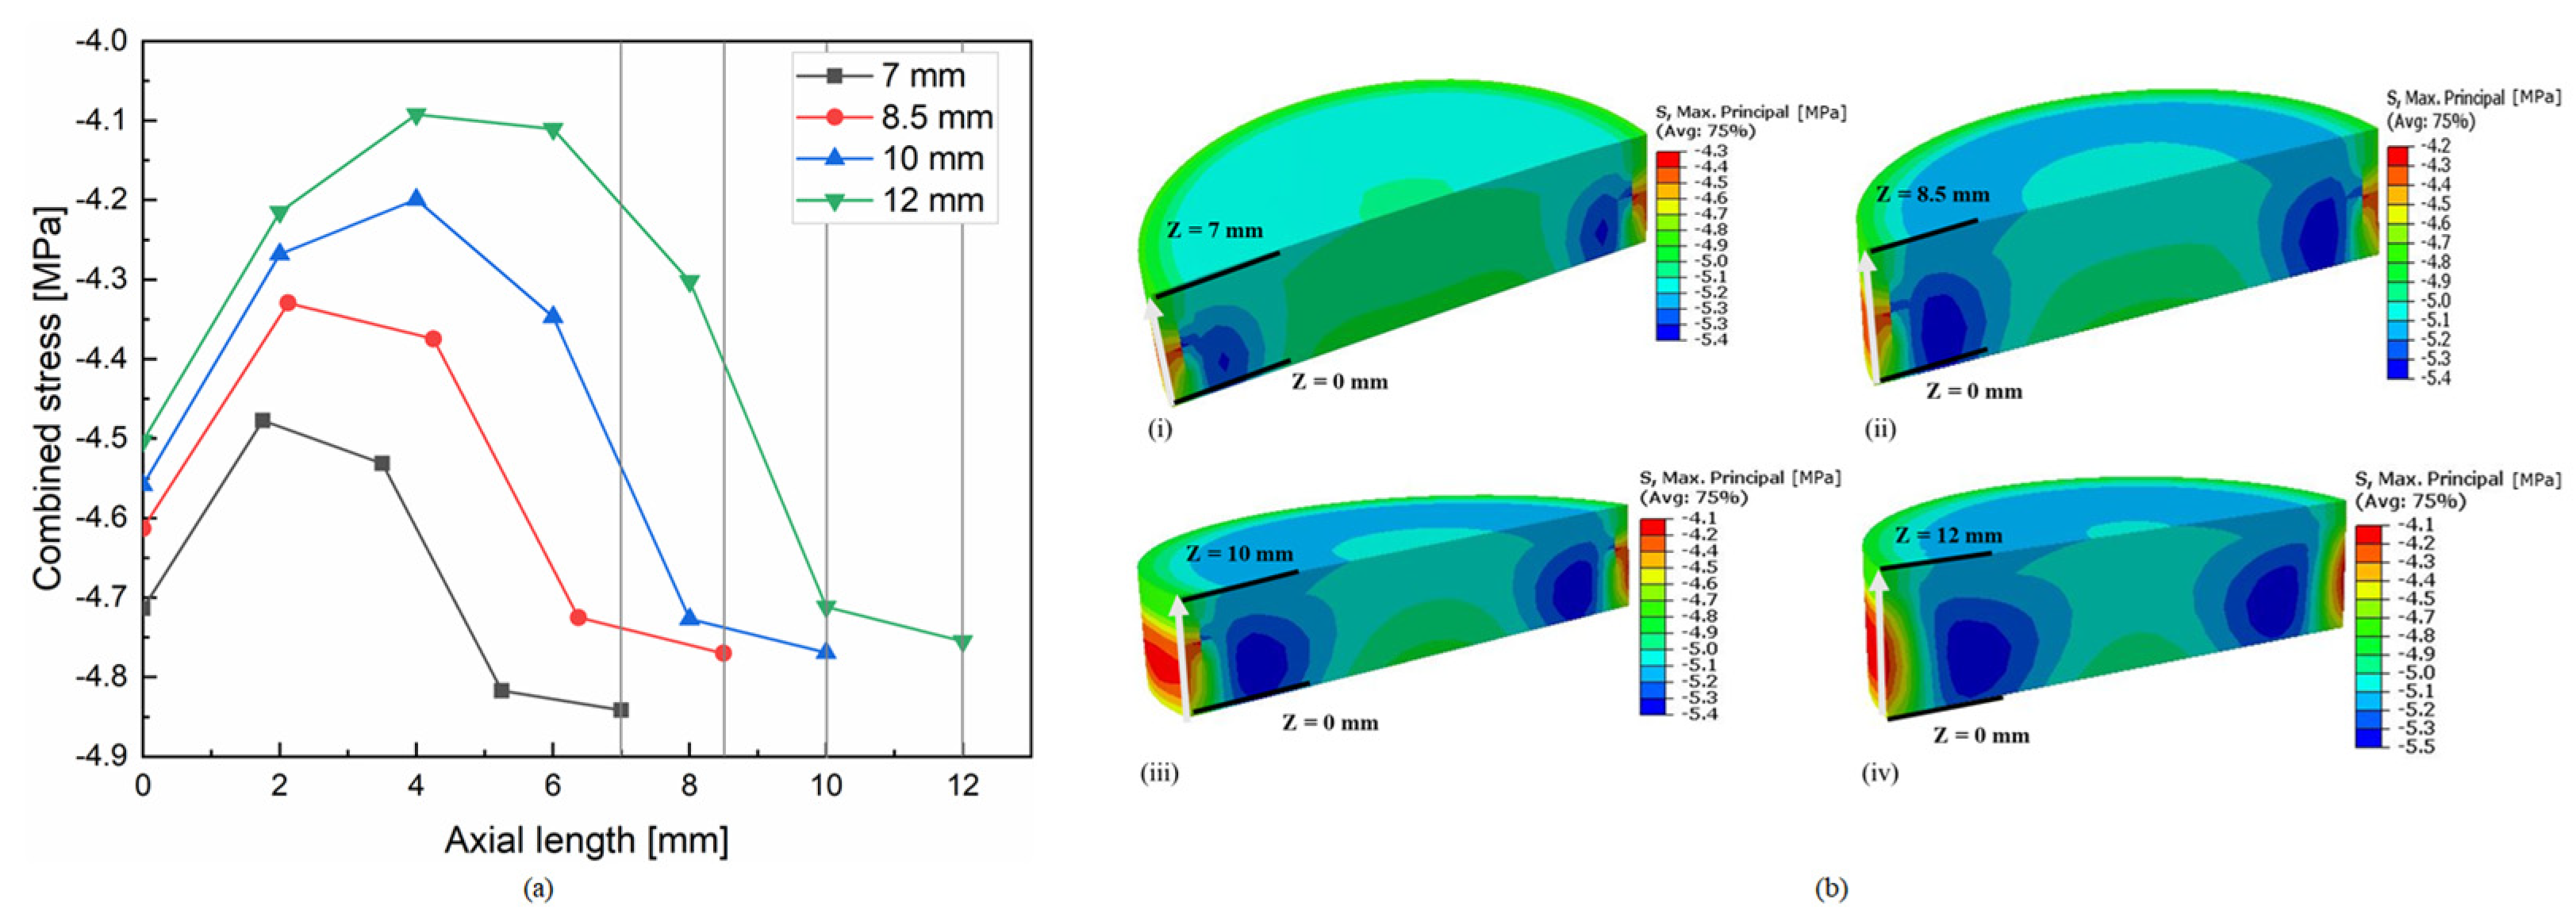
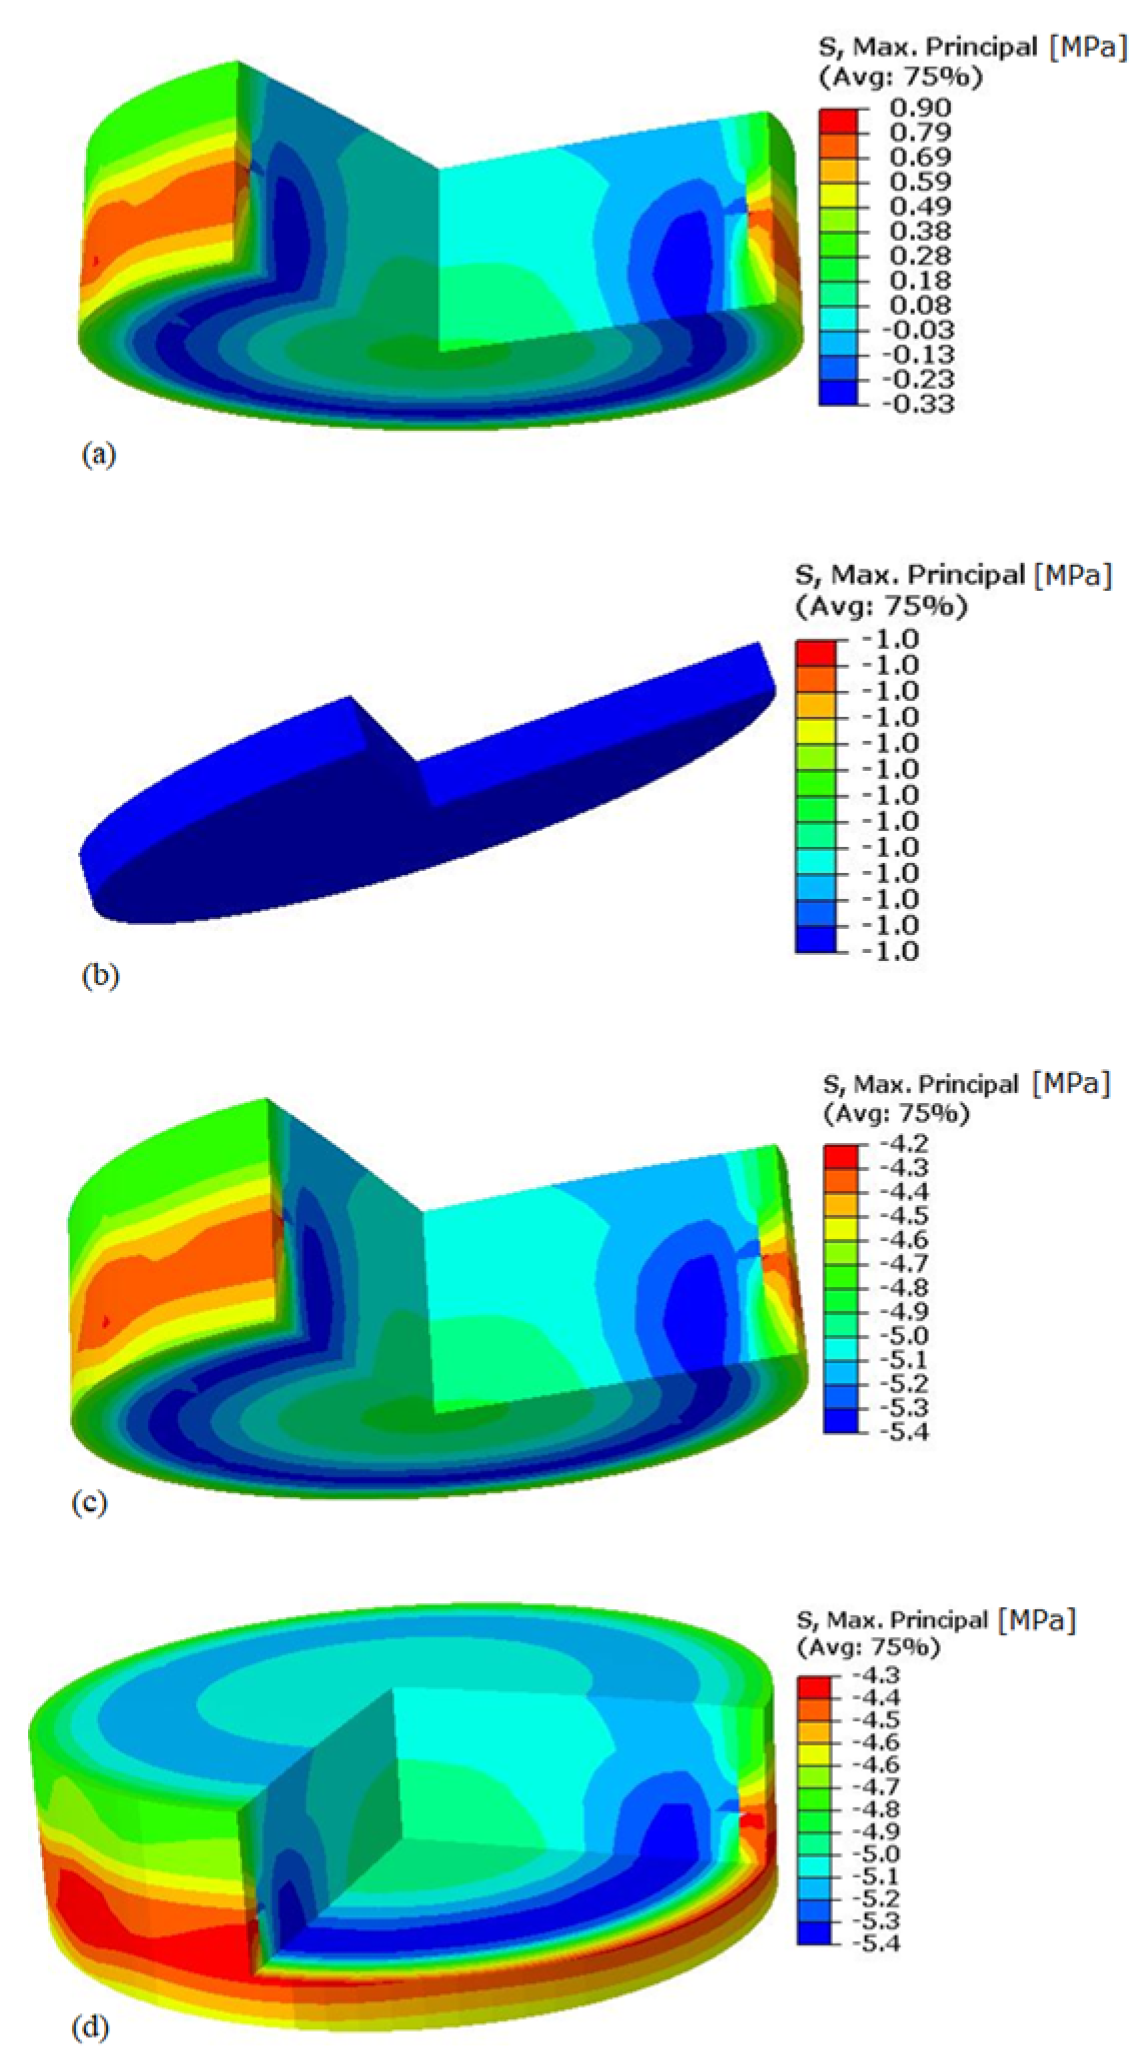
  • The maximum combined stress in the quartz piston top did not vary much with its thickness variation. The thickness was then calculated using Grashoff’s formula for the quartz piston top, and 8.5 mm was chosen as the optimum thickness in the present study.

Author Contributions

Conceptualization, M.M.; methodology, M.M., R.V., B.T.l. and L.V.; software, R.V. and B.T.l.; validation, M.M., R.A., L.V. and B.T.l.; formal analysis, R.V. and B.T.l.; investigation, R.V. and B.T.l.; resources, M.M., R.A. and L.V.; data curation, R.V.; writing—original draft preparation, R.V.; writing—review and editing, M.M., R.A., B.T.l. and L.V.; visualization, R.V.; supervision, M.M. and R.A.; project administration, M.M. and L.V.; funding acquisition, M.M. and R.A. All authors have read and agreed to the published version of the manuscript.

Funding

This work was supported by the Core Research Grant of Science and Engineering Research Board of India through Grant No. CRG/2020/003091.

Acknowledgments

The authors gratefully acknowledge the financial support from Science and Engineering Research Board of India through Grant No. CRG/2020/003091.

Conflicts of Interest

The authors declare no conflict of interest.

References

  1. Henriot, S.; Chaouche, A.; Chevé, E.; Duclos, J.M.; Leduc, P.; Ménégazzi, P.; Monnier, G.; Ranini, A. NSDI-3: A Small Bore GDI Engine; SAE: Warrendale, PA, USA, 1999. [Google Scholar]
  2. Cecere, G.; Irimescu, A.; Merola, S.S.; Rolando, L.; Millo, F. Lean Burn Flame Kernel Characterization for Different Spark Plug Designs and Orientations in an Optical GDI Engine. Energies 2022, 15, 3393. [Google Scholar] [CrossRef]
  3. Cho, K.; Grover, R.O., Jr.; Assanis, D.; Filipi, Z.; Szekely, G.; Najt, P.; Rask, R. Combining instantaneous temperature measurements and CFD for analysis of fuel impingement on the DISI engine piston top. J. Eng. Gas Turbines Power 2010, 132, 072805. [Google Scholar] [CrossRef]
  4. Jose, J.; Parsi, A.; Shridhara, S.; Mittal, M.; Ramesh, A. Effect of Fuel Injection Timing on the Mixture Preparation in a Small Gasoline Direct-Injection Engine; SAE: Warrendale, PA, USA, 2018. [Google Scholar]
  5. Kim, J.; Chung, J.; Kim, N.; Cho, S.; Lee, J.; Oh, S.; Song, C.; Min, K. Numerical investigation of soot emission sources in a direct-injection spark-ignition engine based on comprehensive breakup model validation. Int. J. Engine Res. 2023, 24, 217–239. [Google Scholar] [CrossRef]
  6. Nayek, S.; Mittal, M. Mixture Distribution in Spark Ignited Port Fuel Injection Engines: A Review. J. Eng. Gas Turbines Power 2023, 145, 70801. [Google Scholar]
  7. Jose, J.V.; Thakur, H.; Mittal, M.; Ramesh, A. A Computational Study on the Effect of Injector Location on the Performance of a Small Spark-Ignition Engine Modified to Operate under the Direct-Injection Mode; SAE: Warrendale, PA, USA, 2020. [Google Scholar]
  8. Jose, J.V.; Mittal, M.; Ramesh, A. Development of a small-bore gasoline direct-injection engine, and enhancement of its performance using multiple-injection strategies. SAE Int. J. Engines 2021, 14, 115–134. [Google Scholar] [CrossRef]
  9. Honda, T.; Kawamoto, M.; Katashiba, H.; Sumida, M.; Fukutomi, N.; Kawajiri, K. A Study of Mixture Formation and Combustion for Spray Guided DISI; SAE: Warrendale, PA, USA, 2004. [Google Scholar]
  10. El-Adawy, M.; Heikal, M.R.; Aziz, A.R.A.; Adam, I.K.; Ismael, M.A.; Babiker, M.E.; Baharom, M.B.; Firmansyah; Abidin, E.Z.Z. On the Application of Proper Orthogonal Decomposition (POD) for In-Cylinder Flow Analysis. Energies 2018, 11, 2261. [Google Scholar] [CrossRef]
  11. Mittal, M.; Mehta, P. Design Features of Optically Accessible Engines for Flow and Combustion Studies—A Review; SAE: Warrendale, PA, USA, 2018. [Google Scholar]
  12. Richman, R.M.; Reynolds, W.C. The Development of a Transparent Cylinder Engine for Piston Engine Fluid Mechanics Research; SAE: Warrendale, PA, USA, 1984. [Google Scholar]
  13. Bowditch, F.W. A New Tool for Combustion Research a Quartz Piston Engine; SAE: Warrendale, PA, USA, 1961. [Google Scholar]
  14. Nakanishi, K.; Hirano, T.; Inoue, T.; Ohigashi, S. The effects of charge dilution on combustion and its improvement—Flame photograph study. SAE Trans. 1975, 84, 352–364. [Google Scholar]
  15. Holtman, R.L.; McClure, P.B.; Detroit Diesel Allison, Indianapolis, Indiana. Private Communication, 1978.
  16. Bates, S.C. A transparent engine for flow and combustion visualization studies. SAE Trans. 1988, 97, 892–907. [Google Scholar]
  17. Lee, K.S.; Assanis, D.N. Thermo-mechanical analysis of optically accessible quartz cylinder under fired engine operation. Int. J. Automot. Technol. 2000, 1, 79–87. [Google Scholar]
  18. Lowe, A.S.H.; Morel, T. A new generation of tools for accurate thermo-mechanical finite element analyses of engine components. SAE Trans. 1992, 101, 1380–1395. [Google Scholar]
  19. Roy, S.; Ganesh, N.; Kumarasamy, A.; Viswanathan, P. Thermomechanical Analysis of a Cylindrical Liner. In The Advances in Engineering Design and Simulation: Select Proceedings of NIRC 2018; Springer: Singapore, 2020; pp. 33–40. [Google Scholar]
  20. Javanmardi, D.; Rezvani, M.A. Thermomechanical fracture failure analysis of a heavy-duty diesel engine cylinder liner through performance analysis and finite element modeling. SAE Int. J. Engines 2020, 13, 665–684. [Google Scholar] [CrossRef]
  21. Barbieri, S.G.; Giacopini, M.; Mangeruga, V.; Bianco, L.; Mastrandrea, L.N. A Simplified Methodology for the Analysis of the Cylinder Liner Bore Distortion: Finite Element Analyses and Experimental Validations; SAE: Warrendale, PA, USA, 2019. [Google Scholar]
  22. Liu, X.F.; Wang, Y.; Liu, W.H. Finite element analysis of thermo-mechanical conditions inside the piston of a diesel engine. Appl. Therm. Eng. 2017, 119, 312–318. [Google Scholar] [CrossRef]
  23. Shinde, G.; Mittal, M.; Lakshminarasimhan, V. A Study of Cycle-To-Cycle Flow Variations in a Small Spark-Ignition Engine at Low Throttle Opening; SAE: Warrendale, PA, USA, 2018. [Google Scholar]
  24. Alam, A.; Mittal, M.; Lakshminarasimhan, V. Analysis of In-Cylinder Flow and Cycle-To-Cycle Flow Variations in a Small Spark-Ignition Engine at Different Throttle Openings; SAE: Warrendale, PA, USA, 2020. [Google Scholar]
  25. Tsiogkas, V.D.; Chraniotis, A.; Kolokotronis, D.; Tourlidakis, A. In-Cylinder Flow Measurements in a Transparent Spark Ignition Engine; SAE: Warrendale, PA, USA, 2019. [Google Scholar]
  26. Ge, P.; Hung, D.L.S. Investigation of cycle-to-cycle variation of in-cylinder engine swirl flow fields using quadruple proper orthogonal decomposition. J. Eng. Gas Turbines Power 2017, 139, 72803. [Google Scholar] [CrossRef]
  27. Tornatore, C.; Sjöberg, M. Optical Investigation of a Partial Fuel Stratification Strategy to Stabilize Overall Lean Operation of a DISI Engine Fueled with Gasoline and E30. Energies 2021, 14, 396. [Google Scholar] [CrossRef]
  28. Misul, D.; Baratta, M.; Xu, J.; Fuerhapter, A.; Heindl, R. Experimental and CFD Investigation of Fuel Mixing in an Optical-Access Direct-Injection NG Engine and Correlation with Test Rig Combustion and Performance Data. Energies 2023, 16, 3004. [Google Scholar] [CrossRef]
  29. Zhu, C.; Chakrapani, V.; Wooldridge, M. An In-Cylinder Imaging Study of Pre-Chamber Spark-Plug Flame Development in a Single-Cylinder Direct-Injection Spark-Ignition Engine; SAE: Warrendale, PA, USA, 2023. [Google Scholar]
  30. Aronsson, U.; Chartier, C.; Horn, U.; Andersson, Ö.; Johansson, B.; Egnell, R. Heat Release Comparison between Optical and All-Metal HSDI Diesel Engines; SAE: Warrendale, PA, USA, 2008. [Google Scholar]
  31. ABAQUS, A. 6.14, Abaqus 6.14 Anal. User’s Guid; Dassault Systemes Simulia Corp.: Providence, RI, USA, 2014; Volume 14. [Google Scholar]
  32. Pourhamid, R.; Ahmadian, M.T.; Mahdavy Moghaddam, H.; Mohammadzadeh, A.R. Mechanical analysis of a functionally graded cylinder-piston under internal pressure due to a combustion engine using a cylindrical super element and considering thermal loading. Sci. Iran. 2015, 22, 493–503. [Google Scholar]
  33. Bergman, T.L.; Lavine, A.S.; Incropera, F.P.; DeWitt, D.P. Introduction to Heat Transfer; John Wiley & Sons: Hoboken, NJ, USA, 2011. [Google Scholar]
  34. Carreño, R. A Comprehensive Methodology to Analyse the Global Energy Balance in Reciprocating Internal Combustion Engines. Doctoral Thesis, Universitat Politècnica de València, Valencia, Spain, 2016. [Google Scholar]
  35. Stokes, J.; Lake, T.H.; Osborne, R.J. A Gasoline Engine Concept for Improved Fuel Economy—The Lean Boost System; SAE Technical Papers; SAE: Warrendale, PA, USA, 2000. [Google Scholar] [CrossRef]
  36. Nagar, P.; Miers, S. Friction between piston and cylinder of an IC engine: A review. In Proceedings of the SAE 2011 World Congress and Exhibition, Detroit, MI, USA, 12–14 April 2011. [Google Scholar] [CrossRef]
  37. Kennedy, M.; Hoppe, S.; Esser, J. Piston Ring Coating Reduces Gasoline Engine Friction. MTZ Worldw. 2012, 73, 40–43. [Google Scholar] [CrossRef]
  38. Mittal, M.; Schock, H.; Zhu, G. In-Cylinder Combustion Visualization of a Direct-Injection Spark-Ignition Engine with Different Operating Conditions and Fuels; SAE: Warrendale, PA, USA, 2012. [Google Scholar]
  39. Garg, S.; Mittal, M.; Sahu, S.; Lakshminarasimhan, V. Measurement of Fuel Distribution in a Small PFI Spark-Ignition Engine Using Tracer PLIF; SAE: Warrendale, PA, USA, 2020. [Google Scholar]
  40. Dudareva, N.Y.; Enikeev, R.D.; Ivanov, V.Y. Thermal Protection of Internal Combustion Engines Pistons. Procedia Eng. 2017, 206, 1382–1387. [Google Scholar] [CrossRef]
  41. Espadafor, F.J.; Villanueva, J.B.; García, M.T.; Trujillo, E.C. Analysis of a diesel generator cylinder failure. Eng. Fail. Anal. 2010, 17, 913–925. [Google Scholar] [CrossRef]
  42. Heywood, J.B. Internal Combustion Engine Fundamentals; McGraw-Hill Education: New York, NY, USA, 2018. [Google Scholar]
  43. Wulf, W. Integral methods for two-phase flow in hydraulic systems. Adv. Heat Transf. 1998, 31, 105–158. [Google Scholar]
  44. Spalding, D.B. Heat and Mass Transfer in Gasoline and Diesel Engines. International Symposium 1987. In Archives of Heat Transfer; Hemisphere Publishing Corporation: London, UK, 1988. [Google Scholar]
  45. Young, W.C.; Budynas, R.G. Elastic Stability; Springer: Dordrecht, The Netherlands, 1980; Volume 4, ISBN 007072542X. [Google Scholar]
  46. Bhandari, V.B. Design of Machine Elements, 3rd ed.; Denett & Company: Nagpur, India, 2020. [Google Scholar]
Figure 1. (a) Exploded view of the optical engine’s computer-aided model, and (b) optical engine experimental setup.
Energies 16 07400 g001
Figure 2. (a) Flow chart of the combined (mechanical and thermal) stress analysis, and (b) 3D model of the main parts in the optical engine along with different loadings.
Energies 16 07400 g002
Figure 3. Schematic of the assumptions in the load profiles: (a) mechanical (see red profile for combustion pressure, dark blue profile for clamping pressure and orange profile for atmospheric pressure loads), and (b) thermal loads (see dark red profile for combustion heat flux and dark gold profile for frictional heat flux loads).
Energies 16 07400 g003
Figure 4. Heat flux profiles on the inner surface of the quartz cylinder: (a) combustion heat flux, and (b) frictional heat flux.
Energies 16 07400 g004
Figure 5. Maximum in−cylinder combustion pressure from CFD analysis: (a) uniformly distributed maximum pressure, and (b) comparison of in−cylinder pressure traces from experiment and simulation.
Energies 16 07400 g005
Figure 6. (a) FEA model of the quartz cylinder, and (b) mechanical and thermal loads on the quartz cylinder in ABAQUS/CAE.
Energies 16 07400 g006
Figure 7. Loading on the FEA model of quartz cylinder in ABAQUS/CAE: (a) mechanical loads (see gold color for combustion pressure, red color for clamping pressure and blue color for atmospheric pressure loads), and (b) total thermal load.
Energies 16 07400 g007
Figure 8. Boundary conditions and loadings on the quartz piston top: (a) CAD model of the optical engine with quartz cylinder and quartz piston top, and (b) boundary conditions and mechanical and thermal loads on the quartz piston top in ABAQUS/CAE.
Energies 16 07400 g008
Figure 9. Temperature variations in the quartz cylinder for different thicknesses at steady-state condition: (a) for inner and outer surfaces along the axial length (bottom to top), and (b) at the top surface in the radial direction.
Energies 16 07400 g009
Figure 10. Temperature contours at the steady-state condition in the quartz cylinder at various thicknesses: (a) 8 mm, (b) 11 mm, (c) 14 mm and (d) 16 mm.
Energies 16 07400 g010
Figure 11. Temperature distributions in the quartz piston top at steady-state condition for different thicknesses: (a) on the circumference along the axial length from bottom (Z = 0 mm) to top, and (b) temperature contours for various thicknesses: (i) 7 mm, (ii) 8.5 mm with r and z axes’ cut view, (iii) 10 mm and (iv) 12 mm.
Energies 16 07400 g011
Figure 12. Combined stress levels along the axial length (bottom, Z = 0 mm, to top, Z = 92 mm) at the inner and outer surfaces of the quartz cylinder at steady-state condition.
Energies 16 07400 g012
Figure 13. Combined stress distributions at the steady-state condition in the quartz cylinder for various thicknesses: (a) 8 mm, (b) 11 mm, (c) 14 mm and (d) 16 mm.
Energies 16 07400 g013
Figure 14. Combined stresses at the steady-state condition in the quartz piston top: (a) on the circumference along the axial length (across the light grey arrow shown in (b)), and (b) contours at various thicknesses–(i) 7 mm, (ii) 8.5 mm, (iii) 10 mm and (iv) 12 mm.
Energies 16 07400 g014
Figure 15. Different stresses in the deformed quartz piston top with 8.5 mm thickness: (a) thermal stress, (b) mechanical stress, (c) combined stress with x and r axes cut view and (d) combined stress with x, r and z axes cut view.
Energies 16 07400 g015
Figure 16. Variation in the displacement (radially outwards) along the length (bottom to top) at the inner surface of the quartz cylinder for different thicknesses (i.e., 8 and 16 mm) at the steady-state condition.
Energies 16 07400 g016
Figure 17. Displacement distributions at the steady-state condition in the quartz cylinder with various thicknesses: (a) 8 mm, and (b) 16 mm.
Energies 16 07400 g017
Figure 18. Effect of different engine operating times: (a) transient maximum temperature in the quartz cylinder, and (b) transient maximum combined stress in the quartz cylinder.
Energies 16 07400 g018
Figure 19. Transient combined stress distributions in the quartz cylinder for different thicknesses.
Energies 16 07400 g019
Figure 20. Maximum temperatures in the quartz cylinder under different engine operating times.
Energies 16 07400 g020
Figure 21. Comparison of different stresses in the quartz cylinder for various thicknesses.
Energies 16 07400 g021
Figure 22. Effect of engine operating time on maximum combined stress and FOS for the quartz cylinder with various thicknesses: (a) maximum combined stress, and (b) factor of safety corresponding to combined stress.
Energies 16 07400 g022
Table 1. Properties of the quartz material used for coupled FEA [12].
PropertyValue
Ultimate tensile strength (MPa)50
Young’s modulus (MPa)70 × 103
Poisson’s ratio (−)0.16
Thermal expansion coefficient (/°C)0.6 × 10−6
Thermal conductivity (mW/mm−K)1.4
Density (ton/mm3)2.2 × 109
Melting point (K)1973
Table 2. Engine specifications and operating condition.
ParticularsDetails
Bore62 mm
Stroke66 mm
Displacement200 cm3
Compression ratio9.6:1
Length of the quartz cylinder92 mm
Diameter of the quartz piston top 50 mm
Engine speed and load3000 rpm and WOT
Fuel   flow   rate   ( m ˙ f ) 1.148 kg/h
Lower   heating   value   ( L H V )44 MJ/kg
Table 3. Maximum combined stress at different engine operating times for various thicknesses of the quartz cylinder.
Thickness (mm)Maximum Combined Stress (MPa)
at 600 sat 900 sat 1500 s
822.7822.7822.78
1118.7720.821.85
1416.8920.623.75
1615.9520.3324.66
Disclaimer/Publisher’s Note: The statements, opinions and data contained in all publications are solely those of the individual author(s) and contributor(s) and not of MDPI and/or the editor(s). MDPI and/or the editor(s) disclaim responsibility for any injury to people or property resulting from any ideas, methods, instructions or products referred to in the content.

