Abstract
Archimedes screws are an ancient pumping technology that has more recently found use as a technology for hydropower generation. Currently, the literature is lacking reliable data, performance predicting models, and design guidelines. Most performance models presented in the literature are theoretical or were developed and evaluated using laboratory-scale data. This paper presents novel experimental and numerical simulation data to the literature from screw generators with a wide range of sizes (laboratory to full-scale powerplant scale) and orientations. The data suggest that the components of power production (pressure-driven and viscous/friction) scale differently depending on system size, configuration, and operating conditions. So, for the robust validation of models and the development of reliable design guidance, data from a wide range of sizes and configurations are crucial. The paper presents data collected from laboratory experiments, field measurements from operating powerplants, and data from numerical simulations. The numerical simulations were evaluated for accuracy with experimental data, then used to collect performance data from a wide range of screw geometries and scales. The length-scale (diameter), number of blades, fill height of water, inclination angle, and surface roughness were all varied. The data gathered in these experiments were analyzed and used to develop back-of-the-envelope estimations for the effect of each parameter on overall system performance; the relationships are intended to serve as a useful reference for designers, though they should not be used in lieu of a design model. The length-scale and number of blades were related to power in a way that could be reasonably approximated with a constant value. The fill height, inclination angle, and surface roughness were related to power in a way that could be approximated reasonably with first-order polynomial fits. Altogether, this paper presents much-needed, novel data to the literature; the data are integral for future model development and evaluation.
1. Introduction
Archimedes screws are an ancient pumping technology that has recently found use in hydropower schemes. As a hydropower generator, their design is not optimized; this research focused on introducing novel data and insights of Archimedes screw generator performance to the literature, both of which are vital to improving Archimedes screw generator (ASG) design.
An Archimedes screw is made up of a helical array of blades wrapped around a central cylindrical tube. Archimedes screws are commonly inclined and held between an upper and lower bearing; they rotate within a fixed, open-topped, concentric trough. There is a small gap between the screw blades and the fixed trough to minimize impacts of friction loss and component wear. As the screw rotates, fluid and/or granular solids are trapped between its blades and the trough, forming a volume of media called a “bucket” [1]. As the screw rotates, buckets are translated up or down along the axis of rotation.
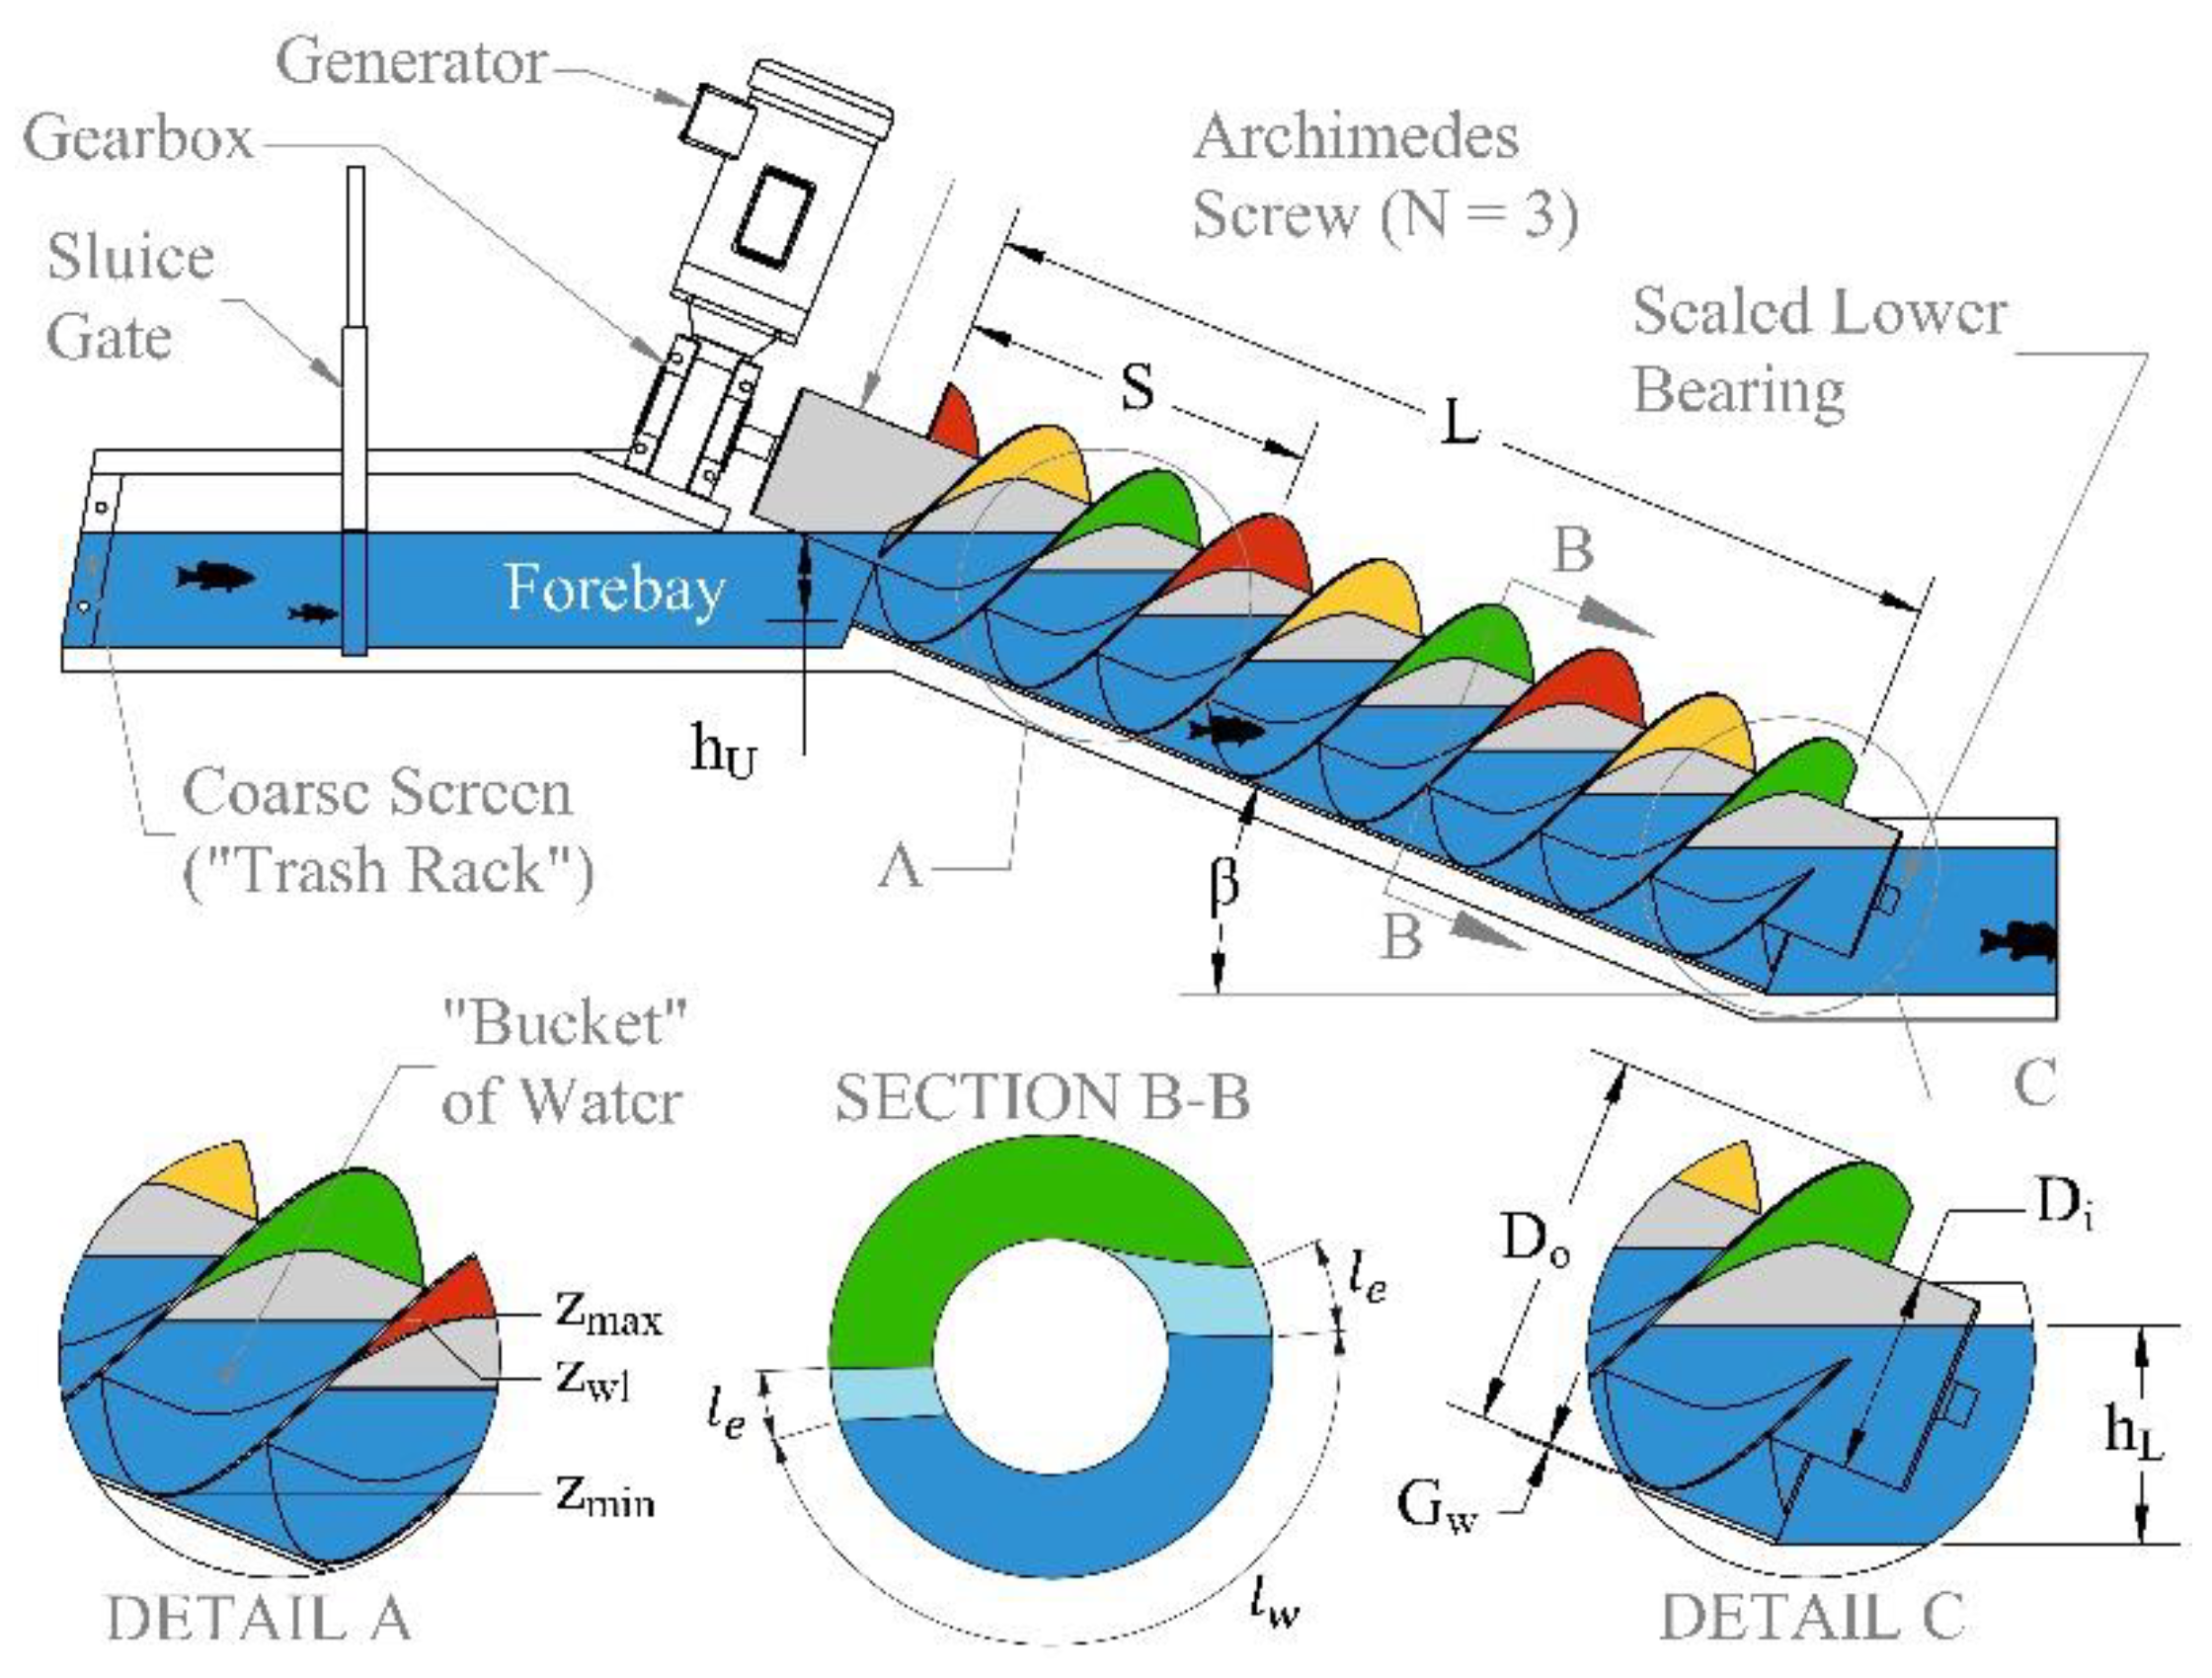
Historically, Archimedes screws have been used as a pumping device. Archimedes screw pumps (ASPs) have been used since antiquity (circa 7th century BCE [2]) to pump water for irrigation and slurry in mining operations. More recently, Archimedes screws have found use for run-of-river hydroelectric power generation [3]; in this implementation, the device is referred to as an Archimedes screw generator. The diagram in Figure 1 demonstrates the geometry and general layout of an ASG powerplant.

Figure 1.
General Archimedes screw generator powerplant layout. Detail A highlights the parameters often used to quantify bucket water levels. Section B highlights the parameters often used for gap leakage modeling. Detail C highlights the blade–trough gap and outlet water levels in higher resolution. Each blade surface is shown with a unique color. From [4].
Water flows into the Archimedes screw generator from an upper reservoir or inlet channel. Typically, ASGs are installed in diversion (run-of-river) hydropower schemes; a sluice gate is often used to control water flow at the inlet of the screw. As the screw rotates, water from the inlet channel fills the top bucket. Water pressure in the screw’s buckets is converted into a mechanical torque by the screw’s helical blades. Torque conversion is dominantly due to hydrostatic pressure; dynamic pressure seems to have proportionally much less impact [5]. The continuous torque and rotation speed are converted by an electric generator into on- or off-grid electrical energy. ASGs commonly operate with rotation speeds between 15 and 80 revolutions per minute [4]. Often, a gearbox is installed to convert the screw’s mechanical power to a more appropriate speed and torque for a standard electric generator.
ASGs may be installed with fixed- or variable-speed drive systems. Fixed-speed systems typically use induction generators due to their high efficiency and lower costs. Variable-speed systems are becoming more popular for ASG powerplants since they are able to accommodate greater seasonal variations in water levels and flow rates [6]; they are also able to accommodate hourly variations in flow in flashy water systems. The most efficient operating speed for ASGs depends on the flow and head available at the powerplant. So, variable-speed screw generators use electronic controls to set the screw’s rotation speed to an optimal level.
Screw generators are often described by their geometric and operational parameters. Geometrically, Archimedes screws are often described by their outer diameter (Do), inner diameter (Di), pitch (S), length (L), and number of blades (N); these parameters are required to fabricate or construct a screw. Designers require the inclination angle (β) and gap width (Gw) to be determined in order to install an Archimedes screw at a pump station or hydropower plant. Gap width is the variable that defines the distance between the blade tips and the fixed trough (shown in Figure 1).
The operating parameters used to describe screw generators are the conditions or settings that the screw is subjected to during operation. They include the upper water level (hU), lower water level (hL), rotation speed (ω), flow rate (Q), and bucket water level (zwl). Usually, a hydropower site has known upper water levels, lower water levels, and flow rate; however, gate systems may be used to control the upper water level and flow rate in the screw generator’s inlet channel. Generally, the rotation speed is a user-defined setting. The bucket water level is mostly dependent on the upper water level, flow rate, and rotation speed; so, it is not strictly a setting. Some powerplants use control systems that change operating parameters (e.g., rotation speed) to reach a desired bucket water level or optimize mechanical efficiency.
The bucket water level is an important parameter in describing ASG operation. When the screw buckets are underfilled, they generally perform inefficiently. When screw buckets are too full, water leaks over the top of the screw into the next successive bucket downstream along the pitch; this overflow leakage (Qo) wastes the energy conversion capacity. To allow for generalizations when describing screw fill levels, the bucket water level is usually described in dimensionless terms as the fill height ratio (f). The fill height ratio is a function of the bucket water level, the maximum bucket water level before overflow leakage occurs (zmax), and the minimum bucket water level (zmin) (see Detail A of Figure 1, and Equation (1)).
When the fill height ratio is f = 1, the bucket is at its fullest level before overflowing. If the fill height is f > 1, the screw bucket experiences overflow leakage. It is common for screw generators to operate with buckets at their fullest point (f = 1) or experiencing a small amount of overflow.
Archimedes screw generators operate with low hydraulic head and moderate flow rates. Under normal operating conditions, ASGs can operate at a river-to-wire efficiency of about 75% [6]; some well-designed installations purportedly operate at higher efficiencies [7,8]. Variable-speed systems extend the efficient range of operation for ASGs, particularly in waterways with a high flow rate and head variability. For context, the common ranges of some hydropower technologies are shown in Figure 2.
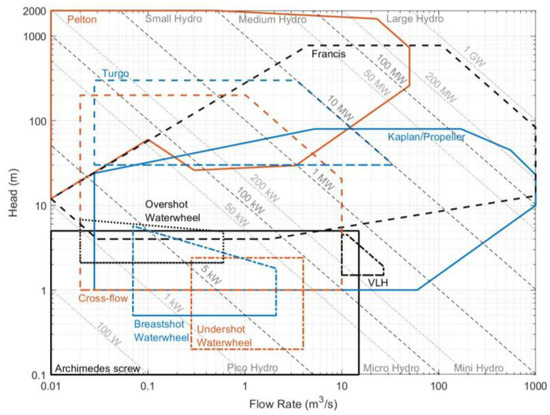
Figure 2.
Common operating ranges of various hydropower technologies. Data from various sources [9,10,11,12,13,14,15,16,17,18,19,20,21,22,23,24,25,26,27,28,29,30,31,32,33].
ASGs have a comparatively large operating envelope compared to other technologies of a similar operating envelope (Figure 2). In sites with proportionally low head and high flows, multiple, parallel screw generators may be installed. For example, a screw generator powerplant near Ferrara, Italy, utilizes two large screws that produce up to 121 kW of on-grid electricity. The two screws operate with different speed controls: one screw is fixed-speed, and the other is variable-speed to adapt to the site’s water system more effectively. The two screws are geometrically identical (Do = 3.6 m) and have a designed flow capacity of Q = 5.5 m3/s each. The site operates with river-to-wire efficiencies between 70% and 88% [34,35,36,37].
The manufacturing and installation costs of a screw generator system are comparatively low, making the technology viable for sustainable electricity generation in developing regions [38]. The simple, robust design of an Archimedes screw makes it comparatively less expensive to manufacture than most modern hydropower technologies. Modern screws have helical metal blades that are welded to a central cylindrical tube. High-precision fabrication of a screw is very complex, but more rudimentary screws have been built out of other materials. Archimedes screws have been constructed since circa 700 CE [2], so it is possible to manufacture a successful basic screw generator locally in rural, off-grid regions in the developing world. To save on civil works costs, ASGs are often retrofit to existing flood control infrastructure or old mill sites.
The maintenance and operating costs of ASGs are relatively low [4] compared to other hydropower technologies within a similar operating envelope (Figure 2). Higher-frequency maintenance includes fluid level checks, trash rack cleaning, and replacement of bearing grease cartridges (if equipped). Some powerplants have exhibited substantial algae growth that was reportedly responsible for river-to-wire efficiency decreases of 10% [8] and 11% [39]. So, some operators have implemented a seasonal cleaning schedule to successfully mitigate the efficiency losses [39]. Alternatively, some ASG powerplants have covered screws with an air seal at their inlets and outlets to prevent algae growth, icing, and noise emissions. A covered screw powerplant near Waterford (Ontario), Canada, has operated reliably in temperatures below −30 °C. The moderately sized (Do = 1.4 m), fixed-speed (40.7 rev/min) screw has a designed discharge capacity of Q = 0.54 m3/s and usually operates with river-to-wire efficiencies of about 60% [40].
Screw generators are widely considered to be an “eco-friendly” hydropower technology since they usually operate in run-of-river (diversion) schemes and are generally regarded to be “fish friendly”. The simple, robust design of ASG systems allows for coarser intake screens that allow sediment, debris, nutrients, and aquatic fauna (i.e., fish [41,42,43,44,45,46,47], eels [45,46,47], etc.) to pass through the screw safely during operation. One study has suggested that mortality rates in fish and eels could be more substantial and species-dependent than previous research had documented; however, it was not clear where trauma originated, and it does not appear that common injury reduction design practices were followed [48]. Common screw generator design guidelines have been defined to mitigate harm during fish and eel passage through operating ASG powerplants [49].
The available literature for Archimedes screw pumps and generators lacks detailed design and performance documentation. Since Archimedes screws have been designed since antiquity, it is suggested that screws are mostly designed by experience. To improve screw generator performance, accurate performance prediction models are a necessity. An accurate performance prediction model can be used to develop optimization software for site-specific Archimedes screw generator design.
The literature that is available for ASP design presents heuristic and empirical models, but it does not document the experiments used for model development [50,51,52]. For ASGs, current performance models [53,54,55,56,57,58] have not been robustly validated against large-scale (Do > 2 m) performance data. Most of the current modeling techniques were developed from data gathered from small-scale, laboratory experiments (Do = 0.15 to 0.38 m); most real-world screw generator installations are much larger. It is common for screw generators to have outer diameters of Do = 2 m [59]; the largest operating ASG installation (at time of writing) has an outer diameter of Do = 5 m [60]. Though these differences in length-scale may appear to be small, it is crucial to consider the effects of scaling on screw generator performance.
Consider how the outer diameter (the primary length-scale) of an Archimedes screw effects the mechanical power (Ps) and frictional power loss (PL,f) during operation. Mechanical power was observed to almost exclusively be a function of the static pressure in the screw’s buckets [5]. So, the mechanical power is due to the water availability (flow rate, m3/s) and the head drop, and thusly scales to the fourth order of the length-scale (i.e., ). Since frictional power loss acts on the surface area of the screw and trough, it can be argued that it scales to the second order of the length-scale (i.e., ). This suggests that, as the screw increases in size, its power production capacity will increase proportionally to the frictional power loss. In other words, it is hypothesized that the fluid mechanics in an ASG changes with respect to length-scale, such that larger-scale screws perform differently than small-scale screws.
With consideration of the above hypothesis, current ASG modeling techniques developed from laboratory-scale data may not properly predict performance in larger-scale systems. Therefore, there is a critical need for larger-scale screw generator performance data to aide in model evaluation and development.
This study sought to introduce much-needed data to the literature. Data were gathered experimentally from seven different scale-sized screws in the laboratory (Do = 0.148 m, 0.316 m, and 0.381 m) and via field studies with industrial collaborators (Do = 1.39 m, 2.5 m, 2.9 m, and 3.6 m). For performance data to be useful for modeling and evaluation, they are required to have at least the flow rate (Q), rotation speed (ω), upper (hU) and lower water levels (hL), and mechanical torque (T) about the screw rotation axis. When data sharing with powerplants was possible, it was discovered that most powerplants only tracked some of the required parameters. Generally, it was very difficult to measure the mechanical torque in an operating screw powerplant. The torque could be estimated from electrical power readings once component efficiencies (i.e., generator, gearbox, bearings, etc.) were assumed. The assumptions added some uncertainty, but it made the data from a few powerplants usable.
Since it was very difficult to find powerplants that measured all the necessary modeling parameters, the seven different screws were used to evaluate the accuracy of a computational fluid dynamics (CFD) model across the wide range of scale sizes. The CFD model was deemed to be an accurate approximation of screw generator performance and was used to simulate ASG systems of any desirable size and configuration. Simulations were conducted to measure the performance effects of systematic variations in diameter, number of screw blades, bucket fill height, inclination angle, and surface roughness.
This paper discusses the methods used in laboratory experimentation, field studies, and numerical simulations, the results of which will be presented and discussed. For designers, some back-of-the-envelope relationships are presented as estimation tools; however, these should only be used for estimation and not in lieu of a full performance prediction model.
2. Materials and Methods
Data were gathered experimentally from 7 different scale-sized screws via laboratory experimentation and field studies. Table 1 shows the dimensions, operating conditions (rotation speed and flow rate), and performance (measured mechanical power) of each screw. These seven datapoints were used for CFD model evaluation.

Table 1.
Geometry, operating conditions, and mechanical power production of three laboratory screws and four operating powerplants.
This section will outline the laboratory experiment and field study methodology used to gather the data shown in Table 1.
2.1. Laboratory Experiments
Experiments were conducted in the Archimedes Screw Laboratory at the University of Guelph. The laboratory has an apparatus that recirculates water through a series of basins to simulate an Archimedes screw generator powerplant (Figure 3).
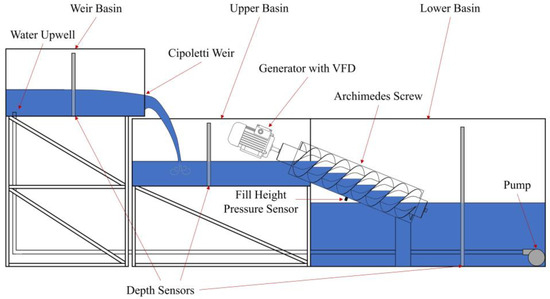
Figure 3.
Layout of the apparatus in the Archimedes Screw Laboratory.
The laboratory apparatus consists of three basins. During an experiment, a variable-speed pump was used to move water from the Lower Basin through a return pipe to the Weir Basin. The variable-speed pump was used to set a desired flow rate through the system. The return pipe housed an inline turbine flow meter (Omega, FTB-740) was used to measure system flow. Water upwelled in the Weir Basin through a perforated tube in order to lessen the development of secondary flows. The water passed from the Weir Basin, through a Cipoletti weir, and spilled into the Upper Basin. A depth sensor (Keller, Series 26 Y) was used in a stilling well to measure the height of water over the Cipoletti weir to provide a manual, redundant verification of the flow rate. From the Upper Basin, water filled the Archimedes screw generator buckets and passed through the screw, spilling into the Lower Basin to complete the flow cycle. Water levels were measured in the Upper and Lower Basin via depth sensors (Keller, Series 26 Y) placed in stilling wells. Rulers were mounted to all three basins to provide manual, redundant verification of water depth.
A motor with a variable frequency drive (VFD) was mounted to the Archimedes screw and to the apparatus frame via a moment arm. A load cell (Omega, LC703-25) was placed between the motor’s moment arm and the apparatus frame to measure mechanical torque in the system. The VFD allowed the user to change the screw rotation speed. A magnet was placed on the screw’s body, and a magnetic reed switch (RC-33) was used to measure the rotation speed. An optical tachometer (Omega, HHT12) was used to manually verify the rotation speed. The screw fixed trough was tapped, and a pressure transducer (Omega, PX309) was used to measure the water level in the screw buckets [58].
To gather a data point, a desired flow rate was set with the recirculating pump, and the VFD was used to set the screw rotation speed. Whenever flow rate or rotation speed were adjusted, the water levels in the system would slowly reach different levels. So, the system was left to adjust to a new equilibrium state (when all basin water levels stabilized) for two minutes. After the system equilibrated, data were sampled from the sensors for one minute. During the one-minute sampling time, the manual readings of basin water levels and rotation speed were gathered. Afterwards, the data were time-averaged for the one-minute period and added as a single datapoint to the full experimental database. Altogether, there are more than 1600 unique points in the laboratory experiment database (at time of writing). More details about Archimedes Screw Laboratory experiments can be found in the literature [38,61,62].
2.2. Field Studies
Powerplants in Waterford (Greenbug Energy Inc., Delhi, ON, Canada), Buckfast (Buckfast Abbey, United Kingdom), Ruswarp (Whitby Esk Energy Ltd., Yorkshire, UK), and Ferrara (HydroSmart Srl., Ferrara, Italy) were visited by the authors. When required, the powerplants were instrumented to measure performance and operating conditions. After a site survey, data were collected from the powerplants and added to the experimental database. Figure 4 shows the four active ASG powerplants that were visited in this study.
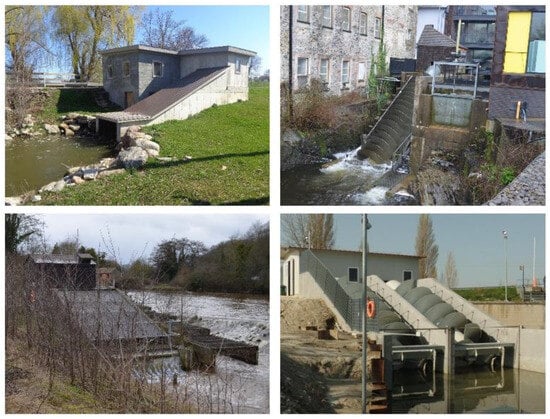
Figure 4.
Archimedes screw generator powerplants in Waterford (top left), Buckfast (top right), Ruswarp (bottom left), and Ferrara (bottom right).
Though most powerplants measure and record performance data on-site, they do not often measure flow rate or mechanical torque since both measurements are difficult to attain. So, most on-site data are not useful for model evaluation and development as-is. As mentioned before, torque values can be calculated from electrical power readings if a few assumptions are made for component efficiencies. Flow rate data were more difficult to collect. Instrumentation was brought to each powerplant to measure the flow rate.
To measure the flow rate at the powerplants, water velocity was measured along a grid pattern within the screw inlet channel. Water velocity was measured and recorded with a handheld FlowTracker2 acoustic Doppler velocimeter (Sontek, San Diego, CA, USA). This method was used for the Buckfast and Ruswarp powerplants. Flow measurement details for the Waterford screw can be found in the literature [38]. The powerplant in Ferrara is one of the few ASG powerplants that actively measures and records flow rate data. Flow rate is estimated based on the height of water passing through a calibrated inlet channel; details can be found in the literature [35,36,37].
At each powerplant, water levels and powerplant layout were verified with a survey pole and manual transit. The rotation speed of the screw was measured with a handheld tachometer and verified optically via video recording. Flow rate was then measured, and power readings were gathered. Along with the operating data, equipment part numbers were recorded to find more accurate efficiency estimates based on manufacturer rating curves. The Buckfast and Ruswarp powerplants both had intake sluice gates at the upper end of their inlet channels that allowed for variations in the inlet water level and flow rates. Both powerplants were tested across a small range of achievable flow rates. It took about 30 min for each powerplant to reach equilibrium states after the gates were adjusted.
3. Numerical Model
A transient, three-dimensional, dynamic model of an Archimedes screw generator powerplant was developed with the computational fluid dynamic (CFD) software OpenFOAM (Version 4.0, The OpenFOAM Foundation, 2016). The simulation modeled the two-phase immiscible flow of water and air through an ASG. The flow is governed by the continuity equation and the RANS equations with a Boussinesq eddy viscosity assumption:
where U is velocity, P is pressure, ν is kinematic viscosity, and νt is the eddy viscosity.
The Volume of Fluid (VoF) method is implemented to define the phase fraction (α) of the simulated two-phase immiscible flow. The method computes the fluid properties density (ρ) and dynamic viscosity (µ) within a cell as:
The simulation used a dynamic mesh to simulate screw rotation; arbitrary mesh interfaces (AMIs) were defined at the inlet and outlet of the screw generator to couple the dynamic portion of the mesh to the static upper and lower basins. To match experimental and real-world ASG design, a small gap was defined between the blades and the fixed trough; leakage through the gap was of interest as a simulation output, so modeling the gap with an appropriate mesh size was important. The mesh was refined in the blade–trough gap region to improve model performance when simulating gap leakage. The mesh and simulation boundaries are shown in Figure 5.
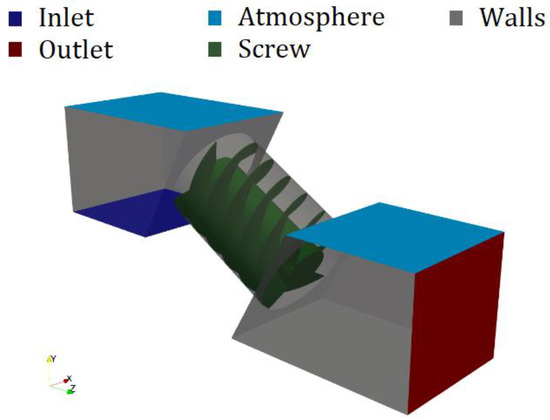
Figure 5.
Archimedes screw generator simulation mesh with color-coded boundaries.
Mesh generation was conducted with OpenFOAM’s blockMesh to generate a domain with roughly 3.65 million cells. The snappyHexMesh utility and a 3D model (STL file) was used to model the complex, helical geometry of the Archimedes screw; this utility usually yielded a mesh with about 3.69 million cells, and y+ values above 30 or below 2, which satisfied the requirements for Menter’s Shear Stress Transport turbulence model (k-ω SST) [63].
Simulation time was discretized with an Euler scheme, and an adaptive timestep was used to satisfy the Courant–Friedrich–Lewy (CFL) conditions. Simulation timesteps were typically on the order of 10−4 s. Laplacian and gradient terms were discretized with a second-order central differencing scheme, and the divergence of the velocity term was discretized with a second-order upwind scheme. The PIMPLE algorithm was implemented for the simulation; it combines the semi-implicit method for pressure-linked equations (SIMPLE) and pressure-implicit split-operator (PISO) algorithms and can be used for transient systems. Menter’s Shear Stress Transport model (k-ω SST) was used for turbulence modeling; it was selected due to the relative importance of mesh size and since it has been widely used in hydro-turbine modeling [64].
A flow inlet was specified at the upper basin using OpenFOAM’s flowRateInletVelocity function to supply a uniform flow rate. The bottom face of the basin was selected as the flow inlet since upwelling reduced the introduction of secondary flows. The outlet boundary condition was set to maintain a desired lower water level by defining a fixed outlet pressure condition (OpenFOAM’s totalPressure function). To match an experimental datapoint, the flow inlet, rotation speed, and lower water level were set. Further details regarding the numerical simulation may be found in the literature [65].
Simulations were set to run until they converged at a regularly oscillating torque value; this was termed the “quasi-steady-state condition”. Torque was extracted from the simulation during run-time using OpenFOAM’s forces utility. The utility generates force and moment data for surfaces using pressure results to compute forces due to normal pressure contributions (Fp):
and tangential viscous force contributions (Fv):
where ρ is the density, sf,i is the face area vector, P is the pressure, µ is the dynamic viscosity, and Rdev is the deviatoric stress tensor. The force values are then taken as moments about the axis of rotation to yield torque values that act to aid in power generation, and as a power loss due to frictional effects.
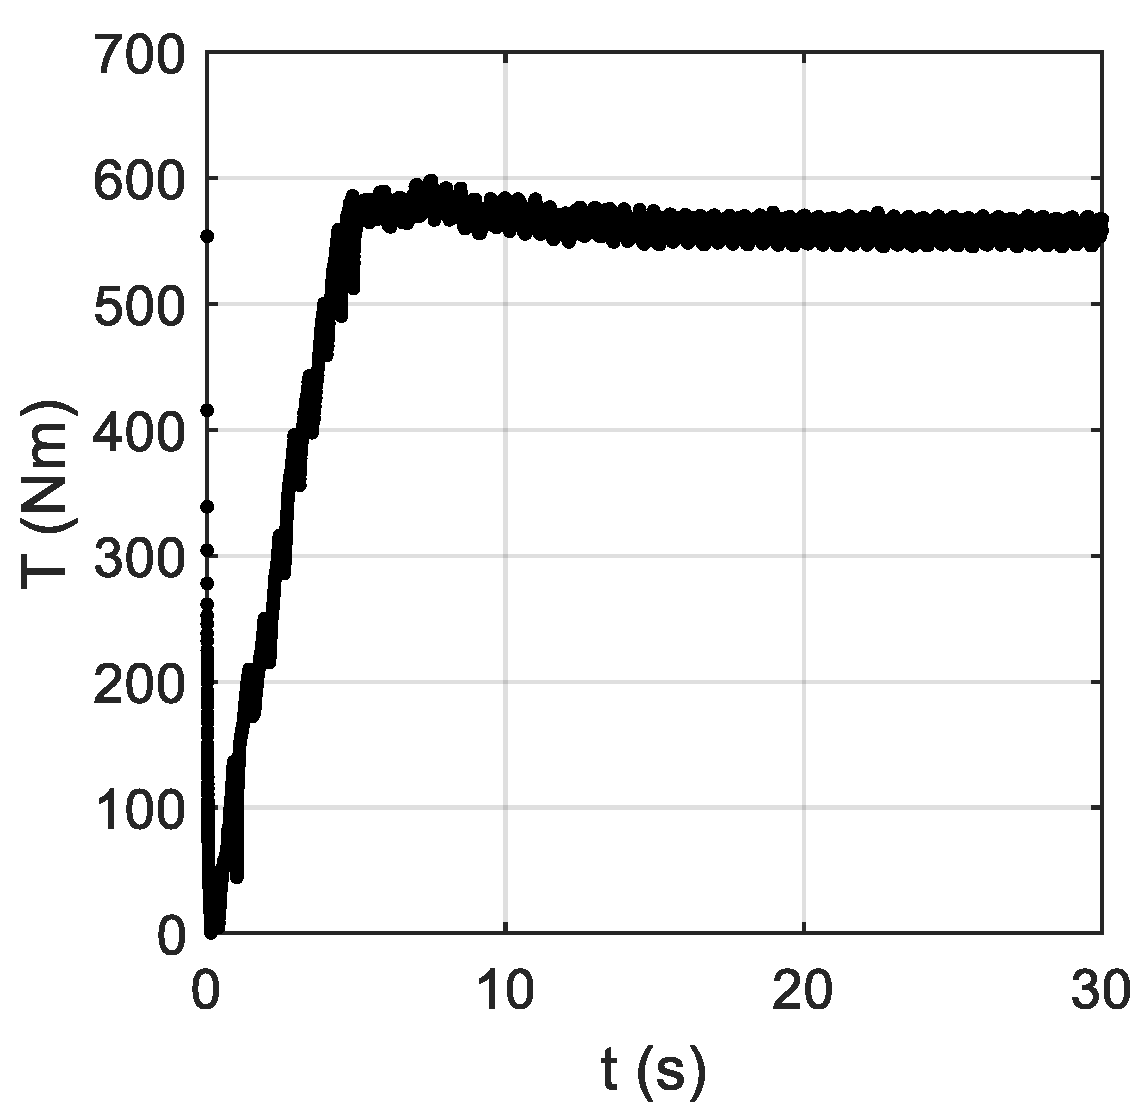
The presence of torque oscillations is expected in Archimedes screw generators; they are due to the periodic filling and emptying of screw buckets during operation. Figure 6 shows an example of a converged simulation. The simulation was considered to have converged after roughly 18 s.
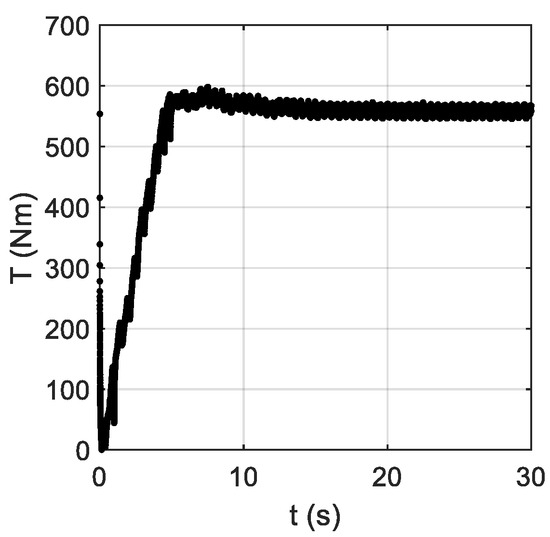
Figure 6.
Torque output of Simulation 4 (details in Table 2) with respect to simulation time.
Another indicator that quasi-steady-state conditions were reached was the flow rate; when the flow rate into the system was equal to the flow rate out of the system, the equilibrium condition was met.
3.1. Model Evaluation
The numerical simulations were evaluated with experimental data collected in the laboratory and during the field experiments. Altogether, seven simulations were conducted that matched the screw geometries and operating conditions shown in Table 1. The results of the experiments and CFD simulations were compared to evaluate model accuracy. Figure 7 demonstrates the comparison between the mechanical power production values of the CFD and experiments.
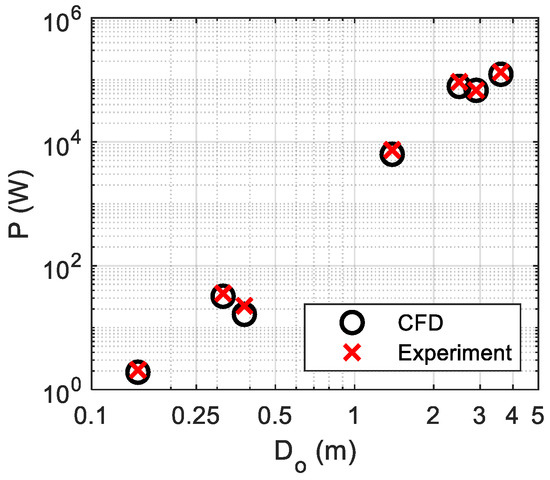
Figure 7.
Evaluation of CFD results using experimental results for mechanical power from Table 1. Experimental results are discussed in [5]).
The results of the simulations seem to agree reasonably well with the experimental data. The CFD simulation represents an idealized screw generator. The magnitude of the power differences between the numerical simulations and experimental data can be explained by the presence of bearings, system components, and minor imperfections during fabrication in the real-world systems. So, the authors suggest that the CFD model presented in this paper is an accurate approximation of Archimedes screw generator systems. Since the CFD model was evaluated against experimental data from screws with a wide range of sizes (from Do = 0.15 m to 3.6 m), it is suggested that the model can be used to simulate any realistic geometry or configuration of screw generator. The CFD model is capable of introducing a wide range of useful data to the literature to aid in physical model development and evaluation.
3.2. Model Evaluation
The study presented in this paper observed the effects of varying the outer diameter, number of blades, fill height, inclination angle, and surface roughness on screw performance. Specifically, screw performance was evaluated with power production, and the components of power production (power production due to pressure and hydraulic power loss). The outer diameter simulations were conducted with screws that were geometrically identical but scaled in size, so they could be considered variations in length-scale. The geometry and operating conditions of the length-scale (outer diameter) simulations are shown in Table 2.
Table 2.
Geometry and operating conditions of the length-scale simulation set. The length-scale set varied outer diameter while maintaining all screw proportions.
The length-scale simulations were conducted at near-optimal conditions; the bucket fill heights were all at f = 1, so overflow leakage loss was not present. As mentioned, the length-scale simulations maintained their proportionality but varied in size. As such, the simulation set had constant design ratios as follows: diameter ratio Di/Do = 0.532, length ratio L/S = 3.84, and pitch ratio S/Do = 1.00.
By experience, Simulation 1, 2, and 3 were classified as “laboratory-scale” screws, and Simulations 4 through 7 represented larger, “real-world scale” screws. So, Simulation 4 was used to simulate the effects of varying the number of blades in an ASG. This screw geometry was selected since it was the smallest real-world screw, so it was able to simulate the fluid dynamics of a real-world scale screw in the most computationally inexpensive way. To compare the effects of a changing number of screw blades, Simulation 4 (Table 2) was used, and only the number of blades (N) was altered to test the performance of a screw with N = 3, 4, and 5 blades.
Fill height variation simulations were conducted by varying the flow rate of Simulation 5 (Table 2) to achieve values of f = 0.5 to 1.3 by increments of 0.1. Simulation 5 was used for other similar studies, so it was also used to investigate variations in fill height (instead of Simulation 4).
The inclination angle of Simulation 4 was varied from β = 10° to 40° by increments of 5° to evaluate its effects on performance. Since all other dimensions of the screw were maintained (Table 2), specifically the length, the overall head changed with the inclination angle. The head change was not an issue in analysis since all data were made dimensionless; however, it is important to make note of this phenomenon.
Finally, a set of simulations were run that varied the surface roughness of Simulation 5 (Table 2). Six different surface roughness values were selected to represent a wide range of surfaces. The following surfaces were used in the simulations, and their Gauckler–Manning coefficient (n) and roughness height (z0) values [66] are given in brackets: smooth walls (n = 0.000 s/m1/3, z0 = 0.0000 m), glass (n = 0.010 s/m1/3, z0 = 0.0003 m), smooth steel (n = 0.012 s/m1/3, z0 = 0.0010 m), painted steel (n = 0.014 s/m1/3, z0 = 0.0024 m), steel with algal growth (n = 0.018 s/m1/3, z0 = 0.0114 m), and corrugated steel (n = 0.022 s/m1/3, z0 = 0.0370 m). Corrugated steel was the roughest material that could reach convergence during simulation.
4. Results
Experimental data were used to evaluate the accuracy of the CFD model in this study. This section will present the results of the CFD simulation sets discussed above. The results will be presented in six sub-sections; they include observations of performance effects caused by changing length-scale (Section 4.1), number of blades (Section 4.2), bucket fill height (Section 4.3), inclination angle (Section 4.4), and surface roughness (Section 4.5), as well as a general performance estimate (Section 4.6).
Throughout the analysis, the mechanical torque (T) of the screw was used as the variable of interest rather than the mechanical power of the screw (Ps). Mechanical power is the product of the mechanical torque and rotation speed (ω) of the screw. In a previous study, it was found that mechanical power was almost entirely due to the hydrostatic pressure of water in the screw during operation [5]. So, it can be reasonably assumed that screw torque is generally due to the bucket water level, and that it is largely independent of rotation speed (though rotation speed changes do impact frictional effects on performance). Analyzing the torque allows for more direct comparisons between ASGs with different flow rates and rotation speeds. Torque was analyzed as two components and the resultant mechanical torque of the screw; the components included torque due to fluid pressure (positive-power-producing torque) and torque due to frictional effects (power-loss-inducing torque).
To broaden the analysis further, torque was recast as “bucket torque” (the torque of one, single screw bucket) to eliminate the effect of screw length. Using the bucket torque, proportionally long and short screws could be directly compared for their performance. Bucket torque was calculated as a function of the average number of buckets of the screw, which is a function of the length (L), number of blades (N), and screw pitch (S).
The bucket torque was then calculated as:
The bucket torque was then made dimensionless; a similarity study and a dimensional analysis were conducted to find the most appropriate function. The dimensionless bucket torque (τb) was calculated by dividing the bucket torque by the product of the density of water (ρ), gravitational acceleration (g), the local head drop between each screw bucket (hb), and the outer diameter (length-scale).
The term ρghb represents the hydrostatic pressure difference between adjacent buckets. The third-order length-scale term (Do3) effectively represents how screw volume scales with the length-scale. So, the denominator term is dimensionally homogenous and of a similar form to the potential energy of a screw bucket. Since the base units of torque are the same as energy (i.e., Nm = J = kg m2/s2), the dimensionless bucket torque essentially relates the mechanical energy to the potential energy in each bucket.
The following sub-sections will present the results as well as a back-of-the-envelope relationship for each phenomenon. Individual fits will be presented for the phenomena, then the resultant fit will be determined in the final section using the principal of linear superposition.
4.1. Effect of Length-Scale on Performance (Diametral Scaling)
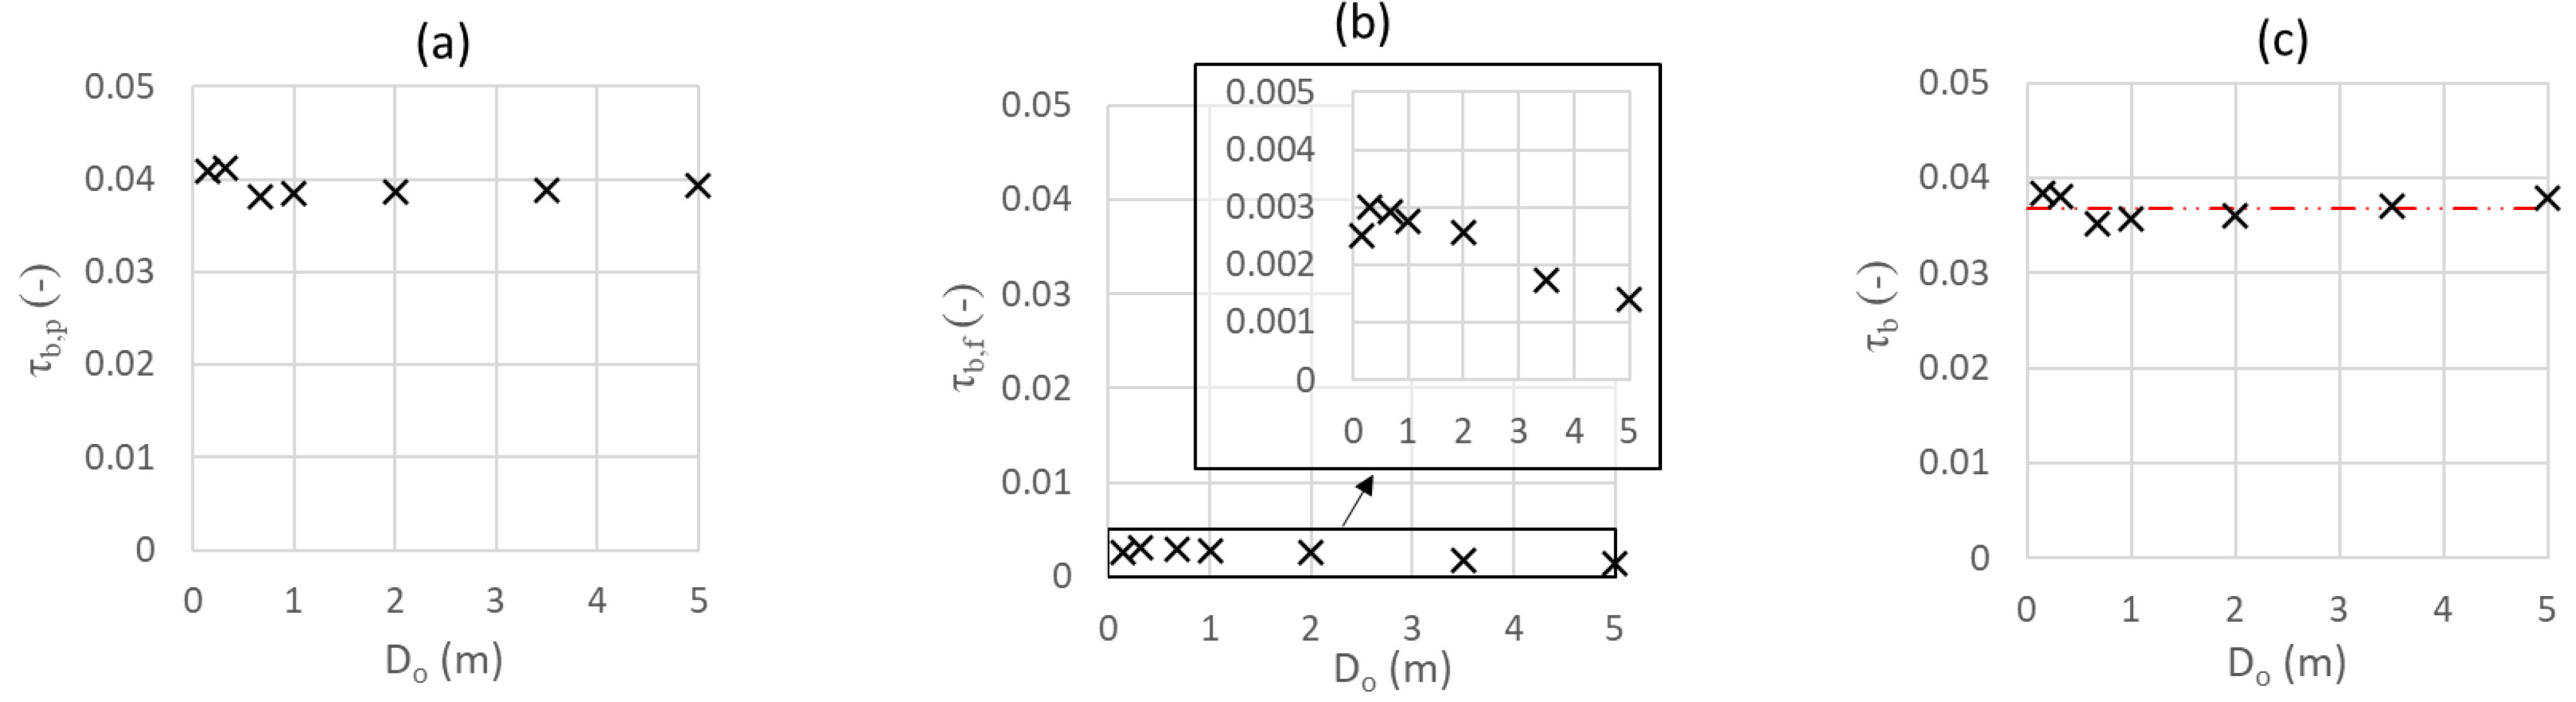
Figure 8 demonstrates the effect of length-scale on screw generator performance. The plots in Figure 8 represent the dimensionless bucket torque components due to hydrostatic pressure (τb,p; ideal power production) in plot (a) and viscous effects (τb,f; frictional power loss) in plot (b). Sub-plot (c) shows the resultant dimensionless bucket torque (τb); this is the difference between the two components and represents the total dimensionless mechanical torque converted by the screw for power conversion in the electric generator. Subsequent sections of this paper will use the same plot format for consistency.
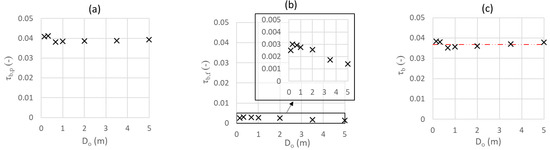
Figure 8.
The effect of outer diameter (length-scale) on the pressure component (a), viscous component (b), and resultant dimensionless bucket torque (c) in an operating ASG for the geometries shown in Table 2. Sub-plot (b) shows a magnified representation of the results to better visualize trends. Sub-plot (c) has a red dashed trendline that represents the average dimensionless bucket torque for this dataset.
It was observed that resultant power production did not proportionally vary substantially as the diameter increased, particularly in the “real-world scale” screws (screws 4 to 7; i.e., Do = 1 m, 2 m, 3.5 m, 5 m). Recall that, in this simulation set, the fill heights, inclination angles, number of blades, surface roughness, and design ratios (diameter ratio, length ratio, and pitch ratio) were all kept constant (Table 2). Considering Equation 10, and that the local head drop between buckets (hb) is a geometric function of the outer diameter, this suggests that power production scales to the fourth order of length-scale when operating conditions and geometry are proportionally similar.
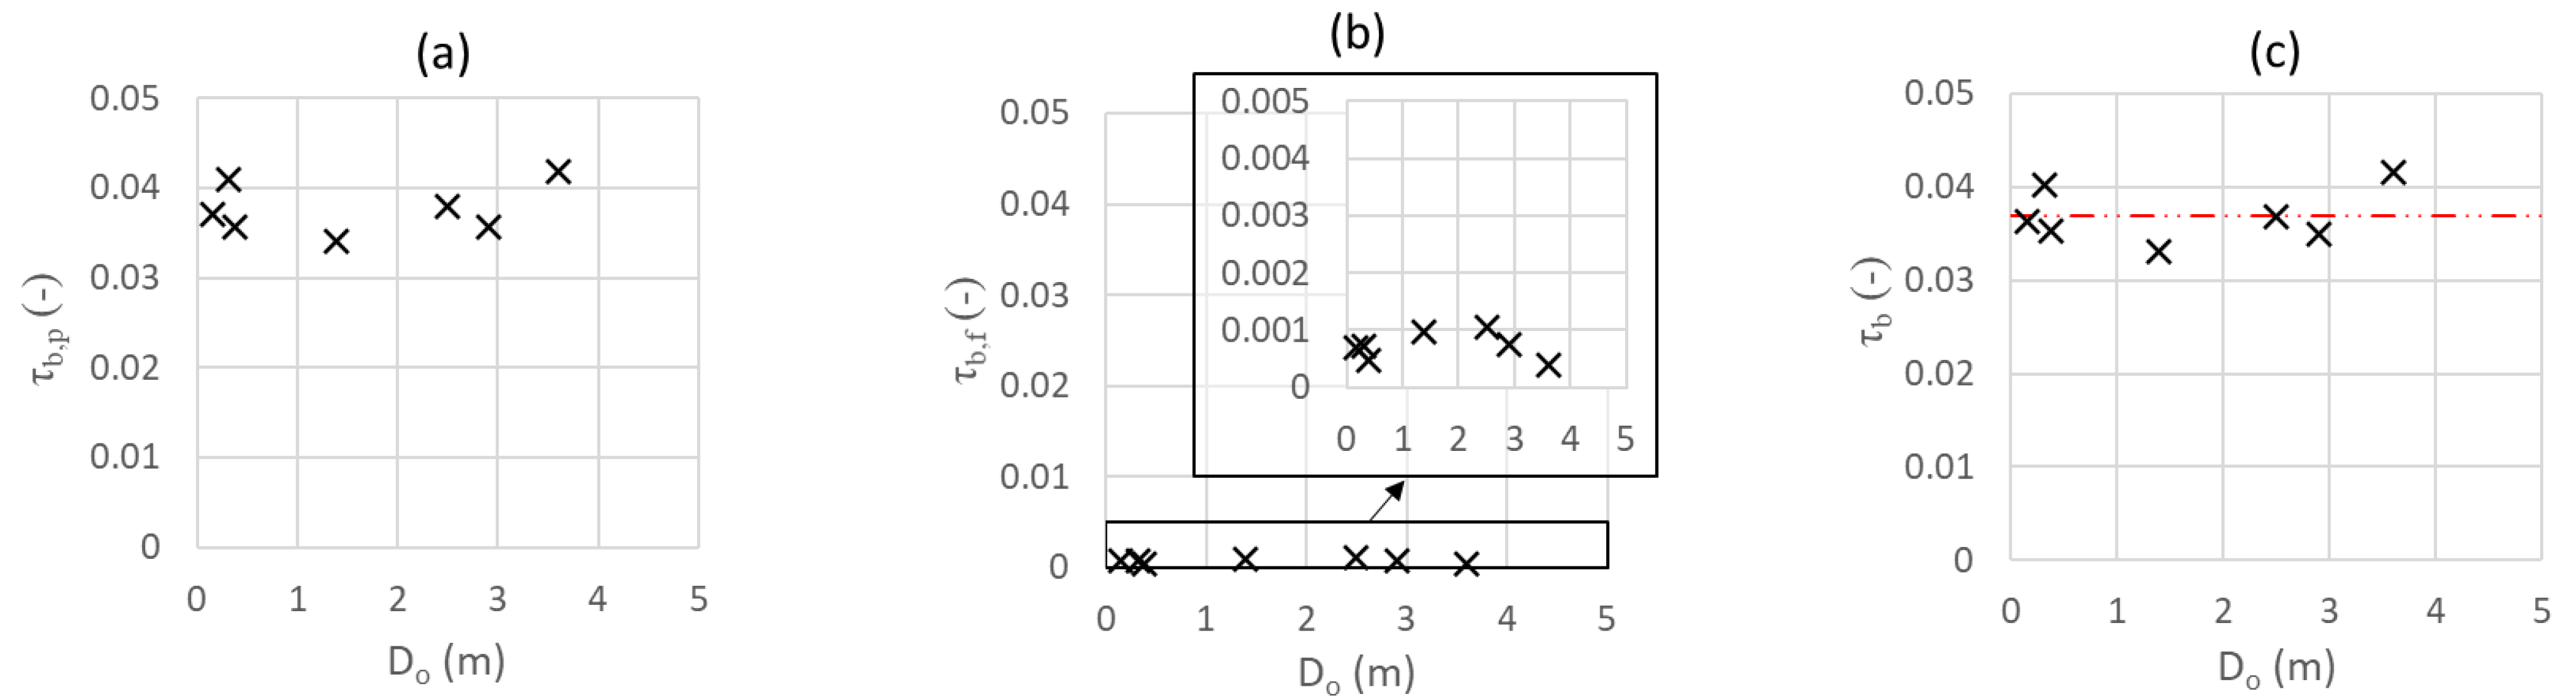
To extend the analysis, the simulations used in the model evaluation were also compared (Figure 9). Each of the experimental screws varied in geometry and operating conditions. So, comparison of the simulated screw counterparts allowed for a more robust investigation of length-scaling effects when conditions and screw geometries were not proportionally consistent.

Figure 9.
The effect of outer diameter (length-scale) on the pressure component (a), viscous component (b), and resultant dimensionless bucket torque (c) in an operating ASG for the geometries shown in Table 1. Sub-plot (b) shows a magnified representation of the results to better visualize trends. Sub-plot (c) has a red dashed trendline that represents the average dimensionless bucket torque for this dataset.
From Figure 8 and Figure 9, it can be observed that the dimensionless bucket torque was fairly consistent as the system length-scale increased. There was objectively more variance in the simulation set shown in Figure 9; however, the authors suggest that the variance was due to variations in all the design ratios (diameter, length, and pitch ratios), as well as bucket fill height, inclination angle, and number of blades (see Table 1). With the variety of conditions exhibited in the simulation set in Figure 9, it was notable that the data had a relatively close fit to the trendline (Figure 9c) at all.
The dimensionless bucket torque due to viscous effects (frictional power loss component) seemed to generally decrease as the length-scale increased (Fig. 8b). However, it should be noted that frictional power loss should also have increased with rotation speed, and that rotation speed was not kept constant in either simulation set. In any case, as the positive power production component of torque remained relatively consistent with increasing length-scale, the frictional power loss component tended to decrease and was proportionally very small.
A relationship was developed based on the trend shown for the resultant bucket torque data of Figure 8:
In dimensional terms:
As the total screw torque:
The maximum errors between the relationship and results shown in Figure 8c and Figure 9c were around 4% and 13%, respectively. The authors suggest the relationship could be used to estimate the torque conversion capabilities of an ASG powerplant, but that the relationship should only be used for reference and not for design purposes.
It must be noted that the expressions above were developed from simulations that had design values as follows: Do = 0.15 to 5 m, β = 22° to 26°, f = 0.85 to 1.15, N = 3 or 4, z0 = 0.0024 m, Di/Do = 0.41 to 0.55, S/Do = 1 to 1.2, and L/S = 1.62 to 4.22. As design parameters become more extreme, the effects of each parameter may impact performance more substantially and increase the error of the relationships. Next, each parameter will be varied to observe their impact on ASG performance.
4.2. Effect of Number of Blades on Performance
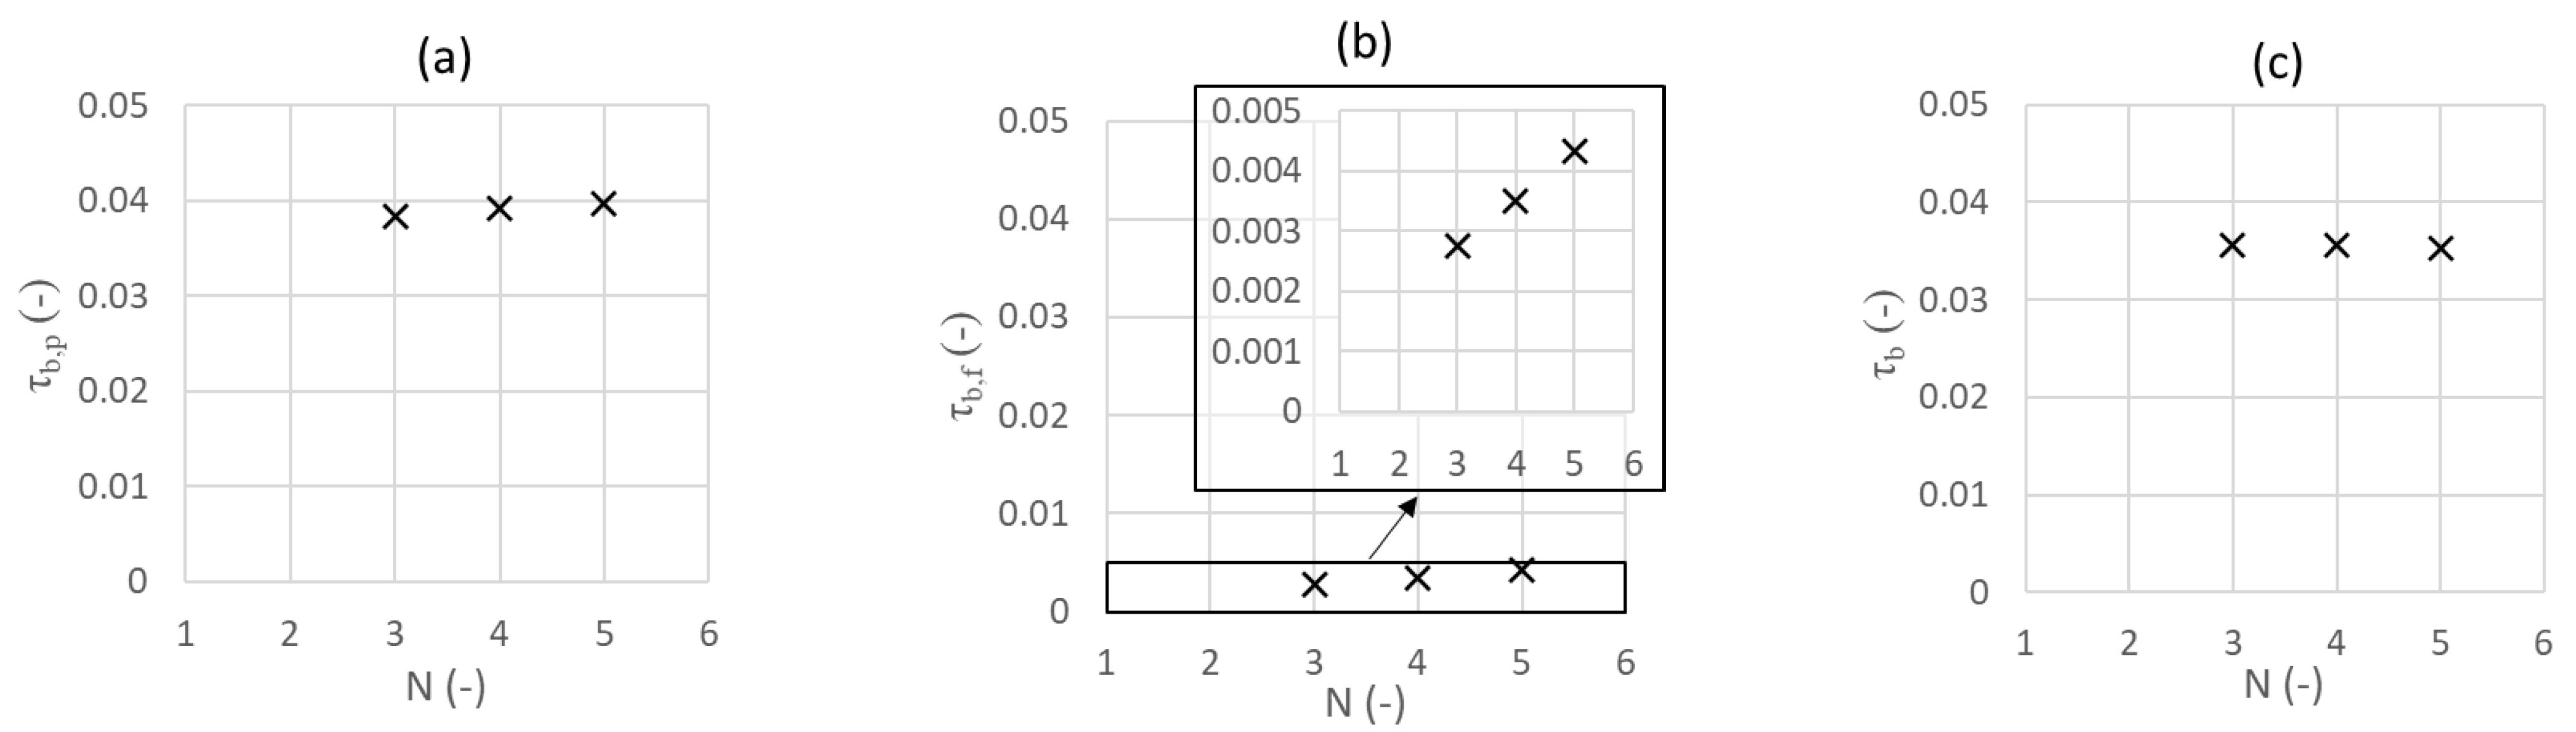
As discussed in Section 3.2, Simulation 4 (Table 2) was run with N = 3, 4, and 5 blades. The results of this simulation set are shown in Figure 10.
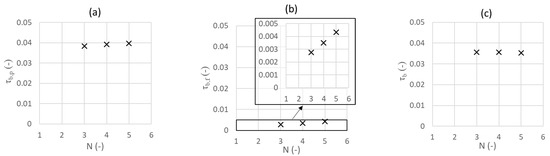
Figure 10.
The effect of the number of screw blades on the pressure component (a), viscous component (b), and resultant dimensionless bucket torque (c) in an operating ASG for the Simulation 4 geometry. Sub-plot (b) shows a magnified representation of the results to better visualize trends.
As can be observed in Figure 10a, it was found that that increasing the number of blades corresponded to an increase in the positive power production component capacity of ASGs. This effect is due to the screw’s ability to hold a higher volume of water with the addition of blades when the bucket fill height ratio remains constant. However, an increase in frictional power loss was observed with the addition of blades (Figure 10b). The addition of blades increased the overall wetted surface area of the screw generator, causing an increase in frictional power loss. Altogether, the resultant torque (Figure 10c) seemed to be relatively constant for the simulation set, suggesting that the addition of blades has a proportionally minimal impact on overall power production.
In this simulation set, the screw with N = 3 blades would be the most desirable to implement at a powerplant since it would cost the least to manufacture (less blades) and produced the same amount of power as the N = 4 and 5 bladed screws. This dataset was generated from a screw with the following design and operating parameters: Do = 1 m, β = 24.5°, f = 1, N = 3 to 5, z0 = 0.0024 m, Q = 0.202 m3/s, ω = 40 rev/min, Di/Do = 0.532, S/Do = 1.00, and L/S = 3.84. The data suggest that, when operating under similar conditions, the relationship found in Section 4.1 may be reasonably used for a screw with N = 3, 4, or 5 blades.
4.3. Effect of Bucket Fill Height on Performance
As discussed in Section 3.2, Simulation 5 (Table 2) was run with bucket fill height ratio values ranging from f = 0.5 to 1.3 to observe the effects on performance. The results are shown in Figure 11.
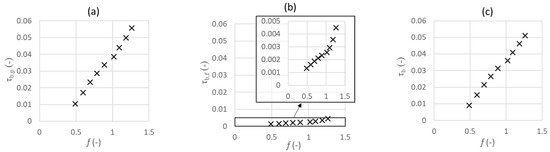
Figure 11.
Effect of the bucket fill height ratio on the pressure component (a), viscous component (b), and resultant dimensionless bucket torque (c) in an operating ASG for the Simulation 5 geometry. Sub-plot (b) shows a magnified representation of the results to better visualize trends.
Dimensionless bucket torque was observed to increase with the bucket fill height ratio in a trend that appeared almost linear. The potential energy of water within a bucket is a product of the mass (analogous to volume—a third-order length-scale), the gravitational acceleration, and the height of water in the screw bucket. The length-scale remained constant throughout the simulation set, so in effect, a first-order relationship remained between energy and fill height. It is noted that the volume of water in an Archimedes screw bucket is not linearly related to the fill height due to the complex, inclined, helical, and annular geometry of a bucket.
The results do exhibit some curvature and are not strictly linear; however, the simplified concepts above did seem reasonable in this range of data. Therefore, it is suggested that the relationship between the bucket fill height and the torque can be reasonably approximated with a first-order equation if the screw geometry does not proportionally change (i.e., the scale of the volume does not change). The additional uncertainty by approximating the system with a first-order linear fit seemed small. So, the following relationship may be used as an approximate reference for dimensionless bucket torque with respect to the bucket fill height ratio.
In dimensional terms:
As the total screw torque:
The trend fitting above suggests that the bucket fill height ratio may be used to scale the potential energy in a screw and determine an approximate value for the mechanical torque converted by the screw. The data presented in Figure 11 were generated from a simulation with geometry and operating conditions with the following values: Do = 2 m, β = 24.5°, f = 0.5 to 1.3, N = 3, z0 = 0.0024 m, Q = 0.520 to 1.761 m3/s, ω = 31.5 rev/min, Di/Do = 0.532, S/Do = 1.00, and L/S = 3.84. Since the length-scale and number of blade simulations showed dimensionless bucket torques that were relatively consistent, it is suggested that this relationship may be reasonably implemented for a similar range of length-scales (Do = 0.15 m to 5 m) and numbers of blades (N = 3, 4, and 5).
4.4. Effect of Inclination Angle on Performance
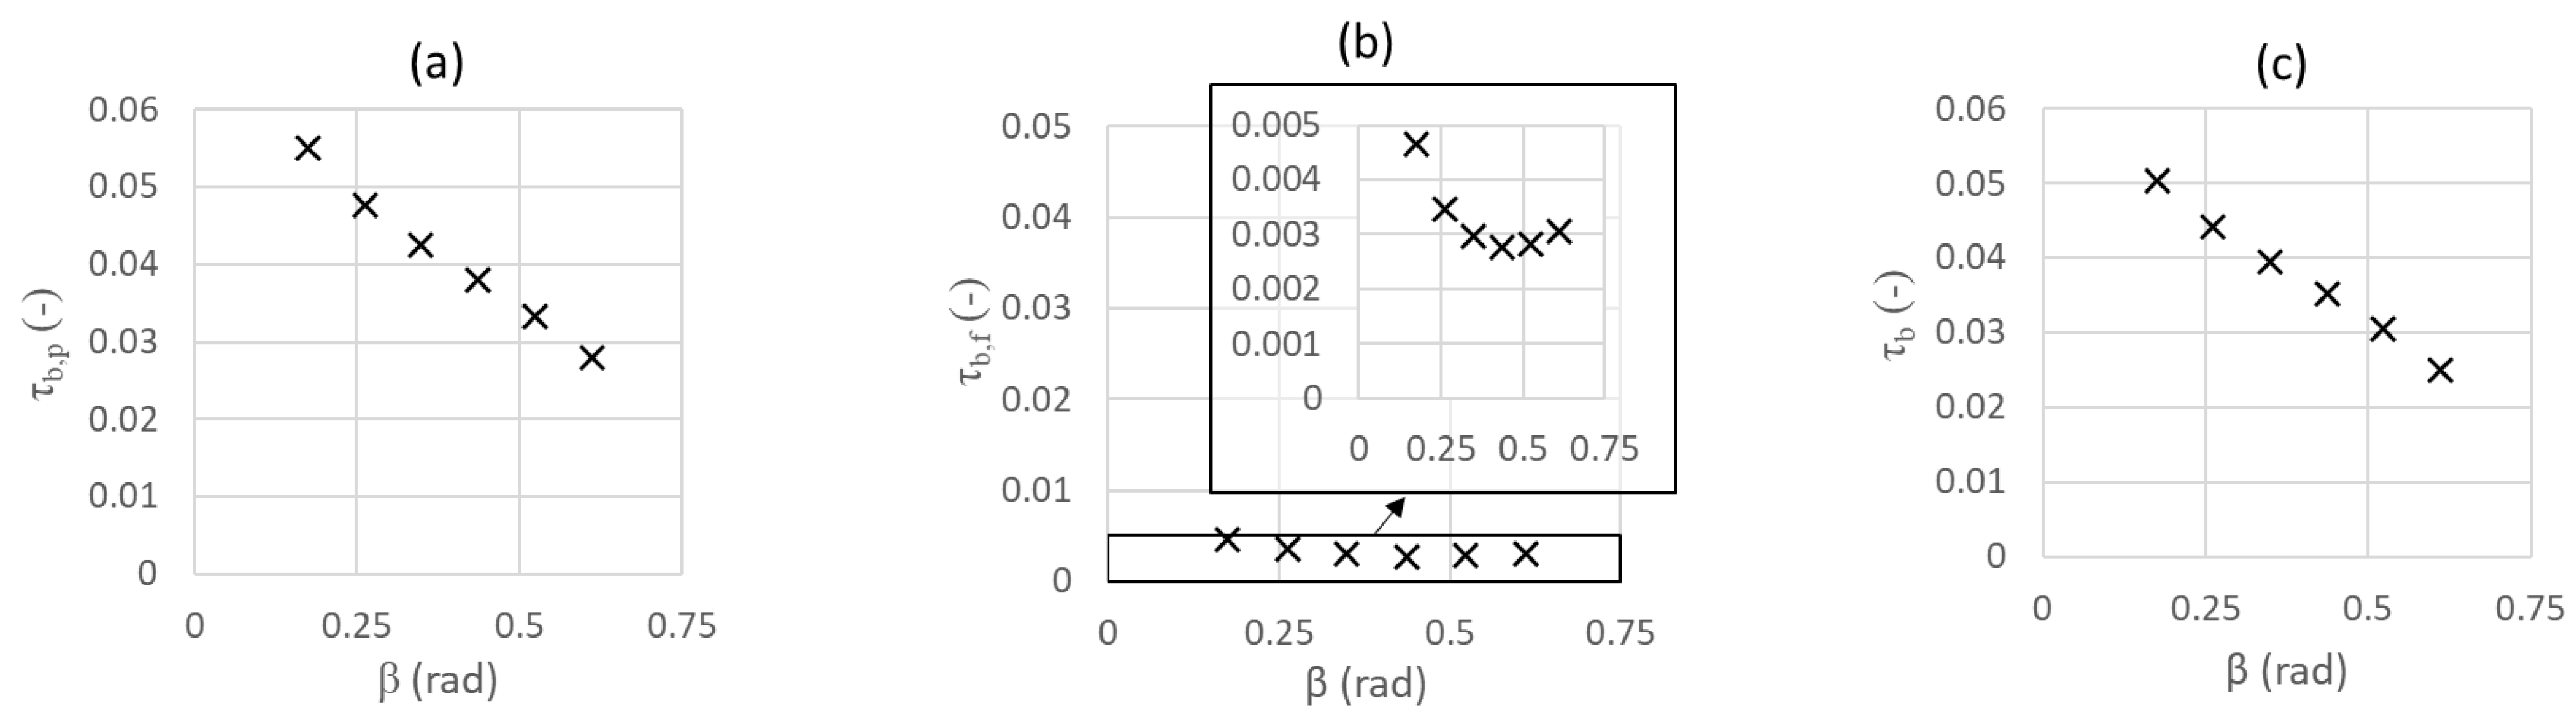
As discussed in Section 3.2, Simulation 4 (cf. Table 2) was run with inclination angles ranging from β = 10° to 40° to observe the effects on performance. The results are shown in Figure 12.

Figure 12.
Effect of the inclination angle on the pressure component (a), viscous component (b), and resultant dimensionless bucket torque (c) in an operating ASG for the Simulation 4 geometry. Sub-plot (b) shows a magnified representation of the results to better visualize trends.
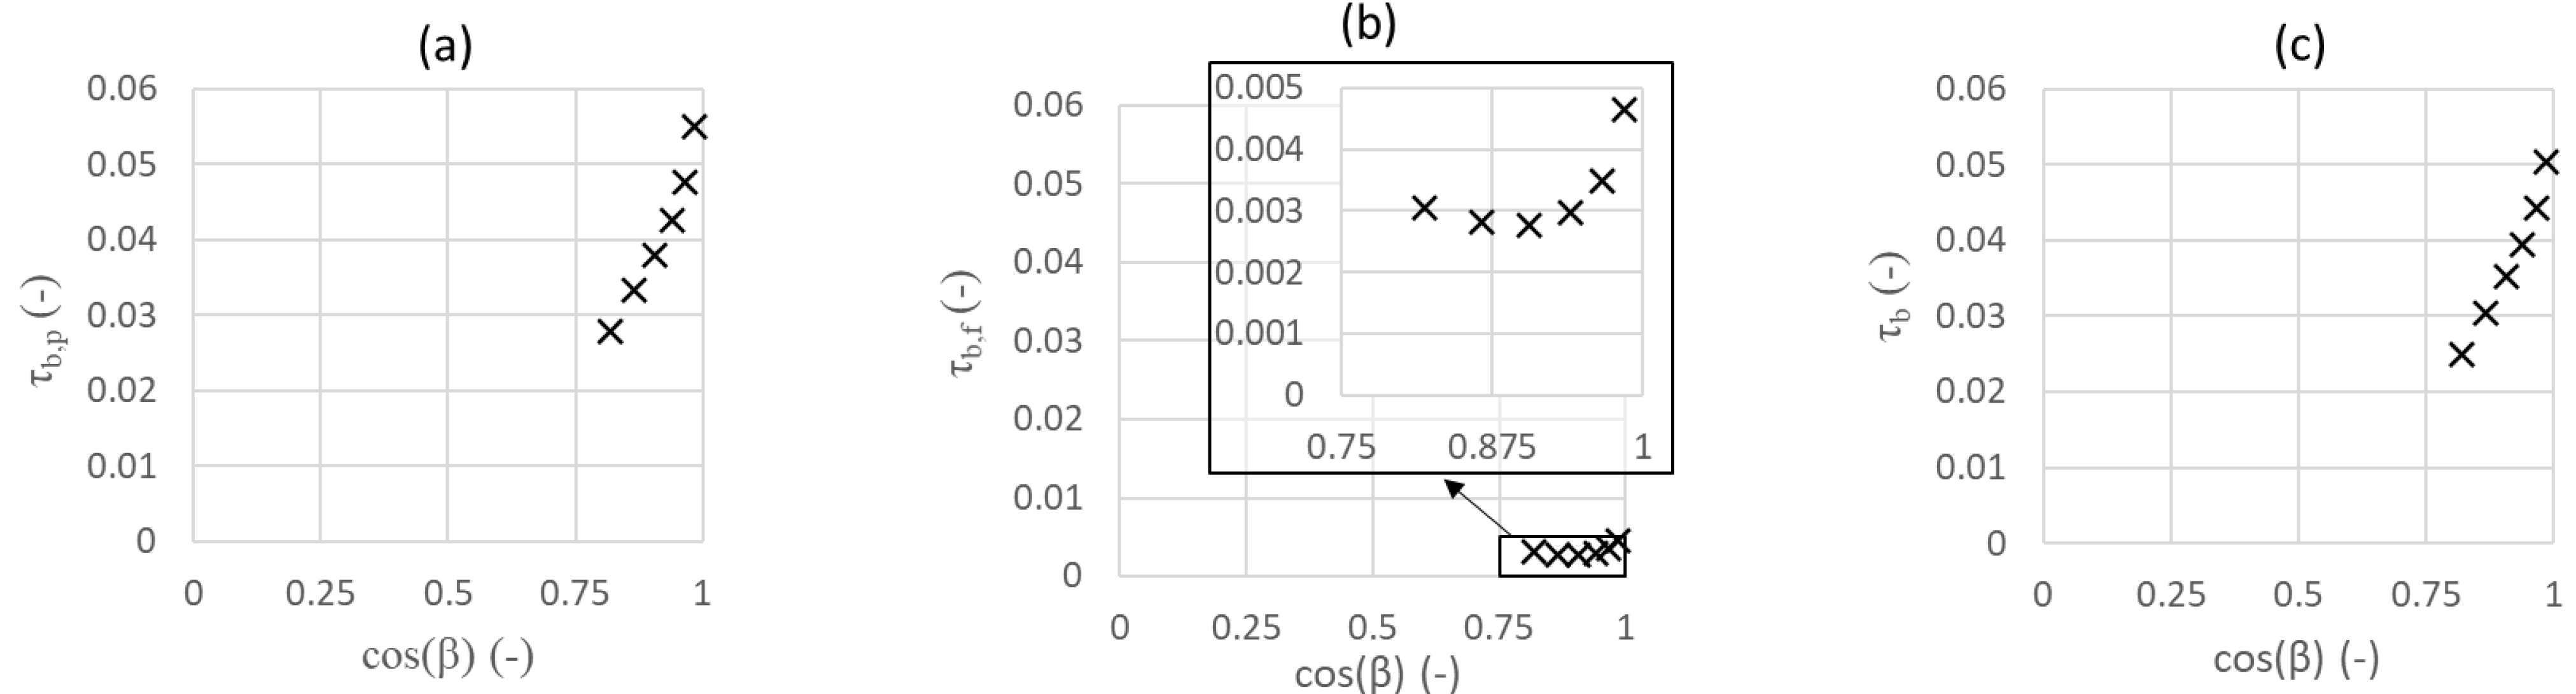
To add mathematical stability to possible relationships, the results were re-cast using the cosine of the inclination angle as the independent variable, limiting the range of the inclination term to be within −1 and +1.
Similar to the bucket fill height ratio, the inclination angle seems to be related to the dimensionless bucket torque in a way that could reasonably be approximated with a first-order, linear fit. As the inclination angle increased, the bucket head drop between each bucket (hb) increased, subsequently increasing the hydrostatic pressure and associated mechanical torque. The frictional power loss component of the power (Figure 12b and Figure 13b) appears to have a relationship similar to a second-order polynomial in the simulated range. The more complex frictional power loss component of torque can be explained by the changing shape of the wetted area of the screw as the inclination angle changed. Figure 14 demonstrates that the volume capacity and shape of an ASG bucket varies significantly with the inclination angle.
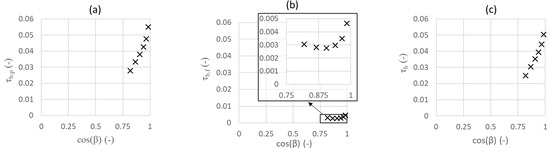
Figure 13.
Effect of the cosine of the inclination angle on the pressure component (a), viscous component (b), and resultant dimensionless bucket torque (c) in an operating ASG for the Simulation 4 geometry. Sub-plot (b) shows a magnified representation of the results to better visualize trends.

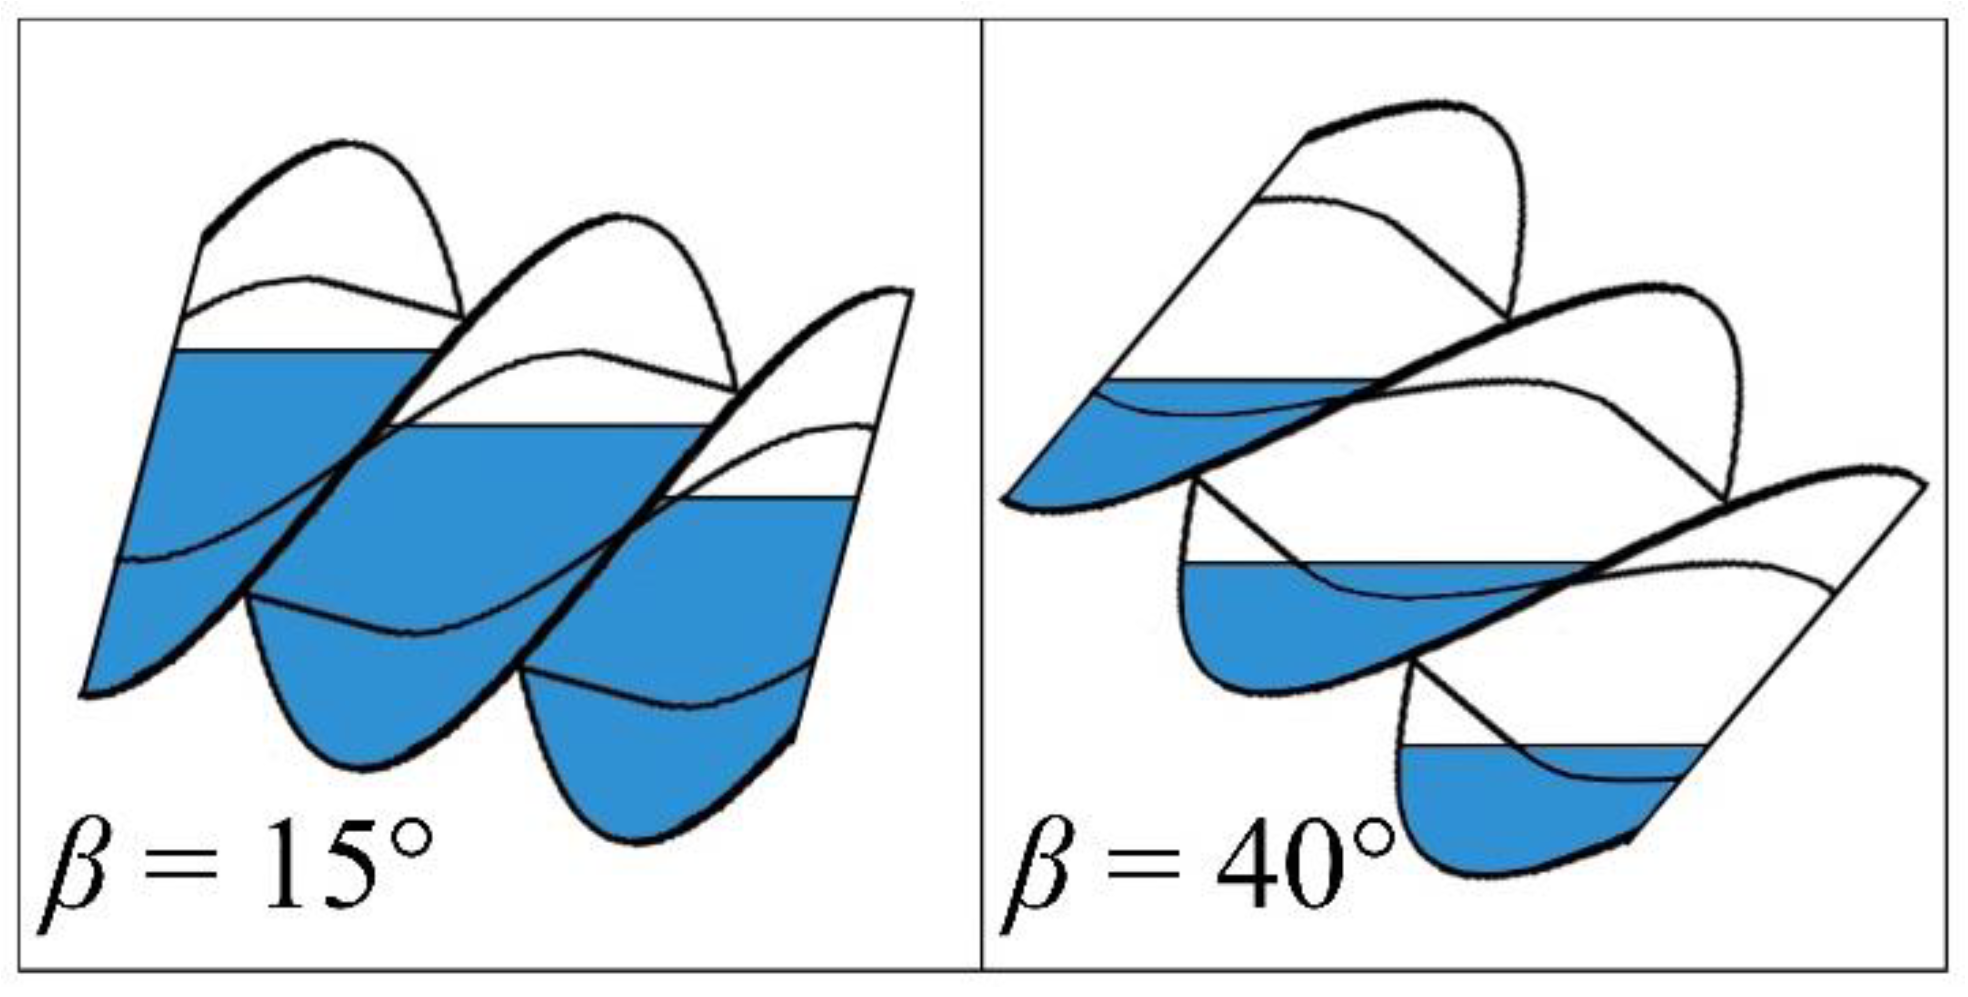
Figure 14.
When the bucket fill height ratio is held constant at f =1, the bucket capacity of an Archimedes screw is higher in a screw at an inclination of β = 15° (left) than an inclination of β = 40° (right).
In an Archimedes screw bucket, water is trapped between an upstream and downstream blade. Figure 14 demonstrates that, when the fill height ratio is constant at f = 1, the downstream blade has a similar wetted area (though still slightly different) but a very different wetted area on the upstream blade. So, as the inclination angle increased, the wetted area generally decreased.
Frictional power loss is generally a function of the wetted area and the rotation speed of the screw, so with regard to the wetted area, the frictional power loss in a screw with a steeper inclination angle should decrease. However, Archimedes screws with steeper inclination angles hold less volume of water. Therefore, to maintain the same flow and a fill height ratio of f = 1, the rotation speed of the screw was changed. The rotation speed ranged from ω = 3.324 rad/s for the β = 10° simulation to ω = 5.571 rad/s for the β = 40° simulation. Since the rotation speed increased with the inclination angle, the frictional power loss tended to proportionally increase. So, the frictional power loss was a balance which can be observed in Figure 12b, and Figure 13b shows a balance between the effects of a changing wetted area and rotation speed with inclination angle. At lower inclination angles, the increased wetted area drove the frictional power loss to be high. At higher inclination angles, the higher rotation speeds increase the frictional power loss. At intermediate inclination angles, there was a point in which frictional power loss was minimized.
Altogether, it was observed that the frictional power loss component of ASG performance was very small. So, a first-order relationship was fit to the data presented in Figure 12c to approximate dimensionless bucket torque with respect to inclination angle. Note, the inclination angle term uses units of radians.
In dimensional terms:
As total screw torque:
The above relationships were developed from a screw with geometric and operating conditions as follows: Do = 1 m, β = 10° to 40°, f = 1, N = 3, z0 = 0.0024 m, Q = 0.2017 m3/s, ω = 3.324 to 5.571 rad/s, Di/Do = 0.532, S/Do = 1.00, and L/S = 3.84. Since the length-scale and number of blades had minimal impact on dimensionless bucket torque in their associated ranges (see Section 4.1 and Section 4.2), it is suggested that the relationships above may be reasonably implemented for a similar range of length-scales (Do = 0.15 m to 5 m) and numbers of blades (N = 3, 4, and 5).
4.5. Roughness Effect
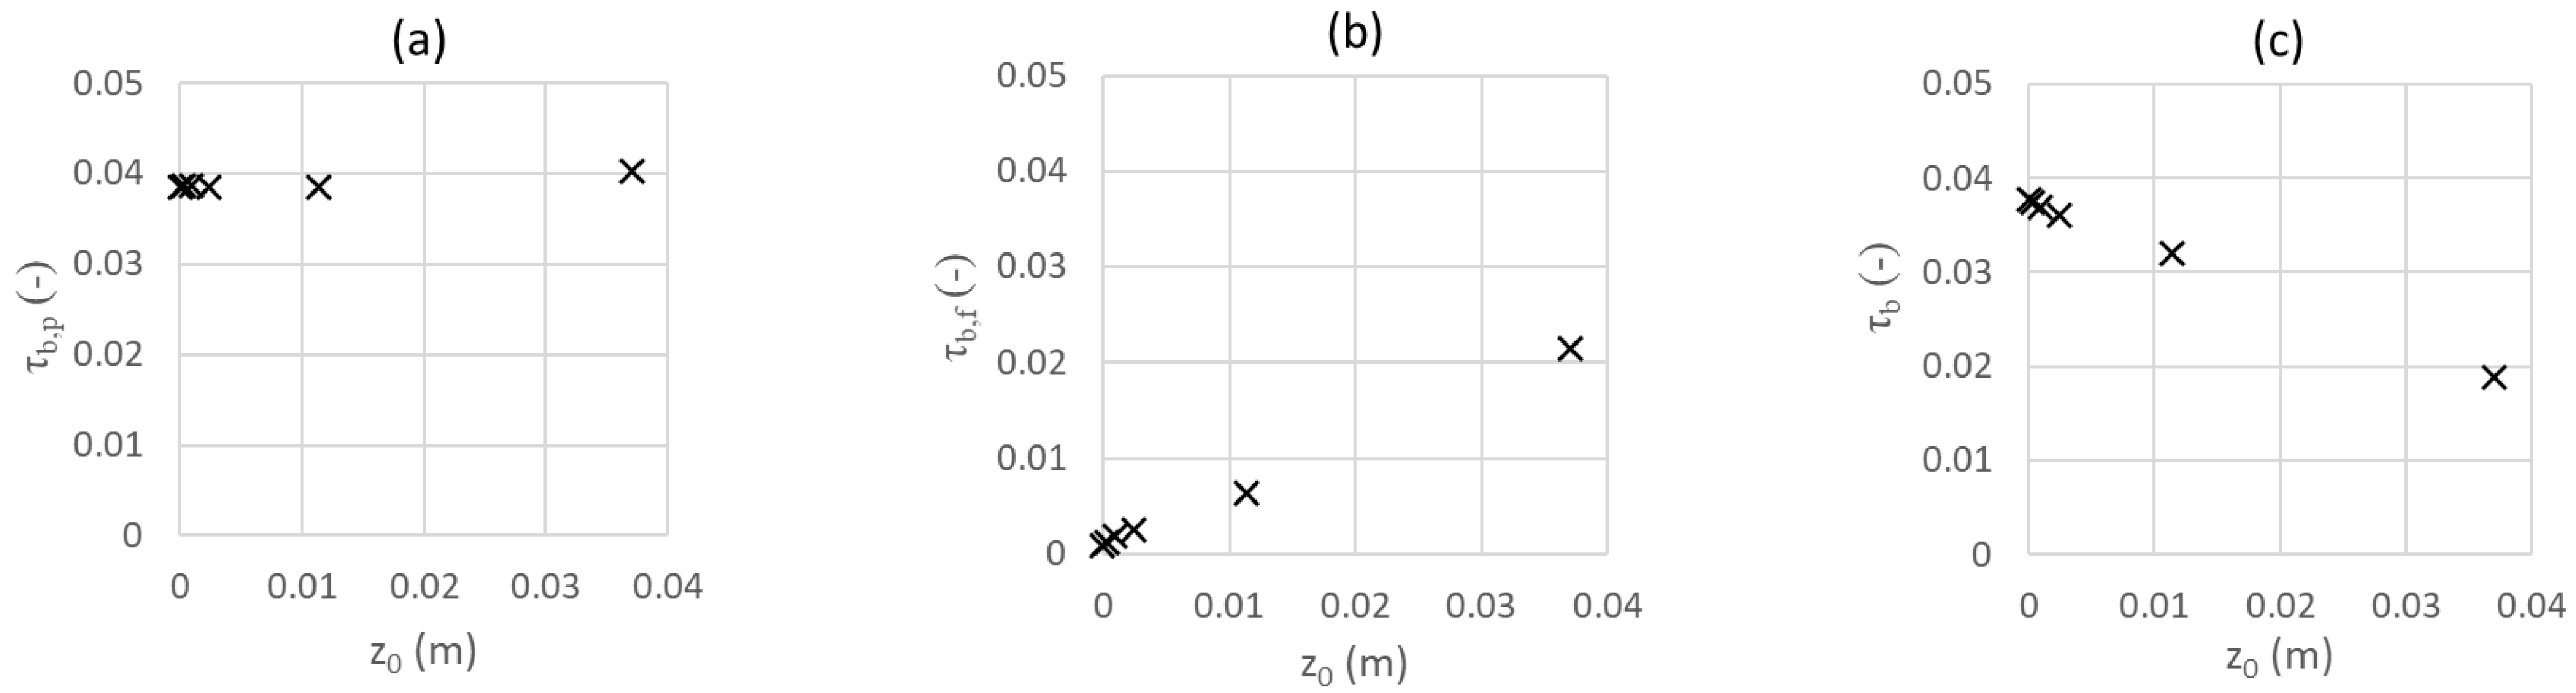
As discussed in Section 3.2, Simulation 5 (Table 2) was run with surface roughness values ranging from z0 = 0 m (n = 0) to z0 = 0.0370 m (n = 0.022) to observe the effects on performance. The results are shown in Figure 15.
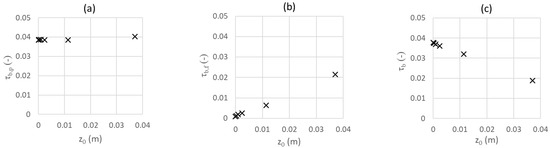
Figure 15.
Effect of the cosine of the inclination angle on the pressure component (a), viscous component (b), and resultant dimensionless bucket torque (c) in an operating ASG for the Simulation 4 geometry. Frictional power loss was high enough that sub-plot (b) did not require magnification as with other simulation sets above.
Notably, Figure 15b did not require magnification; in every previous simulation set, frictional power loss was small enough that it required magnification to view trends appropriately. This indicated that frictional power loss can be substantial when surface roughness values are high. The simulation with significant algal growth (z0 = 0.0114 m or n = 0.018) experienced frictional power losses on the order of 10%. Recall that two powerplant operators in the United Kingdom independently reported power losses of 10% [8] and 11% [39] when significant algal growth was present on their Archimedes screws.
The power-producing pressure component of dimensionless bucket torque was relatively consistent throughout the simulation set. This result could be expected since torque conversion is largely due to hydrostatic pressure and the surface roughness mostly impacts dynamic pressure in the system. The resultant dimensionless bucket torque was significantly impacted by the frictional power loss component of the simulated performance. The resultant torque appeared to exhibit a trend that could reasonably be approximated with a first-order polynomial. In the following relationship, the roughness height (z0) is in units of meters.
In dimensional terms:
As the total screw torque:
The relationships were developed from a simulation that had geometric and operational conditions as follows: Do = 2 m, β = 24.5°, f = 1, N = 3, z0 = 0 to 0.0370 m, Q = 1.233 m3/s, ω = 31.5 rev/min, Di/Do = 0.532, S/Do = 1.00, and L/S = 3.84.
In the previous simulation sets that investigated the performance effects of varying diameter, number of blades, fill height, and inclination angle, the frictional power loss component of the dimensionless bucket torque was very small. However, this simulation set demonstrated that friction has a substantial impact on screw generator performance when surface roughness is high. Therefore, it is recommended that the other expressions given in this paper may only be reasonable for ASGs with low surface roughness values. In many of the previous relationships, frictional effects were neglected; as surface roughness increases, that assumption is no longer valid. The most extreme roughness tested in this simulation set (z0 = 0.0370 m, or n = 0.022) yielded friction effects that accounted for a more than 40% drop in overall powerplant power production.
4.6. General Performance Estimate
The resultant relationships developed to estimate dimensionless bucket torque for each simulation set above were all first-order or constant. Therefore, Equations (7) through (10) could be combined using the principle of linear superposition. Adding the four equations together yields the following general equation:
In dimensional terms:
As the total screw torque:
Equation (23) should provide a reasonable approximation for dimensionless bucket torque for any ASG operating within a similar range of parameters simulated in this study. It should provide a reasonable reference value for screws with the following parameter ranges: Do = 0.15 to 5 m, β = 10° to 40°, f = 0.5 to 1.3, N = 3 to 5, and z0 = 0 to 0.037 m. The simulated screws had the following ranges for design ratios: Di/Do = 0.41 to 0.55, S/Do = 1 to 1.2, and L/S = 1.62 to 4.22. Note that not all terms were developed with varying design ratios, so Equation (23) may have higher uncertainty as design ratios become more extreme. The cumulative relationship shown in Equations (23)–(25) was developed using the principle of linear superposition. This is a combination of relationships that were all individually shown to appropriately approximate screw generator performance. The relationship is centered around a fill height of f = 1 and an inclination angle of β = 22° (0.384 rad).
5. Conclusions
A full-scale, transient computational fluid dynamic model of an Archimedes screw generator was used to generate a comprehensive dataset to evaluate the impact that length-scale (diameter), number of blades, bucket fill level, inclination angle, and surface roughness had on performance.
The five parameters had unique impacts on power generation. The impacts of length-scale could be approximated with a constant value, which indicated that proportional changes were not drastic. Similarly, the number of blades did not appear to significantly impact the resultant dimensionless bucket torque. The bucket fill height ratio, inclination angle, and surface roughness each individually appear to impact the dimensionless bucket torque with nearly first-order relationships. A back-of-the-envelope approximation was developed for each parameter using first-order polynomial fits. The principle of linear superposition was applied to develop a combined, general back-of-the-envelope equation that described the relationship between each parameter and torque in operating Archimedes screw generators.
The data and analyses presented in this study provide novel insight to the literature that are valuable for future model development and design optimization. The authors plan to use the results and data of this study to develop more reliable performance prediction models for Archimedes screw generator powerplants.
Author Contributions
Conceptualization, S.S., G.D. and W.D.L.; methodology, S.S. and W.D.L.; software, S.S. and G.D.; validation, S.S.; formal analysis, S.S.; investigation, S.S.; resources, G.D. and W.D.L.; data curation, S.S.; writing—original draft preparation, S.S.; writing—review and editing, S.S., G.D. and W.D.L.; project administration, W.D.L.; funding acquisition, W.D.L. All authors have read and agreed to the published version of the manuscript.
Funding
Aspects of Dr. Lubitz’ and Dr. Simmons’ work were financially supported by the Natural Sciences and Engineering Research Council (NSERC) Collaborative Research and Development (CRD) program (grant numbers CRDPJ 433740-12 and CRDPJ 513923-17) and Greenbug Energy Inc. (Delhi, ON, Canada). The authors would like to thank Murray Lyons and Arash YoosefDoost for feedback and assistance during planning and analysis. The assistance of Tony Bouk and Brian Weber of Greenbug Energy Inc. is gratefully acknowledged.
Data Availability Statement
Experimental data used in this study are available from the cited sources. Simulation data are available on request from the corresponding author.
Acknowledgments
The authors gratefully acknowledge the help and support of Adrian Clayton, David Mann, and Stuart Moore of Mann Power Hydro Ltd. for granting site access, sharing data, and helping with surveying and measurements. We are also very grateful to Mike Ford, Colin Mather, Rory Newman, Stephen Larkin, Dave Moore, and the rest of the team at Whitby Esk Energy for their help and support with surveying and measurements at Ruswarp Hydro. The assistance of Chris Elliott (On Stream Energy Ltd.) and the Buckfast Abbey staff was integral to the measurements taken at Buckfast Abbey’s Hydro plant and is greatly appreciated. The authors would also like to thank David Dechambeau of Southeast Power Engineering for his insights data set and his help and support with the surveying and measurements of the Romney Weir ASG plant in Windsor, UK.
Conflicts of Interest
The authors declare no conflict of interest.
References
- Rorres, C. The Turn of the Screw: Optimal Design of and Archimedes Screw. J. Hydraul. Eng. 2000, 126, 72–80. [Google Scholar] [CrossRef]
- Dalley, S.; Oleson, J.P. Sennacherib, Archimedes, and the Water Screw: The Context of Invention in the Ancient The Context of Invention in the Ancient World. Technol. Cult. 2003, 44, 1–26. [Google Scholar] [CrossRef]
- Radlik, K.-A. Hydrodynamic screw for energy conversion—Uses changes in water supply to regulate energy output. Patent, Germany DE4139134A1, 1997. [Google Scholar]
- Simmons, S.; Elliott, C.; Ford, M.; Clayton, A.; Lubitz, W.D. Archimedes screw generator powerplant assessment and field measurement campaign. Energy Sustain. Dev. 2021, 136, 896–908. [Google Scholar] [CrossRef]
- Simmons, S.C.; Lubitz, W.D. Analysis of internal fluid motion in an Archimedes screw using computational fluid mechanics. J. Hydraul. Res. 2020, 59, 932–946. [Google Scholar] [CrossRef]
- Lashofer, A.; Hawle, W.; Pelikan, B. State of technology and design guidelines for the Archimedes screw turbine. In Hydro 2012—Innovative Approaches to Global Challenges; The International Journal on Hydropower & Dams: Bilbao, Spain, 2012; pp. 1–8. [Google Scholar]
- Clayton, A. Personal Communication with Adrian Clayton; Mannpower: York, UK, 2019. [Google Scholar]
- Mann, D. Personal Communiation with David Mann; Mannpower: York, UK, 2019. [Google Scholar]
- Chen, J.; Yang, H.X.; Liu, C.P.; Lau, C.H.; Lo, M. A novel vertical axis water turbine for power generation from water pipelines. Energy 2013, 54, 184–193. [Google Scholar] [CrossRef]
- Chen, J.; Lu, W.; Hu, Z.; Lei, Y.; Yang, M. Numerical studies on the performance of a drag-type vertical axis water turbine for water pipeline. J. Renew. Sustain. Energy 2018, 10, 44503. [Google Scholar] [CrossRef]
- Ghimire, A.; Dahal, D.R.; Pokharel, N.; Chitrakar, S.; Thapa, B.S.; Thapa, B. Opportunities and Challenges of introducing Francis Turbine in Nepalese Micro Hydropower Projects. J. Phys. Conf. Ser. 2019, 1266, 12007. [Google Scholar] [CrossRef]
- Uamusse, M.M.; Aljaradin, M.; Persson, K.M. Micro-Hydropower Plant -Energy Solution Used in Rural Areas, Mozambique. Sustain. Resour. Manag. J. 2017, 2, 3–9. [Google Scholar] [CrossRef]
- Kaunda, C.S.; Kimambo, C.Z.; Nielsen, T.K. A technical discussion on microhydropower technology and its turbines. Renew. Sustain. Energy Rev. 2014, 35, 445–459. [Google Scholar] [CrossRef]
- Sangal, S.; Garg, A.; Kumar, D. Review of Optimal Selection of Turbines for Hydroelectric Projects. Rev. Optim. Sel. Turbines Hydroelectr. Proj. 2013, 3, 424–430. [Google Scholar]
- Matsushita, D.; Moriyama, R.; Nakashima, K.; Watanabe, S.; Okuma, K.; Furukawa, A. Tentative study on performance of darriues-type hydroturbine operated in small open water channel. IOP Conf. Ser. Earth Environ. Sci. 2014, 22, 1–10. [Google Scholar] [CrossRef]
- Kadier, A.; Kalil, M.S.; Pudukudy, M.; Hasan, H.A.; Mohamed, A.; Hamid, A.A. Pico hydropower (PHP) development in Malaysia: Potential, present status, barriers and future perspectives. Renew. Sustain. Energy Rev. 2018, 81, 2796–2805. [Google Scholar] [CrossRef]
- McLean, E.; Kearney, D. An evaluation of seawater pumped hydro storage for regulating the export of renewable energy to the national grid. Energy Procedia 2014, 46, 152–160. [Google Scholar] [CrossRef]
- Uhunmwangho, R.; Odje, M.; Okedu, K.E. Comparative analysis of mini hydro turbines for Bumaji Stream, Boki, Cross River State, Nigeria. Sustain. Energy Technol. Assess. 2018, 27, 102–108. [Google Scholar] [CrossRef]
- Fraser, R.; Deschênes, C.; O’Neil, C.; Leclerc, M. VLH: Development of a new turbine for Very Low Head sites. Waterpower XV 2007, 10, 1–9. [Google Scholar]
- Kemp, P.; Williams, C.; Sasseville, R.; Anderson, N. Very Low Head Turbine Deployment in Canada. IOP Conf. Ser. Earth Environ. Sci. 2014, 22, 062005. [Google Scholar] [CrossRef]
- Nuantong, W.; Taechajedcadarungsri, S. Optimal design of VLH axial hydro-turbine using regression analysis and multi-objective function (GA) optimization methods. J. Appl. Fluid. Mech. 2016, 9, 2291–2298. [Google Scholar] [CrossRef]
- Razak, J.; Ali, Y.; Alghoul, M. Application of crossflow turbine in off-grid pico hydro renewable energy system. Recent Adv. Appl. Math. 2010, 519–526. Available online: http://www.wseas.us/e-library/conferences/2010/Harvard/MATH/MATH-084.pdf (accessed on 28 October 2023).
- Yahya, A.K.; Munim, W.N.W.A.; Othman, Z. Pico-hydro power generation using dual pelton turbines and single generator. In Proceedings of the 2014 IEEE 8th International Power Engineering and Optimization Conference, PEOCO 2014, Langkawi, Malaysia, 24–25 March 2014; pp. 579–584. [Google Scholar] [CrossRef]
- Quaranta, E. Stream water wheels as renewable energy supply in flowing water: Theoretical considerations, performance assessment and design recommendations. Energy Sustain. Dev. 2018, 45, 96–109. [Google Scholar] [CrossRef]
- Quaranta, E. Estimation of the permanent weight load of water wheels for civil engineering and hydropower applications and dataset collection. Sustain. Energy Technol. Assess. 2020, 40, 100776. [Google Scholar] [CrossRef]
- Quaranta, E.; Revelli, R. Gravity water wheels as a micro hydropower energy source: A review based on historic data, design methods, efficiencies and modern optimizations. Renew. Sustain. Energy Rev. 2018, 97, 414–427. [Google Scholar] [CrossRef]
- MJ2 Technologies S.A.S. Case Studies: VLH Turbines. Sorgent.e Capital. Available online: www.vlh-turbine.com/documents/%0D (accessed on 12 July 2020).
- Inc. Hydropower Turbine Systems, Ossberger Hydro Projects. ossbergerhydro.com. Available online: http://www.ossbergerhydro.com/projects.html (accessed on 14 July 2020).
- Voith GmbH & Co. KGaA. Kaplan Turbines. Available online: http://www.voith.com/ca-en/products-services/hydro-power/turbines/kaplan-turbines-560.html (accessed on 14 July 2020).
- GE Renewable Energy Division, Kaplan Hydro turbine. Available online: https://www.ge.com/renewableenergy/hydro-power/large-hydropower-solutions/hydro-turbines/kaplan-turbine (accessed on 15 July 2020).
- Eisenring, M. Micro Pelton Turbines. St. Gallen, Switzerland: Swiss Center for Appropriate Technology. 1991. Available online: https://skat.ch/wp-content/uploads/2017/03/09-Micro-Pelton-Turbines.pdf. (accessed on 28 October 2023).
- Gruner, A.G. Akköy ll: Giresun, Turkey. Available online: https://www.gruner.ch/en/references/styt-ref-d-akkoey-ll (accessed on 16 July 2020).
- Gilbert Gilkes & Gordon Ltd. Case Studies: Our Global Projects. Available online: https://www.gilkes.com/case-studies (accessed on 15 July 2020).
- Fergnani, N.; Silva, P. Energetic and Economic Assessment of an Archimedean Screw with Variable Speed Operation under Variable Flows. In Proceedings of the Hydro 2015, Bordeaux, France, 26–28 October 2015; pp. 1–13. [Google Scholar]
- Fergnani, N.; Silva, P. Energetic and economic assessment of an Archimedean screw with variable speed operation under variable flows. In Hydro 2015; Hydropower and Dams: Bilbao, Spain, 2015. [Google Scholar]
- Fergnani, N.; Silva, P. Archimedean screw and intake head losses: Design optimization under variable flows and variable speed. In Hydro 2016; Hydropower and Dams: Montreux, Switzerland, 2016. [Google Scholar]
- Fergnani, N.; Silva, P.; Bavera, D. Efficiency assessment of a commercial size Archimedean screw turbine based on experimental data. In Hydro 2017; Hydropower and Dams: Seville, Spain, 2017. [Google Scholar]
- Kozyn, A. Power Loss Model for Archimedes Screw Turbines. Master’s Thesis, University of Guelph, Guelph, ON, Canada, 2016. [Google Scholar]
- Dechambeau, D. Personal Communication with David Dechambeau; Southeast Power Engineering Ltd.: Windsor, UK, 2019. [Google Scholar]
- Kozyn, A.; Lubitz, W.D. A power loss model for Archimedes screw generators. Renew. Energy 2017, 108, 260–273. [Google Scholar] [CrossRef]
- Wolter, C.; Bernotat, D.; Gessner, J.; Brüning, A.; Lackemann, J.; Radinger, J. Fachplanerische Bewertung der Mortalität von Fischen an Wasserkraftanlagen; BfN-Skripten: Bonn, Germany, 2020. [Google Scholar]
- Boys, C.A.; Pfugrath, B.D.; Mueller, M.; Pander, J.; Deng, Z.D.; Geist, J. Physical and hydraulic forces experienced by fish passing through three different low-head hydropower turbines. Mar. Freshw. Res. 2018, 69, 1934–1944. [Google Scholar] [CrossRef]
- Piper, A.T.; Rosewarne, P.J.; Wright, R.M.; Kemp, P.S. The impact of an Archimedes screw hydropower turbine on fish migration in a lowland river. Ecol. Eng. 2018, 118, 31–42. [Google Scholar] [CrossRef]
- Havn, T.; Sæther, S.; Thorstad, E.; Teichert, M.; Heermann, L.; Diserud, O.; Borcherding, J.; Tambets, M.; Økland, F. Downstream migration of Atlantic salmon smolts past a low head hydropower station equippped with Archimedes screw and Francis turbines. Ecol. Eng. 2017, 105, 262–275. [Google Scholar] [CrossRef]
- McNabb, C.D.; Liston, C.R.; Borthwick, S.M. Passage of Juvenile Chinook Salmon and other Fish Species through Archimedes Lifts and a Hidrostal Pump at Red Bluff, California. Trans. Am. Fish. Soc. 2003, 132, 326–334. [Google Scholar] [CrossRef]
- Kibel, P.; Coe, T. Fish Monitoring and Live Fish Trials. Archimedes Screw Turbine, River Dart. Report. Fishtek Consulting: Moretonhampstead, UK, September 2007. [Google Scholar]
- Kibel, P. Archimedes Screw Turbine Fisheries Assessment. Phase II: Eels and Kelts. Report. Fishtek Consulting: Moretonhampstead, UK, March 2008. [Google Scholar]
- Pauwels, I.S.; Baeyens, R.; Toming, G.; Schneider, M.; Buysse, D.; Coeck, J.; Tuhtan, J.A. Multi-Species Assessment of Injury, Mortality, and Physical Conditions during Downstream Passage through a Large Archimedes Hydrodynamic Screw. Sustainability 2020, 12, 8722. [Google Scholar] [CrossRef]
- United Kingdom Environment Agency. Hydropower Good Practice Guidelines Screening Requirements; UK Environment Agency: York, UK, 2012. [Google Scholar]
- Muysken, J. Berekening van het nuttig effect van de vijzel. De. Ing. 1932, 21, 77–91. [Google Scholar]
- Nagel, G. Archimedian Screw Pump Handbook: Fundamental Aspects of the Design and Operation of Water Pumping Installations Using Archimedian Screw Pumps, 1st ed.; RITZ-Pumpenfabrik OHG: Schwäbisch Gmünd, Germany, 1968. [Google Scholar]
- Nagel, G.; Radlik, K.-A. Wasserförderschnecken: Planung, Bau und Betrieb von Wasserhebeanlagen, 1st ed.; Pfriemer Buchverlag in der Bauverlag: Berlin, Germany, 1988. [Google Scholar]
- Nuernbergk, D.M. Wasserkraftschnecken—Berechnung und Optimaler Entwurf von Archimedischen Schnecken als Wasserkraftmaschine (Hydropower Screws—Calculation and Design of Archimedes Screws Used in Hydropower), 2nd ed.; Verlag Moritz Schäfer: Detmold, Germany, 2020. [Google Scholar]
- Nuernbergk, D.M.; Rorres, C. An Analytical Model for the Water Inflow of an Archimedes Screw Used in Hydropower Generation. J. Hydraul. Eng. 2012, 139, 213–220. [Google Scholar] [CrossRef]
- Lubitz, W.D.; Lyons, M.; Simmons, S. Performance Model of Archimedes Screw Hydro Turbines with Variable Fill Level. J. Hydraul. Eng. 2014, 140, 922. [Google Scholar] [CrossRef]
- Kozyn, A.; Lubitz, W. Experimental Validation of Gap Leakage Flow Models in Archimedes Screw Generators. In Renewable Energy in the Service of Mankind Vol I; Sayigh, A., Ed.; Springer International Publishing: Cham, Switzerland, 2015; pp. 365–375. [Google Scholar]
- Rohmer, J.; Knittel, D.; Sturtzer, G.; Flieller, D.; Renaud, J. Modeling and experimental results of an Archimedes screw turbine. Renew. Energy 2016, 94, 136–146. [Google Scholar] [CrossRef]
- Songin, K.J.; Lubitz, W.D. Measurement of fill level and effects of overflow in power-generating Archimedes screws. J. Hydraul. Res. 2018, 57, 635–646. [Google Scholar] [CrossRef]
- Lashofer, A. Projekt Wasserkraftschnecken Verortung; Ingenieurbüro Lashofer: Wald, Austria. Available online: https://www.lashofer.at/deutsch/wasserkraftschnecke/projekt-wasserkraftschnecken-verortung/ (accessed on 3 March 2020).
- Landustrie Sneek, B.V. Hydropower: Linton Lock (UK). Landustrie.nl. Available online: https://www.landustrie.nl/en/products/hydropower/projects/linton-lock.html (accessed on 3 March 2020).
- Lyons, M. Lab Testing and Modeling of Archimedes Screw Turbines; University of Guelph: Guelph, ON, Canada, 2014. [Google Scholar]
- Songin, K. Experimental Analysis of Archimedes Screw Turbines. Master’s Thesis, University of Guelph, Guelph, ON, Canada, 2017. [Google Scholar]
- Menter, F.R. Two-equation eddy-viscosity turbulence models for engineering applications. AIAA J. 1994, 32, 1598–1605. [Google Scholar] [CrossRef]
- Dhakal, T.P.; Walters, D.K. Curvature and Rotation Sensitive Variants of the K-Omega SST Turbulence Model. In ASME 2009 Fluids Engineering Division Summer Meeting; ASME: Vail, CO, USA, 2010; pp. 2221–2229. [Google Scholar] [CrossRef]
- Simmons, S.; Dellinger, G.; Lyons, M.; Terfous, A.; Ghenaim, A.; Lubitz, W.D. Effects of Inclination Angle on Archimedes Screw Generator Power Production with Constant Head. J. Hydraul. Eng. 2021, 147, 1–12. [Google Scholar] [CrossRef]
- White, F.M. Fluid Mechanics, 7th ed; McGraw-Hill: New York, NY, USA, 2011. [Google Scholar]


Disclaimer/Publisher’s Note: The statements, opinions and data contained in all publications are solely those of the individual author(s) and contributor(s) and not of MDPI and/or the editor(s). MDPI and/or the editor(s) disclaim responsibility for any injury to people or property resulting from any ideas, methods, instructions or products referred to in the content. |
© 2023 by the authors. Licensee MDPI, Basel, Switzerland. This article is an open access article distributed under the terms and conditions of the Creative Commons Attribution (CC BY) license (https://creativecommons.org/licenses/by/4.0/).