Article

Value-Stream Mapping as a Tool to Improve Production and Energy Consumption: A Case Study of a Manufacturer of Industrial Hand Tools

by
Mariusz Salwin
1,*,
Karolina Pszczółkowska
2,
Michał Pałęga
3,* and
Andrzej Kraslawski
4
1
Institute of Organization of Production Systems, Faculty of Mechanical and Industrial Engineering, Warsaw University of Technology, 85 Narbutta Street, 02-524 Warsaw, Poland
2
Building Tools Manufacturing Plant, 34 Graniczna Street, 05-094 Janki, Poland
3
Department of Production Management, Faculty of Production Engineering and Materials Technology, Częstochowa University of Technology, 19 Aleja Armii Krajowej, 42-201 Częstochowa, Poland
4
Industrial Engineering and Management, School of Engineering Science, Lappeenranta University of Technology, P.O. Box 20, FI-53581 Lappeenranta, Finland
*
Authors to whom correspondence should be addressed.
Energies 2023, 16(21), 7292; https://doi.org/10.3390/en16217292
Submission received: 15 September 2023 / Revised: 10 October 2023 / Accepted: 23 October 2023 / Published: 27 October 2023
(This article belongs to the Special Issue Energy Saving Manufacturing System Optimization)

Abstract

:
Manufacturing companies strive to minimize costs, maximize efficiency and improve production quality, which is crucial for market competitiveness. As companies grow and technologies evolve, increasingly complex challenges arise in effectively managing and improving production processes. One of the tools that helps companies improve their processes is value-stream mapping (VSM). The article focuses on the use of VSM in the production process of hand tools used in the construction industry. The paper presents selected aspects of the optimization of the production process using the mapping concept. The research identified and characterized the most important processes occurring in the production of hand tools used in construction. Then, basic data on the value stream was collected and the need for improvements and actions aimed at optimizing the value stream was indicated. Financial results, key performance indicators (KPIs), machine operation and reliability, energy consumption in the production process and overall equipment effectiveness (OEE) before and after improvements were calculated. The analysis carried out allowed for the optimization of the production process in terms of economy and energy consumption. As a result of the improvements, the productivity of injection-molding workers increased by 9.4% and the overall equipment efficiency by 18%. The machine availability rate increased from 70.3% to 85.2%. After implementing the improvements, the company is able to save approximately 295,488 kWh annually, i.e., approximately EUR 53,253, while 1 kWh currently costs producers in Poland EUR 0.18. The conclusions and results described in the paper constitute a solid basis for further development of an improvement project for the selected company.

1. Introduction

Value-stream mapping (VSM) has its roots in the Japanese company Toyota and is an integral part of the lean manufacturing philosophy [1,2]. The idea for this tool was born in the 1950s, when Toyota, trying to improve its production processes, began to focus on eliminating all forms of waste in production [3,4]. The pioneers in the development of VSM were Taiichi Ohno and Shigeo Shingo, who worked on this tool over the years [5]. In 1980, VSM was officially introduced into practice at Toyota [2,6]. It is worth noting that although it was born in the context of production, its applications quickly moved to other fields and industries, such as services, health care and logistics [7,8].
Value-stream mapping (VSM) is a visual tool that allows simultaneous representation of the information and material flow using symbolic illustrations and icons. VSM is supposed to identify and eliminate waste in a factory or production line in order to serve customers with higher quality and timely deliveries. The designed maps should represent the current state of the production process in enterprise, showing the critical points and the future state, when all the improvement plans are in place [5,9,10]. The value-stream mapping identifies different kinds of value-added and non-value-added activities in the process, where non-value-added (NVA) time has to be eliminated by the proposed changes. The value-added time is determined by all the operations in a production process that really add value to the product. Lead time is the elapsed time from receiving a customer request to delivering on that request [10,11].
Nowadays, the clients require the cheapest products simultaneously with high quality, which is difficult for producers to achieve [1,12,13,14,15,16]. It is due to the fact that recently most of the raw materials’ prices have increased during the pandemic and economic crisis [17,18,19]. However, the growing popularity of do-it-yourself (DIY) projects has increased the production of hand-tool devices in the market. Figure 1 shows the growing value of the global industrial-hand-tool market and global hand-tool market [20].
Furthermore, a global problem related to hand-tool production is plastic pollution, which has a harmful impact on the environment. Global plastic production reached almost 370 million tons in 2020, where around 80% of plastics ended up in landfill [21,22,23,24]. The struggle with a complex issue like plastic pollution is it typically requires a mix of actions from a variety of stakeholders such as governments, producers, consumers, researchers, media and civil society. Preventing and mitigating pollution is an essential starting point, but an adapted process with improved knowledge is needed to achieve a truly sustainable economy. The first step for this is to reduce the production and use of several plastics, and also to reduce material waste during production [25,26,27].
This paper focuses on the analysis of a company producing hand tools for the construction industry. Important elements in the production of such tools include ergonomics, comfort and safety of use, as well as the use of modern materials for their production and taking care of the natural environment. This indicates that the demand for the materials from which tools are made and the electricity needed to produce them will likely increase in the near future. The company identified the main problems related to rising costs, in particular the increase in electricity prices, as well as the problem of operation and reliability of machines and increasing waste. Long production cycles hinder efficient production, leading to increased retention of capital in the form of inventories at various stages of production and limiting the flexibility and efficiency of the production system. To identify the sources of problems, the current state of the injection-molding station’s value stream was mapped and analyzed. Based on this analysis, improvements were suggested using lean manufacturing tools, which were used to map the future state of the value stream. In an effort to prove and quantify the benefits of such improvements, a map model for each VSM state was proposed and their results compared.
The paper is structured as follows: Section 1 is an introduction. Section 2 explains the research methodology. Section 3 presents the literature review. Section 4 presents the case study. Section 5 presents the key performance indicators (KPIs). Section 6 presents the financial and effectiveness analysis of the proposed solutions. Section 7 presents the conclusions.

2. Research Methodology

2.1. Value-Stream Mapping

The aim of this paper is to analyze and improve the production process of plastering trowels using a value-stream mapping technique. These actions are proceeded to reduce waste and result in the better quality and efficiency of the production process.
The main questions formulated in this paper are as follows:
  • How does VSM help identify areas for improvement in the production of hand tools used in the construction industry?
  • How can we reduce waste and achieve better results in the analyzed production process, while maintaining the same financial, human and time expenditure?
  • How will the improvements used affect electricity consumption, operation and reliability, and OEE?
In order to answer these questions and achieve the aim set out in this paper, we adopted the following research methodology covering the following:
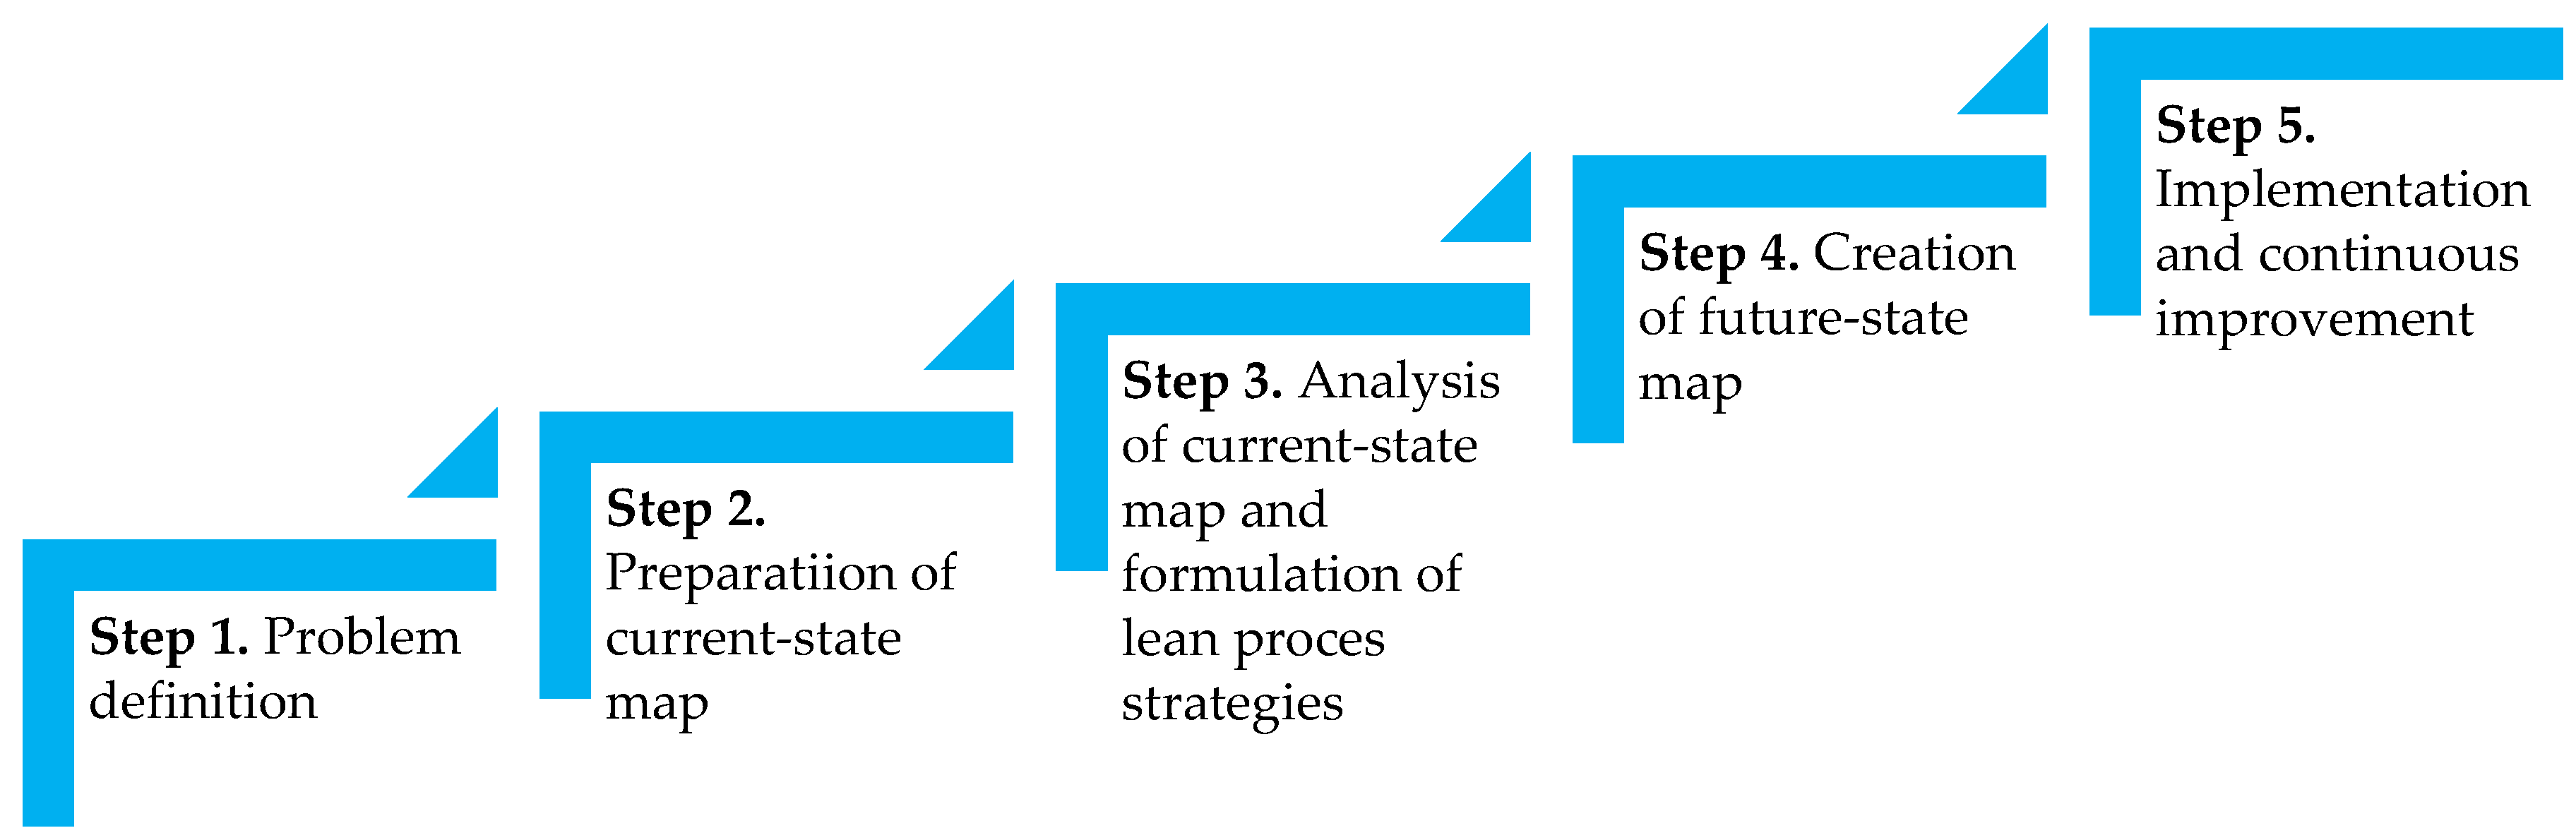
  • Analysis of the enterprise. In this step, basic information about the company was described. At this step, consultations with the company’s engineers and supervisors were made.
  • Description of the production process and data collection. Data collecting consisted of tech tree analyzing and analyzing the actual process in the production hall. Based on this information, the current-state map was developed. This stage took place in February 2023, in the hand-tool production plant. We managed to obtain data of machines, operators, machine-changeover time, number of changes, production volume and level of non-compliances. In this phase the following actions were made:
    • Interviews with operators about individual operations in specific units: At this stage, interviews were conducted with employees performing specific operations in the process. The purpose of these interviews was to gather knowledge of the details of and details-related-to given operations. Operators shared information about the time needed to perform the operation, the tools used, raw materials and any problems encountered during work.
    • Live observation of the production process: This stage involved monitoring and documenting the actual course of the production process. Each stage of production was tracked, recording the duration of the operation, the efficiency of the machines, the number of products produced and any delays or problems. The observations were made live, which allowed the collection of accurate and up-to-date data on the process.
    • Establishing working time standards: During this stage, data collected during observations of the work of operators and machines were analyzed. On their basis, the average time needed to perform individual operations and tasks in the production process was determined. During this stage, various factors are taken into account, such as the specifications of the hand tools used in construction, environmental and technical conditions, and the skills of the operators.
    • Technology tree analysis—the technology tree was used as a source of information to create VSM. As part of this stage, information was collected about the duration of individual operations and activities in the analyzed production process, which had previously been identified in the technology tree.
    • Analysis of machine changeover time: At this stage, data were collected of the time needed to changeover machines. Changeover time refers to the period between the end of the production of one product and the start of the production of the next. This is to identify periods when production is suspended due to a product change or a machine being adapted to a new task. Including it in the VSM allows you to identify areas where efficiency can be improved by reducing changeover time.
    • Collecting data on electricity consumption: At this stage, the values for electricity consumption were read from information boards attached to the machines. Additionally, energy-consumption measurements were constantly made from the installed meters. Then, the collected data were analyzed.
  • Based on the obtained data, a map of the current situation was developed. The main disadvantages of the current situation were pointed out, as were issues that should be improved.
  • Consultations with supervisors about energy and improvement costs were made. Furthermore, the situation of the material-waste level was discussed. Joint analysis allowed for the ability to select proposed improvements and to define what changes are the most important in terms of the cost-effective implementation.
  • Design of a future-state map. In the last stage, a map of the future state with proposed improvements was present. Based on the gathered data and consultations with operators and supervisors the future-state map has been developed. The map presents information of the material flow through the production system, in relation to the supplier and customer. Thanks to the improvements, the lead time is shortened and waste is reduced.

2.2. Key Performance Indicators (KPIs)

A KPI is a measurement that evaluates how a company executes its strategic vision. It is important that everyone involved in the company strategy agrees on what the strategy represents and how its variations are interpreted [28,29]. Measuring the performance of the organization means qualitative and quantitative expression of some results using chosen indicators [3]. The selection of appropriate indicators to be used for measurement and appraisal of the performance is very important [30,31].

2.2.1. KPIs in Production Department

Employee performance indicator (EP)
The employee performance indicator is an indicator for measuring employees’ effectiveness at working hours. It is determined with the formula:
E P = N o r m a t i v e   w o r k i n g   t i m e W o r k i n g   t i m e 100 %
where the normative working time is calculated using the result of a subtraction non-normative hours from total working time. In the discussed enterprise non-normative working hours are inscribed by the department leader in the system. Non-normative hours include the changeover time, cleaning the workplace, breaks, etc.
Quantitative production indicator (WI)
The quantitative production indicator is an indicator for production supervision, which measures quantitative deviations in the production process. This indicator is determined using the following formula:
W I = Q u a n t i t y o f p r o d u c e d p r o d u c t s P l a n n e d p r o d u c t i o n q u a n t i t y 100 %
It includes planned production quantity based on customer’s forecasts and their orders, and also the availability of raw materials. This indicator reflects on what part of the plans were achieved during an amount of time.

2.2.2. KPIs in Quality Department

Level of complaints indicator (QI1 and QI2)
This indicator measures the long term and reflects the annual comparison using the level of complaints. The more accurate indicator is the measure of complained of products in an amount of time and then compared annually. It is calculated as follows:
Q I 1 = S u b t r a c t i o n   o f   a n n u a l   c o m p l a i n t s L e v e l   o f   c o m p l a i n t s   l a s t   y e a r 100 %
and
Q I 2 = S u b t r a c t i o n   o f   a n n u a l   c o m p l a i n t e d   p r o d u c t s L e v e l   o f   c o m p l a i n t e d   p r o d u c t s   l a s t   y e a r 100 %
It reflects how the level of complaints or complained products decreasing annually.
Level of scraps indicator (SI)
This indicator is also measured long term and reflects the annual comparison using the quantity of scraps. It is calculated with the following formula:
S I = S u b t r a c t i o n   o f   a n n u a l   s c r a p Q u a n t i t y   o f   s c r a p   l a s t   y e a r 100 %
It shows how the level of scraps decreases annually. In the Quality Department, KPI is defined as an aim that has to be reached in a set amount of time. Each year, the obtained data are compared to define if it has been achieved.

3. Literature Analysis

VSM is a method of documenting processes and flows of information and materials in the current situation. It is also a systematic way to analyze these processes to identify different forms of waste and identify areas for improvement [2,32,33,34,35]. This visual representation facilitates the implementation of the lean approach by identifying value-adding steps in the value stream and eliminating non-value-adding or wasteful steps [34].
Initially, VSM was developed to focus on the analysis and optimization of isolated production lines [2,36]. However, over time, it has become the preferred tool to support and implement the lean approach in all industries. VSM allows companies to look at their entire process, both in its current state and in the desired future state after optimization. This allows you to identify and eliminate waste by streamlining work processes, reducing lead times, reducing costs and improving quality [2,37,38].
The use of VSM in enterprise brings numerous benefits. It allows you to understand the flow of value in the production process, identify areas of waste and imperfection, and find opportunities for improvement [5,34,39]. After the implementation of the recommended changes, you can observe a reduction in production time, cost reduction and an increase in efficiency [10,40]. Thanks to the value-flow analysis, it is also possible to increase employee involvement, which has a positive impact on the organizational culture [4,33].
Value-stream mapping is a tool that helps companies improve production processes, streamline operations, eliminate waste and achieve a competitive advantage [41,42]. It is an extremely important tool for enterprises that strive to increase efficiency, improve quality and customer satisfaction, as well as reduce costs and ensure sustainable success in the market [43].
The literature indicates five steps for VSM implementation: Step 1. Problem definition; Step 2. Preparation of the current-state map; Step 3. Analysis of the current-state map and formulation of a lean process strategy; Step 4. Creating a map of the future state; and Step 5. Implementation and continuous improvement [3,44]. The steps in the implementation of VSM are shown in Figure 2. Most researchers also believe that knowledge of the current situation and critical areas or places for improvement are necessary to prepare a VSM, to have some preparation to gather information related to the situation of the company, and then use observation to document what the company looks like without neglecting or hiding the exact situation [1,45].
Table 1 shows 25 examples of applications and results obtained from VSM. The analysis of the presented examples shows that VSM has been successfully applied in various industries and production processes to identify areas for improvement and achieve better results. The use of VSM brings positive effects in the form of shortening the production time, improving productivity, reducing costs and increasing the efficiency of processes, improving quality, and increasing customer satisfaction. It is an important tool in improving production and service management and improving the competitiveness of enterprises. In each of the presented cases, it is recommended to continue monitoring the processes and regularly update the value-flow map in order to maintain the benefits achieved.

4. The Case Study

4.1. Company Analysis

The analyzed enterprise produces hand tools for the building industry, producing 350 kinds of tools. A lot of them are personalized. The company reworks 315,000 kg of steel, 245,000 kg of plastics and 180,000 pcs of aluminum components per year. The total value of the used raw materials was about EUR 1,252,000 for 2022. Currently, the company employs 150 people, and the number of men and women is almost equal. The production process takes place in a two-shift system and is divided into 4 units:
  • Steel cutting line: Work takes place 5 days a week; there are two shifts and both last 8 h (6:00–14:00 and 14:00–22:00); during the shift there are two breaks, one for 20 min and one for 15 min.
  • Engraving station: Work takes place the same as the cutting line, for 5 days a week, for 8 h a day (6:00–14:00 and 14:00–22:00); there are two breaks, also 20 and 15 min.
  • Welding with labelling station and assembly with packing station: Work takes place on the same unit for 5 days a week, for 8 h a day. There is one shift from 6:00 until 14:00 including two breaks—one for 20 min and another one for 15 min.
  • Injection molding station: Work takes place over two shifts, and the working hours and breaks are the same as at the cutting line.
The process time of all operations is quite fast, which is why the work system is the same for all units.
The raw materials for the production of plastering trowels are cold-rolled stainless-steel rolls, plastic granules of polypropylene and thermoplastic elastomer, steel copper-coated pins and aluminum-handle components of the enterprise’s own project. The average times for order fulfilment of raw materials are 4 months for steel, 2 weeks for plastics, 2 weeks for aluminum components and the pins are available right away. For materials with a longer waiting time, there are prepared demand forecasts.
The customers are able to place their order at any time after working out the details of the required products. The verification of orders is possible every day. The minimum required order for the discussed plastering trowels is about 300 pieces.
Production orders for each unit are generated from an ERP (Enterprise Resources Planning) system and are based on customer orders, the level of raw materials and stocked components, the level of stocks of finished products and the expected level of shortages. The company uses the concept of 5S and a FIFO (“First-In, First-Out”) system.

4.2. Description of the Production Process

The production process of plastering trowels includes seven main stages (Figure 3). At every stage, the quality inspection is made by the quality-control department, but also by the shop-floor worker. The production is divided into four units: T1 is the press unit; T2 is the injection molding unit; T3 is the welding and assembly unit; and T8 is the engraving unit.
The stainless steel is ordered in the form of rolls. The roll is placed on the cutting line with a forklift with a hook. The roll of steel is straightened on the line and cut into a particular size of float. If there is any defect observed, the steel floats are sorted and reworked into other products. Cut-off components are transported with a pallet jack by the operator to another unit.
The next step is engraving the customer’s logo on the steel floats. This step is not obligatory and can be skipped—it depends on the customer’s requirements. The logo is engraved on steel using a diode laser. At this step, any incompliances have to be removed to the scrap yard and cannot be reworked. After this operation, the steel is transported to the welding and assembly unit by an operator with a pallet jack.
At the injection-molder unit, the plastic handles are made. There are two steps of making a handle. The first step is to make a core of the handle from stiff plastic. After the injection molding process has finished, cores fall into the small water tank where they are cooled down. Then, the cores are taken out from the water and placed into a metal box where they dry. Dried cores are placed in the machine and over molded with thermoplastic elastomer. If there is any small excess of material, the operator has to cut it out. If there is any other incompliance the components are ground and reworked.
After these processes, the steel floats are placed in the welding robot where the pins are connected to the steel with the induction head. In this process, the labels are also placed on steel floats. Then, welded steel floats, plastic handles that were transported to hall and aluminum components are assembled on the hydraulic press. Next to the hydraulic press, there is packing section where finished trowels are packed into boxes and secured with tape.
Figure 4 shows the structure of the product in question, while the photos in Figure 5 show the main stages of the production process in the factory.

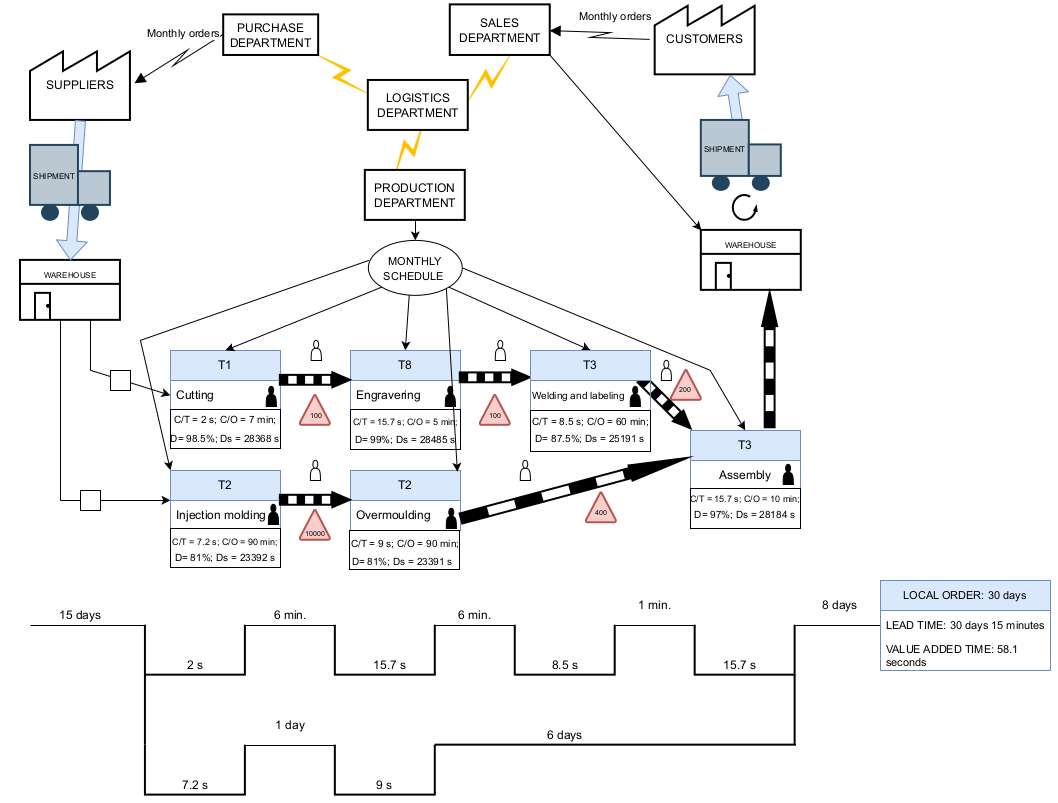
4.3. Mapping the Current State in the Plastering Trowel’s Manufacturing System

The next step is to draw the VSM, for which an understanding regarding the process sequence is a pre-requisite. Based on the gathered data, and after analyzing the production process, the map of the current state of the plastering trowel’s manufacturing process was made (Figure 6) and the legend of the map (Figure 7). The map represents all the operations that are performed in the analyzed enterprise during the process, their duration and also indicator values.
From Figure 6, it can be found that process implementation starts with a customer order. After the information flow between internal units, the production schedule is made. Here, future operations and material flow during the process are shown. For every operation there is a table with individual indicators where the following applies:
  • C/T is the operation time;
  • C/O is the changeover time;
  • D is the availability of the machine, including changeover time;
  • Ds is the available time of the machine.
The lead time of the local order is about 30 days and the value-added time is only 58.1 s for one trowel. It gives only 0.003% of value-added time in lead time.
It can be observed that the longest non-value-added time is the changeover time of the injection-molding unit. Other activities that are part of MUDA are excessive walking and moving around done by workers, sorting, taking inventory, transportation, waiting time and reworking goods.

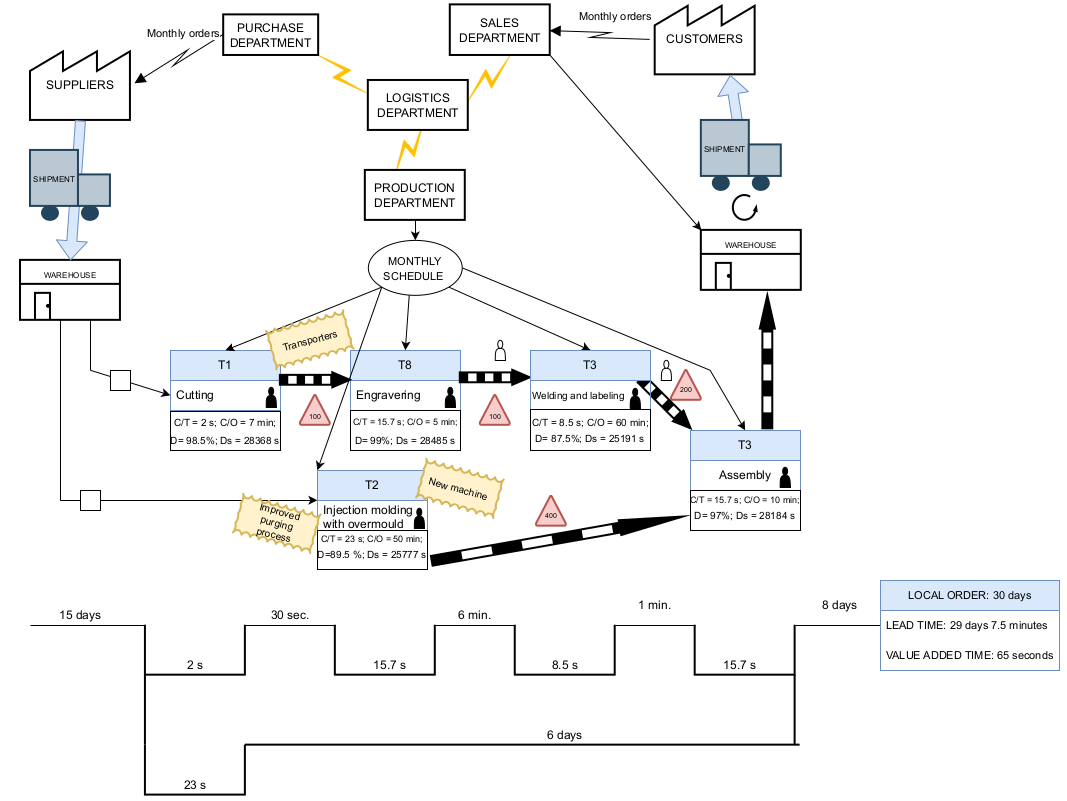
4.4. Future-State Map and Proposed Improvements

The future-state map (Figure 8) which was designed is based on the assumption that the issues in the problematic areas will be resolved. However, in practice, the entire problem may not be completely resolved. The areas that should be improved were signed with yellow labels.
Most of the improvements take place at the injection-molder station because it has the largest amount of the NVA activities.

4.4.1. Improvement 1—Automatic Transporter

Traditional automated guided vehicle (AGV) systems use fixed guide paths for vehicles. Tasks like motion planning and the allocation of tasks are done by a central entity, for all the AGV systems together. The threads of generic AGV work flow are shown in Figure 9.
During the shift time, after cutting the steel floats from the steel roll, the operator has to transport one pallet with the pallet jack to the engraving station. At that time, there has to be an operator that will look after the cutting line. It creates 12 min of non-value-added time for one working day with two shifts.
The improvement aims to shorten the transport time by purchasing the automatic transporter, which will transport the components without employee involvement. The time of transportation should take about 0.5 min. It creates 11 min of saved time for one working day with two shifts and also does not require additional work from the operator. The cost of the investment in automated guided vehicle is estimated to be around EUR 20,000.

4.4.2. Improvement 2—Injection Purging-Liquid Sachets

An idea to improve the injection-molding operation is to use purging-liquid sachets while changing the color of the component. This solution creates many benefits, for example reduction of planned breaks and material waste, and it also means that the extruder screw does not have to be disassembled. It refers to the handle core-injection-molding process and also the over molding of the cores. Color changing takes about 60 min of changeover time. Using the purging-liquid sachets can cut this time to 15 min with normal purging (Figure 10). There are two changeovers in the first shift and one for the second shift. As a result, for one machine 135 min are saved for one working day with this solution.
During the color-changing operation, the valuable raw material is used and after that has to be removed to scraps. Implementation of this improvement helps to reduce the level of material waste (Figure 11). The level of saved material would be about 7.5 kg of plastic for one color change with normal purging. As a result, for one machine that is 22.5 kg of plastic for one working day.
The cost of one purging sachet is EUR 7. There has to be two sachets used for one cleaning, so that is six sachets for a working day assuming that there will be three operations of color changing. This is an EUR 840 of additional cost for a month, but the benefits are promising.

4.4.3. Improvement 3—Two-Component Injection-Molder Machine

The current situation requires the use of two injection molders to produce the handles; moreover, two molds have to be used for this process. The issue is that the stocked plastic cores can undergo a secondary shrinkage, which will be discovered during the over-molding operation, when the flash of the material will be observed on the components. Then, all the defected cores have to be reworked, which causes time and money waste. Moreover, the quality of the reworked plastic is lower.
The idea of the third improvement is to replace the two-injection molders with one machine, which produces two-component material in one operation using two different plastics (Figure 12).
The process is based on two phases. In the first phase, the core material is injected into a mold and cooled to form a solid part. Then, the rotating platen is transferred to the core, to a second mold where the over mold of the second material can begin. At the same time, the next core is produced. The finished part is cooled and ejected from the mold [11].
This solution would reduce the level of inter operational stocks and defects which cause waste. Also, the core-drying time would be cut off. The estimated cost of the purchase would be about EUR 210,000 for the machine and EUR 10,500 for the two-component mold.
The proposed solution will allow about EUR 800 in savings for eliminating the inter operational stocks. The injection time will increase due to the polymer-core crosslinking, but the shrinkage of the material will be eliminated. Also, one day of core drying would be saved.

5. Key Performance Indicators (KPIs)

5.1. KPIs in Production Department

In the discussed enterprise, the calculated KPIs observed are employee performance, level of complaints, quantitative production indicator and also scrap level.
Table 2 shows calculations of KPIs. The employee performance is calculated for the injection-molder operator who is able to implement the setting and adjustments of the machine, but also works as a shop-floor worker.
The calculated data show that after purchasing the purging sachets, the employee performance is almost 10% higher than in the current state. It is due to a shorter time of adjustment of color changing. Saved time can be used for normative working hours.
The quantitative production indicators are based on forecasts from clients and especially on clients orders.
Table 3 shows that before introducing the improvements, the company managed to meet 87.6% of production forecasts, while after introducing the improvements it was 95.6%. The level was not reached in 100%, probably because some of the clients resigned from the purchase of ordered products.

5.2. KPIs in Quality Department

Table 4 contains data about the level of complaints from clients, where QI1 is the quality indicator for the number of complaints, QI2 is the quality indicator for the number of complained-about products. There is a comparison of before and after the improvement.
As it is observed, the level of the complaints increased by 321%. The reason for this situation is that the enterprise started to sell products using e-commerce for individual customers in 2022. By looking at the bigger picture, we can see that the actual number of complained-about products decreased by 90.3%. The conclusion is that there have to be many indicators observed to reach reliable data.
The next indicator that is observed in the company is the level of production scraps, where SI1 is the plastic scrap indicator; SI2 is the steel scrap indicator; and SI3 is the aluminum scrap indicator. Data include only utilized waste without reworked materials (Table 5).
It is noticed that the level of scraps of all materials has decreased from 2021 to 2022. The biggest change is observed for aluminum, where all the waste was eliminated. For plastics, the scrap level decreased by almost 47% and steel 22.6%. In the case of this indicator, the lower the better for the company.

6. Financial and Effectiveness Analysis of the Proposed Solutions

6.1. Purchase of Automatic Transporters

The time of transport that is currently intended is 240 min monthly. It can be reduced using the automated guided vehicle to 20 min monthly. The labor cost for the transport is about EUR 21 per month. A summary of the results is provided in Table 6. For the AGV, the energy value has to be taken into account.
This solution allows a saving of EUR 19 per month which is EUR 228 per year, and also one of the operators can be eliminated. Because of the high cost of the AGV, return from the investment would take a really long time, but this financial analysis is done just for one station. The AVG robot could be used for different stations in the production hall to produce more return.

6.2. Purchase of Injection Molding Improvements

The labor value is about EUR 6 for an hour. Due to the collected data, we assume that there are 9790 finished pieces of manufacturing monthly for that particular product. It requires EUR 3840 of labor value for a month for two operators. The cost of the raw materials for one handle is EUR 0.24, which is EUR 2349.6 per month. The energy cost for one injection molder is EUR 530 for a month, and in the current state the enterprise is using two of them. A summary of the results is provided in Table 7.
Before the improvement:
T C = R + M · N + E + I + S
K = T c N
where the following applies:
  • TC is total cost;
  • R is labor value;
  • M is cost of the raw material of finished product;
  • N is number of finished handles (monthly);
  • I is inter operational stock of cores value;
  • S is cost of the purging sachets;
  • K is component cost.
T C = 3840   EUR + 0.24   EUR · 9790   pcs + 1060   EUR + 800   EUR = 8049.6   EUR
K = 8049.6   EUR 9790   pcs = 0.82   EUR
After the improvement:
T C = 1920   EUR + 0.24   EUR · 11,160   pcs + 530   EUR + 840   EUR = 5968.4   EUR
K = 5968.4   EUR 11,160   pcs = 0.53   EUR
Return from the investment would take:
Return from the investment = 220,500   EUR 2081.2   EUR = 105.9   EUR 12   months = 8.83   years
The counted time of the investment return is satisfactory. The two-component injection molder can be used for totally different components in the factory due to a wide variety of products, but it entails the additional costs of new two-component molds.
Table 8 shows calculations of the overall equipment effectiveness (OEE) of the injection-molder station. Calculations were made for the time of 3 working days, due to the fact that when the mold is placed on the machine, the production runs continuously for two shifts a day until the required amount of components are made.
In the context of this case study, OEE is a measure of the efficiency of the performance of machines in a manufacturing plant. OEE is calculated on the basis of three main components:
  • Availability (OEE takes into account the time during which machines used in the analyzed company are available and ready for work. This includes planned downtime (e.g., breaks to change tools), unplanned downtime (e.g., breakdowns) machines) and machine start-up time (start-up time after a break);
  • Performance (performance refers to the efficiency of machinery while it is running. It determines how quickly a machine performs work compared to its theoretical or maximum efficiency);
  • Quality (refers to the number of products or products produced without errors in relation to the total number produced).
After the implementation of the improvement, the availability of the machine is almost 15% higher than at the current state. It is due to the fact that time for the adjustments and machine settings is shorter after the improvement. In both situations, machines are fully utilized and the performance indicator is at the level 100%. The company expects that in the current situation the number of defects cannot be higher than 5% of the manufactured components. We assume that after the improvement the level of non-compliances will reduce to 0, thanks to the repetitive process guaranteed by new machine.
The overall equipment effectiveness indicator would be 18.35% higher after implementation of the planned improvement. Furthermore, the number of produced components could be greater thanks to the additional time that was saved during changeover.

6.3. Electricity Consumption—Purchase of Injection-Molding Improvements

This stage focused on improvements related to electricity consumption. Data of the power consumption of the production process using two hydraulic injection-molding machines in the current situation is shown in Table 9.
Producers declare that the purchase of a two-component servo-electric injection-molding machine can reduce power consumption by 50–70%. Assuming that the saving would be 65%, the power consumption of one handle piece would be 1.47 kWh. In Table 10, there is a comparison of the current power consumption and that after the improvement.
After implementing the improvement, the company could save about 24,654 kWh per month which is about EUR 4438, where 1 kWh costs at the moment EUR 0.18 for producers in Poland. This would be about a EUR 53,253 in savings per year.

6.4. Machine Exploitation and Reliability

For calculations (Table 11), data on injection-molding machines were used. The exploitation and reliability of injection-molding machines was calculated before and after improvement, and it refers only to the plastering-trowel handles.
After implementing the improvement, the return of equity will be 161.2% higher than before. It means that financial effectiveness will be improved. Mean Time Between Failures will be longer for about 36.6 h after improvement which means that there will be less breakdowns and losses. The average time for repairs takes 2.3 h.

7. Conclusions

Companies will implement VSM with a view of achieving a competitive advantage and ensuring sustainable business development. The purpose of introducing the VSM tool in the studied company was to reduce waste and improve the quality and efficiency of the production process. In the first stage of the study, data collection and analysis of the production process, which was the subject of the case study, were carried out. This collected information allowed us to define the initial state of the process and identify critical points. A future state was then mapped which represented a sustainable production process with significant waste reduction. Additionally, a financial analysis was performed to estimate the expected profit from the proposed changes.
The purpose of the above paper was to demonstrate the usefulness of value-stream mapping in analyzing production processes and finding improvements in a plant producing hand tools. The main use of VSM was to shorten machine-changeover time and increase the quality and efficiency of the production process. In the first step, the company was analyzed. Based on the collected data, a map of the current state was developed. Once critical issues were identified, improvements were proposed and a future-state map was designed. In addition, a basic analysis of the financial profitability of the investment was made, emphasizing the benefits resulting from the proposed improvements. As a result of the improvements, the efficiency of injection-molding-machine workers could increase by almost 10%, and the overall equipment efficiency would increase by 18%. The machine availability rate also changed from 70.3% to 85.2%. After implementing the improvements, the company is able to save approximately 24,654 kWh per month, which is approximately EUR 4438, where 1 kWh currently costs producers in Poland EUR 0.18, and that is approximately EUR 53,253 in savings per year. One of the noted drawbacks of the VSM tool is its static nature. Using VSM, it is possible to capture only a specific moment of the production process in a production plant. This means that conditions in the company are dynamic and may change at any time, e.g., failures and delays may occur. Overall, using VSM can provide a comprehensive view of your production system and help you manage your most critical issues.
It is extremely important to continuously monitor the indicators indicated in the paper and to consistently use the VSM tool throughout the value chain and other processes in the company. Digital twins can continuously monitor the production process of hand tools used in construction. This involves creating digital copies of these tools, enabling real-time tracking of production processes. Digital twins will allow the monitoring of production parameters, diagnostics, performance analysis and process optimization. Thanks to the study of the collected data, it will be possible to forecast and plan production, increasing the efficiency of tool production. Additionally, digital twins will support production safety and facilitate collaboration between manufacturers and customers.
The implementation of the VSM tool described in this paper played a key role in reducing waste and increasing the productivity of the studied process, providing solid evidence of the potential of this lean tool.
The use of the VSM method requires a holistic approach to the production system, because even minor changes in this system can significantly affect the efficiency of processes.
The presented paper is of great importance both for researchers interested in the impact of lean thinking in production, as well as for decision-makers in companies and staff who would like to implement lean tools, especially VSM, in their activities.
The next stage of work will be implementing innovative tools that will contribute to improving the production process in the analyzed enterprise. Particular emphasis will be placed on effective management of company resources and environmental protection.

Author Contributions

Conceptualization, M.S. and K.P.; methodology, M.S., K.P., M.P. and A.K.; formal analysis, M.S. and K.P.; investigation, M.S. and K.P.; resources, M.S. and K.P.; data curation, M.S. and K.P.; writing—original draft preparation, M.S. and K.P.; writing—review and editing, M.S., K.P. and M.P.; visualization, M.S., K.P. and M.P.; supervision, M.S. and A.K. All authors have read and agreed to the published version of the manuscript.

Funding

This research received no external funding.

Acknowledgments

Behold bless ye the Lord.

Conflicts of Interest

The authors declare no conflict of interest.

References

  1. Hidalgo Martins, G.; Gechele Cleto, M. Value Stream Mapping and Earned Value Analysis: A Case Study in the Paper Packaging Industry in Brazil. Braz. J. Oper. Prod. Manag. 2016, 13, 360. [Google Scholar] [CrossRef]
  2. Rother, M.; Shook, J. Learning to See: Value-Stream Mapping to Create Value and Eliminate Muda; Version 1.5; 20th Anniversary Edition; Lean Enterprise Inst: Boston, MA, USA, 2018; ISBN 978-0-9667843-0-5. [Google Scholar]
  3. Monden, Y. Toyota Production System; Springer US: Boston, MA, USA, 1993; ISBN 978-1-4615-9716-2. [Google Scholar]
  4. Keyte, B.; Locher, D. The Complete Lean Enterprise: Value Stream Mapping for Administrative and Office Processes; Productivity Press: New York, NY, USA, 2004; ISBN 978-1-56327-301-8. [Google Scholar]
  5. Salwin, M.; Jacyna-Gołda, I.; Bańka, M.; Varanchuk, D.; Gavina, A. Using Value Stream Mapping to Eliminate Waste: A Case Study of a Steel Pipe Manufacturer. Energies 2021, 14, 3527. [Google Scholar] [CrossRef]
  6. Hoekstra, S.; Romme, J.; Argelo, S.M. (Eds.) Integral Logistic Structures: Developing Customer-Oriented Goods Flow; Industrial Press: New York, NY, USA, 1992; ISBN 978-0-8311-3037-4. [Google Scholar]
  7. Graban, M.; Swartz, J.E. Healthcare Kaizen: Engaging Front-Line Staff in Sustainable Continuous Improvements; Taylor & Francis/CRC Press: Boca Raton, FL, USA, 2012; ISBN 978-1-4398-7296-3. [Google Scholar]
  8. Bell, S.; Orzen, M.A. Lean IT: Enabling and Sustaining Your Lean Transformation; Productivity Press: Boca Raton, FL, USA, 2011; ISBN 978-1-4398-1756-8. [Google Scholar]
  9. Parthanadee, P.; Buddhakulsomsiri, J. Production Efficiency Improvement in Batch Production System Using Value Stream Mapping and Simulation: A Case Study of the Roasted and Ground Coffee Industry. Prod. Plan. Control 2014, 25, 425–446. [Google Scholar] [CrossRef]
  10. Andrade, P.F.; Pereira, V.G.; Del Conte, E.G. Value Stream Mapping and Lean Simulation: A Case Study in Automotive Company. Int. J. Adv. Manuf. Technol. 2016, 85, 547–555. [Google Scholar] [CrossRef]
  11. Jeong, B.K.; Yoon, T.E. Improving IT Process Management through Value Stream Mapping Approach: A Case Study. JISTEM 2016, 13, 525–540. [Google Scholar] [CrossRef]
  12. Salwin, M. Design of Product-Service Systems in Printing Industry. Ph.D. Thesis, Lappeenranta-Lahti University of Technology LUT, Lappeenranta, Finland, 2021. [Google Scholar]
  13. Salwin, M.; Kraslawski, A.; Lipiak, J.; Gołębiewski, D.; Andrzejewski, M. Product-Service System Business Model for Printing Houses. J. Clean. Prod. 2020, 274, 122939. [Google Scholar] [CrossRef]
  14. Salwin, M.; Kraslawski, A.; Andrzejewski, M.; Lipiak, J. Product-Service System for the Pharmaceutical Industry. In Smart and Sustainable Collaborative Networks 4.0; Camarinha-Matos, L.M., Boucher, X., Afsarmanesh, H., Eds.; IFIP Advances in Information and Communication Technology; Springer International Publishing: Cham, Switzerland, 2021; Volume 629, pp. 485–493. ISBN 978-3-030-85968-8. [Google Scholar]
  15. Salwin, M.; Kraslawski, A.; Andrzejewski, M.; Lipiak, J. Product-Service System for the Pharmaceutical Industry—A New Opportunity for Machine Manufacturers. In Advances in Manufacturing III; Gorski, F., Rychlik, M., Păcurar, R., Eds.; Lecture Notes in Mechanical Engineering; Springer International Publishing: Cham, Switzerland, 2022; pp. 120–135. ISBN 978-3-030-99768-7. [Google Scholar]
  16. Salwin, M.; Lipiak, J.; Kulesza, R. Product-Service System—A Literature Review. Res. Logist. Prod. 2019, 9, 5–14. [Google Scholar] [CrossRef]
  17. Bańka, M.; Kukurba, M.; Waszkiewicz, A. The Impact of the COVID-19 Pandemic on Start-Ups’ Collaboration with Corporations. Procedia Comput. Sci. 2022, 207, 1283–1292. [Google Scholar] [CrossRef]
  18. Ebner, N.; Iacovidou, E. The Challenges of COVID-19 Pandemic on Improving Plastic Waste Recycling Rates. Sustain. Prod. Consum. 2021, 28, 726–735. [Google Scholar] [CrossRef]
  19. Masłowski, D.; Kulińska, E.; Salwin, M.; Pawlas, K.; Kulińska-Jachowska, K. Impact of Policy Regulations on the Functioning of Hospitals in Poland during the COVID-19 Pandemic: A Qualitative Analysis. Int. J. Manag. Econ. 2022, 58, 192–217. [Google Scholar] [CrossRef]
  20. Value of the Hand Tool Market Worldwide 2017–2027. Available online: https://www.statista.com/statistics/476871/global-value-hand-tool-market/ (accessed on 10 September 2023).
  21. Biron, M. Industrial Applications of Renewable Plastics: Environmental, Technological, and Economic Advances; Elsevier: Boston, MA, USA, 2017; ISBN 978-0-323-48065-9. [Google Scholar]
  22. Bańka, M.; Salwin, M.; Kukurba, M.; Rychlik, S.; Kłos, J.; Sychowicz, M. Start-Up Accelerators and Their Impact on Sustainability: Literature Analysis and Case Studies from the Energy Sector. Sustainability 2022, 14, 13397. [Google Scholar] [CrossRef]
  23. Lipiak, J.; Salwin, M. The Improvement of Sustainability with Reference to the Printing Industry—Case Study. In Advances in Manufacturing II; Hamrol, A., Grabowska, M., Maletic, D., Woll, R., Eds.; Springer International Publishing: Cham, Switzerland, 2019; pp. 254–266. ISBN 978-3-030-17268-8. [Google Scholar]
  24. Plastics Europe. Closed-Loop Plastics. Analysis of the Situation in Europe. 2021. Available online: https://plasticseurope.org/pl/wp-content/uploads/sites/7/2021/11/Raport-Tworzywa-w-Obiegu-Zamknietym_do-pobrania.pdf (accessed on 10 September 2023).
  25. Van Oosterhout, L.; Dijkstra, H.; Borst, D.; Duijndam, S.; Rehdanz, K.; Van Beukering, P. Triggering Sustainable Plastics Consumption Behavior: Identifying Consumer Profiles across Europe and Designing Strategies to Engage Them. Sustain. Prod. Consum. 2023, 36, 148–160. [Google Scholar] [CrossRef]
  26. Waaijers-van Der Loop, S.; Van Bruggen, A.; Beijer, N.R.M.; Sips, A.; De Roda Husman, A.M.; Cassee, F.; Peijnenburg, W. Improved Science-Based Transformation Pathways for the Development of Safe and Sustainable Plastics. Environ. Int. 2022, 160, 107055. [Google Scholar] [CrossRef] [PubMed]
  27. Salwin, M.; Lipiak, J.; Wałachowski, P. Production Improvement by Using the SMED Method—Case Study. Res. Logist. Prod. 2019, 9, 137–152. [Google Scholar] [CrossRef]
  28. Marr, B. Key Performance Indicators: The 75 Measures Every Manager Needs to Know, 1st ed.; Always learning; Pearson: Harlow, UK; Munich, Germany, 2012; ISBN 978-0-273-75011-6. [Google Scholar]
  29. Kerzner, H. Project Management Metrics, KPIs, and Dashboards: A Guide to Measuring and Monitoring Project Performance, 4th ed.; Wiley: Hoboken, NJ, USA, 2023; ISBN 978-1-119-85155-4. [Google Scholar]
  30. De Ryck, M.; Versteyhe, M.; Debrouwere, F. Automated Guided Vehicle Systems, State-of-the-Art Control Algorithms and Techniques. J. Manuf. Syst. 2020, 54, 152–173. [Google Scholar] [CrossRef]
  31. Velimirović, D.; Velimirović, M.; Stanković, R. Role and Importance of Key Performance Indicators Measurement. Serbian J. Manag. 2011, 6, 63–72. [Google Scholar] [CrossRef]
  32. Bevilacqua, M.; Ciarapica, F.E.; Giacchetta, G. Value Stream Mapping in Project Management: A Case Study. Proj. Manag. J. 2008, 39, 110–124. [Google Scholar] [CrossRef]
  33. Haefner, B.; Kraemer, A.; Stauss, T.; Lanza, G. Quality Value Stream Mapping. Procedia CIRP 2014, 17, 254–259. [Google Scholar] [CrossRef]
  34. Grewal, C. An Initiative to Implement Lean Manufacturing Using Value Stream Mapping in a Small Company. IJMTM 2008, 15, 404. [Google Scholar] [CrossRef]
  35. Tapping, D.; Shuker, T. Value Stream Management for the Lean Office; Productivity Press: New York, NY, USA, 2018; ISBN 978-1-4822-7817-0. [Google Scholar]
  36. Klimecka-Tatar, D. Context of Production Engineering in Management Model of Value Stream Flow According to Manufacturing Industry. Prod. Eng. Arch. 2018, 21, 32–35. [Google Scholar] [CrossRef]
  37. Tabanli, R.M.; Ertay, T. Value Stream Mapping and Benefit–Cost Analysis Application for Value Visibility of a Pilot Project on RFID Investment Integrated to a Manual Production Control System—A Case Study. Int. J. Adv. Manuf. Technol. 2013, 66, 987–1002. [Google Scholar] [CrossRef]
  38. Teichgräber, U.K.; De Bucourt, M. Applying Value Stream Mapping Techniques to Eliminate Non-Value-Added Waste for the Procurement of Endovascular Stents. Eur. J. Radiol. 2012, 81, e47–e52. [Google Scholar] [CrossRef] [PubMed]
  39. Stadnicka, D.; Litwin, P. Value Stream Mapping and System Dynamics Integration for Manufacturing Line Modelling and Analysis. Int. J. Prod. Econ. 2019, 208, 400–411. [Google Scholar] [CrossRef]
  40. Ruiz-de-Arbulo-Lopez, P.; Fortuny-Santos, J.; Cuatrecasas-Arbós, L. Lean Manufacturing: Costing the Value Stream. Ind. Manag. Data Syst. 2013, 113, 647–668. [Google Scholar] [CrossRef]
  41. Womack, J.P.; Jones, D.T. Lean Thinking: Banish Waste and Create Wealth in Your Corporation; Rev. and updated, 1. paperback ed.; Simon & Schuster: London, UK, 2003; ISBN 978-0-7432-3164-0. [Google Scholar]
  42. Paredes-Rodríguez, A.M. Aplicación de La Herramienta Value Stream Mapping a Una Empresa Embaladora de Productos de Vidrio. Entramado 2017, 13, 262–277. [Google Scholar] [CrossRef]
  43. Braglia, M.; Carmignani, G.; Zammori, F. A New Value Stream Mapping Approach for Complex Production Systems. Int. J. Prod. Res. 2006, 44, 3929–3952. [Google Scholar] [CrossRef]
  44. Manos, T. Value Stream Mapping an Introduction. Qual. Prog. 2006, 39, 64–69. [Google Scholar]
  45. Serrano Lasa, I.; Ochoa Laburu, C.; De Castro Vila, R. An Evaluation of the Value Stream Mapping Tool. Bus. Process Manag. J. 2008, 14, 39–52. [Google Scholar] [CrossRef]
  46. Das, A.K.; Das, M.C. Productivity Improvement Using Different Lean Approaches in Small and Medium Enterprises (SMEs). Manag. Sci. Lett. 2023, 13, 51–64. [Google Scholar] [CrossRef]
  47. Sekaninová, M. Value Stream Mapping in Advanced Management Systems. IJEK 2022, 10, 68–79. [Google Scholar] [CrossRef]
  48. Shamsu Anuar, M.A.; Mansor, M.A. Application of Value Stream Mapping in the Automotive Industry: A Case Study. JMMST 2022, 6, 34–41. [Google Scholar] [CrossRef]
  49. Zahraee, S.M.; Esrafilian, R.; Kardan, R.; Shiwakoti, N.; Stasinopoulos, P. Lean Construction Analysis of Concrete Pouring Process Using Value Stream Mapping and Arena Based Simulation Model. Mater. Today Proc. 2021, 42, 1279–1286. [Google Scholar] [CrossRef]
  50. Mangers, J.; Minoufekr, M.; Plapper, P. Value Stream Mapping (VSM) to Evaluate and Visualize Interrelated Process-Chains Regarding Circular Economy. In Advances in Production Management Systems. Artificial Intelligence for Sustainable and Resilient Production Systems; Dolgui, A., Bernard, A., Lemoine, D., Von Cieminski, G., Romero, D., Eds.; IFIP Advances in Information and Communication Technology; Springer International Publishing: Cham, Switzerland, 2021; Volume 633, pp. 534–542. ISBN 978-3-030-85909-1. [Google Scholar]
  51. Dadashnejad, A.-A.; Valmohammadi, C. Investigating the Effect of Value Stream Mapping on Overall Equipment Effectiveness: A Case Study. Total Qual. Manag. Bus. Excell. 2019, 30, 466–482. [Google Scholar] [CrossRef]
  52. Cardoso, W. Value Stream Mapping as Lean Healthcare’s Tool to See Wastes and Improvement Points: The Case of the Emergency Care of a University Hospital. J. Innov. Healthc. Manag. 2019, 2, 360–380. [Google Scholar] [CrossRef]
  53. Deshkar, A.; Kamle, S.; Giri, J.; Korde, V. Design and Evaluation of a Lean Manufacturing Framework Using Value Stream Mapping (VSM) for a Plastic Bag Manufacturing Unit. Mater. Today Proc. 2018, 5, 7668–7677. [Google Scholar] [CrossRef]
  54. Huang, Y.; Tomizuka, M. Production Flow Analysis through Environmental Value Stream Mapping: A Case Study of Cover Glass Manufacturing Facility. Procedia CIRP 2017, 61, 446–450. [Google Scholar] [CrossRef]
  55. Li, W.; Thiede, S.; Kara, S.; Herrmann, C. A Generic Sankey Tool for Evaluating Energy Value Stream in Manufacturing Systems. Procedia CIRP 2017, 61, 475–480. [Google Scholar] [CrossRef]
  56. Lacerda, A.P.; Xambre, A.R.; Alvelos, H.M. Applying Value Stream Mapping to Eliminate Waste: A Case Study of an Original Equipment Manufacturer for the Automotive Industry. Int. J. Prod. Res. 2016, 54, 1708–1720. [Google Scholar] [CrossRef]
  57. Rohac, T.; Januska, M. Value Stream Mapping Demonstration on Real Case Study. Procedia Eng. 2015, 100, 520–529. [Google Scholar] [CrossRef]
  58. Rosenbaum, S.; Toledo, M.; González, V. Improving Environmental and Production Performance in Construction Projects Using Value-Stream Mapping: Case Study. J. Constr. Eng. Manag. 2014, 140, 04013045. [Google Scholar] [CrossRef]
  59. Erikshammar, J.; Lu, W.; Stehn, L.; Olofsson, T. Discrete Event Simulation Enhanced Value Stream Mapping: An Industrialized Construction Case Study. Lean Constr. J. 2013, 10, 47–65. [Google Scholar]
  60. Luna, L.B.; Klökner, P.E.D.; Ferreira, J.C.E. Applying Value Stream Mapping to Identify and Evaluate Waste in a Company of the Ceramic Sector. In Advances in Sustainable and Competitive Manufacturing Systems; Azevedo, A., Ed.; Lecture Notes in Mechanical Engineering; Springer International Publishing: Heidelberg, Germany, 2013; pp. 1515–1525. ISBN 978-3-319-00556-0. [Google Scholar]
  61. Gurumurthy, A.; Kodali, R. Design of Lean Manufacturing Systems Using Value Stream Mapping with Simulation: A Case Study. J. Manuf. Technol. Manag. 2011, 22, 444–473. [Google Scholar] [CrossRef]
  62. Rahani, A.R.; al-Ashraf, M. Production Flow Analysis through Value Stream Mapping: A Lean Manufacturing Process Case Study. Procedia Eng. 2012, 41, 1727–1734. [Google Scholar] [CrossRef]
  63. Chen, J.C.; Li, Y.; Shady, B.D. From Value Stream Mapping toward a Lean/Sigma Continuous Improvement Process: An Industrial Case Study. Int. J. Prod. Res. 2010, 48, 1069–1086. [Google Scholar] [CrossRef]
  64. Venkataraman, K.; Ramnath, B.V.; Kumar, V.M.; Elanchezhian, C. Application of Value Stream Mapping for Reduction of Cycle Time in a Machining Process. Procedia Mater. Sci. 2014, 6, 1187–1196. [Google Scholar] [CrossRef]
Figure 1. Value of the global industrial-hand-tool market and global hand-tool market from 2017 to 2027 [20].
Energies 16 07292 g001
Figure 2. Steps of the implementation of value-stream mapping.
Energies 16 07292 g002
Figure 3. Flow chart of the production process in the analyzed enterprise.
Energies 16 07292 g003
Figure 4. Structure of discussed plastering trowel (1: Product components. 2: Front view of the product. 3: Top view of the product. 4: Side view of the product).
Energies 16 07292 g004
Figure 5. Illustration of the production-process steps based on the plastering trowel (1: Cutting process of stainless steel in a particular dimension. 2: Engraving of customer’s logo. 3: Pins-welding process with labeling. 4: Injection molding. 5: Assembly of the components. 6: Section for packing near to the assembly press).
Energies 16 07292 g005
Figure 6. Map of the current state.
Energies 16 07292 g006
Figure 7. Legend of the map.
Energies 16 07292 g007
Figure 8. Map of the future state.
Energies 16 07292 g008
Figure 9. Threads of generic AGV work flow [9].
Energies 16 07292 g009
Figure 10. Machine downtime with and without purging sachets during the cleaning and color changing [10].
Energies 16 07292 g010
Figure 11. Material wastage during the injection-molding process with and without purging sachets [10].
Energies 16 07292 g011
Figure 12. Process of two-component injection molding ((a): Two-component detail. (b): Core injection and overmoulding of the core of the detail. (c): Removal of the finished part by the robot. (d): Head rotation. (e): End of the injection process) [11].
Energies 16 07292 g012
Table 1. Twenty-five examples of applications and results obtained from VSM.
NoIndustryDescriptionReferences
1.Foundry—rail trolley.NVA time was reduced from 107 min to 56 min, and foundry turnaround time was reduced from 208 min to 157 min, allowing customers to be met on time.[46]
2.Analysis of the assembly process of a turbomolecular pump representing an axial turbine in which rotating blades ensure gas compression in the direction of pumping.Reduction of the process-execution time by 26% from 1380 min to 1020 min.[47]
3.Production and assembly of various types of motorcycles and scooters.There was an improvement, respectively: lead time from 497 h to 164.03 h (67% reduction) and non-added-value time from 437 h to 113.8 h (74% reduction).[48]
4.Steel tubes of various dimensions for upholstered furniture.Productivity rates on the slitting line can improve by 17%, and the waste of polypropylene strapping should be reduced by 1.7 times. Change of availability index on the slitting line from 67% to 79%.[5]
5.A concrete construction project that is underway consisting of two stories, each requiring 420 m3 of concrete to be placed in accordance with the design specifications. The operation is carried out in two phases: concreting slabs and beams and concreting walls and columns.Reduction of concrete pumping-cycle time from 8.5 min to 6 min. Reducing the cycle time of the vibrating and finishing processes by approximately 35% and 20%, respectively. Ultimately, adding two trucks to the entire process leads to a production-lead-time reduction of nearly 35%. Lead time shortened from 11 to 7 days, value-added time decreased from 38.2 min to 22.5 min. The tact time has also been reduced from 138 s to 93 s.[49]
6.Plastic products.Lead time was shortened from 11.6 h to 0.96 h. The CO2 equivalent was reduced from 48.1 kgCO2-eq/fu to 16.9 kgCO2-eq/fu. Energy consumption has been reduced from 174.9 kWh/fu to 47.50 kWh/fu.[50]
7.Production.Elimination of problems related to delivery delays, machine failures and the quality of finished products.[39]
8.Production of various models of ball valves for gas.Improvement of the OEE index from 76% to 83%.[51]
9.Mapping the flow of values in the emergency services of a university hospital.Lead time of production has been reduced from 5.31 h to 5.12 h. Processing time has been reduced from s = 4.36 h to 4.26 h.[52]
10.Production of plastic bags.Reduction of TAKT time from 46 min to 26.6 min. The number of rolls produced per day increased from 28 to 50. The implementation of the lean manufacturing framework increased the value-added time by 74.5% (from 15% to 89.85%). Non-value-added time reduced from 55% to 9.54%. Cycle time reduced from 12 min to 10 min.[53]
11.Cover glass—flat glass for smartphones and electronics.Operator’s walking time reduced by 33%. The time a product spends from the receiving dock to shipping dock reduced by 27%. CO2 reduction can be reduced from 8.5 kgCO2eq per head to 4.6 kgCO2eq per head, a reduction of approximately 46%.[54]
12.Aluminum recycling.Reduction of machine failures and reduction of gas consumption.[55]
13.Production of simple fold paper bags.Lead time has been reduced from 33 days to 12 days. Processing time has been reduced from 11.85 s to 2.85 s.[1]
14.Providing IT services—support and database management.The total lead time has been reduced from 20 days to 3 days, which means a 92% reduction in the total time of the database provisioning process. Lead time at the planning stage was reduced by 89.7% (from 20 days 130 min to 2 days 95 min), at the implementation stage by 96.2% (from 8 days to 505 min 445 min), and at the quality control and by almost 98% (from 3 days 120 min to 80 min).[11]
15.Car parts—15 plastic parts used in the interior of luxury cars.The cycle time in the assembly sub-process was reduced from 370 to 140 s; the number of operators was reduced from four to three; and the stock level of the semi-finished product was reduced by 25%.[56]
16.Car parts clutch disc assembly process.Shortened lead time from 60.5 to 4.14 days. Simulations were carried out using current and future states to support suggested improvements and verified a 7% reduction in total production time as well as a 10% increase in job occupancy.[10]
17.Plastic products dedicated to the medical industry.Total lead time reduced from 296.36 days to 96.00 days.[57]
18.Construction of a medical center.Reducing the cycle time from 62 min/m2 to 39 min/m2.[58]
19.Production process in a roasted and ground coffee plant.Reducing the total cycle time from 92.59 min to 69.40 min.[9]
20.Production of windows, patio doors and other components for industrialized builders of single-family houses.Mean-cycle-time reduction from 345.65 h to 246.75 h. Reduction of the average WIP index from 98.76 to 23.05.[59]
21.Red ceramics.Lead-time reduction from 36.7 days to 11.34 days and value-added time from 83.5 min/thousand bricks to 77.4 min/thousand bricks.[60]
22.PVC doors and windows.VA time shortened from 63.36 min to 42.72 min. Production lead time shortened from 37.87 days to 12.68 days. Increasing the daily demand from 40 to 60 windows and from 160 to 240 squares.[61]
23.Automotive engine components.The overall reduction in man time was 15.99 s or 16.9%, while machine time was reduced to 299,832 s or 14.17%.[62]
24.Manufacture of electrical devices.The plasma-cutting process has been improved and the cycle time has been reduced from 47 min to 30 min. The cycle time in the manufacturing stage is reduced to 128.5 min.[63]
25.Crankshaft production system in car-manufacturing plant.Production lead-time reduction from 1,644,300 s to 251,100 s and value-added time from 9627 s to 2933 s.[64]
Table 2. Key performance indicator—employee performance indicator (production indicator).
LabelDescriptionBefore the ImprovementAfter the Improvement
A.Working time40 h40 h
B.Non-normative working time16.04 h12.29 h
C.Setting and adjustment time in non-normative working time11.87 h8.12 h
D.Employee performance EP = ((A − B)·100/A)59.9%69.3%
Table 3. Key performance indicator—quantitative production indicator (production indicator).
LabelDescriptionBefore the ImprovementAfter the Improvement
A.Planned production25,000 pcs25,000 pcs
B.Actual production21,900 pcs23,900 pcs
C.Quantitative production indicator WI = ((B/A)·100)87.6%95.6%
Table 4. Key performance indicator—level of complaints and number of complained-about products (quality indicator).
LabelDescriptionBefore the ImprovementAfter the Improvement
A.Number of complaints19 pcs80
B.Number of complained-about products8185 pcs795 pcs
QI1.Comparison of number of complaints321% higher after the improvement
QI2.Comparison of number of complained-about products90.3% lower after the improvement
Table 5. Key performance indicator—level of production scraps (without being reworked) (environmental indicator).
LabelKind of ScrapBefore the ImprovementAfter the Improvement
A.Plastics5200 kg2770 kg
B.Steel18,920 kg14,650 kg
C.Aluminum1326 kg0 kg
SI1.Plastic-scrap comparison46.73% lower after the improvement
SI2.Steel-scrap comparison22.57% lower after the improvement
SI3.Aluminum-scrap comparison100% lower after the improvement
Table 6. Situation before and after implementation of the improvement.
LabelDescriptionBefore the ImprovementAfter the Improvement
A.Time of the transport (monthly)240 min20 min
B.Labor valueEUR 21 EUR 0
C.Number of operators10
D.Energy costEUR 0EUR 2
E.Monthly differenceEUR 19
Table 7. Situation before and after the implementation of the improvements.
LabelDescriptionBefore the ImprovementAfter the Improvement
RLabor valueEUR 3840 EUR 1920
MCost of the raw material of finished productsEUR 0.24 EUR 0.24
NNumber of finished handles (monthly)9790 pcs11,160 pcs (improvement allows production of 1370 more pcs)
IInter operational stock of cores valueEUR 1060 EUR 530
SCost of the purging sachetsEUR 800 EUR 840
TCTotal costEUR 8049.6 EUR 5968.4
KComponent costEUR 0.82 EUR 0.53
Number of machines21
Number of operators21
Monthly differenceEUR 2081.2
Table 8. Overall equipment effectiveness (OEE)—calculations.
Lean MetricsBefore the ImprovementAfter the Improvement
LabelAvailabilityMinutesMinutes
TzTotal working time28802880
TppPlanned brakes150150
TpzSetting and adjustments810405
TpnpUnplanned interruptions00
TawBreakdowns00
TwEffective working time (Tz − (Tpp + Tpz))19202325
TtopPlanned production time (Tz − Tpp)27302730
TtopPlanned production time (Ttop·100/Tz) in %94.79%94.79%
TdAvailability (Ttop − Tpz)19202325
WWaste (Ttop − Td)810405
TdAvailability in % (Td·100/Ttop)70.33%85.16%
Performance
PdProduct details (good and bad)6400 pcs8835 pcs
P1Maximum performance on machine200 pcs/h228 pcs/h
P2Actual machine performance (Pd/Tw)3.333.80
PPerformance (P2·60/P1) in %100%100%
Quality
NdNumber of defects320 pcs0 pcs
QQuality ((Pd − Nd)/Pd·100)95%100%
Overall equipment effectiveness
EOEE (E = Td·P·Q)66.81%85.16%
Table 9. Power consumption in current situation.
Measurement No.Injection MoldingOver MoldingSum
1.1.86 kWh2.33 kWh4.19 kWh
2.1.81 kWh2.27 kWh4.08 kWh
3.1.83 kWh2.30 kWh4.13 kWh
4.1.95 kWh2.45 kWh4.40 kWh
5.1.92 kWh2.41 kWh4.33 kWh
6.1.87 kWh2.35 kWh4.22 kWh
7.1.90 kWh2.38 kWh4.28 kWh
8.1.79 kWh2.25 kWh4.04 kWh
9.1.83 kWh2.29 kWh4.12 kWh
10.1.82 kWh2.29 kWh4.11 kWh
Average1.86 kWh2.33 kWh4.19 kWh
Table 10. Power-consumption comparison before and after the improvement.
LabelDescriptionBefore the ImprovementAfter the Improvement
A.Number of pcs (monthly)9790 pcs11,160 pcs
B.Power consumption (monthly)41,020.1 kWh16,366.1 kWh
C.Energy saving per month24,654 kWh
D.Financial saving per monthEUR 4437.73
Table 11. Injection-molding machines exploitation and reliability.
LabelInjection MoldingBefore the ImprovementAfter the Improvement
A.Total working time49 h/month49 h/month
B.Downtime16 h/month9.25 h/month
C.Produced details9790 pcs11,160 pcs
D.Breakdowns quantity3 per month1 per month
E.Machine exploitation costsEUR 7500 EUR 3200
F.Income from sold handlesEUR 7600 EUR 8400
G.ROE (Return of Equity)1.3%162.5%
H.OEE66.81%85.16%
I.MTBF (Mean Time Between Failures)21.7 h58.25 h
J.MTTR (Mean Time To Repair)2.3 h-
Disclaimer/Publisher’s Note: The statements, opinions and data contained in all publications are solely those of the individual author(s) and contributor(s) and not of MDPI and/or the editor(s). MDPI and/or the editor(s) disclaim responsibility for any injury to people or property resulting from any ideas, methods, instructions or products referred to in the content.

