Article

Assessing the Impact of Shallow Renovation on Energy Poverty: A Primary Data Study

by
Roberto Barrella
1,2,*,
José Carlos Romero
1,2,*,
Almudena Laguillo
1,3 and
Ester Sevilla
1,3
1
Chair of Energy and Poverty, ICAI School of Engineering, Comillas Pontifical University, Alberto Aguilera, 25, 28015 Madrid, Spain
2
Institute for Research in Technology (IIT), ICAI School of Engineering, Comillas Pontifical University, Alberto Aguilera, 25, 28015 Madrid, Spain
3
Naturgy Foundation, Avenida de América, 38, 28028 Madrid, Spain
*
Authors to whom correspondence should be addressed.
Energies 2023, 16(21), 7237; https://doi.org/10.3390/en16217237
Submission received: 19 September 2023 / Revised: 19 October 2023 / Accepted: 20 October 2023 / Published: 24 October 2023

Abstract

:
One of the main identified causes of energy poverty (EP) is the low energy efficiency of housing. In this line, since 2018, public administrations and NGOs collaborating with the Naturgy Foundation’s Energy Renovation Solidarity Fund have implemented several shallow renovation interventions in 3660 Spanish vulnerable households. However, the effects of these measures on domestic energy affordability were not evaluated before because of a lack of a proper method. This paper presents a methodology to objectively assess the impact of these interventions on EP. In particular, this work proposes calculating a hidden EP indicator using data from a primary survey and applies it to a local case study (54 vulnerable households in Catalonia—10% of dwellings renovated by the Fund in the region) by processing their characteristics and energy bills before and after the implementation of the interventions. Considering the whole sample of households analysed, the hidden EP indicator drops by 10% in absolute terms (11.2% in relative terms) after the retrofit, and the average EP gap goes from 423 €/year to 313 €/year, thus marking a significant positive effect of the analysed interventions on the EP situation of this population. Eventually, extrapolating the results to the vulnerable population in Spain, this paper points out a series of recommendations that could be useful for decision-makers and organisations when designing and implementing shallow renovation interventions.

1. Introduction

One of the main determinants of energy poverty (EP) in developed countries is the low energy efficiency of residential buildings. Vulnerable households often live in old and very energy-inefficient dwellings [1]. This issue is even more significant in Mediterranean countries, such as Portugal and Spain [2]. In fact, according to the Spanish Household Budget Survey, in 2019, 72% of Spanish households belonging to the five lowest income deciles lived in buildings constructed more than 25 years ago. The low-income level of these households weakens their ability to undertake renovations to their homes, particularly those that could improve their energy efficiency, i.e., those commonly classified as energy retrofitting interventions. Moreover, according to the above-mentioned survey, 23% of the lowest-income households live in rented accommodation, compared to 13% of the highest-income households [3]. This fact is often an additional barrier towards improving the energy quality of their dwellings. Indeed, if the tenure regime is renting, the paradox arises from financing the interventions by the owner, who does not live in the property and could even raise the rent by having a more efficient dwelling (cfr. landlord/tenant dilemma [4]).
According to the latest available data for 2021, EP had different incidence in Spain depending on the indicator under consideration. According to [5], while the indicators measuring disproportionate expenditure and arrears on utility bills have improved slightly, the hidden energy poverty (HEP) and the inadequate household temperature indicators have worsened significantly. The year 2021 marked the definitive return to normality in the EU countries after the COVID-19 pandemic, but this came with the rise in energy prices in the year’s second half. This rise significantly impacted European consumers, especially vulnerable ones, and required additional regulatory measures by the government [6].
The abovementioned measures are temporary short-term (re)actions to mitigate EP, but they do not tackle the main structural determinant of EP, i.e., the low energy efficiency of housing. Thus, to reduce energy consumption and, consequently, cut the energy expenditure of vulnerable households, two main types of structural interventions can be carried out: active and passive measures. The former are applied to the active systems of the dwelling/building, such as heating equipment. The latter aim to improve the thermal performance of the building envelope.
These issues have been described in depth in the Spanish National Strategy against EP 2019–2024 (ENPE), which highlights the improvement of energy efficiency in housing as the key tool to structurally fight EP in Spain. Focusing on efficiency measures, the ENPE proposes the implementation of three types of interventions:
-
Short-term measures: low-cost “express energy retrofitting” of dwellings (shallow renovation).
-
Medium-term measures: replacement of household equipment and promotion of affordable social housing.
-
Long-term measures: deep retrofitting of buildings.
On the other hand, the 2020 update of the Long-term Strategy for Energy Retrofitting in the Spanish Building Sector (ERESEE) established a specific plan to combat EP through energy efficiency interventions. However, neither the ENPE 2019–2024 nor the ERESEE 2020 propose an assessment of the ‘real impact’ of these measures on household expenditures and EP.
In the private sector, several NGOs have carried out micro-intervention campaigns (lighting energy savings and passive micro-measures) to improve the energy efficiency of dwellings (“micro-efficiency”), often financed by energy companies. However, given their limited scope, they are not usually included in the express energy retrofitting measures mentioned in the ENPE. Indeed, micro-efficiency measures are not included in the definition of ‘express energy retrofitting’ proposed in the first report by Naturgy Foundation [7], so they will be considered as another class of shallow renovation interventions. The exception is the installation of weather stripping on windows, which is usually included in the ‘express energy retrofitting’ measures.
The study that mentioned for the first time the aforementioned kind of shallow renovation measures for vulnerable households and analysed in depth the category of “express energy retrofitting” interventions (later included in the Strategy) is the report funded by Naturgy Foundation in 2017 [7], subsequently updated in 2022 [8]. That work proposed the “express energy retrofitting” as a series of low-cost measures that can be applied to the thermal envelope (passive measures) of vulnerable households with people living in the dwelling during its renovation. The authors calculated the energy savings resulting from the application of the low-cost retrofit in a three-storey model building. The calculation, based on the adaptive comfort criterion [9], was carried out in four Spanish cities (Barcelona, La Coruña, Madrid and Seville). Eventually, these studies showed that even a modest investment in the energy efficiency of dwellings (approx. EUR 4500 in 2017, updated to between EUR 5600 and EUR 8000 in 2022) can lead to considerable energy demand savings. A previous report published in 2012 by the Environmental Sciences Association (ACA) [10] pointed out additional benefits of energy retrofitting of buildings in Spanish households: (1) it reduces greenhouse gas emissions; (2) it generates employment in the construction sector; (3) it improves the quality of the indoor environment, reducing the exposure of household members to chronic diseases.
On the other hand, examples of active measures are the replacement of Heating, Ventilation and Air Conditioning (HVAC) equipment or the installation of self-consumption micro-grids. For instance, replacing old boilers with modern condensing boilers is one of the easiest measures to implement if façade flue gas discharge is chosen [11]. However, in buildings where multiple housing units are connected to the same chimney, if façade flue gas discharge is not allowed, this measure would require the consent of all tenants, thus making it more complicated to implement. However, in Spain, façade flue gas discharge is allowed in existing builds, which are the focus of this paper. The technical guides published by the Institute for Energy Diversification and Saving (IDAE) [12] allow the calculation of energy savings due to the replacement of HVAC and/or Domestic Hot Water (DHW) equipment.
Both types of measures (active and passive) have been applied to the Spanish residential sector. However, the biggest barriers faced by low-income households when opting for energy refurbishment are, on the one hand, the lack of financial resources to make the investment and, on the other hand, the complex bureaucracy related to the application for subsidies. In this regard, since the year after the publication of the first report financed by Naturgy Foundation [7], local public administrations and Third Sector entities that collaborate with the Energy Renovation Solidarity Fund [13] of the aforementioned foundation have been implementing both the passive measures proposed in the study (classified into walls, roofs, carpentry and glazing and solar protection) and other types of interventions. In particular, they have also implemented active measures (for example, changing boilers or electrical appliances) and micro-energy efficiency measures (for example, changing light bulbs).
In 2022, Naturgy Foundation published a first analysis of the benefits of express energy retrofitting in vulnerable households and the contributions of the social entities that collaborate with the Fund [14]. This report highlighted that establishing clear objectives and simple and unbureaucratised procedures had made it possible to carry out 3005. By May 2022, the number of retrofitted dwellings reached 3660 interventions implemented in the first four years of the programme. However, as has been the case in most of the interventions carried out in other Spanish programmes, very little work has been done on quantifying the impact of energy refurbishment on the household economy of the beneficiary households and, in particular, on their EP situation. A later study [15] analysed which practical and simple measures of express energy retrofitting can be applied to households in the municipality of Valencia, generating an impact on EP. In particular, the authors of that report used data from households that participated in the 2016 EP Map [16] to model typical dwellings in an official building energy modelling tool. Finally, they analysed how different interventions affect and what results are derived from them, providing recommendations to improve the quality of life of vulnerable households through energy saving and efficiency measures. Another theoretical study [17] analyses the effect of alternative retrofit strategies on the affordability of thermal services in vulnerable Spanish households. This assessment considers their impact on winter and summer EP and includes an integrated “social cost” and cost–benefit analysis. A statistical approach to this issue was presented by [18], which points out energy retrofitting priorities for vulnerable households in the Autonomous Region of Madrid by using the EU-SILC and HBS data, focusing on the needs of the different groups and taking into account their housing stock features. However, the abovementioned studies do not analyse the impact of energy retrofitting in real cases, i.e., systematically studying the ‘energy situation’ before and after the intervention of a sample of vulnerable households benefiting from such measures. In the same line, studies on EP in Spain—either national [19] or regional/local ones [20,21]—are usually based on official statistics, which usually lack specific data to perform a proper EP assessment. On the other hand, [22] presents a study based on a field survey and analyses more than 700 homes from collective social housing buildings in the south of Spain, thus harvesting primary data and showing a clear stratification of energy consumption habits and ownership of electrical appliances and thermal systems.
In all the studies cited above, the impact of shallow renovation is theoretically or statistically assessed, or energy-related practices are investigated by analysing the results of a field survey. Eventually, the authors of the mentioned studies highlight the limitations of a purely theoretical approach or one based on unspecific surveys, and they call for the need to measure the ‘real effects’ of energy retrofitting, thus pointing out the scarcity of knowledge and data on this subject, particularly in relation to their impact on EP.
To fill that gap, this paper proposes a methodology to measure the objective impact of shallow renovation interventions on EP. In particular, this methodology estimates the effects of such measures on households’ required and actual energy consumption and their impact on hidden energy poverty (HEP). The latter is the major strength of the proposed approach for two main reasons. First, the ‘conceptualization of hidden energy poverty represents a significant improvement in the scope of fuel poverty research’ for its explicit campaign to foster ‘energy sufficiency considerations (i.e., adequate and complete fulfilment of energy needs)’ [23]. Second, the studies that analysed this underconsumption issue have often estimated both the extent and the depth of energy poverty [24,25] in the considered household sample. The former-mentioned aspect of the HEP methodology makes it possible to complement the traditional ‘measured energy poverty’ approach [24], while the latter allows scholars and stakeholders to go beyond the binary identification of EP. On the other hand, estimating required energy expenditure is not an easy task, so the holistic bottom-up methodology presented in [25] is selected for this purpose. Therefore, in this paper, this metric is applied to a sample of vulnerable households living in Catalonia, this being the preferred territory of action of the social entities collaborating on this study within the framework of the Naturgy Foundation Fund. This application is in line with the current European EP research focus, the local studies being the greatest research challenge proposed by the European EP Advisory Hub (EPAH) [26,27].
In particular, Section 2 presents the methodology of the two main steps of this EP impact assessment. The first is the characterisation of the households benefiting from shallow renovation, which was carried out in this study using data from a primary survey of 54 vulnerable households living in Catalonia. The second one estimates the reduction in energy consumption generated by the measures included in the Fund and presents the methodology of the proposed EP impact measurement. This evaluation is based on the characteristics of the households described in the first step and on electricity and gas bills before and after the shallow renovations, comparing the actual expenditure with the required energy expenditure (RENE) of the household [25]—and the theoretical savings with the real savings. Subsequently, the calculation of an indicator of hidden EP (HEP) is presented to measure the objective impact of retrofitting on energy vulnerability. This metric was selected for this case study for the reasons mentioned in the previous paragraph and because ‘under-expenditure due to lack of affordability’ is the most pressing dimension of EP at the national level and in Catalonia [5]. Subsequently, Section 3 presents and discusses the results obtained for the local case study. Finally, Section 4 highlights the main conclusions of the paper and proposes some recommendations for decision-makers and future measurements of the impact of retrofitting on vulnerable households.

2. Materials and Methods

2.1. Characterisation of the Households’ Sample in the Local Case Study

This section presents the sample characterisation methodology and its application to data from the primary survey performed by the collaborating entities to the selected 54 households benefiting from the Naturgy fund’s shallow renovation in Catalonia between 2020 and 2023. The number of samples was conditioned by the complex work of collecting such detailed data from a primary survey together with energy bills. The latter kind of information was of extreme importance for this study, but most of the energy-vulnerable households in Spain are tenants [25], who are almost always not in possession or aware of their energy bills [28]. However, 54 households out of 522 households (10.3%) renovated by the Fund’s collaborating NGOs in Catalonia (data from 2021 [14] projected to May 2022) is considered a significant sample. The following information was required for each household under study:
-
Historical record of monthly electricity consumption/expenditure bills before and after retrofitting.
-
Historical record of other fuels’ consumption and expenditure (if heating energy carrier is not electricity).
-
Date and scope of energy retrofitting.
-
Locality or postcode of the dwelling (climate zone).
-
Age and size of the dwelling.
-
Household size and composition.
-
Household income bracket.
-
Thermal (heating and DHW) and electrical equipment.
The questionnaire designed by the authors of this paper and distributed to the NGOs that collaborated with the study consisted of three sections:
  • Energy bills: collects basic data on consumption and expenditure before and after interventions (if energy bills are not provided).
  • Energy efficiency interventions: collects information on the nature and dates on which the interventions were carried out.
  • Household characteristics: collects information on the socio-economic characteristics of the household and the technical parameters of the dwelling and its thermal and electrical equipment.
The queries that were asked in this questionnaire are shown in Appendix A. The data collected in this survey contain the information necessary for the analysis of the impact of shallow renovations on the household’s EP situation. Indeed, the survey results have been mainly used to estimate the required energy consumption and expenditure (see Section 2.2.3). For data that could not be collected (less than 5%), an estimate of their value was made based on public data such as information from the Spanish National Institute of Statistics (INE) and Cadastral data or the average value of similar households in the sample.

2.2. Impact of Shallow Renovation on Energy Poverty

2.2.1. Theoretical Reduction in Energy Consumption Generated by the Interventions

In this section, the theoretical simulation of the reduction in energy consumption after the application of each retrofitting solution studied is carried out. This is a necessary preliminary step for the calculation of the theoretical savings in each household, whose estimation methodology is described in Section 2.2.3. The initial required energy demand/consumption will be compared with the demand/consumption after each intervention in order to study which measures are theoretically more effective in saving energy. First, passive measures that lead to a decrease in theoretical heating demand are studied (section “Reduction in Energy Demand by Passive Measures”). Secondly, section “Reduction in Energy Consumption by Active Measures“ analyses active measures that lead to a reduction in heating and DHW consumption (e.g., change of heating system) and in the theoretical electricity consumption (e.g., replacement of household appliances with more efficient devices). Finally, section “Reduction in Energy Consumption by Micro-Efficiency Measures” presents the theoretical consumption reduction generated by energy micro-efficiency measures commonly implemented by the NGOs collaborating with the fund.

Reduction in Energy Demand by Passive Measures

This section presents an elaboration of the latest update of the technical report on express energy retrofitting [8]. As mentioned above, that theoretical study was carried out for a model of a block of nine dwellings (distributed over three floors) in four cities with different climates. In the present study, having used anonymised data, the information on the floor and doorway in which each household lived was not available. Therefore, for each measure, this procedure calculates the average demand reduction generated in the flat typologies analysed in [8] in order to simulate a “standard block dwelling”. Moreover, the study presented in this paper has focused on measures designed to reduce heating demand (i.e., awnings and roof painting have been excluded), as this is the most important HVAC demand in households in Catalonia. This fact has been demonstrated at the theoretical level [25] and by analysing the actual consumption of Spanish households [29]. Moreover, this choice of including only measures for the cold months has been reinforced by the fact that none of the analysed households had implemented cooling demand reduction measures (see Section 2.2.2). However, future studies could extend the range of measures to include heat adaptation measures, given the prospect of a significant increase in cooling demand due to climate change (Castaño-Rosa et al., 2021 [30]).
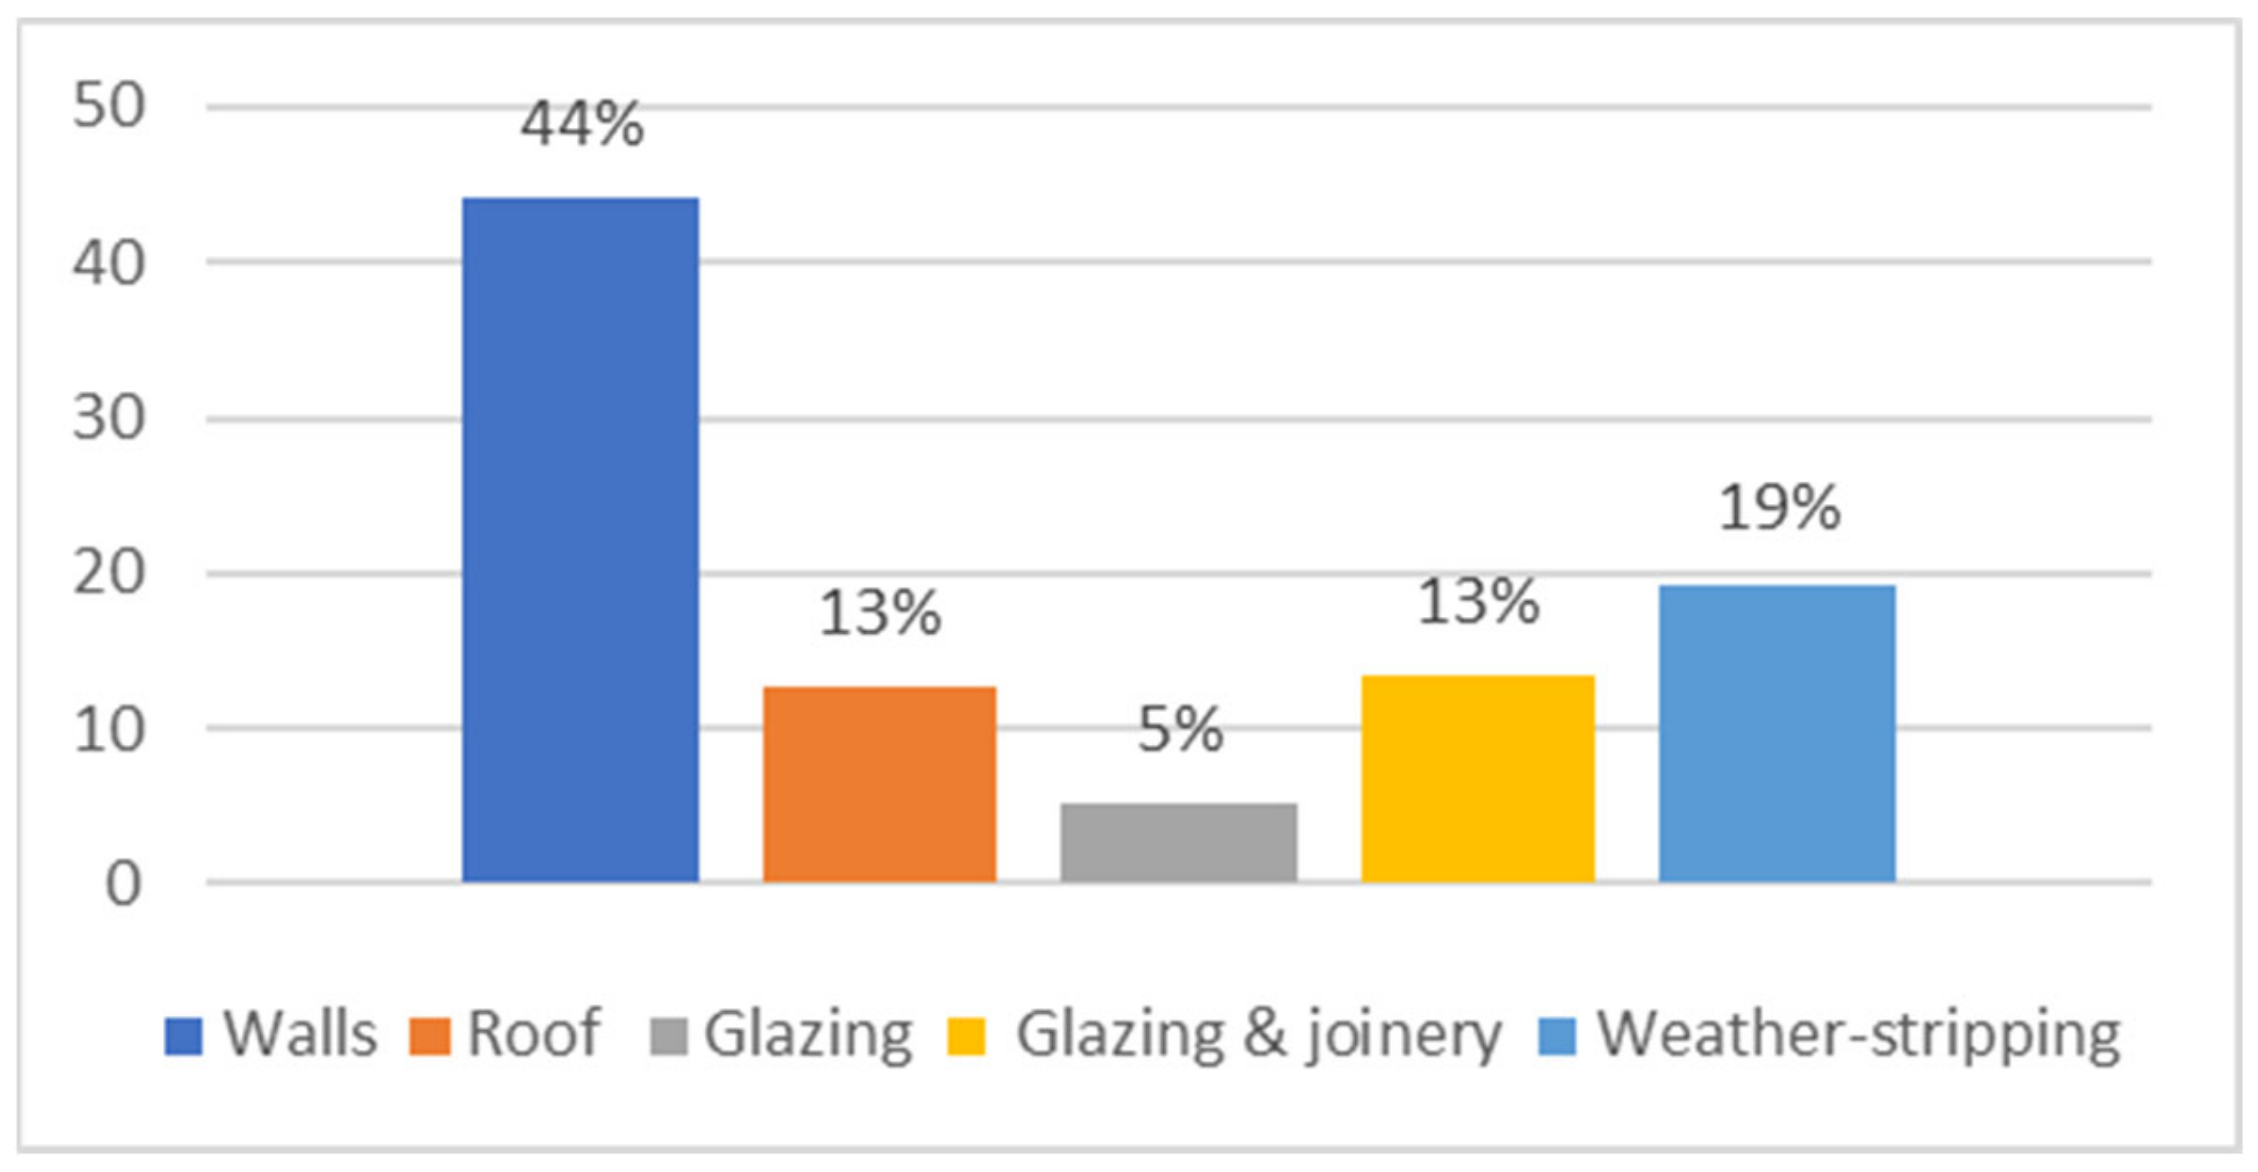
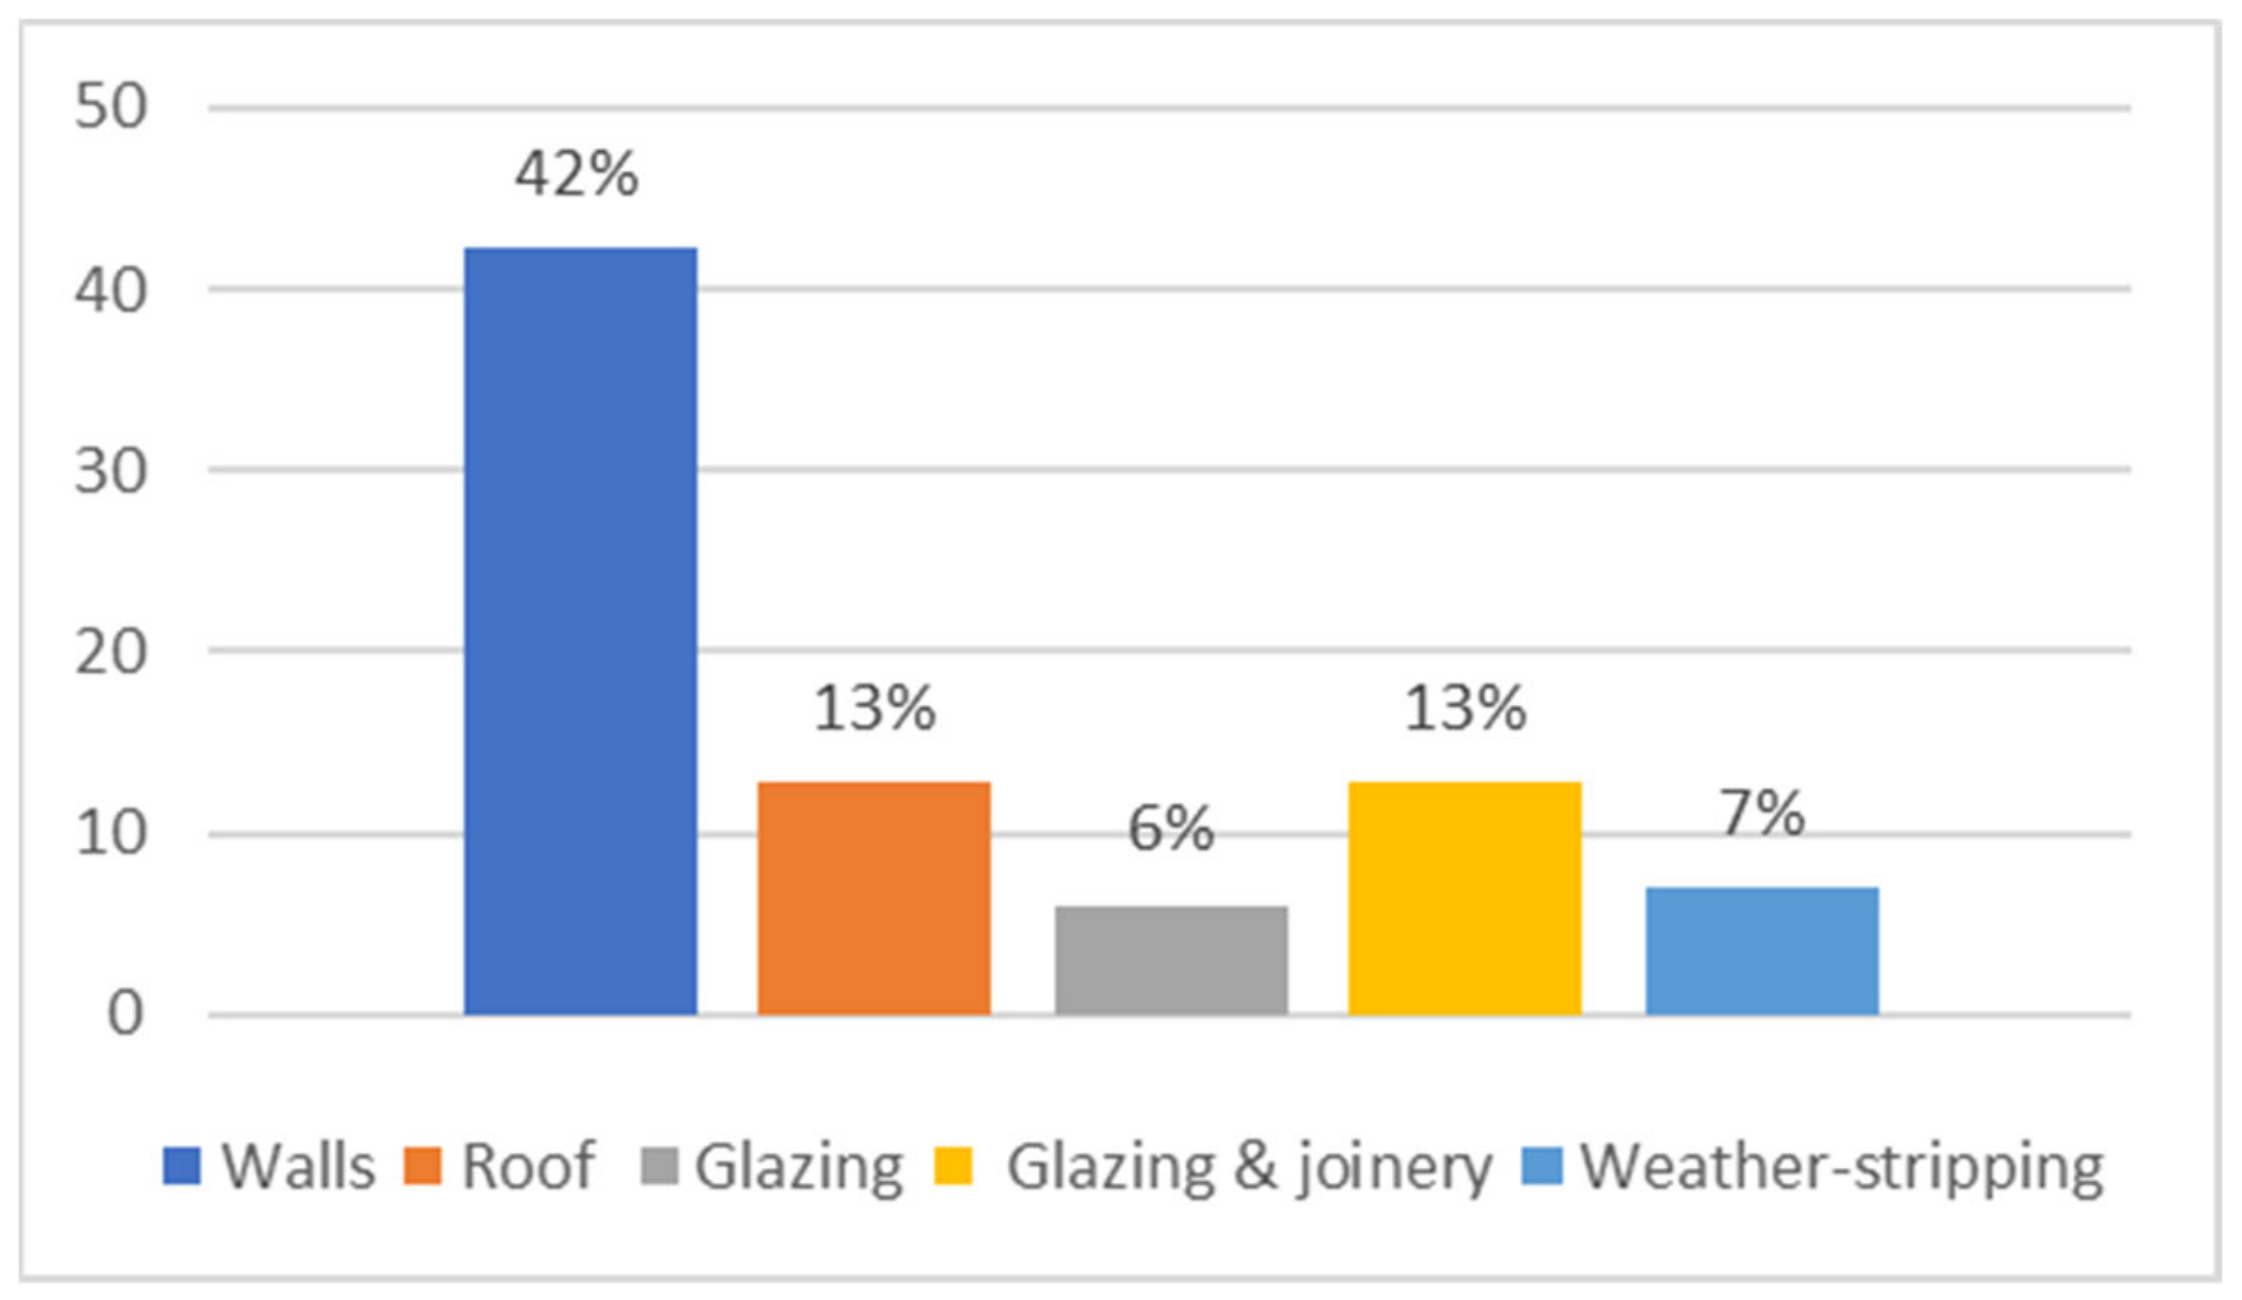
Figure 1, Figure 2, Figure 3 and Figure 4 show how the relative reduction in heating demand [%] varies greatly depending on the type of passive measure implemented. The most effective intervention (among the analysed ones) for reducing energy demand in cold months is wall insulation; glazing and joinery replacement and roof insulation have an intermediate impact, while weather-stripping and glazing replacement have a more limited effect on heating demand. In particular, savings range from 4% for glass replacement in Madrid to 44% for wall insulation in Sevilla, and the relative heating demand reduction [%] is usually higher in cities with a milder winter climate, like Sevilla.

Reduction in Energy Consumption by Active Measures

(A) Replacement of heating and/or DHW production systems
In order to calculate the theoretical reduction in energy consumption generated by replacing a boiler or appliance for heating and/or domestic hot water (DHW) production, the seasonal performances of the equipment according to their age estimated in [31] were used. Table A1 and Table A2 show the used average seasonal heating performance factors (SHPF), respectively, for old and new systems. Knowing the average seasonal performance of installations makes it possible to calculate consumption based on the energy demand of a building or dwelling [12]. In particular, the quotient between the heating demand of a dwelling and the seasonal efficiency of the boiler determines its heating consumption. Regarding the type of system, a distinction is made between three typologies: individual systems, which heat the whole house (e.g., a system with a boiler and wall radiators), centralised boilers for the whole building, and portable devices for some rooms (heaters or heating stoves). On the other hand, Table A3 and Table A4 show the seasonal performance for DHW production, respectively, for old and new systems.
Thus, the reduction in required heating and DHW energy consumption generated by replacing an old boiler or appliance with a new one was calculated. Table 1 and Table 2 show the resulting values. It should be noted that it has been assumed that old systems would be replaced by their new versions, i.e., a more efficient system using the same energy carrier. The only exception is in the case of coal boilers, which are replaced with biomass boilers/stoves, the former being the most polluting system.
In both cases, the biggest savings are obtained by replacing the systems using biomass as fuel, but significant savings are also obtained by replacing natural gas or LPG boilers and heat pumps.
(B) Replacement of household electrical appliances
Firstly, the consumption of the main household appliances has been analysed according to their energy efficiency label, following the methodology set out in a previous study [32]. The old labelling system has been used as it is the most common in vulnerable households. Subsequently, the unit reduction and the total reduction due to the replacement of the existing appliance by a new one (A+++ label) were calculated. Unit reduction means the reduction in consumption required for the operation of the appliance. On the other hand, the total reduction is the relative reduction in the total required electricity consumption (cooking, appliances and lighting).
In the paper’s case study, consumption values before and after the intervention were estimated according to the household size (1, 2, 3, 4 or more than 4 members) and the electrical devices in the dwelling. In addition, the base case is estimated by setting an average energy efficiency of existing devices in Spain (see [31]).
Table 3 shows the energy savings by replacing an “old” appliance with a “new” one for an average three-member household with all appliances, included in the model mentioned in Section 2.2.3—assuming they are all old in the base case. For this purpose, the most energy-consuming appliances have been classified into three efficiency categories: old (Label G), intermediate (Label C) and new (Label A+++)—see [32].

Reduction in Energy Consumption by Micro-Efficiency Measures

(A) LED bulbs
The power equivalence of 20 W low-consumption, fluorescent and halogen bulbs with respect to a LED bulb is calculated following the methodology presented by Fernandez, 2022 [33]. From this data, a “standard bulb” is created, which will be the average of the LED power equivalences of the previous bulbs. This make it possible to calculate the average savings generated by switching to LED bulbs when the starting bulb type is unknown. The results are shown in Table 4.
Thereafter, based on the equivalent LED wattage of the other bulbs shown in Table 4, the unit reduction in consumption is calculated by using the LED bulb instead of the other 20 W luminaire types (Table 5).
It can be seen how, with the LED bulb, an average of 48.5% of power is saved compared to other bulbs.
(B) Thermocover
According to the references consulted (the HIGITECH manufacturer’s data sheet and commercial thermocover [34]), it can be estimated that the application of a thermocover reduces heat dissipation by 28% for single-glazed windows and 13% for double-glazed windows. Based on these values, the savings in terms of reduced heating demand were calculated under the assumption that the ideal measure to reduce heat dissipation through the windows would be to replace all windows (glazing and frames) with more insulating ones. Subsequently, the reduction in heat dissipation through the window generated by the Thermocover has been multiplied by the reduction in demand estimated above for the ideal measure mentioned above (Figure 1 and Figure 3). The results for C (Barcelona) and D (Madrid) climate zones are shown in Table 6. In vulnerable households, the starting conditions of the windows are usually single glazed without thermocover; therefore, the first of the two data in the table will be used as a theoretical reference for the savings generated by this intervention.

2.2.2. Classification of the Analysed Shallow Renovation Interventions

The interventions analysed in this study were classified into ten typologies to facilitate data collection through the questionnaire described in Section 2.1.
-
Installation/replacement of heating and/or DHW systems.
-
Replacement of electrical appliances.
-
LED bulbs.
-
Sealing of windows or doors (weather-stripping).
-
Application of an insulating film to windows (Thermocover).
-
Replacement of roller shutter/drawer.
-
Wall insulation.
-
Roof insulation.
-
Replacement of windows (glazing and joinery).
-
Replacement of glazing.
For each household in the study, information has been collected on the types of interventions carried out and their date of completion. It is worth noting that in 16 of the 54 households analysed, multiple interventions were carried out.

2.2.3. Household Actual and Required Energy Expenditure

The actual energy expenditure of the households in the sample was estimated from their electricity bills, applying the methodology described below. Forty-seven households were included in this analysis, as seven households had to be excluded (because they did not have a bill and therefore lacked data on consumption, actual expenditure and price). In some cases, reported by Terrassa City Council, the gas bill was also available. This extra information has been used to complete the actual energy expenditure of one of the families living in Terrasa who uses natural gas for DHW production and whose boiler has been replaced by a more efficient one.
To estimate the actual electricity expenditure of the sampled households, firstly, the following information has been extrapolated from the bills provided by the collaborating NGOs and administrations (from 2020 to 2023; there was only one case with previous invoices-2018 and 2019):
-
The type of market to which the tariff belongs (regulated-PVPC or free).
-
The type of tariff.
-
The percentage of the discount due to the social tariff (if any).
-
The retailer.
According to the data collected by the surveys, 36% of households contracted the PVPC, while approximately 60% are on the free market, and the remaining 4% have switched markets in the months following the refurbishment.
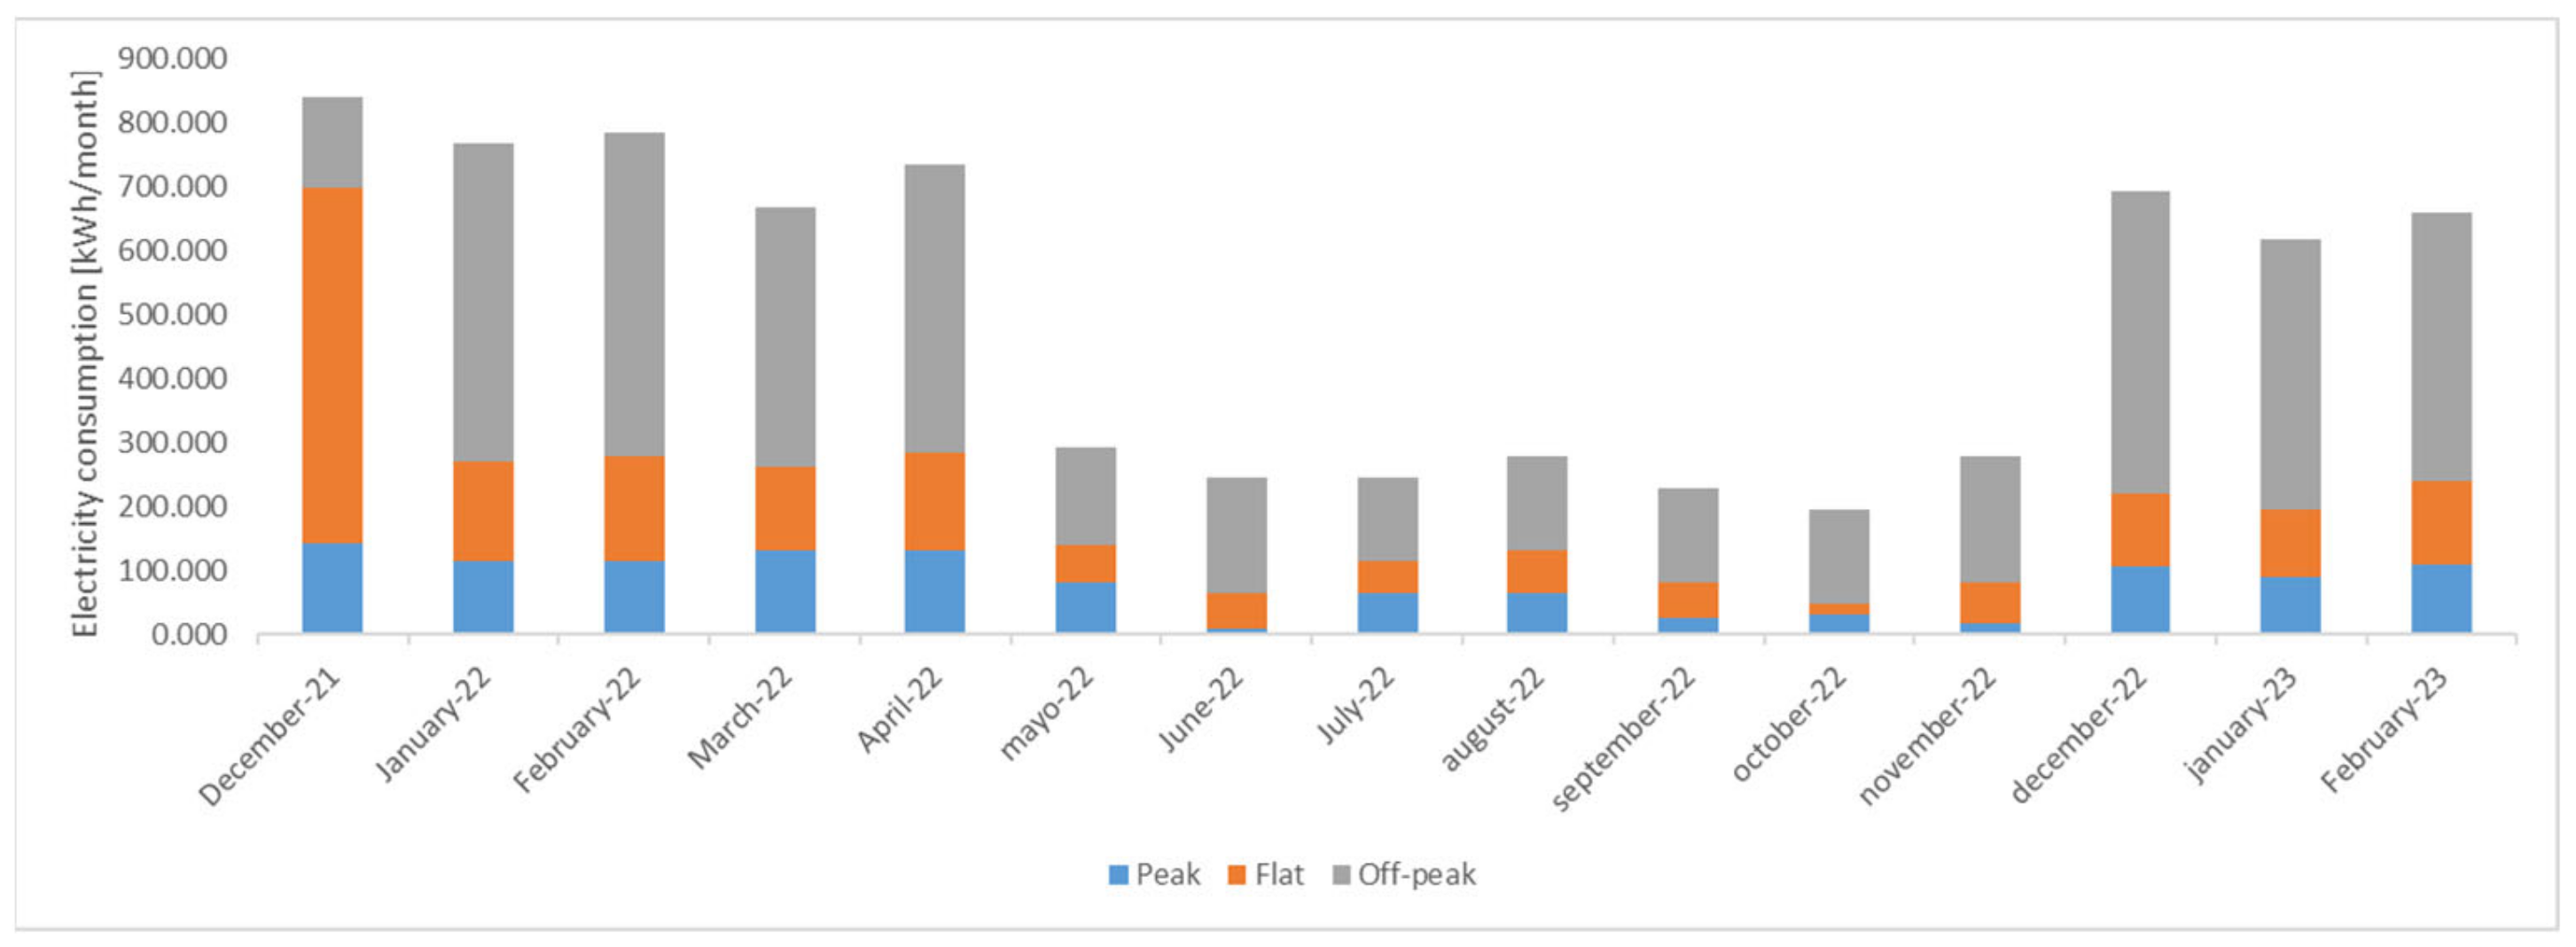
Secondly, to estimate the actual electricity consumption and expenditure of each household, detailed information from the bills was used. However, in most cases, only a single monthly or bimonthly bill was available. To estimate the electricity consumption for the remaining months (up to a maximum of 12 months for each period—before and after the refurbishment), the graph of the electricity consumption history in the months prior to the invoice was used. Figure 5 shows an example of an extrapolation of this graph for a PVPC bill.
After obtaining the electricity consumption for each month shown in the invoices, the actual monthly electricity expenditure was calculated. For the free market consumers, the estimate of electricity expenditure was made using the prices stipulated in the bill for each month, i.e., a one-year contract was assumed where electricity prices remain constant, as it is common in Spain. For the regulated market, the estimation of electricity costs has been carried out in a different way since, unlike the free market, electricity prices vary on an hourly basis. Therefore, the CNMC’s online tool FACTURALUZ [35] has been used, wherein after filling in a series of basic data, it estimates the electricity cost of a household with PVPC in the selected period. The data required are the billing date (a billing period of 30 days has been assumed in all cases), the postcode of the household, the household’s electricity consumption in that billing period (estimated above), the contracted power, and enter the discount due to the social bonus (in case the household has it). In addition, this web tool shows the electricity prices involved in this calculation for each billing period. It should be noted that these same prices identified for free and regulated market bills have also been applied to the calculation of the required energy expenditure of households described below.
The actual natural gas expenditure, which has been considered only for one household of the sample, is estimated from their gas bills. The 24-month timeline of measured or estimated consumption and the prices and taxes applied in the different months have been used to estimate, respectively, the average monthly consumption and actual expenditure on natural gas before refurbishment. The same method has been applied 5 months later to estimate the actual gas consumption and expenditure after the refurbishment. In this particular case, the calculation after refurbishment is less reliable than before because it is based on only 5 months of estimated consumption. However, it was considered a sufficient reference for the calculation of the actual natural gas expenditure.
The required energy expenditure (RENE) and the Required Energy Consumption (REC) of each of the sampled households before the shallow renovation interventions has been estimated using the RENE model presented in the above mentioned work [31]. The input data are the characteristics of the household in question (described in Section 2.1). On the other hand, the RENE and the REC after the shallow renovation interventions have been calculated by applying the theoretical reductions in consumption generated by the measures implemented (presented in Section 2.2.1) to the abovementioned model.

2.2.4. Impact on Hidden Energy Poverty

The most pressing dimension of energy vulnerability in Spain is what is known as “hidden energy poverty” (HEP) [5]. Furthermore, [5] also highlights the HEP indicator as the only one that has been able to capture the trend of reduced consumption due to lack of affordability of energy in 2021 compared to previous years, particularly in low-income households. In addition, the HEP indicator is the only one (among the one proposed for Spain [5]) that uses the required energy expenditure of households. This makes it particularly useful for being able to reliably measure the result of energy efficiency actions on dwellings and measures that might have a different impact on their required and actual energy consumption. In this way, we can help detect phenomena such as the rebound effect [36] from masking the positive impact that these measures are in fact having on homes in terms of comfort for their inhabitants, but we also take into account the prebound effect [37], particularly noticeable in vulnerable households [25]. The former is a situation that occurs when a household increases its energy expenditure after an energy efficiency intervention. The reason for this increase lies mainly in the change in attitude of the household inhabitants, who, for example, after insulating their house, adjust the thermostat so that the average temperature of the house is higher than before the renovation. In the case of vulnerable households, they could lose the “fear of the energy bill” (contributing to the prebound effect—the opposite phenomenon characterised by the actual consumption being lower than the required one) after the renovation and return to consumption levels closer to the level required for their health and comfort. However, there may well be other sociological factors at work which, although outside the scope of this study, should be further explored.
For all these reasons, the HEP indicator is selected as a reference for the impact analysis of the shallow renovation presented in this study. In particular, to avoid the effects of a possible overestimation of the required heating expenditure by the RENE model, the HEP indicator methodology proposed in [25] is applied. According to this metric, a household is in hidden EP if:
-
It is under-spending: its actual energy expenditure is less than half of its required energy expenditure—RENE/2;
-
It has low income: it belongs to the lowest 5 deciles of equivalent income.
This indicator has been applied to each sampled household to estimate the share of hidden EP (HEP extent) in the target population of the Fund, i.e., the percentage of households suffering from this problem. In particular, the average values of their actual and required energy expenditures before and after the shallow renovation interventions have been used as a reference (see Section 2.2.3). On the other hand, the equivalent income criterion used (income lower than the maximum equivalent income of the fifth decile of the Spanish population: EUR 16,004 per year, estimated with the HBS 2021 data) is verified in a sample of households representative of the whole. In particular, income information has been accessed for 11 families in the sample that have been considered representative of the set of vulnerable households analysed, both in terms of their number and socio-demographic characteristics. This result was expectable given that these households are assisted by the collaborating NGOs due to their degree of vulnerability. In addition, the ‘depth’ of this hidden dimension of EP (the EP gap or HEP depth) has also been estimated as the difference between half of the household’s RENE and its actual energy expenditure.

3. Results and Discussion

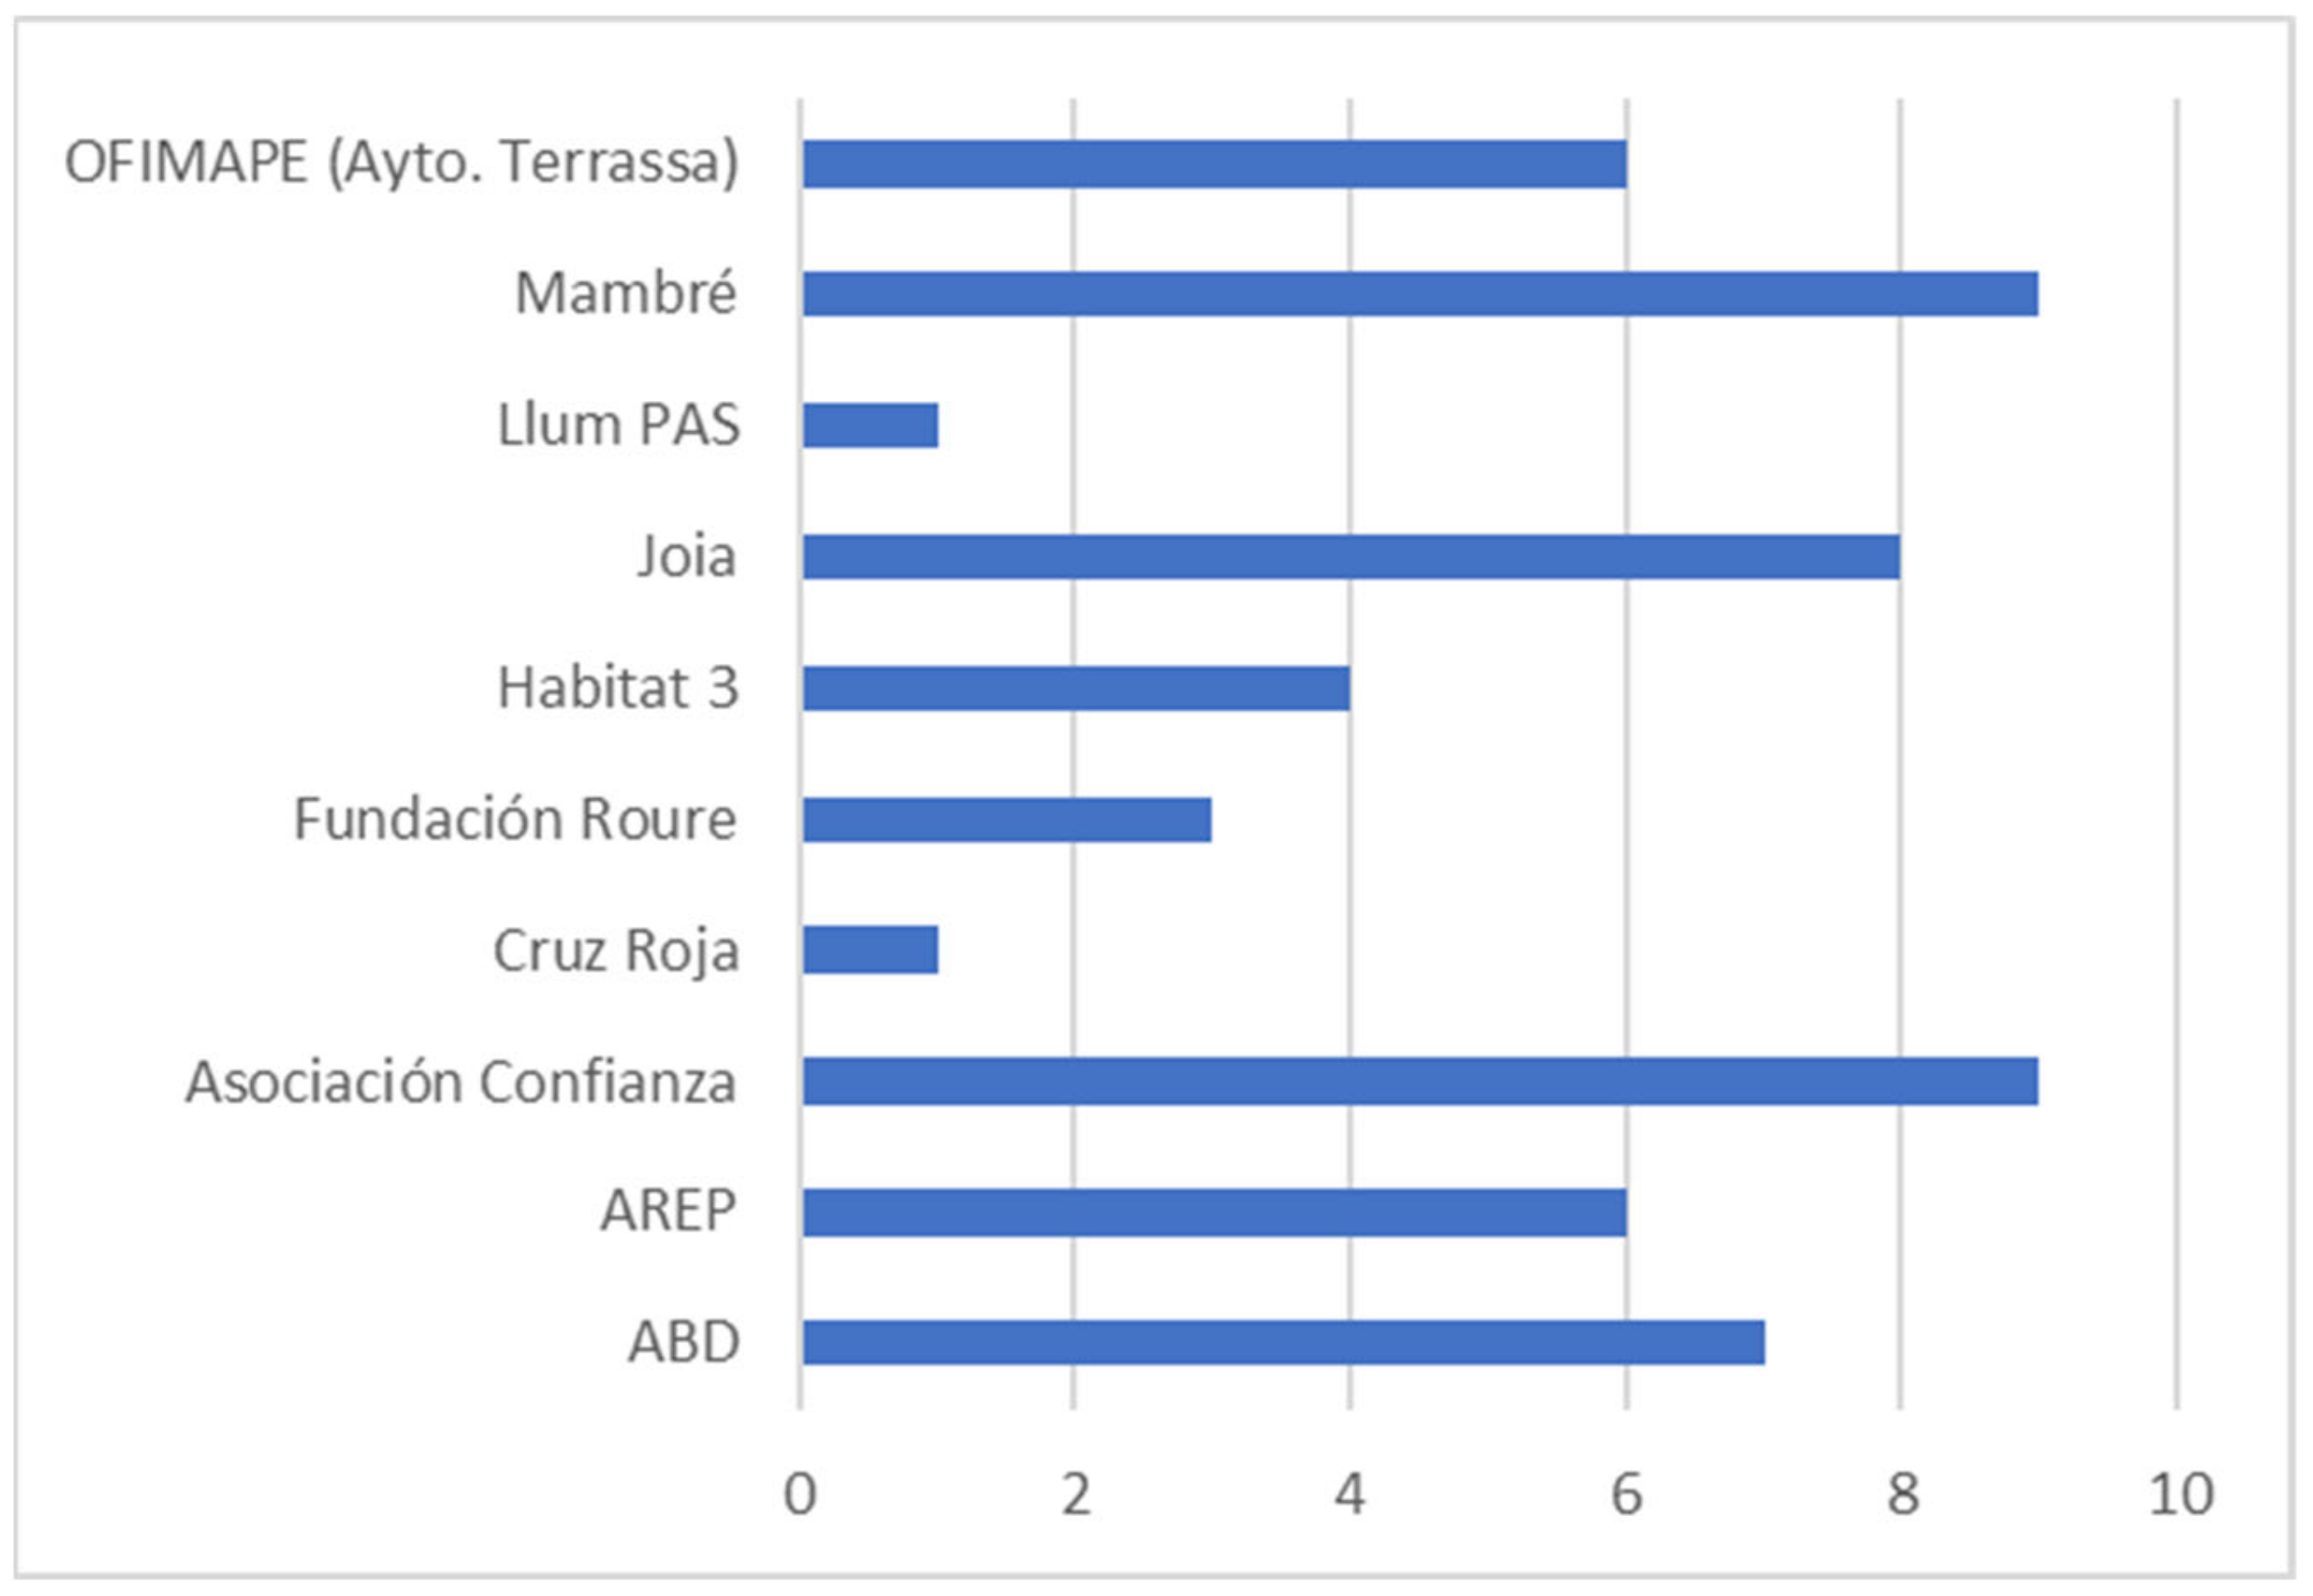
Figure 6 shows the breakdown of the households by the collaborating organisation that cares for them, with Asociación Confianza, Fundació Mambré and Joia being the organisations that provided the greatest amount of data. Another noteworthy fact is that 60% of the households in the study live in the same residential centre in Barcelona. This is a residential centre for people in vulnerable situations in the Marina del Prat Vermell neighbourhood.
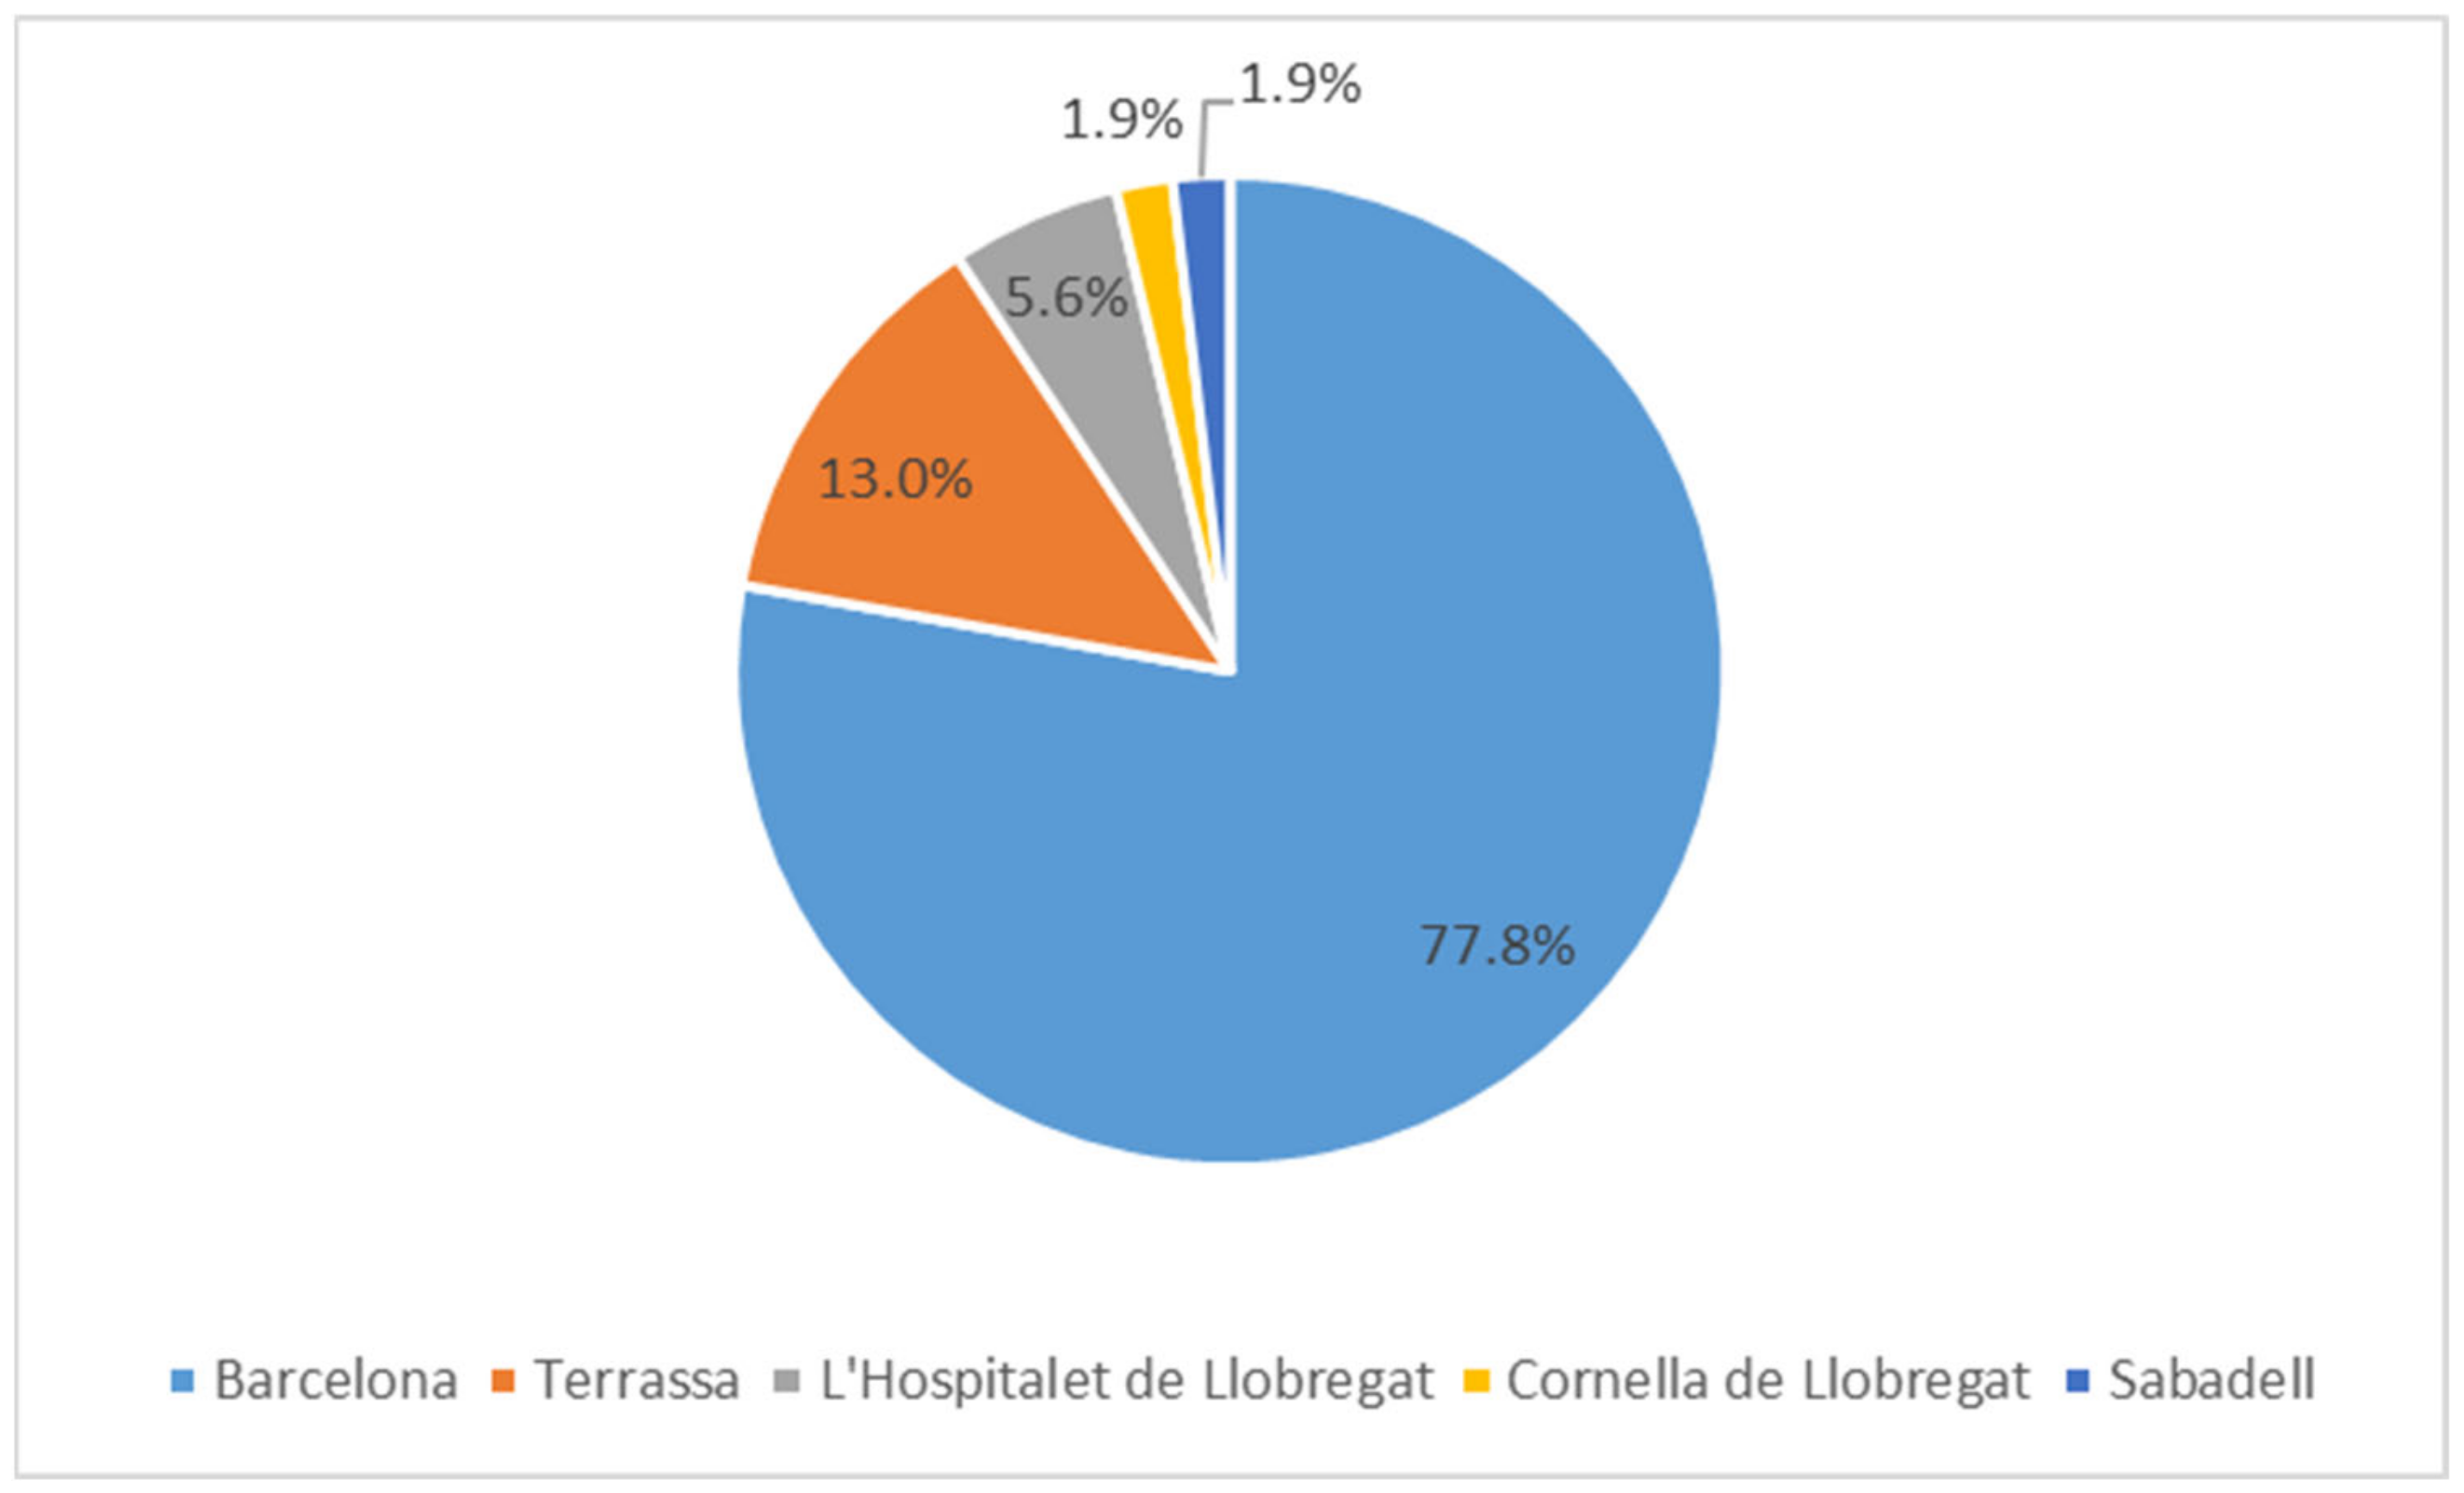
Figure 7 shows the distribution of surveyed households according to their place of residence. Most households (42 out of 54) are located in Barcelona, while the remaining households are distributed across Terrassa (7), L’Hospitalet de Llobregat (3), Cornellá de Llobregat and Sabadell (both with only one household). Only one of these localities is classified within the second coldest winter climate zone is in Spain (D) [25], namely Terrassa. On the other hand, the rest of the cities included in the study have a more temperate climate (Zone C).
On the other hand, all the dwellings analysed are in blocks, 35% of them in buildings constructed before 1981 (the most inefficient ones in Spain) and the remaining 65% in buildings constructed between 1981 and 2007 (average energy efficiency level). In particular, the latter are almost all located in the same building, namely the before-mentioned residential centre in Barcelona.
The average size of the dwellings is 67 m2, well below the square metres of dwellings of general Spanish population (103 m2, according to the SECH-SPAHOUSEC project). Information on household size could only be collected for 65% of the households in the sample. Of these, 74% are either single-person households (43%) or two-person households (31%). The third most frequent group is four-person households (14%). Households with three and more than four persons both represent only 5% of the total.
In terms of heating systems, the vast majority (72%) of households have an individual system that is supposed to heat the whole dwelling, while 13% do not have any type of equipment, despite needing it. Of these, the majority live in Terrassa, which, as mentioned before, is a cold locality.
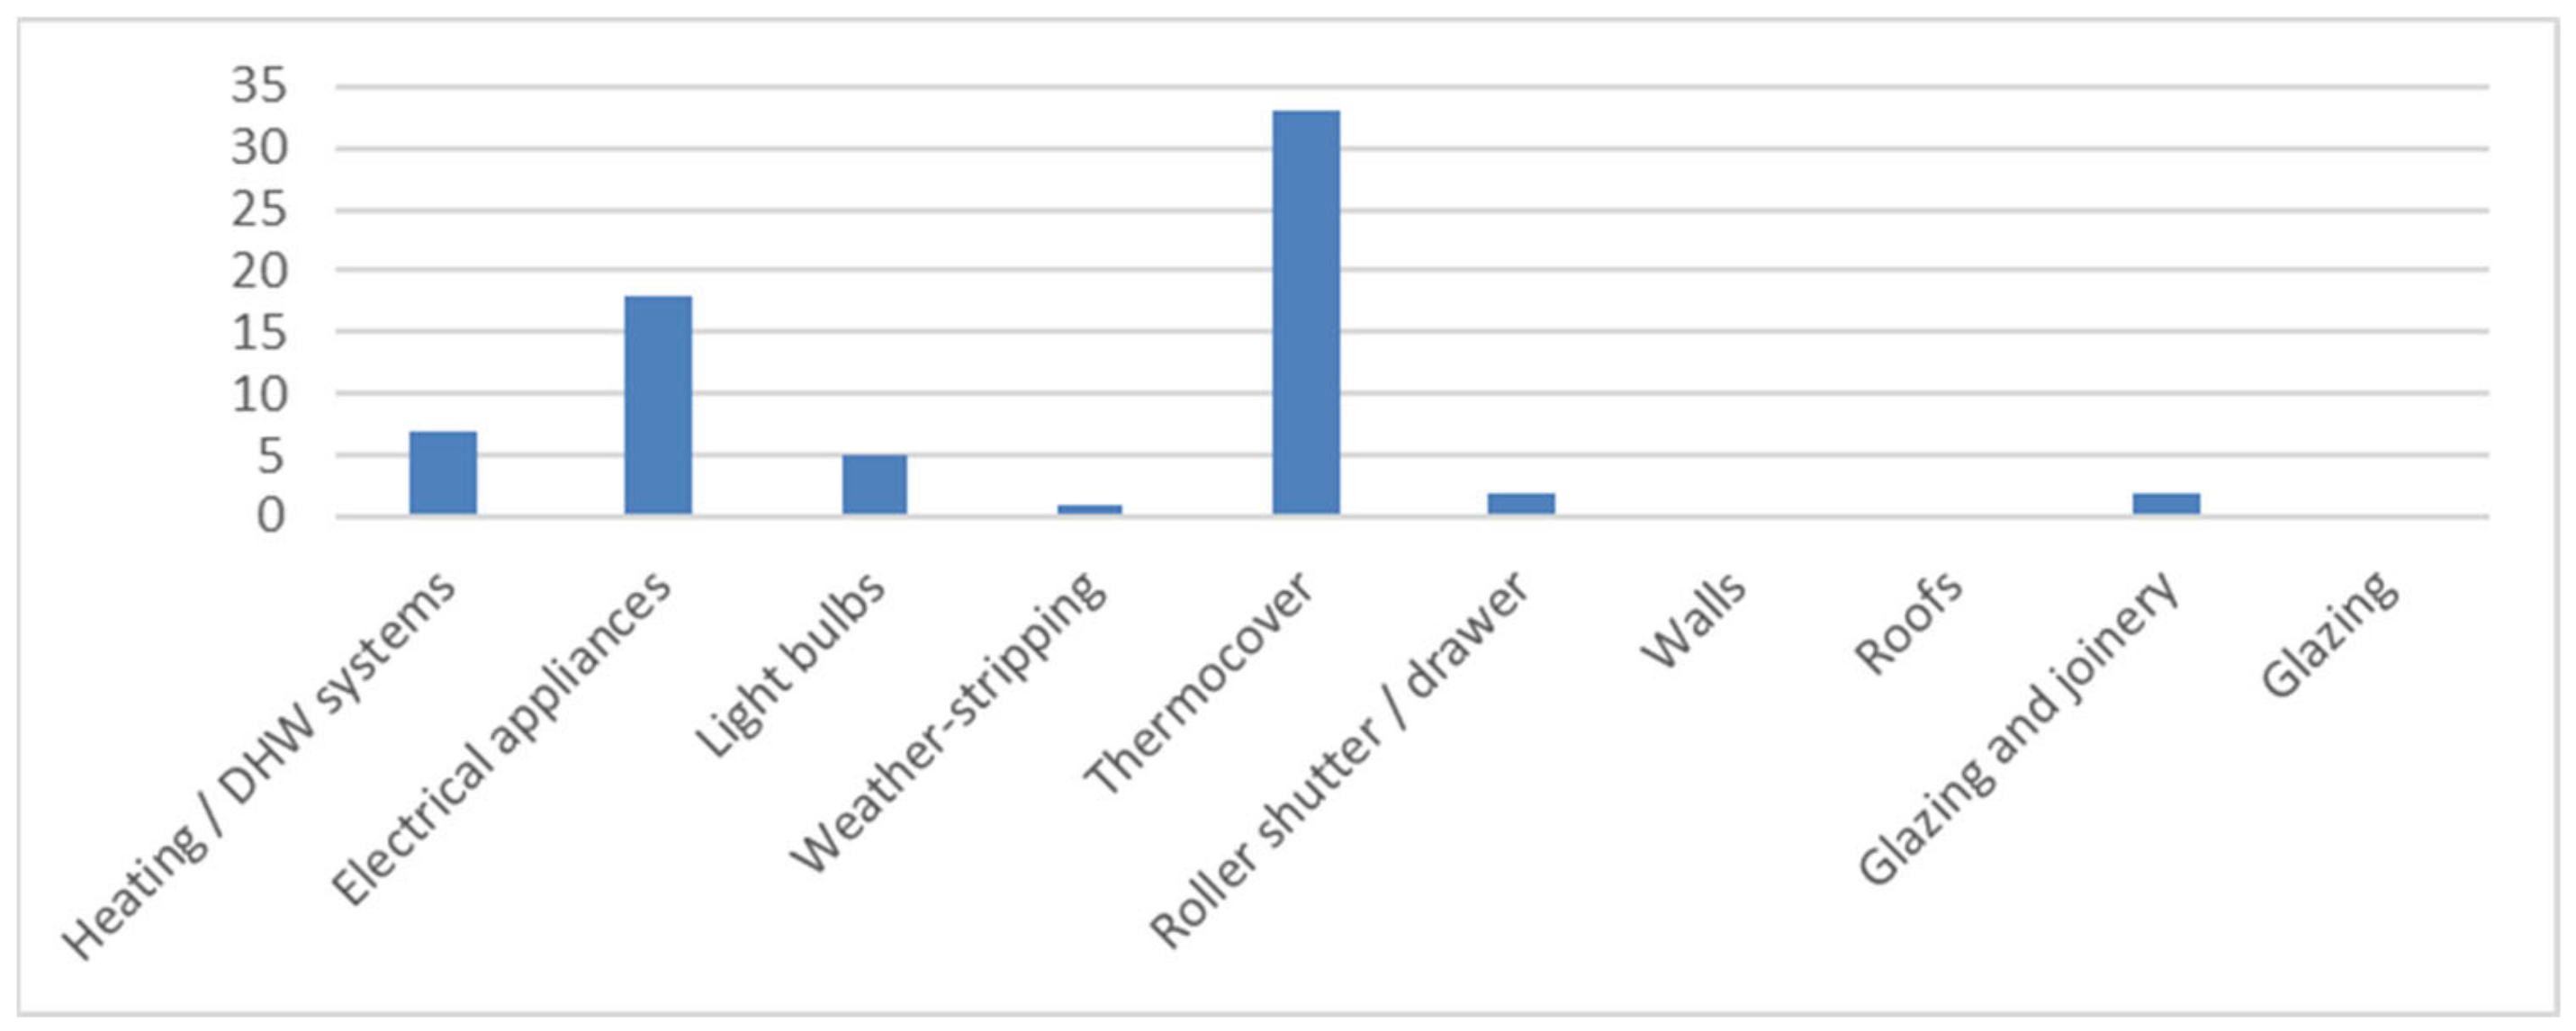
Figure 8 shows the number of interventions that were carried out in the dwellings analysed under the classification presented in Section 2.2.2. The graph highlights the application of Thermocover to windows as the most implemented measure (in 33 dwellings) in the sample under analysis. These data are justified by the fact that it is the only intervention implemented in the households living in the aforementioned Barcelona’s residential centre. Photovoltaic panels have also been installed in this building, but their use by residents has not yet been achieved. On the other hand, 18 electrical appliances were replaced, especially those that consume the most (refrigerator, washing machines, etc.). Finally, among other frequent measures, seven heating/DHW systems and five lighting devices (light bulbs) have been replaced.
Information on the amount of investment needed to carry out the renovations was available for all the analysed households. The average investment per household was around EUR 810 (including 21% VAT), ranging from EUR 36 to EUR 2516, well below the average of EUR 6800 for a “full express energy retrofitting” proposed by [8]. This is because in most of the real cases analysed (36 out of 54), only one action has been implemented, and in almost all (52 out of 54), there were none of the three structural measures that make up the above-mentioned express intervention.
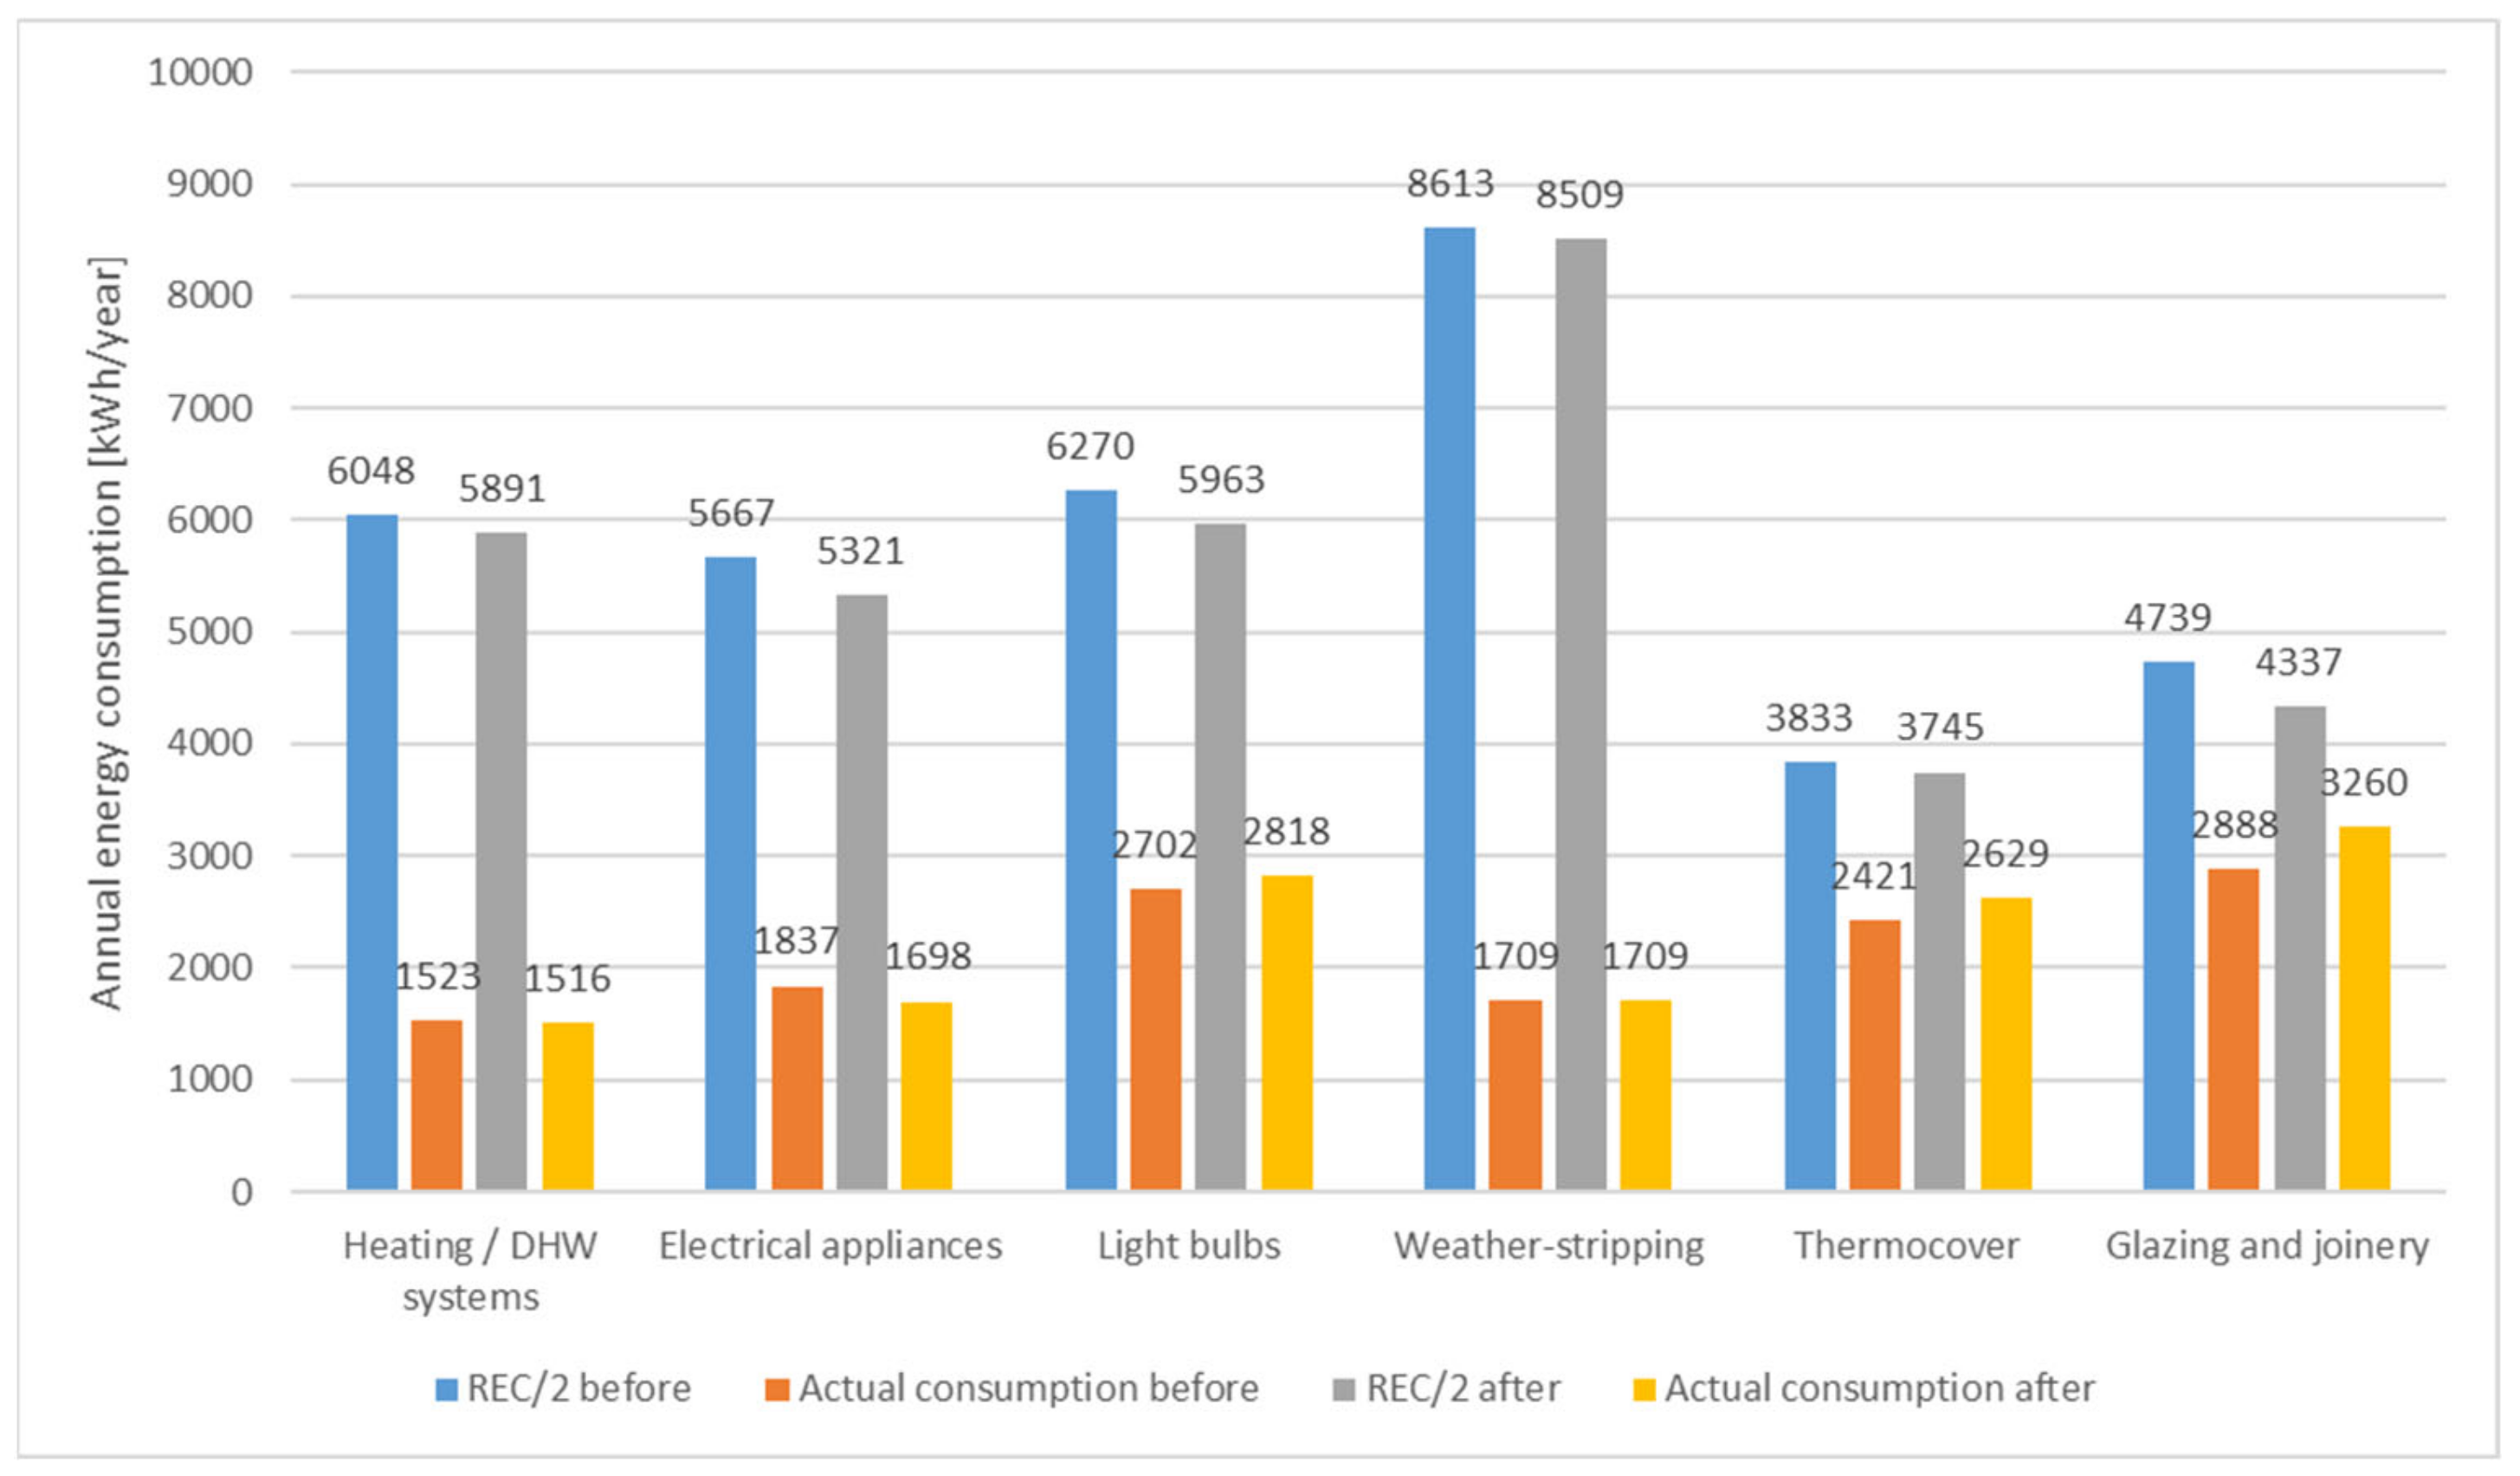
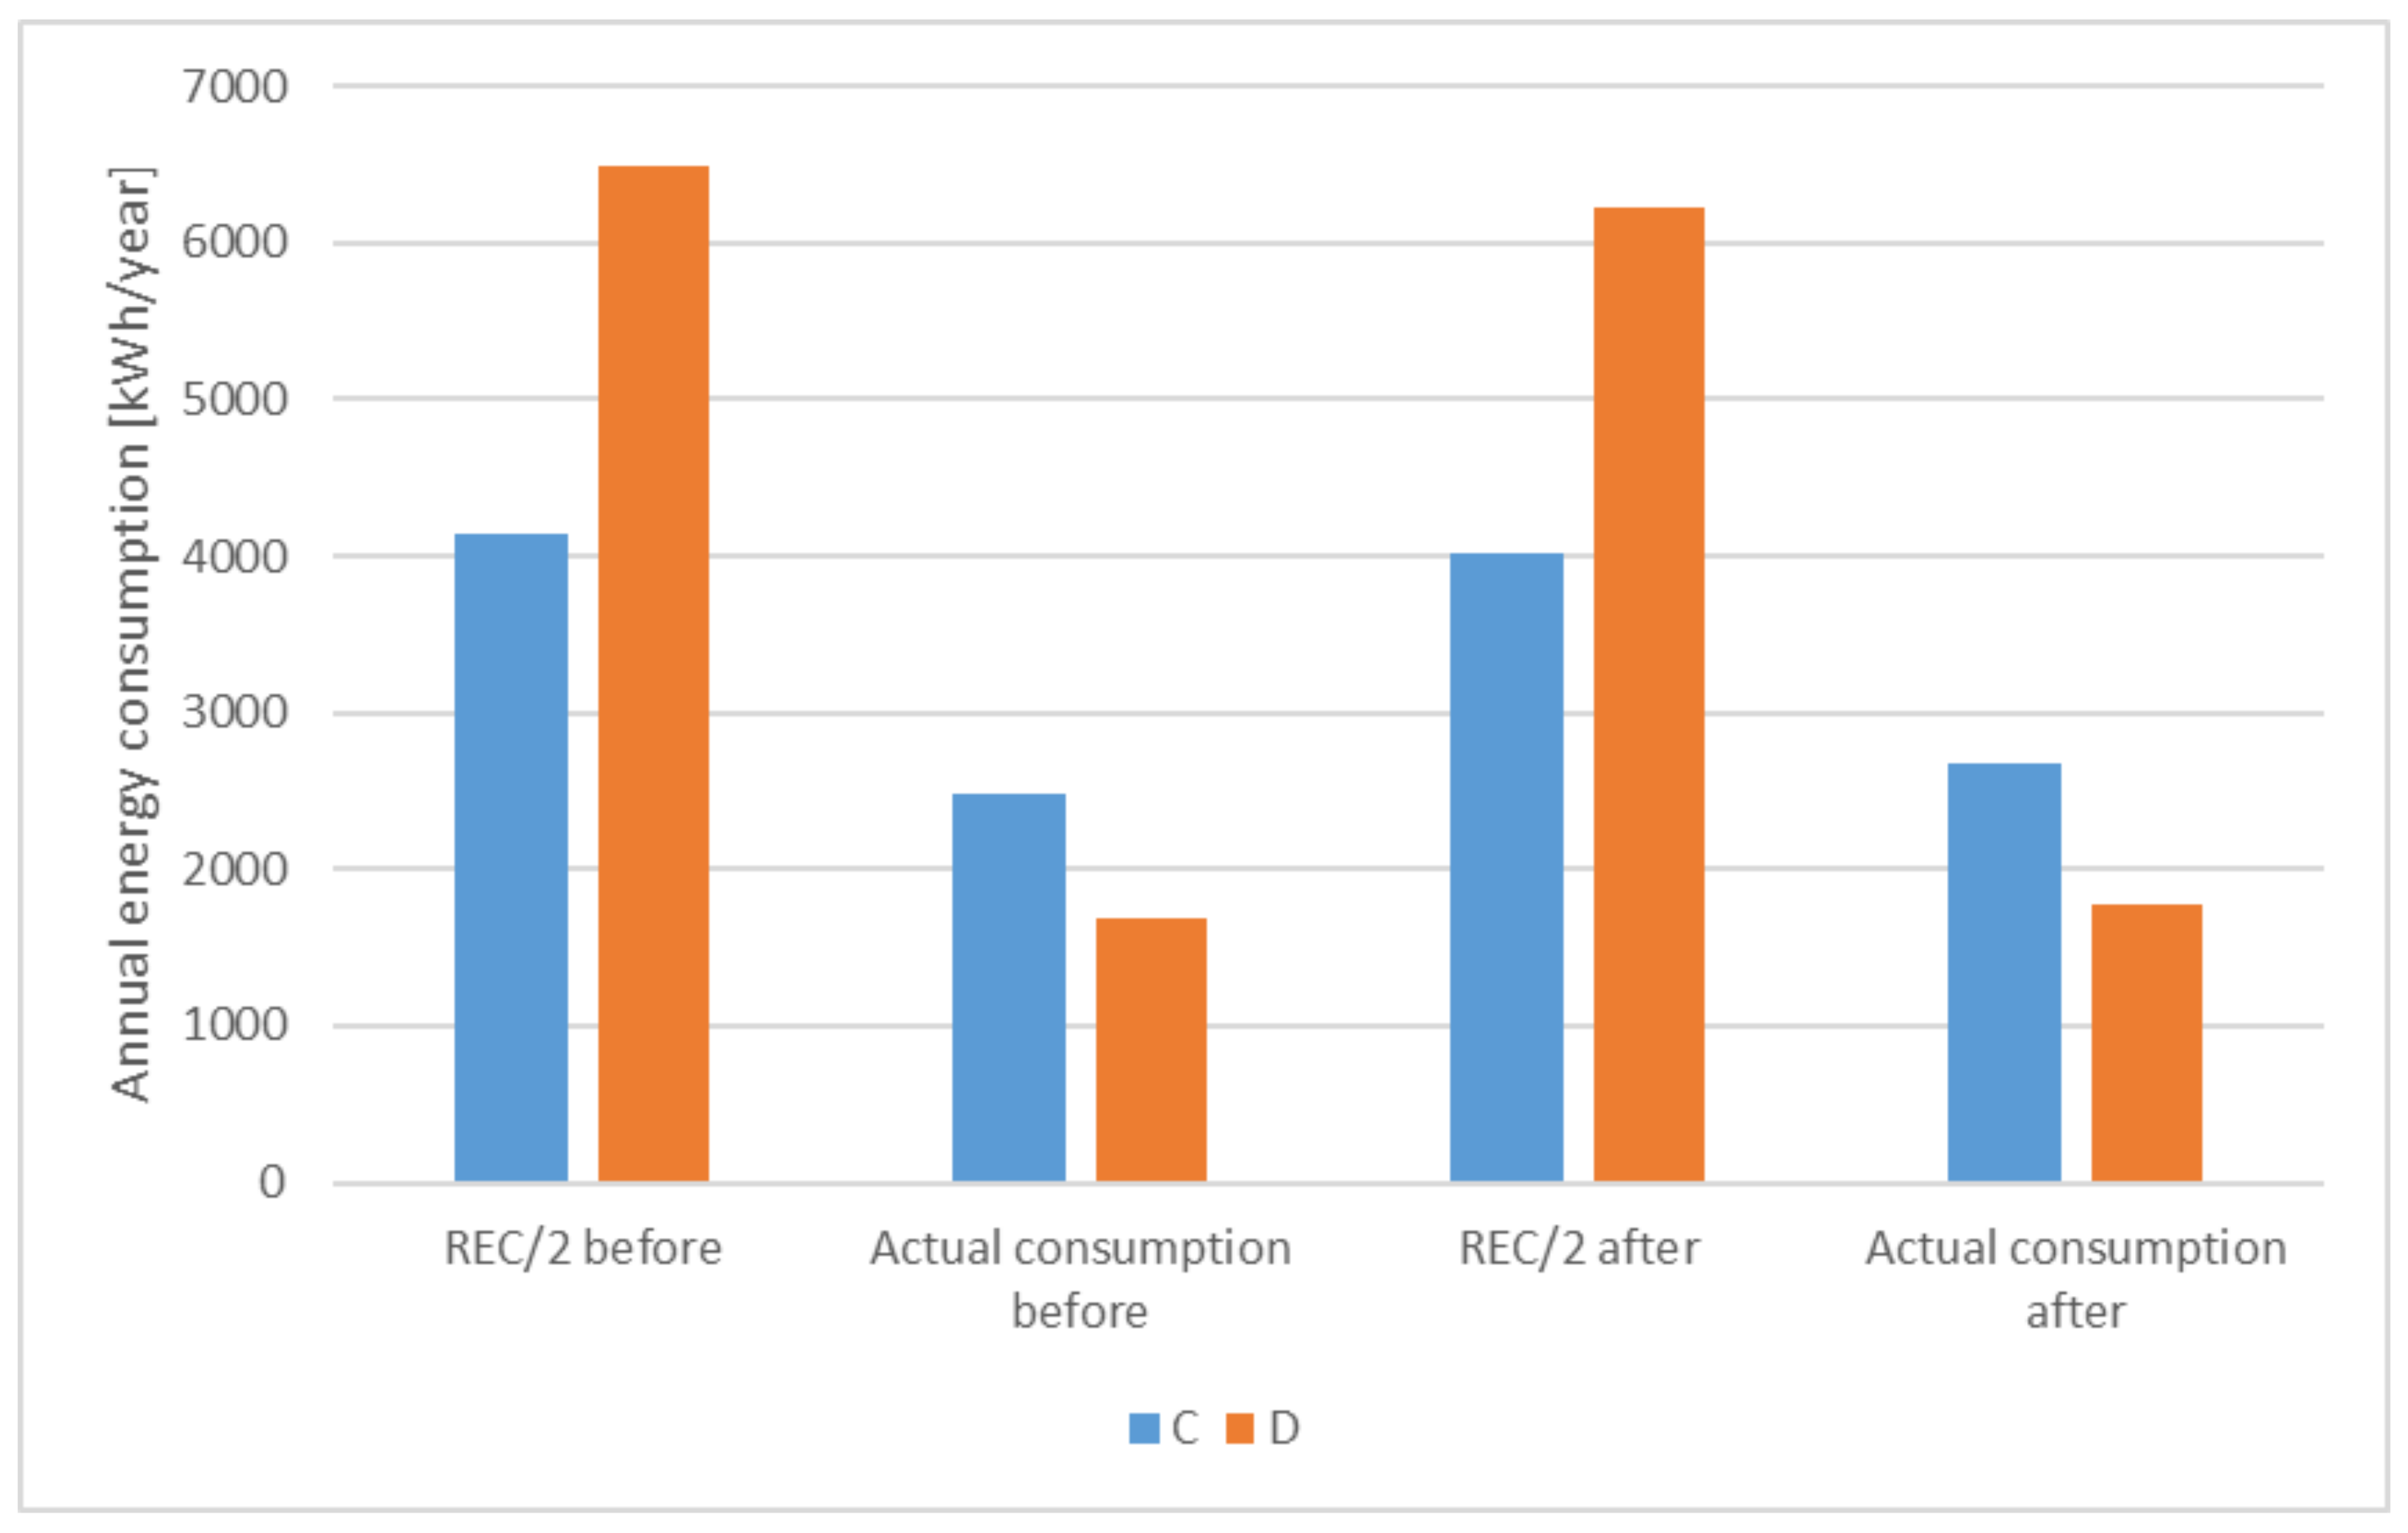
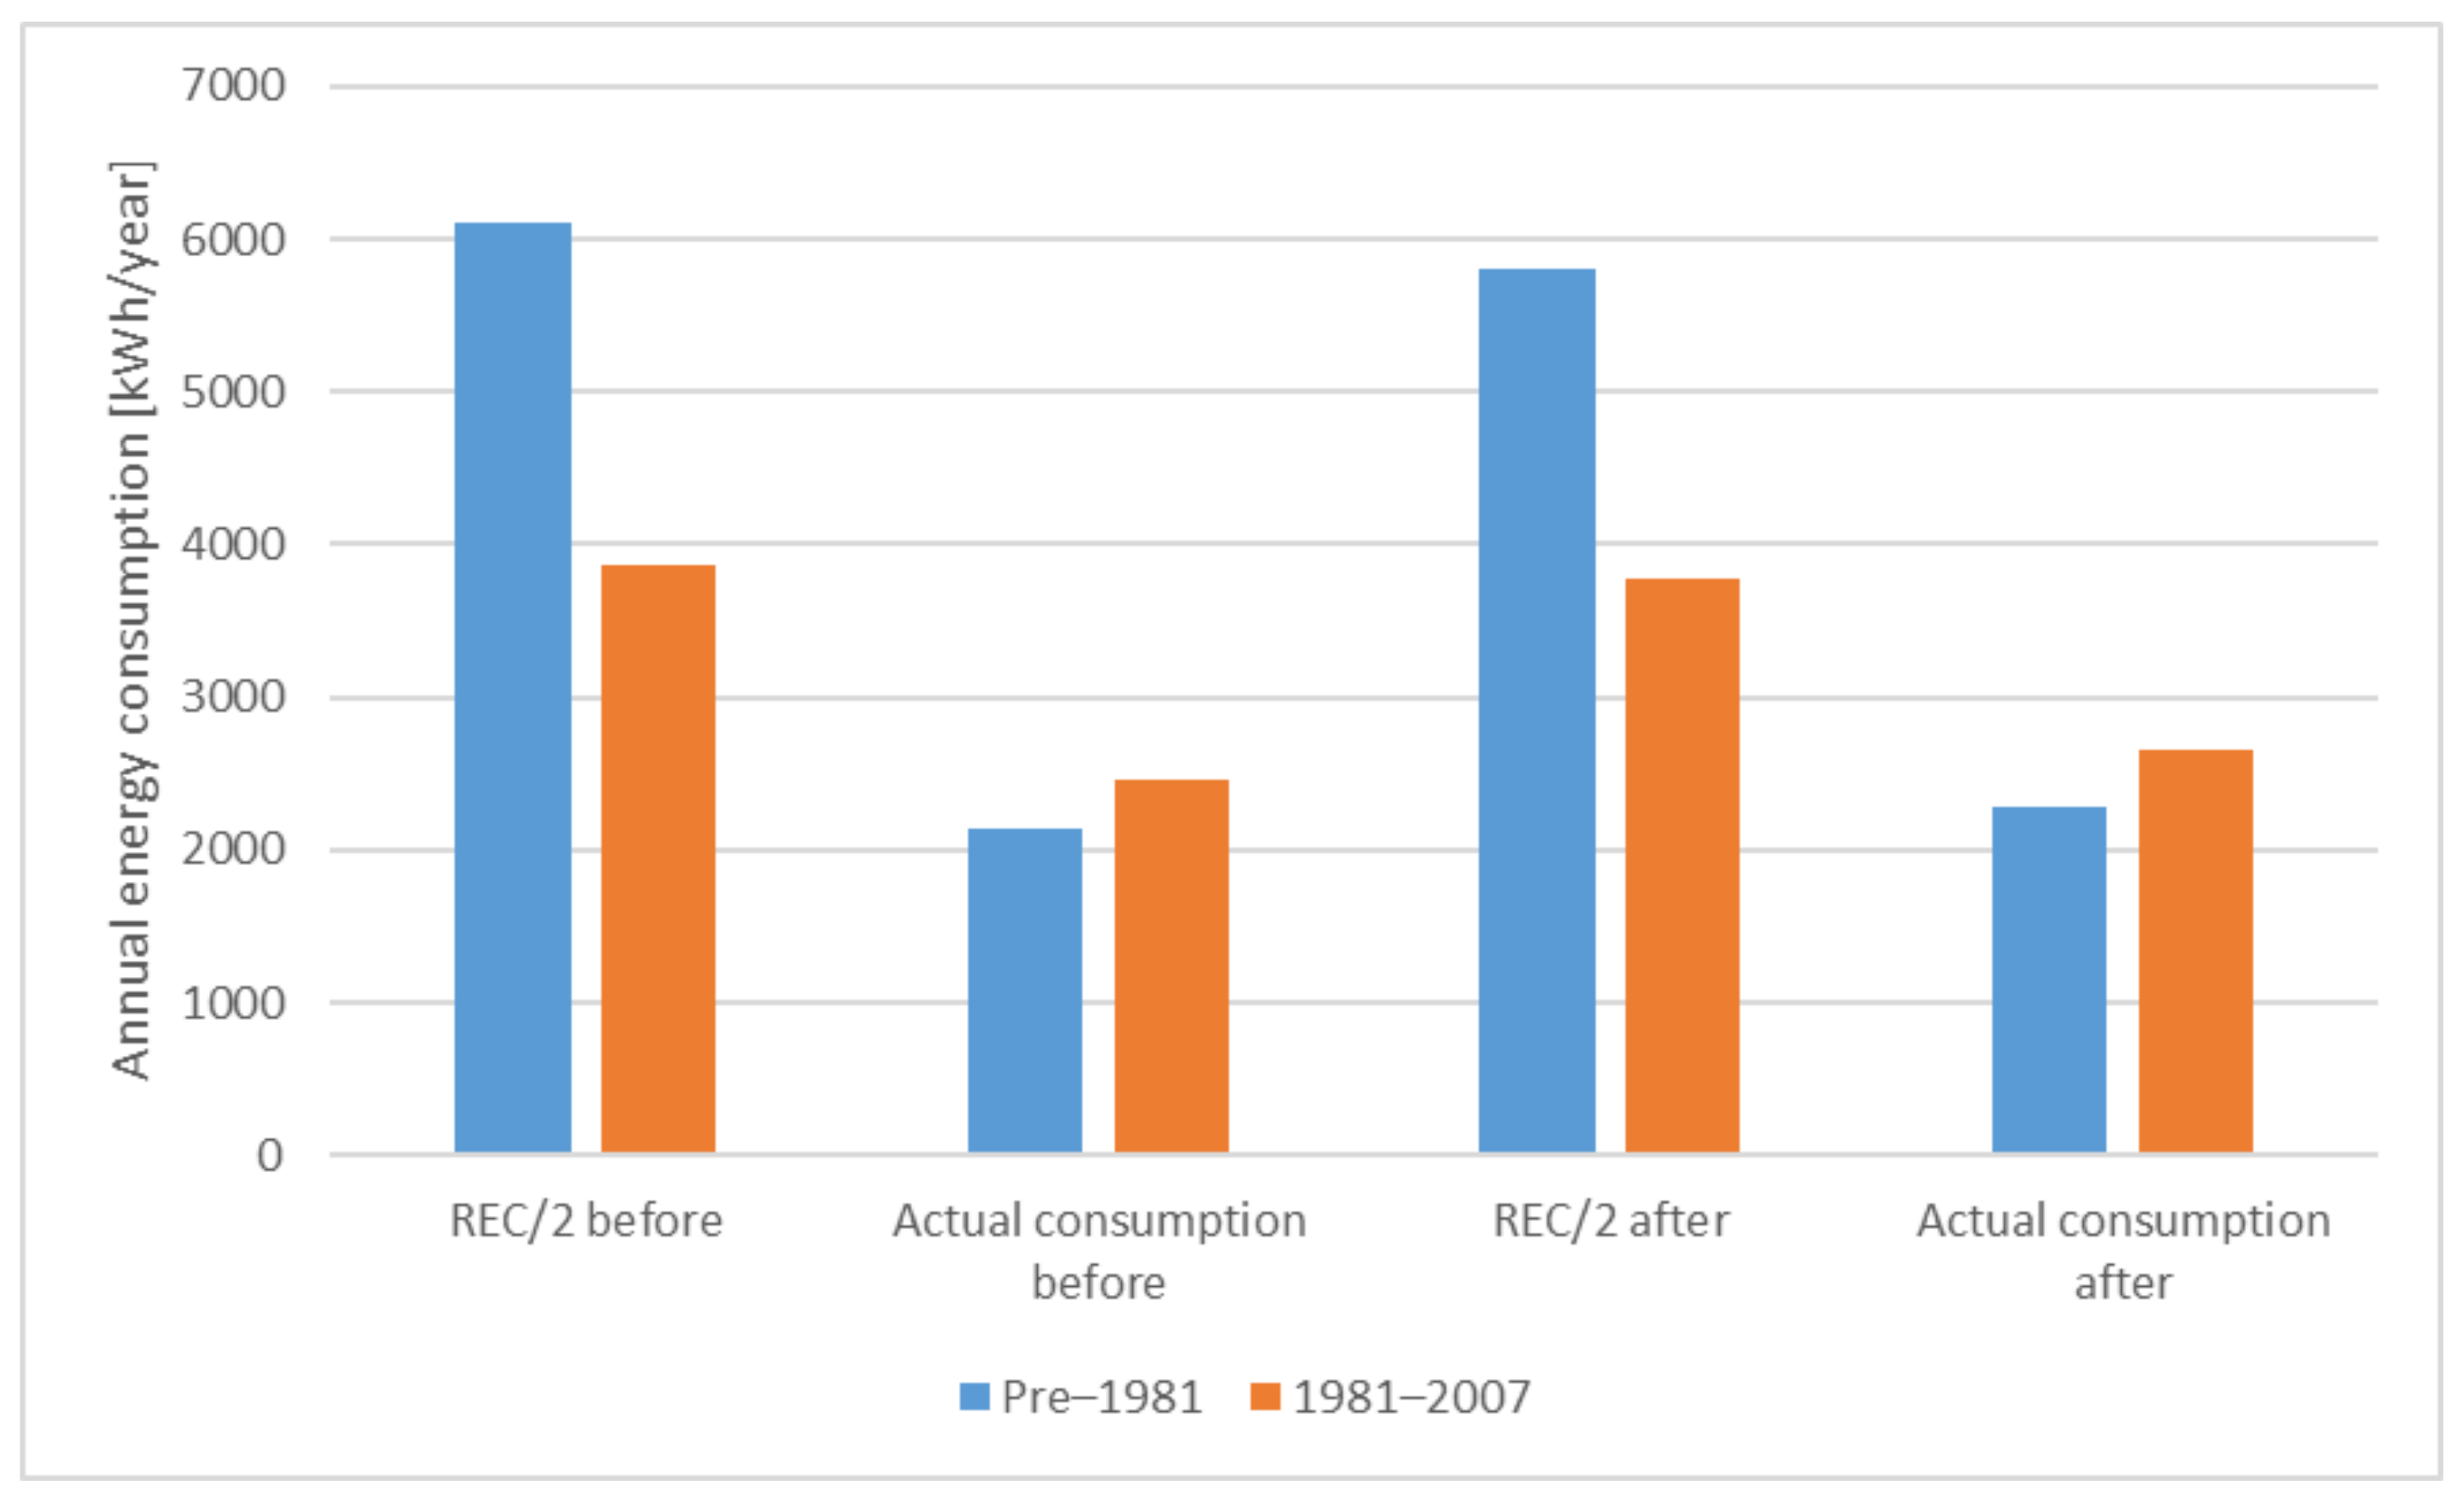
In the following paragraphs, the results of the required energy consumption and the actual consumption before and after retrofitting are compared. The analysis of consumption rather than expenditure makes it possible to isolate the effects of the price increases in the last two years due to the energy crisis, thus putting the focus on the impact of the intervention made. In the first case, half of the required energy consumption (REC/2) has been taken as a reference, in line with the literature that has shown a possible overestimation of the required consumption model with respect to the actual one (see [25]).
Figure 9 compares the average REC/2 with the actual energy consumption before and after the retrofitting by classifying the households according to the measure implemented. The relative theoretical savings (relative difference between REC/2 before and after) are highest in households where windows have been replaced (8.5%), followed by those where electrical appliances have been changed (6.1%). On the other hand, the highest relative actual savings (relative difference between actual consumption before and after the intervention) are obtained with the replacement of household appliances (7.6%), while the replacement of windows and the application of the thermocover increase the real consumption of the analysed households. The latter result might point to a rebound effect of some measures that improve the thermal envelope insulation [38]. It should be noted that, in this case study, the percentages of theoretical and actual savings are not comparable, the required energy consumption always being higher than the actual consumption. For example, in the case of households with electrical appliances replacement (where the relative theoretical savings are lower than the relative actual savings), the absolute theoretical savings (346 kWh/year) are significantly higher than the absolute actual savings (139 kWh/year), i.e., the theoretical consumption decreases more than the actual consumption in absolute terms. Finally, it should be noted that 30% of the households analysed have implemented multiple measures, and the results reflect the impact of all of them. This percentage of cases with multiple measures increases to 80% when considering only households with lighting system replacement; thus, their results are significantly influenced by other measures’ impact.
On the other hand, Figure 10 and Figure 11 show the same comparison according to two crucial variables for this type of study: the winter climate zone (ZCI) and the age of the building. In the first case, the figure shows how the average relative theoretical savings are higher for households living in the coldest climate zone (4.2% in D versus 3.1% in C). In the second case, households living in older buildings have calculated higher theoretical savings than households living in dwellings built between 1981 and 2007 (4.9% in the former compared to 2.4% in the latter). On the other hand, in all the cases shown in Figure 10 and Figure 11, actual consumption after the renovation is higher than before the renovation, again pointing to the possible rebound effect. To confirm that this rebound is indeed operating, it would be necessary to complement this analysis with qualitative fieldwork to identify the behaviour of households after retrofitting. This exercise is beyond the scope of this study. It should be noted that it is not possible to directly relate the saving results to the two variables analysed, especially in a reduced sample of households, but this comparison can serve as a reference for future impact studies.
The following results have been obtained for the extent and depth of hidden EP in the analysed sample of households. Considering all the households in the sample analysed, the HEP indicator drops after the shallow renovation; in particular, it changes from having 89% of households in this situation of energy vulnerability to 79%, i.e., there is a 10% reduction in absolute term (11.2% in relative terms) in the incidence of hidden EP. On the other hand, the EP gap goes from around EUR 423/year to EUR 313/year, thus marking a positive effect of the interventions analysed on the EP situation of the analysed households.
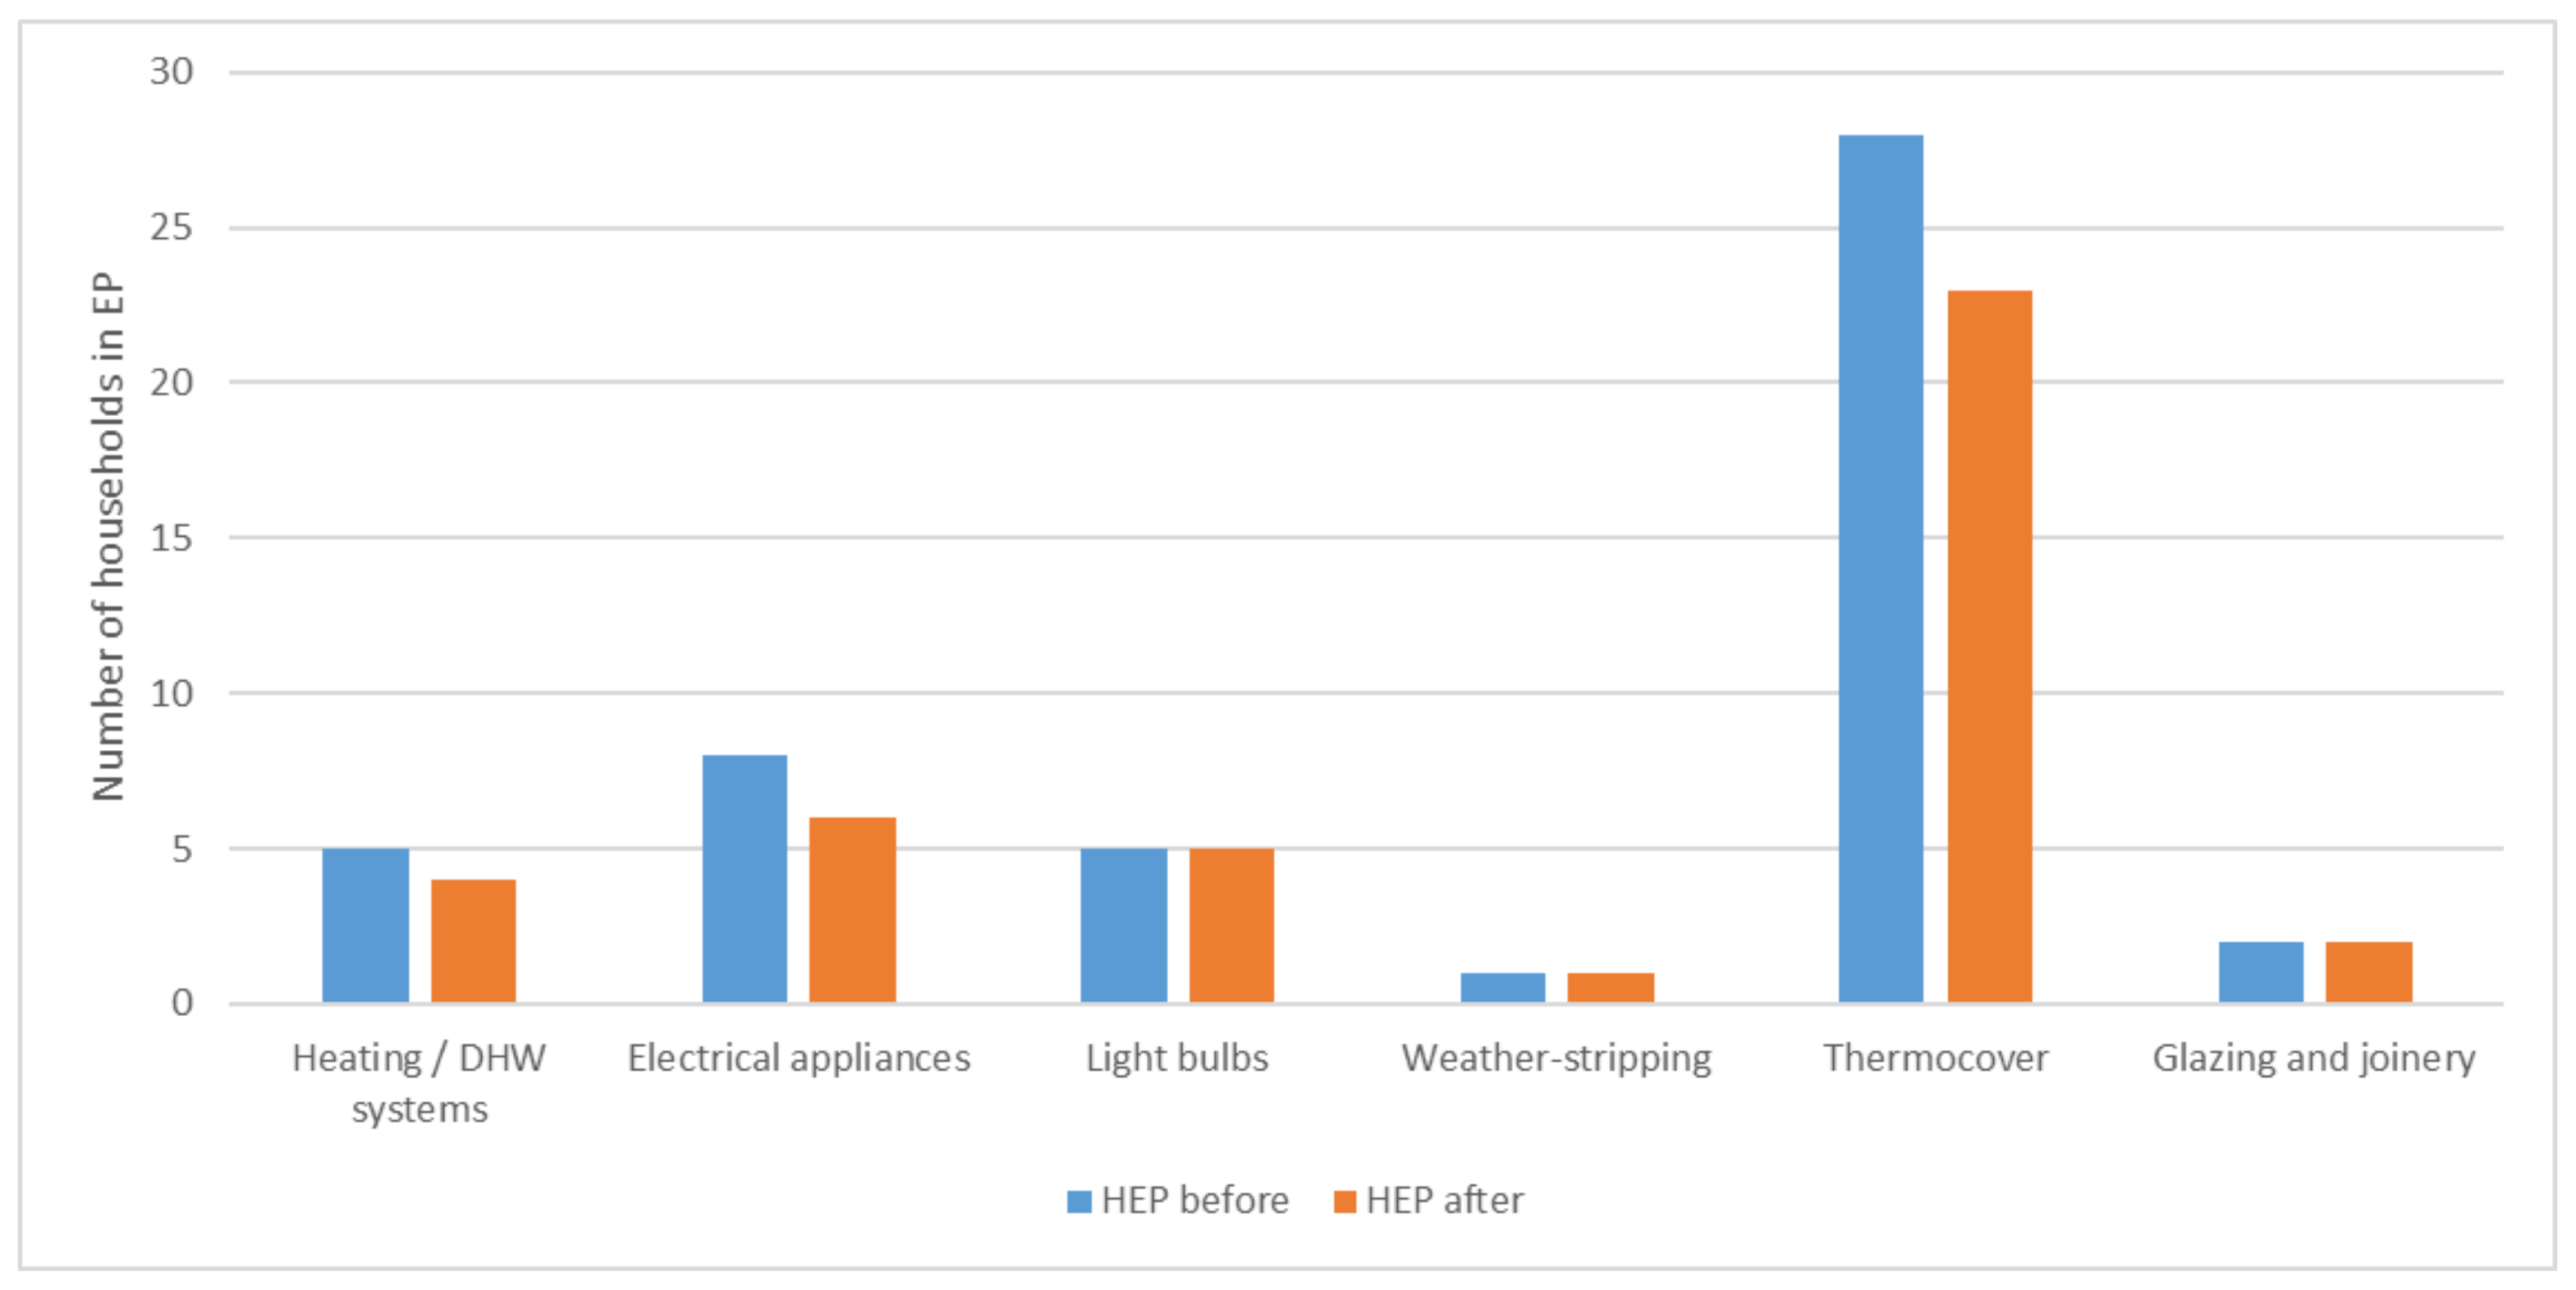
Figure 12 compares the results of the extent of HEP before and after retrofitting according to the measure implemented. The most effective measure in terms of percentage of households moving out of EP is the replacement of household appliances (producing a 25% drop), followed by the replacement of the heating or DHW system (20%).
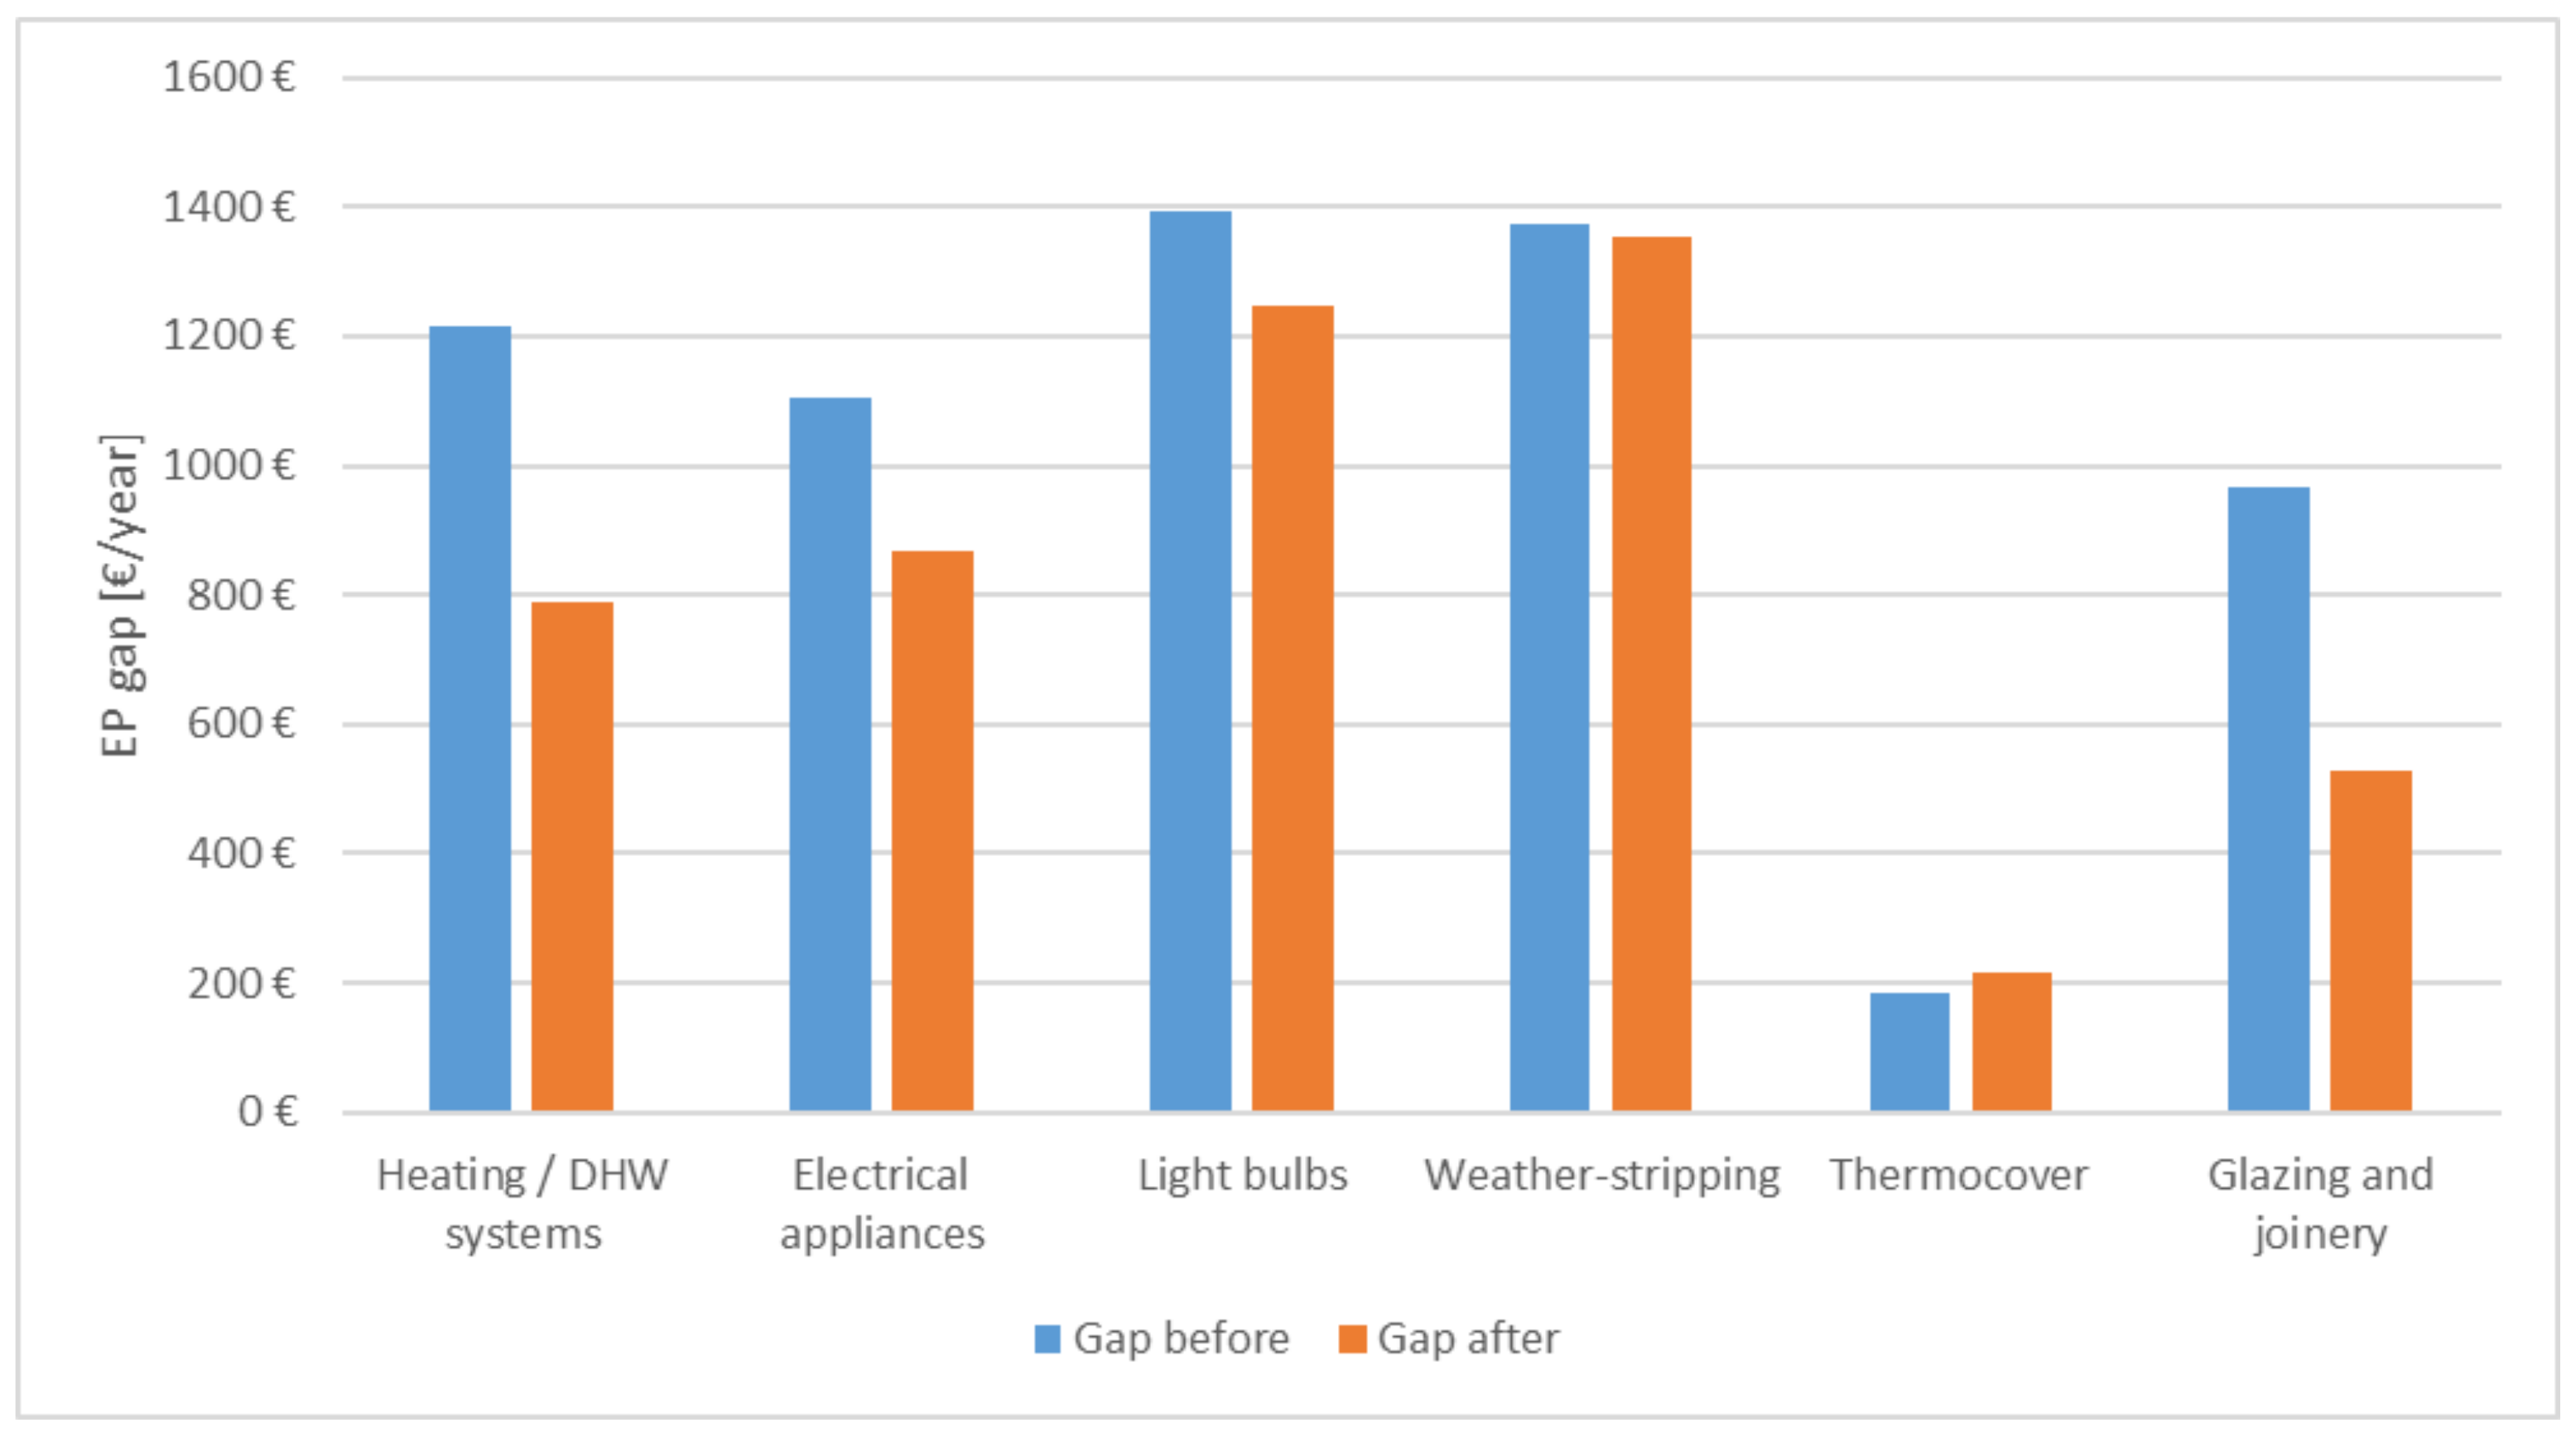
On the other hand, when comparing the EP gap before and after the intervention (Figure 13), the most effective measure in reducing the EP gap is the replacement of windows and joinery (45% reduction), followed by the replacement of the heating/DHW system (35%) and the replacement of household appliances (22%). These HEP extent/depth findings make it possible to unpack the different measures impacts, not limiting the insights on a binary result coming from a single thresholds indicator. For example, the two households with new windows do not manage to move out from EP due to their severe vulnerability and low energy efficiency (both households live in buildings constructed before 1981). However, they manage to reduce their EP gap considerably, i.e., their under-spending situation is greatly alleviated. In conclusion, it should be noted that the three most costly measures (higher investment) are the ones that most reduce the EP gap in the analysed households.
Finally, it should be highlighted that, in some cases, the positive impact of the implemented measures has been partially offset by the increase in energy prices experienced by the households in the sample. This phenomenon most acutely affected the households with thermocover installation, whose electricity price increase averagely by 18% after the intervention, causing their RENE to increase proportionally. Such a sharp price increase often provokes vulnerable households to reduce their energy consumption [5]. Thus, although the thermocover theoretically produced energy savings for these households, the impact was not enough to offset such a significant increase in energy prices (Figure 13).

4. Conclusions

This paper presents a methodology to assess the objective impact of shallow renovation on energy poverty (EP) by analysing both the actual and required energy expenditure of households. Subsequently, this study presents the results of its application to a representative sample of vulnerable households attended by the NGOs that collaborate with the Energy Renovation Solidarity Fund of Naturgy Foundation in Catalonia. In addition, the intrinsic value of this methodology is its applicability to any Spanish case study, which makes it a possible reference for studies throughout Spain and eventually an example for studies in other UE countries.
The local case study application was based on data collected by a primary survey of 54 households benefiting from the mentioned fund. Its subsequent processing for the estimation of their actual and required energy expenditures has provided an estimate of the extent and depth of hidden energy poverty (HEP indicator) in this sample of households. The former measures the percentage of households suffering from this situation of energy under-expenditure, while the latter (also called the EP gap) estimates the difference between half of a household’s required energy expenditure and its actual energy expenditure. In particular, the calculation has been repeated with the energy expenditure values (actual and required) before and after the shallow renovation interventions, i.e., the impact of the abovementioned retrofitting on the EP situation of the analysed population has been assessed. Considering all the households in the sample, the HEP indicator drops significantly after the shallow renovation; in particular, there is a 10% reduction in absolute terms (11.2% in relative terms) in the incidence of hidden EP in the analysed vulnerable population. On the other hand, the EP gap goes from around EUR 423/year to EUR 313/year, marking a positive effect of the analysed shallow renovation interventions on the EP situation of the studied households. In other words, these households are significantly closer to reaching the “comfort consumption” after the retrofitting than in the initial situation.
This paper also breaks down the results of the HEP impact assessment according to the measure implemented. The most effective measure (among those implemented in the considered sample) in terms of percentage of households moving out of hidden EP is the replacement of electrical appliances (producing a 25% drop), followed by the replacement of the heating or DHW system (20%). On the other hand, comparing the EP gap before and after the intervention, the most effective measure in reducing this gap in the paper’s case study is the replacement of windows (45% reduction), followed by the replacement of the heating or DHW system (35%) and the replacement of electrical appliances (22%).
These findings highlight the relevance of measuring both the extent and the depth of this social issue. Indeed, the overall EP incidence [%]—EP gap [€/year] picture makes it possible to not rely only on binary limited results. For instance, the deep interpretation of the paper’s results highlights that the households with window replacements do not manage to escape from EP due to their severe initial energy vulnerability situation, but they manage to reduce their EP gap considerably, i.e., their situation of under-spending is greatly alleviated. More generally, it is worth noting that the biggest reduction in the EP gap is verified in households where the three most costly measures (higher investment) were implemented.
In addition, to complete the case study EP picture, it is also necessary to consider that the positive impact of some measures has been partially offset by the increase in energy prices suffered by the households analysed, mostly in the period after the retrofitting interventions. However, the aforementioned results on the extent and depth of HEP reflect the potential greater resilience of vulnerable energy-rehabilitated households in facing extreme situations such as the energy crisis of 2021–2022.
Finally, the results of this paper suggest several recommendations that could be useful for decision-makers and organisations when designing and implementing shallow renovation interventions in dwellings. Cautiously extrapolating the data presented for the case study to the vulnerable population living in the same winter climate zones (tier 3 and 4 out of 5) in Spain, it can be concluded that, among the measures implemented in the sample, the replacement of heating systems, windows and electrical appliances are the measures that should be prioritised when deciding to undertake shallow renovation in vulnerable households. However, other very promising measures (at a theoretical level) that were not implemented in the sample analysed, i.e., the improvement of insulation in walls and roof, would have to be implemented to obtain a more thorough renovation of the thermal envelope of the dwelling. Finally, the benefits generated by the Naturgy Foundation’s Energy Renovation Solidarity Fund encourage society to continue promoting collaboration between entities to create solidarity networks that prevent the chronification of EP in Spain.
On the other hand, this study does not include the possible positive psychological impact of these measures, such as the possible improvement of the emotional well-being of the people benefiting from them and the empowerment and awareness of these people on energy management issues. The only behavioural features mentioned in this paper as a potential justification for the EP gap changes in some households are the so-called prebound and rebound effects. However, to confirm this outcome and complete the impact assessment, a qualitative analysis of the energy behaviour before and after retrofitting as well as temperature measurements would be needed, thus paving the way for potential interesting further work.

Author Contributions

Conceptualization, R.B. and J.C.R.; methodology, R.B. and J.C.R.; software, R.B.; validation, R.B.; formal analysis, R.B. and J.C.R.; investigation, R.B.; resources, R.B., A.L. and E.S.; data curation, R.B.; writing—original draft preparation, R.B.; writing—review and editing, R.B., J.C.R., A.L. and E.S.; visualization, R.B.; supervision, J.C.R., A.L. and E.S.; project administration, R.B. and E.S.; funding acquisition, R.B. and E.S. All authors have read and agreed to the published version of the manuscript.

Funding

This research was funded by Fundación Naturgy through the VAREX-2022 project.

Data Availability Statement

The data resulting from the primary survey carried out within this work are confidential.

Acknowledgments

The authors are especially grateful to all those who collaborated in this research work, in particular to Fundación Naturgy and the Third Sector organizations and local public administration that collaborated with the VAREX-2022 project: Asociación Bienestar y Desarrollo ABD, Associació AREP per la salut mental, Asociación Proyecto Confianza, Cruz Roja Española, Fundació Roure, Fundació Hàbitat3, Fundació Joia, Prevencion Asistencia y Seguimiento (PAS), Fundació Mambré, and OFIMAPE (Ayuntamiento de Terrassa).

Conflicts of Interest

The authors declare no conflict of interest. The funder had no role in the design of the study; in the collection, analyses, or interpretation of data; or in the writing of the manuscript. The funder agreed to publish the results.

Appendix A

Questionnaire for the evaluation of energy savings generated by shallow renovation
  • Household ID *
Add the code/reference number of the shallow renovation intervention in the solidarity fund programme or other reference to identify the household.
A. Energy bills
Ignore this section if you have sent your utility bills.
2.
Electricity consumption before refurbishment (kWh/month)
Monthly average from available invoices
3.
Electricity cost before refurbishment (€/month)
Monthly average from available invoices
4.
Electricity consumption after refurbishment (kWh/month)
Monthly average from available invoices
5.
Electricity costs after refurbishment (€/month)
Monthly average from available invoices
6.
Fuel consumption before rehabilitation (kWh/month or cylinders/month)
Monthly average based on available information
7.
Fuel expenditure before refurbishment (€/month)
Monthly average based on available information
8.
Fuel consumption after refurbishment (kWh/month or cylinders/month)
Monthly average based on available information
9.
Fuel costs after refurbishment (€/month)
Monthly average based on available information
10.
From how many billing months is the estimate of consumption and expenses made?
Specifies the billing/payment months for each supply.
B. Energy efficiency interventions
11.
Scope of retrofitting
-
Repair of boiler/heating appliance (e.g., heaters)
-
Replacement of boiler/heating appliance (e.g., heaters)
-
Installation/replacement/repair of boiler/heating appliance (e.g., heaters)
-
Installation/replacement/repair of thermos flasks
-
Replacement of household appliances LED bulbs
-
Sealing of doors and windows (weather-stripping)
-
Replacement of shutters/box insulation
-
Awnings
-
Insulation in walls
-
Insulation in roofs
-
Replacement of windows (glazing and carpentry)
-
Replacement of glazing
-
Other:
12.
Which electrical appliances were replaced?
Answer only if there was replacement of appliances with more efficient ones.
-
Electric cooker (hobs)
-
Electric oven
-
Washing Machine Tumble Dryer Fridge
-
Freezer Dishwasher Microwave
13.
Dates of interventions *
C. Household characteristics
14.
Locality *
15.
Type of dwelling *
-
Single Family
-
Block
16.
Age of the dwelling
-
Pre–1981 1981–2007
-
Post 2007
-
I don’t know
17.
Energy rating of the dwelling before renovation
-
A
-
B
-
C
-
D
-
E
-
F
-
G
-
I don’t know
18.
Energy rating of the dwelling after renovation
-
A
-
B
-
C
-
D
-
E
-
F
-
G
-
I don’t know
19.
Approximate size of the dwelling (m2) *
20.
Number of household members *
-
1
-
2
-
3
-
4
-
More than 4
21.
Occupation of household members
-
Employed Unemployed
-
Student
-
Pensioner
-
Early retiree
-
Receiving a permanent disability or invalidity pension
-
Receiving a widow’s, widower’s or orphan’s pension
-
Doing housework
-
Other inactive situation
22.
Range of monthly household income (€/month)
-
Less than 600€
-
600€–1000€
-
1000€–1500€
-
1500€–2200€
-
More than 2200€.
23.
Type of main heating system *
-
Individual: individual for the whole house.
-
Central: Centralised for the whole building.
-
Appliances: Portable or only in one room.
-
None
24.
Energy supply of the main heating system *
-
Natural gas
-
LPG: Butane or propane
-
Gasoil
-
Biomass
-
Coal
-
Electricity (storage heaters) Electricity (radiators)
-
Electricity (heat pump)
-
N/A
25.
Type of hot water system *
-
Individual: Only for my home.
-
Central: Centralised system for the whole building.
-
None
26.
Hot water system energy supply *
-
Natural gas
-
LPG: Butane or Propane
-
Biomass
-
Coal
-
Electricity
-
N/A
27.
Do you have air conditioning? *
-
Yes
-
No
28.
Appliances available in the dwelling *
-
Electric cooker (hobs)
-
Electric oven
-
Washing machine
-
Tumble dryer
-
Fridge with freezer compartment
-
Freezer (in addition to the fridge)
-
TV
-
Computer
-
Dishwasher
-
Mobile phone
-
Tablet
-
Microwave
* Mandatory question
Table A1. Heating seasonal performance factors (HSPF) for old systems (commonly installed in buildings constructed before 2007).
SystemIndividualCentralPortable
LPG0.750.70.65
Heating Gasoil0.70.650.65
Biomass0.350.40.3
Coal0.40.450.45
Natural Gas0.750.70.7
Electricity (radiators)0.990.990.95
Electricity (heat storage units)0.990.990.96
Heat pump3.23.23.2
Table A2. Heating seasonal performance factors (HSPF) for new systems (commonly installed in buildings constructed from 2007 onwards).
SystemIndividualCentralPortable
LPG0.890.830.77
heating gasoil0.830.770.77
biomass0.700.680.51
natural gas0.910.850.85
electricity (radiators)1.001.000.96
electricity (heat storage units)1.001.000.96
heat pump3.93.93.9
Table A3. Seasonal performance factors (SPF) for domestic hot water production for old systems (commonly installed in buildings constructed before 2007).
SystemIndividualCentral
LPG0.76790.8092
gasoil0.76790.8092
biomass0.350.4
coal0.40.45
natural gas0.76790.8092
electricity0.990.99
Table A4. Seasonal performance factors (SPF) for domestic hot water production for new systems (commonly installed in buildings constructed from 2007 onwards).
SystemIndividualCentral
LPG0.84530.8907
gasoil0.76790.8092
biomass0.7140.714
natural gas0.84530.8907
electricity0.990.99

References

  1. Santamouris, M.; Kapsis, K.; Korres, D.; Livada, I.; Pavlou, C.; Assimakopoulos, M.N. On the Relation between the Energy and Social Characteristics of the Residential Sector. Energy Build. 2007, 39, 893–905. [Google Scholar] [CrossRef]
  2. Barrella, R.; Palma, P.; Gouveia, J.P.; Romero, J.C.; Arenas, E.; Linares, J.I. Toward an Integrated Policy Framework to Address Energy Poverty in the Iberian Peninsula: An Exploratory Analysis. 2023. Available online: https://www.iit.comillas.edu/publicacion/workingpaper/en/450/Toward_an_integrated_policy_framework_to_address_energy_poverty_in_the_Iberian_Peninsula:_an_exploratory_analysis (accessed on 18 September 2023).
  3. INE. Encuesta de Presupuestos Familiares. 2019. Available online: https://www.ine.es/dyngs/INEbase/es/operacion.htm?c=Estadistica_C&cid=1254736176806&menu=ultiDatos&idp=1254735976608 (accessed on 29 January 2021).
  4. Bouzarovski, S.; Burbidge, M.; Stojilovska, A. Deliverable 2.6 Report on Energy Poverty in the PRS—Overview & Framework; Version 2020/3; University of Manchester: Manchester, UK, 2020. [Google Scholar]
  5. Romero Mora, J.C.; Barrella, R.; Centeno Hernáez, E. Informe de Indicadores de Pobreza Energética En España 2021. 15 November 2022. Available online: http://hdl.handle.net/11531/75498 (accessed on 18 September 2023).
  6. Sgaravatti, G.; Tagliapietra, S.; Trasi, C.; Zachmann, G. National Policies to Shield Consumers from Rising Energy Prices. Available online: https://www.bruegel.org/dataset/national-policies-shield-consumers-rising-energy-prices (accessed on 21 April 2023).
  7. De Luxán García De Diego, M.; Sánchez-Guevara Sánchez, C.; Román López, E.; del Mar Barbero Barrera, M.; Gómez Muñoz, G. Re-Habilitación Exprés Para Hogares Vulnerables. Soluciones de Bajo Coste. 2017. Available online: https://estaticos.naturgy.com/fundacion/rehabilitacion-energetica-expres-para-hogares-vulnerables/ (accessed on 18 September 2023).
  8. De Luxán García De Diego, M.; Sánchez-Guevara Sánchez, C.; Román López, E.; del Mar Barbero Barrera, M.; Gómez Muñoz, G. Re-Habilitación Exprés Para Hogares Vulnerables. Soluciones de Bajo Coste (Actualización Mayo 2022). 2022. Available online: https://www.fundacionnaturgy.org/publicacion/re-habilitacion-energetica-expres-para-hogares-vulnerables-soluciones-de-bajo-coste-actualizacion-2022/ (accessed on 18 September 2023).
  9. Sánchez-Guevara Sánchez, C.; Mavrogianni, A.; Neila González, F.J. On the Minimal Thermal Habitability Conditions in Low Income Dwellings in Spain for a New Definition of Fuel Poverty. Build. Environ. 2017, 114, 344–356. [Google Scholar] [CrossRef]
  10. Tirado Herrero, S.; López Fernández, J.L.; Martín García, P. Pobreza Energética En España. Potencial de Generación de Empleo Derivado de La Rehabilitación Energética de Viviendas; Asociación de Ciencias Ambientales: Madrid, Spain, 2012. [Google Scholar]
  11. ATECYR. Guía Técnica de Instalaciones de Calefacción Individual; IDAE: Madrid, Spain, 2012. [Google Scholar]
  12. AICIA. IDAE, Escala de Calificación Energética Para Edificios Existentes; IDAE: Madrid, Spain, 2011. [Google Scholar]
  13. Fundación Naturgy. Fondo Solidario de Rehabilitación Energética. Available online: https://www.fundacionnaturgy.org/accion-social/plan-vulnerabilidad-energetica/fondo-solidaridad-rehabilitacion-energetica/ (accessed on 11 May 2023).
  14. Fundación Naturgy. Re-Habilitación Energética Exprés. Análisis y Aportaciones de Las Entidades Sociales . 2022. Available online: https://www.fundacionnaturgy.org/publicacion/re-habilitacion-energetica-expres-analisis-y-aportaciones-de-las-entidades-sociales/ (accessed on 18 September 2023).
  15. Luján Torres, C.; Moliner Galbis, J.; Rodríguez Hernández, J.C.; Vilariño Feltrer, G. Impacto de Las Rehabilitaciones Exprés Sobre La Pobreza Energética En Valencia; Universitat Politècnica de València: Valencia, Spain, 2022. [Google Scholar]
  16. Gómez-Navarro, T.; Calero-Pastor, M.; Pellicer-Sifres, V.; Lillo-Rodrigo, P.; Alfonso-Solar, D.; Pérez-Navarro, Á. Fuel Poverty Map of Valencia (Spain): Results of a Direct Survey to Citizens and Recommendations for Policy Making. Energy Policy 2021, 151, 112162. [Google Scholar] [CrossRef]
  17. Barrella, R.; Linares, J.I.; Romero, J.C.; Arenas, E. Evaluating the Impact of Energy Efficiency Strategies on Households’ Energy Affordability: A Spanish Case Study. Energy Build. 2023, 295, 113289. [Google Scholar] [CrossRef]
  18. Sanchez-Guevara, C.; Fernandez, A.S.; Aja, A.H. Income, Energy Expenditure and Housing in Madrid: Retrofitting Policy Implications. Build. Res. Inf. 2015, 43, 737–749. [Google Scholar] [CrossRef]
  19. Romero, J.C.; Barrella, R.; Centeno, E. Understanding the Impact of COVID-19 Lockdown on Energy Poverty in Spain. Energy Effic. 2023, 16, 56. [Google Scholar] [CrossRef]
  20. Bienvenido-Huertas, D.; Sanz Fernández, A.; Sánchez-Guevara Sánchez, C.; Rubio-Bellido, C. Assessment of Energy Poverty in Andalusian Municipalities. Application of a Combined Indicator to Detect Priorities. Energy Rep. 2022, 8, 5100–5116. [Google Scholar] [CrossRef]
  21. Marí-Dell’Olmo, M.; Oliveras, L.; Vergara-Hernández, C.; Artazcoz, L.; Borrell, C.; Gotsens, M.; Palència, L.; López, M.J.; Martinez-Beneito, M.A. Geographical Inequalities in Energy Poverty in a Mediterranean City: Using Small-Area Bayesian Spatial Models. Energy Rep. 2022, 8, 1249–1259. [Google Scholar] [CrossRef]
  22. Domínguez-Amarillo, S.; Fernández-Agüera, J.; Peacock, A.; Acosta, I. Energy Related Practices in Mediterranean Low-Income Housing. Build. Res. Inf. 2020, 48, 34–52. [Google Scholar] [CrossRef]
  23. Guevara, Z.; Mendoza-Tinoco, D.; Silva, D. The Theoretical Peculiarities of Energy Poverty Research: A Systematic Literature Review. Energy Res. Soc. Sci. 2023, 105, 103274. [Google Scholar] [CrossRef]
  24. Meyer, S.; Laurence, H.; Bart, D.; Middlemiss, L.; Maréchal, K. Capturing the Multifaceted Nature of Energy Poverty: Lessons from Belgium. Energy Res. Soc. Sci. 2018, 40, 273–283. [Google Scholar] [CrossRef]
  25. Barrella, R.; Romero, J.C.; Linares, J.I.; Arenas, E.; Asín, M.; Centeno, E. The Dark Side of Energy Poverty: Who Is Underconsuming in Spain and Why? Energy Res. Soc. Sci. 2022, 86, 102428. [Google Scholar] [CrossRef]
  26. EPAH. Abordar La Pobreza Energética a Través de Acciones Locales. Casos Ejemplares de Toda Europa; EU Energy Poverty Advisory Hub, DG Energy, European Commission: Brussels, Belgium, 2021. [Google Scholar]
  27. Palma, P.; Gouveia, J.P. Bringing Energy Poverty Research into Local Practice: Exploring Subnational Scale Analyses; EU Energy Poverty Advisory Hub, DG Energy, European Commission: Brussels, Belgium, 2022. [Google Scholar]
  28. Ahora. Un 88% de Familias Atendidas Por Cruz Roja No Entiende La Factura Eléctrica. Available online: https://www2.cruzroja.es/web/ahora/-/informe-pobreza-energetica-cruz-roja-ecodes (accessed on 9 October 2023).
  29. IDAE. Informe Anual de Consumos Energéticos. Evolución 2010–2018; IDAE: Madrid, Spain, 2020. [Google Scholar]
  30. Castaño-Rosa, R.; Barrella, R.; Sánchez-Guevara, C.; Barbosa, R.; Kyprianou, I.; Paschalidou, E.; Thomaidis, N.S.; Dokupilova, D.; Gouveia, J.P.; Kádár, J.; et al. Cooling Degree Models and Future Energy Demand in the Residential Sector. A Seven-Country Case Study. Sustainability 2021, 13, 2987. [Google Scholar] [CrossRef]
  31. Barrella, R. Addressing Energy Poverty in an Integrated Way. An Interdisciplinary Characterisation of Spanish Vulnerable Households and Proposal for Implementing Feasible Technical and Policy Solutions; Universidad Pontificia Comillas: Madrid, Spain, 2022. [Google Scholar]
  32. Borque Angulo, G. Estudio de La Influencia de La Eficiencia Energética de Los Diferentes Electrodomésticos de Un Hogar Español En Su Gasto Eléctrico; Universidad Pontificia Comillas: Madrid, Spain, 2022. [Google Scholar]
  33. Fernández Pedraz, M. Desarrollo de Un Modelo de Cálculo Del Consumo Eléctrico Por Iluminación En Un Hogar Español; Universidad Pontificia Comillas: Madrid, Spain, 2022. [Google Scholar]
  34. El Corte Inglés. Película Aislante Ventanas Thermo Cover. Tesa. Available online: https://www.elcorteingles.es/bricor/A22399373-pelicula-aislante-ventanas-thermo-cover/?/ (accessed on 23 July 2011).
  35. CNMC. Simulador Factura de La Luz. Available online: https://facturaluz2.cnmc.es/facturaluz2.html#! (accessed on 3 April 2020).
  36. Cansino, J.M.; Ordóñez, M.; Prieto, M. Decomposition and Measurement of the Rebound Effect: The Case of Energy Efficiency Improvements in Spain. Appl. Energy 2022, 306, 117961. [Google Scholar] [CrossRef]
  37. Sunikka-Blank, M.; Galvin, R. Introducing the Prebound Effect: The Gap between Performance and Actual Energy Consumption. Build. Res. Inf. 2012, 40, 260–273. [Google Scholar] [CrossRef]
  38. Seebauer, S. The Psychology of Rebound Effects: Explaining Energy Efficiency Rebound Behaviours with Electric Vehicles and Building Insulation in Austria. Energy Res. Soc. Sci. 2018, 46, 311–320. [Google Scholar] [CrossRef]
Figure 1. Reduction in the required heating demand [%] in Barcelona according to the passive measure implemented.
Energies 16 07237 g001
Figure 2. Reduction in the required heating demand [%] in La Coruña according to the passive measure implemented.
Energies 16 07237 g002
Figure 3. Reduction in the required heating demand [%] in Madrid according to the passive measure implemented.
Energies 16 07237 g003
Figure 4. Reduction in the required heating demand [%] in Sevilla according to the passive measure implemented.
Energies 16 07237 g004
Figure 5. Example of electricity consumption record in the months prior to the invoice (prepared by the author based on electricity bill data).
Energies 16 07237 g005
Figure 6. Disaggregation of study households by partner organisation attending them.
Energies 16 07237 g006
Figure 7. Distribution of study households by locality of residence.
Energies 16 07237 g007
Figure 8. Number of interventions that were carried out in the analysed dwellings according to the classification of the study.
Energies 16 07237 g008
Figure 9. Average of half of the required energy consumption (REC/2) and actual consumption before and after retrofitting according to the type of measure implemented.
Energies 16 07237 g009
Figure 10. Average of half of the required energy consumption (REC/2) and actual consumption before and after retrofitting according to the winter climate zone (ZCI).
Energies 16 07237 g010
Figure 11. Average of half of the required energy consumption (REC/2) and actual consumption before and after retrofitting according to the building age.
Energies 16 07237 g011
Figure 12. Results of the extent of HEP before and after retrofitting by measure implemented [number of households in energy poverty].
Energies 16 07237 g012
Figure 13. EP gap before and after retrofitting according to the implemented measure.
Energies 16 07237 g013
Table 1. Reduction in the required heating consumption resulting from the replacement of the old system by a new one.
SystemIndividualCentralPortable
LPG15.7%15.7%15.6%
Heating gasoil15.7%15.6%15.6%
Biomass50.0%41.2%41.2%
Natural gas17.6%17.6%17.6%
Electricity (radiators)1.0%1.0%1.0%
Electricity (heat storage units)1.0%1.0%1.0%
Heat pump17.9%17.9%17.9%
Table 2. Reduction in consumption required for domestic hot water production resulting from replacing the old system with a new one.
SystemIndividualCentral
LPG9.2%9.2%
Gasoil0.0%0.0%
Biomass51.0%44.0%
Natural gas9.2%9.2%
Electricity0.0%0.0%
Table 3. Consumption and savings from old to new electrical appliance for an average three-member household (own elaboration from [32]).
ApplianceOld Consumption [kWh/Year]New Consumption [kWh/Year]Absolute Savings [kWh/Year]Unit Reduction [%]Total Reduction [%]
Refrigerator105511685189.0%15.4%
Freezer111312299089.0%16.2%
Washing machine58320637764.7%6.2%
Dishwasher61923338662.4%6.3%
Tumble dryer99315783684.2%13.7%
Oven1932616786.5%2.7%
Table 4. Power equivalence of the different types of 20 W bulbs with respect to LED (W).
Bulb TypeLED Power Equivalence (W)
Fluorescent10.90
Halogen4.54
Low consumption15.45
“Standard bulb”10.3
Table 5. Reduction in lighting consumption (unit consumption reduction) generated by switching from 20 W old bulbs to LED bulbs.
Bulb TypePower Difference (W)Unit Consumption Reduction [%]
Fluorescent9.145.5%
Halogen15.577.3%
Low consumption4.522.7%
“Standard bulb”9.748.5%
Table 6. Reduction in the required heating demand after the application of a thermocover.
Climate ZoneHeating Demand Reduction in Single Glazing [%]Heating Demand Reduction in Double Glazing [%]
Zone C3.7%1.7%
Zone D3.0%1.4%
Disclaimer/Publisher’s Note: The statements, opinions and data contained in all publications are solely those of the individual author(s) and contributor(s) and not of MDPI and/or the editor(s). MDPI and/or the editor(s) disclaim responsibility for any injury to people or property resulting from any ideas, methods, instructions or products referred to in the content.