Article

Heat Production Performance from an Enhanced Geothermal System (EGS) Using CO2 as the Working Fluid

1
National Key Laboratory of High-Efficiency Flexible Coal Power Generation and Carbon Capture Utilization and Storage, Beijing 102209, China
2
China Huaneng Clean Energy Research Institute, Beijing 102209, China
3
Key Laboratory of Groundwater Resources and Environment Ministry of Education, Jilin University, Changchun 130021, China
4
Fujian Branch of China Huaneng Group, Fuzhou 350000, China
*
Author to whom correspondence should be addressed.
Energies 2023, 16(20), 7202; https://doi.org/10.3390/en16207202
Submission received: 1 September 2023 / Revised: 17 October 2023 / Accepted: 19 October 2023 / Published: 23 October 2023
(This article belongs to the Special Issue The Status and Development Trend of Geothermal Resources)

Abstract

:
CO2-based enhanced geothermal systems (CO2-EGS) are greatly attractive in geothermal energy production due to their high flow rates and the additional benefit of CO2 geological storage. In this work, a CO2-EGS model is built based on the available geological data in the Gonghe Basin, Northwest China. In our model, the wellbore flow is considered and coupled with a geothermal reservoir to better simulate the complex CO2 flow and heat production behavior. Based on the fractured geothermal reservoir at depths between 2900 m and 3300 m, the long-term (30-year) heat production performance is predicted using CO2 as the working fluid with fixed wellhead pressure. The results indicate that the proposed CO2-EGS will obtain an ascending heat extraction rate in the first 9 years, followed by a slight decrease in the following 21 years. Due to the significant natural convection of CO2 (e.g., low viscosity and density) in the geothermal reservoir, the mass production rate of the CO2-EGS will reach 150 kg/s. The heat extraction rates will be greater than 32 MW throughout the 30-year production period, showing a significant production performance. However, the Joule–Thomson effect in the wellbore will result in a drastic decrease in production temperature (e.g., a 62.6 °C decrease in the production well). This means that the pre-optimization analyses and physical material treatments are required during geothermal production using CO2 as the working fluid.

1. Introduction

Geothermal energy is considered the most promising form of renewable energy because it is clean, stable and sustainable [1,2,3]. It is gradually believed that geothermal energy can contribute to the realization of a carbon-neutral society [4]. However, most of the available geothermal resources are stored in deep hot dry rock (HDR) [5]. Generally, the available HDR geothermal resources are buried 3–10 km underground with high temperatures ranging from 150 to 650 °C [6]. However, there is commonly no water and steam in HDR reservoirs because of their naturally low permeability and porosity.
Geothermal energy stored in HDR can be efficiently extracted and used for electricity generation based on an enhanced geothermal system (EGS) [7]. So far, more than 60 EGS sites have been tested around the world [8,9]. These EGS projects have basically indicated the feasibility of exploiting geothermal resources from the HDR. In the past, water was generally considered as the working fluid used in conventional EGSs. However, due to the serious problem of water loss in water-based enhanced geothermal systems (e.g., water-EGSs) [10], carbon dioxide-based enhanced geothermal systems (e.g., CO2-EGSs) have become an attractive option [11,12,13]. Obviously, CO2-EGSs have four advantages compared to water-EGSs: (1) the lower effect of scale precipitation induced by the water–rock reaction [14]; (2) the thermosiphon effect, which reduces external consumption [15]; (3) the environmental benefits related to CO2 geological sequestration [16]; and (4) the higher mass flow rate and lower flow impedance due to the higher flow mobility (e.g., low viscosity and density) of CO2 [17].
Although a CO2-EGS is theoretically feasible, it has not yet been experimentally tested in the EGS field. This is mainly because there are many challenges for field demonstration projects of CO2-EGSs. However, numerical simulation is a very useful and economical method for investigating the heat production performance of EGSs using CO2 as the working fluid. Based on the five-spot-well configuration, Pruess [16] conducted and compared numerical simulations on a CO2-EGS and a water-EGS. Their results indicated that the heat production power increased by about 50% when using the CO2-EGS compared to the water-EGS, because the mass flow rate of CO2 increased about four-fold [16]. Based on the doublet well configuration, Atren et al. [18,19] analyzed the potential of power generation using CO2 as the working fluid. They found that the heat production efficiency of the CO2-EGS was significantly dependent on the wellbore properties (e.g., diameter, thermal conductivity) and geothermal reservoir (e.g., temperature and pressure) conditions. Generally, the heat production performance of CO2-EGSs is significantly better than that of water-EGSs, especially for geothermal reservoirs with lower permeability [18,19]. Pan et al. [20,21] used supercritical CO2 as the working fluid to study geothermal production potential using the T2WELL code (e.g., a wellbore–reservoir coupled model). Their results showed that a good thermosiphon effect was achieved when using CO2 as the working fluid, thus significantly reducing the external cost for pumping. Hu et al. [22] conducted a wellbore–reservoir coupled numerical model to investigate the heat production performance in a closed-loop geothermal system through CO2 fluid circulation. Their results also suggested that the heat production efficiency of CO2 is greater than water for a closed-loop geothermal system.
These mentioned numerical studies have suggested the superiority of CO2 as a working fluid used for geothermal exploitation. It is worth noting that hydraulic fracturing is the main method used in EGSs to create a fracture network in low-permeability HDR [23]. However, most of the previous numerical models have employed homogeneous geothermal reservoirs to represent the fractured geothermal reservoir. This leads to an inaccurate prediction of fluid and heat flow, heat exchange between fractures and the rock matrix, and heat production efficiency in the fractured geothermal reservoir. In addition, the complex heat exchanges between the borehole and geothermal reservoir in a CO2-EGS should be fully considered, because the physical properties of CO2 (e.g., viscosity, density, compressibility, etc.) are very sensitive to the temperature and pressure changes in the wellbore [15,24].
In this work, a CO2-EGS model is built based on the first EGS demonstration project in the Gonghe Basin, Northwest China. The “multiple interacting continua (MINC)” numerical method is employed in our model to study the effects of a heterogeneous EGS reservoir on heat production. In addition, both the wellbore flow and reservoir flow are considered in our model by using the T2WELL (version 2) software. On this basis, the heat production efficiency of the CO2-EGS is evaluated using a fixed wellhead pressure. The main targets are to (1) predict the heat production potential from the heterogeneous EGS reservoir, and (2) analyze the complex fluid flow and heat exchange processes in the geothermal reservoir and borehole during heat recovery. In addition, the results presented in this work give a theoretical guide for CO2-EGS design in the Gonghe Basin and other geothermal fields with similar reservoir conditions.

2. Numerical Method

2.1. Geothermal Characteristics of the Gonghe Basin

The Gonghe Basin lies at the conjunction and transformation of several orogenic belts, including the Qinling, Qilian, and Kunlun orogens in central China [25,26]. It is believed that the Gonghe Basin is an important region in China for high-temperature geothermal exploitation due to its intense tectonic activity [27]. The drilling data suggest that the deep formations are Triassic strata and Indosinian–Yanshanian granite at the Gonghe Basin [28,29]. This indicates that the deep rock mass has high temperature potential. In addition, the geothermal exploitation potential of the Gonghe Basin can be significantly reflected by the following points: (1) the field survey results indicated a great number (over 84) of geothermal anomaly sites (e.g., hot springs) [26]; (2) the average value of heat flow reaches 102.2 mW/m2 in the Qiabuqia geothermal area [30]; (3) the HDR exploration wells (e.g., DR3, DR4, and GR2) proved that the temperature is around 180 °C at the 3000 m depth; and (4) the GR1 well drilled to the highest temperature of 236 °C at the depth of 3705 m [26,30]. According to the deep well drilling results (Figure 1), the average value of the geothermal gradient is about 45 °C/km at the depth of 2500–3705 m. These results indicated that the HDR geothermal resources in the Gonghe Basin have great potential for development.
Recently, the Gonghe Basin was selected as the target area for developing the first EGS demonstration project in China. On this basis, many numerical models were built to investigate the heat production potential of the Gonghe Basin. These simulation studies suggested that water-EGSs show great production performance in the Gonghe Basin [27,31,32,33]. However, the Gonghe Basin is a semi-arid area and its water is precious and scarce [34]. This is in contradiction with the development of HDR geothermal resources, which consume a lot of water. Thus, using CO2 as the working fluid may be an alternative method for geothermal exploitation at the Gonghe Basin and other EGS sites where water is scarce. Generally, the CO2 can come from large coal-fired power plants because these can produce about tens of thousands of tons of CO2 per day [16].

2.2. Numerical Simulator

In this work, the wellbore–reservoir coupled simulator T2Well was used to investigate the heat production performance at the Gonghe Basin geothermal site. T2Well was developed by integrating the wellbore model into the existing reservoir code TOUGH2 [35], and thus can be used to investigate the heat production from both porous and fractured geothermal systems [36]. To solve the geothermal production using CO2 as the working fluid, the equation of state (e.g., ECO2H module) for the H2O-CO2-NaCl system was considered in our numerical model. In a geothermal reservoir, the fluid flow is calculated by Darcy’s multiphase law, while the wellbore flow is based on the momentum conservation. The main governing equations for mass and heat transfer in a geothermal system are given as follows:
The fluid flow in the formation is observed via Darcy’s law; thus, the mass balance equation in the reservoir can be defined as:
t ρ w ϕ = k ρ w μ w P + ρ w g + q m
where ρ w is the circulation fluid density (CO2 is considered in this work), kg/m3; ϕ is the porosity of the geothermal reservoir; t is the time, s; μ w is the circulation fluid viscosity, Pa·s; k is the permeability of the geothermal reservoir, m2; P is the pressure, Pa; and q m is the mass source.
The local thermal equilibrium model is used to describe the overall heat transfer in the formation, and the energy balance equation is:
t ρ r C r T 1 ϕ + ϕ ρ w μ w = 1 ϕ λ r + ϕ λ w T + h w r k ρ w μ w P w + ρ w g + q h
where C r is the heat capacity of the geothermal reservoir rocks, kJ/kg·°C; ρ r is the rock density, kg/m3; q h is the heat source; and h w r is the fluid-specific enthalpy in the geothermal reservoir, J/kg.
Due to the high velocity of fluid flow in the wellbore, the mass balance equation for single phase flow in a wellbore can be defined as follows based on momentum conservation:
ν i t = ν i ν i z 1 ρ w P i z + g cos θ Γ w i τ w i A i
where v is the fluid velocity in the wellbore, m/s; θ is the incline angle of the wellbore, °; A is the fluid flow area in the wellbore, m2; Γ w is the perimeter of the wellbore section, m; z is the along-wellbore coordinate; and τ w i is the wellbore shear stress in the wellbore, Pa, which is a function of fluid and wellbore properties, and can be calculated as Equation (4):
τ w i = 1 2 f ρ ν i ν i f = 16 R e , R e < 2400 1 f = 4 l o g 2 ε 3.7 d w i 5.02 R e l o g 2 ε 3.7 d w i + 13 R e , R e 2400
where d w i is the diameter for wellbore i, m; and ε is the roughness of the wellbore (dimensionless).
The energy balance in the wellbore can be defined as:
h w i t P i t + ρ w ν i ν i t = ρ ν i h w i z + λ w i 2 T z 2 ρ v 2 ν i z ρ w ν i g cos θ + Q
where h w i is the fluid-specific heat in the wellbore, J/kg; λ w i is the thermal conductivity of the wellbore, W/m °C; and Q is the heat exchange between the wellbore and the surrounding formation.
The detailed governing equations and numerical solution can be found in Pan and Oldenburg [36]. This code has been demonstrated for geothermal production at several geothermal fields [15,22,24,37,38].

2.3. Model Geometry and Numerical Discretization

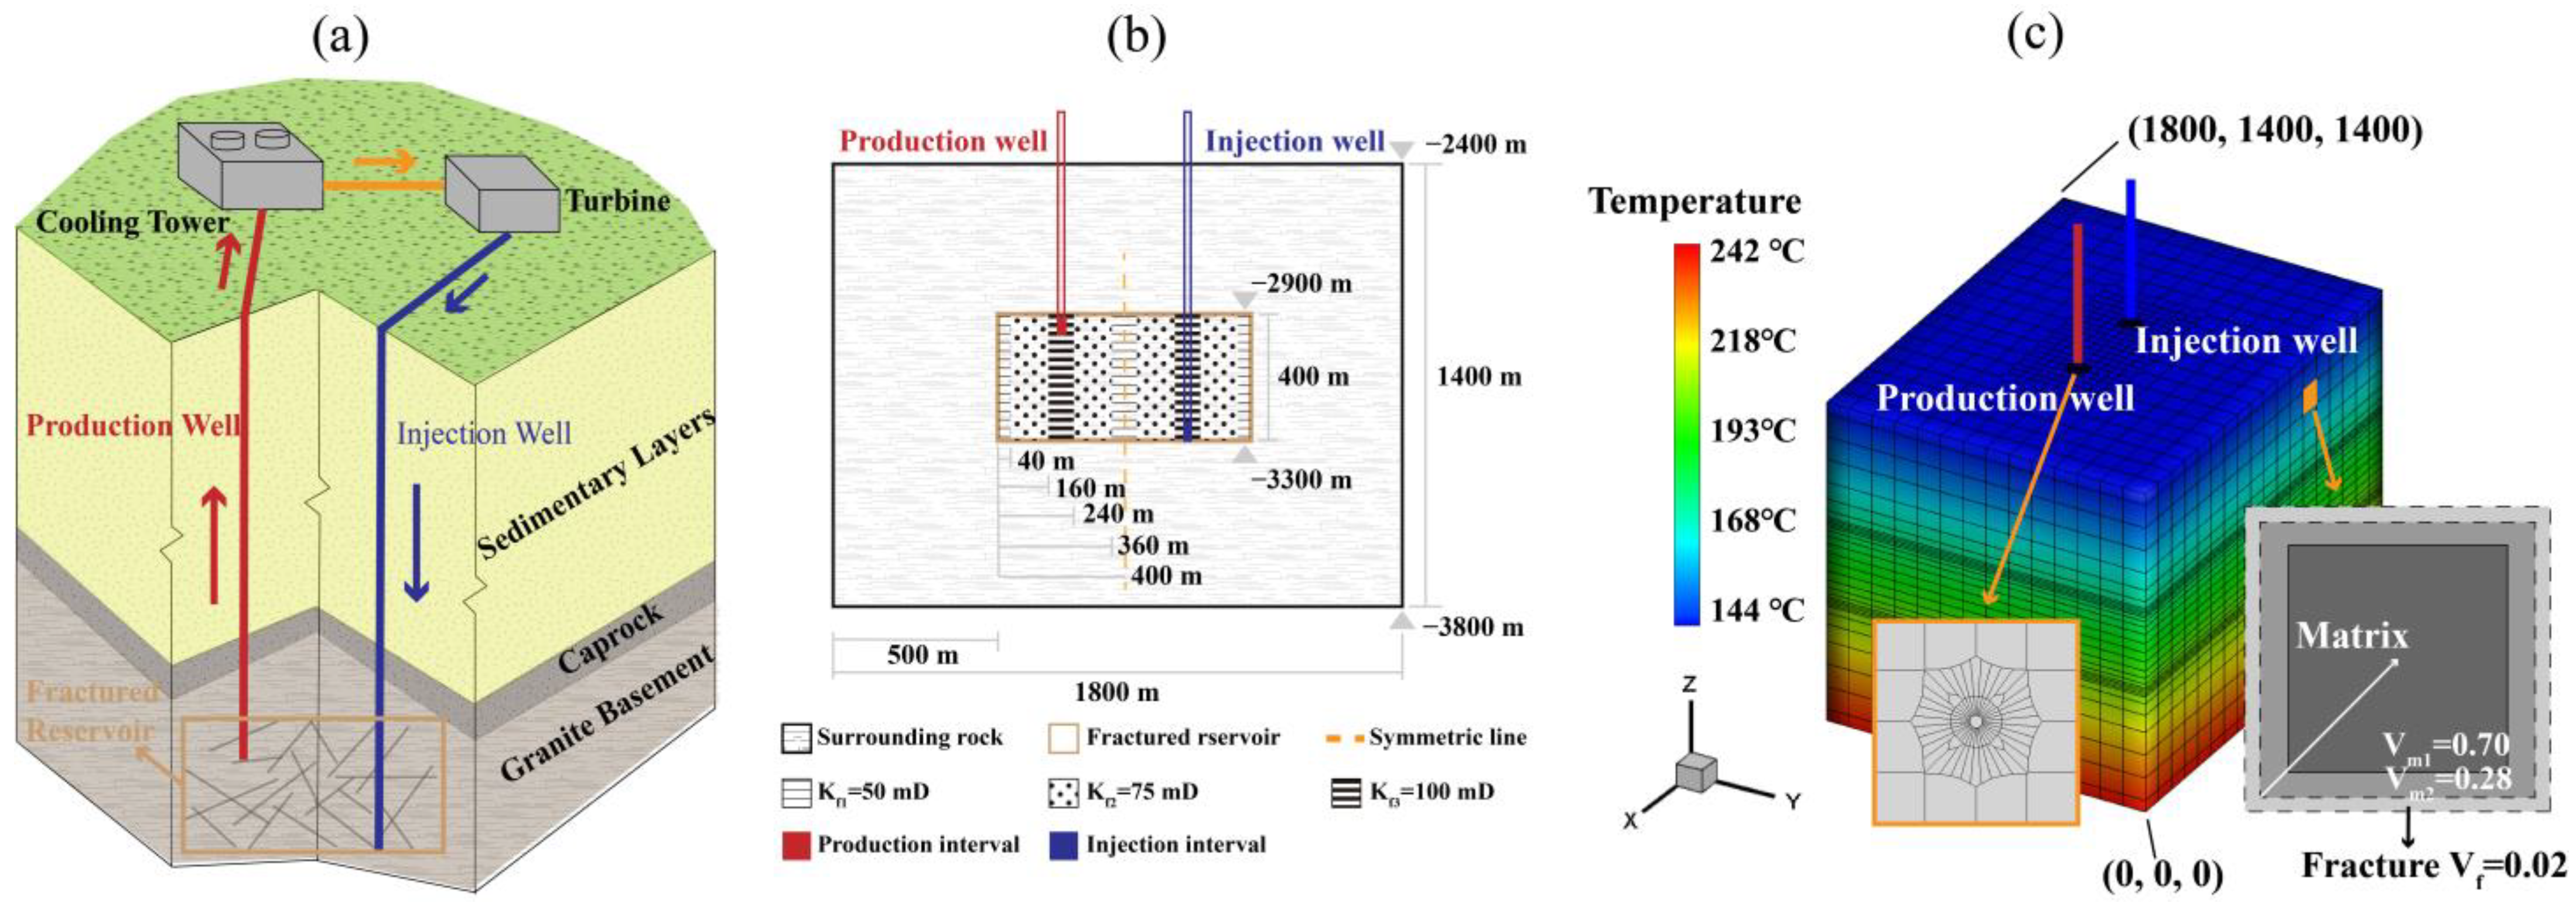
Figure 2 shows the concept design and numerical model of the CO2-EGS at the Gonghe Basin geothermal site. In this work, the proposed CO2-EGS has two vertical wells: one cold-water injection well and one hot-water production well (Figure 2a). Based on the prediction results published by Chen et al. [39], the potential fractured reservoir volume induced by hydraulic fracturing reaches 1.4~2.1 × 10⁸ m3 for the given total injection volume of 2~3 × 10⁴ m3. In addition, the half-length of the fractured reservoir reaches 300~350 m at the Gonghe Basin EGS site. In our model, we conservatively estimated that the geometry of the fractured reservoir in the x, y, and z directions was 800 m, 400 m, and 400 m (Figure 2b), according to the existing engineering experience [40,41]. Generally, the advantageous development direction of a fractured reservoir is along the maximum horizontal principal stress direction [42]. Thus, in our model, the x-axis is along the maximum horizontal principal stress direction. The numerical model takes the fractured geothermal reservoir as the center and extends outward, and considers the rock matrix of 500 m in each direction to accurately simulate the heat transfer between the fractured geothermal reservoir and surrounding rock. As a result, the entire model geometry in the x, y, and z directions is 1800 m, 1400 m, and 1400 m, respectively, as shown in Figure 2c. Based on the field drilling and fracturing results, the depth of the target fractured geothermal reservoir is between 2900 m and 3300 m.
The diameter of the wellbore is 200 mm, and the length of perforation interval is 50 m both for the production well and injection well. The horizontal distance between two vertical wells (e.g., injection well and production well) is 400 m. To improve the heat production performance using CO2 as working fluids, a novel two-well pattern was designed for the fractured geothermal reservoir. The cold CO2 was injected into the reservoir at the bottom of the target fractured geothermal reservoir and produced from the top of the target fractured geothermal reservoir (Figure 2b). Our previous numerical studies have proved that this well layout is beneficial for the cold fluid to extract more heat from an in situ rock matrix [43]. This is mainly because the longest flow path between the injection well and production well can significantly enhance the heat exchange time. For the proposed two-well geothermal production model in this work, the depth of the production interval is 2950 m, and the depth of injection interval is 3300. Thus, the vertical distance between the production interval and the injection interval in the fractured reservoir is 350 m.
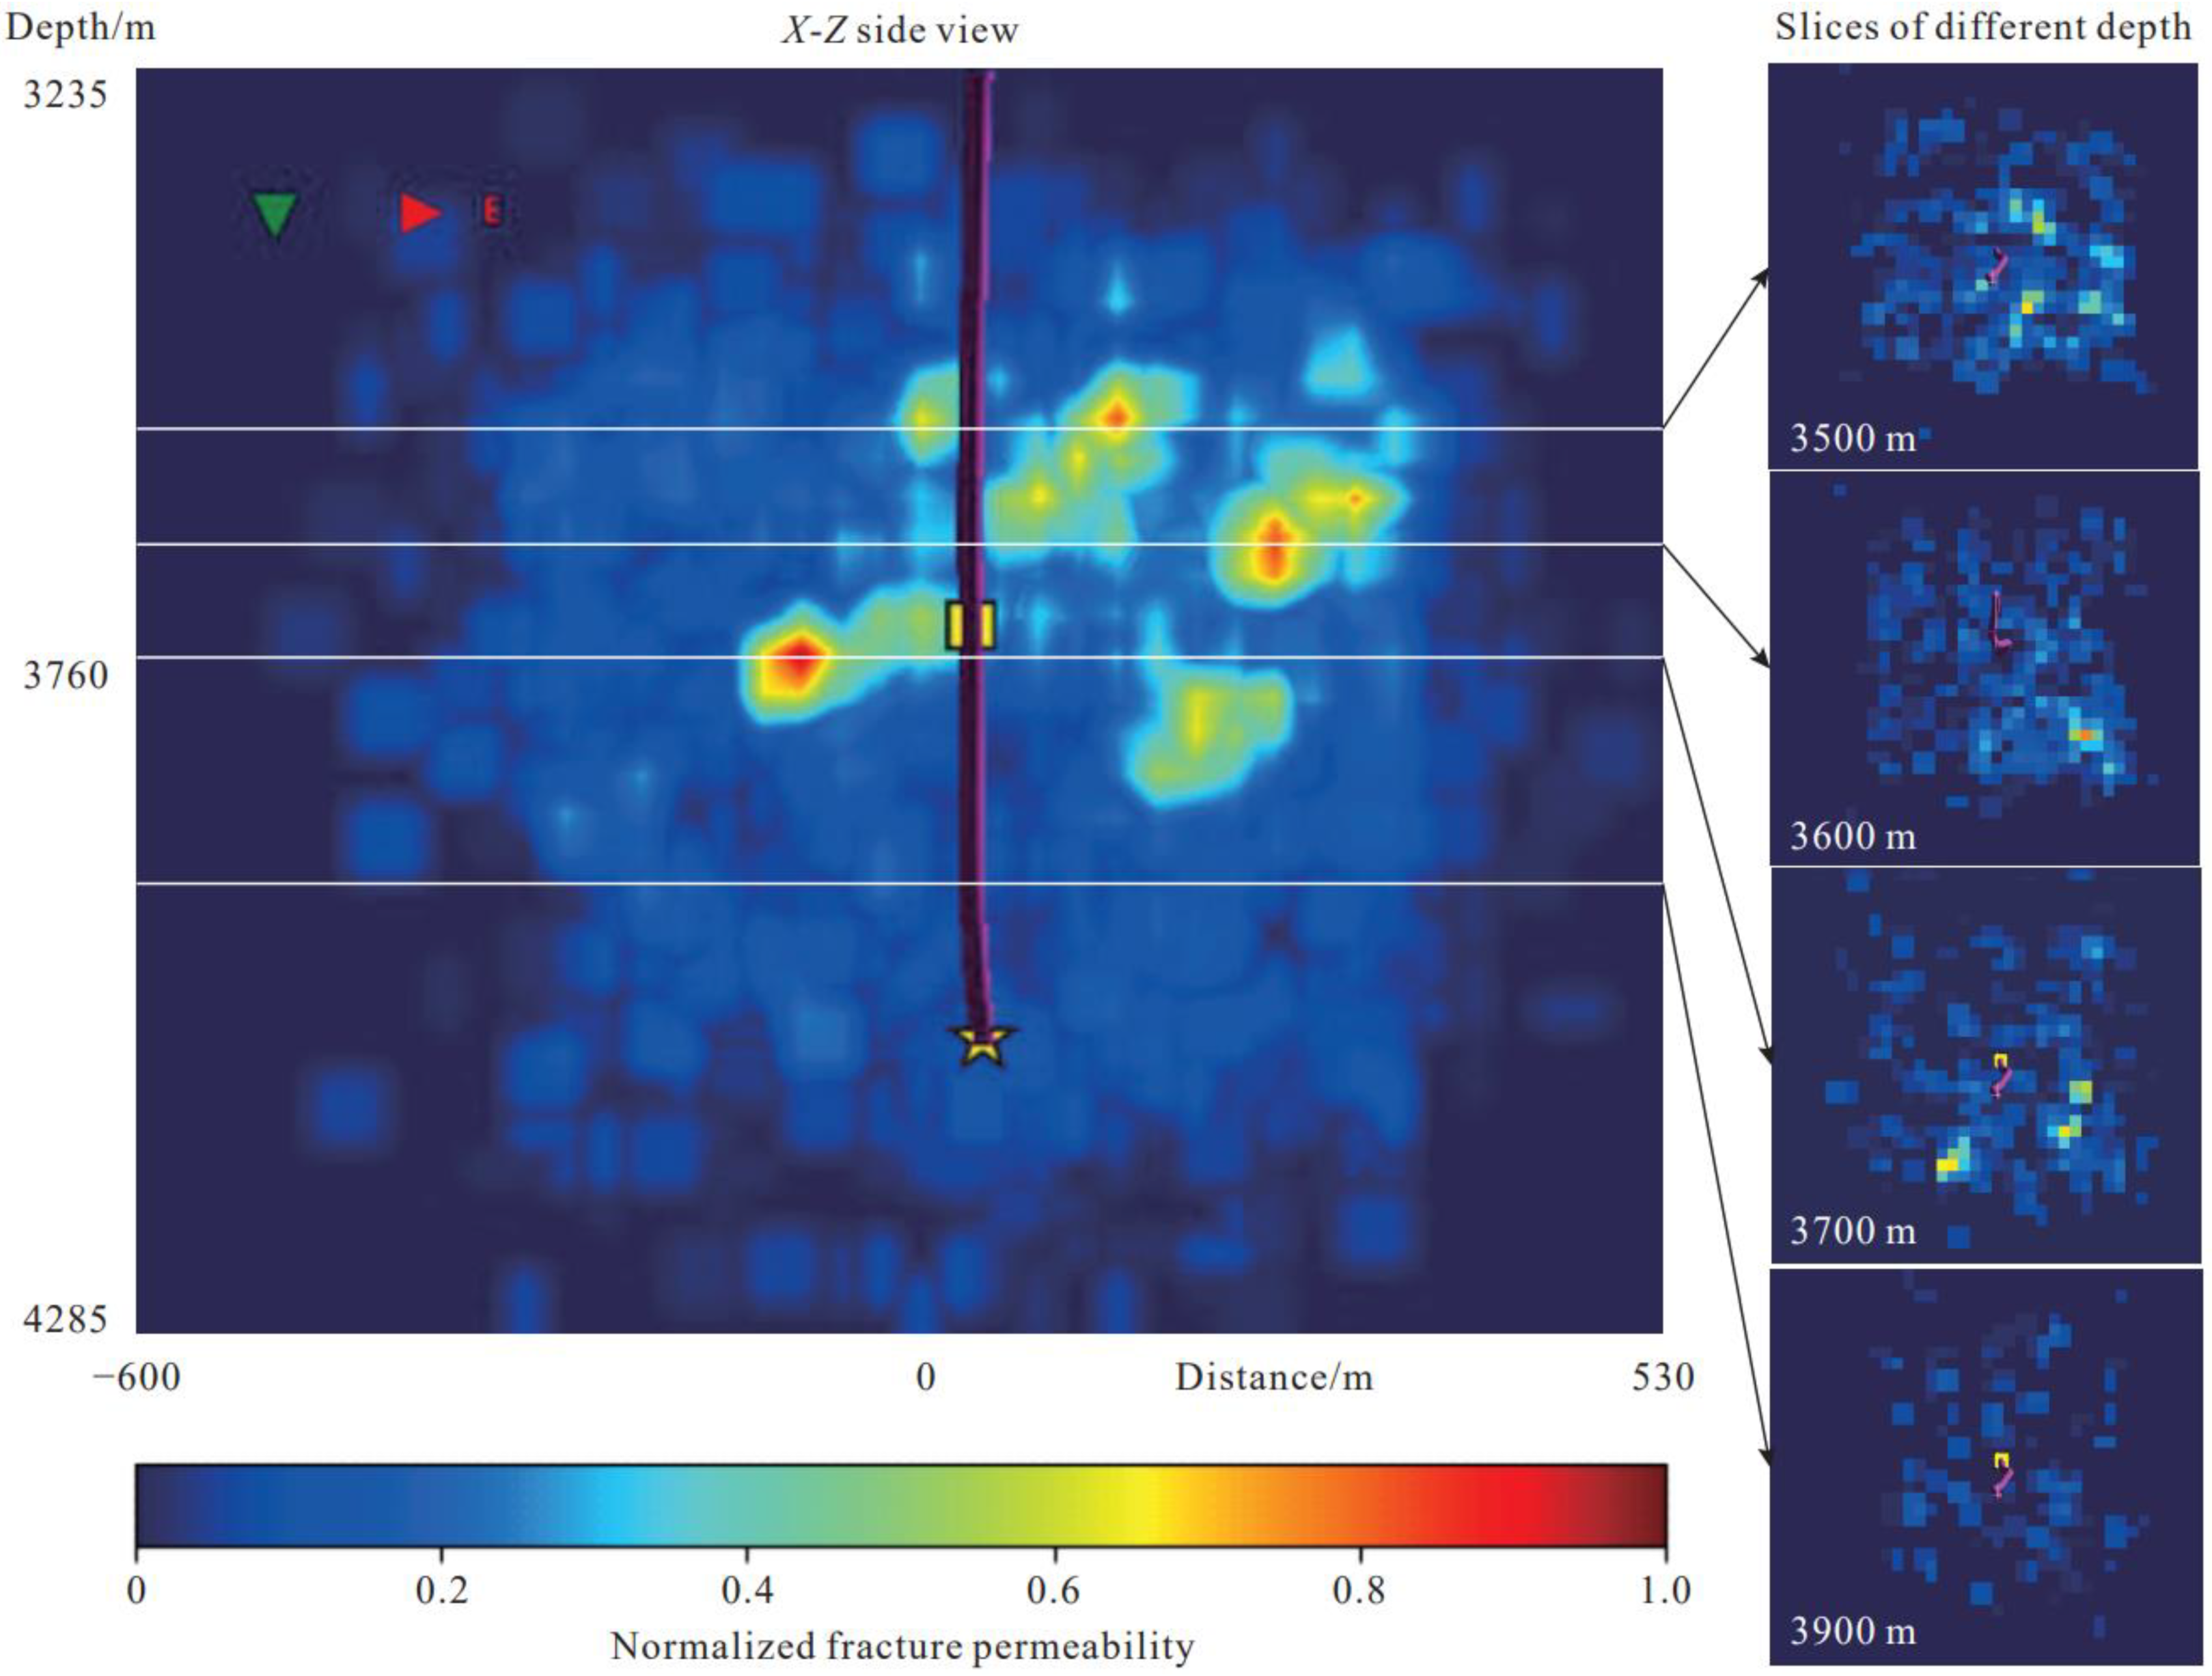
Many EGS fracturing test results indicated that the permeability of the fractured geothermal reservoir was heterogeneous. Generally, the reservoir permeability around the wellbore was greatly larger than that in the far well area [44,45]. This phenomenon has also been observed during hydraulic fracturing in the Gonghe Basin EGS site [46], as shown in Figure 3. Therefore, heterogeneous permeability distribution for the artificial geothermal reservoir should be considered. In our model, three fractured regions were considered with different initial permeability. As shown in Figure 2b, these fractured regions were labeled as the outermost (kf1), middle (kf2), and innermost (kf3) regions, respectively. Based on the field fracturing results [39], the distances from the boundary of these three fractured regions to the wellbore were 40 m, 160 m, and 200 m, respectively.
To obtain accurate modeling results, the numerical model considers fine and heterogeneous spatial discretization (Figure 2c). In the horizontal direction, the size of the simulation grids was 10 m in the well perforation layer. In the fractured reservoir, the size of the simulation grids ranged from 20 m to 40 m. However, the size of the simulation grids increased to 100 m in the surrounding rock matrix, because heat conductivity mainly occurred in this region (i.e., granite with low permeability). In the vertical direction, the size of the simulation grids was 10 m in the fractured reservoir and 50 m in the surrounding layer. For the one-dimensional production well and injection well, the discretization of the wellbore was consistent with the reservoir in the vertical direction. In addition, the MINC method was used to calculate the fluid flow and heat exchange between the fractures and rock matrix in the fractured geothermal reservoir [16]. As shown in Figure 2c, the rock matrix in our model was divided into two sub-grids, and their volume fractions were 28% and 70%, respectively. Thus, the volume fraction of the fracture was about 2% [31,32,35].

2.4. Model Parameters

Table 1 displays the main hydraulic and thermal model parameters. Most of these parameters are based on the sampling and laboratory test results [32]. The rock density was 2623 kg/m3. The heat conductivity and specific heat of the rock were 3 W/(m·°C) and 980 J/(kg·°C), respectively. For the fractured reservoir, the permeability in the outermost (kf1), middle (kf2) and innermost (kf3) fractions were assumed to be 50 mD, 75 mD, and 100 mD, respectively [44]. The porosity in the fractured reservoir was assumed to be 0.5. The rock matrix has significantly low porosity and permeability according to previous numerical studies [31,33]. The production period of the proposed CO2-EGS was assumed to be 30 years.

2.5. Initial and Boundary Conditions

Based on the field measured temperature at the GR1 well in the Qiabuqia geothermal area (Figure 1), the initial temperature distribution of the geothermal reservoir ranged from 144 °C to 242 °C, corresponding to the 2400 m to 3800 m depth. The initial pressure distribution followed a hydrostatic gradient, and the initial pressure at the reservoir top was 24 MPa [47]. Noteworthy, a CO2-dominating geothermal reservoir is assumed in the subsequent discussion. This suggests that the process of CO2 displacement of native brine has not been simulated. In addition, our model does not consider geochemical processes because of the smaller time scales. The initial temperature at the wellhead of the two vertical wells was 18 °C. The injection temperature of CO2 remained constant at 30 °C throughout the simulation. The geothermal production condition of the numerical model was fixed wellhead pressure; for example, 12 MPa at the injection well and 10 MPa at the production well. High-pressure injection and production were used to ensure that the CO2 was in a supercritical state.

3. Results and Discussion

3.1. Production Temperature, Flow Rate, and Heat Extraction Rate

Generally, changes in production temperature, flow rate, and heat extraction rate are very important criteria for defining the heat production performance. For the two-well geothermal production system, the heat extraction rate G can be calculated as:
G = F p r o h p r o F i n j h i n j
where F p r o and F i n j are the mass flow rates in the production well and injection well, respectively, and h p r o and h i n j are the specific enthalpy at the production well and injection well, respectively. In this work, the specific enthalpy was dynamically calculated based on the temperature and pressure at the wellhead. This means the heat extraction rate is dependent on key operational variables, such as injection/production pressures and temperatures during geothermal production.
Figure 4 shows the evolutions in production temperature, mass flow rate, and heat extraction rate at the production wellhead over 30 years. According to the changes in production temperature (Figure 4a), the heat production process can be divided into two stages: the ascending stage (0–9 years) and the declining stage (9–30 years). In the ascending stage, the production temperature gradually increases from 114.5 °C to 120.3 °C; an increase of about 5%. The slight increase in production temperature is mainly because of the gradual displacement of deep geothermal fluids into the production wells via the injected CO2. This phenomenon further proves the superiority of the well layout method presented in this work, because this well layout can significantly prolong the flow path of the injected CO2. More details on the comparison of well layout designs can be found in our previous published paper [43]. Due to the process of CO2 displacement of native brine not being simulated in our model, water evaporation and salt precipitation did not occur as reported by Borgia et al. (2012) [48]. In the declining stage, the production temperature decreased from 120.3 °C to 96.4 °C; a decrease of about 20%. The significant decrease in production temperature was mainly due to the cold CO2 gradually flowing into the production well.
Since the geothermal production was maintained as the constant pressure gradient (e.g., Pinj = 12 MPa, Ppro = 10 MPa), the production rate was basically unchanged with a high value of about 150 kg/s (Figure 4b). The modeling results indicate that the injection mass rate was basically consistent with the production mass rate throughout the production period of 30 years. Furthermore, CO2-EGSs can achieve higher production rates even under smaller production pressure gradients (e.g., 2 MPa). This is because of the better mobility of CO2 compared to water. According to Equation (1), the changes in heat extraction rate can be obtained as shown in Figure 4c. The heat extraction rate was mainly controlled by the production temperature, because the mass flow rate was basically constant at 150 kg/s. The heat extraction rate in the ascending stage gradually increased from 37.12 MW to 38.09 MW; an increase of 2.6%. The heat extraction rate in the declining stage decreased from 38.09 MW to 32.63 MW; a decrease of 14.3%.
Because few studies have focused on the performance criteria of CO2-EGSs, the performance criteria of water-EGSs were used for reference. Generally, a maximum decrement in production temperature of less than 10% is required for sustainable operation during geothermal production [49]. In this work, the maximum decrease in production temperature was about 20% for the proposed CO2-EGS. Though the temperature index of the proposed CO2-EGS is below the commercialization target, the mass flow rate of 150 kg/s is far greater than the suggestion of 40–60 kg/s in a water-EGS [50]. This suggests a promising production potential in the CO2-EGS due to the high mass flow rate. The maximum decrement of heat extraction rate was predicted to have the value of 14.3%, which indicates that the proposed CO2-EGS has a promising heat extraction performance. In addition, the heat extraction rate was always greater than 32 MW, indicating that the proposed CO2-EGS has a great geothermal power generation and heating potential.

3.2. Spatial Distribution of Reservoir Temperature

As mentioned above, the production temperature showed a strange phenomenon when using CO2 as the working fluid, such as a significant increase (e.g., about 5%) in the first 9 years. This can be clearly explained by the spatial distribution of reservoir temperature. Figure 5 shows the spatial distribution of the rock matrix temperature in the geothermal reservoir at three different times (e.g., 1, 10, and 30 years). In the first year, the low-temperature region induced by the cold CO2 injection is mainly concentrated near the injection well (Figure 5a). With the increase in geothermal development time, the low-temperature area gradually expands to the production well. When the geothermal system has been in operation for 10 years, the low-temperature area has migrated to the producing well (Figure 5b). This means that there is insufficient contact with the hottest rock matrix for the recharged CO2 to be fully heated. Therefore, the geothermal production temperatures began to drop (Figure 4a). However, in the ascending stage, the slow increase in production temperature is mainly due to the recharged CO2 displacing the deep hot fluids gradually upward into the producing well. Therefore, there is a slight increase in reservoir temperature under the production well, as shown in Figure 5a,b. It is interesting that the trapezoid cold area occurs in the fractured geothermal reservoir. This is because the natural convection of CO2 fluid is significantly stronger than that of water [3,51]. As shown in Figure 5c, the dual-vertical well pattern with vertical difference proposed in this work is very beneficial for geothermal production using CO2 as working fluids. This well pattern provides a long flow path for the injected cold CO2 with enough time for heat exchange and to avoid early thermal breakthroughs. This has also been demonstrated in our previous comparative study [43].

3.3. Changes in CO2 Velocity, Density, and Specific Enthalpy along the Wellbore

The proposed CO2-EGS obtained a promising production performance during the 30-year production. This is mainly owing to the better mobility of CO2 resulting in high mass flow rate and heat production rate. However, the distribution of fluid velocity, density, and specific enthalpy along the wellbore should be further considered. These parameters and their changes are very important for sustainable geothermal development using CO2 as the working fluid. Figure 6 shows the vertical distribution of CO2 velocity along the production and injection wellbores after 15 years of geothermal production. There is a significant difference in the fluid velocity distribution between the injection well and the production well when using CO2 as the working fluid. The CO2 velocity at the injection well is basically constant. However, the CO2 velocity at the production well significantly increases from 12.29 m/s to 22.97 m/s. This is mainly due to the significant changes in CO2 density during geothermal production in the production well, as shown in Figure 7.
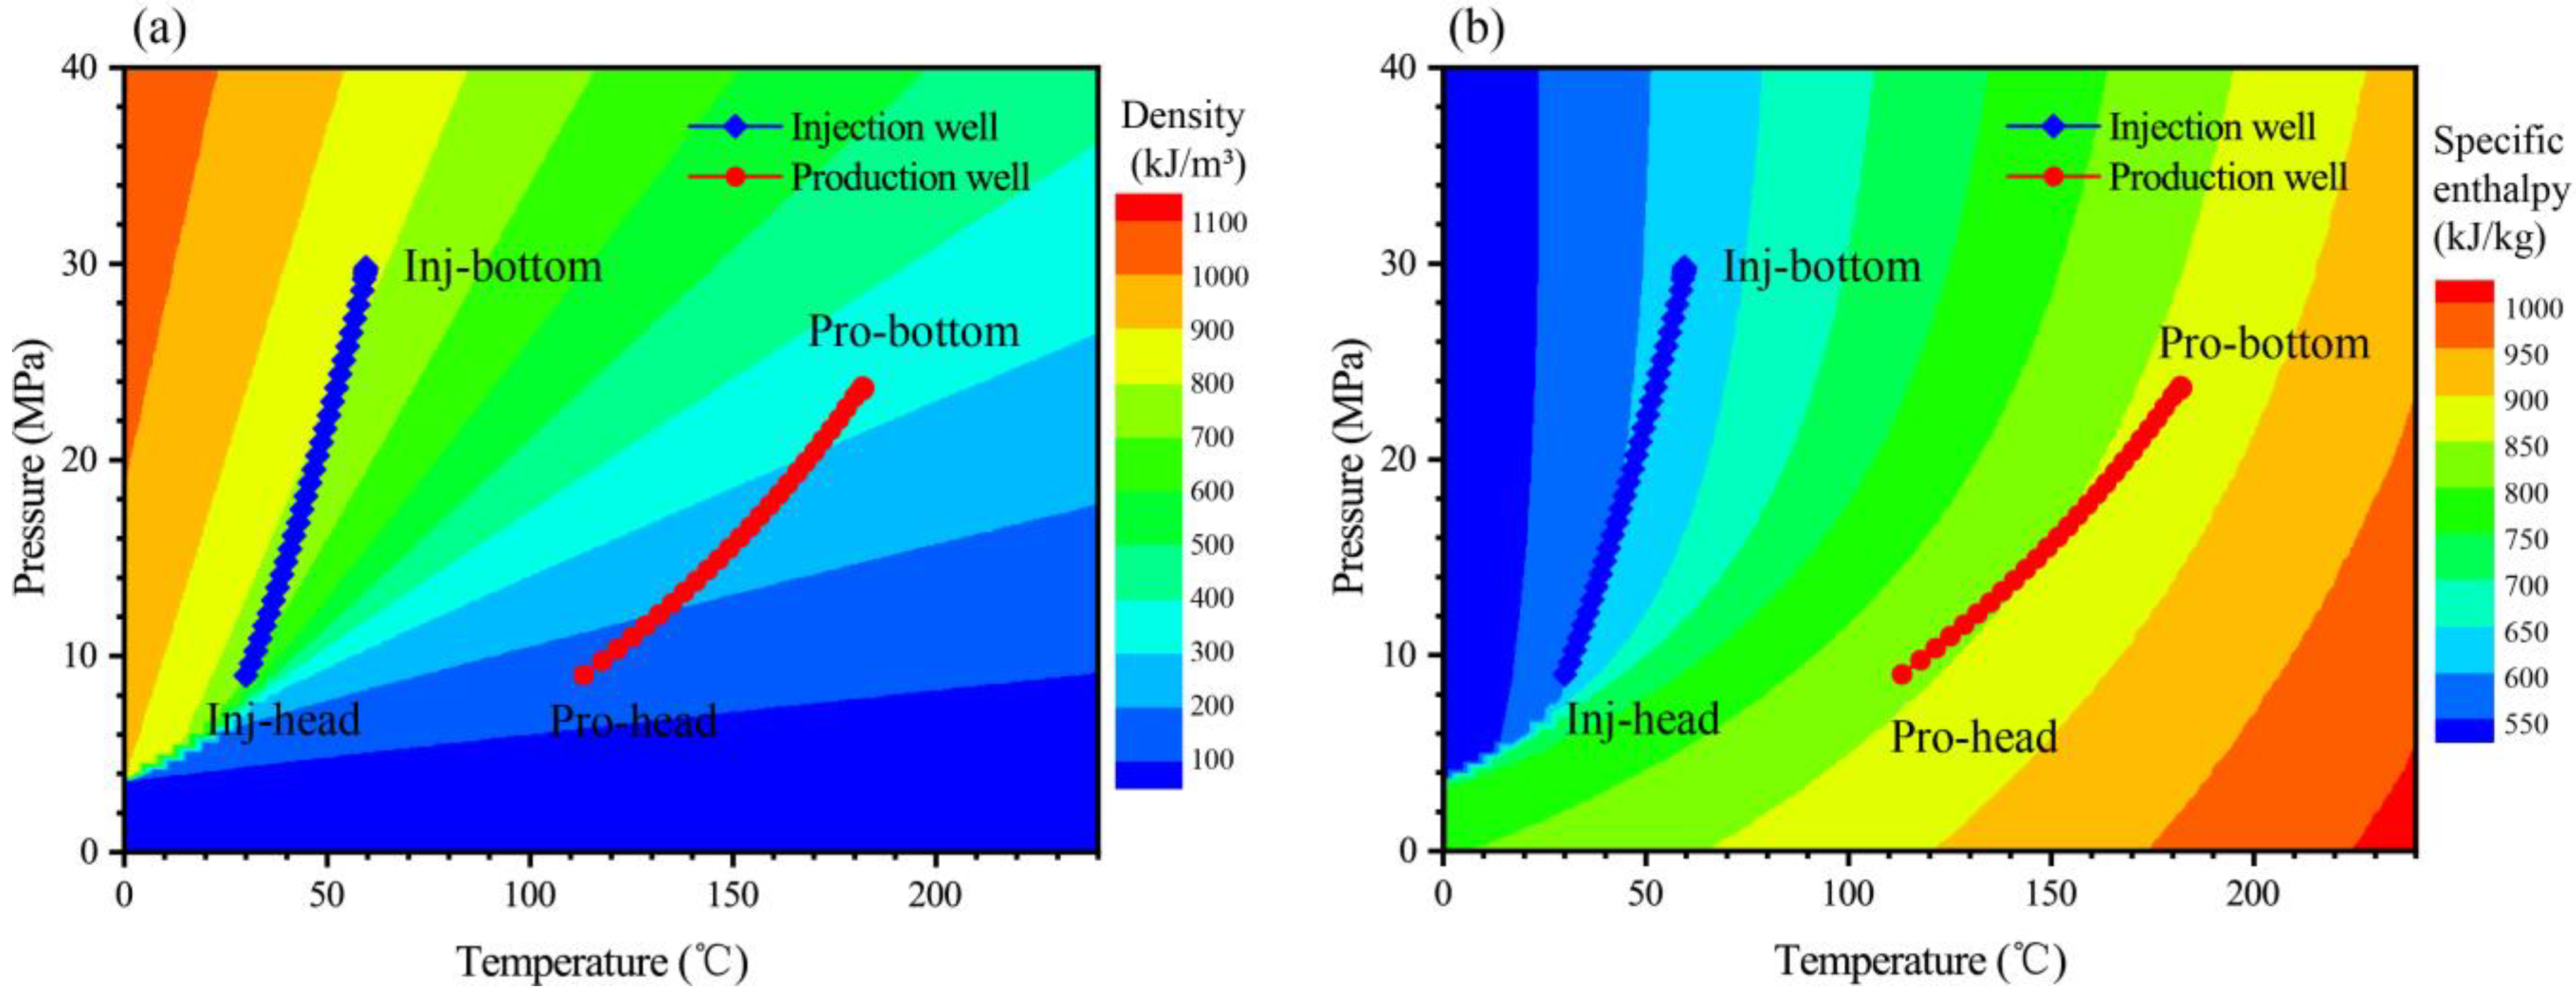
Generally, the CO2 velocity in the wellbore is inversely proportional to the CO2 density for the specified mass flow rate. Figure 7 shows the transient changes in density and specific enthalpy along the injection and production wellbores after 15 years of geothermal production. Contour lines of density and specific enthalpy at different temperatures and pressures are also shown in the background. Compared to water, the CO2 density is affected by both temperature and pressure (Figure 7a). The modeling results indicated that the CO2 density significantly changes in the wellbores during geothermal production, especially in the production well. The difference of the CO2 density between the well bottom and the wellhead in the injection well is 66.61 kg/m3, while it increases to 426.92 kg/m3 in the production well. This is mainly because the temperature of CO2 in the production well is significantly higher than that in the injection well. In addition, the significant density difference in the production well is the main reason that causes the CO2 velocity variation in the wellbore (Figure 6).
As shown in Figure 7b, the CO2-specific enthalpy is significantly affected by both the pressure and temperature. At the injection well, the CO2 temperature slightly increases from 30 °C to 55.22 °C at the well bottom, which is mainly controlled by the heat exchange between the wellbore and surrounding rocks. Due to the slight changes in pressure and temperature at the injection well, the specific enthalpy of CO2 changes slightly along the injection well. However, the production temperature is drastically reduced by 62.61 °C when the CO2 flows from the bottom to the wellhead in the production well. This is mainly controlled by the significant Joule–Thomson effect [52]. Generally, the Joule–Thomson effect results in a significant decrease in temperature, especially for the high-temperature CO2 fluid in the production wellbore [53].
The Joule–Thomson coefficient can be used to quantitatively characterize the Joule–Thomson effect, which can be defined as
μ J T = T p h
According to Equation (7), the Joule–Thomson coefficient is numerically equal to the partial derivative of temperature to pressure under constant specific enthalpy conditions. Figure 8 shows the vertical distribution of the Joule–Thomson coefficient along the production and injection wellbores after 15 years of geothermal production. The Joule–Thomson coefficient in the production well is significantly greater than that in the injection well. This is the main reason that fluid temperatures in the production well change more than that in the injection well (see Figure 7). In addition, the Joule–Thomson coefficient at the production well significantly increases from 1.7 °C/MPa to 4.6 °C/MPa. This indicates that the Joule–Thomson effect increases gradually during the upward flow of CO2 along the production well. As a result, the rapid drop in fluid temperature occurs in the production well due to the significant Joule–Thomson effect. For the geothermal production well, the wellbore flow of the proposed CO2-EGS can be regarded as an isenthalpic process due to the relative change in specific enthalpy of CO2 is very small. However, the rapid decrease in production temperature makes it difficult for the proposed geothermal system to meet the requirements of commercial geothermal production (e.g., stable production temperature). Therefore, methods of reducing the Joule–Thomson impact are very important for the development of CO2-EGSs. Pre-optimization of the potential parameters of wellbore diameter, production pressure, injection pressure, fluid flow rate, injection, and production temperatures are required to reduce the negative effects based on the field geothermal utilization patterns. For the proposed geothermal system, the only variable we can control is pressure, and so reducing pressure loss in the production well is an important way in which we can minimize this effect. In addition, this negative impact can also be mitigated by the use of physical materials, such as by using casing and cement materials with low heat conductivity to resist heat transfer between the wellbore and the surrounding rocks, especially in the production well [54].

3.4. Evaluation of Heat Production Performance

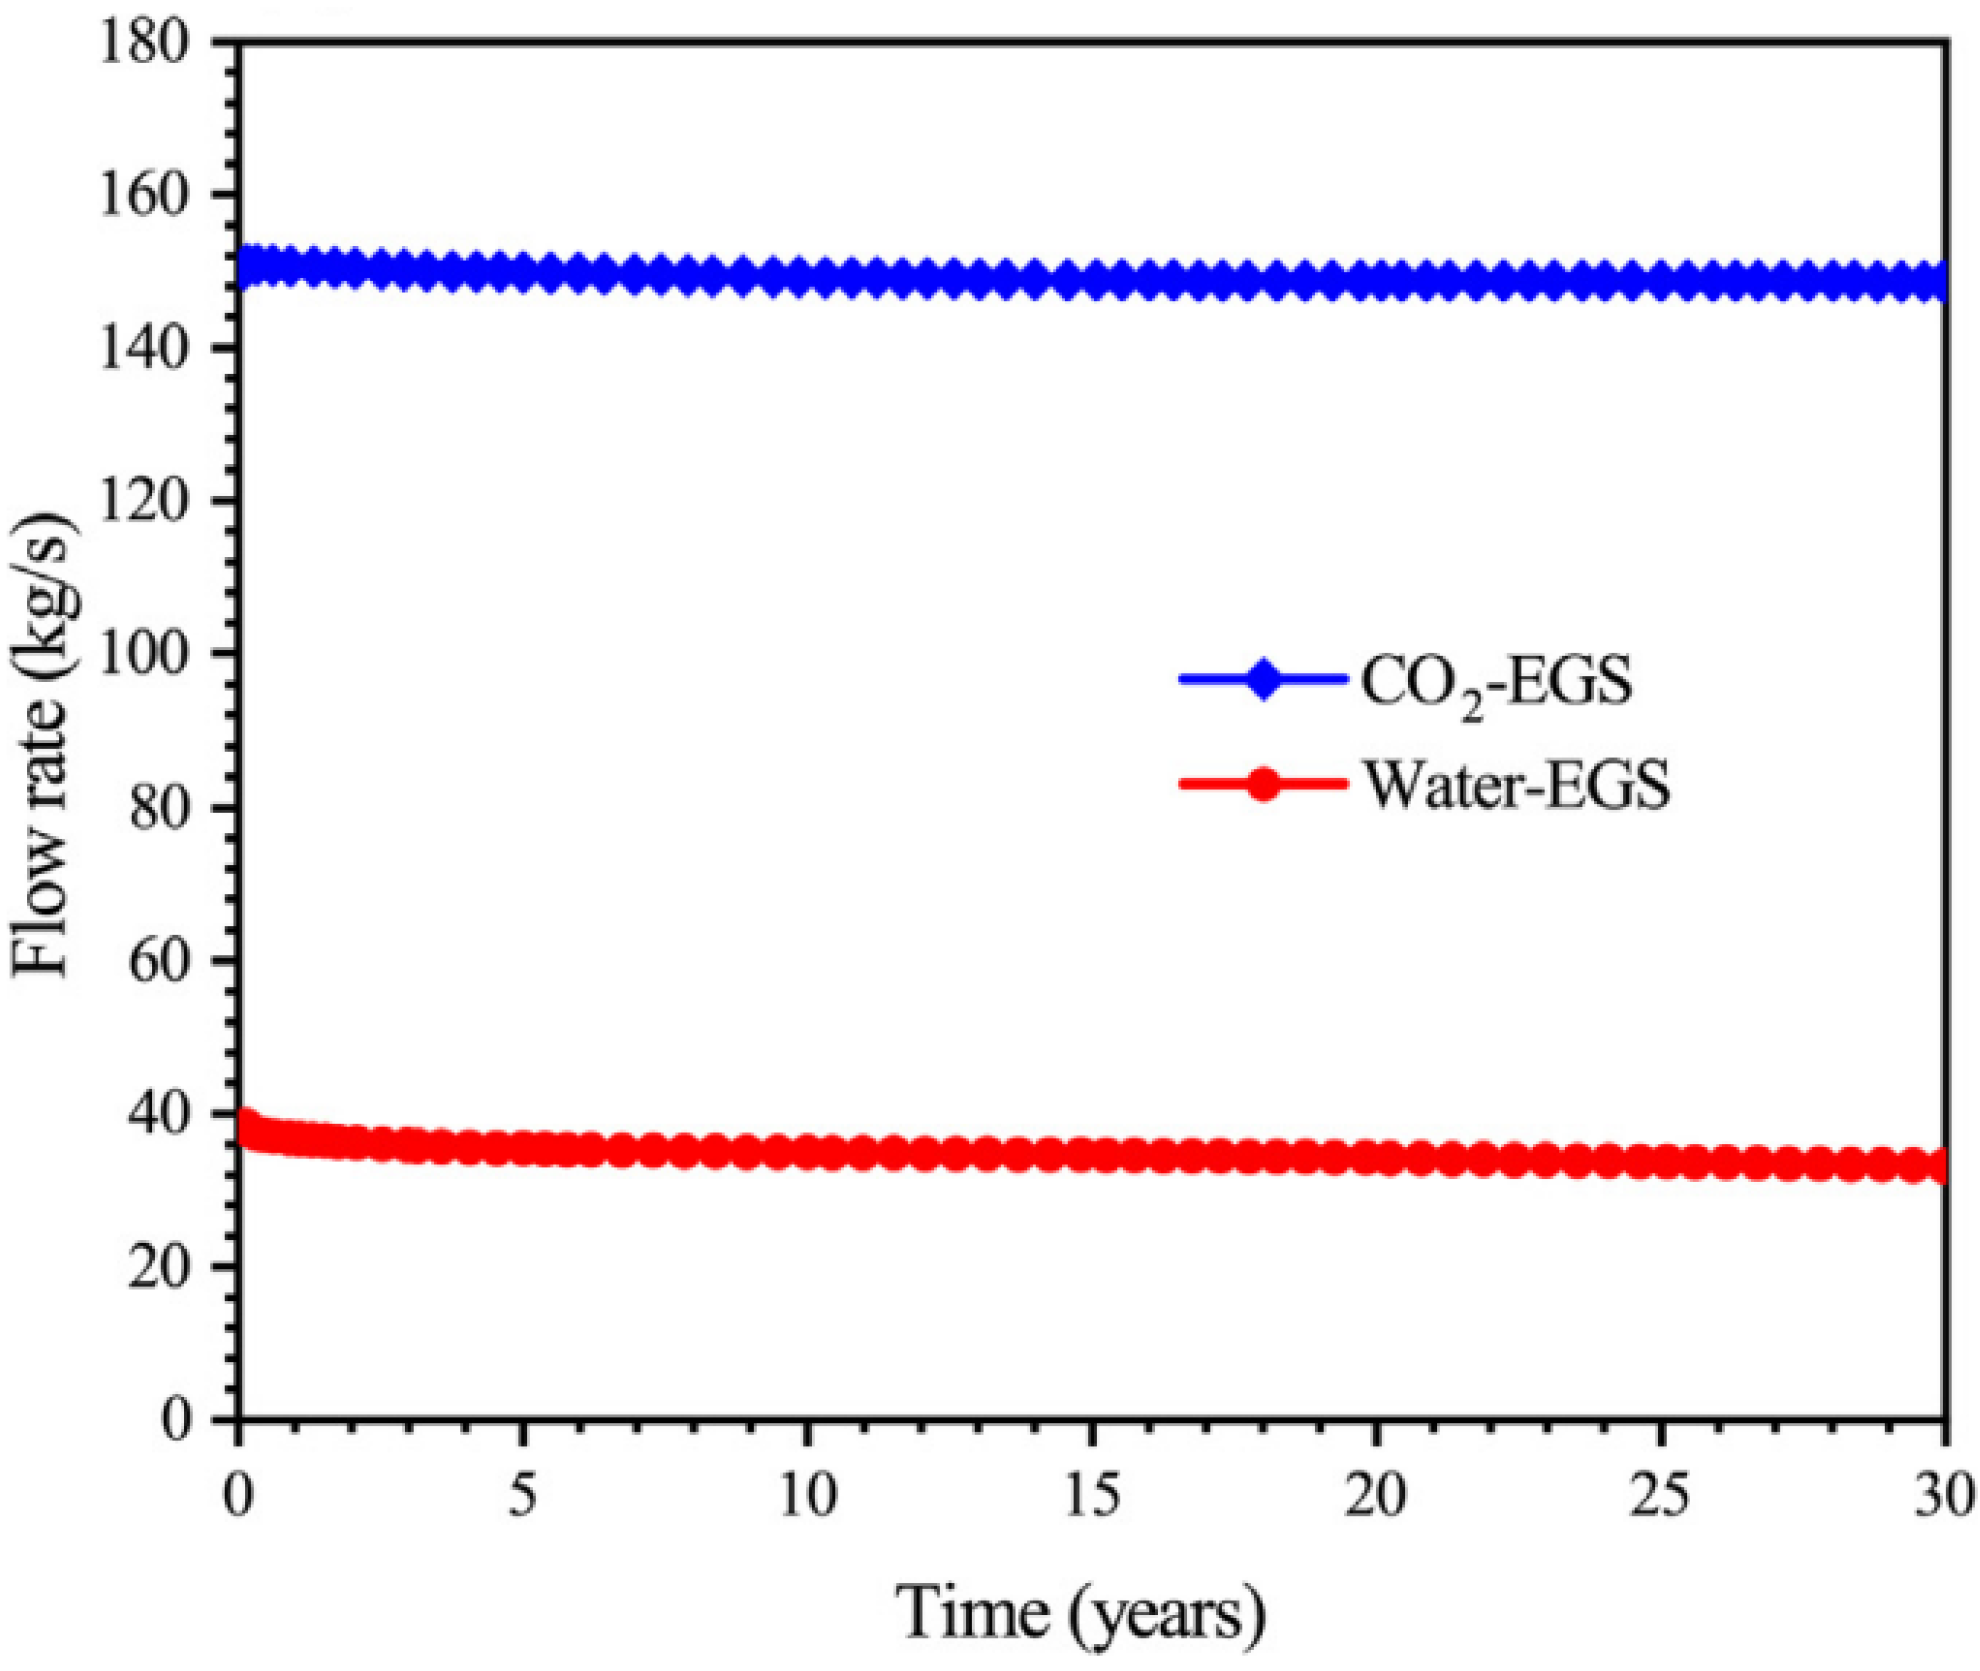
Based on the above discussion, the simulation results indicate that the proposed CO2-EGS has a promising mass production rate and heat production performance during the 30-year production period. On the one hand, the proposed CO2-EGS is very beneficial for additional CO2 geological storage in the deep formation. In this work, we do not intend to estimate the sequestration capacity because there are no available data on the fractions of CO2 mass flow that would be lost in the geothermal reservoir. In addition, the process is extremely complex and the loss rate likely depends on the site-specific porosity, permeability, water chemistry, and mineralogy of the geothermal reservoir [16]. Therefore, coupled modeling of multiphase fluid and heat flow, solute transport, and chemical reactions should be considered to estimate additional CO2 geological storage in the future. On the other hand, the high heat extraction rate suggests a great power generation potential for CO2-EGSs in the Gonghe Basin geothermal site. The novel dual-vertical-well CO2-EGS proposed by this study is one of the preferred production schemes. It is believed that the development of CO2-EGSs for power generation is a beneficial method of realizing carbon neutrality by 2060 in China. According to the spatial distribution of the reservoir temperature, the placement of the perforation interval at the production well should be prioritized at the top of the target geothermal reservoir. This is conducive to increasing the flow path of the CO2 and significantly improving the heat transfer efficiency of the CO2-EGS. In fact, this advantage also exists in water-based geothermal systems [4,43]. In addition, the operation of a CO2-EGS requires very little external pump consumption due to the significant effect of the produced thermosiphon using CO2 as the working fluid [19]. This can be proven by the relationship of the CO2 density and velocity between the production well and the injection well. As a result, the CO2-EGS suggests a better production performance because of the high flow rate using CO2 instead of water as the working fluid [15]. As shown in Figure 9, the mass production rate of a CO2-EGS is significantly higher than that of a water-EGS under the same production conditions (e.g., reservoir properties, production pressure gradient, etc.).
Previous studies have shown that CO2-based geothermal systems are more suitable for development in low-temperature geothermal reservoirs [24] because the CO2 temperature in the injection well is relatively high (e.g., 55.22 °C at the well bottom, Figure 7). However, geothermal production using CO2 as the working fluid is also favorable for the high-temperature reservoir in the Gonghe Basin by considering the heat production performance of this work. It is noted that the modeling results indicate that the heat production performance of the CO2-EGS is greatly affected by the borehole and geothermal reservoir conditions. This means that different geothermal site conditions require different studies and analyses to determine the best production scheme for the CO2-based geothermal systems. In particular, the Joule–Thomson effect is a huge barrier to achieving the commercial production standard for the CO2-EGS.

3.5. Limitations of Using CO2 as the Working Fluid

Although the CO2-EGS has many advantages, there are some challenges associated with using CO2 as the working fluid for geothermal production. CO2 is known to be more corrosive than water, which can pose challenges for maintaining well integrity in CO2-EGS systems. The corrosive nature of CO2 may require additional measures to ensure the long-term integrity and reliability of wellbores and surface infrastructure. The physical properties of CO2 (e.g., its lower density and viscosity and higher thermal expansion behavior) compared to water may require modifications in wellbore designs and reservoir management strategies. As CO2 is used as the working fluid, the potential risk of CO2 leakage needs to be carefully considered. If CO2 leaks into shallow aquifers, CO2 dissolution in groundwater will significantly change the water chemical balance and affect the quality of groundwater. In addition, CO2 is a greenhouse gas, and its unintended release into the atmosphere can contribute to climate change. Therefore, implementing proper monitoring and mitigation strategies to prevent CO2 leakage is essential. The effective solution of these problems is important for the sustainable operation of CO2 based geothermal systems. As mentioned above, implementing CO2-EGS systems may involve higher upfront costs due to the need for specialized equipment and infrastructure. Additionally, the scalability of CO2-EGS technology on a larger commercial scale might still be a challenge, and further research and development are needed to optimize its economic viability. The feasibility and effectiveness of CO2-EGS can vary depending on the geological characteristics of the geothermal site. Not all geothermal reservoirs may be suitable for CO2 injection, and careful site selection and characterization are required to ensure successful implementation.

4. Conclusions

A wellbore–reservoir coupled model was constructed to study the heat production performance of the proposed CO2-EGS in the Gonghe Basin geothermal site. The heterogeneous fractured geothermal reservoir was considered in our model according to the hydraulic fracturing responses. Two vertical wells with novel well perforation were designed for effective geothermal production. Based on the fractured geothermal reservoir at depths of 2900 m to 3300 m, the key geothermal production indicators (e.g., production temperature, mass flow rate, and heat production rate) were forecasted for the long term of 30 years production. In addition, the numerical analyses provide a deep understanding of the complex mass flow and heat transfer processes in the wellbore and geothermal reservoir using CO2 as the working fluid. Some conclusions are drawn as follows:
(1)
The proposed CO2-EGS shows a promising heat production performance for the specified operating conditions using two vertical wells. The heat production processes of the proposed CO2-EGS include the ascending geothermal production stage in the first 9 years and the declining geothermal production stage in the following 21 years. The geothermal production temperature and heat extraction rate gradually increase during the ascending stage, while they drop by 20.0% and 14.3% during the declining stage. The heat extraction rate meets the commercial requirements throughout the 30-year production. In addition, the flow rate maintains a steady level of 150 kg/s throughout the entire production period.
(2)
The dual-vertical well pattern with height difference is a preferred well layout for the CO2-based enhanced geothermal systems. This is mainly because the optimal flow path can be obtained for the injected cold CO2 to extract more heat stored in the rock matrix, and thus a potential early thermal breakthrough can be avoided effectively. In addition, the trapezoid cold area occurs in the fractured geothermal reservoir due to the natural convection of CO2 fluid being significantly stronger than water. This further indicates that there must be a certain height difference in the perforation zone between the injection well and production well for the CO2-EGS.
(3)
The velocity and density of CO2 change significantly in the wellbore. The CO2 velocity increases from 12.29 m/s to 22.97 m/s during the upward process in the production well. The difference of the CO2 density between the well bottom and the wellhead reaches 426.92 kg/m3 in the production well. The significant density difference in the production well is the main reason for the CO2 velocity variation in the wellbore. In the production well, a significant Joule–Thomson effect coupled with a drastic temperature drop (e.g., about 62.61 °C) is observed based on the wellbore–reservoir coupled model. This is a critical defect of the proposed CO2-EGS for stable geothermal production. Therefore, pre-optimization analyses and physical material treatment (e.g., thermal insulation materials) are required to reduce this negative impact during the development of CO2-EGSs.

Author Contributions

Conceptualization, C.Z.; methodology, Y.Y. (Yilong Yuan); software, Y.Y. (Yilong Yuan) and C.Z.; validation, Y.Y. (Yilong Yuan) and T.J.; investigation, C.Z. and J.Z.; data curation, Y.Y. (Yulong Yin); writing—original draft preparation, C.Z. and W.Z.; writing—review and editing, Y.Y. (Yilong Yuan), S.W. (Shoucheng Wei), D.Z. and S.W. (Shaomin Wang); visualization, H.Y.; supervision, W.Z. and Y.Y. (Yilong Yuan); project administration, T.J.; funding acquisition, W.Z. All authors have read and agreed to the published version of the manuscript.

Funding

This work was jointly supported by the National Natural Science Foundation of China (No. 42372283), Jilin Province Science and Technology Development Plan Project (No. 20220101160JC) and Huaneng Group Technology Project (No. HNKJ21-HF310).

Data Availability Statement

Not applicable.

Conflicts of Interest

The authors declare no conflict of interest.

References

  1. Sowizdzal, A. Geothermal Systems—An Overview. Energies 2022, 15, 6377. [Google Scholar] [CrossRef]
  2. Yu, H.; Xu, T.F.; Yuan, Y.L.; Feng, B.; ShangGuan, S.T. Enhanced heat extraction performance from deep buried U-shaped well using the high-pressure jet grouting technology. Renew. Energy 2023, 202, 1377–1386. [Google Scholar] [CrossRef]
  3. Zhong, C.H.; Xu, T.F.; Gherardi, F.; Yuan, Y.L. Comparison of CO2 and water as working fluids for an enhanced geothermal system in the Gonghe Basin, northwest China. Gondwana Res. 2023, 122, 199–214. [Google Scholar] [CrossRef]
  4. Zhong, C.; Xu, T.; Yuan, Y.; Feng, B.; Yu, H. The feasibility of clean power generation from a novel dual-vertical-well enhanced geothermal system (EGS): A case study in the Gonghe Basin, China. J. Clean. Prod. 2022, 344, 131109. [Google Scholar] [CrossRef]
  5. Haraden, J. The status of hot dry rock as an energy source. Energy 1992, 17, 777–786. [Google Scholar] [CrossRef]
  6. Tester, J.W.; Anderson, B.J.; Batchelor, A.S.; Blackwell, D.D.; DiPippo, R.; Drake, E.M.; Garnish, J.; Livesay, B.; Moore, M.C.; Nichols, K.; et al. The Future of Geothermal Energy. Impact of Enhanced Geothermal Systems [EGS] on the United States in the 21st Century; Massachusetts Institute of Technology: Cambridge, MA, USA, 2006. [Google Scholar]
  7. Catalan, L.; Aranguren, P.; Araiz, M.; Perez, G.; Astrain, D. New opportunities for electricity generation in shallow hot dry rock fields: A study of thermoelectric generators with different heat exchangers. Energy Convers. Manag. 2019, 200, 112061. [Google Scholar] [CrossRef]
  8. Li, S.; Wang, S.; Tang, H. Stimulation mechanism and design of enhanced geothermal systems: A comprehensive review. Renew. Sustain. Energy Rev. 2022, 155. [Google Scholar] [CrossRef]
  9. Lu, S.M. A global review of enhanced geothermal system (EGS). Renew. Sustain. Energy Rev. 2018, 81, 2902–2921. [Google Scholar] [CrossRef]
  10. Duchane, D. (Ed.) Hot Dry Rock Flow Testing What Has It Use? What Questions Remain? Los Alamos National Lab. (LANL): Los Alamos, NM, USA, 1993.
  11. Brown, D.W. (Ed.) A hot dry rock geothermal energy concept utilizing supercritical CO2 instead of water. In The Twenty-Fifth Workshop on Geothermal Reservoir Engineering; Stanford University: Stanford, CA, USA, 2000. [Google Scholar]
  12. Mahmoodpour, S.; Singh, M.; Baer, K.; Sass, I. Thermo-hydro-mechanical modeling of an enhanced geothermal system in a fractured reservoir using carbon dioxide as heat transmission fluid—A sensitivity investigation. Energy 2022, 254, 124266. [Google Scholar] [CrossRef]
  13. Singh, M.; Mahmoodpour, S.; Ershadnia, R.; Soltanian, M.R.; Sass, I. Comparative study on heat extraction from Soultz-sous-Forêts geothermal field using supercritical carbon dioxide and water as the working fluid. Energy 2023, 266, 126388. [Google Scholar] [CrossRef]
  14. Olasolo, P.; Juárez, M.C.; Morales, M.P.; D’Amico, S.; Liarte, I.A. Enhanced geothermal systems (EGS): A review. Renew. Sustain. Energy Rev. 2016, 56, 133–144. [Google Scholar] [CrossRef]
  15. Pan, L.; Freifeld, B.; Doughty, C.; Zakem, S.; Sheu, M.; Cutright, B.; Terrall, T. Fully coupled wellbore-reservoir modeling of geothermal heat extraction using CO2 as the working fluid. Geothermics 2015, 53, 100–113. [Google Scholar] [CrossRef]
  16. Pruess, K. Enhanced geothermal systems (EGS) using CO2 as working fluid—A novel approach for generating renewable energy with simultaneous sequestration of carbon. Geothermics 2006, 35, 351–367. [Google Scholar] [CrossRef]
  17. Pan, L.; Doughty, C.; Freifeld, B. How to sustain a CO2-thermosiphon in a partially saturated geothermal reservoir: Lessons learned from field experiment and numerical modeling. Geothermics 2018, 71, 274–293. [Google Scholar] [CrossRef]
  18. Atrens, A.D.; Gurgenci, H.; Rudolph, V. CO2 Thermosiphon for Competitive Geothermal Power Generation. Energy Fuels 2009, 23, 553–557. [Google Scholar] [CrossRef]
  19. Atrens, A.D.; Gurgenci, H.; Rudolph, V. Electricity generation using a carbon-dioxide thermosiphon. Geothermics 2010, 39, 161–169. [Google Scholar] [CrossRef]
  20. Pan, C.; Romero, C.E.; Levy, E.K.; Wang, X.; Rubio-Maya, C.; Pan, L. Fully coupled wellbore-reservoir simulation of supercritical CO2 injection from fossil fuel power plant for heat mining from geothermal reservoirs. J. CO2 Util. 2018, 27, 480–492. [Google Scholar] [CrossRef]
  21. Wang, X.C.; Pan, C.J.; Romero, C.E.; Qiao, Z.L.; Banerjee, A.; Rubio-Maya, C.; Pan, L. Thermo-economic analysis of a direct supercritical CO2 electric power generation system using geothermal heat. Front. Energy 2022, 16, 246–262. [Google Scholar] [CrossRef]
  22. Hu, Z.X.; Xu, T.F.; Feng, B.; Yuan, Y.L.; Li, F.Y.; Feng, G.H.; Jiang, Z. Thermal and fluid processes in a closed-loop geothermal system using CO2 as a working fluid. Renew. Energy 2020, 154, 351–367. [Google Scholar] [CrossRef]
  23. Guo, T.; Gong, F.; Wang, X.; Lin, Q.; Qu, Z.; Zhang, W. Performance of enhanced geothermal system (EGS) in fractured geothermal reservoirs with CO2 as working fluid. Appl. Therm. Eng. 2019, 152, 215–230. [Google Scholar] [CrossRef]
  24. Xu, T.; Feng, G.; Hou, Z.; Tian, H.; Shi, Y.; Lei, H. Wellbore–reservoir coupled simulation to study thermal and fluid processes in a CO2-based geothermal system: Identifying favorable and unfavorable conditions in comparison with water. Environ. Earth Sci. 2015, 73, 6797–6813. [Google Scholar] [CrossRef]
  25. Zeng, L.; Zhang, K.-J.; Tang, X.-C.; Zhang, Y.-X.; Li, Z.-W. Mid-Permian rifting in central China; record of geochronology, geochemistry and Sr-Nd-Hf isotopes of bimodal magmatism on NE Qinghai-Tibetan Plateau. Gondwana Res. 2018, 57, 77–89. [Google Scholar] [CrossRef]
  26. Yan, W.D.; Wang, Y.X.; Gao, X.Z.; Zhang, S.; Ma, Y.; Shang, X.; Guo, S. Distribution and Aggregation Mechanism of Geothermal Energy in Gonghe Basin. Northwestern Geol. 2013, 46, 223–230. [Google Scholar]
  27. Lei, Z.; Zhang, Y.; Zhang, S.; Fu, L.; Hu, Z.; Yu, Z.; Li, L.; Zhou, J. Electricity generation from a three-horizontal-well enhanced geothermal system in the Qiabuqia geothermal field, China: Slickwater fracturing treatments for different reservoir scenarios. Renew. Energy 2020, 145, 65–83. [Google Scholar] [CrossRef]
  28. Yan, W.D. Characteristics of Gonghe Basin hot dry rock and its utilization prospects. Sci. Technol. Rev. 2015, 33, 54–57. [Google Scholar]
  29. Wang, B.; Zhang, G.; Li, S.; Yang, Z.; Roberts, A.P.; Zhao, Q.; Wang, Z. Early Carboniferous paleomagnetic results from the northeastern margin of the Qinghai–Tibetan plateau and their implications. Gondwana Res. 2016, 36, 57–64. [Google Scholar] [CrossRef]
  30. Zhang, C.; Zhang, S.; Li, S.; Jia, X.J.; Jiang, G.; Gao, P.; Wang, Y.; Hu, S. Geothermal characteristics of the Qiabuqia geothermal area in the Gonghe basin, northeastern Tibetan Plateau. Chin. J. Geophys. 2018, 61, 4545–4557. [Google Scholar]
  31. Xu, T.; Yuan, Y.; Jia, X.; Lei, Y.; Li, S.; Feng, B.; Hou, Z.; Jiang, Z. Prospects of power generation from an enhanced geothermal system by water circulation through two horizontal wells: A case study in the Gonghe Basin, Qinghai Province, China. Energy 2018, 148, 196–207. [Google Scholar] [CrossRef]
  32. Lei, Z.; Zhang, Y.; Yu, Z.; Hu, Z.; Li, L.; Zhang, S.; Fu, L.; Zhou, L.; Xie, Y. Exploratory research into the enhanced geothermal system power generation project: The Qiabuqia geothermal field, Northwest China. Renew. Energy 2019, 139, 52–70. [Google Scholar] [CrossRef]
  33. Zhang, C.; Jiang, G.; Jia, X.; Li, S.; Zhang, S.; Hu, D.; Hu, S.; Wang, Y. Parametric study of the production performance of an enhanced geothermal system: A case study at the Qiabuqia geothermal area, northeast Tibetan plateau. Renew. Energy 2019, 132, 959–978. [Google Scholar] [CrossRef]
  34. Ram Mohan, A.; Turaga, U.; Shembekar, V.; Elsworth, D.; Pisupati, S.V. Utilization of carbon dioxide from coal-based power plants as a heat transfer fluid for electricity generation in enhanced geothermal systems (EGS). Energy 2013, 57, 505–512. [Google Scholar] [CrossRef]
  35. Pruess, K.; Oldenburg, C.; Moridis, G. TOUGH2 User’s Guide Version 2; Lawrence Berkeley Natl Lab: Berkeley, CA, USA, 1999.
  36. Pan, L.; Oldenburg, C.M. T2Well—An integrated wellbore–reservoir simulator. Comput. Geosci. 2014, 65, 46–55. [Google Scholar] [CrossRef]
  37. Vasini, E.M.; Battistelli, A.; Berry, P.; Bonduà, S.; Bortolotti, V.; Cormio, C.; Pan, L. Interpretation of production tests in geothermal wells with T2Well-EWASG. Geothermics 2018, 73, 158–167. [Google Scholar] [CrossRef]
  38. Hu, L.; Pan, L.; Zhang, K. Modeling brine leakage to shallow aquifer through an open wellbore using T2WELL/ECO2N. Int. J. Greenh. Gas Control 2012, 9, 393–401. [Google Scholar] [CrossRef]
  39. Chen, Z.; Zhang, B.; Zhou, J.; Liu, H.; Zhou, L.; Wu, C. Research and Test on the Stimulated Reservoir Volume Technology of Hot Dry Rock. Pet. Drill. Tech. 2020, 48, 82–87. [Google Scholar]
  40. Liao, J.; Cao, C.; Hou, Z.; Mehmood, F.; Feng, W.; Yue, Y.; Liu, H. Field scale numerical modeling of heat extraction in geothermal reservoir based on fracture network creation with supercritical CO2 as working fluid. Environ. Earth Sci. 2020, 79, 1–22. [Google Scholar] [CrossRef]
  41. Farkas, M.P.; Hofmann, H.; Zimmermann, G.; Zang, A.; Bethmann, F.; Meier, P.; Cottrell, M.; Josephson, N. Hydromechanical analysis of the second hydraulic stimulation in well PX-1 at the Pohang fractured geothermal reservoir, South Korea. Geothermics 2021, 89, 101990. [Google Scholar] [CrossRef]
  42. Yuan, Y.; Xu, T.; Moore, J.; Lei, H.; Feng, B. Coupled Thermo–Hydro–Mechanical Modeling of Hydro-Shearing Stimulation in an Enhanced Geothermal System in the Raft River Geothermal Field, USA. Rock Mech. Rock Eng. 2020, 53, 5371–5388. [Google Scholar] [CrossRef]
  43. Yuan, Y.; Xu, T.; Jiang, Z.; Feng, B. Prospects of power generation from the deep fractured geothermal reservoir using a novel vertical well system in the Yangbajing geothermal field, China. Energy Rep. 2021, 7, 4733–4746. [Google Scholar] [CrossRef]
  44. Liu, G.; Zhou, C.; Rao, Z.; Liao, S. Impacts of fracture network geometries on numerical simulation and performance prediction of enhanced geothermal systems. Renew. Energy 2021, 171, 492–504. [Google Scholar] [CrossRef]
  45. Cladouhos, T.T.; Petty, S.; Swyer, M.W.; Uddenberg, M.E.; Grasso, K.; Nordin, Y. Results from Newberry Volcano EGS Demonstration, 2010–2014. Geothermics 2016, 63, 44–61. [Google Scholar] [CrossRef]
  46. Zhang, E.-Y.; Wen, D.-G.; Wang, G.-L.; Yan, W.-D.; Wang, W.-S.; Ye, C.-M.; Li, X.-F.; Wang, H.; Tang, X.-C.; Weng, W.; et al. The first power generation test of hot dry rock resources exploration and production demonstration project in the Gonghe Basin, Qinghai Province, China. JO-China Geol. 2022, 5, 372–382. [Google Scholar] [CrossRef]
  47. Liu, B.; Jin, H.; Sun, L.; Sun, Z.; Su, Z.; Zhang, C. Holocene climatic change revealed by aeolian deposits from the Gonghe Basin, northeastern Qinghai–Tibetan Plateau. Quat. Int. 2013, 296, 231–240. [Google Scholar] [CrossRef]
  48. Borgia, A.; Pruess, K.; Kneafsey, T.J.; Oldenburg, C.M.; Pan, L. Numerical simulation of salt precipitation in the fractures of a CO2-enhanced geothermal system. Geothermics 2012, 44, 13–22. [Google Scholar] [CrossRef]
  49. Sanyal, S.K.; Butler, S.J. (Eds.) An Analysis of Power Generation Prospects from Enhanced Geothermal Systems; Transactions Geothermal Resources Council: Reno, NV, USA, 2005. [Google Scholar]
  50. Keith, E. Enhanced/engineered geothermal systems: An introduction with overviews of deep systems built and circulated to date. In China Geothermal Development Forum Beijing; Geological Publishing House: Beijing, China, 2010; pp. 395–418. [Google Scholar]
  51. Cao, W.; Huang, W.; Jiang, F. Numerical study on variable thermophysical properties of heat transfer fluid affecting EGS heat extraction. Int. J. Heat Mass Transf. 2016, 92, 1205–1217. [Google Scholar] [CrossRef]
  52. Mathias, S.A.; Gluyas, J.G.; Oldenburg, C.M.; Tsang, C.-F. Analytical solution for Joule-Thomson cooling during CO2 geo-sequestration in depleted oil and gas reservoirs. Int. J. Greenh. Gas Control 2010, 4, 806–810. [Google Scholar] [CrossRef]
  53. Oldenburg, C.M. Joule-Thomson cooling due to CO2 injection into natural gas reservoirs. Energy Convers. Manag. 2007, 48, 1808–1815. [Google Scholar] [CrossRef]
  54. Zhang, X.X.; Wang, Z.P.; She, A.M.; Wei, Y.Q.; Zhu, Z.Y. Preparation and characterization of high-strength low-thermal-conductivity cement-based insulation materials. IOP Conf. Ser. Mater. Sci. Eng. 2019, 542, 012070. [Google Scholar] [CrossRef]
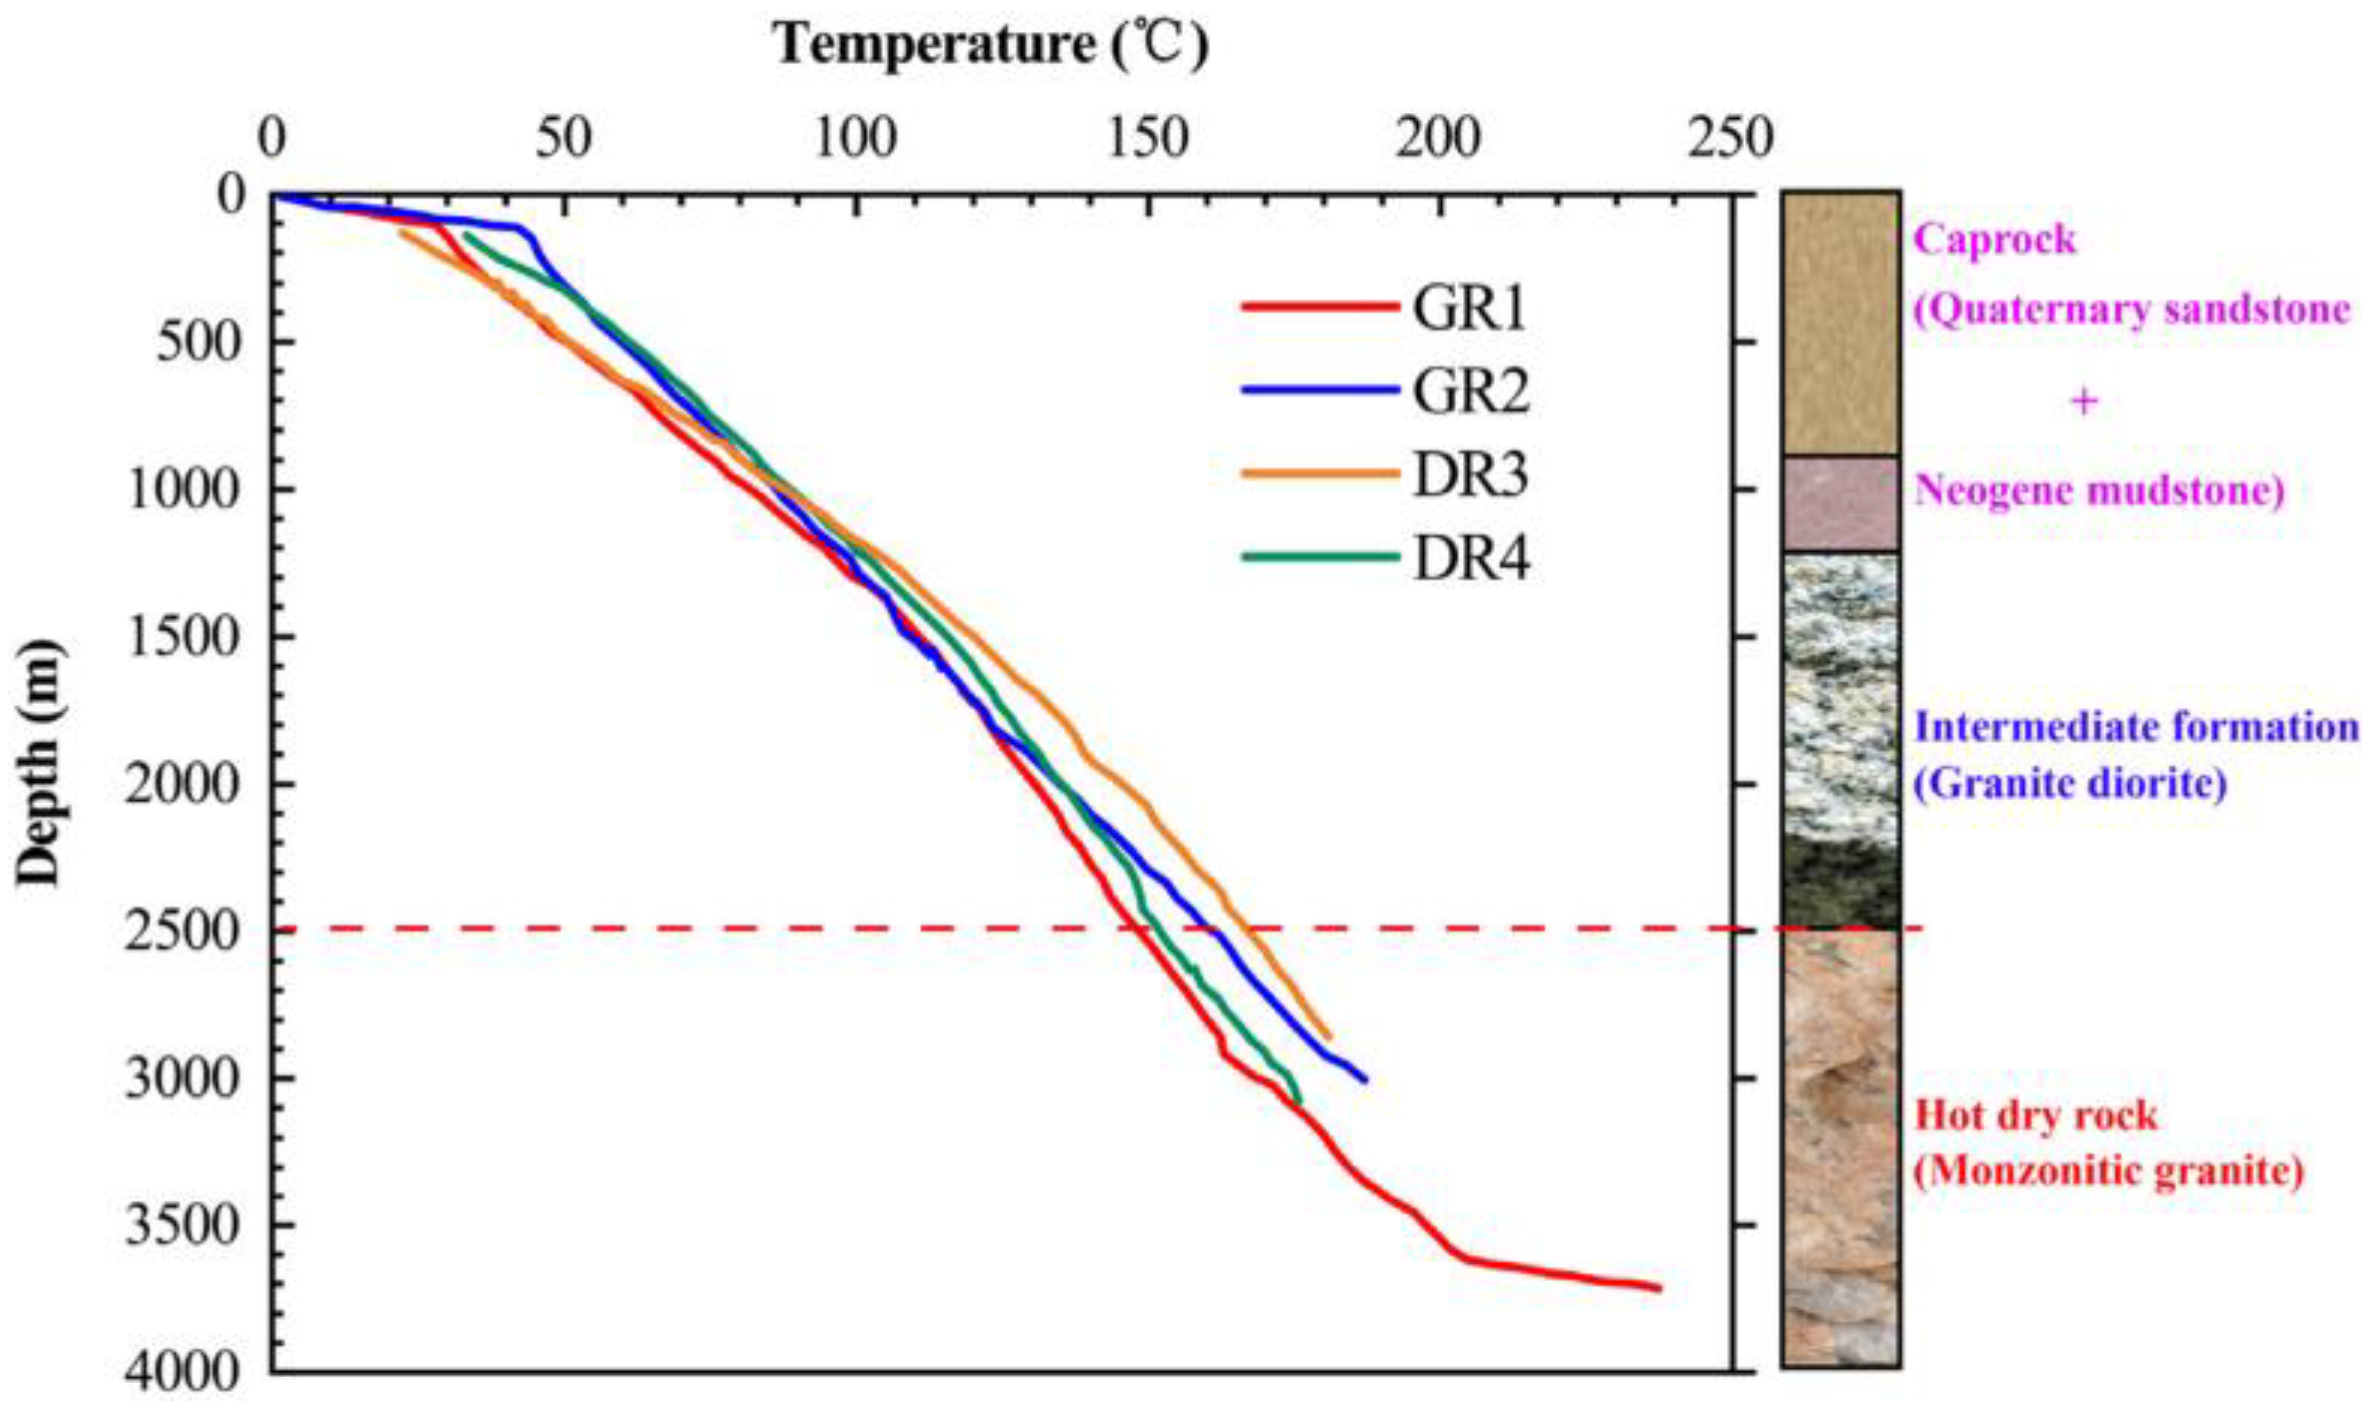
Figure 1. Temperature–depth profiles of four geothermal wells in the Qiabuqia geothermal area; the stratigraphic sections are also shown [27].
Energies 16 07202 g001
Figure 2. Schematic diagram of (a) the conceptual CO2-EGS with one production well and one injection well [18], (b) the heterogeneous fractured reservoir model, and (c) the 3D model geometry and simulation grids [3].
Energies 16 07202 g002
Figure 3. Distribution of EGS reservoir permeability from the inversion of microseismic data at the Gonghe Basin EGS site [46].
Energies 16 07202 g003
Figure 4. Evolutions of (a) production temperature, (b) mass flow rate in the production well, and (c) heat extraction rate during the production over 30 years.
Energies 16 07202 g004
Figure 5. Spatial distribution of the rock matrix temperature in the fractured geothermal reservoir at (a) 1 year, (b) 10 years, and (c) 30 years [3].
Energies 16 07202 g005
Figure 6. Distribution of the CO2 velocity along injection and production wellbores after 15 years of geothermal production [3].
Energies 16 07202 g006
Figure 7. Changes in (a) density and (b) specific enthalpy of CO2 along the wellbore after 15 years of production. The background shows the contour lines of density and specific enthalpy at different temperatures and pressures.
Energies 16 07202 g007
Figure 8. Distribution of the Joule–Thompson coefficient along injection and production wellbores after 15 years of geothermal production.
Energies 16 07202 g008
Figure 9. Comparison of mass flow rate for use of two working fluids [3].
Energies 16 07202 g009
Table 1. Reservoir and wellbore parameters used in the model.
PropertiesValue
Reservoir
Density (kg/m3)2623
Specific heat (J/(kg·°C))980
Heat conductivity (W/(m·°C))3
Volume fraction of fracture0.02
Fracture spacing (m)50
Fracture porosity0.5
Matrix porosity1 × 10−5
Permeability in fractured reservoir
kf1 (m2)50 × 10−15
kf2 (m2)75 × 10−15
kf3 (m2)100 × 10−15
Matrix permeability (m2)9 × 10⁻¹⁹
Wellbore
Heat conductivity (W/(m·°C))2.51
Diameter (m)0.2
Roughness (mm)0.046
Disclaimer/Publisher’s Note: The statements, opinions and data contained in all publications are solely those of the individual author(s) and contributor(s) and not of MDPI and/or the editor(s). MDPI and/or the editor(s) disclaim responsibility for any injury to people or property resulting from any ideas, methods, instructions or products referred to in the content.