Article

Suitable Analysis of Micro-Increased Capacity Model on Cold-End System of Nuclear Power Plant

1
Key Laboratory of Condition Monitoring and Control for Power Plant Equipment, Ministry of Education, North China Electric Power University, Beijing 102206, China
2
Beijing Jingqiao Thermal Power Co., Ltd., Beijing 101102, China
*
Author to whom correspondence should be addressed.
Energies 2023, 16(20), 7188; https://doi.org/10.3390/en16207188
Submission received: 15 September 2023 / Revised: 8 October 2023 / Accepted: 13 October 2023 / Published: 21 October 2023
(This article belongs to the Section B4: Nuclear Energy)

Abstract

:
The cold-end system of a nuclear power plant is a key complex node connecting the power generation system with the variable environmental conditions, and its operation, economy, and stability have become the main obstacles to further improving the performance of the first and second circuits. The current research on the interactions between the cold-end system and the thermal cycle of nuclear power mainly adopts the micropower model, while the existing condenser model does not take into account the influence of the turbine exhaust resistance and exhaust flow and other factors on the condenser vacuum change caused by the change in the circulating water flow rate and temperature in determining the optimal vacuum. This ignores the interactions between the equipment and the interconnections between the parameters, which results in the reduction of the model’s accuracy. This paper takes a nuclear power unit as an example, adopts the “constant flow calculation” method to calculate the heat balance of the two-loop thermal system of the nuclear power plant, and constructs an integrated simulation model of the reaction environment variables, the cold-end system, and the thermal cycle. Taking the circulating water temperature and flow rate as variables, the errors of the separate condenser model and the coupled model in circulating water parameter changes were obtained under the condition of satisfying the thermal system operation, and the circulating water temperature and flow rate change ranges applied by the separate condenser model were analyzed in order to reduce the amount of calculations when the unit power error was 1%. The results show that the circulating water temperature is 4 °C, the applicable range of the circulating water flow rate is 42 m3/s to the rated flow rate, the applicable range of the circulating water temperature is 20 °C, the applicable range of the circulating water flow rate is 32.12 m3/s to the rated flow rate, the applicable range of the circulating water temperature is 26 °C, the applicable range of the circulating water flow rate is 38.63 m3/s to the rated flow rate, the applicable range of the circulating water temperature is 30 °C, and the applicable range of the circulating water flow rate is 45 m3/s to the rated flow rate. At a circulating water temperature of 26 °C, the applicable range of the circulating water flow is between 38.63 m3/s and the rated flow; at a circulating water temperature of 30 °C, the applicable range of the circulating water flow is between 45.64 m3/s and the rated flow.

1. Introduction

Cold-end systems have a significant impact on unit economics. The thermal efficiency of nuclear power plants currently in operation is usually slightly lower than that of coal-fired power plants, and the cold-end system of a nuclear power plant affects the output of the unit through the condenser vacuum, which reduces the unit’s cycle efficiency and thermal economy. The performance of the condenser-cooling system, which discharges 60% of the heat absorbed by the work mass from the reactor to the environment, has become a key constraint on improving the efficiency of the thermal cycle. Therefore, it is an important means for nuclear power plants to save energy, reduce consumption, and improve the thermal economy of the unit to study the cold-end system, improve its operational performance, ensure that the condenser works under the optimal vacuum, and realize the optimal operation of the cold-end system [1]. In determining the optimal vacuum, the existing condenser model does not take into account the effect of the change in the condenser vacuum caused by the change in the circulating water flow rate and temperature on the turbine exhaust resistance and other factors.
Most of the existing models of the cold-end and unit economics model the turbine and condenser separately, analyze the effect of the circulating water temperature and flow rate changes on the turbine back pressure through the condenser model, analyze the effect of back pressure on the unit economics through the turbine model, and then link the two models together through the back pressure. The impact of the cold-end system on the economy can be reflected in the cold-end system micropower characteristics, which need to go to analyze the turbine back pressure characteristics, and use the turbine back pressure characteristics to establish the micropower model of the cold-end system. For steam turbines, some scholars have studied the power back pressure characteristics of the turbine in order to more accurately determine the turbine back pressure power variation relationship [2,3]. Colonna and Van Putten [4,5] proposed a model in which the parameters in the heat exchanger are corrected as a function of the operating conditions using Dittus–Boelter and Colburn correlations. However, their study looked at the economizer and superheater of the boiler rather than the wet turbine in this study. Some scholars have established a simulation system for thermal systems based on energy, mass, and momentum equations and verified the accuracy of the system calculations [6,7,8,9,10]. Drawing on Chailbakhsh A [11], in order to characterize the transient dynamics of a steam turbine, in this paper, a nonlinear mathematical model is firstly developed based on energy balance, thermodynamic principles, and semi-empirical equations. Then, the relevant parameters of the established model are determined through empirical relations and finally adjusted using algorithms. Chao Li et al. [12], using the matrix method to calculate the vapor parameters of the turbine, can improve the calculation speed of the software. For condensers, the effects of the circulating water temperature [13,14] and flow rate [15,16] as well as fouling [17] on the performance of the condenser were investigated. The back pressure of the turbine varies with the turbine load, the circulating water flow rate, and the temperature, and the heat transfer performance will be degraded during condenser cycling due to fouling formed by impurities and biomass in the circulating water. Some scholars [18,19,20,21,22,23,24] have established dynamic mathematical models of condensers in large power stations and verified the accuracy and generality of the models. For cold-end systems vs. system power, Chuang C-C et al. [25], based on the actual operation of the power plant, found that the efficiency of the stage group increases significantly when the back pressure decreases due to the change in ambient temperature. Many of the studies mentioned above have analyzed the performance of the turbine separately from the condenser. However, this approach often ignores the interactions between devices and the interconnections between parameters. If the link between the thermal cycle system and the cold-end system is established, the effect of the cold-end system on the unit’s micropower increase can be studied more accurately.
The methods described above often ignore the interactions between the equipment and the interconnections between the parameters. Therefore, we propose a method to establish the connection between the thermal cycle system and the cold-end system. As for the coupled model of the turbine and the condenser, the change in the exhaust vapor flow rate can be added into the model to obtain more accurate calculation results. The contribution of each parameter of the cold-end system to the unit’s slight power increase can be studied more accurately.
This paper investigates the energy transport transformation mechanism of the nuclear power thermal cycle and the cold-end system. Integrated simulation modeling of an open cooling system thermal cycle is established. The effect of the circulating water temperature and the flow rate on the unit’s micropower increase is systematically analyzed. The error between the original nuclear cold-end system micropower model and the integrated simulation model is obtained, and, finally, the scope of application of the original nuclear cold-end system micropower model is given.

2. Nuclear Thermal System Description

A sketch of the nuclear principle thermal system of a nuclear power unit is given in Figure 1. Its thermal system mainly consists of a steam generator, a steam–water separation and reheat system, a turbine power generation system, a high-pressure feedwater heating system, a deaerator system, a low-pressure feedwater heating system, a condenser, and a circulating water pump system. Where SE is the vapor separator, RH1 and RH2 are the primary and secondary reheaters, H1 and H2 are the first and second high-pressure heaters, H3 is the deaerator, and H4, H5, H6, and H7 are the four-, five-, six-, and seven-stage low-pressure heaters. Under normal operating conditions, the first loop cooler absorbs the heat and warms up in the nuclear island, and then it enters the conventional island to heat the second loop feedwater in the steam generator, which becomes saturated steam. The saturated steam from the steam generator enters the high-pressure cylinder to expand and do work, and part of the expanded steam is discharged from the high-pressure cylinder into the steam–water separator and reheater to carry out hydrophobicity and reheat. It then goes to the low-pressure cylinder to expand and do work, and the low-pressure cylinder exhaust steam enters the condenser to exchange heat with the circulating water so as to condense into water. The condensate is pressurized by pumps, and then it enters the low-pressure feedwater heating system to be heated. It then enters the deaerator to be heated and deoxygenated. After that, it is pressurized by the water pump to enter the high-pressure feedwater heating system for heating, and, finally, the feedwater enters the steam generator to realize the circulation of the steam and water.
It is worth noting that most of the saturated steam coming out of the steam generator goes into the high-pressure cylinder to expand and do work, and part of it goes into the secondary heater to heat the high-pressure cylinder exhaust steam. A portion of the first-stage high-pressure heater exhaust steam goes to the first-stage heater to heat the high-pressure cylinder exhaust steam. The hydrophobic water from the primary and secondary reheaters goes to the secondary high-pressure heater and the primary high-pressure heater, respectively, separating hydrophobic water into the deaerator.

3. Calculation Model for Nuclear Power Two and Three Circuits

3.1. Calculation Model for Major Equipment

3.1.1. Calculation Model for a Two-Loop System

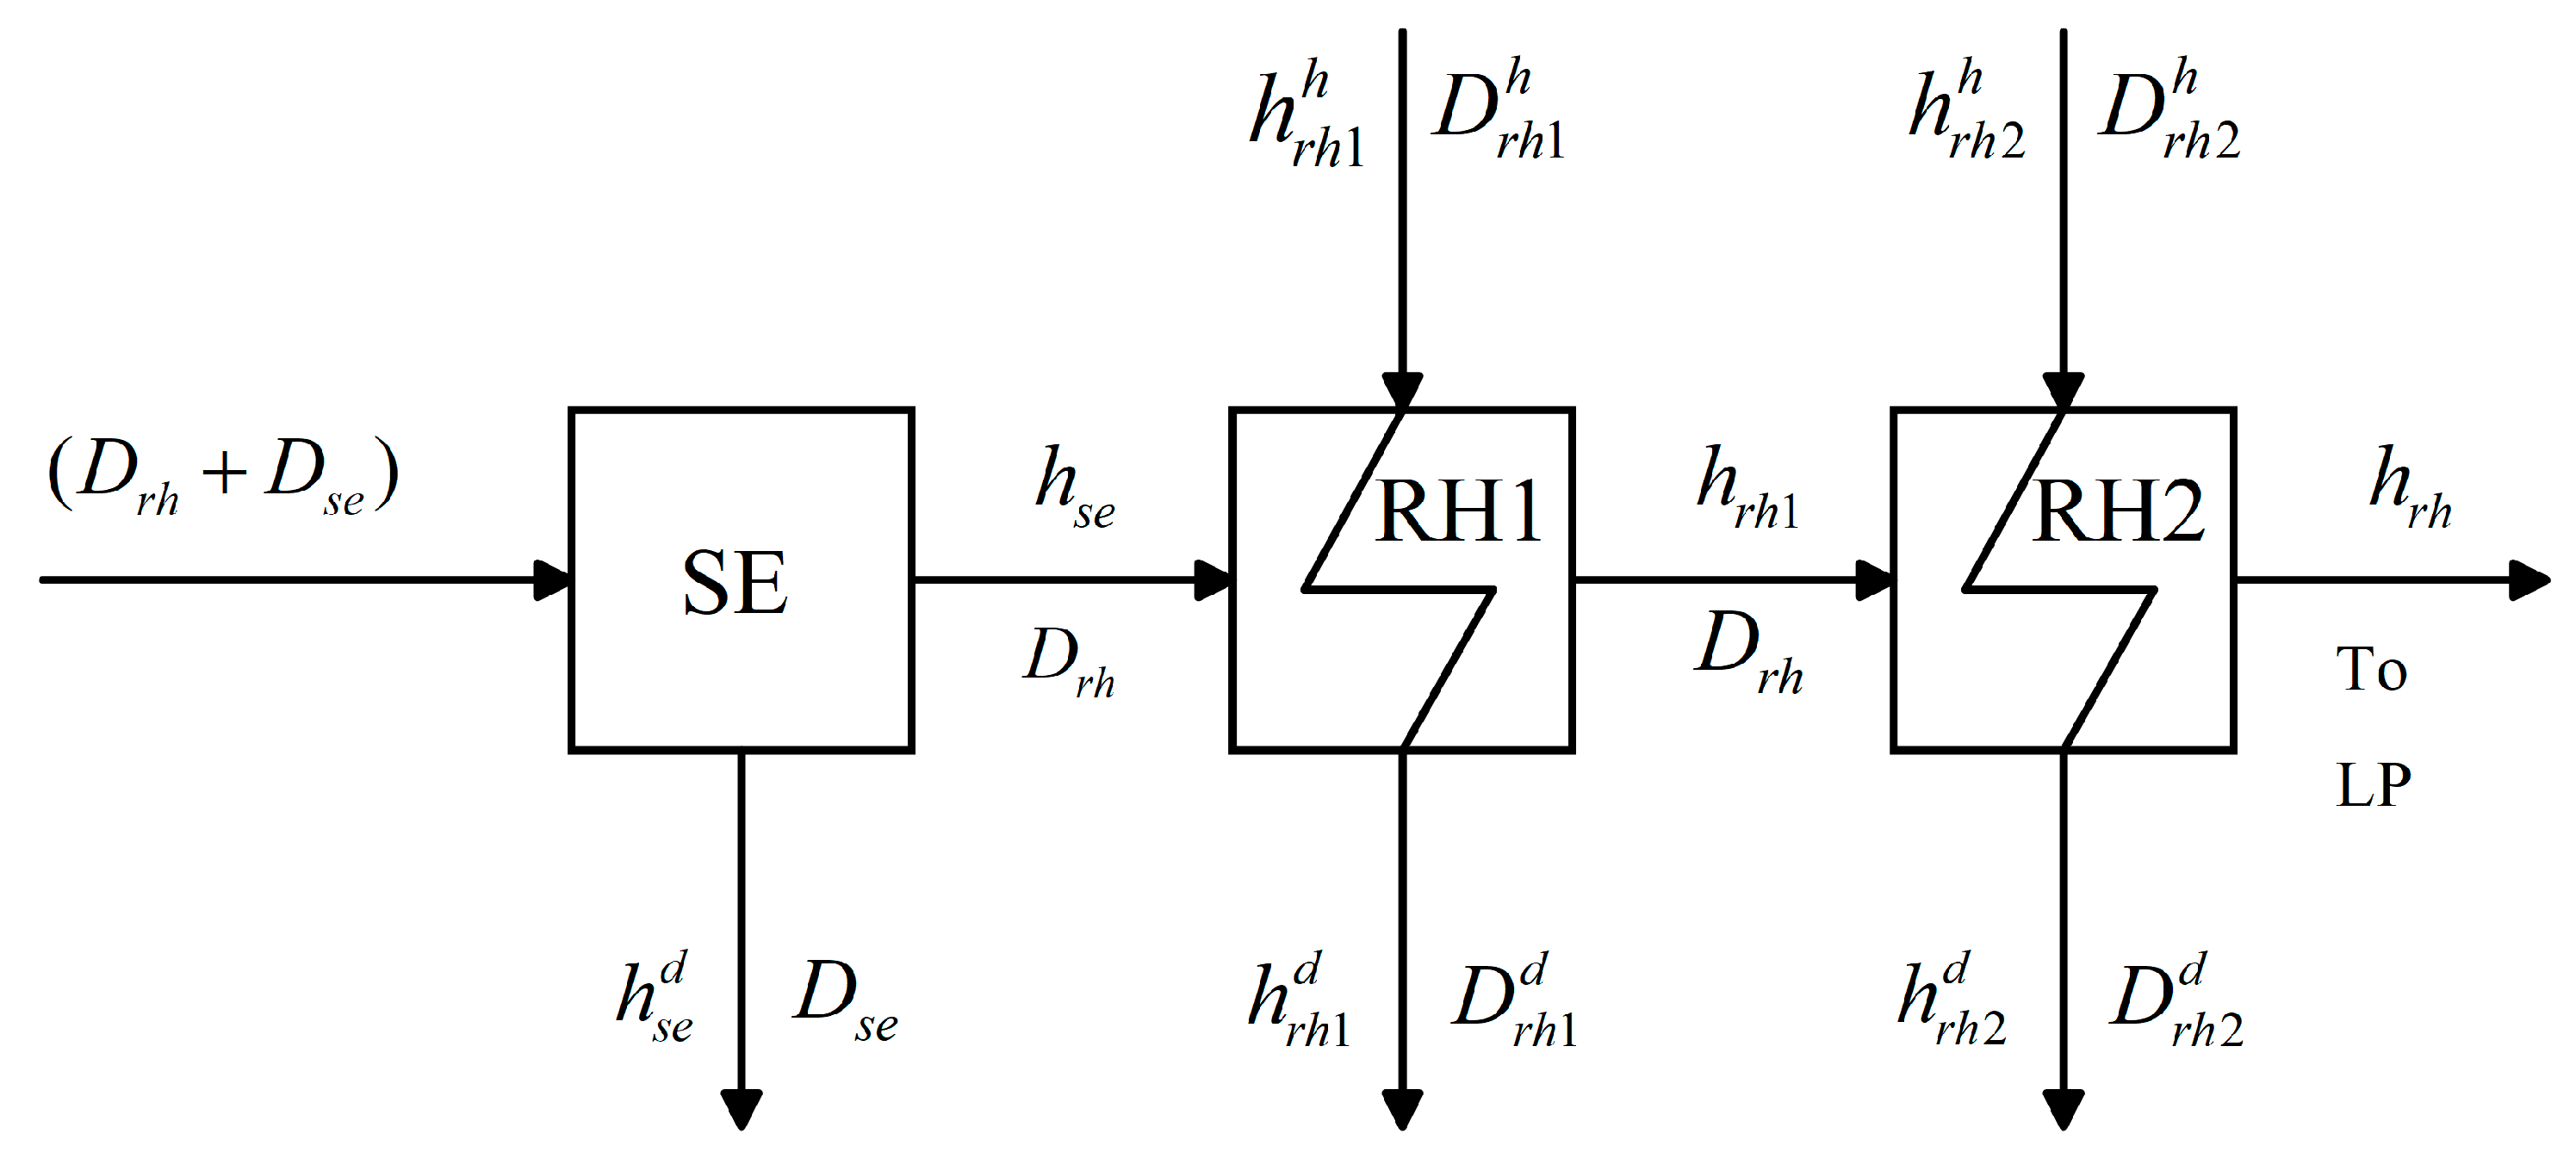
Figure 2 shows the vapor separation reheater. The steam–water separation reheater is arranged at the location of the outlet of the high-pressure cylinder to render hydrophobic and reheat the exhaust steam of the high-pressure cylinder and to improve the dryness of the inlet steam of the low-pressure cylinder, thus improving the economy and safety.
D r h 1 = h r h 1 h s e h r h 1 h h r h 1 d
D r h 2 = h r h h r h 1 h r h 2 h h r h 2 d
D s e = η s e D r h ( 1 x ) 1 η s e ( 1 x )
where Drh and Dse represent the flow rate of the reheat steam into the low-pressure cylinder and the flow rate of the separated water from the vapor separator, Drh1 and Drh2 represent the amount of steam used to heat the primary and secondary reheaters, hse, hrh1, and hrh represent the separator outlet enthalpy, primary reheater outlet enthalpy, and secondary reheater outlet enthalpy, hhrh1 and hhrh2 represent the enthalpy of vapor heating the primary and secondary reheaters, hdrh1 and hdrh2 represent the enthalpy of cooling of the steam heating the primary and secondary reheaters, ηse represents the separator efficiency, and x represents the high-pressure cylinder exhaust vapor dryness.
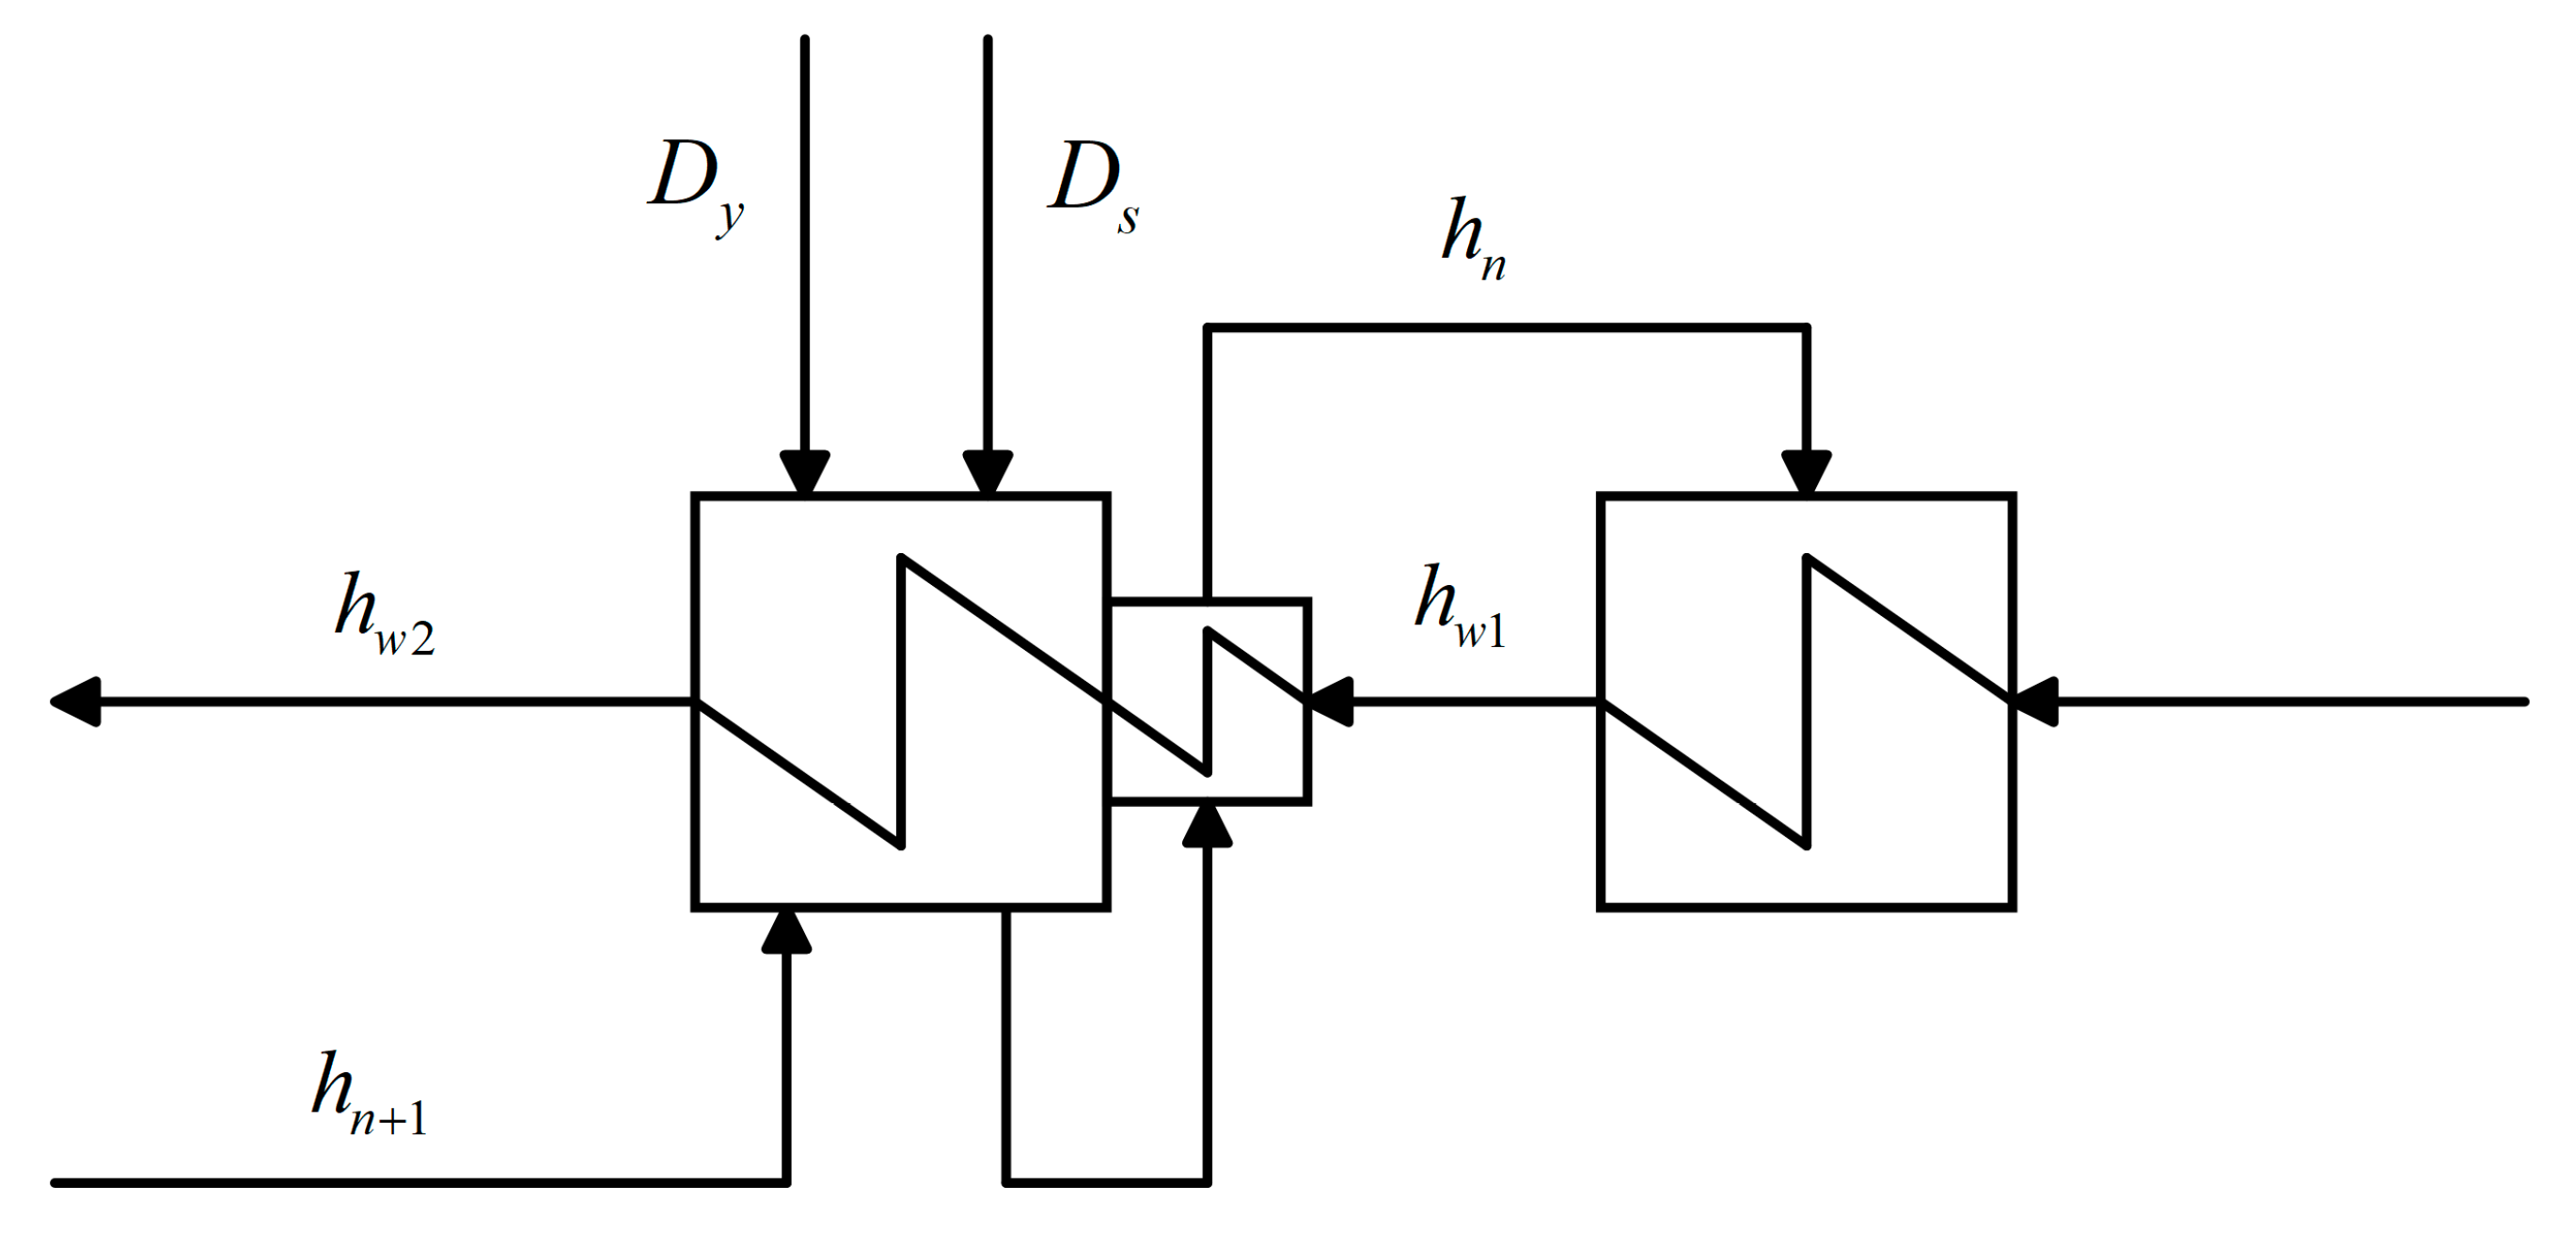
Figure 3 shows a heater with a hydrophobic cooling section. The feedwater is heated in the heater by the return steam and the upper-stage sparge water, and the resulting vapor–water mixture preheats the feedwater entering the heater in the cooling section. Then, the most sparged water of the stage is discharged.
D s h s h n η y = D w 1 , n + 1 h w 2 h w 1 D d , n + 1 h n + 1 h n D y h y h n
where Ds and Dy represent the Pumping Volume and the Vapor Seal Pumping Volume, Dw1,n+1 and Dd,n+1 represent the water supply and the upper-level heater evacuation, hs and hn represent the enthalpy of vapor extraction and the enthalpy of hydrophobic water in the return heaters of this stage, hw1 and hw2 represent the inlet and outlet water enthalpy of the return heaters, hn+1 and hy represent the enthalpy of the upper-level return heaters and the enthalpy of vapor extraction from the vapor seal, and ηy represents the heater heat transfer efficiency.
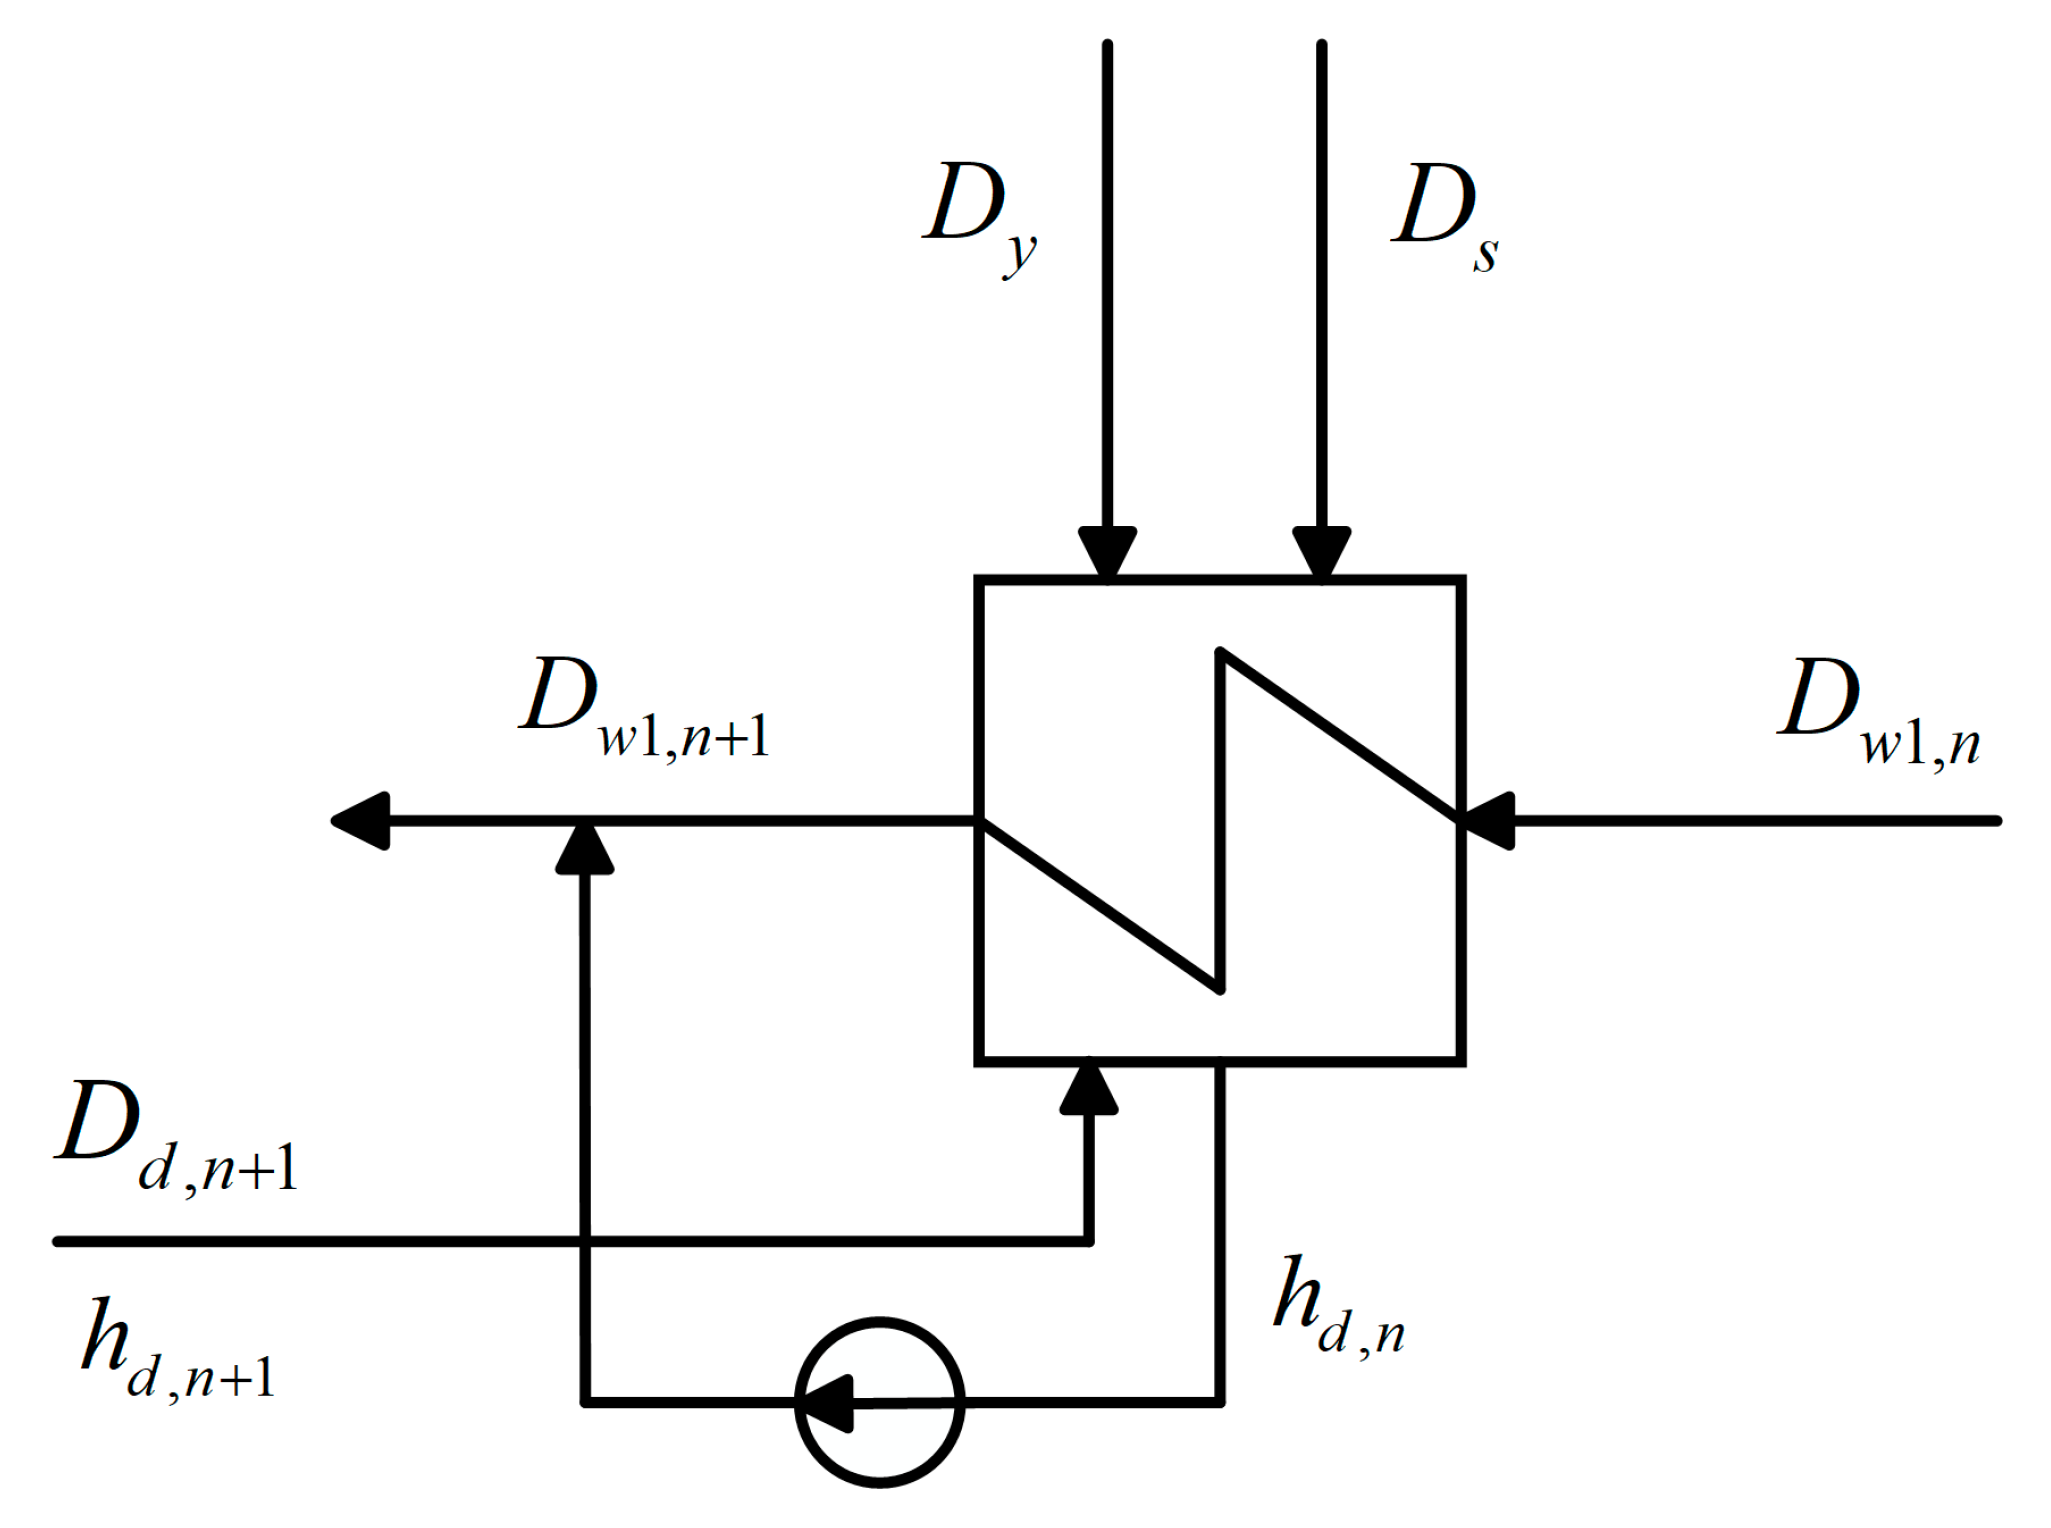
Figure 4 shows a heater with a hydrophobic pump type. This type of heater pumps the exothermic condensed hydrophobic water from the heater to the outlet of the heater.
D s h s h w 1 , n + 1 η y = D w 1 , n + 1 D s D d , n + 1 D y h w 1 , n + 1 h w 1 D d , n + 1 h d , n + 1 h w 1 , n + 1 D y h y h w 1 , n + 1
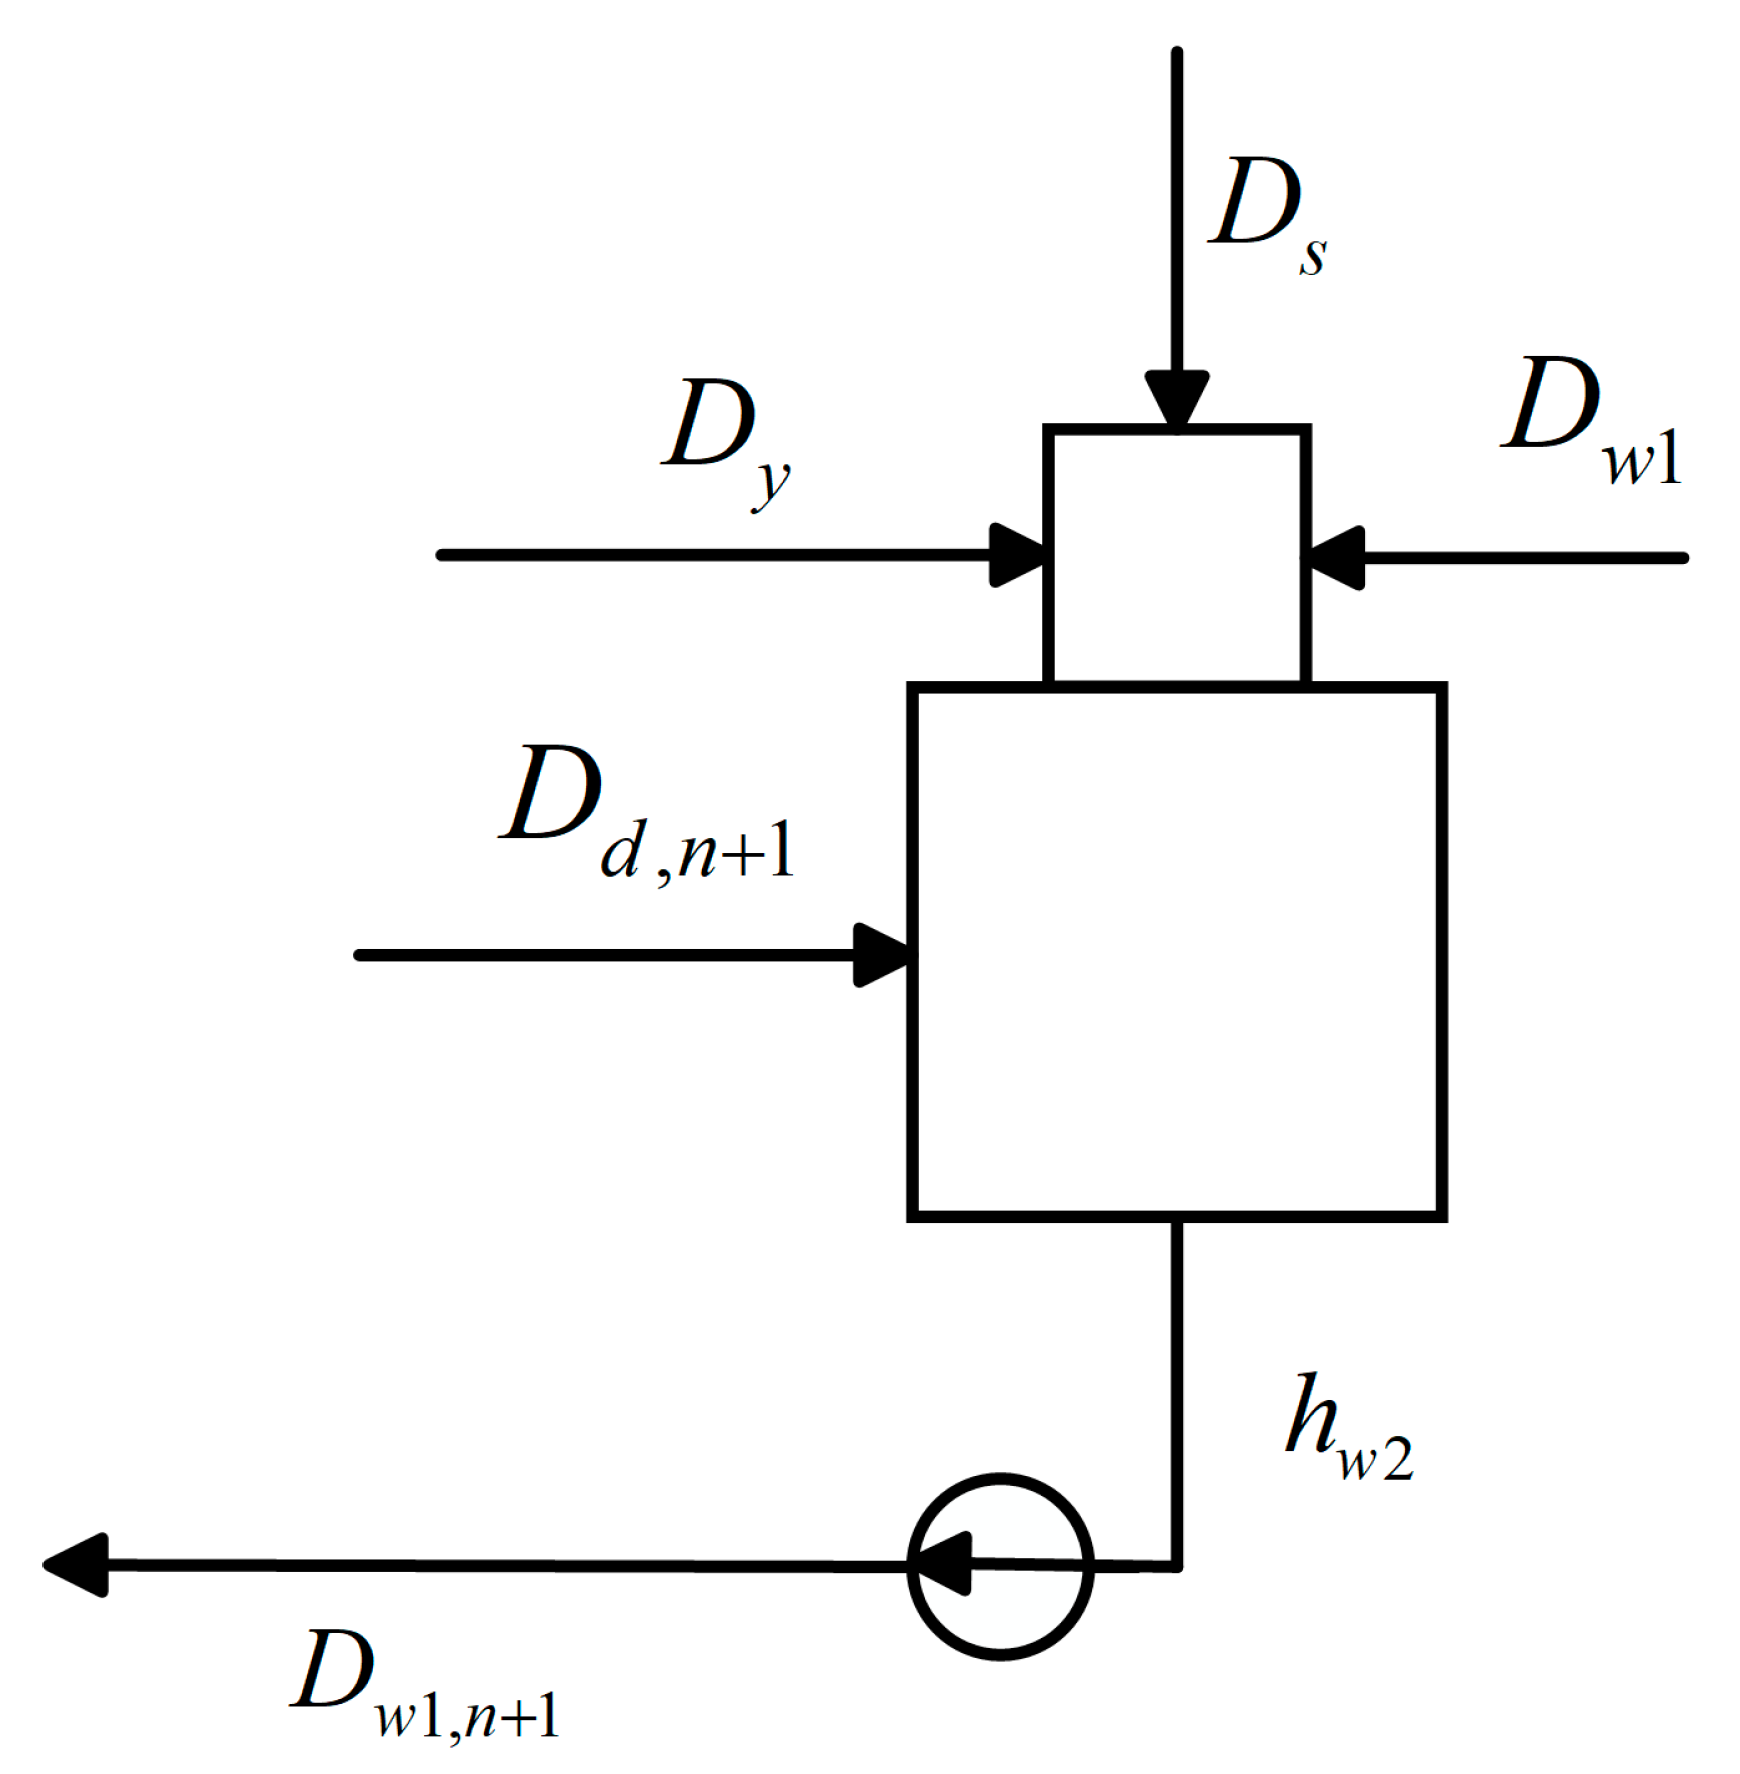
Figure 5 shows the deaerator. The deaerator is a hybrid heater whose function is to heat the feedwater to saturation at the operating pressure of the deaerator, thereby removing dissolved oxygen from the water.
D s h s h w 1 η y = D w 1 h w 2 h w 1 D d , n + 1 h d , n + 1 h w 1 D y h y h w 1
where Dw1 represents the feedwater and hd,n+1 represents enthalpy of the upper-level hydrophobicity.
The heater-end differential changes at variable operating conditions thus affect the heat exchange coefficient of the heater, which is shown below for the heater at variable operating conditions.
Disregarding the effects of wall heat transfer and fouling thermal resistance, the heat transfer coefficient for a circular tube based on the surface of the outer wall of the tube is:
k = 1 1 a o + 1 a i · d o d i
where ao represents the steam heat transfer coefficient outside of the tube, ai represents the partial coefficient of convective heat transfer of feedwater in the pipe, do represents the outer diameter, and di represents the inner diameter of the tube.
The following is the tube-side heat transfer coefficient.
The convective heat transfer coefficient from the wall to the feedwater is:
a i = 0.023 λ d i R e 0.8 P r 0.4
R e = d i w υ
w = D v π 4 d i 2 N
where λ represents the thermal conductivity of water in the pipe, Re represents the Reynolds number, υ represents the kinematic viscosity of water in the pipe, w represents the water flow rate in the pipe, v represents the specific volume of water in the tube, N represents the number of tubes per stroke, and Pr represents the Plante number.
The following is the shell-side heat transfer coefficient.
(a)
Overheating section
The heat transfer coefficient for superheated steam sweeping across a forked tube bundle is calculated as follows:
a o 1 = 0.35 λ d e R e 1 0.6 P r 0.36
R e 1 = d o w 1 υ 1
w 1 = D v 1 A 1
where Re1 represents the Reynolds number of superheated steam, υ1 represents the Kinematic Viscosity of Steam, w1 represents the Superheated Steam Flow Rate, v1 represents the specific volume of the superheated steam, and A1 represents the minimum cross-sectional area for a longitudinal sweep of the superheated steam bundle.
(b)
Coagulation section
The heat transfer coefficient of the horizontal tube bundle steam to the tube wall is calculated as follows:
a o 2 = 0.5894 B r N w d o t s a t t w 4
where r represents the latent heat of vaporization of the steam, tsat represents the saturation temperature of steam in the heater, tw represents the condensation section vapor side pipe wall temperature, B represents coefficients related to the average temperature of the condensate film, and Nw represents the average number of rows of tubes along the vertical on the steam side of a horizontal tube bundle.
(c)
Hydrophobic section
The heat transfer partition coefficient for a horizontal heater with a hydrophobic cross-swept fork-row tube bundle is calculated as follow:
a o 3 = 0.35 λ d e R e 3 0.6 P r 0.36
R e 3 = d o w 3 υ 3
w 3 = D + D d , n + 1 v 3 A 3
where Re3 represents the hydrophobic Reynolds number, υ3 represents the kinematic viscosity of hydrophobicity, w3 represents the Superheated Steam Flow Rate, v3 represents the specific volume of hydrophobicity, and A3 represents the minimum cross-sectional area of the hydrophobic longitudinal tube bundle.
The turbine internal power calculation formula is as follows:
W = D h h 0 1 z D i h i D h e h h c + D r h h r h 1 k D j h j D l e h l e
where Dh, Di, Dhe, Drh, Dj, and Dle represent the steam flow rate into the high-pressure cylinder, the pumping flow rate at all levels of the high-pressure cylinder, the exhaust flow rate of the high-pressure cylinder, the steam flow rate into the low-pressure cylinder after reheating, the pumping flow rate at all levels of the low-pressure cylinder, and the exhaust flow rate of the low-pressure cylinder. h0, hi, hhe, hrh, hj, and hle represent the enthalpy of the steam entering the high-pressure cylinder, the enthalpy of vapor extraction at all levels of the high-pressure cylinder, the enthalpy of vapor discharge from the high-pressure cylinder, the enthalpy of the steam entering the low-pressure cylinder after reheating, the enthalpy of vapor extraction at all levels of the low-pressure cylinder, and the enthalpy of vapor discharge from the low-pressure cylinder.

3.1.2. Three-Loop System Calculation Model

Currently, when analyzing the effect of the circulating water temperature and the flow rate on the power of the unit, the condenser is mostly taken as a separate part to calculate. In this paper, the latest HEI (heat exchange instrument) formulation is utilized to establish the heat and mass transfer equations for the condenser.
The heat transfer coefficient formula is as follows:
K = F c K 0 F M F W
where K represents the overall heat transfer coefficient of the condenser, Fc represents the comprehensive cleaning factor (for the condenser operation, generally take a cleaning factor of 0.85), K0 represents the uncorrected basic heat transfer, FW represents the inlet temperature correction factor for circulating water, and FM represents the correction factors for the pipe material and thickness.
The cooling multiplier formula is as follows:
m = D c w D l e
where Dcw and Dle represent the Circulating Cooling Water Volume and the Turbine Exhaust Volume.
The condenser heat load calculation formula is as follows:
Q = D l e ( h sat h l e ) = c p D c w ( t c w 2 t c w 1 )
where Q represents the condenser heat load, hsat represents the specific enthalpy of the turbine exhaust vapor, hle represents the specific enthalpy of the condensate, cp represents the specific heat capacity of the cooling water, and tcw2 and tcw1 represent the cooling water outlet temperature and the inlet temperature.
The condenser crosstalk calculation formula is as follows:
δ t = t c w 2 t c w 1 e K A c p D c w 1
where δt represents crosstalk and A represents the cooling area.
The condenser saturation temperature formula is as follows:
t s a t = δ t + t c w 1 + Δ t
where Δt represents the temperature rise of the circulating water inlet and outlet.

3.2. Model Calculation Logic

3.2.1. Calculation Logic for Two-Loop Models

In the nuclear power two-loop, the temperature, pressure, flow, and other parameters of the fluid in and out of each device are not independent, as there is a coupling of thermal parameters. When the operating conditions of the thermal system change within a certain range, it is necessary to provide the input parameters in order to obtain the operating parameters of each node of the thermal system through modeling. For simplicity of calculation, the effect of the temperature change can be ignored, and the flux area is considered to be unchanged. Variable operating condition calculations using Friugel’s formula are employed.
The efficiency of the stage group under each design condition of the turbine of the unit is fitted by the data method, and the curve model of the fitted stage group efficiency and the stage group flow rate is stored in the database, so that the efficiency of the stage group under different operating conditions can be predicted.
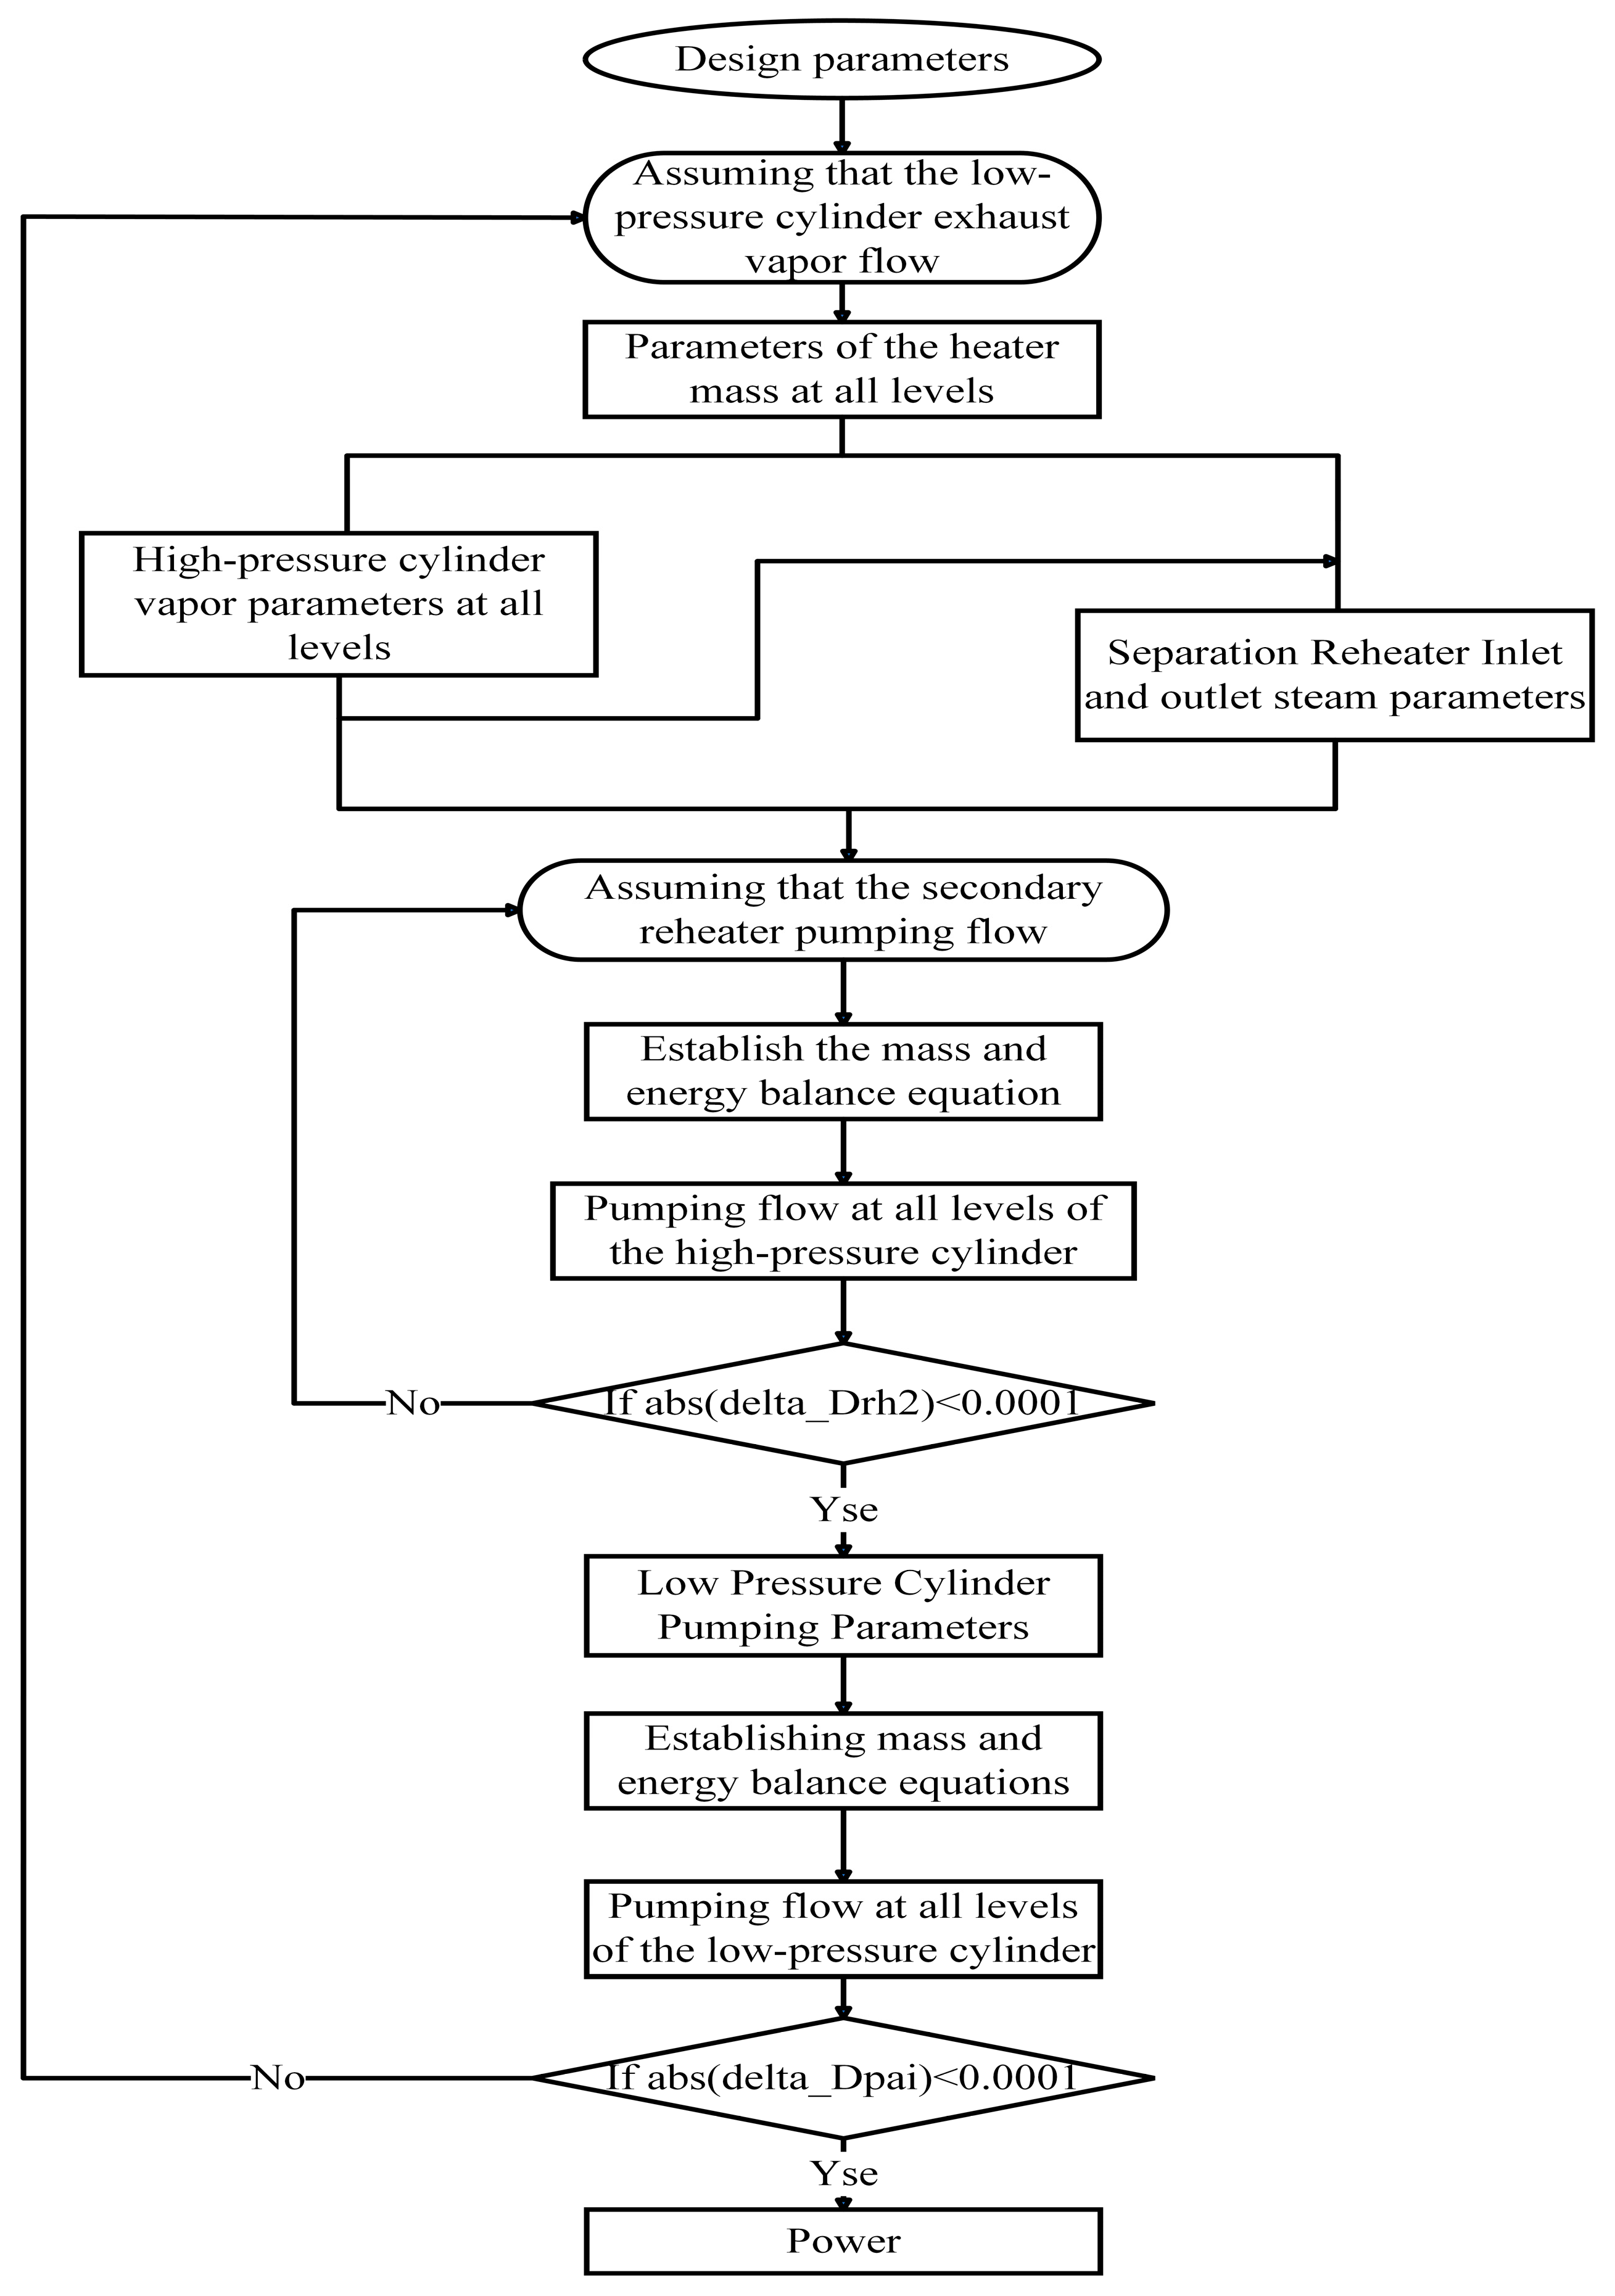
The amount of steam to be pumped under various operating conditions is calculated using the heat balance method based on the given steam parameters at the outlet of the steam generator. The basic equations used during thermal calculations are the mass balance equation, the heat balance equation, and the turbine power equation. The heat balance formula is divided into “constant power calculation” and “constant flow calculation.” This paper adopts the “constant flow calculation” method. The computational model is shown in Figure 6 below.

3.2.2. Three-Loop Model Calculation Logic

At present, the design of condenser mainly includes a three-cylinder, four-row steam unit condenser and a four-cylinder, six-row steam unit condenser. Among them, the three-cylinder, four-row steam unit condenser design scheme includes a double shell, a single process, a single back pressure condenser, a double shell, a single process, and a double back pressure condenser. The four-cylinder, six-row steam unit condenser design scheme includes a three-shell, single process, single back pressure condenser and a three-shell, single process, three back pressure condenser. This paper adopts the three-cylinder, four-row steam (four circulating water pumps) single back pressure program. Because the HEI formula can quantitatively analyze the effect of various factors on the heat transfer coefficient, the HEI formula is used to establish the heat and mass transfer equation for the condenser. The structural parameters, such as the condenser heat transfer area and the cooling tube length, were calculated and collected. The mathematical formulas for K0, FW, and FM were fitted according to HEI’s standard for vapor surface condensers to obtain the values of K0, FW, and FM for each operating condition. After determining the structural parameters, the back pressure was calculated and iterated through the condenser heat balance when the unit changed the circulating cooling water volume, the circulating water temperature, and other parameters under variable operating conditions; the calculation model is shown in Figure 7 below.
This paper describes the methods and principles used in the process of modeling, and it gives an iterative calculation process for the thermal cycle side model and the condenser model, giving a comprehensive overview of the process of building the calculation program.

4. Computational Model Validation

4.1. Verification of Two-Loop Modeling Design Conditions

Detailed thermal calculations were performed for a unit with a steam inlet at the TMCR (turbine maximum continue rate) and a back pressure of 3.7 kPa. The results of the calculations are shown in Table 1 below. The flow calculations for each section of the heater were 0.18% compared to the design specification, with a maximum error of 1.4%. The error value of the pumping flow rate of other sections is less than 1%, which meets the requirement of engineering accuracy. The correctness of the model is verified for the designed operating conditions.

4.2. Verification of Two-Loop Model with Variable Operating Conditions

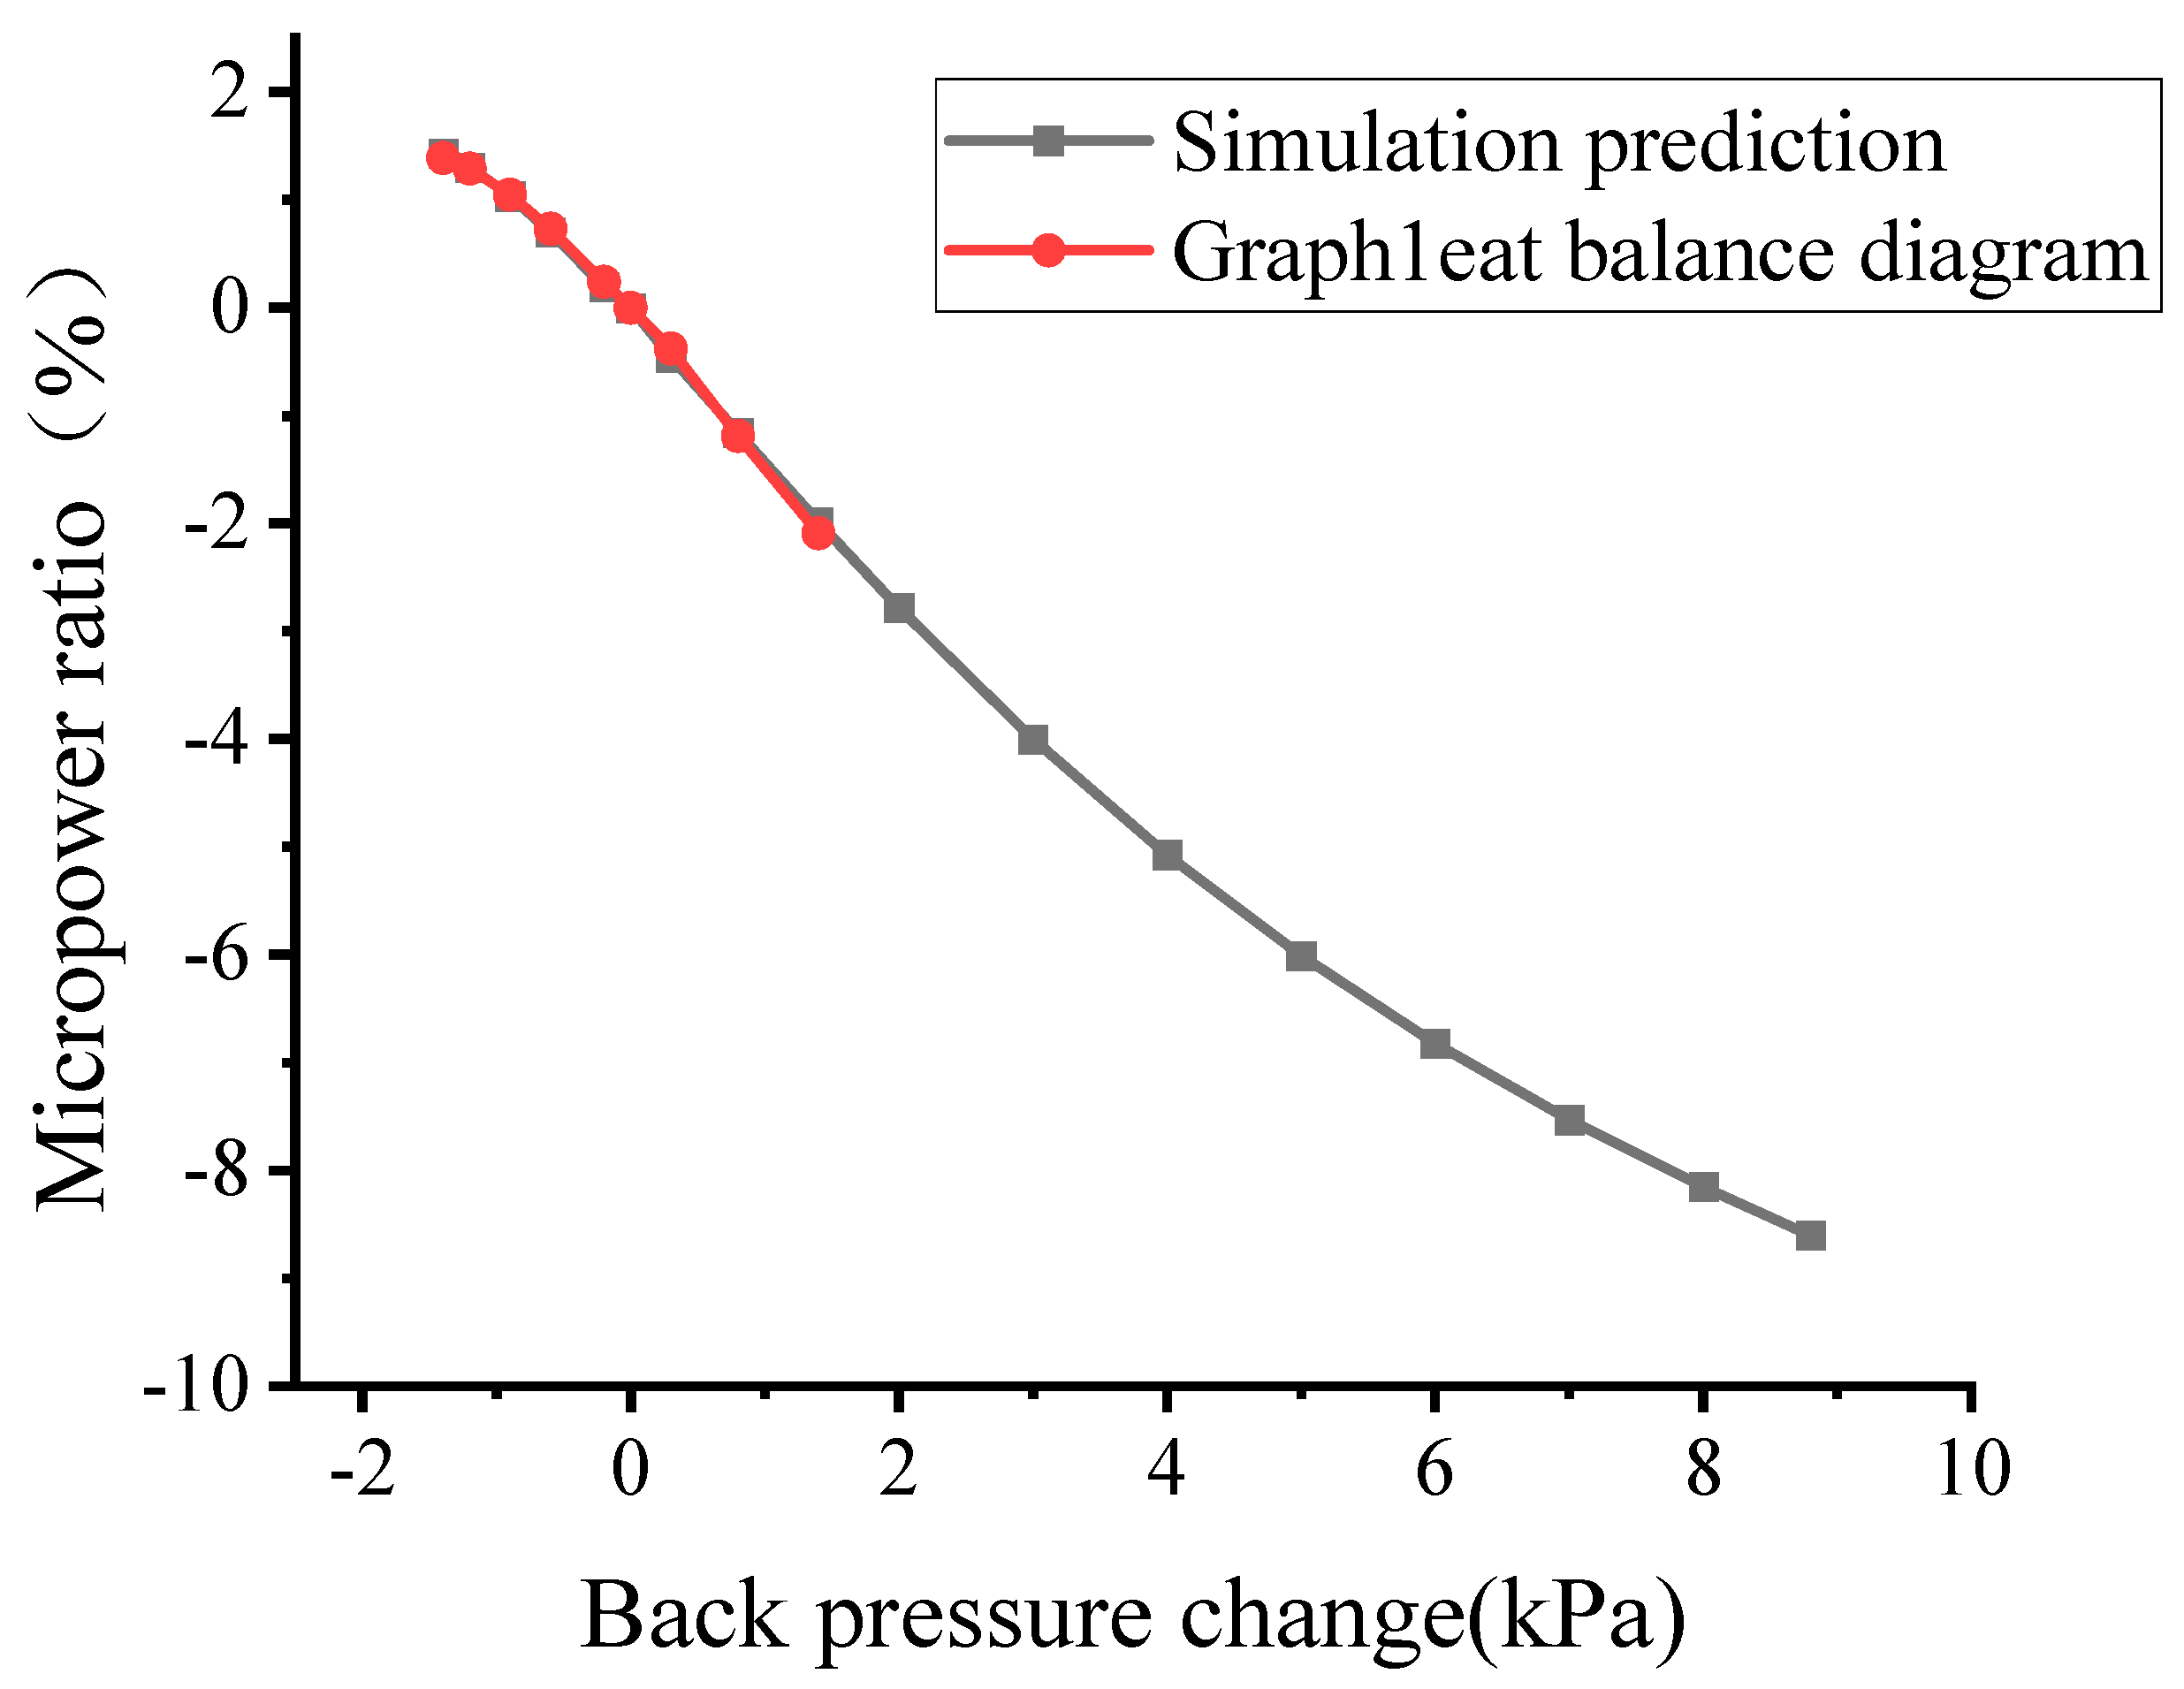
Calculation of the power of a unit at the TMCR operating steam inlet and a back pressure of 2.3, 2.5, 2.8, 3.1, 3.5, 4, 4.5, and 5.1 kPa, respectively, can be calculated to obtain the data in Table 2. At the same time, with 3.7 kPa as a reference, the model calculation of the micropower curve graph with the heat balance diagram provides a comparison of the micropower curve graph; the resulting comparison of the trend is shown in Figure 8.
From the above Table 2, it can be seen that the average error between the predicted calculation results of the variable operating conditions and the load data provided by the heat balance diagram of the coupled unit is in the range of 0.04%. Meanwhile, the predicted curves of micropower obtained from Figure 8 agree with the trend of micropower curves provided by the heat balance diagram. Combining the above two aspects, the correctness of the model under variable operating conditions is verified. Because the variation range provided by the micropower plot is from 2.3 to 5.1 kPa, the portion after 5.1 kPa is predicted based on the model developed.
Section 3.1 and Section 3.2 compare and analyze the data obtained from the thermal cycle model calculations with the design specification, which prove the correctness of the model under design conditions and variable conditions and provide a guarantee for the subsequent comparative analysis of the cold-end model.

4.3. Three-Loop Model Design Parameters

The condenser design parameters for one of the above units are shown in Table 3 below.

5. Cold-End System Micropower Modeling Analysis

The shortcoming of the above condenser calculation model is that the turbine exhaust volume and exhaust dryness are calculated as fixed values, but the turbine exhaust volume and exhaust dryness will change with the changes in the circulating water temperature and flow rate, which makes the model have a certain error when calculating the group power.
In this paper, the calculation of the thermal cycle side is coupled with that of the condenser, and the back pressure calculated on the condenser side is input to the thermal cycle side for calculation to obtain the turbine exhaust volume and exhaust pressure, which are input to the condenser model again for calculation. The calculation is iterated until the error meets the requirements.
The historical trend of seawater temperature at the location of the nuclear power unit is between 2 and 31 °C. The circulating water temperatures are taken to be 4, 10, 14.95, 20, 26, and 30 °C, respectively, in the range of historical temperature variations. The circulating water pump has a flow rate of 9.8 m3/s at low rotational speed and 12.3 m3/s at high rotational speed, so the range of the circulating water flow rate is between 9.8 and 49.2 m3/s. According to the range of variation, the circulating water flow rate is taken to be 12.78, 14.07, 15.36, 16.45, 17.65, 18.86, and 20.00, respectively, and 21.15, 22.46, 23.62, 24.92, 26.16, 27.22, 28.47, 29.61, 30.76, 32.12, 33.23, 34.39, 35.61, 36.79, 38.06, 39.20, 40.78, 42.00, 43.19, 44.41, 45.64, 46.90, 48.00, and 49.20 m3/s, and we calculate the errors of the thermal system parameters of the two methods under the variation of the circulating water temperature and circulating water flow.

5.1. Exhaust Vapor Flow Analysis of Two Models

When the condenser model is used for calculation, the exhaust vapor flow rate is fixed at 895.88 kg/s, while the exhaust vapor flow rate using the model of heat cycle and cold-end coupling calculation is changed with the circulating water flow rate and circulating water temperature, and the change trend is shown in Figure 9 below. The errors of the two models in relation to the exhaust vapor flow rate are shown in Figure 10 below. In the figure, εD denotes the error of the two models with respect to the discharged flow rate of the low-pressure cylinder.
As can be seen from Figure 9, under the rated flow rate, for every 1 °C increase in the circulating water temperature, the steam discharge of the unit increases by 1.59 kg/s. The exhaust vapor flow rate decreases with the increasing circulating water flow rate, and the trend of the decreasing exhaust flow rate gradually slows down. When the circulating water flow rate is more than 50% of the rated flow rate, the steam discharge of the unit decreases by 1.16 kg/s for every 1 m3/s increase in the circulating water flow rate. According to Figure 10, it is found that at the point where the circulating water temperature is 4 °C and the circulating water flow rate is 50% of the rated flow rate, there is no error in the two models. As the temperature of the circulating water increases, the circulating water flow required to reach this point gradually increases. However, when the circulating water temperature is greater than the design temperature, there is no 0 error point in the two models.
According to the analysis in this subsection, it is determined that the cold-end system has an effect on the exhaust steam flow on the thermal cycle side when the circulating water temperature and flow rate are varied. It is proved that the condenser model alone does have limitations, thus leading to the following study on the scope of application of the condenser model alone.

5.2. Unit Back Pressure Analysis for Two Models

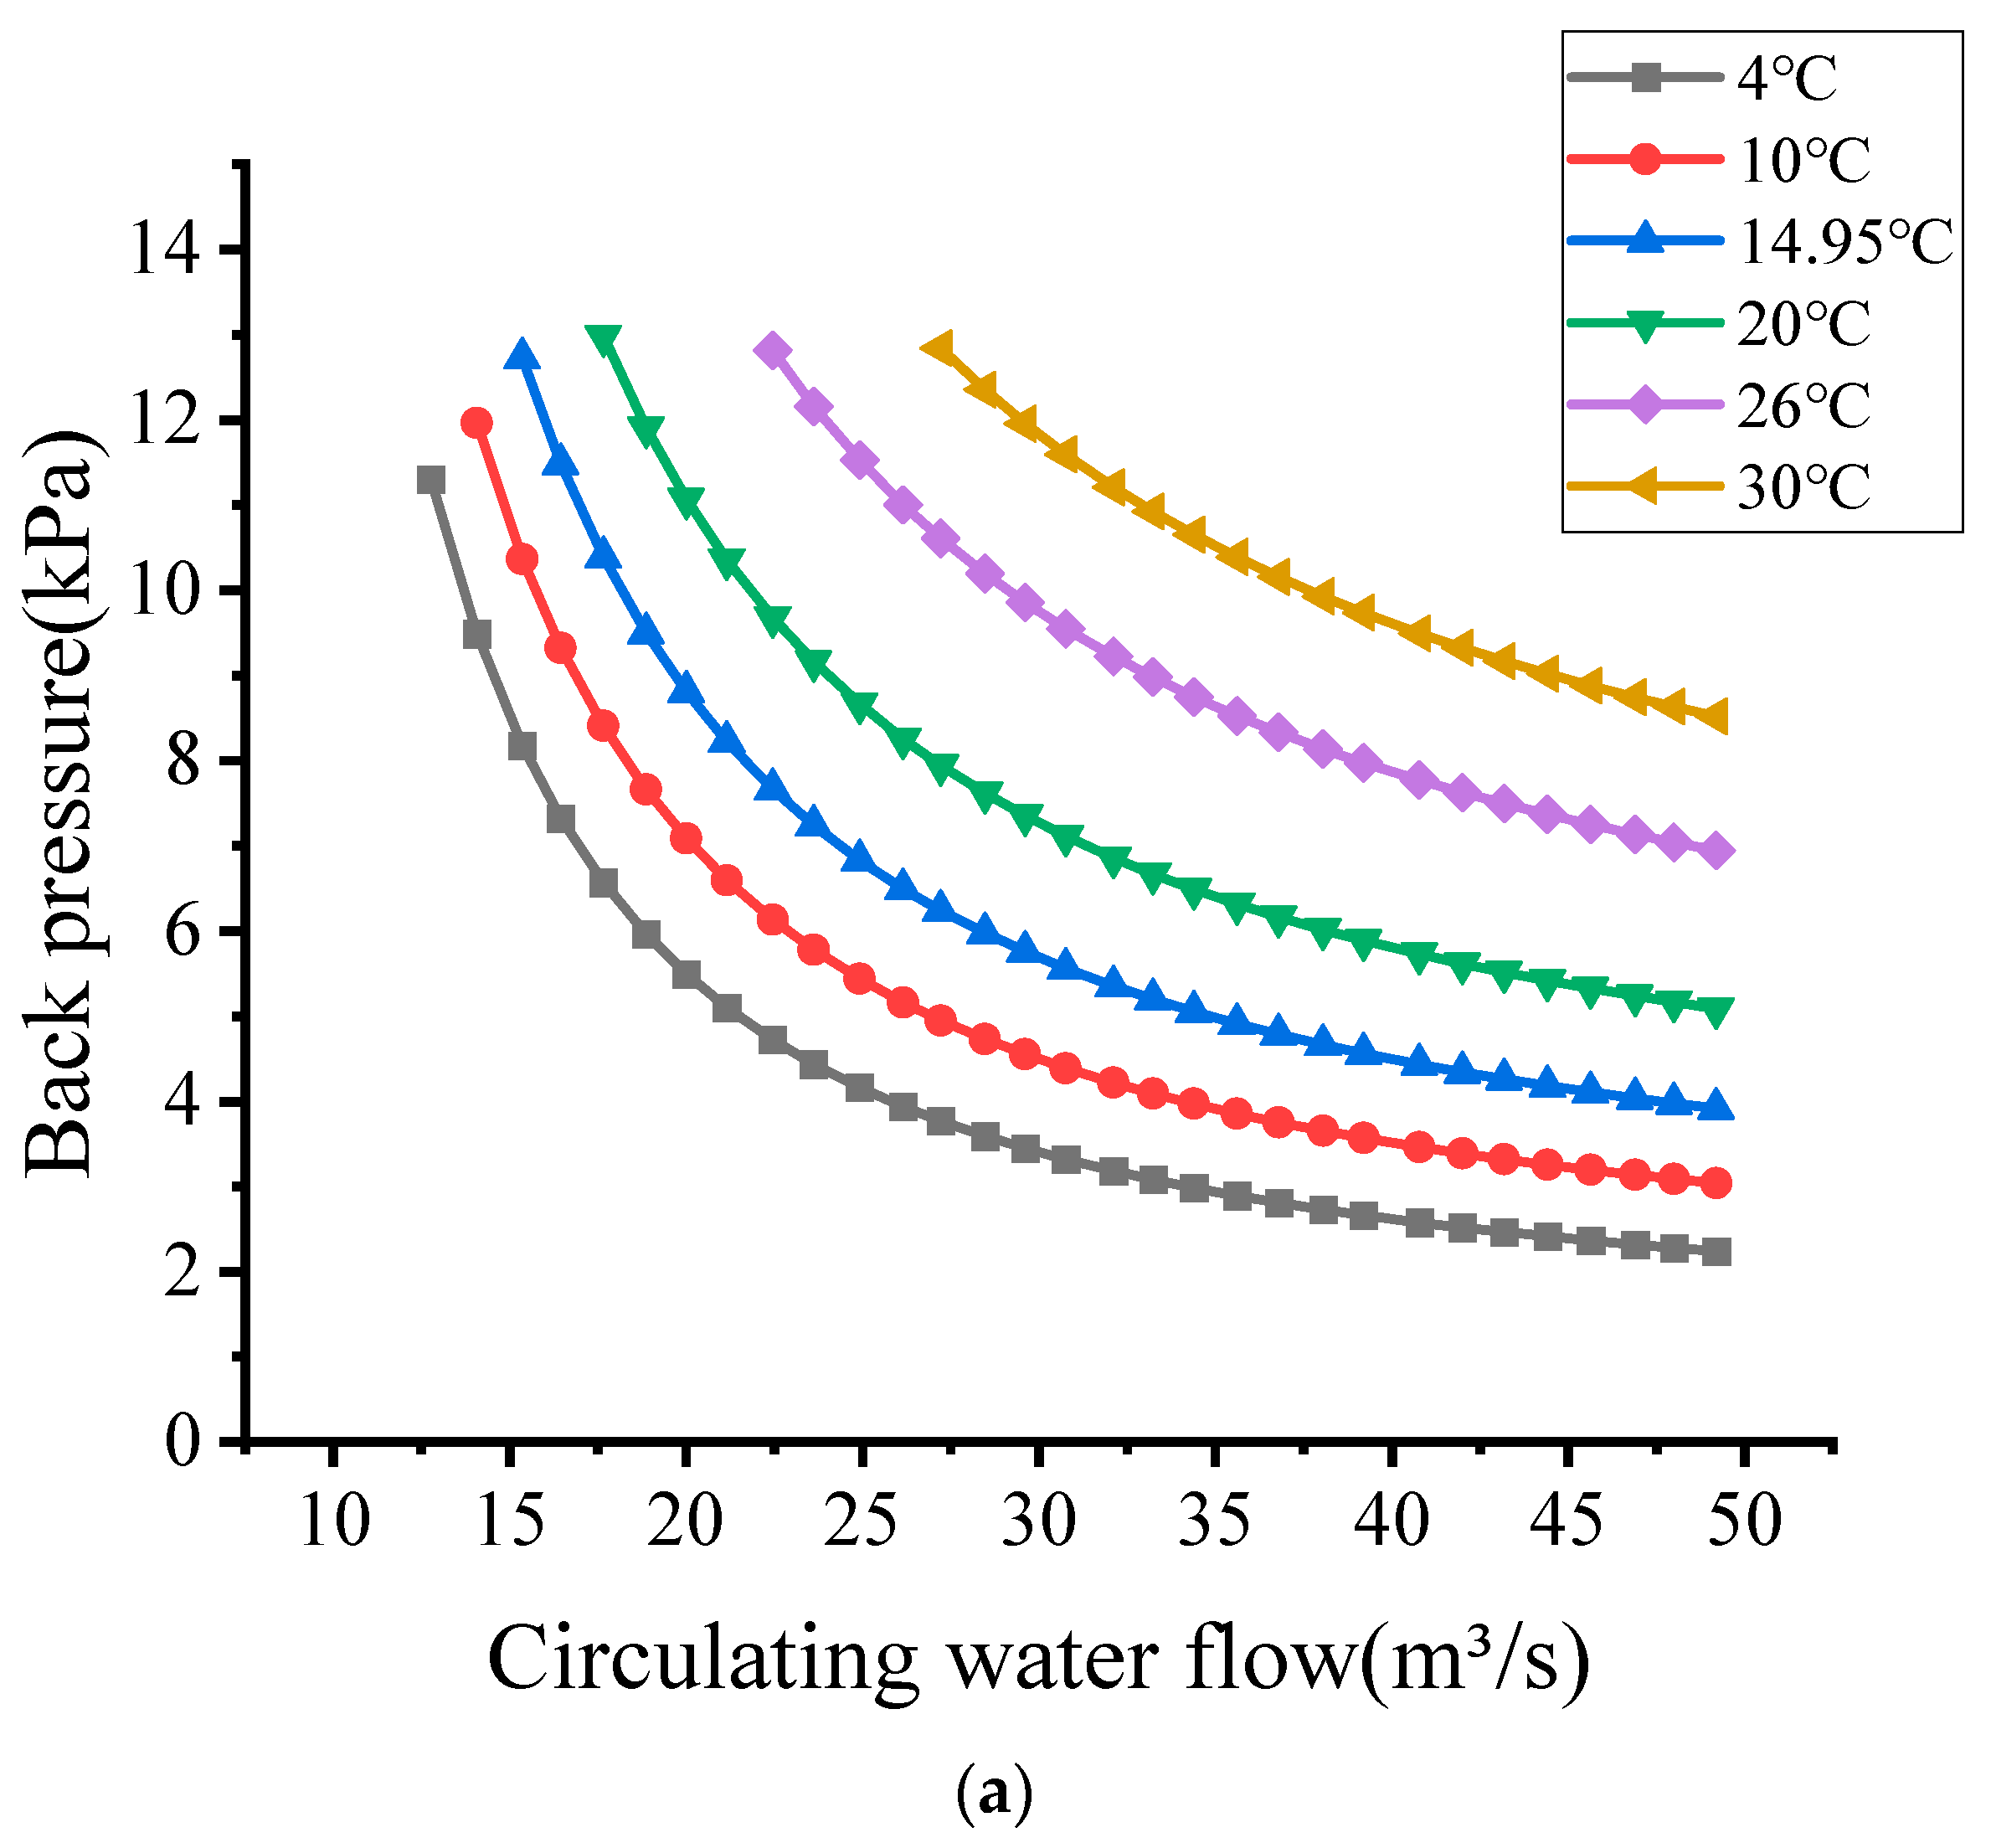
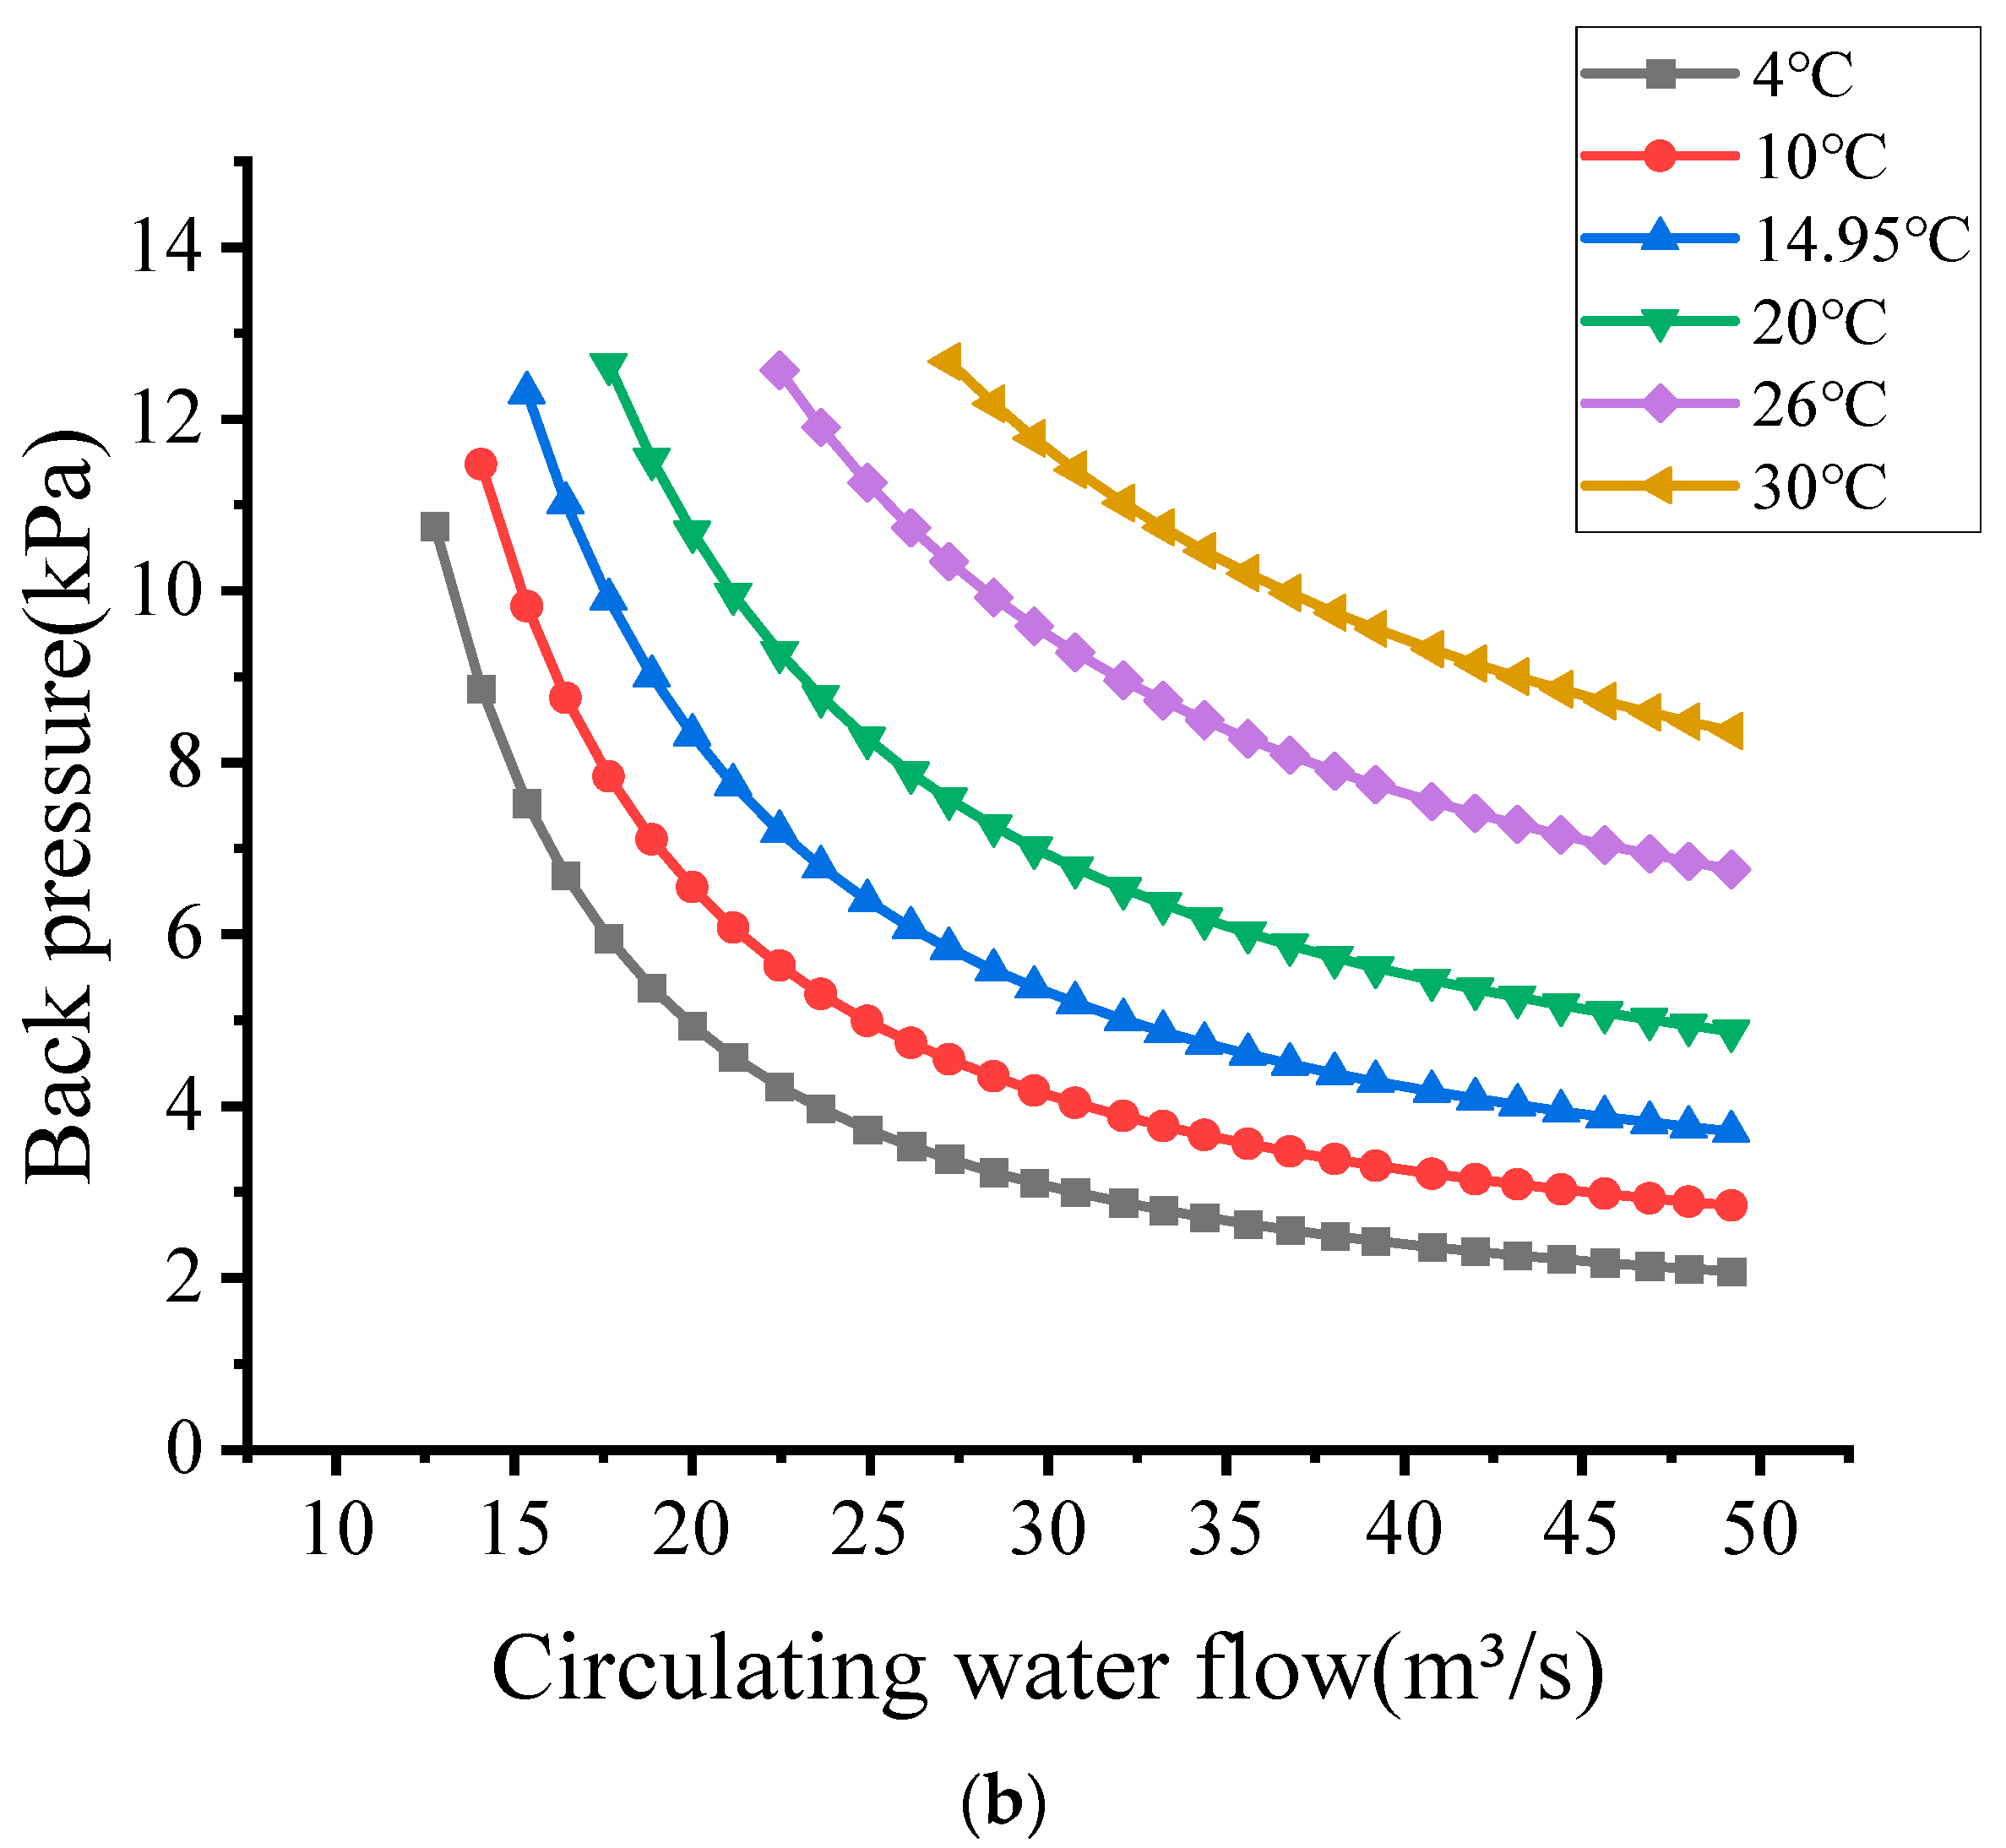
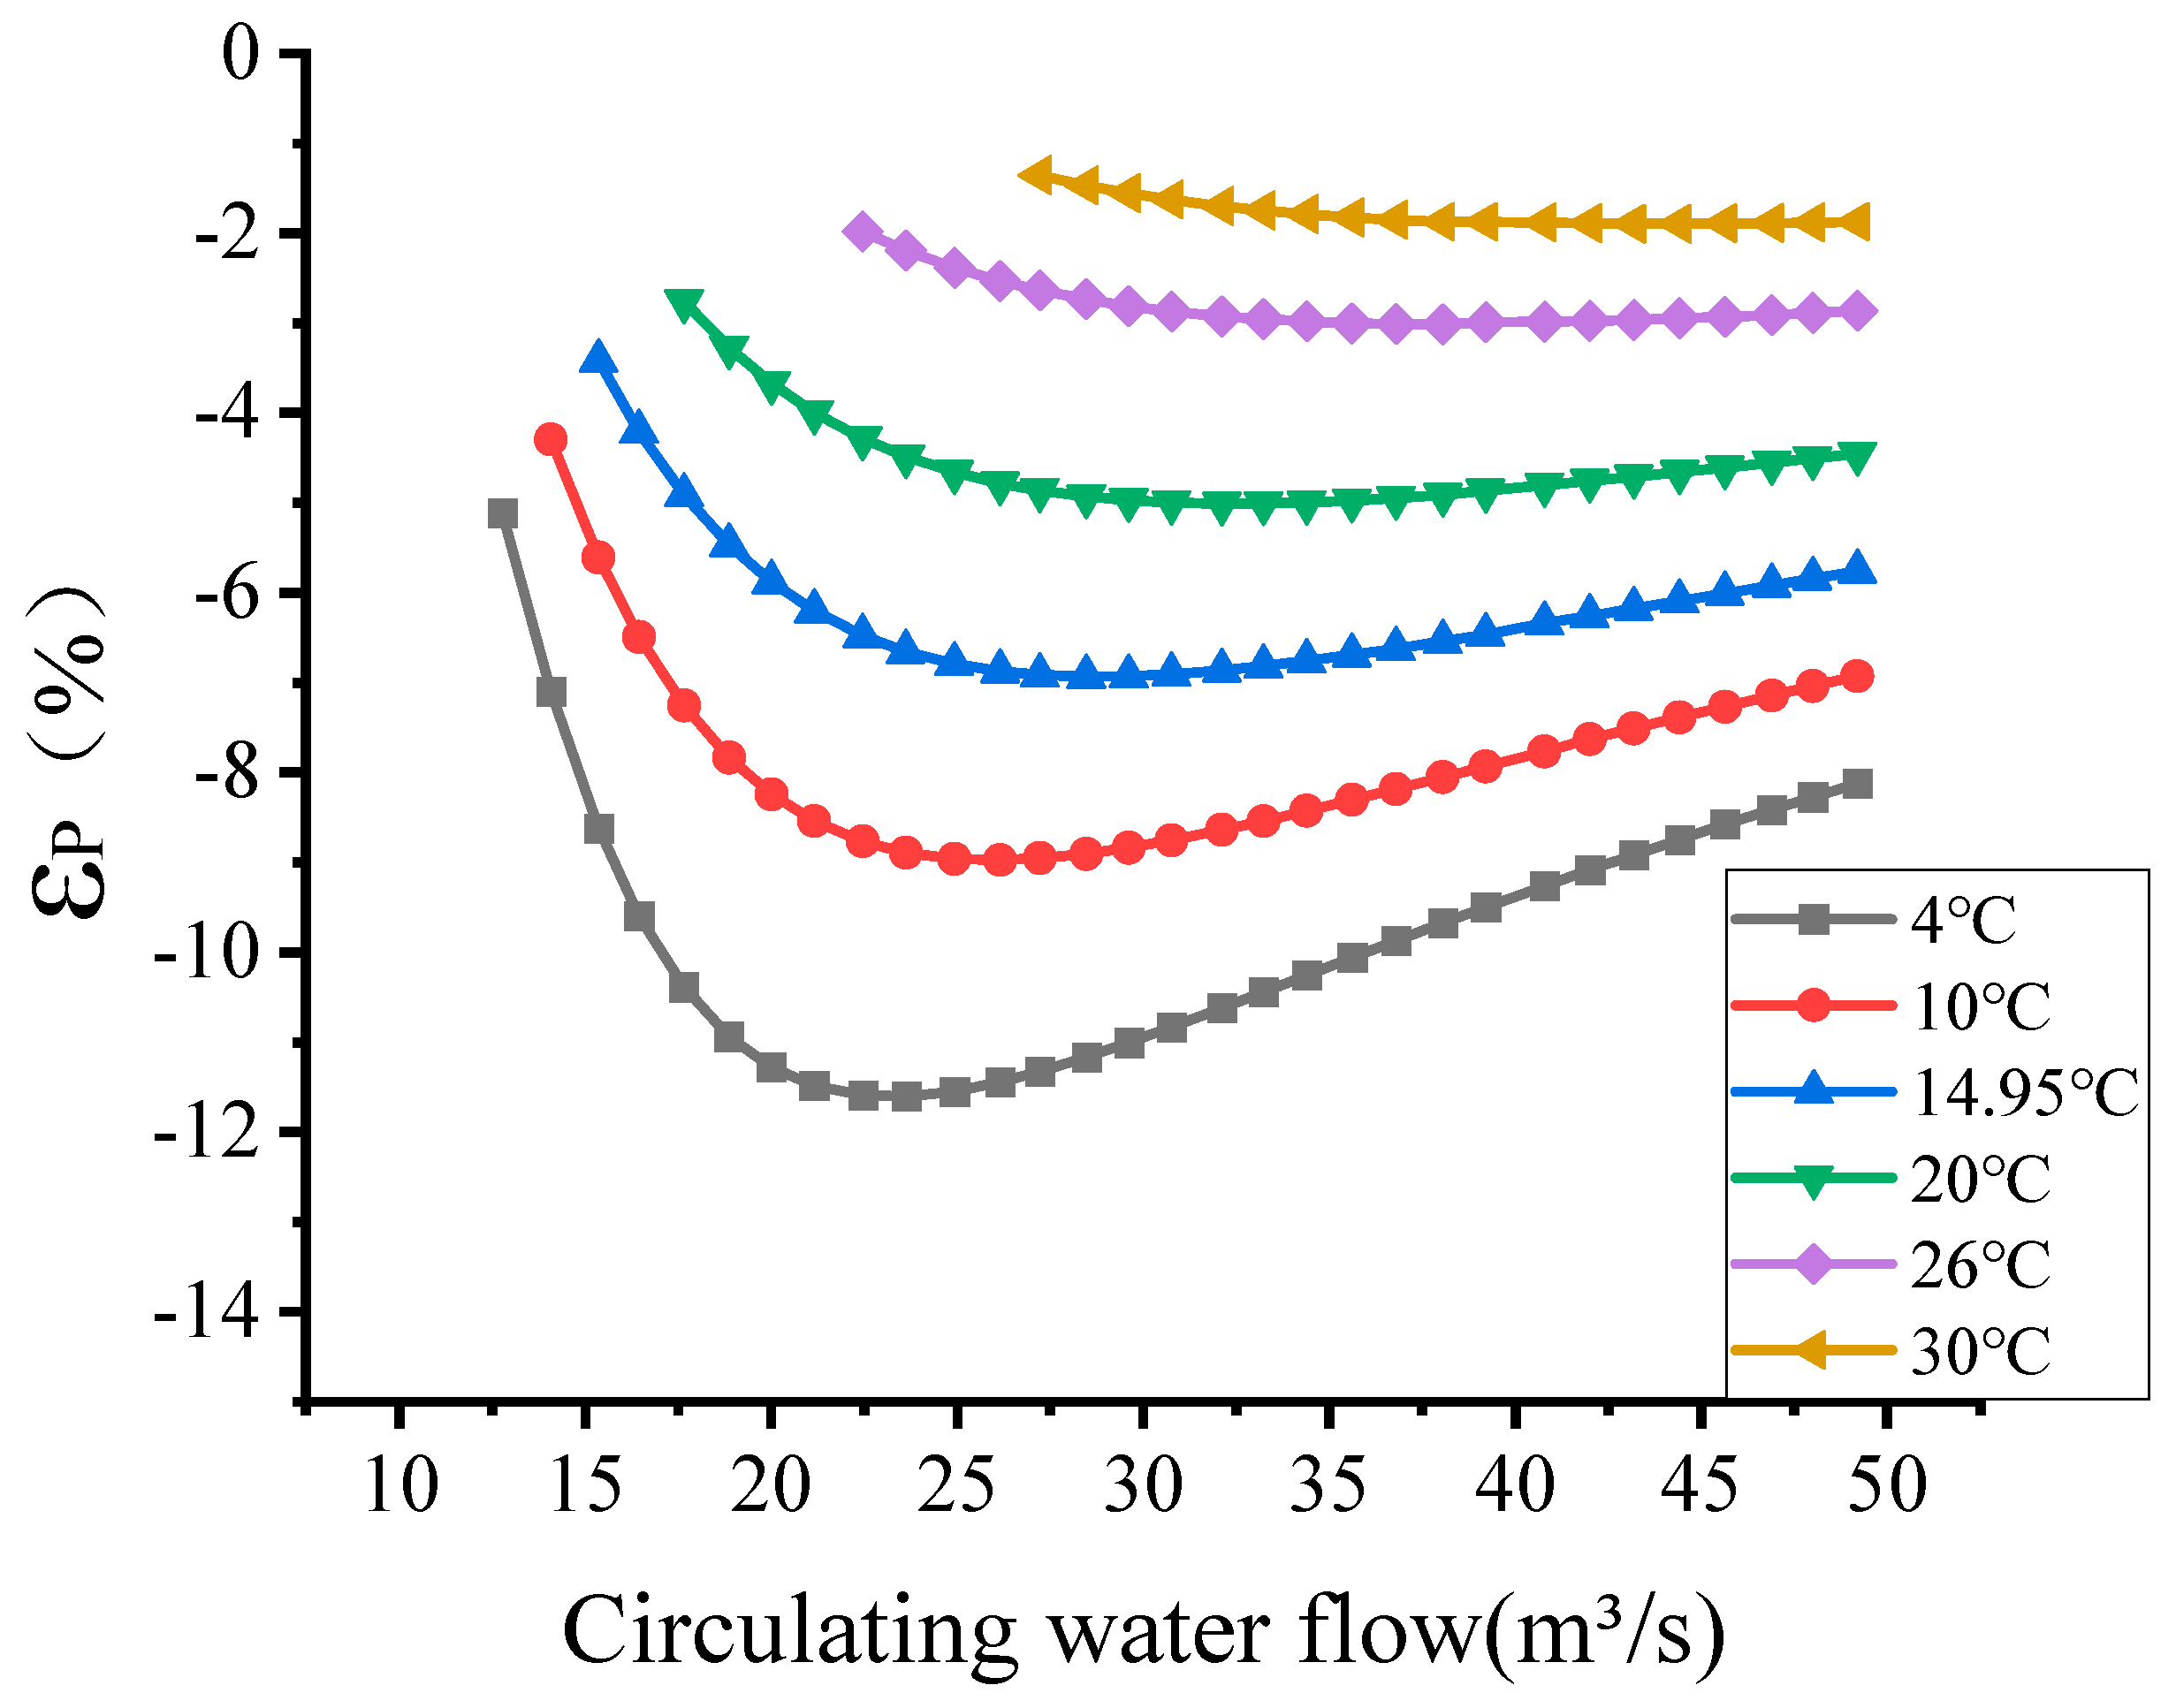
The back pressure of the unit affects the enthalpy of steam discharge from the turbine, thus affecting the efficiency of the unit, and the analysis of the back pressure is also very important. Figure 11a shows the variation in the back pressure with the circulating water parameters calculated by the conventional condenser model, and Figure 11b shows the variation in the back pressure with the circulating water parameters calculated by the coupled model. Figure 12 shows the error of the two models with respect to the back pressure of the unit. In the figure, εP denotes the error in the back pressure of the unit calculated by the two models.
As can be seen from Figure 11, the trend of the unit back pressure change is the same for both models when the circulating water parameter changes. The unit back pressure is more sensitive to changes in the flow rate at lower circulating water volumes. According to Figure 12, it can be seen that when the circulating water flow rate increases, the back pressure errors of the two models first increase and then decrease, and the flow rate at the turning point increases gradually with the increase in the circulating water temperature. When the circulating water temperature is lower, the error of the two models is larger, because the condenser model treats the turbine exhaust steam as dry saturated steam, and when the temperature of the circulating water is lower, the humidity of the turbine exhaust steam is greater, which makes the error of the two models increase.
According to the analysis in this subsection, the change rule and error of the back pressure of the unit calculated by the two models are obtained when the circulating water parameters change. The power back pressure characteristic is an important characteristic of the cold-end system. Changes in back pressure will affect the efficiency of the turbine stage group, thus affecting the power of the unit, so it is necessary to analyze the back pressure calculated by the two models.

5.3. Unit Power Analysis for Both Models

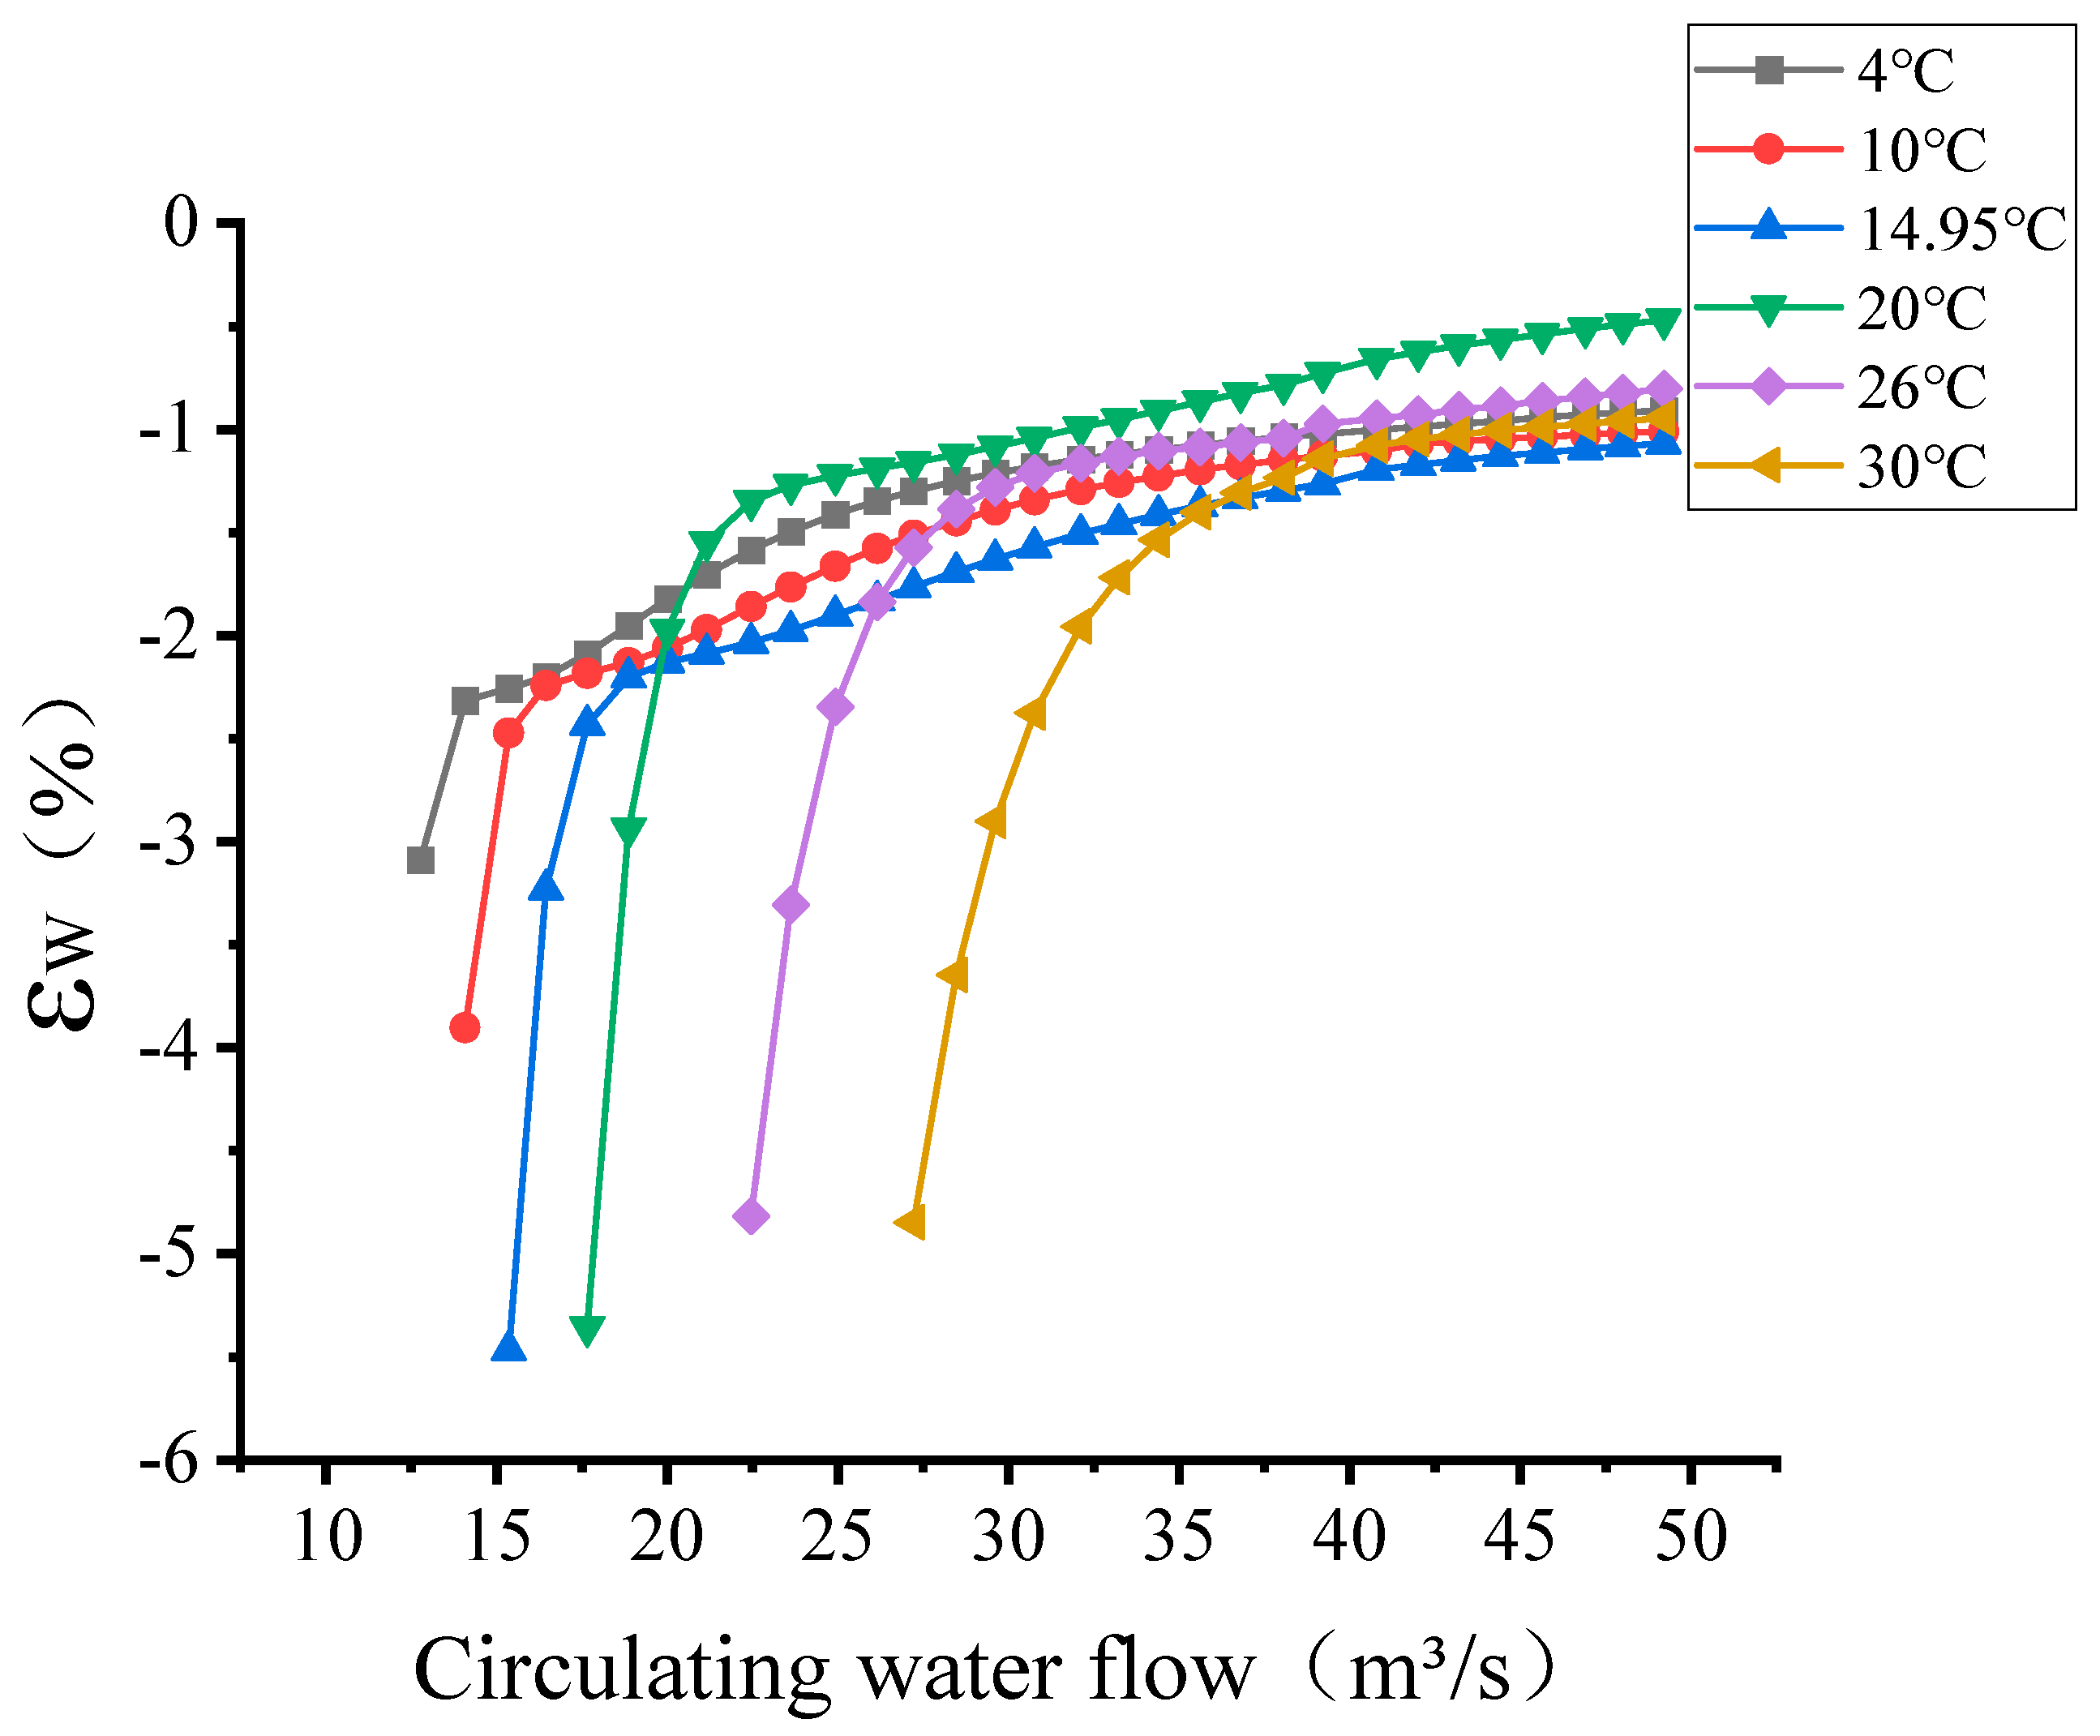
The back pressure obtained from the condenser model is used as the back pressure of the unit to calculate the power of the unit, and the power of the unit varies with the circulating water parameters, as shown in Figure 13a below. The coupled model can directly calculate the unit power, and its unit power varies with the circulating water parameters, as shown in Figure 13b. The variation of error with the circulating water parameters for both models is shown in Figure 14, In the figure, εW denotes the error in the calculated micropower from the two models.
As can be seen from Figure 13, the trends of the two models are the same when the circulating water parameters are changed, but the magnitude of the changes is not the same. The power of the unit is more sensitive to changes in the flow rate at lower circulating water volumes. The higher the circulating water temperature, the more sensitive the unit power is to changes in the circulating water flow rate.
From Figure 14, it can be found that the error of the unit power at different circulating water temperatures follows the same trend with the circulating water flow rate. However, at each circulating water temperature where the circulating water flow rate is between 40 m3/s and the rated flow rate, the error in the power of the unit basically remains unchanged with the change in the circulating water flow rate. As the circulating water temperature decreases, the flow area that keeps the power error of the unit basically unchanged will gradually increase.
At the same time, because of the large amount of calculation of the coupled model, the circulating water flow rate and circulating water temperature range applicable to the condenser model are selected according to Figure 14 within the range of error so that the condenser model can be used to reduce the amount of calculation. If the error requirement is 1%, the research results show that, in the circulating water temperature of 4 °C, the circulating water flow rate’s applicable range is 42 m3/s to the rated flow; in the circulating water temperature of 20 °C, the circulating water flow rate’s applicable range is 32.12 m3/s to the rated flow; in the circulating water temperature of 26 °C, the circulating water flow rate’s applicable range is 38.63 m3/s to the rated flow; and in the circulating water temperature of 30 °C, the circulating water flow rate’s applicable range is 45.64 m3/s to the rated flow. When the circulating water temperature is 30 °C, the applicable range of the circulating water flow rate is between 45.64 m3/s and the rated flow rate.
According to the analysis in this subsection, the variation rule of the unit power and the error of the slight increase in power calculated by the two models when the circulating water parameter changes are obtained, and the range used by the separate condenser model is given. In this accuracy range, in order to obtain the results quickly, the separate condenser model can be chosen for calculation. Outside this accuracy range, it is necessary to use the coupled model to meet the requirements of engineering accuracy.

6. Conclusions

Taking a nuclear power unit as the research object, a calculation model coupling the thermal cycle and condenser is established to consider the influence of the condenser on the size of the turbine exhaust flow when the circulating water temperature and flow rate change, and a separate condenser model is also established to analyze the influence of the two models on the nuclear power micropower increase. The interactions between the cold-end and the thermal cycle are analyzed more accurately, and theoretical support is provided for the scope of application of the condenser model. The main conclusions are as follows:
(1)
For the two-loop thermal system given in this paper, the turbine exhaust flow rate of the coupled model of the two-loop and cold-end system increases gradually with the increase in the circulating water temperature and the decrease in the flow rate.
(2)
The error between the back pressure calculated by the separate condenser model and the coupled model gradually increases with the decrease in the circulating water temperature. Especially when the circulating water flow rate and temperature are small, the error is more obvious.
(3)
Because the condenser model uses the exhaust steam flow rate and the exhaust steam dryness as fixed values in the calculation, but these two parameters change when the circulating water parameters change, there is an error in the cold-end system micropower model composed of a separate condenser calculation model. The coupled model provided in this paper can solve the errors generated by the condenser model and more accurately reflect the relationship between the cold-end and the system micropower. The range of applicability of the condenser model is analyzed based on the error between the coupled model and the condenser model at a unit micropower increase error of 1%.
(4)
According to the analysis of the results, it is found that when the error of incremental power of the two models tends to flatten out with the change in the circulating water flow rate, the size of the error increases with the increase in the circulating water temperature, but the error suddenly decreases when the circulating water temperature is 20 °C, and then it gradually increases with the increase in the circulating water temperature again. This shows that the accuracy of the condenser model is the highest when the circulating water temperature is 20 °C, which is close to the designed circulating water flow rate.

Author Contributions

Conceptualization, H.S.; Methodology, H.W.; Formal analysis, H.W.; Investigation, X.X.; Resources, L.X.; Writing—original draft, S.A.; Writing—review & editing, H.W.; Project administration, X.D.; Funding acquisition, X.D. All authors have read and agreed to the published version of the manuscript.

Funding

This research was funded by China National Natural Science Foundation grant number 52006066, National Key Research and Development Program of China grant number 2020YFB0606202.

Data Availability Statement

Not applicable.

Acknowledgments

The financial support for this research project from China National Natural Science Foundation (No. 52006066) and the National Key Research and Development Program of China (Grant No. 2020YFB0606202) are gratefully acknowledged.

Conflicts of Interest

The authors declare no conflict of interest.

Nomenclature

asteam heat transfer fraction coefficient (kW/(m2·°C))
Aarea (m3)
Bcoefficients related to the average temperature of the condensate film
cpspecific heat (kJ/(kg·°C))
ddiameter (m)
Dflow rate (kg/s)
FMcorrection factor for the material of condenser
FCcomprehensive cleaning factor
FWinlet temperature correction factor for circulating water
henthalpy (kJ/kg)
ktube heat transfer coefficient (kW/(m2·°C))
Kheat transfer coefficient (kW/(m2·°C))
K0uncorrected heat transfer coefficient (kW/(m2·°C))
mcooling magnification
Nnumber of tubes per stroke
PrPrantl number
Qheat load (kW)
rlatent heat of vaporization (kJ/kg)
ReReynolds number
ttemperature (°C)
vspecific volume (m3/kg)
wvelocity magnitude (m/s)
Wunit power (kW)
xvapor dryness
Greek symbols
ηefficiency
λheat conductivity (W/(m2·°C))
υkinematic viscosity (m2/s)
Δdifference

References

  1. Wang, C.; Liu, M.; Zhao, Y.; Qiao, Y.; Chong, D.; Yan, J. Dynamic modeling and operation optimization for the cold end system of thermal power plants during transient processes. Energy 2018, 145, 734–746. [Google Scholar] [CrossRef]
  2. Chen, J.; Xu, D.M. Characteristics and selection of nuclear power steam turbine. J. Eng. Therm. Energy Power 2010, 25, 459–462+472. (In Chinese) [Google Scholar]
  3. Xu, D.M.; Ke, Y.; Wang, S.Y. General calculation method and application of turbine power back pressure characteristics. J. Eng. Therm. Energy Power 2010, 25, 605–608+684. (In Chinese) [Google Scholar]
  4. Colonna, P.; Van Putten, H. Dynamic modeling of steam power cycles. Appl. Therm. Eng. 2007, 27, 467–480. [Google Scholar] [CrossRef]
  5. Van Putten, H.; Colonna, P. Dynamic modeling of steam power cycles: Part II—Simulation of a small simple Rankine cycle system. Appl. Therm. Eng. 2007, 27, 2566–2582. [Google Scholar] [CrossRef]
  6. Zhang, J.; Yin, S.S.; Chen, L.; Ma, Y.C.; Wang, M.J.; Fu, H.; Wu, Y.; Tian, W.; Qiu, S.; Su, G. A study on the dynamic characteristics of the secondary loop in nuclear power plant. Nucl. Eng. Technol. 2021, 53, 1436–1445. [Google Scholar] [CrossRef]
  7. Teyssedou, A.; Dipama, J.; Hounkonnou, W.; Aubé, F. Modeling and optimization of a nuclear power plant secondary loop. Nucl. Eng. Des. 2010, 240, 1403–1416. [Google Scholar] [CrossRef]
  8. Yu, J.; Petersen, N.; Liu, P.; Li, Z.; Wirsum, M. Hybrid modelling and simulation of thermal systems of in-service power plants for digital twin development. Energy 2022, 260, 125088. [Google Scholar] [CrossRef]
  9. Sun, X.; Song, F.; Yuan, J. Online estimation approach of the steam specific enthalpy for wet steam turbines in nuclear power plants. Appl. Therm. Eng. 2023, 229, 120531. [Google Scholar] [CrossRef]
  10. Vajpayee, V.; Becerra, V.; Bausch, N.; Deng, J.; Shimjith, S.R.; Arul, A.J. Dynamic modelling, simulation, and control design of a pressurized water-type nuclear power plant. Nucl. Eng. Des. 2020, 370, 110901. [Google Scholar] [CrossRef]
  11. Chaibakhsh, A.; Ghaffari, A. Steam turbine model. Simul. Model. Pract. Theory 2008, 16, 1145–1162. [Google Scholar] [CrossRef]
  12. Li, C.; Zhai, R.; Yang, Y.; Patchigolla, K.; Oakey, J.E. Thermal performance of different integration schemes for a solar tower aided coal-fired power system. Energy Convers. Manag. 2018, 171, 1237–1245. [Google Scholar] [CrossRef]
  13. Laskowski, R. Relations for steam power plant condenser performance in off-design conditions in the function of inlet parameters and those relevant in reference conditions. Appl. Therm. Eng. 2016, 103, 528–536. [Google Scholar] [CrossRef]
  14. Attia, S.I. The influence of condenser cooling water temperature on the thermal efficiency of a nuclear power plant. Ann. Nucl. Energy 2015, 80, 371–378. [Google Scholar] [CrossRef]
  15. Anozie, A.N.; Odejobi, O.J. The search for optimum condenser cooling water flow rate in a thermal power plant. Appl. Therm. Eng. 2011, 31, 4083–4090. [Google Scholar] [CrossRef]
  16. Harish, R.; Subhramanyan, E.E.; Madhavan, R.; Vidyanand, S. Theoretical model for evaluation of variable frequency drive for cooling water pumps in sea water based once through condenser cooling water systems. Appl. Therm. Eng. 2010, 30, 2051–2057. [Google Scholar] [CrossRef]
  17. Rubio, D.; Casanueva, J.F.; Nebot, E. Assessment of the antifouling effect of five different treatment strategies on a seawater cooling system. Appl. Therm. Eng. 2015, 85, 124–134. [Google Scholar] [CrossRef]
  18. Medica-Viola, V.; Pavković, B.; Mrzljak, V. Numerical model for on-condition monitoring of condenser in coal-fired power plants. Int. J. Heat Mass Transf. 2018, 117, 912–923. [Google Scholar] [CrossRef]
  19. Zhang, C.; Sousa, A.C.M.; Venart, J.E.S. The Numerical and Experimental Study of a Power Plant Condenser. J. Heat Transf. 1993, 115, 435–445. [Google Scholar] [CrossRef]
  20. Zeng, H.; Meng, J.; Li, Z. Numerical study of a power plant condenser tube arrangement. Appl. Therm. Eng. 2012, 40, 294–303. [Google Scholar] [CrossRef]
  21. Zhang, C. Numerical Modeling Using a Quasi-Three-Dimensional Procedure for Large Power Plant Condensers. J. Heat Transf. 1994, 116, 180–188. [Google Scholar] [CrossRef]
  22. Saari, J.; Kaikko, J.; Vakkilainen, E.; Savolainen, S. Comparison of power plant steam condenser heat transfer models for on-line condition monitoring. Appl. Therm. Eng. 2014, 62, 37–47. [Google Scholar] [CrossRef]
  23. Roy, R.P.; Ratisher, M.; Gokhale, V.K. A computational model of a power plant steam condenser. J. Energy Resour. Technol. Trans. ASME 2001, 123, 81–91. [Google Scholar] [CrossRef]
  24. Wang, X.; Zhou, Z.; Song, Z.; Lu, Q.; Li, J. Numerical analysis of transient pressure variation in the condenser of a nuclear power station. J. Mech. Sci. Technol. 2016, 30, 953–962. [Google Scholar] [CrossRef]
  25. Chuang, C.-C.; Sue, D.-C. Performance effects of combined cycle power plant with variable condenser pressure and loading. Energy 2005, 30, 1793–1801. [Google Scholar] [CrossRef]
Figure 1. Nuclear power principle thermal system.
Energies 16 07188 g001
Figure 2. Vapor separation reheater calculation model.
Energies 16 07188 g002
Figure 3. Heater with hydrophobic cooling section.
Energies 16 07188 g003
Figure 4. With evacuation pump type heater.
Energies 16 07188 g004
Figure 5. Deaerator.
Energies 16 07188 g005
Figure 6. Flow chart of constant flow calculation.
Energies 16 07188 g006
Figure 7. Condenser calculation model.
Energies 16 07188 g007
Figure 8. Comparison of micro-increase power curves.
Energies 16 07188 g008
Figure 9. Coupling model exhaust flow variation.
Energies 16 07188 g009
Figure 10. Exhaust flow error for both models εD.
Energies 16 07188 g010
Figure 11. The two models calculate the effect of circulating water on the back pressure of the unit. (a) Condenser model calculations to obtain the effect of circulating water on unit back pressure. (b) Coupled modeling calculations to obtain the effect of circulating water on unit back pressure.
Energies 16 07188 g011aEnergies 16 07188 g011b
Figure 12. The unit back pressure error for both models εp.
Energies 16 07188 g012
Figure 13. The two models calculate the effect of circulating water on the power of the unit. (a) Condenser model calculations to obtain the effect of circulating water on unit power. (b) Coupled model calculations to obtain the effect of circulating water on the power of the unit.
Energies 16 07188 g013aEnergies 16 07188 g013b
Figure 14. The unit micropower error for both models εP.
Energies 16 07188 g014
Table 1. Calculated parameters for pumping flow rate at all levels of nuclear power second circuit.
ParameterResult (kg/s)Design (kg/s)Errors
H152.1852.19−0.02%
H2114.84114.91−0.06%
H3115.44116.55−0.96%
H465.3064.700.92%
H558.2458.210.05%
H665.5965.62−0.05%
H741.9542.56−1.42%
RH174.4374.44−0.02%
RH290.7690.690.08%
Table 2. Power calculation results when the back pressure varies.
Back Pressure (kPa)Result (kW)Design (kW)Errors
2.31,283,587.411,283,009.380.05%
2.51,281,934.381,281,743.940.01%
2.81,278,526.951,278,706.950.01%
3.11,274,322.941,274,657.610.03%
3.51,267,923.221,268,457.350.04%
3.71,265,4201,265,4200.00%
41,259,638.831,260,611.420.08%
4.51,250,777.351,250,361.530.03%
5.11,240,276.571,238,972.740.11%
Table 3. Condenser design parameters.
ParametersValueParametersValue
Condenser area95,240 m2Tube number45,400
MaterialTP316LTube length13.36 m
Tube sizeΦ 25 × 0.50 mmCirculating water design temperature14.95 °C
Tube flow rate2.39 m/sCirculating water design flow49.20 m3/s
Condenser design crosstalk3.20 °CHeat transfer coefficient2.95 KW/m2·°C
Cleaning factor0.85TMCR Operating Temperature Rise9.43 °C
Disclaimer/Publisher’s Note: The statements, opinions and data contained in all publications are solely those of the individual author(s) and contributor(s) and not of MDPI and/or the editor(s). MDPI and/or the editor(s) disclaim responsibility for any injury to people or property resulting from any ideas, methods, instructions or products referred to in the content.