


Energy Security in Ecuador: An Analysis Considering the Interrelationships of the WEF Nexus


Abstract
:1. Introduction
2. Ecuadorian Energy System
2.1. Evolution of the Energy Sector
2.2. Primary Energy
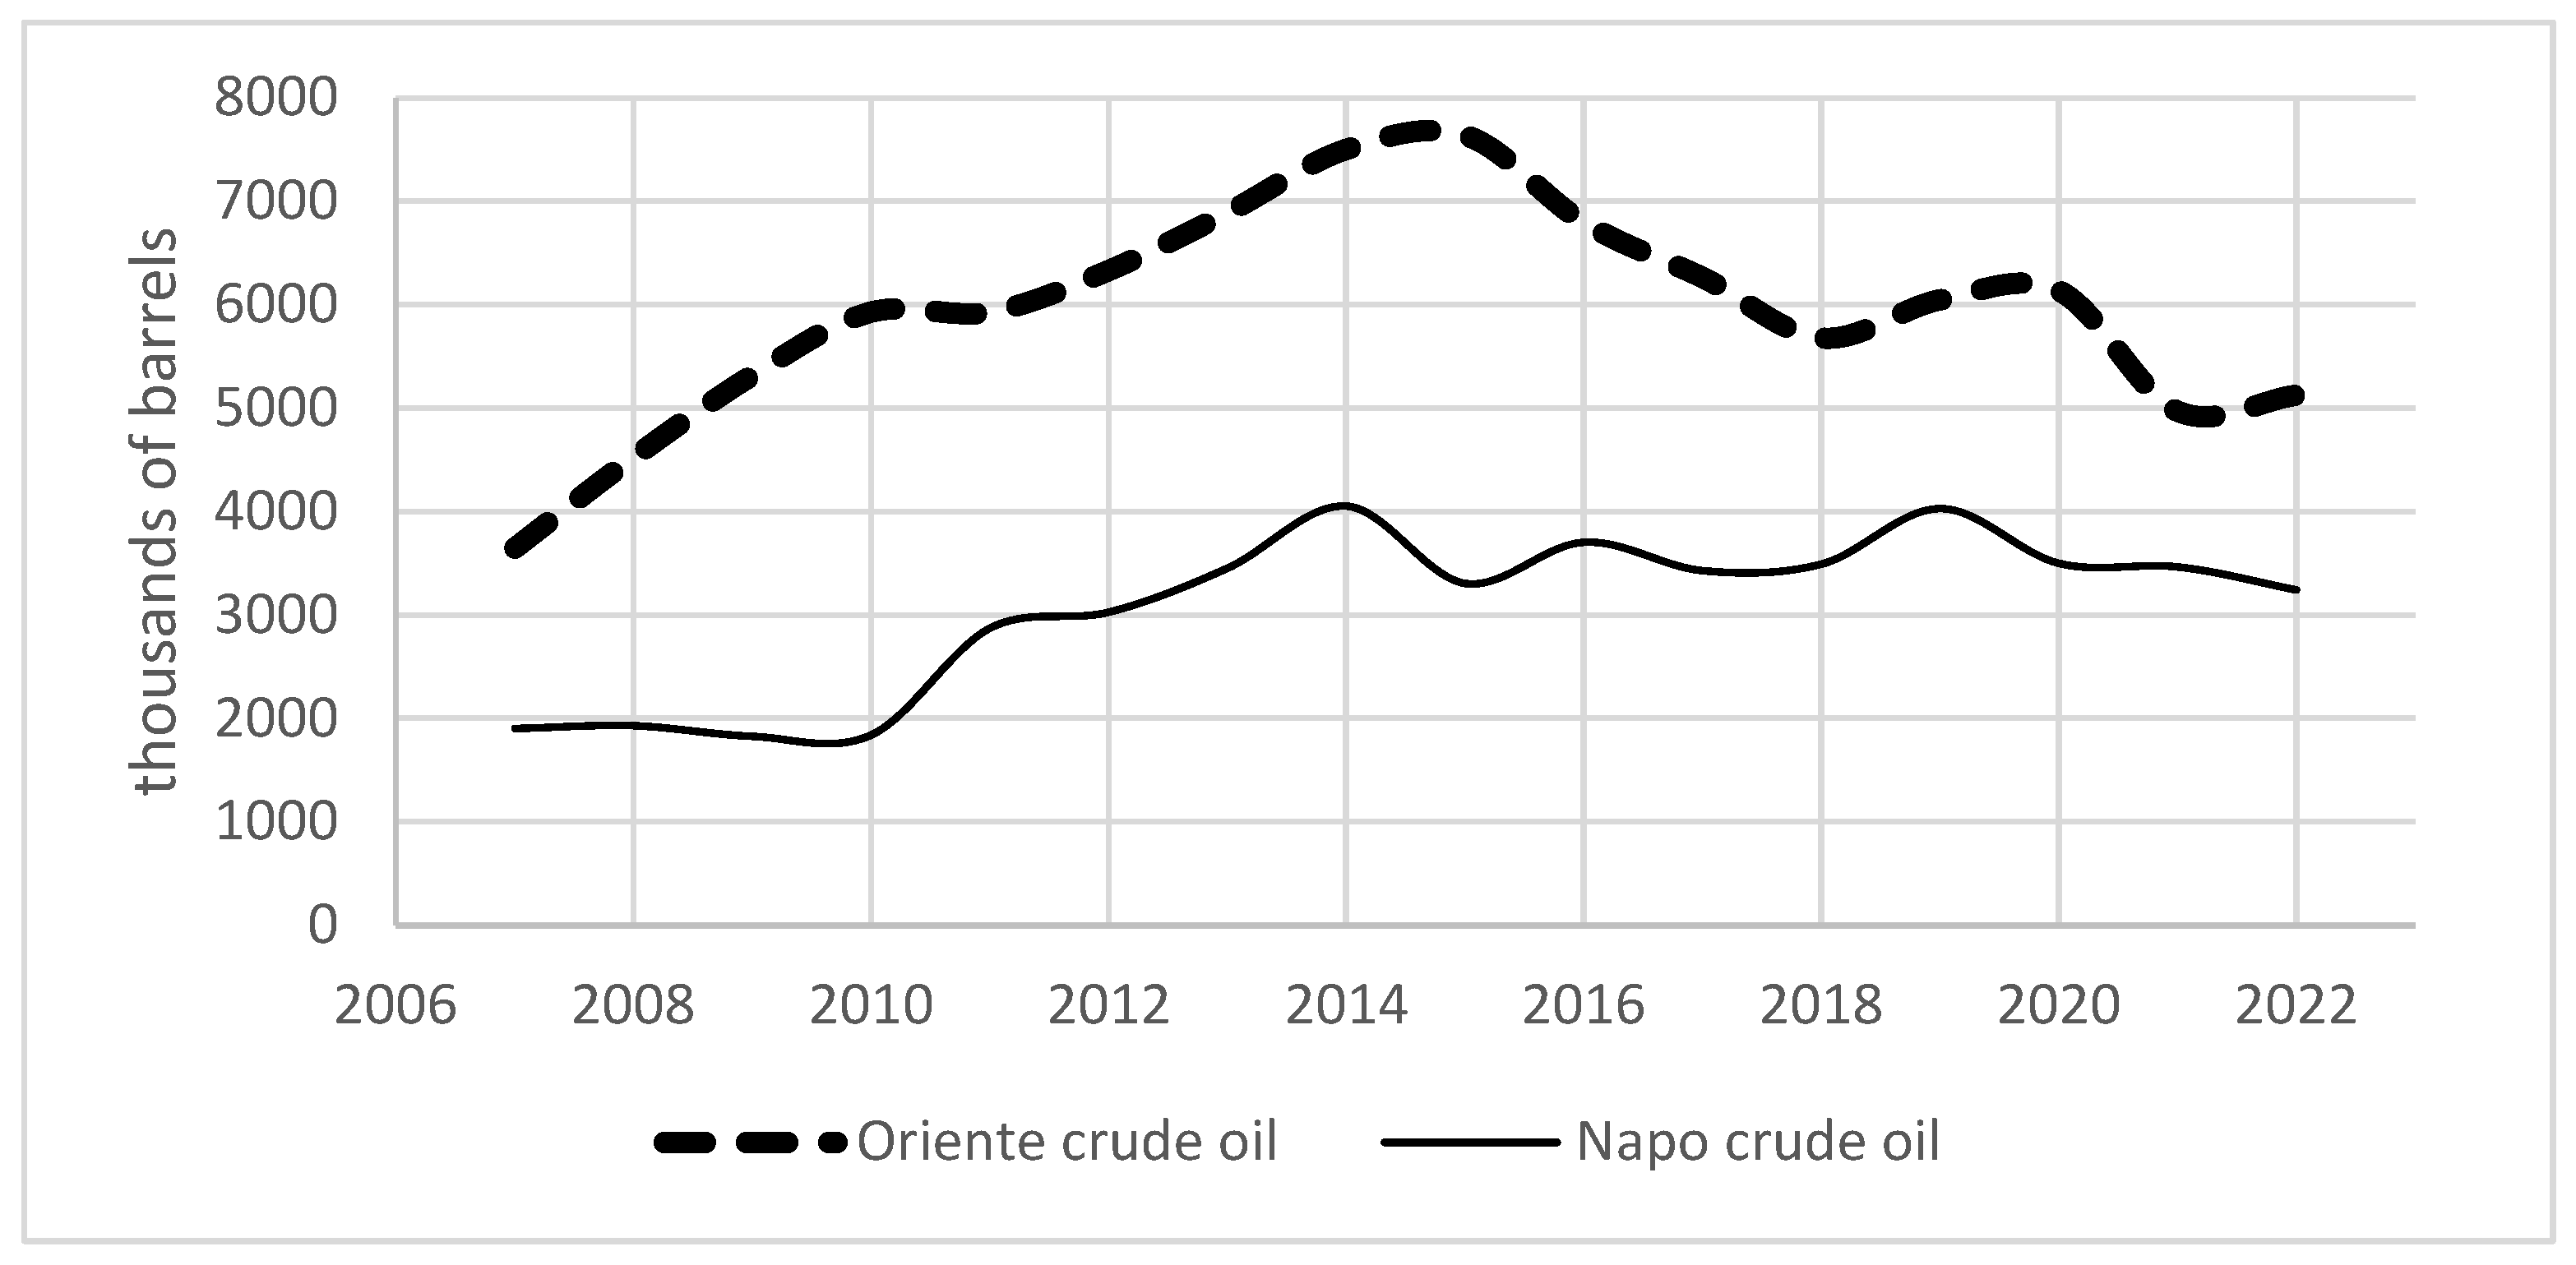
2.2.1. Oil
2.2.2. Hydroelectric Power
2.2.3. Biomass
2.2.4. Other Primary Sources
2.3. Secondary Energy
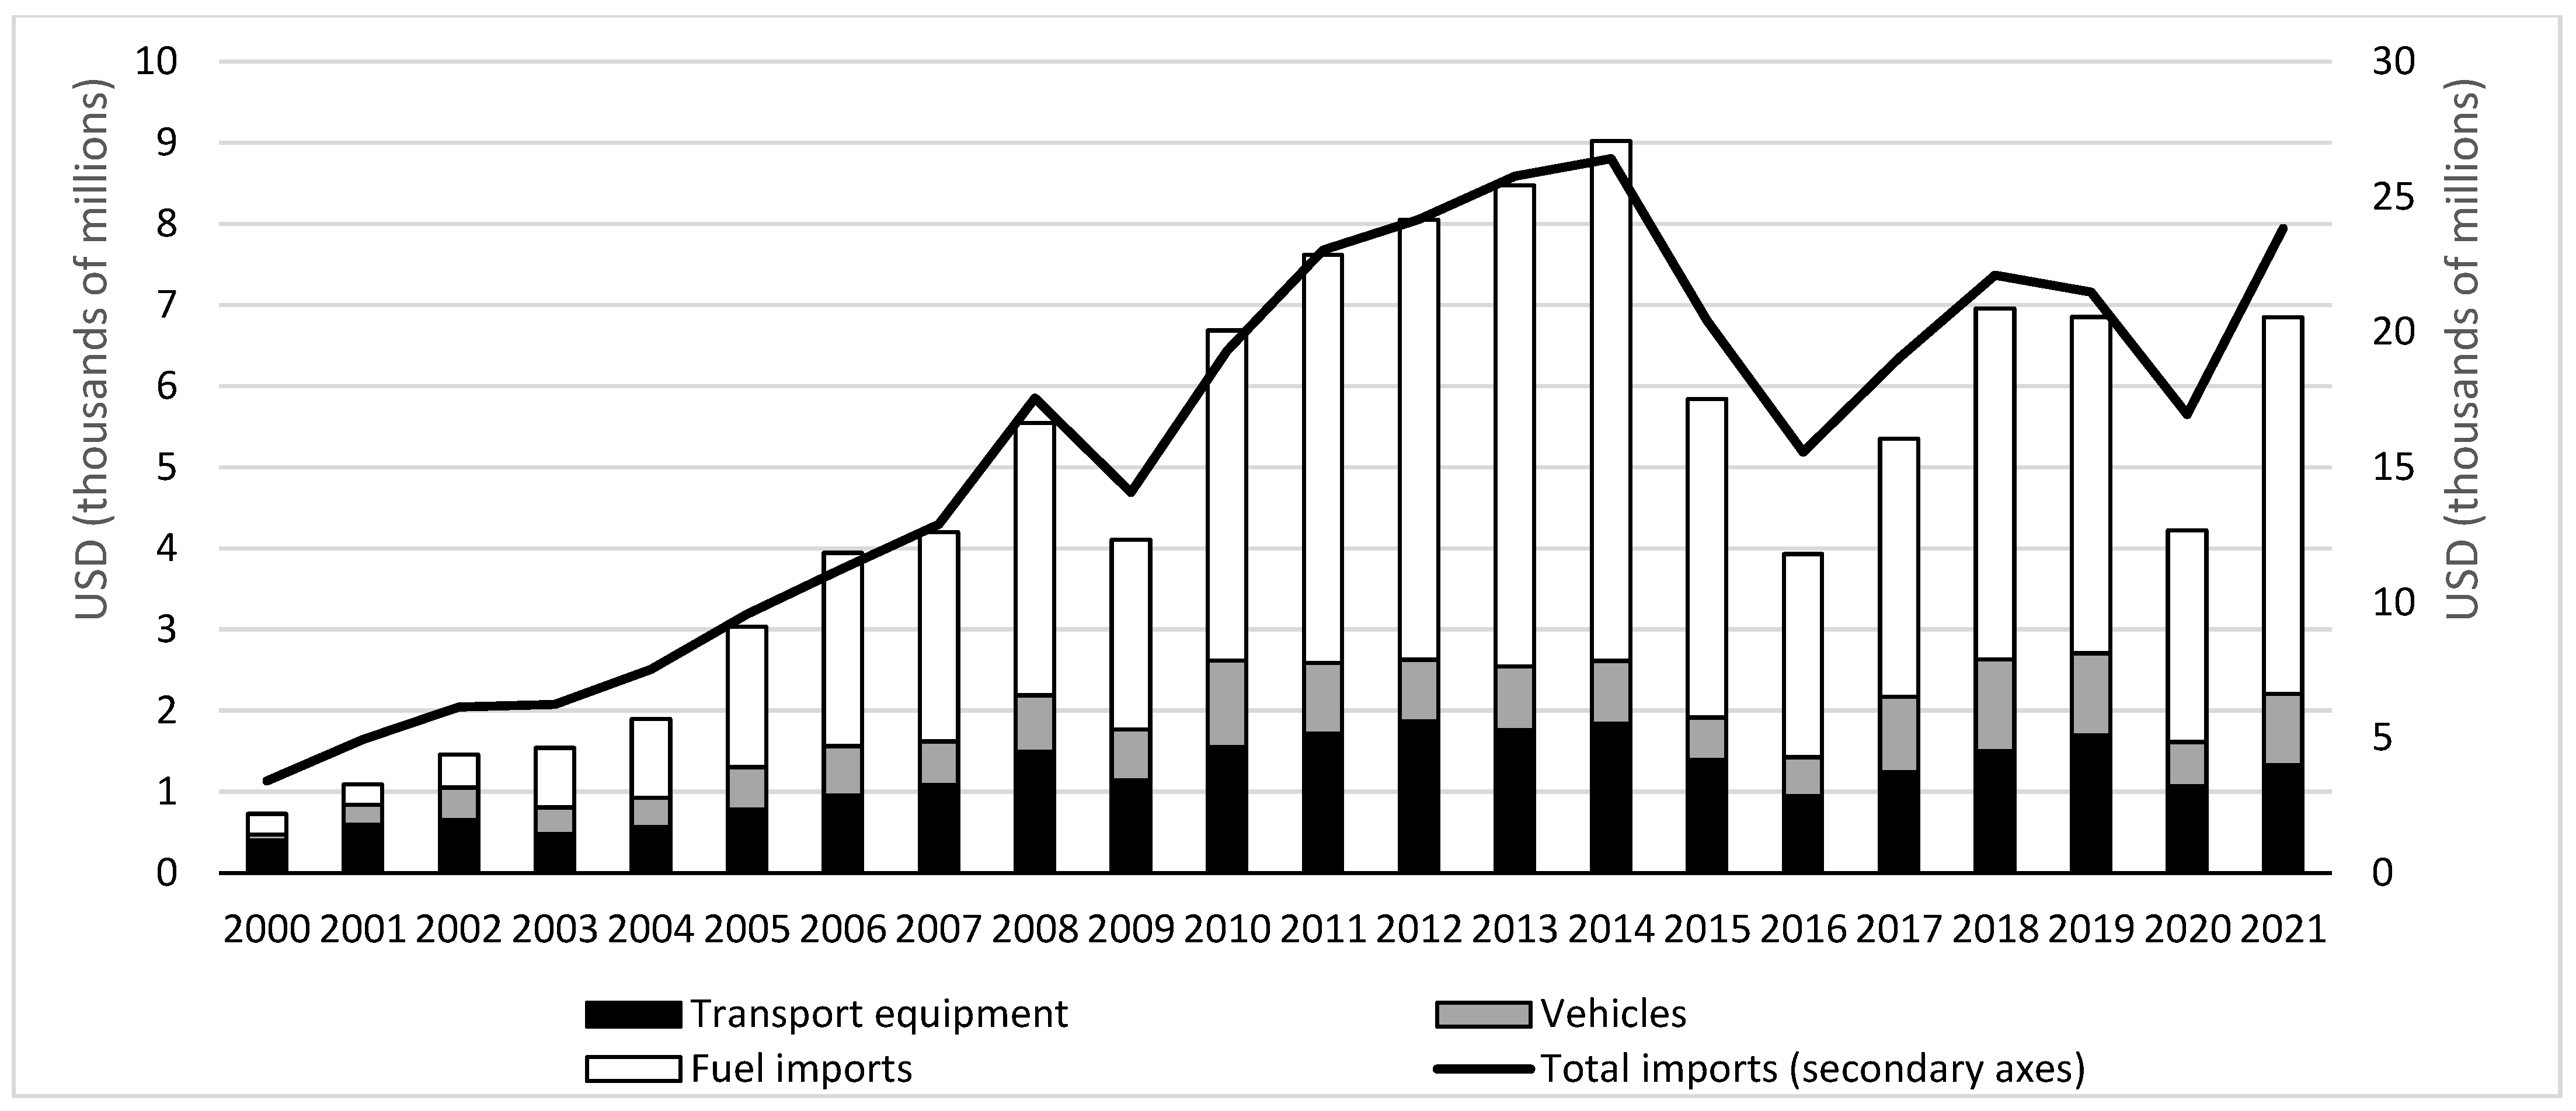
2.3.1. Petroleum Derivatives
2.3.2. Electricity
2.3.3. Fuel Oil
3. Methodology
4. Analysis and Discussion of Indicators
4.1. Availability
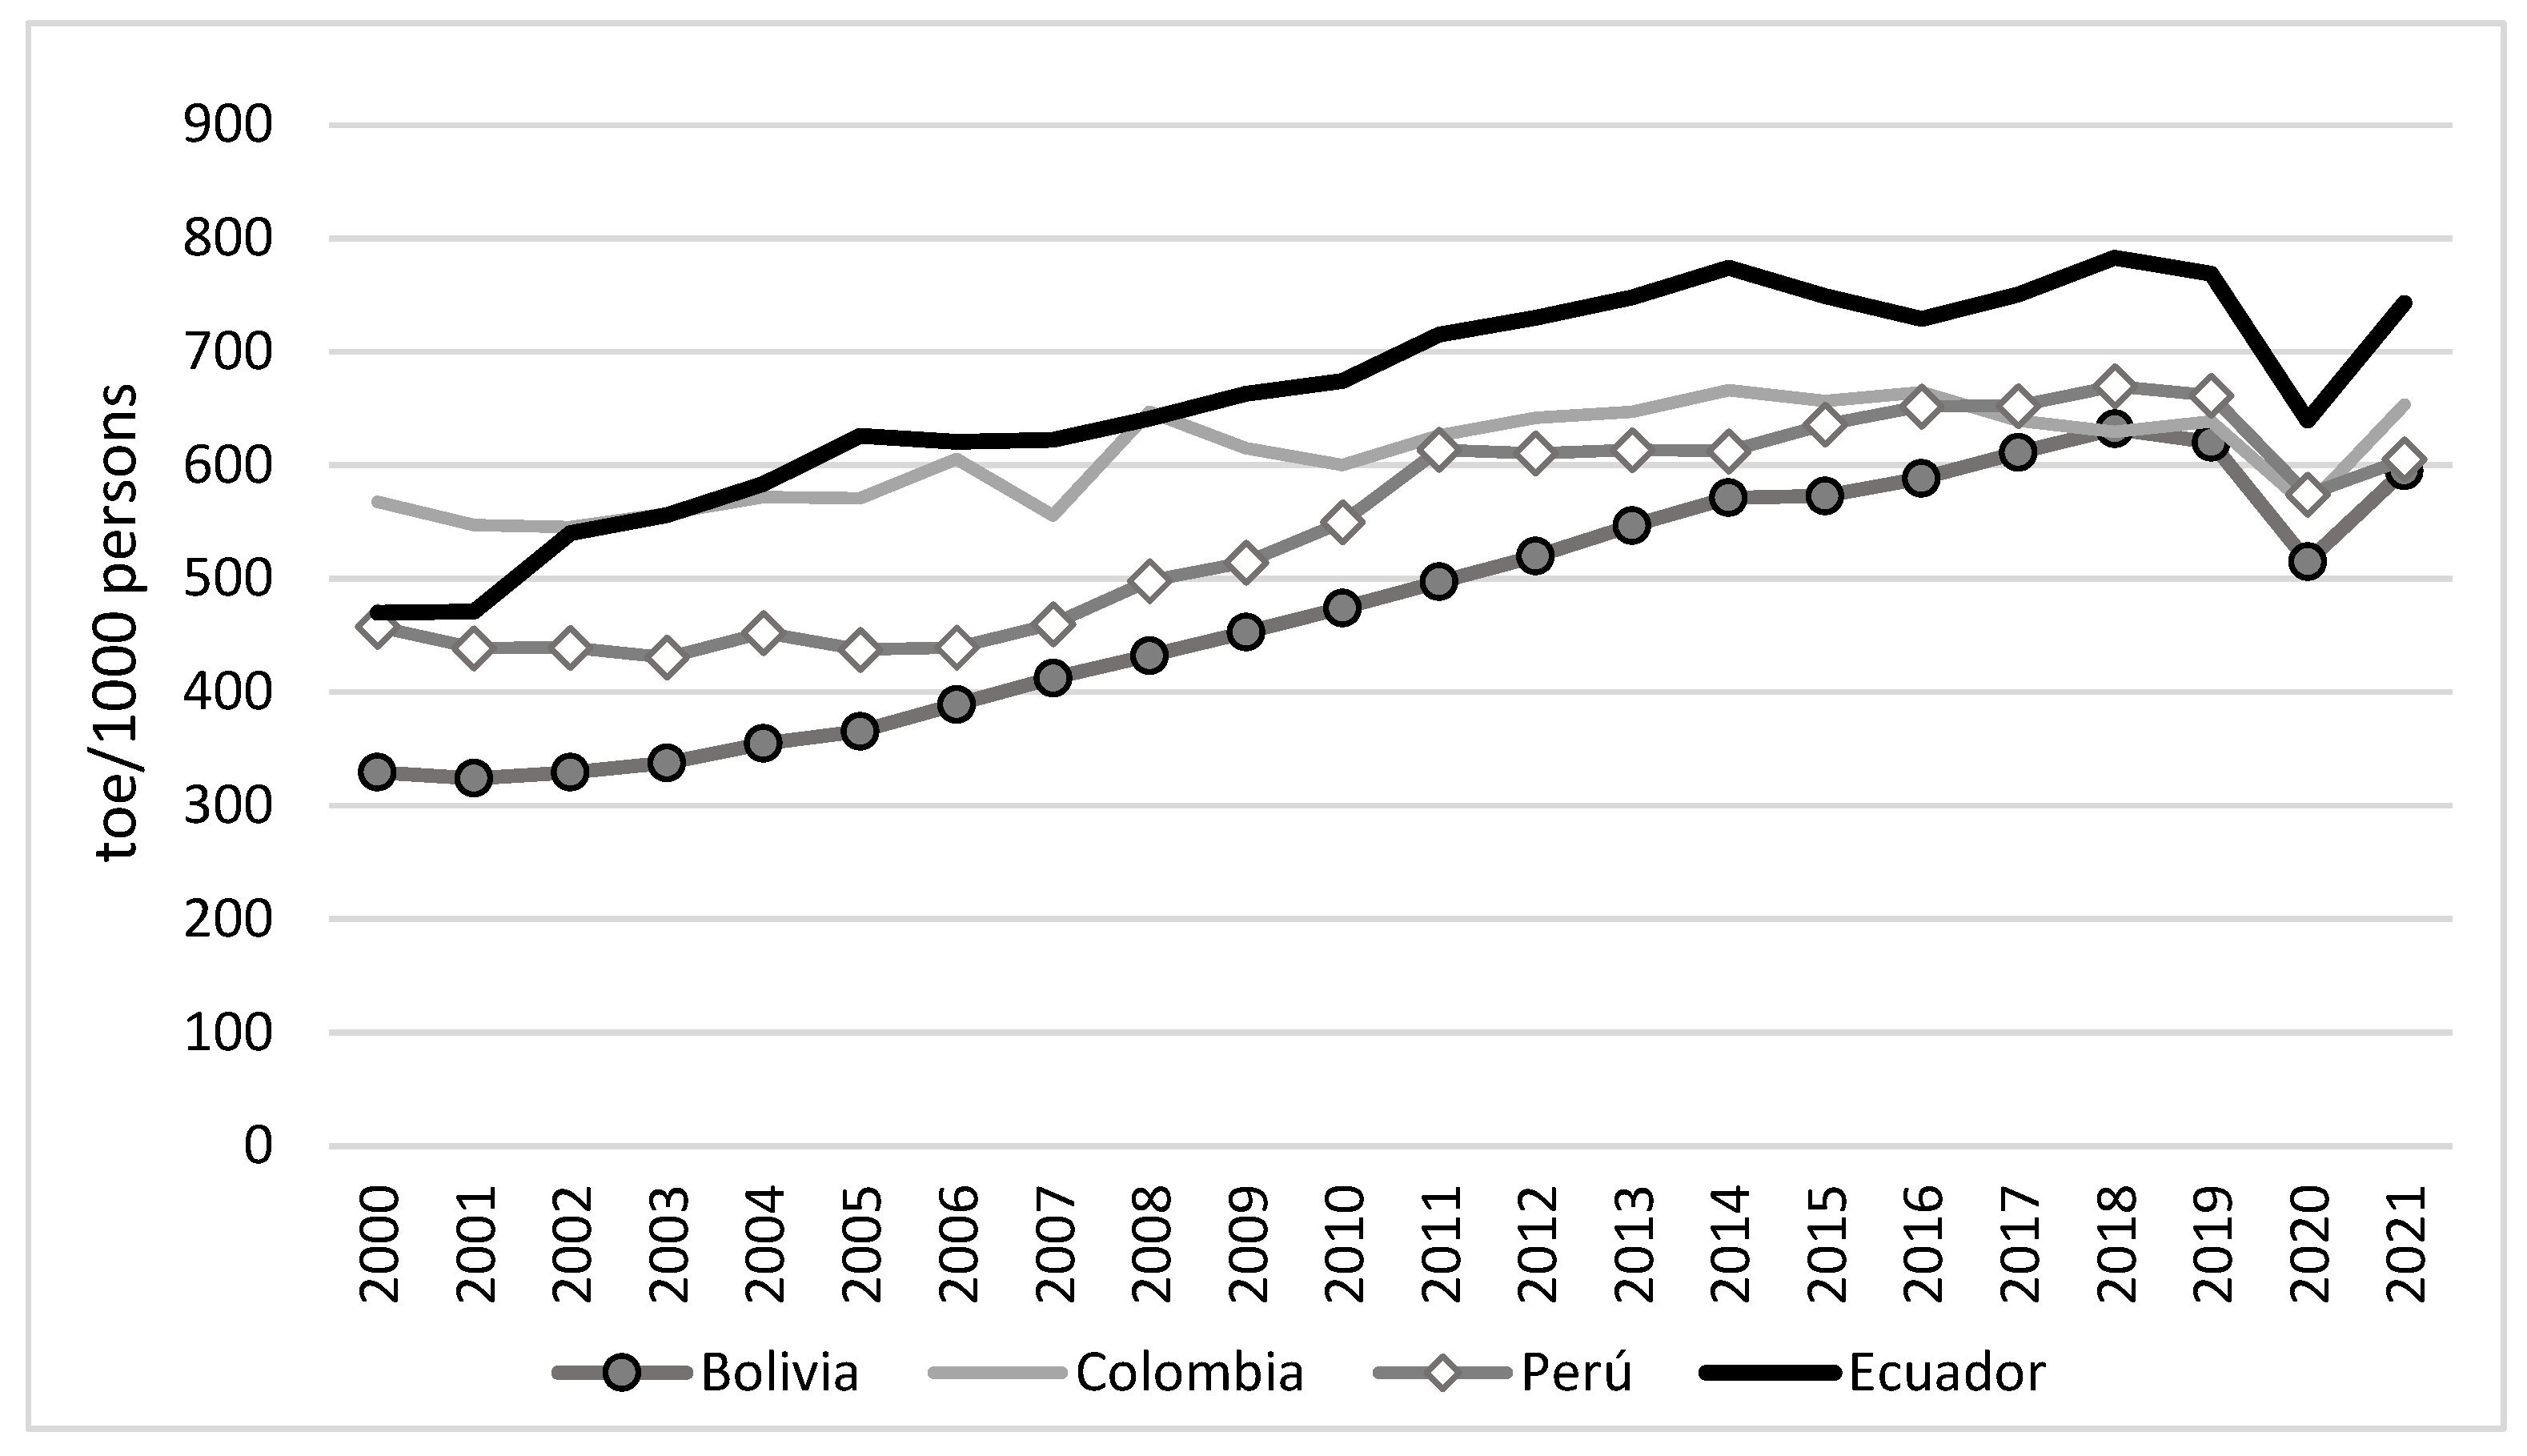
4.1.1. Per Capita Primary Energy Supply and Final Energy Consumption
4.1.2. Scope of Proven Oil and Gas Reserves
4.1.3. Energy Self-Sufficiency
4.1.4. Diversification
4.1.5. The Proportion of Renewable Energy in the Total Primary Energy Supply
4.1.6. Dependence on Petroleum Derivatives for Transportation
4.2. Infrastructure
4.2.1. Fuel Infrastructure
4.2.2. Hydroelectric Infrastructure
4.2.3. Electricity Transmission and Distribution Infrastructure
4.3. Energy Prices
4.3.1. Residential Electricity Price
4.3.2. LPG Price
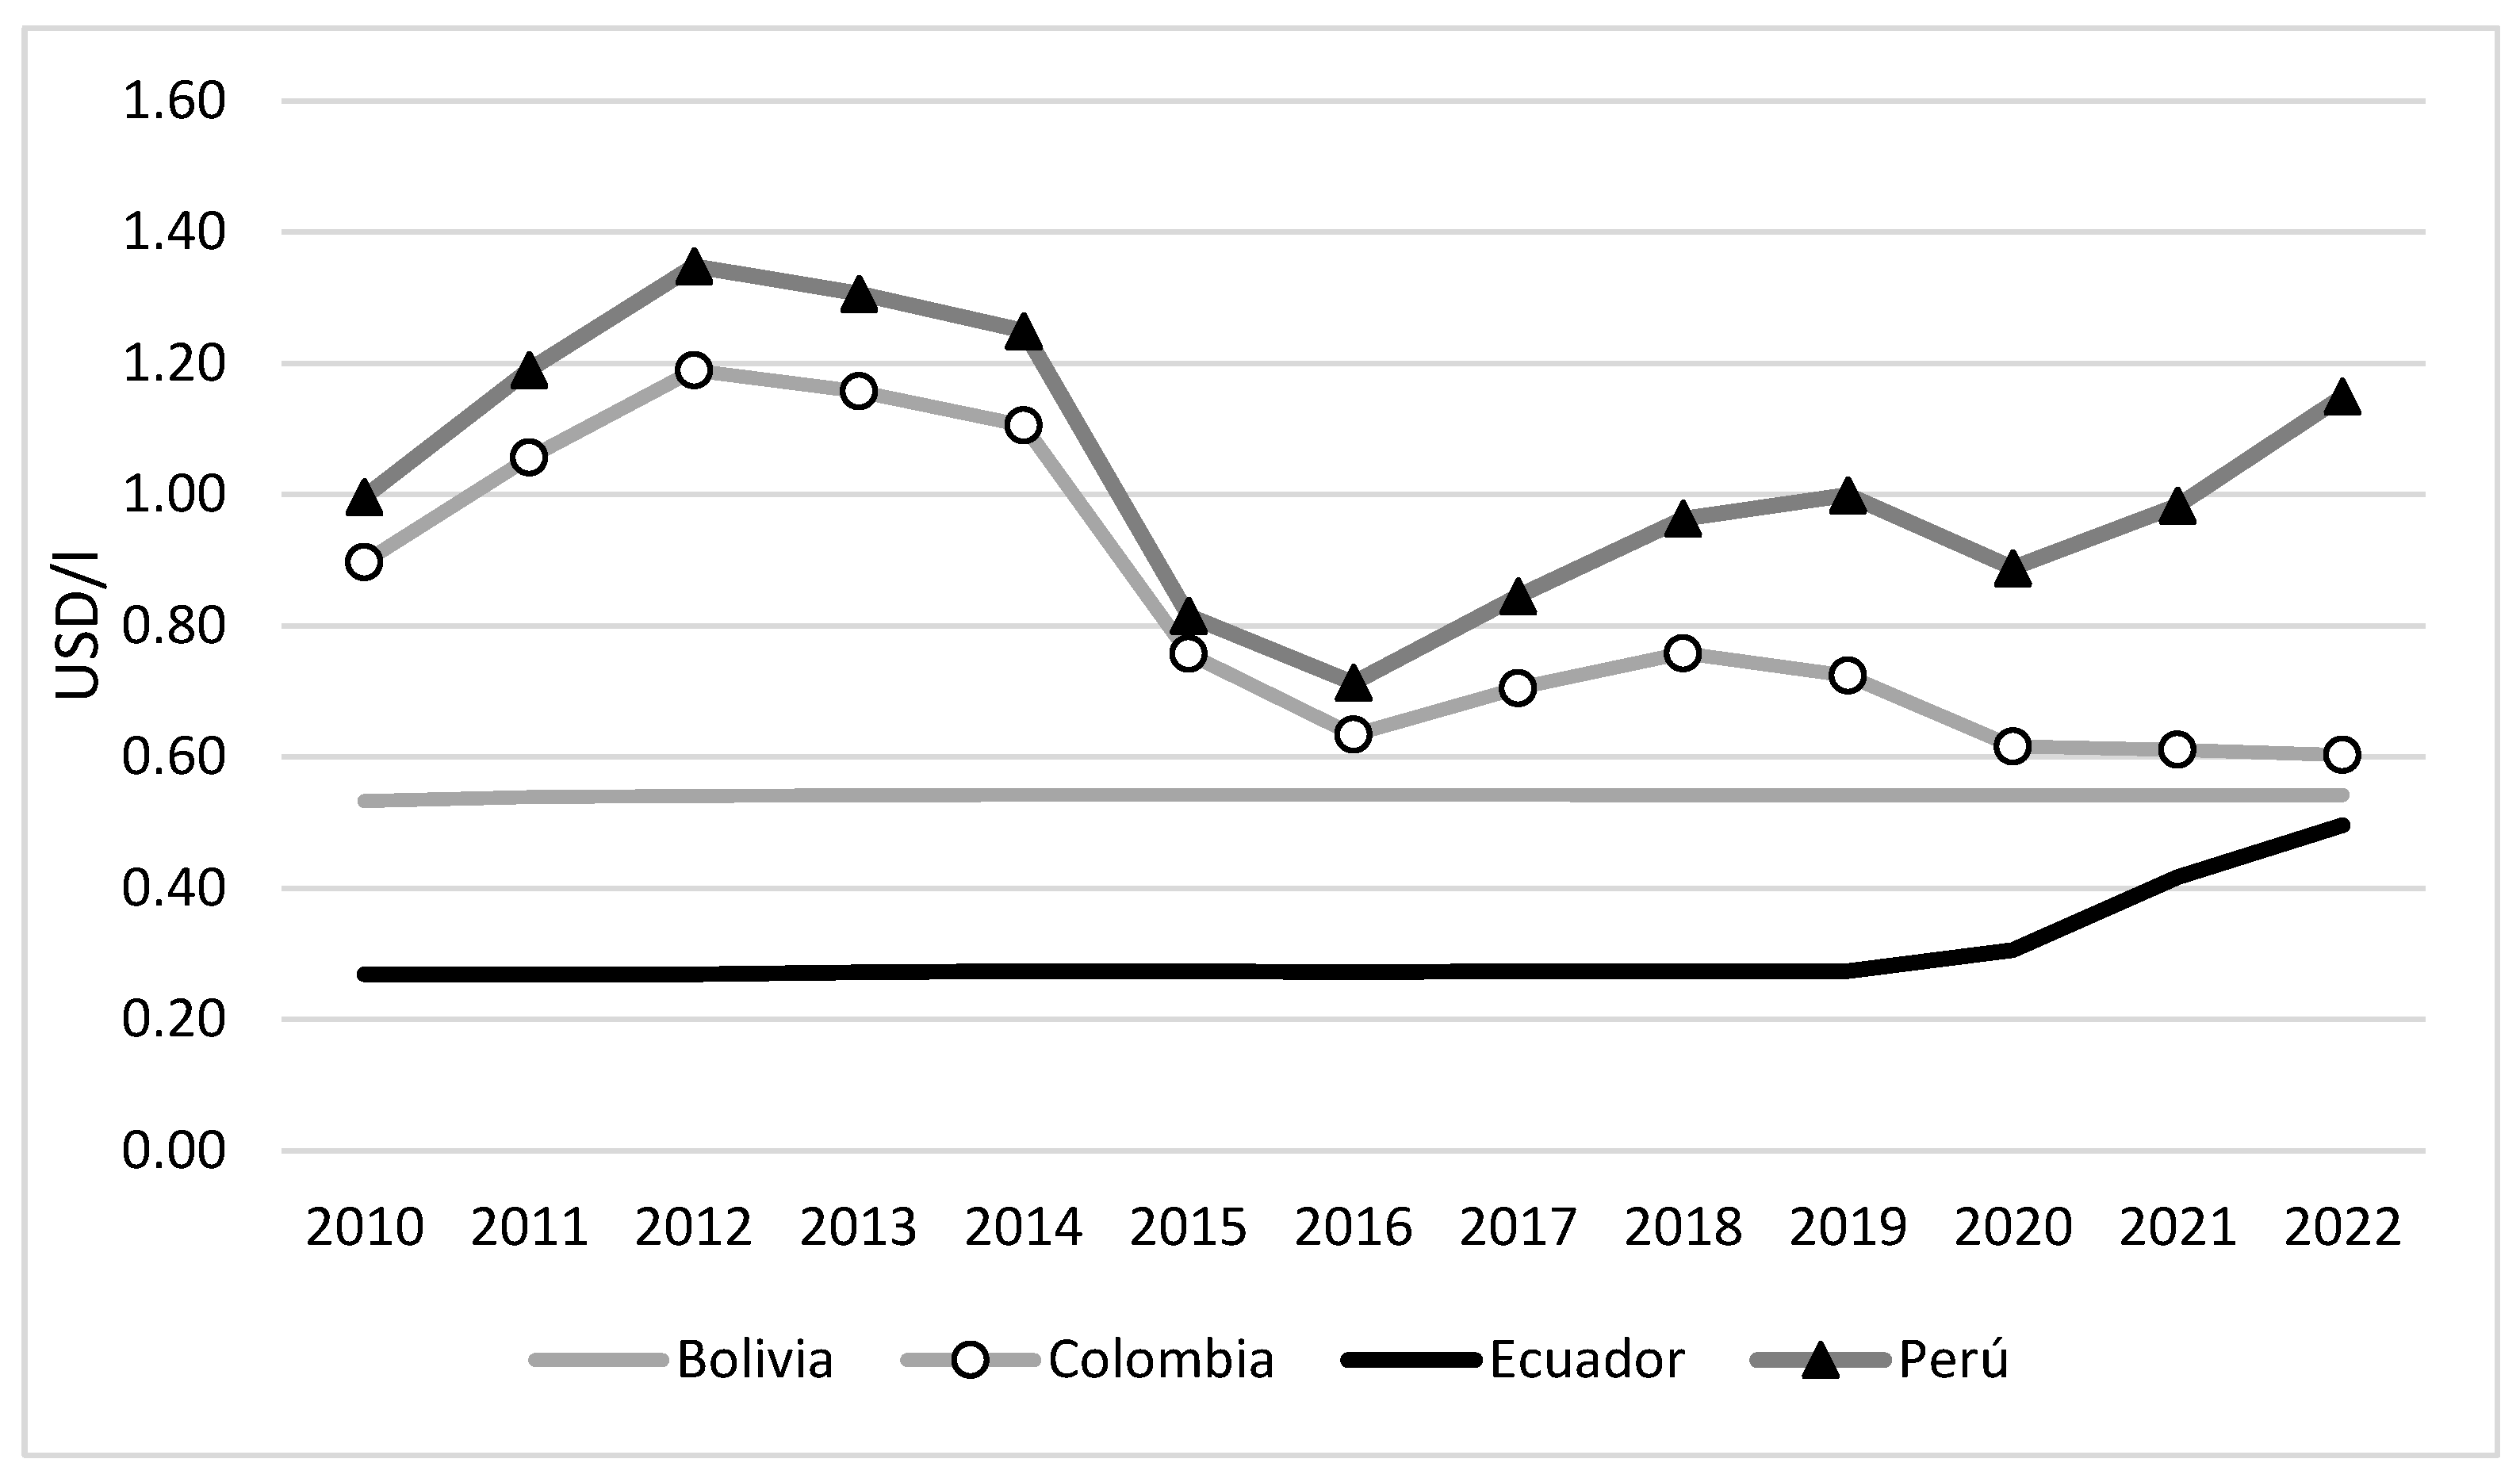
4.3.3. Gasoline and Diesel Prices
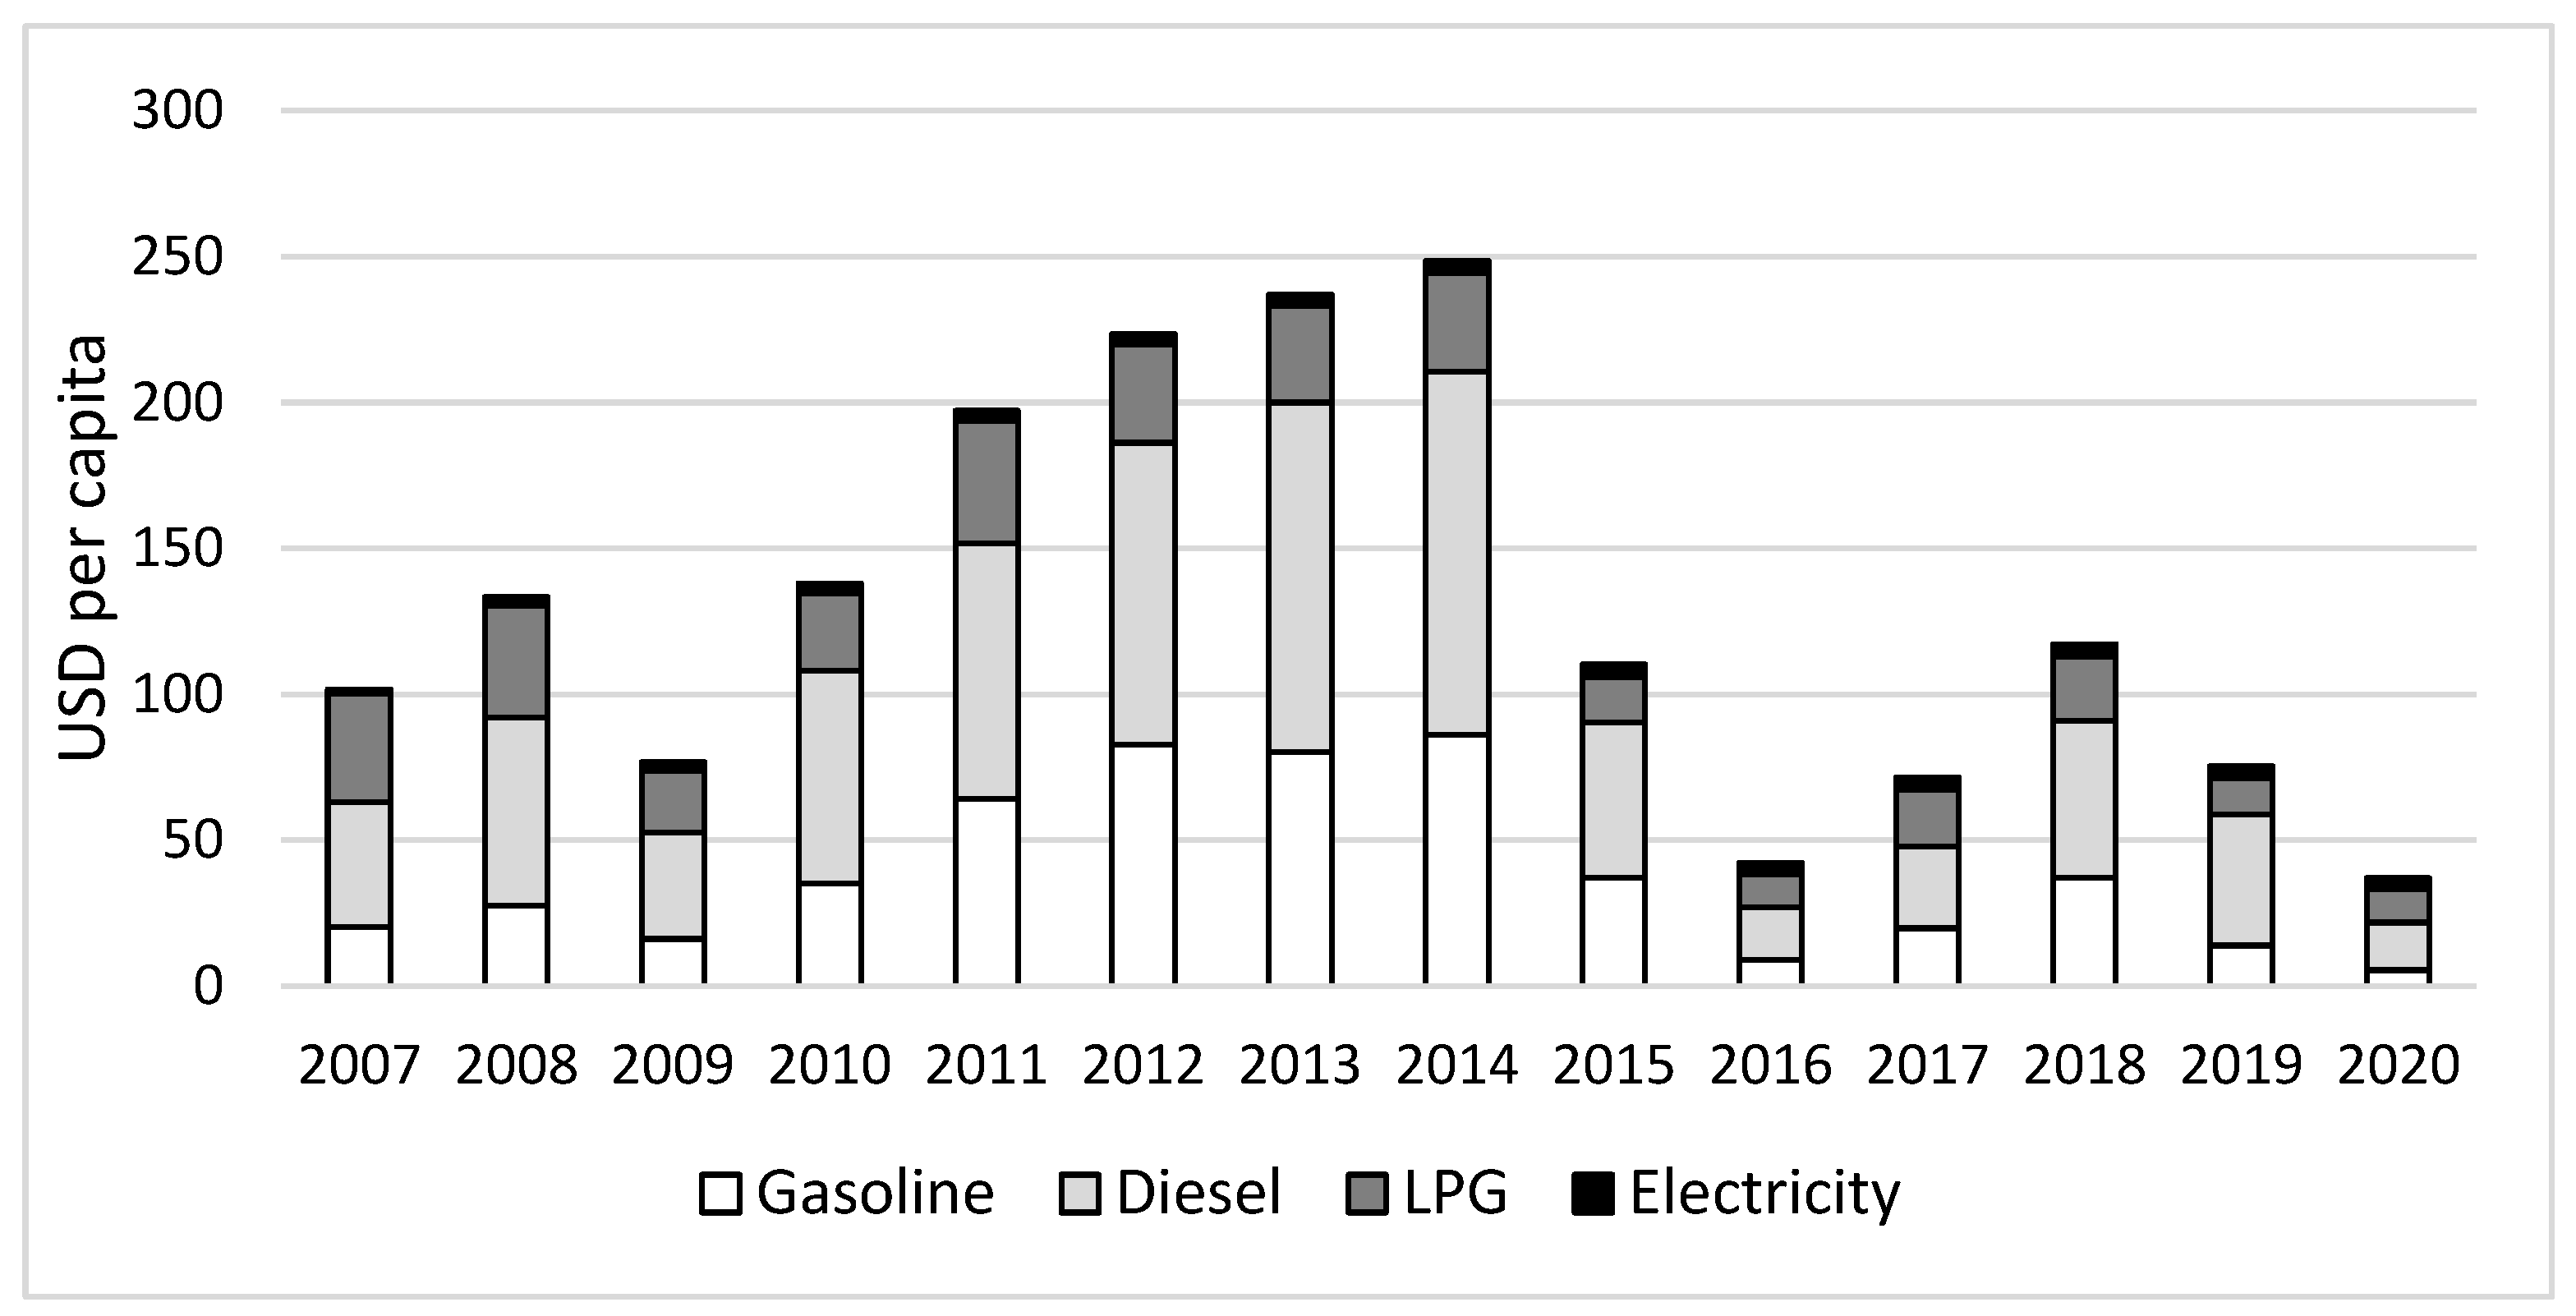
4.3.4. Energy Subsidies
- (a)
- (b)
- (c)
- Fuel smuggling to neighboring countries and to international vessels, ranging from 5% to 30% [137], and causing significant damage at the national level, is estimated at around USD 400 million annually [138]. It is carried out by a section of the population, often backed by organized criminal groups and drug trafficking organizations [139,140,141,142,143]. It should be noted that the media have reported numerous cases of fishermen captured for drug or fuel smuggling [144,145].
4.4. Efficiency
4.4.1. Primary and Final Energy Intensity
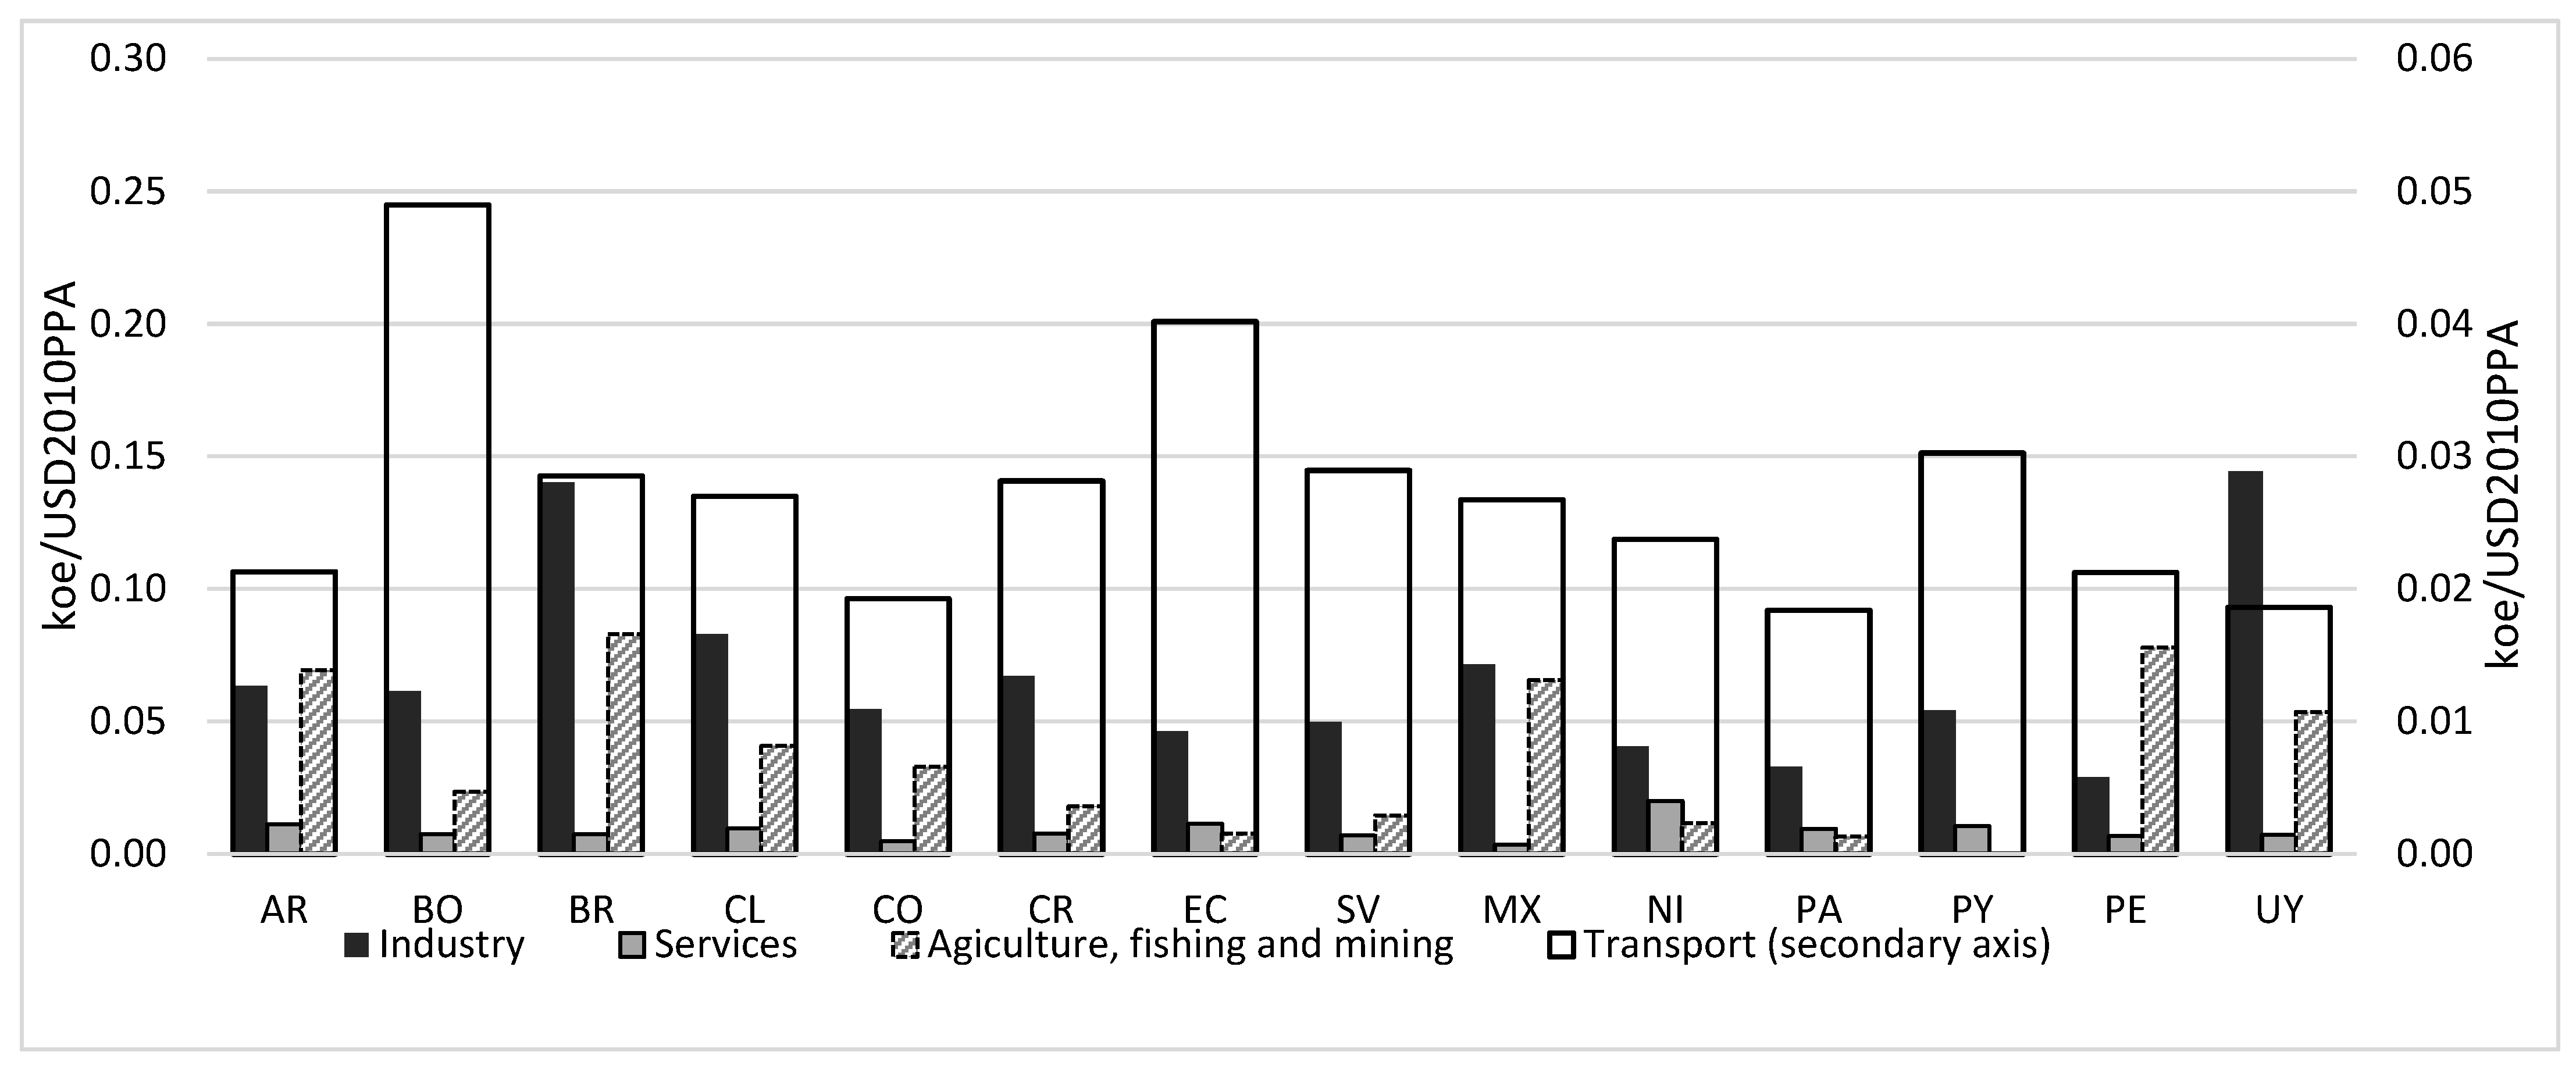
4.4.2. Sectoral Energy Intensity
Energy Intensity of Industrial and Service Sectors
Energy Intensity of Agriculture, Fishing and Mining Sector
Energy Intensity in Transportation Sector
4.4.3. Efficiency Indicators in Transportation
4.4.4. Electrical Losses
4.5. Social Impact
4.6. Environment
4.6.1. Forest Coverage
4.6.2. Water Availability
4.6.3. Per Capita Carbon Dioxide Emissions
4.6.4. Sulfur Dioxide (SO2) Emissions per Capita
4.7. Governance
5. Conclusions and Policy Recommendations
5.1. Characterization of the Energy System
5.2. Implications for Energy Security
5.3. Policy Recomendations
Author Contributions
Funding
Data Availability Statement
Conflicts of Interest
References
- Bellfield, H. The Water-Energy-Food Nexus in Latin America and the Caribbean; Global Canopy Programme: Oxford, UK, 2015; Available online: https://iwa-network.org/wp-content/uploads/2017/03/The-Water-Energy-Food-Nexus-in-LAC-April-2015-lower-res.pdf (accessed on 31 July 2023).
- Terrapon-Pfaff, J.; Ortiz, W.; Dienst, C.; Gröne, M.-C. Energising the WEF nexus to enhance sustainable development at local level. J. Environ. Manag. 2018, 223, 409–416. [Google Scholar] [CrossRef] [PubMed]
- Al-Saidi, M.; Elagib, N.A. Towards Understanding the Integrative Approach of the Water, Energy and Food Nexus. Sci. Total Environ. 2017, 574, 1131–1139. [Google Scholar] [CrossRef]
- World Economic Forum. Global Risks 2011: An Initiative of the Risk Response Network, 6th ed.; World Economic Forum: Geneva, Stwizerland, 2011. [Google Scholar]
- Hoff, H. Understanding the Nexus. Background Paper for the Bonn 2011 Conference: The Water, Energy and Food Security Nexus; Stockholm Environment Institute: Stockholm, Sweden, 2011; Available online: https://mediamanager.sei.org/documents/Publications/SEI-Paper-Hoff-UnderstandingTheNexus-2011.pdf (accessed on 18 September 2021).
- Embid, A.; Martín, L. El Nexo Entre el Agua, la Energía y la Alimentación en América Latina y el Caribe: Planificación, Marco Normativo e Identificación de Interconexiones Prioritarias. 2017. Available online: https://www.cepal.org/es/publicaciones/41069-nexo-agua-la-energia-la-alimentacion-america-latina-caribe-planificacion-marco (accessed on 14 September 2021).
- Embid, A.; Martín, L. Lineamientos de Políticas Públicas: Un Mejor Manejo de las Interrelaciones del Nexo Entre el Agua, la Energía y la Alimentación; CEPAL: Santiago, Chile, 2018; Available online: https://repositorio.cepal.org/handle/11362/44183 (accessed on 23 May 2022).
- Gordillo, G.; Méndez, O. Seguridad y Soberanía Alimentarias; FAO: Rome, Italy, 2013; Available online: https://www.fao.org/3/ax736s/ax736s.pdf (accessed on 29 July 2023).
- Ferroukhi, R.; Nagpal, D.; Lopez-Pena, A.; Hodges, T.; Mohtar, R.H.; Daher, B.; Mohtar, S.; Keulertz, M. Renewable Energy in the Water, Energy & Food Nexus; IRENA: Masdar City, United Arab Emirates, 2015; Available online: https://www.irena.org/-/media/Files/IRENA/Agency/Publication/2015/IRENA_Water_Energy_Food_Nexus_2015.pdf (accessed on 11 September 2021).
- Ochoa, R.G.; Bracamonte Sierra García, R. Pobreza Energética en América Latina; CEPAL: Santiago, Chile, 2014; Available online: https://repositorio.cepal.org/server/api/core/bitstreams/79cc961b-7908-4fce-a7dd-133d484c1be7/content (accessed on 19 September 2023).
- Montesdeoca, L. Soberanía Energética en el Ecuador; Posgrado; FLACSO: Quito, Ecuador, 2011; Available online: https://repositorio.flacsoandes.edu.ec/bitstream/10469/7638/7/TFLACSO-2011LCME.pdf (accessed on 5 May 2023).
- Ang, B.W.; Choong, W.L.; Ng, T.S. Energy security: Definitions, dimensions and indexes. Renew. Sustain. Energy Rev. 2015, 42, 1077–1093. [Google Scholar] [CrossRef]
- Calvo, R.; Álamos, N.; Billi, M.; Urquiza, A.; Lisperguer, R.C. Desarrollo de Indicadores de Pobreza Energética en América Latina y el Caribe. 2021. Available online: https://repositorio.cepal.org/bitstream/handle/11362/47216/4/S2100433_es.pdf (accessed on 4 May 2023).
- Lucena, A.; Szklo, A.; Schaeffer, R.; Soria, R.; Chávez, M. Energy Security in the Amazon. Report for Global Canopy Programme and International Center for Tropical Agriculture as Part of the Amazonia Security Agenda Project. 2013. Available online: https://bit.ly/3dEpUDD (accessed on 10 December 2019).
- Huang, S.-W.; Chung, Y.-F.; Wu, T.-H. Analyzing the relationship between energy security performance and decoupling of economic growth from CO2 emissions for OECD countries. Renew. Sustain. Energy Rev. 2021, 152, 111633. [Google Scholar] [CrossRef]
- Escalante, D. La Seguridad Energética de Centroamérica: Propuesta Para una Estimación Abarcadora. Revista CEPAL N° 139. 2023. Available online: https://hdl.handle.net/11362/48797 (accessed on 23 April 2023).
- Xie, M.; Wei, X.; Chen, C.; Sun, C. China’s natural gas production peak and energy return on investment (EROI): From the perspective of energy security. Energy Policy 2022, 164, 112913. [Google Scholar] [CrossRef]
- Sovacool, B.K.; Brown, M.A. Competing Dimensions of Energy Security: An International Perspective. Annu. Rev. Environ. Resour. 2010, 35, 77–108. [Google Scholar] [CrossRef]
- IEA. Energy Security—Topics; IEA: Paris, France, 2019; Available online: https://bit.ly/3cv78i6 (accessed on 10 February 2020).
- Sperling, E.; Sikorsky, E.; Femia, F. The Climate and Security Advisory Group’s Climate and Security Fellowship Program: Climate Security Risk Briefers; Center for Climate and Security, an Institute of the Council on Strategic Risks: Washington, DC, USA, 2021; Available online: https://climateandsecurity.org/wp-content/uploads/2021/10/Climate-Security-Risk-Briefers_Climate-and-Security-Fellows-Program_October-2021-1.pdf (accessed on 14 November 2022).
- Global Energy Institute. International Energy Security Risk Index; Global Energy Institute: Washington, DC, USA, 2018; Available online: https://www.globalenergyinstitute.org/international-energy-security-risk-index (accessed on 16 May 2023).
- Castro Domingo, P. Termodinámica de la Supervivencia Para las Ciencias Sociales, Leonardo Tyrtania. 2003. Available online: https://bit.ly/3fMX0mW (accessed on 23 August 2019).
- Petroecuador. El Petróleo en el Ecuador: La Nueva era Petrolera. 2013. Available online: https://www.eppetroecuador.ec/wp-content/uploads/downloads/2015/03/El-Petr%C3%B3leo-en-el-Ecuador-La-Nueva-Era.pdf (accessed on 10 July 2023).
- Ayala, E. Resumen de Historia del ECUADOR, 3rd ed.; Corporación Editora Nacional: Quito, Ecuador, 2008. [Google Scholar]
- Ponce-Jara, M.A.; Castro, M.; Pelaez-Samaniego, M.R.; Espinoza-Abad, J.L.; Ruiz, E. Electricity sector in Ecuador: An overview of the 2007–2017 decade. Energy Policy 2018, 113, 513–522. [Google Scholar] [CrossRef]
- Espinosa, A.A.; Darlic, V.; Granja, G. Estadísticas Energéticas del Ecuador; ILDIS: Quito, Ecuador, 1989; Available online: https://ecuador.fes.de/fileadmin/user_upload/pdf/indice_libros-energeticas-0136.pdf (accessed on 7 January 2023).
- Altomonte, H.; Coviello, M.F.; Lutz, W.F. Energías Renovables y Eficiencia Energética en América Latina y el Caribe: Restricciones y Perspectivas; Naciones Unidas, CEPAL: Santiago, Chile, 2003. [Google Scholar]
- Naranjo, M. La Enfermedad Holandesa y El Caso Ecuatoriano; BCE: Quito, Ecuador, 1995; Available online: http://repositorio.bce.ec:8080/handle/32000/164 (accessed on 20 April 2023).
- Naranjo Chiriboga, M. Dos décadas pérdidas: Los ochenta y los noventa. Cuest. Econ. 2004, 20, 223–250. [Google Scholar]
- Acosta, A. Breve Historia Económica del Ecuador; Segunda en Biblioteca General de Cultura: Quito, Ecuador, 2006; Available online: https://biblio.flacsoandes.edu.ec/libros/111157-opac (accessed on 6 January 2023).
- BCE. La Economía Ecuatoriana Luego de 10 Años de Dolarización. 2010. Available online: https://bit.ly/2ztOGb0 (accessed on 17 November 2018).
- Mateo, J.P.; García, S. El sector petrolero en Ecuador. 2000–2010. Probl. Desarro. 2014, 45, 113–139. [Google Scholar] [CrossRef]
- Ministerio Coordinador de Sectores Estratégicos. Balance Energético Nacional 2013. 2013. Available online: https://issuu.com/sectoresestrategicos/docs/balance_energe__tico_nacional_2013_ (accessed on 5 January 2022).
- Segovia-Larrea, S. 20 Años de Dolarización de la Economía Ecuatoriana. In Análisis del Sector Real e Indicadores Sociales; BCE: Quito, Ecuador, 2020; p. 78. Available online: https://www.bce.fin.ec/micrositio20dolarizacion/documentos/Sector-Real.pdf (accessed on 5 January 2022).
- Díaz Cassou, J.; Ruiz-Arranz, M. (Eds.) Reformas y Desarrollo en el Ecuador Contemporáneo; Inter-American Development Bank: Washington, DC, USA, 2018. [Google Scholar] [CrossRef]
- Arias, K.M. Gobernanza Energética y Neonacionalismo, Caso Refinería del Pacífico: Implicaciones en Política Energética, Económica, Social y Ambiental; Posgrado; FlacsoAndes: Quito, Ecuador, 2014; Available online: https://repositorio.flacsoandes.edu.ec/xmlui/bitstream/handle/10469/6178/TFLACSO-2014KMAM.pdf?sequence=2&isAllowed=y (accessed on 26 December 2022).
- Narváez, J.C. Lenín Moreno Anuncia Que si Nadie Quiere Invertir en la Refinería del Pacífico, la Descartará; El Comercio: Quito, Ecuador, 2017; Available online: https://www.elcomercio.com/actualidad/politica/leninmoreno-inversionistas-refineria-pacifico-hidrocarburos.html (accessed on 26 December 2022).
- Figueroa de la Vega, F. Tablero de Comando Para la Promoción de los Biocombustibles en Ecuador; CEPAL: Santiago, Chile, 2008; Available online: https://www.cepal.org/cgi-bin/getProd.asp?xml=/publicaciones/xml/9/33219/P33219.xml&xsl=/publicaciones/ficha-imprimir.xsl&base=/publicaciones/top_publicaciones.xsl (accessed on 13 October 2020).
- Nolivos, I.; Molina, E.; Bejarano, L.; Valarezo, A. Importancia del Subsidio Eléctrico para las Cocinas de Inducción y su Efecto en la Salud, la Eficiencia Energética y el Ahorro de Recursos, para los Ecuatorianos. 2021. Available online: https://www.usfq.edu.ec/sites/default/files/2021-04/white_paper_PEC-GLP_versus_Induccion.pdf (accessed on 26 February 2022).
- Hidalgo, F. Reflexiones Sobre el Paro de Junio en Ecuador; Centre Tricontinental: Louvain la Neuve, Belgium, 2022; Available online: https://www.cetri.be/Reflexiones-sobre-el-paro-de-junio (accessed on 20 May 2023).
- Garzón Vera, B.O.; Bravo, K.A. Implicaciones históricas y sociales de las protestas indígenas en el Ecuador. Investig. Desarro. 2023, 31, 309–327. [Google Scholar] [CrossRef]
- Tarín, A. Los Muertos del Junio Ecuatoriano. 2022. Available online: https://www.elsaltodiario.com/ecuador/nueve-muertos-junio-ecuatoriano-jhonny-felix-byron-guatatuca-marcelino-villa-henry-quezada-eduardo-iniguez-hermanos-sislema (accessed on 20 May 2023).
- Espinosa, C. Comisión de la Asamblea Aprueba Informe Sobre Protestas de Octubre, Sin Fijar Responsabilidades Políticas; El Comercio: Quito, Ecuador, 2019; Available online: https://www.elcomercio.com/actualidad/politica/comision-informe-protestas-paro-asamblea.html (accessed on 23 May 2023).
- Defensoría del Pueblo. Informe Técnico Sobre los Hechos Ocurridos del 13 al 30 de Junio de 2022 en Ecuador. 2022. Available online: https://www.dpe.gob.ec/wp-content/dpecomunicacion/public/2022-informe-investigacion-defensorial.pdf (accessed on 23 May 2023).
- Mejia, J.J. Evaluación de Daños y Pérdidas. Afectaciones por Paro Nacional del 3 al 14 October 2019, República del Ecuador. 2019. Available online: https://www.bce.fin.ec/images/BANCO_C_ECUADOR/PDF/InformeBMImpactoParoNacional.pdf (accessed on 20 May 2023).
- Villareal, F. Estimación de Pérdidas y Daños Ocasionados por el Paro Nacional de Junio de 2022—Banco Central del Ecuador; BCE: Quito, Ecuador, 2022; Available online: https://www.bce.fin.ec/publicaciones/editoriales/estimacion-de-perdidas-y-danos-ocasionados-por-el-paro-nacional-de-junio-de-2022 (accessed on 20 May 2023).
- España, S. Ecuador Decreta el Estado de Excepción Ante las Protestas por el Alza del Precio del Combustible; El País: Madrid, Spain, 2019; Available online: https://elpais.com/internacional/2019/10/03/america/1570125319_107758.html (accessed on 15 May 2023).
- OLADE. Panorama Energético de América Latina y El Caribe 2022; OLADE: Quito, Ecuador, 2022; Available online: https://www.olade.org/publicaciones/panorama-energetico-de-america-latina-y-el-caribe-2021-2/ (accessed on 23 February 2022).
- Nashawi, I.S.; Malaah, A.; Al-Bisharah, M. Forecasting World Crude Oil Production Using Multicyclic Hubbert Model. Energy Fuels 2010, 24, 1788–1800. [Google Scholar] [CrossRef]
- Bardi, U. Peak oil: The four stages of a new idea. Energy 2009, 34, 323–326. [Google Scholar] [CrossRef]
- Parra, R.; Di Felice, L.J.; Giampietro, M.; Ramos-Martin, J. The metabolism of oil extraction: A bottom-up approach applied to the case of Ecuador. Energy Policy 2018, 122, 63–74. [Google Scholar] [CrossRef]
- BCE. Cifras del Sector Petrolero Ecuatoriano. 2012. Available online: https://contenido.bce.fin.ec/documentos/Estadisticas/Hidrocarburos/cspe201266.pdf (accessed on 22 April 2023).
- Ecuavisa. Ecuador no Producirá la Cantidad de Petróleo Proyectada Para Este Año. 2023. Available online: https://www.ecuavisa.com/noticias/economia/ecuador-no-producira-la-cantidad-de-petroleo-proyectada-para-este-ano-EI4912240 (accessed on 29 April 2023).
- BCE. Cifras del Sector Petrolero. 2022. Available online: https://contenido.bce.fin.ec/documentos/Estadisticas/Hidrocarburos/indice.htm (accessed on 26 April 2023).
- MERNNR. Plan Maestro de Energía. 2020. Available online: https://www.recursosyenergia.gob.ec/wp-content/uploads/2020/01/4.-EXPANSION-DE-LA-GENERACION.pdf (accessed on 29 April 2023).
- MEM. Balance Energético 2021; Ministerio de Energía y Minas: Quito, Ecuador, 2022; Available online: https://www.recursosyenergia.gob.ec/wp-content/uploads/2022/08/Balance_Energe%CC%81tico_Nacional_2021-VF_opt.pdf (accessed on 24 April 2023).
- Statista. Capacidad Instalada de Energía Solar en América Latina y el Caribe en 2021; Statista: Hamburg, Germany, 2021; Available online: https://es.statista.com/estadisticas/1238163/capacidad-instalada-energia-solar-america-latina-caribe/ (accessed on 26 May 2023).
- MERNNR. PROYECTO: K007 Producción de Aceite de Piñón Para Plan Piloto de Generación Eléctrica en Galápagos—Fase II. 2019. Available online: https://www.recursosyenergia.gob.ec/wp-content/uploads/2019/11/gprproduccion-aceite-pinon.pdf (accessed on 22 April 2023).
- ARCERNNR. Estadística Anual y Multianual del Sector Eléctrico Ecuatoriano. 2023. Available online: https://www.controlrecursosyenergia.gob.ec/wp-content/uploads/downloads/2023/03/EstadisticaAnual2022-baja-1.pdf (accessed on 23 April 2023).
- Vivoda, V. Evaluating energy security in the Asia-Pacific region: A novel methodological approach. Energy Policy 2010, 38, 5258–5263. [Google Scholar] [CrossRef]
- Sovacool, B.K.; Mukherjee, I.; Drupady, I.M.; D’Agostino, A.L. Evaluating energy security performance from 1990 to 2010 for eighteen countries. Energy 2011, 36, 5846–5853. [Google Scholar] [CrossRef]
- Siksnelyte-Butkiene, I. Defining the Perception of Energy Security: An Overview. Economies 2023, 11, 174. [Google Scholar] [CrossRef]
- SIELAC. Sistema de Información Energética de Latinoamérica y el Caribe sieLAC. 2023. Available online: https://sielac.olade.org/ (accessed on 11 May 2023).
- Ministerio de Economía y Finanzas. Presupuesto General del Estado; Ministerio de Economía y Finanzas: Quito, Ecuador, 2020. [Google Scholar]
- Beteta, H.; Moreno-Brid, J.C. El desarrollo en las ideas de la CEPAL. J. Econ. Lit. 2012, 9, 76–90. [Google Scholar]
- Castro, P.; Castro, M.; Cunha, M. Análisis Comparativo de Indicadores Energéticos de Países Miembros de la Comunidad Andina de Naciones. Rev. Téc. Energ. 2018, 14, 236–245. [Google Scholar] [CrossRef]
- Fontaine, G. Petróleo y Desarrollo Sostenible en Ecuador: Las Apuestas; Flacso-Sede Ecuador: Quito, Ecuador, 2004. [Google Scholar]
- Chavez-Rodriguez, M.F.; Carvajal, P.E.; Jaramillo, J.E.M.; Egüez, A.; Mahecha, R.E.G.; Schaeffer, R.; Szklo, A.; Lucena, A.F.; Aramburo, S.A. Fuel saving strategies in the Andes: Long-term impacts for Peru, Colombia and Ecuador. Energy Strategy Rev. 2018, 20, 35–48. [Google Scholar] [CrossRef]
- Larrea, C. El Próximo Agotamiento de Petróleo en el Ecuador; Universidad Andina Simón Bolivar: Quito, Ecuador, 2022; Available online: https://repositorio.uasb.edu.ec/bitstream/10644/8948/1/Larrea%20C-CON-35-El%20proximo.pdf (accessed on 6 February 2023).
- Sbroiavacca, N.D.; Dubrovsky, H.; Nadal, G.; Lisperguer, R.C. Rol y Perspectivas del Gas Natural en la Transformación Energética de América Latina; CEPAL: Santiago, Chile, 2019; Available online: https://repositorio.cepal.org/bitstream/handle/11362/44596/1/S1801057_es.pdf (accessed on 24 April 2022).
- Orozco, M. La Planta de Bajo Alto se Hunde y Opera al 36% de su Capacidad; Primicias: Quito, Ecuador, 2023; Available online: https://www.primicias.ec/noticias/economia/planta-bajo-alto-gas-natural-corrupcion/ (accessed on 10 June 2023).
- Parra Aráuz, B.X. Análisis Histórico del Comportamiento de Presión de los Pozos del Campo Amistad. Bachelor’s Thesis, Escuela Politécnica Nacional, Quito, Ecuador, 2019. Available online: https://bibdigital.epn.edu.ec/handle/15000/20252 (accessed on 9 June 2023).
- Petroecuador. La Planta de Licuefacción de Gas Bajo Alto se hunde 70 cm—EP PETROECUADOR. Available online: https://www.eppetroecuador.ec/?p=6683 (accessed on 10 June 2023).
- Ministerio de Energía y Minas Ecuador, COMUNICADO OFICIAL. Sobre la Operatividad e Infraestructura Correspondiente a la Planta de Licuefacción de Gas Natural, Ubicada en Bajo Alto, Provincia de El Oro, esta Cartera de Estado Informa lo Siguiente. 2023. Available online: https://twitter.com/RecNaturalesEC/status/1654197091831369748 (accessed on 10 June 2023).
- Vollenweider, C. 20 Años de Dolarización en Ecuador: ¿es Sostenible? CELAG. 2019. Available online: https://www.celag.org/20-anos-dolarizacion-ecuador-es-sostenible/ (accessed on 24 May 2023).
- Cely Icaza, N.; José Calle, E. Examining the Foreign Trade dynamics of Ecuador under Dollarization using Ricardian Theories. J. Asia Pac. Stud. 2019, 5, 688–715. [Google Scholar]
- BCE. Comercio Exterior. 2023. Available online: https://www.bce.fin.ec/comercio-exterior (accessed on 11 May 2023).
- CEPAL. CEPALSTAT Bases de Datos y Publicaciones Estadísticas. 2023. Available online: https://statistics.cepal.org/portal/cepalstat/index.html?lang=es (accessed on 11 May 2023).
- CEPAL. Informe Nacional de Monitoreo de la Eficiencia Energética de la República del Ecuador. 2016. Available online: https://www.cepal.org/es/publicaciones/40474-informe-nacional-monitoreo-la-eficiencia-energetica-la-republica-ecuador-2016 (accessed on 23 March 2019).
- Urquiza, A.; Billi, M. Seguridad Hídrica y Energética en América Latina y el Caribe: Definición y Aproximación Territorial Para el Análisis de Brechas y Riesgos de la Población; CEPAL: Santiago, Chile, 2020; Available online: https://www.cepal.org/es/publicaciones/46408-seguridad-hidrica-energetica-america-latina-caribe-definicion-aproximacion (accessed on 10 September 2021).
- Fontaine, G. The effects of governance modes on the energy matrix of Andean countries. Energy Policy 2011, 39, 2888–2898. [Google Scholar] [CrossRef]
- CEPAL. Base de Información de Eficiencia Energética. 2021. Available online: https://biee-cepal.enerdata.net/en/datamapper/electricity-consumption-per-electrified-household.html (accessed on 29 March 2022).
- OLADE. Estrategia Para una América Latina y el Caribe Más Renovable; OLADE: Quito, Ecuador, 2023. [Google Scholar]
- SENAGUA. Boletín de la Estadística Sectorial del Agua; SENAGUA: Quito, Ecuador, 2017. [Google Scholar]
- IEA. Central & South America—Countries & Regions; IEA: Paris, France, 2022; Available online: https://www.iea.org/regions/central-south-america (accessed on 26 April 2023).
- NREL. Global Horizontal Solar Irradiance—America. 2018. Available online: https://www.nrel.gov/gis/assets/images/nsrdb-v3-ghi-2018-01.jpg (accessed on 3 July 2023).
- Calderón Loor, M.; Andrade, F.; Lizarzaburu, L.; Masache, M. Valoración Económica de los Cobeneficios del Aprovechamiento Energético de los Residuos Agrícolas en el Ecuador; CEPAL: Santiago, Chile, 2017; Available online: https://repositorio.cepal.org/bitstream/handle/11362/41830/1/S1700556_es.pdf (accessed on 23 March 2022).
- Diazgranados, L.; López, C.A.; Duque, J.E. Estado del Hidrógeno Verde en América Latina y El Caribe. 2022. Available online: https://h2lac.org/wp-content/uploads/2022/08/Infografia_Estado-H2-Verde-LAC_2022_GIZ_Hinicio_vf.pdf (accessed on 27 December 2022).
- Campos Canales, R.; Pérez, G. Tecnología y Recambio Energético en el Transporte Automotor de America Latina y el Caribe. 2019. Available online: https://bit.ly/3bkUVeo (accessed on 7 September 2019).
- Terneus Páez, C.F.; Viteri Salazar, O. Analysis of biofuel production in Ecuador from the perspective of the water-food-energy nexus. Energy Policy 2021, 157, 112496. [Google Scholar] [CrossRef]
- Petroecuador. Informe Estadístico Anual 2018. 2019. Available online: https://www.eppetroecuador.ec/wp-content/uploads/downloads/2019/12/INFORME-ESTAD%C3%8DSTICO-2018.pdf (accessed on 13 October 2020).
- EP Petroecuador. Geoportal EP PETROECUADOR. 2023. Available online: http://sig.eppetroecuador.ec/ (accessed on 10 July 2023).
- EKOS. Visitamos sistema GLP Monteverde-El Chorrillo. 2014. Available online: https://ekosnegocios.com/articulo/visitamos-a-sistema-de-glp-monteverde-chorrillo (accessed on 9 October 2023).
- Moreno, E.F.C. Portal Web Oficial de la Contraloría General del Estado del Ecuador. 2020. Available online: https://www.contraloria.gob.ec/CentralMedios/SalaPrensa/23912 (accessed on 8 September 2023).
- Zambrano, C.; Kovshov, S.; Lyubin, E. Assessment of anthropogenic factor of accident risk on the main oil pipeline Pascuales—Cuenca in Ecuador. J. Appl. Eng. Sci. 2018, 16, 307–312. [Google Scholar] [CrossRef]
- MEER. Plan Maestro de Electricidad 2016–2025. 2017. Available online: https://www.celec.gob.ec/hidroagoyan/index.php/plan-maestro-de-electricidad-2016-2025 (accessed on 25 April 2023).
- García-Garizábal, I.; Romero, P.; Jiménez, S.; Jordá, L. Evolución climática en la costa de Ecuador por efecto del cambio climático. DYNA 2017, 84, 37–44. [Google Scholar] [CrossRef]
- Valderrama Chávez, M.D.; Vásquez Granda, V.D.; León Baque, E.L.; Valderrama Chávez, M.D.; Vásquez Granda, V.D.; León Baque, E.L. Cambios en patrones de precipitación y temperatura en el Ecuador, región costa. Dilemas Contemp. Educ. Política Valores 2021. [Google Scholar] [CrossRef]
- Manciati, C.; Villacís, M.; Taupin, J.-D.; Cadier, E.; Galárraga-Sánchez, R.; Cáceres, B. Empirical mass balance modelling of South American tropical glaciers: Case study of Antisana volcano, Ecuador. Hydrol. Sci. J. 2014, 59, 1519–1535. [Google Scholar] [CrossRef]
- Veettil, B.K.; Leandro Bayer Maier, É.; Bremer, U.F.; De Souza, S.F. Combined influence of PDO and ENSO on northern Andean glaciers: A case study on the Cotopaxi ice-covered volcano, Ecuador. Clim. Dyn. 2014, 43, 3439–3448. [Google Scholar] [CrossRef]
- La Frenierre, J.; Mark, B.G. Detecting Patterns of Climate Change at Volcán Chimborazo, Ecuador, by Integrating Instrumental Data, Public Observations, and Glacier Change Analysis. Ann. Am. Assoc. Geogr. 2017, 107, 979–997. [Google Scholar] [CrossRef]
- Gallegos Castro, E.; Brito Chasiluisa, C.; Serrano Giné, D.; Galárraga Sánchez, R. Análisis de la Variación Temporal y Espacial de la Cobertura Glaciar del Nevado Cayambe, Ecuador, Mediante Fotografías Aéreas e Imágenes Landsat. GeoFocus Rev. Int. Cienc. Tecnol. Inf. Geogr. 2018, 22, 97–113. [Google Scholar] [CrossRef]
- Rhoades, R. Disappearance of the glacier on Mama Cotacachi: Ethnoecological research and climate change in the Ecuadorian Andes. Pirineos 2008, 163, 37–50. [Google Scholar] [CrossRef]
- del Jesús Peñil, M.; Paz, J.; Navas Fernández, S.; Turienzo, E.; Díez Sierra, J.; Peña, N. Efectos del cambio climático en el recurso hídrico de los países andinos. Ing. Agua 2020, 24, 219–233. [Google Scholar] [CrossRef]
- Hasan, M.M.; Wyseure, G. Impact of climate change on hydropower generation in Rio Jubones Basin, Ecuador. Water Sci. Eng. 2018, 11, 157–166. [Google Scholar] [CrossRef]
- Samaniego, J.; De Miguel, C.J.; Galindo, L.M.; Pereira, M.; Martínez, K. La Economía del Cambio Climático en el Ecuador, 2012; CEPAL: Santiago, Chile, 2013. [Google Scholar]
- IEA. Climate Impacts in Latin America Hydropower. 2022. Available online: https://iea.blob.core.windows.net/assets/8fa86b9d-470c-41a6-982e-70acd3fbdda4/ClimateImpactsonLatinAmericanHydropower_WEB.pdf (accessed on 24 April 2023).
- Zaballa Romero, M.; Jimenez Rivera, H.; Franken, V. Recomendaciones de Política Para el Sector Energético de América Latina y el Caribe en Apoyo a la Implementación de las NDCs; OLADE: Quito, Ecuador, 2017. [Google Scholar]
- CENACE. Revista CIER Sin Fronteras Para la Energía. 2017. Available online: https://biblioteca.olade.org/opac-tmpl/Documentos/hm000690.pdf (accessed on 27 June 2023).
- Ministerio de Energía y Recursos Naturales No Renovables. Plan Maestro de Electricidad 2018–2027; Ministerio de Energía y Recursos Naturales No Renovables: Quito, Ecuador, 2018. [Google Scholar]
- Fuentes, S.; Villafafila-Robles, R.; Rull-Duran, J.; Galceran-Arellano, S. Composed Index for the Evaluation of Energy Security in Power Systems within the Frame of Energy Transitions—The Case of Latin America and the Caribbean. Energies 2021, 14, 2467. [Google Scholar] [CrossRef]
- Canese, M. La Tarifa Social de la Energía en América Latina y El Caribe; OLADE: Quito, Ecuador, 2013. [Google Scholar]
- Contreras, R. Análisis de las Tarifas del Sector Eléctrico: Los Efectos del COVID-19 y la Integración Energética en los Casos de la Argentina, Chile, el Ecuador, México y el Uruguay; CEPAL: Quito, Ecuador, 2020. [Google Scholar]
- ARCERNNR. Difusión de Tarifas y Subsidios de Energía Eléctrica. 2022. Available online: https://www.ministeriodegobierno.gob.ec/wp-content/uploads/2022/12/11.-Difusio%CC%81n-de-tarifas-y-subsidios-de-energi%CC%81a-ele%CC%81ctrica-.pdf (accessed on 27 April 2023).
- ARCERNNR. Pliego Tarifario del Servicio Público de Energía Eléctrica; ARCERNNR: Quito, Ecuador, 2022; Available online: https://www.controlrecursosyenergia.gob.ec/wp-content/uploads/downloads/2022/05/Pliego-Tarifario-Servicio-Publico-de-Energia-Electrica_-Ano-2022.pdf (accessed on 27 April 2023).
- ARCERNNR. Informe de Sustento Proyecto Regulacion de Subsidios. 2020. Available online: https://www.controlrecursosyenergia.gob.ec/wp-content/uploads/downloads/2022/02/Informe-de-Sustento-Proyecto-Regulacion-de-Subsidios.pdf (accessed on 12 July 2023).
- Global Petrol Prices. Available online: https://www.globalpetrolprices.com/gasoline_prices (accessed on 24 March 2022).
- CEPAL. La Energía en América Latina y el Caribe: Acceso, Renovabilidad y Eficiencia. 2022. Available online: https://hdl.handle.net/11362/47924 (accessed on 17 April 2023).
- Jimenez, R.; Yépez, A. ¿Cómo consumen energía los hogares?: Evidencia en América Latina y el Caribe|Publications. 2020. Available online: https://publications.iadb.org/publications/spanish/document/Como-consumen-energia-los-hogares-Evidencia-en-America-Latina-y-el-Caribe.pdf (accessed on 19 February 2022).
- Amigo-Jorquera, C.; Guerrero-González, M.J.; Sannazzaro, J.; Urquiza-Gómez, A. Does energy poverty have a female face in Chile? Tapuya Lat. Am. Sci. Technol. Soc. 2019, 2, 378–390. [Google Scholar] [CrossRef]
- Escribano, G. Ecuador’s energy policy mix: Development versus conservation and nationalism with Chinese loans. Energy Policy 2013, 57, 152–159. [Google Scholar] [CrossRef]
- CONELEC. Estudio y Gestión de la Demanda Eléctrica; CONELEC: Las Condes, Chile, 2013. [Google Scholar]
- Espín, N. Focalización del Subsidio al Gas, Impacto Sobre la Demanda Eléctrica y Expansión del Sistema Nacional Interconectado; Pregrado; Escuela Politécnica Nacional: Quito, Ecuador, 2009; Available online: https://bibdigital.epn.edu.ec/bitstream/15000/11937/1/CAPITULO%201.pdf (accessed on 29 March 2023).
- Guamán, J.; García, M.; Guevara, D.; Ríos, A. Evaluación del Impacto Económico en Diferentes Escenarios de Implementación de Tecnologías Eficientes de Calentamiento de Agua en el Ecuador. Rev. Téc. Energ. 2016, 12, 270–283. [Google Scholar] [CrossRef]
- Weiss, W.; Spörk-Dür, M. Solar Heat Worldwide Edition 2022, Global Market Development and Trends 2021 Detailed Market Figures 2020. 2022. Available online: https://www.iea-shc.org/Data/Sites/1/publications/Solar-Heat-Worldwide-2022.pdf (accessed on 26 May 2023).
- IRENA. Leveraging Local Capacity for Solar Water Heaters. 2021. Available online: https://www.irena.org/-/media/Files/IRENA/Agency/Publication/2021/Jul/IRENA_Leveraging_solar_water_heaters_2021.pdf?rev=9deb58376dc048d18324fc6418cf5710 (accessed on 4 July 2023).
- Ministerio de Economía y Finanzas, Subsidios. Proforma Presupuestaria 2023. 2022. Available online: https://www.finanzas.gob.ec/wp-content/uploads/downloads/2022/10/Anexo-3_Subsidios-2023.pdf (accessed on 19 September 2023).
- Zambrano Choez, A.D.J.; Pionce Soledispa, M.E. La intervención de la administración pública en los subsidios de los combustibles del Ecuador. UNESUM-Cienc. Rev. Científica Multidiscip. 2023, 7, 85–102. [Google Scholar] [CrossRef]
- Castro, M. Hacia una Matriz Energética Diversificada en Ecuador; CEDA: Quito, Ecuador, 2011; Available online: https://biblioteca.olade.org/opac-tmpl/Documentos/cg00344.pdf (accessed on 1 October 2022).
- Matute, S.M.; Luzuriaga, L.P. Sostenibilidad de las finanzas públicas en la economía ecuatoriana 2001–2019. Bolentín Coyunt. 2020, 25, 34–40. [Google Scholar]
- Vallejo Carpio, C. Análisis de Intensidad Energética para los Sectores de Uso Final de la Economía Ecuatoriana; BCE: Quito, Ecuador, 2017; Volume 27, Available online: https://estudioseconomicos.bce.fin.ec/index.php/RevistaCE/article/view/59 (accessed on 29 July 2020).
- Espinoza, S.; Guayanlema, V. Balance y Proyecciones del Sistema de Subsidios Energéticos en Ecuador; Friedrich-Ebert-Stiftung Ecuador-Instituto Latinoamericano de Investigaciones Sociales: Quito, Ecuador, 2017. [Google Scholar]
- Puig Ventosa, I.; Martínez Sojo, A.; Córdova Vela, G.; Álvarez Rivera, P. Subsidios a los combustibles fósiles en ecuador: Diagnosos y opciones para su progresiva reducción. Rev. Iberoam. Econ. Ecol. 2018, 28, 87–106. [Google Scholar]
- Terneus Páez, C.F.; Guayanlema, V.; Cabrera Mera, A.G. Estimation of energy consumption due to the elimination of an environmental tax in Ecuador. Energy Sustain. Dev. 2022, 66, 92–100. [Google Scholar] [CrossRef]
- INRIX. Scorecard; INRIX: Kirkland, WA, USA, 2022; Available online: https://inrix.com/scorecard/ (accessed on 12 April 2023).
- Calatayud, A.; Sánchez González, S.; Bedoya Maya, F.; Giraldez Zúñiga, F.; Márquez, J.M. Congestión Urbana en América Latina y el Caribe: Características, Costos y Mitigación; Inter-American Development Bank: Washington, DC, USA, 2021; Available online: https://publications.iadb.org/es/congestion-urbana-en-america-latina-y-el-caribe-caracteristicas-costos-y-mitigacion (accessed on 12 April 2023).
- Ministerio Coordinador de la Producción Empleo y Competitividad. Los Subsidios Energéticos en el Ecuador. 2010. Available online: http://biblioteca.olade.org/opac-tmpl/Documentos/cg00149.pdf (accessed on 28 May 2021).
- Valencia, J. Canciller José Valencia en la Sesión Extraordinaria del Consejo Permanente de la OEA; Ministerio de Relaciones Exteriores y Movilidad Humana: Quito, Ecuador, 2019; Available online: https://www.cancilleria.gob.ec/wp-content/uploads/2019/10/oea_discurso.pdf (accessed on 20 October 2020).
- Donoso, C.V. I was working! Rev. Espaço Acad. 2019, 19. Available online: https://periodicos.uem.br/ojs/index.php/EspacoAcademico/article/view/47863 (accessed on 19 September 2023).
- Prado, F. Los culebrones de la noche: Estudio antropológico del comercio informal de combustible en Tumbes. Cienc. Desarro. 2012, 15, 87. [Google Scholar] [CrossRef]
- Oñate, S. Así es el Contrabando del Combustible en 6 Provincias del Ecuador; El Comercio: Quito, Ecuador, 2019; Available online: http://www.elcomercio.com/actualidad/contrabando-combustible-ecuador-frontera-negocio.html (accessed on 20 October 2020).
- Ruiz, G. Rutas fronterizas del contrabando en Ecuador. Perf. Criminol. 2015, 15, 5. [Google Scholar]
- Guerrero, E.F. Análisis del Contrabando de Combustible Como Crimen Organizado Transnacional. Caso de Estudio: Departamento de Nariño Frontera Terrestre Entre Colombia y Ecuador; Universidad Militar de Nueva Granada: Bogotá, Colombia, 2022; Available online: http://hdl.handle.net/10654/43970 (accessed on 11 July 2023).
- Parametría. El Pescador Artesanal Ecuatoriano Víctima del Narcotráfico; Parametría: Quito, Ecuador, 2019; Available online: https://parametria.org/el-pescador-artesanal-ecuatoriano-victima-del-narcotrafico/ (accessed on 26 March 2022).
- Torres, A. Narcos se Llevan la Gasolina Para Pesca Artesanal en Esmeraldas; Primicias: Quito, Ecuador, 2022; Available online: https://www.primicias.ec/noticias/en-exclusiva/gasolina-contrabando-pescadores-esmeraldas-narcotrafico-colombia/ (accessed on 27 December 2022).
- CEPAL y CAF. Energía: Una Visión Sobre los Retos y Oportunidades en América Latina y el Caribe; Corporacion Andina de Fomento: Caracas, Venezuela, 2013; p. 12. [Google Scholar]
- Asamblea Nacional del Ecuador. Ley Orgánica de Eficiencia Energética; Asamblea Nacional del Ecuador: Quito, Ecuador, 2019; Volume 449, Available online: https://www.recursosyenergia.gob.ec/wp-content/uploads/downloads/2019/03/Ley-Eficiencia-Energe%CC%81tica.pdf (accessed on 14 May 2022).
- Coviello, M.F.; Ruchansky, B. Avances en Materia de Energías Sostenibles en América Latina y el Caribe; CEPAL: Santiago, Chile, 2017; Available online: https://repositorio.cepal.org/bitstream/handle/11362/42552/1/S1701027_es.pdf (accessed on 14 January 2023).
- Lapillone, B. Monitoreando la eficiencia energética en América Latina; CEPAL: Santiago, Chile, 2016; Available online: https://www.cepal.org/es/publicaciones/40505-monitoreando-la-eficiencia-energetica-america-latina (accessed on 28 January 2021).
- Olmos, X. Sostenibilidad Ambiental de las Exportaciones Agroalimentarias; CEPAL: Santiago, Chile, 2017; Available online: https://www.cepal.org/sites/default/files/publication/files/43288/S1700618_es.pdf (accessed on 23 March 2022).
- FAO. Informe Nacional Sobre el Estado de la Biodiversidad Para la Alimentación y la Agricultura en el Ecuador. 2016. Available online: http://www.fao.org/3/CA3493ES/ca3493es.pdf (accessed on 13 February 2021).
- INEC. Boletín Técnico. Módulo de Información Agroambiental y Tecnificación Agropecuaria, Diciembre 2019. 2019. Available online: https://www.ecuadorencifras.gob.ec/documentos/web-inec/Encuestas_Ambientales/Modulo_Ambiental_ESPAC_2019/DOC_TEC_MOD_AGROAMB_2019_11.pdf (accessed on 14 March 2021).
- INEC. Módulo de Información Agroambiental y Tecnificación 2020. 2020. Available online: https://www.ecuadorencifras.gob.ec/documentos/web-inec/Encuestas_Ambientales/Modulo_Ambiental_ESPAC_2020/DOC_TEC_MOD_AMB-2020_08_19_4.pdf (accessed on 14 March 2021).
- Terneus Páez, C.F.; Viteri Salazar, O. The Water–Energy–Food Nexus: An Analysis of Food Sustainability in Ecuador. Resources 2022, 11, 90. [Google Scholar] [CrossRef]
- Avadí, A.; Bolaños, C.; Sandoval, I.; Ycaza, C. Life cycle assessment of Ecuadorian processed tuna. Int. J. Life Cycle Assess. 2015, 20, 1415–1428. [Google Scholar] [CrossRef]
- Boyd, C.E.; Davis, R.P.; Wilson, A.G.; Marcillo, F.; Brian, S.; McNevin, A.A. Uso de recursos en la cría de camarón blanco. J. World Aquac. Soc. 2021, 52, 772–788. [Google Scholar] [CrossRef]
- Troell, M.; Tyedmers, P.; Kautsky, N.; Rönnbäck, P. Aquaculture and Energy Use. Encycl. Energy 2004, 97–108. [Google Scholar] [CrossRef]
- Urresta, E. Eficiencia Energética en la Pesca Artesanal. 2021. Available online: http://www.eloriente.com/articulo/eficiencia-energetica-en-la-pesca-artesanal/16588 (accessed on 17 March 2022).
- Orozco, M. Gobierno Elimina Subsidio al Diésel Para Grandes Camaroneras; Primicias: Quito, Ecuador, 2022; Available online: https://www.primicias.ec/noticias/economia/gobierno-elimina-subsidio-diesel-camaroneras/ (accessed on 2 September 2023).
- Telégrafo. Presidente Lasso Anuncia la Eliminación del Subsidio al Diésel Camaronero Para un Sector de la Industria; El Telégrafo: Quito, Ecuador, 2022; Available online: https://www.eltelegrafo.com.ec/noticias/actualidad/44/presidente-lasso-anuncia-la-eliminacion-del-subsidio-al-diesel-camaronero-para-un-sector-de-la-industria (accessed on 4 September 2023).
- Eliminación del Subsidio al Diésel a Camaroneras sí Afecta a Pequeños y Medianos Productores, Asegura Gremio; El Universo: Quito, Ecuador, 2022; Available online: https://www.eluniverso.com/noticias/economia/eliminacion-del-subsidio-al-diesel-a-camaroneras-si-afecta-a-pequenos-y-medianos-productores-asegura-gremio-nota/ (accessed on 4 September 2023).
- Camaroneras y Minería Ilegal Estaría Comprando Diésel Subsidiado, Según Ministro de Energía. 2023. Available online: https://www.lahora.com.ec/pais/camaroneras-grandes-mineria-ilegal-estaria-comprando-diesel-subsidiado-segun-ministro-energia/ (accessed on 2 September 2023).
- The News. El Desvío y el Contrabando de Diésel solo se Solucionará con la Focalización del Subsidio, Pero la Decisión Quedará en Manos del Próximo Gobierno. The News Ecuador. 1 August 2023. Available online: https://thenews.ec/pais/el-desvio-y-el-contrabando-de-diesel-solo-se-solucionara-con-la-focalizacion-del-subsidio-pero-la-decision-quedara-en-manos-del-proximo-gobierno/ (accessed on 2 September 2023).
- Terneus Páez, C.F.; Viteri Salazar, O. Analysis of agro-food transport in Ecuador faced with a possible reduction in the subsidy of diesel. Energy Policy 2020, 144, 111713. [Google Scholar] [CrossRef]
- IEA y ICCT. Fuel Economy in Major Car Markets; IEA: Paris, France, 2019; Available online: https://bit.ly/2WuVMoN (accessed on 4 October 2019).
- Idler, A. The intersections of smuggling flows. In The Routledge Handbook of Smuggling, 1st; Gallien, M., Weigand, F., Eds.; Routledge: London, UK, 2021; pp. 286–300. [Google Scholar] [CrossRef]
- Donoso Moreno, C. Mujeres, Inequidad y Contrabando en las Fronteras Ecuatorianas. Estado Comunes 2017, 2, 119–134. [Google Scholar] [CrossRef]
- Viscidi, L. La energía del transporte: Un enfoque en el transporte urbano en América Latina; The Dialogue: Washington, WA, USA, 2017; p. 33. Available online: https://www.thedialogue.org/wp-content/uploads/2017/11/La-energia-del-transporte-en-America-Latina-1.pdf (accessed on 30 May 2020).
- Ministerio de Desarrollo Urbano y Vivienda. Informe Nacional. Tercera Conferencia de las Naciones Unidas Sobre la Vivienda y el Desarrollo Urbano Sostenible Habitat III. 2015. Available online: https://www.habitatyvivienda.gob.ec/wp-content/uploads/downloads/2017/05/Informe-Pais-Ecuador-Enero-2016_vf.pdf (accessed on 13 May 2023).
- Strojny, J.; Krakowiak-Bal, A.; Knaga, J.; Kacorzyk, P. Energy Security: A Conceptual Overview. Energies 2023, 16, 5042. [Google Scholar] [CrossRef]
- Sotnyk, I.; Kurbatova, T.; Kubatko, O.; Prokopenko, O.; Prause, G.; Kovalenko, Y.; Trypolska, G.; Pysmenna, U. Energy Security Assessment of Emerging Economies under Global and Local Challenges. Energies 2021, 14, 5860. [Google Scholar] [CrossRef]
- Naranjo, L.; Willaarts, B.A. Guía Metodológica: Diseño de Acciones con Enfoque del Nexo Entre Agua, Energía y Alimentación Para Países de América Latina y el Caribe; CEPAL: Santiago, Chile, 2020; Available online: https://www.cepal.org/es/publicaciones/46078-guia-metodologica-diseno-acciones-enfoque-nexo-agua-energia-alimentacion-paises (accessed on 14 September 2021).
- Von Hippel, D.; Savage, T.; Hayes, P. Introduction to the Asian Energy Security project: Project organization and methodologies. Energy Policy 2011, 39, 6712–6718. [Google Scholar] [CrossRef]
- Finer, M.; Jenkins, C.N.; Pimm, S.L.; Keane, B.; Ross, C. Oil and Gas Projects in the Western Amazon: Threats to Wilderness, Biodiversity, and Indigenous Peoples. PLoS ONE 2008, 3, e2932. [Google Scholar] [CrossRef] [PubMed]
- HAZ. Comunidades Indígenas Impiden a la Petrolera Argentina CGC Realizar sus Trabajos en Ecuador; Revista Haz: Madrid, Spain, 2005; Available online: https://hazrevista.org/rsc/2005/12/comunidades-indigenas-impiden-a-la-petrolera-argentina-cgc-realizar-sus-trabajos-en-ecuador/ (accessed on 13 July 2023).
- Silva, S. Ecuador Dice Pacta Fin Concesión Petrolera Argentina y de EEUU. 2010. Available online: https://www.reuters.com/article/petroleo-ecuador-contratos-idARN0522129920100205 (accessed on 13 July 2023).
- Ministerio de Relaciones Exteriores y Movilidad Humana. El Caso Chevron/Texaco en Ecuador Una lucha por la justicia Ambiental y Social. 2015. Available online: https://www.cancilleria.gob.ec/wp-content/uploads/2015/06/Expediente-Caso-Chevron-abril-2015.pdf (accessed on 13 July 2023).
- Martín, L.; Justo, J.B. Análisis, Prevención y Resolución de Conflictos por el Agua en América Latina y el Caribe; CEPAL: Santiago, Chile, 2015; Volume 171, Available online: https://hdl.handle.net/11362/37877 (accessed on 7 April 2023).
- Romero, R. La Nueva Subjetividad Social Campesina en el Ecuador de Inicios del Siglo XXI. El Caso del Proyecto Hidroeléctrico Angamarca-Sinde; Nómadas: Quito, Ecuador, 2010; Available online: https://www.redalyc.org/articulo.oa?id=18118913020 (accessed on 20 May 2023).
- Hidroabanico. Proyecto—Hidroabanico. 2021. Available online: https://hidroabanico.com.ec/proyecto/ (accessed on 6 May 2023).
- Ullauri, J.C. El Conflicto Socio Ambiental, Estudio de Caso de Proyecto Hidroeléctrico Hidroabanico y la Comunidad e Jimbitono en la Provincia de Morona Santiago; FLACSO: Quito, Ecuador, 2014; Available online: https://repositorio.flacsoandes.edu.ec/xmlui/handle/10469/7602 (accessed on 5 May 2023).
- ADITAL. Ecuador: Construcción de Hidroeléctricas Provoca Conflictos; Biodiversidad en América Latina. 2006. Available online: https://www.biodiversidadla.org/Principal/Prensa/Ecuador_construccion_de_hidroelectricas_provoca_conflictos (accessed on 5 May 2023).
- Morán, G. Estudio de la Comercialización del Arroz en las Provincias de Guayas y Los Ríos; Superintendencia de Control del Poder del Mercado: Guayaquil, Ecuador, 2017; Available online: https://www.scpm.gob.ec/sitio/wp-content/uploads/2019/03/Version-Publica-arroz-2.pdf (accessed on 2 November 2021).
- Paz, A. Ecuador: Justicia Falla a Favor de Indígenas Kichwa y su Defensa del río Piatúa; Mongabay: Cincinnati, OH, USA, 2019; Available online: https://es.mongabay.com/2019/09/hidroelectrica-en-pastaza-ecuador-rio-piatua-indigenas-kichwa/ (accessed on 9 May 2023).
- Velázquez, A.Q.R. Piatúa Case and the Free, Previous and Informed Consultation. A Vision from the Constitutionality. Available online: https://ia802807.us.archive.org/26/items/2020mester/2020%20mester%20Issue%201.-33-46.pdf (accessed on 9 May 2023).
- Ministerio del Ambiente. Acuerdo N°050. 2011. Available online: https://www.ambiente.gob.ec/wp-content/uploads/downloads/2012/10/Acuerdo-50-NCA.pdf (accessed on 26 June 2023).
- Ministerio del Ambiente. Agua y Transición Ecológica, Superficie Cubierta por Bosque; SINIAS: Quito, Ecuador, 2023; Available online: http://sinias.ambiente.gob.ec:8099/proyecto-sinias-web/estadisticasAmbientales.jsf?menu=01 (accessed on 26 June 2023).
- Ruiz, L. Amazonía Ecuatoriana. 2000. Available online: https://biblio.flacsoandes.edu.ec/libros/digital/43406.pdf (accessed on 26 June 2023).
- Camacho-López, C.O.; Carrión-Paqui, N.S.; Jaramillo-Villa, A.F. Análisis multitemporal de la deforestación y cambio de la cobertura del suelo en Zamora Chinchipe. Polo Conoc. 2021, 6. [Google Scholar]
- FAO. Organización de las Naciones Unidas para la Alimentación y la Agricultura: Ecuador en Una Mirada. 2019. Available online: https://www.fao.org/ecuador/fao-en-ecuador/ecuador-en-una-mirada/es/ (accessed on 5 February 2022).
- Foreign Agricultural Service. Palm Oil Explorer. 2023. Available online: https://ipad.fas.usda.gov/cropexplorer/cropview/commodityView.aspx?cropid=4243000 (accessed on 26 June 2023).
- Torres, B.; Fischer, R.; Vargas, J.; Günter, S. Deforestación en Paisajes Forestales Tropicales del Ecuador. 2020. Available online: http://inabio.biodiversidad.gob.ec/wp-content/uploads/2021/01/LAFORET_WEB.pdf (accessed on 26 June 2023).
- RAISG. Deforestación en la Amazonía al 2025. 2022. Available online: https://infoamazonia.org/wp-content/uploads/2023/03/DEFORESTACION-AMAZONIA-2025_21032023.pdf (accessed on 15 June 2023).
- Kleemann, J.; Zamora, C.; Villacis-Chiluisa, A.B.; Cuenca, P.; Koo, H.; Noh, J.K.; Fürst, C.; Thiel, M. Deforestation in Continental Ecuador with a Focus on Protected Areas. Land 2022, 11, 268. [Google Scholar] [CrossRef]
- Romero, D. Tres Posibles Escenarios en la Corte Constitucional para los Yasunidos; El Comercio: Quito, Ecuador, 2023; Available online: https://www.elcomercio.com/actualidad/politica/1247950.html (accessed on 15 June 2023).
- Allen, R.G. Parque Nacional Yasuní: Entre la explotación y la Conservación; Dialogo Chino: London, UK, 2022; Available online: https://dialogochino.net/es/actividades-extractivas-es/52121-parque-nacional-yasuni-entre-la-explotacion-y-la-conservacion/ (accessed on 15 June 2023).
- WWAP. The United Nations World Water Development Report 2014; UNESCO: Paris, France, 2014; Available online: https://unesdoc.unesco.org/ark:/48223/pf0000225741 (accessed on 29 October 2020).
- FAO (Ed.) Walking the Nexus Talk: Assessing the Water-Energy-Food Nexus in the Context of the Sustainable Energy for All Initiative; Environment and natural resources management working paper, no. 58; FAO: Rome, Italy, 2014. [Google Scholar]
- Campos, A.; Banda, R.; Sinichenko, K. Distribución per cápita del agua en el Ecuador. Rev. Científica Cienc. Nat. Ambient. 2016, 10, 29–36. [Google Scholar]
- ARCA. Boletín Estadístico 2021. 2021. Available online: http://www.regulacionagua.gob.ec/wp-content/uploads/downloads/2022/12/Boleti%CC%81n-estadi%CC%81stico-APS-2021_fn_v02.pdf (accessed on 24 June 2023).
- Morán, S. El Agua que no Preocupa a los Candidatos; Plan V: Quito, Ecuador, 2017; Available online: https://www.planv.com.ec/historias/sociedad/el-agua-que-no-preocupa-candidatos (accessed on 24 June 2023).
- Ekos. Se Promueve el Consumo Inteligente de Agua en Ecuador; Ekos Negocios: Quito, Ecuador, 2019; Available online: https://www.ekosnegocios.com/articulo/se-promueve-el-consumo-inteligente-de-agua-en-ecuador (accessed on 8 March 2022).
- Instituto Nacional de Estadística y Censos. Volumen Total de agua distribuida—GAD Municipales; Instituto Nacional de Estadística y Censos: Quito, Ecuador, 2021; Available online: https://www.ecuadorencifras.gob.ec/gad-municipales/ (accessed on 27 June 2023).
- Fernández, D.; Saravia Matus, S.; Gil, M. Políticas regulatorias y tarifarias en el sector de agua potable y saneamiento en América Latina y el Caribe. 2021. Available online: https://repositorio.cepal.org/bitstream/handle/11362/47131/1/S2100310_es.pdf (accessed on 19 September 2023).
- INEC. Información Ambiental en Hogares. 2012. Available online: https://www.ecuadorencifras.gob.ec/documentos/web-inec/Encuestas_Ambientales/Ambientales2012junio/Presentacio_Junio%202012.pdf (accessed on 1 March 2022).
- Agencia de Regulación y Control del Agua. Director Ejecutivo de ARCA Recorre Medios de Comunicación en Guayas y Santa Elena; Regulación Agua: Quito, Ecuador, 2017; Available online: http://www.regulacionagua.gob.ec/director-ejecutivo-de-arca-recorre-medios-de-comunicacion-en-guayas-y-santa-elena/ (accessed on 26 June 2023).
- SENAGUA. Estrategia Nacional de Calidad del Agua. 2016. Available online: https://www.controlsanitario.gob.ec/wp-content/uploads/downloads/2019/05/Estrategia-Nacional-de-Calidad-del-Agua_2016-2030.pdf (accessed on 29 July 2021).
- CISPDR. Plan Nacional de la Gestión Integrada e Integral de los Recursos Hídricos de las Cuencas y Microcuencas Hidrográficas de Ecuador. 2016. Available online: http://suia.ambiente.gob.ec/files/MEMORIA%20PLAN%20NACIONAL%20DEL%20AGUA.pdf (accessed on 8 December 2022).
- MAATE. Cuarta comunicación Nacional y Segundo Informe Bienal de actualización del Ecuador a la Convención Marco de las Naciones Unidas sobre el Cambio Climático; PNUD: New York, NY, USA, 2022; Available online: https://www.undp.org/es/ecuador/publicaciones/cuarta-comunicacion-nacional-y-segundo-informe-bienal-de-actualizacion-del-ecuador-la-convencion-marco-de-las-naciones-unidas (accessed on 19 September 2023).
- Ministerio del Ambiente, Agua y Transición Ecológica. Ecuador Suscribe Acuerdo de París Sobre Cambio Climático. 2016. Available online: https://www.ambiente.gob.ec/ecuador-suscribe-acuerdo-de-paris-sobre-cambio-climatico/ (accessed on 26 June 2023).
- Ministerio del Ambiente, Agua y Transición Ecológica. Plan Nacional de Adaptación al Cambio Climático. 2023. Available online: https://www.adaptacioncc.com/sites/default/files/2023-03/PNA%202022%20Ecuador.pdf (accessed on 26 June 2023).
- Haro, L. Factor de Emision de CO2 del Sistema Nacional Interconectado de Ecuador 2021; CENACE: Quito, Ecuador, 2022; Available online: https://www.controlrecursosyenergia.gob.ec/wp-content/uploads/downloads/2022/12/Factor-de-emision-de-CO2-del-Sistema-Nacional-Interconectado-de-Ecuador-Informe-2021-2.pdf (accessed on 27 April 2023).
- SIELAC. Generación Eléctrica por Fuentes. 2021. Available online: https://sielac.olade.org/default.aspx (accessed on 26 June 2023).
- Muentes, K.; Pereira, J.; Rivadeneira, R.; Moreira, C. Factores Determinantes de las Emisiones de CO2 en los Sectores Industrial y Transporte en Ecuador. 2022. Available online: https://revistas.ug.edu.ec/index.php/cna/article/view/1867/2667 (accessed on 26 June 2023).
- MIT Technology Review Insights. The Green Future Index 2023; MIT Technology Review Insights: Cambridge, MA, USA, 2023; Available online: https://mittrinsights.s3.amazonaws.com/GFI23report.pdf (accessed on 12 May 2023).
- Ministerio del Ambiente, Agua y Transición Ecológica. Concentración Promedio Anual de Dióxido de Azufre (SO2) en el Aire. 2018. Available online: http://sinias.ambiente.gob.ec:8099/proyecto-sinias-web/start.jsf (accessed on 26 June 2023).
- Núñez, L. Edición Especial No 387—Registro Oficial Norma de Calidad del Aire y Ambiente. 2015. Available online: https://www.gob.ec/sites/default/files/regulations/2018-09/Documento_Registro-Oficial-No-387-04-noviembre-2015_0.pdf (accessed on 19 September 2023).
- The World Bank. Worldwide Governance Indicators|DataBank. 2023. Available online: https://databank.worldbank.org/source/worldwide-governance-indicators (accessed on 21 June 2023).
- Escribano, G. Ecuador y los Subsidios a los Combustibles; Real Instituto Elcano: Madrid, Spain, 2019; Available online: https://www.realinstitutoelcano.org/analisis/ecuador-y-los-subsidios-a-los-combustibles/ (accessed on 3 July 2023).
- Yáñez, E. Hablan los Indígenas de Ecuador: Victoria sí, Pero ni Olvido ni Perdón; Vice: Brooklyn, NY, USA, 2019; Available online: https://www.vice.com/es/article/mbmk5y/hablan-los-indigenas-de-ecuador-victoria-si-pero-ni-olvido-ni-perdon (accessed on 21 May 2023).
- PNUD. El costo de la vida, sube otra vez” | Programa De Las Naciones Unidas Para El Desarrollo; UNDP: New York, NY, USA, 2023; Available online: https://www.undp.org/es/latin-america/blog/el-costo-de-la-vida-sube-otra-vez (accessed on 10 October 2023).


| Name | Year | Province | River | Power (MW) |
|---|---|---|---|---|
| Pucará | 1977 | Tungurahua | Yanayacu | 70 |
| Paute-Molino | 1983 | Morona Santiago | Paute | 1100 |
| Agoyán | 1987 | Tungurahua | Pastaza | 156 |
| Marcel Laniado | 1999 | Guayas | Daule | 213 |
| San Francisco | 2004 | Tungurahua | Pastaza | 230 |
| Mazar | 2015 | Cañar | Mazar | 170 |
| Manduriacu | 2015 | Imbabura–Pichincha | Guayllabamba | 65 |
| Sopladora | 2016 | Azuay–Morona Santiago | Paute | 487 |
| Coca Codo Sinclair | 2016 | Napo | Coca | 1500 |
| Delsitanisagua | 2018 | Zamora | Zamora | 180 |
| Minas-San Francisco | 2019 | Azuay–El Oro | Jubones | 275 |
| Diesel | Gasoline | LPG | |
|---|---|---|---|
| % | |||
| Transport | 83.0 | 82.3 | 1.0 |
| Industry | 12.4 | 0.7 | 7.3 |
| Commercial | 2.7 | - | 4.2 |
| Residential | - | - | 70.4 |
| Agriculture, fishing and mining | - | 3.5 | 1.9 |
| Others | 1.9 | 13.3 | 15.2 |
| Annual change in total demand | 1.8 | 2.3 | 2.3 |
| Imports | 69.5 | 60.9 | 88.0 |
| Annual variations in imports | 4.5 | 3.6 | 3.2 |
| Name | Province | Power (MW) |
|---|---|---|
| Jaramijó | Manabí | 149.2 |
| Gonzalo Zeballos Foil | Guayas | 146.0 |
| Machala Gas | El Oro | 138.6 |
| Machala Gas 2 | El Oro | 136.8 |
| Esmeraldas | Esmeraldas | 132.5 |
| Trinitaria | Guayas | 133.0 |
| Edén Yuturi | Orellana | 119.6 |
| Anibal Santos | Guayas | 113.3 |
| Enrique García | Guayas | 102.0 |
| Esmeraldas 2 | Esmeraldas | 96.0 |
| Santa Elena 2 | Santa Elena | 90.1 |
| Santa Rosa | Pichincha | 71.1 |
| Quevedo 2 | Los Ríos | 47.6 |
| Sistemas Insulares | Galápagos | 24.3 |
| Dimension | Indicator |
|---|---|
| Availability | Per capita primary energy supply and final energy consumption |
| Scope of proven oil and gas reserves | |
| Energy self-sufficiency | |
| Diversification | |
| Renewability in the primary supply | |
| Dependence on petroleum derivatives for transportation | |
| Infrastructure | Fuel infrastructure |
| Hydroelectric infrastructure | |
| Energy prices | Liquefied petroleum gas priceElectricity energy price |
| Gasoline and diesel prices | |
| Efficiency | Energy intensity |
| Sectoral energy intensity | |
| Efficiency indicators in transportation | |
| Electrical losses | |
| Social impact | Electric coverage |
| Environment | Forest coverage |
| Water availability | |
| Per capita carbon dioxide emissions | |
| Per capita sulfur dioxide emissions | |
| Governance | Worldwide governance rating |
| Primary Energy Supply per Capita | Final Energy Consumption per Capita | |||
|---|---|---|---|---|
| Average 2021 | Annual Variation 2011–2021 | Average 2021 | Annual Variation 2011–2021 | |
| Toe/Capita | % | Toe/103 Capita | ||
| Bolivia | 0.75 | 1.2 | 595.06 | 1.8 |
| Colombia | 0.89 | 0.1 | 653.37 | 0.4 |
| Ecuador | 0.88 | −0.5 | 742.99 | 0.4 |
| Peru | 0.72 | 0.1 | 605.14 | −0.1 |
| Andean zone | 0.84 | −2.9 | 618.04 | −3.1 |
| LAC | 1.22 | −1.2 | 912.01 | −0.9 |
| Oil | Natural Gas | |||
|---|---|---|---|---|
| Average 2021 | Annual Variation 2011–2021 | Average 2021 | Annual Variation 2011–2021 | |
| Years | % | Years | % | |
| Bolivia | 12.75 | −2.0 | 14.94 | −1.3 |
| Colombia | 6.76 | 0.0 | 4.42 | −1.1 |
| Ecuador | 7.70 | −8,8 | 3.03 | −0.1 |
| Peru | 8.01 | −3.5 | 15.31 | −4.2 |
| Energy Sufficiency | Foreign Energy Dependence | |||
|---|---|---|---|---|
| Average 2021 | Annual Variation 2011–2021 | Average 2021 | Annual Variation 2011–2021 | |
| % | % | % | ||
| Bolivia | 1.97 | −2.4 | −97.47 | −4.2 |
| Colombia | 2.27 | −4.6 | −139.58 | −4.7 |
| Ecuador | 1.79 | −1.1 | −78.67 | −2.3 |
| Peru | 1.27 | −0.2 | −15.28 | 8.8 |
| Andean zone | 1.99 | −3.4 | −101.67 | −5.0 |
| LAC | 1.12 | −1.5 | −5.76 | −14.0 |
| SWI (Average 2021) | |
|---|---|
| Bolivia | 1.15 |
| Colombia | 1.56 |
| Ecuador | 0.88 |
| Peru | 1.56 |
| Venezuela | 1.07 |
| LAC | 1.77 |
| Andean zone | 1.43 |
| Renewability Index | ||
|---|---|---|
| Average | Annual Variation 2010–2021 | |
| % | % | |
| Bolivia | 14.71 | −0.7 |
| Colombia | 25.00 | −1.6 |
| Ecuador | 17.45 | 4.6 |
| Peru | 28.78 | 0.4 |
| Andean zone | 22.78 | 1.3 |
| LAC | 29.84 | 1.6 |
| Percentage of Renewables | Hydroelectric Dependency | |||
|---|---|---|---|---|
| Average | Annual Variation 2011–2021 | Average | Annual Variation 2011–2021 | |
| % | % | % | % | |
| Bolivia | 38.25 | 1.1 | 21 | 1.2 |
| Colombia | 83.42 | 0.0 | 53 | 0.3 |
| Ecuador | 81.00 | 3.8 | 80 | 2.0 |
| Peru | 61.17 | 0.8 | 50 | 2.2 |
| LAC | 58.97 | −0.2 | 26 | −2.8 |
| Andean zone | 75.46 | 1.1 | 62 | 0.0 |
| Electricity | |
|---|---|
| Tariff 2021 | |
| USD/KWh | |
| Bolivia | 0.09 |
| Colombia | 0.15 |
| Ecuador | 0.10 |
| Peru | 0.16 |
| Venezuela | 0.04 |
| Andean zone | 0.11 |
| LAC | 0.16 |
| LPG | Firewood Consumption | ||
|---|---|---|---|
| Price 2021 | Average 2021 | Annual Variation 2011–2021 | |
| USD/bbl | Ton/Capita | % | |
| Bolivia | 28.39 (2015) | 0.02 | −6.70 |
| Colombia | 98.38 (2015) | 0.12 | −3.42 |
| Ecuador | 27.53 (2023) | 0.03 | −6.70 |
| Peru | 101.61 (2015) | 0.16 | −3.97 |
| Venezuela | 12.71 (2011) | 0.01 | −10.40 |
| Andean zone | 53.72 | 0.09 | −3.61 |
| LAC | 109.00 | 0.23 | 0.00 |
| Primary | Final | |||
|---|---|---|---|---|
| Average 2021 | Annual Variation 2011–2021 | Average 2021 | Annual Variation 2011–2021 | |
| Koe/USD2011PPA | % | Koe/USD2011PPA | % | |
| Bolivia | 0.09 | −0.6 | 0.07 | 0.0 |
| Colombia | 0.06 | −1.5 | 0.04 | −1.2 |
| Ecuador | 0.08 | −0.2 | 0.07 | 0.7 |
| Peru | 0.06 | −1.7 | 0.05 | −1.9 |
| LAC | 0.08 | −1.2 | 0.06 | −0.9 |
| Andean zone | 0.07 | −2.5 | 0.05 | −2.6 |
| Sector | Diesel (KBOE) | Gasoline (KBOE) |
|---|---|---|
| Shrimp | 2062 | 28 |
| Tuna | 1083 | 1 |
| Other fisheries | 454 | 0 |
| Artisanal fisheries | 0 | 1005 a |
| Total | 3599 | 1033 |
| Energy Consumption per Vehicle 2018 | Transportation Energy Consumption per Capita 2018 | |||
|---|---|---|---|---|
| Average | Annual Variation 2010–2018 | Average | Annual Variation 2010–2018 | |
| Toe/Eq-Car | % | Toe/Capita | % | |
| Bolivia | 1.06 | 2.7 | 0.33 | 4.8 |
| Colombia | 1.10 | 0.2 | 0.25 | 3.2 |
| Ecuador | 1.76 | 0.5 | 0.43 | 3.4 |
| Peru | 1.16 | 0.4 | 0.27 | 4.9 |
| Average | Annual Variation 2010–2021 | |
|---|---|---|
| % | % | |
| Bolivia | 9 | −2.5 |
| Colombia | 6 | −6.6 |
| Ecuador | 14 | −2.1 |
| Peru | 12 | 2.0 |
| Venezuela | 19 | −4.1 |
| Andean zone | 12 | −5.0 |
| LAC | 13 | −1.6 |
| Average 2021 | Annual Variation 2011–2021 | |
|---|---|---|
| % | % | |
| Bolivia | 94.10 | 1.56 |
| Colombia | 96.81 | 0.11 |
| Ecuador | 97.29 | 0.13 |
| Peru | 97.00 | 1.39 |
| Venezuela | 99.00 | 0.01 |
| Andean zone | 96.84 | 0.61 |
| LAC | 95.02 | 0.54 |
| Tons of CO2/Capita | Tons of CO2/1000 USD GDP | |
|---|---|---|
| Bolivia | 1.94 | 546.29 |
| Colombia | 1.61 | 250.81 |
| Ecuador | 2.26 | 363.46 |
| Peru | 1.75 | 248.53 |
| LAC | 2.53 | 289.74 |
| Ecuador | Colombia | Peru | LAC | ||
|---|---|---|---|---|---|
| Policy | Voice and accountability | 0.1 | 0.1 | 0.2 | 0.1 |
| Political stability | −0.3 | −0.9 | −0.4 | −0.1 | |
| Economic | Government effectiveness | −0.2 | 0.0 | −0.3 | −0.4 |
| Regulatory quality | −0.7 | 0.2 | 0.1 | −0.3 | |
| Institutional | Rule of law | −0.3 | −0.5 | −0.5 | −0.5 |
| Control of corruption | −0.6 | −0.3 | −0.6 | −0.4 |
Disclaimer/Publisher’s Note: The statements, opinions and data contained in all publications are solely those of the individual author(s) and contributor(s) and not of MDPI and/or the editor(s). MDPI and/or the editor(s) disclaim responsibility for any injury to people or property resulting from any ideas, methods, instructions or products referred to in the content. |
© 2023 by the authors. Licensee MDPI, Basel, Switzerland. This article is an open access article distributed under the terms and conditions of the Creative Commons Attribution (CC BY) license (https://creativecommons.org/licenses/by/4.0/).
Share and Cite
Terneus-Páez, C.F.; Viteri-Salazar, O. Energy Security in Ecuador: An Analysis Considering the Interrelationships of the WEF Nexus. Energies 2023, 16, 7166. https://doi.org/10.3390/en16207166
Terneus-Páez CF, Viteri-Salazar O. Energy Security in Ecuador: An Analysis Considering the Interrelationships of the WEF Nexus. Energies. 2023; 16(20):7166. https://doi.org/10.3390/en16207166
Chicago/Turabian StyleTerneus-Páez, Carlos Francisco, and Oswaldo Viteri-Salazar. 2023. "Energy Security in Ecuador: An Analysis Considering the Interrelationships of the WEF Nexus" Energies 16, no. 20: 7166. https://doi.org/10.3390/en16207166
APA StyleTerneus-Páez, C. F., & Viteri-Salazar, O. (2023). Energy Security in Ecuador: An Analysis Considering the Interrelationships of the WEF Nexus. Energies, 16(20), 7166. https://doi.org/10.3390/en16207166