Article

Comprehensive Characterization of Energy Saving and Environmental Benefits of Campus Photovoltaic Buildings

1
School of Petroleum Engineering, Changzhou University, Changzhou 233016, China
2
College of Civil Engineering, Hunan University, Changsha 410082, China
3
Department of Chemical Engineering, University College London, London WC1E 6BT, UK
4
College of Civil Engineering, Jiangsu Urban and Rural Construction College, Changzhou 213147, China
*
Authors to whom correspondence should be addressed.
Energies 2023, 16(20), 7152; https://doi.org/10.3390/en16207152
Submission received: 14 August 2023 / Revised: 16 October 2023 / Accepted: 17 October 2023 / Published: 19 October 2023
(This article belongs to the Special Issue Sustainable Heating and Cooling Technologies for Low-Carbon Buildings)

Abstract

:
The development of campus photovoltaic buildings is a promising way to solve the problem of high energy consumption in colleges and universities. However, comprehensive study on their energy saving and environmental benefits is still insufficient. In this study, a theoretical model of a photovoltaic building roof system was preliminarily built, and the main factors affecting the power generation of campus photovoltaic buildings were analyzed. Furthermore, an experimental test platform for the campus photovoltaic building system was built, and a dynamic grid-connected strategy of “spontaneous self-use, surplus electricity connected to the grid” was creatively proposed, which points out that the grid connection rate in winter and summer vacations are about 15% and over 40%, respectively, and the annual grid connection rate is 25%. The result shows that the electricity input of the campus photovoltaic building can bear nearly 30% of the school’s annual electricity supply, which reduces the comprehensive energy consumption per unit area and per capita comprehensive energy consumption of the campus by more than 20%. The economic and environmental benefits of the 130,000 square meter campus photovoltaic building in the article are 38.8 million CNY and 20.12 million CNY, respectively, and the static investment payback period is about 7 years. The results show considerable reference value to the upgrading of campus photovoltaic buildings.

1. Introduction

With the intensification of global warming since beginning of the 21st century, fossil energy has gradually exposed the problems of limited resources and serious environmental pollution. Driven by the growth in energy demand, it is urgently needed to utilize more green energy. During the transformation of the world energy structure, solar energy is increasingly showing its distinctive advantages with its environmental protection and safety advantages [1,2,3]. University campuses are often made up of large buildings that are responsible for high energy consumption. At the same time, universities face several challenges due to shrinking budgets and rising energy costs. Implementing energy efficiency programs and installing renewable energy generation technologies not only reduces primary energy consumption, costs and resources, but also greenhouse gas emissions [4,5,6].
As one of the most significant application forms of building energy conservation, the development of solar buildings has become increasingly mature in recent years. Building energy consumption accounts for about 30% of the total energy consumption of the whole society [7,8]. Therefore, reducing the building load and creating green energy-saving buildings have become the research and development goals of domestic and foreign scholars. This kind of building mainly exists in the form of combining photovoltaic modules with building roof, curtain wall, windows and other building façades [9,10,11]. Wu et al. [12] proposed a new, multifunctional photovoltaic wall, which can achieve solar heating, ventilation, and air purification. The study found that the ambient temperature and solar radiation have certain impacts on the ventilation and thermal efficiency. J. Peng et al. [13] found that the photovoltaic walls can reduce heat absorption by about half in summer and reduce heat loss by about 30% in winter through experiments. The high integration of flat-plate solar collectors and shutters can not only provide heat and electricity to the building, but also have the effect of shading [14]. The use of hydrogenated amorphous silicon in translucent thin-film solar cells can improve their photoelectric performance, which is crucial for the application of dual photovoltaic window systems [15]. S. Yadav et al. [16] integrated the photovoltaic module with the roof system of the building and obtained the best tilt angle of the building integrated photovoltaic (BIPV) panel by measuring the thermal performance of the photovoltaic roof under different light conditions. N. Shao et al. [17] evaluated the thermal performance and electrical performance of a photovoltaic roof attached to the outer surface of a building and proved that it can significantly reduce the cooling and heating load during the day and night. Moreover, the modern photovoltaic buildings can also couple phase change materials to reduce photovoltaic waste heat and improve the overall efficiency of BIPV [18,19].
Compared with conventional building attached photovoltaic (BAPV), which is the most used structural installation methods of solar buildings, BIPV integrates photovoltaic structure into the building or replaces a building structure, and thus is also known as a photovoltaic building integration. Namely, BAPV is only an additional component of the building, and the photovoltaic structure will not change the original function and structure of the building [20,21]. It can be found that BAPV has increased the building load to a certain extent and seriously wasted building materials. On the contrary, BIPV has a certain degree of aesthetics and integrity, which can create a continuous visual effect, makes full use of the building shape and space and greatly saves land resources [22]. Today, solar-integrated buildings are developing towards the concept of passive smart photovoltaics in pursuit of zero energy consumption in buildings [23]. C. Toledo et al. [24] conducted research on the thermal characteristics of BIPV buildings when generating electricity and discussed factors such as ambient temperature and photovoltaic module materials. As the vacuum system can reduce the heat loss of BIPV and produce clean electricity, A. Ghosh et al. [25] analyzed and evaluated the environmental benefits of a vacuum photovoltaic glass window and found that double-layer translucent photovoltaic windows can effectively reduce ventilation, enhance internal circulation and save electricity in cold areas [26]. M. Fossa al. [27] analyzed the thermal behavior of double-layer photovoltaic walls under different separation distances and heating configurations, so as to improve the conversion efficiency of BIPV buildings on a basis. By investigating the energy payback period and greenhouse gas payback period of the photovoltaic building grid-connected system, it can be known that the sustainability of BIPV technology application is affected by the installation position and direction of photovoltaic modules [28].
BIPV systems can not only repay the initial investment in the life cycle, but also profit for the construction, which has great economic value [29]. Along with the continuous development of modern BIPV, the accurate consideration of its economic and environmental benefits becomes increasingly critical. M. J. Sorgato et al. [30] proved that the application of photovoltaic modules in buildings can not only meet the energy demand of office buildings, but also have certain economic benefits. Photovoltaic energy storage systems have made great contribution to improving the economic and environmental benefits of residential buildings [31]. M. Lee et al. [32] developed a photovoltaic roof rating system based on applicability standards to reasonably evaluate its economic performance. According to the research results, appropriate grid power supply restrictions can increase the technical and economic performance of the BIPV system [33]. Compared with traditional building materials, the use of photovoltaic modules can meet their own energy needs and has the potential for sustainable development [34]. In terms of the popularization and application of campus photovoltaic buildings, J. Lee et al. [35] evaluated the economic feasibility of the New England campus photovoltaic system based on actual data on local retail electricity prices and campus photovoltaic production. Taking the University of Jaen as a case, D. L. Talavera et al. [36] analyzed the economics and costs of multiple photovoltaic systems on campus, and calculated the discounted payback period, internal rate of return, and initial investment cost.
Due to the strong publicity function of the campus to the society and the high resource consumption of colleges and universities, there is an urgent need to build a new type of green campus that is energy saving and environmentally friendly. To a certain extent, the use of photovoltaic buildings on campus can effectively reduce the grid-connected power use and participate in the cooling and heating load adjustment of the building. Due to the holiday factor, the building load and the actual energy consumption of campus buildings are very different, so it is necessary to study the dynamic grid-connected strategy of photovoltaic power generation. Therefore, the practical application of campus photovoltaic buildings is of great significance to the construction and promotion of green campuses. However, the existing studies rarely emphasize the large-scale application of the coupling of photovoltaic modules and buildings in campuses. In this paper, the main factors that affect the power generation of photovoltaic buildings were analyzed, and a corresponding experimental test platform was built. On this basis, the annual power generation of campus photovoltaic buildings was counted, the campus energy consumption was analyzed, and the impacts of building power generation on the building energy consumption per unit area of the campus and the comprehensive energy consumption per capita were studied. Finally, an economic analysis was carried out, and the environmental benefits obtained from the application of photovoltaic buildings were explained.

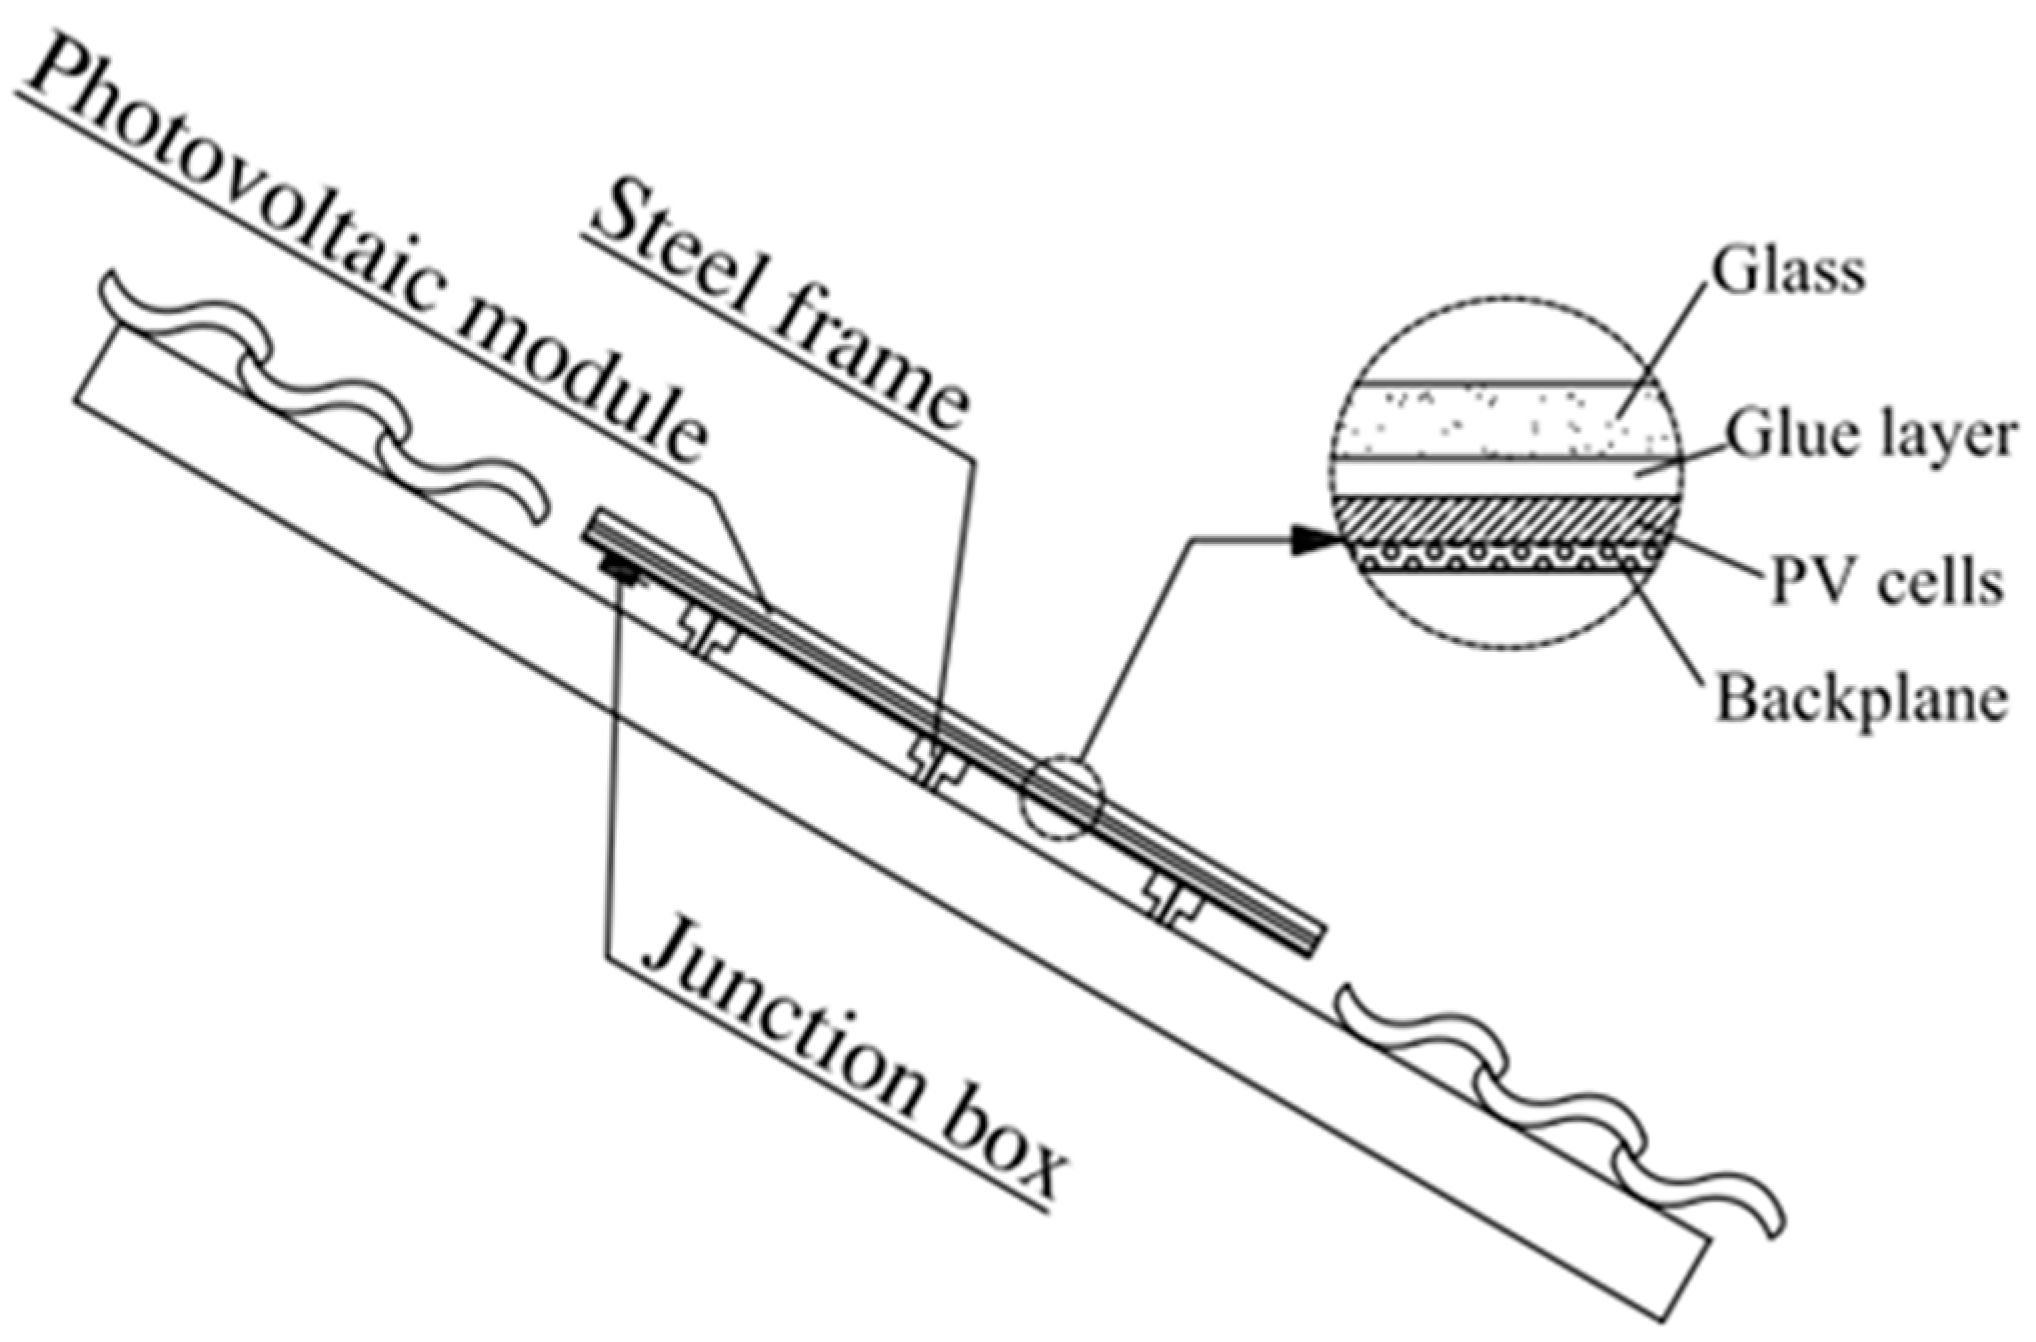
2. Description of Campus Photovoltaic Buildings

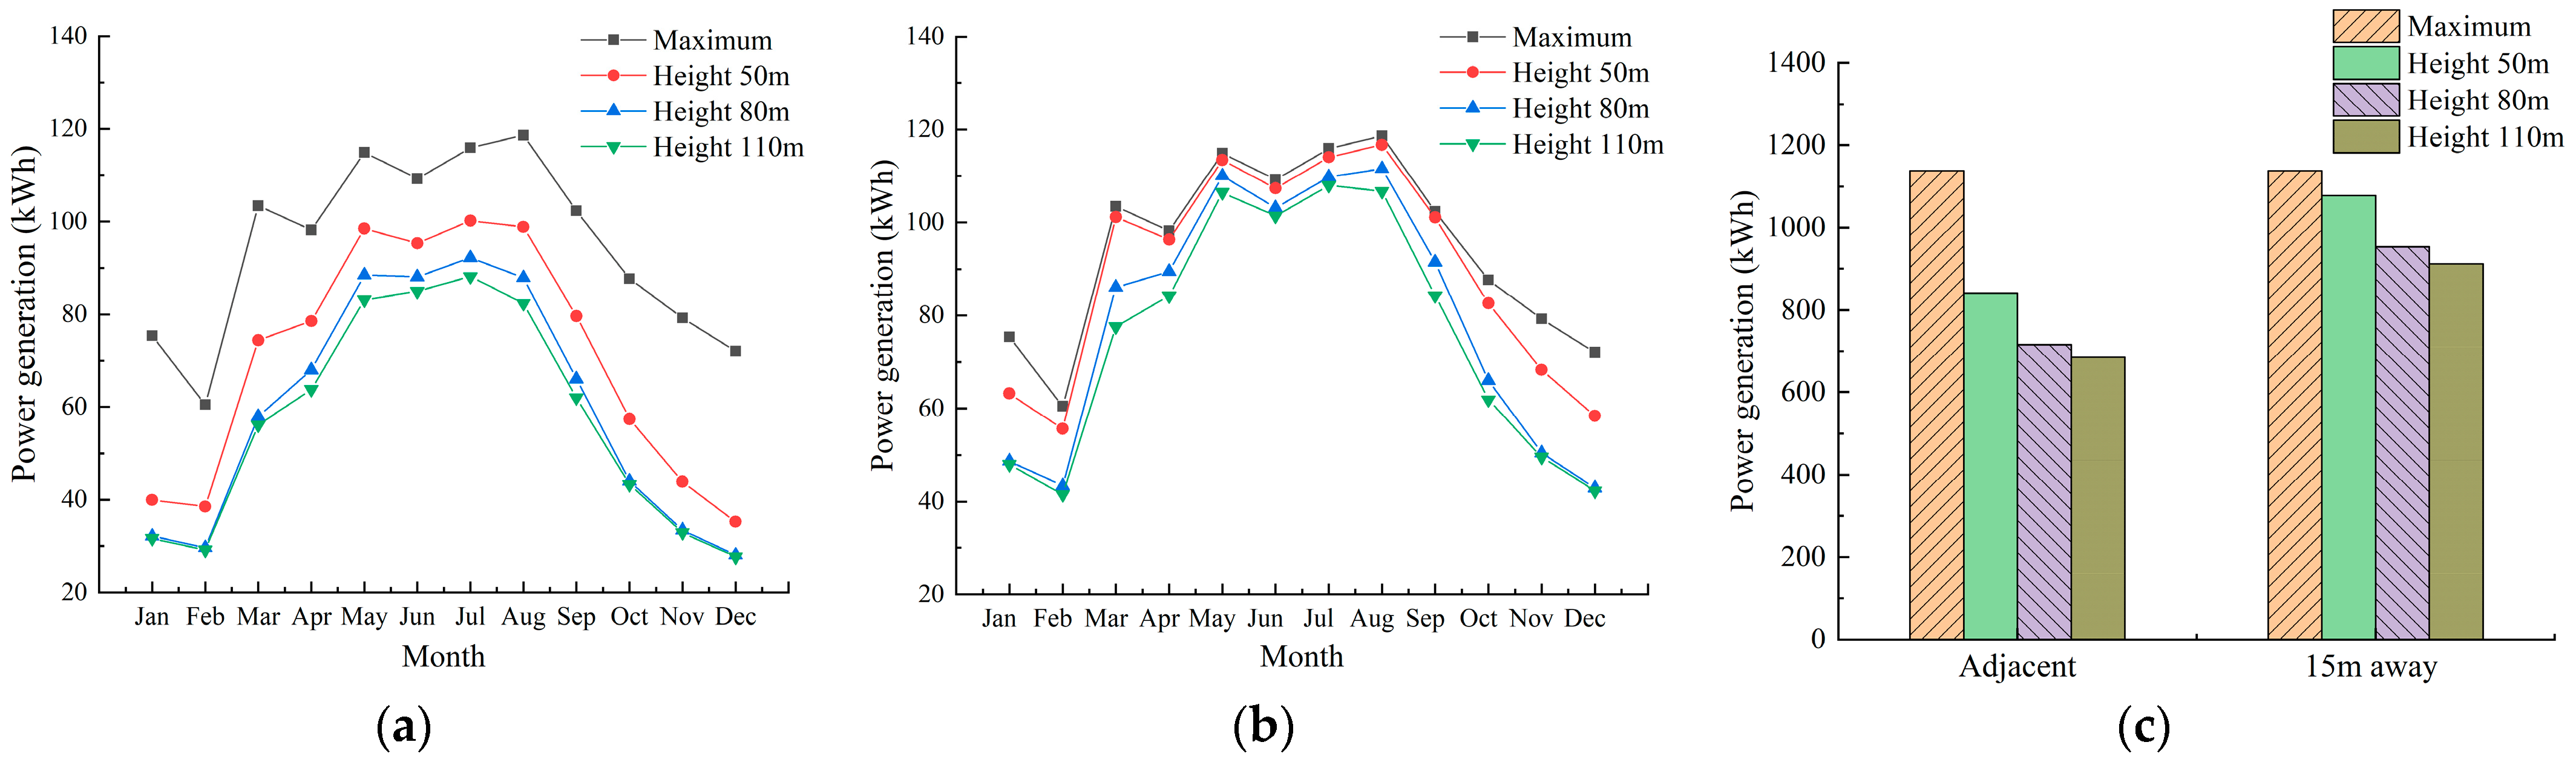
2.1. Analysis of Factors Affecting Photovoltaic Power Generation

The model diagram of the photovoltaic roof system is shown in Figure 1, and the energy transfer of each layer of photovoltaic panels is shown in Figure 2, where E is the electrical energy, Qr is the radiant energy, Qd is the heat conduction energy, and Qc is the convective heat transfer energy. According to the model of photovoltaic building roof system, the mathematical heat transfer model of each layer is established according to the energy conservation equation as follows, and then the main influencing factors of campus photovoltaic building power generation revenue is analyzed.
The energy conservation analysis of the glass layer is as follows:
M g C g d T g d t = A g σ ε T s 4 T g 4 + h a g A g T a T g + A g β g G h g l A g T g T l
where Mg is the mass of glass, kg. Cg is the specific heat capacity of glass, J/(kg·K). Ag is the area of the glass, m2. σ is the black body radiation constant, and ε is the emissivity of the glass. Ts is the temperature of sky, K. Tg is the temperature of glass, K. Ta is the ambient temperature, K. Tl is the temperature of the glue layer, K. ha−g is the convective heat transfer coefficient between the environment and the glass, W/(m2·K). hg−l is the heat transfer coefficient between backplane and the ambience, W/(m2·K). βg is the absorption rate of glass. G is the radiation intensity, W/m2.
The thermal conductivity [37] between the glass layer and the glue layer is calculated as follows:
h g l = 1 / δ g λ g + δ l λ l
where δg is the thickness of the glass, m. λg is the thermal conductivity of glass, W/(m·K). δl is the thickness of the glue layer, m. λl is the thermal conductivity of the adhesive layer, W/(m·K).
For the convective heat transfer coefficient [38] between the environment and the glass, the following formula can be used:
h a g = 3.8 V + 5.7
where V is the ambient wind speed, m/s.
For the calculation between sky temperature and ambient temperature [39], the following formula can be used:
T s = 0.0552 T a 1.5
The energy conservation equation of the glue layer is as follows:
M l C l d T l d t = A l h g l T g T l + A l τ g β l G A l h l c T l T c
where Ml is the mass of the adhesive layer, kg. Cl is the specific heat capacity of the adhesive layer, J/(kg·K). Al is the area of the glue layer, m2. τg is the light transmittance of the glass, and βl is the absorption rate of the glue layer. hl−c is the thermal conductivity between the glue layer and the photovoltaic cell, W/(m2·K). Tc is the temperature of the photovoltaic cell, K.
The thermal conductivity between the adhesive layer and the photovoltaic cell is calculated as follows:
h l c = 1 / δ l λ l + δ c λ c
where δc is the thickness of the photovoltaic cell, m. λc is the thermal conductivity of the photovoltaic cell, W/(m·K).
The energy conservation equation of photovoltaic cells is as follows:
M c C c d T c d t = A c τ g τ l β c f G + A c h l c T l T c E A c h c b T c T b
where Mc is the mass of the photovoltaic cell, kg. Cc is the specific heat capacity of the photovoltaic cell, J/(kg·K). Ac is the area of the photovoltaic cell, m2. τl is the light transmittance of the glue layer. βc is the absorption rate of the photovoltaic cell. ƒ is the area coverage factor of photovoltaic cells. E is the electrical energy output from photoelectric conversion, W. hc−b is the thermal conductivity between the photovoltaic cell and the backplane, W/(m2·K). Tb is the temperature of backplane, K.
The thermal conductivity between the photovoltaic cell and the backplane is calculated as follows:
h c b = 1 / δ c λ c + δ b λ b
where δb is the thickness of the backplane, m. λb is the thermal conductivity of the backplane, W/(m·K).
For the calculation of electric energy [40,41], the following formula can be used:
E = η r 1 ξ T c T c , r A c G
where Tc,r is the reference temperature under standard conditions, K. ξ is the temperature coefficient. ηr is the photoelectric conversion efficiency under standard conditions.
The energy conservation equation of the backplane is as follows:
M b C b d T b d t = A b τ g τ l β b 1 f G + A b h c b T c T b A b h b a T b T a
where Mb is the mass of the backplane, kg. Cb is the specific heat capacity of the back plate, J/(kg·K). Ab is the area of the back plate, m2. βb is the absorption rate of the backplane. hb−a is the convective heat transfer coefficient between the backplane and the backplane environment, W/(m2·K).
The following formula can be used for the convective heat transfer coefficient between the backplane and the environment [42]:
h b a = 3.8 ψ + 5.7
where Ψ is the air velocity of the backplane, m/s.
The school basically has a relatively high greening rate, a large area of artificial lakes, and a relatively stable internal ecological environment. In order to analyze the main factors affecting the power generation of campus photovoltaic buildings, the following theoretical research is carried out. As shown in Figure 3a, when the campus area’s environmental temperature is 25 °C and the wind speed is 1.5 m/s, as the radiation intensity of the campus area increases, the waste heat generated by photovoltaics is also increasing, which reduces the power generation efficiency. As more energy is received, the overall power generation increases. When the radiation intensity of the campus area increases from 400 W/m2 to 900 W/m2, the power generation more than double, and the final electricity revenue is considerable. As shown in Figure 3b, when the radiation intensity of the campus area is 700 W/m2 and the ground wind speed is 1.5 m/s, the increase in campus environment temperature makes the heat dissipation of the photovoltaic module to the environment worse, thereby suppressing the power generation efficiency and power generation. When the campus environment temperature changes in the range of 15–35 °C, the maximum power generation will be reduced by about 10%. Compared with radiation, ambient temperature has a smaller impact on the revenue of electricity. As shown in Figure 3c, when the radiation intensity of the campus area is 700 W/m2 and the ambient temperature is 25 °C, the increase in wind speed will accelerate the transfer of photovoltaic waste heat to the environment, thereby increasing the power generation efficiency. When the campus environmental wind speed changes in the range of 0.5–2.5 m/s, the power generation will increase by about 5% at most. Compared with radiation, the environmental wind speed has a smaller impact on the electricity revenue.
In summary, the increase in radiation intensity in the campus area can significantly increase the income of electricity, and the increase in ambient wind speed and the decrease in ambient temperature will help improve the efficiency of power generation and electricity. Compared with the ambient temperature and wind speed, the radiation in the campus area is the most important factor affecting the electricity revenue of the campus photovoltaic building. Therefore, based on the above research, when choosing a campus photovoltaic building site, it is necessary to avoid the shelter of existing buildings around the school and fully consider the comprehensive impact of environmental parameters and the location of the building community to ensure the greatest benefits.
In addition to weather factors, the shading of buildings will also reduce the amount of radiation received by the photovoltaic modules, which will affect the power generation of the photovoltaic system. As shown in Figure 4, the power generation of photovoltaic roofs under different building shades is analyzed through software simulation. It can be seen from Figure 4a that when the surrounding building is close to the photovoltaic roof, the solar radiation received by the photovoltaic roof is reduced due to the shading, which in turn reduces the power generation. This situation becomes more obvious as the height of surrounding building increases. Among these values, the most severe monthly reduction in power generation from photovoltaic roof caused by shading is December and January. Compared with the maximum power generation without shading, the monthly power generation drops by nearly 60%. As shown in Figure 4b, when the surrounding building is 15 m away from the photovoltaic roof, the shading of the surrounding building still has a certain impact on the power generation of the photovoltaic roof. The most serious month of this impact occurs around December. The monthly power generation has dropped by nearly 40% compared to the maximum power generation. With reference to Figure 4c, when the surrounding building is adjacent to the photovoltaic roof and the height of the surrounding building increases from 50 m to 110 m, the annual total power generation of the photovoltaic roof is reduced by 26%, 37%, and 40%, respectively, compared with the maximum power generation. When the distance between the surrounding building and the photovoltaic roof is increased to 15 m, the power generation of photovoltaic roof under different building heights is reduced by 5%, 16%, and 20%, respectively, compared with the maximum power generation. For campus buildings, a major functional building is far away from other buildings, and the height of the school building is lower than that of the urban building complex. Furthermore, compared with other lower-height campus buildings such as student dormitories, the height of teaching building and administrative building is relatively high. It is very suitable to use the roof area of campus buildings such as teaching buildings to construct photovoltaic roofs.

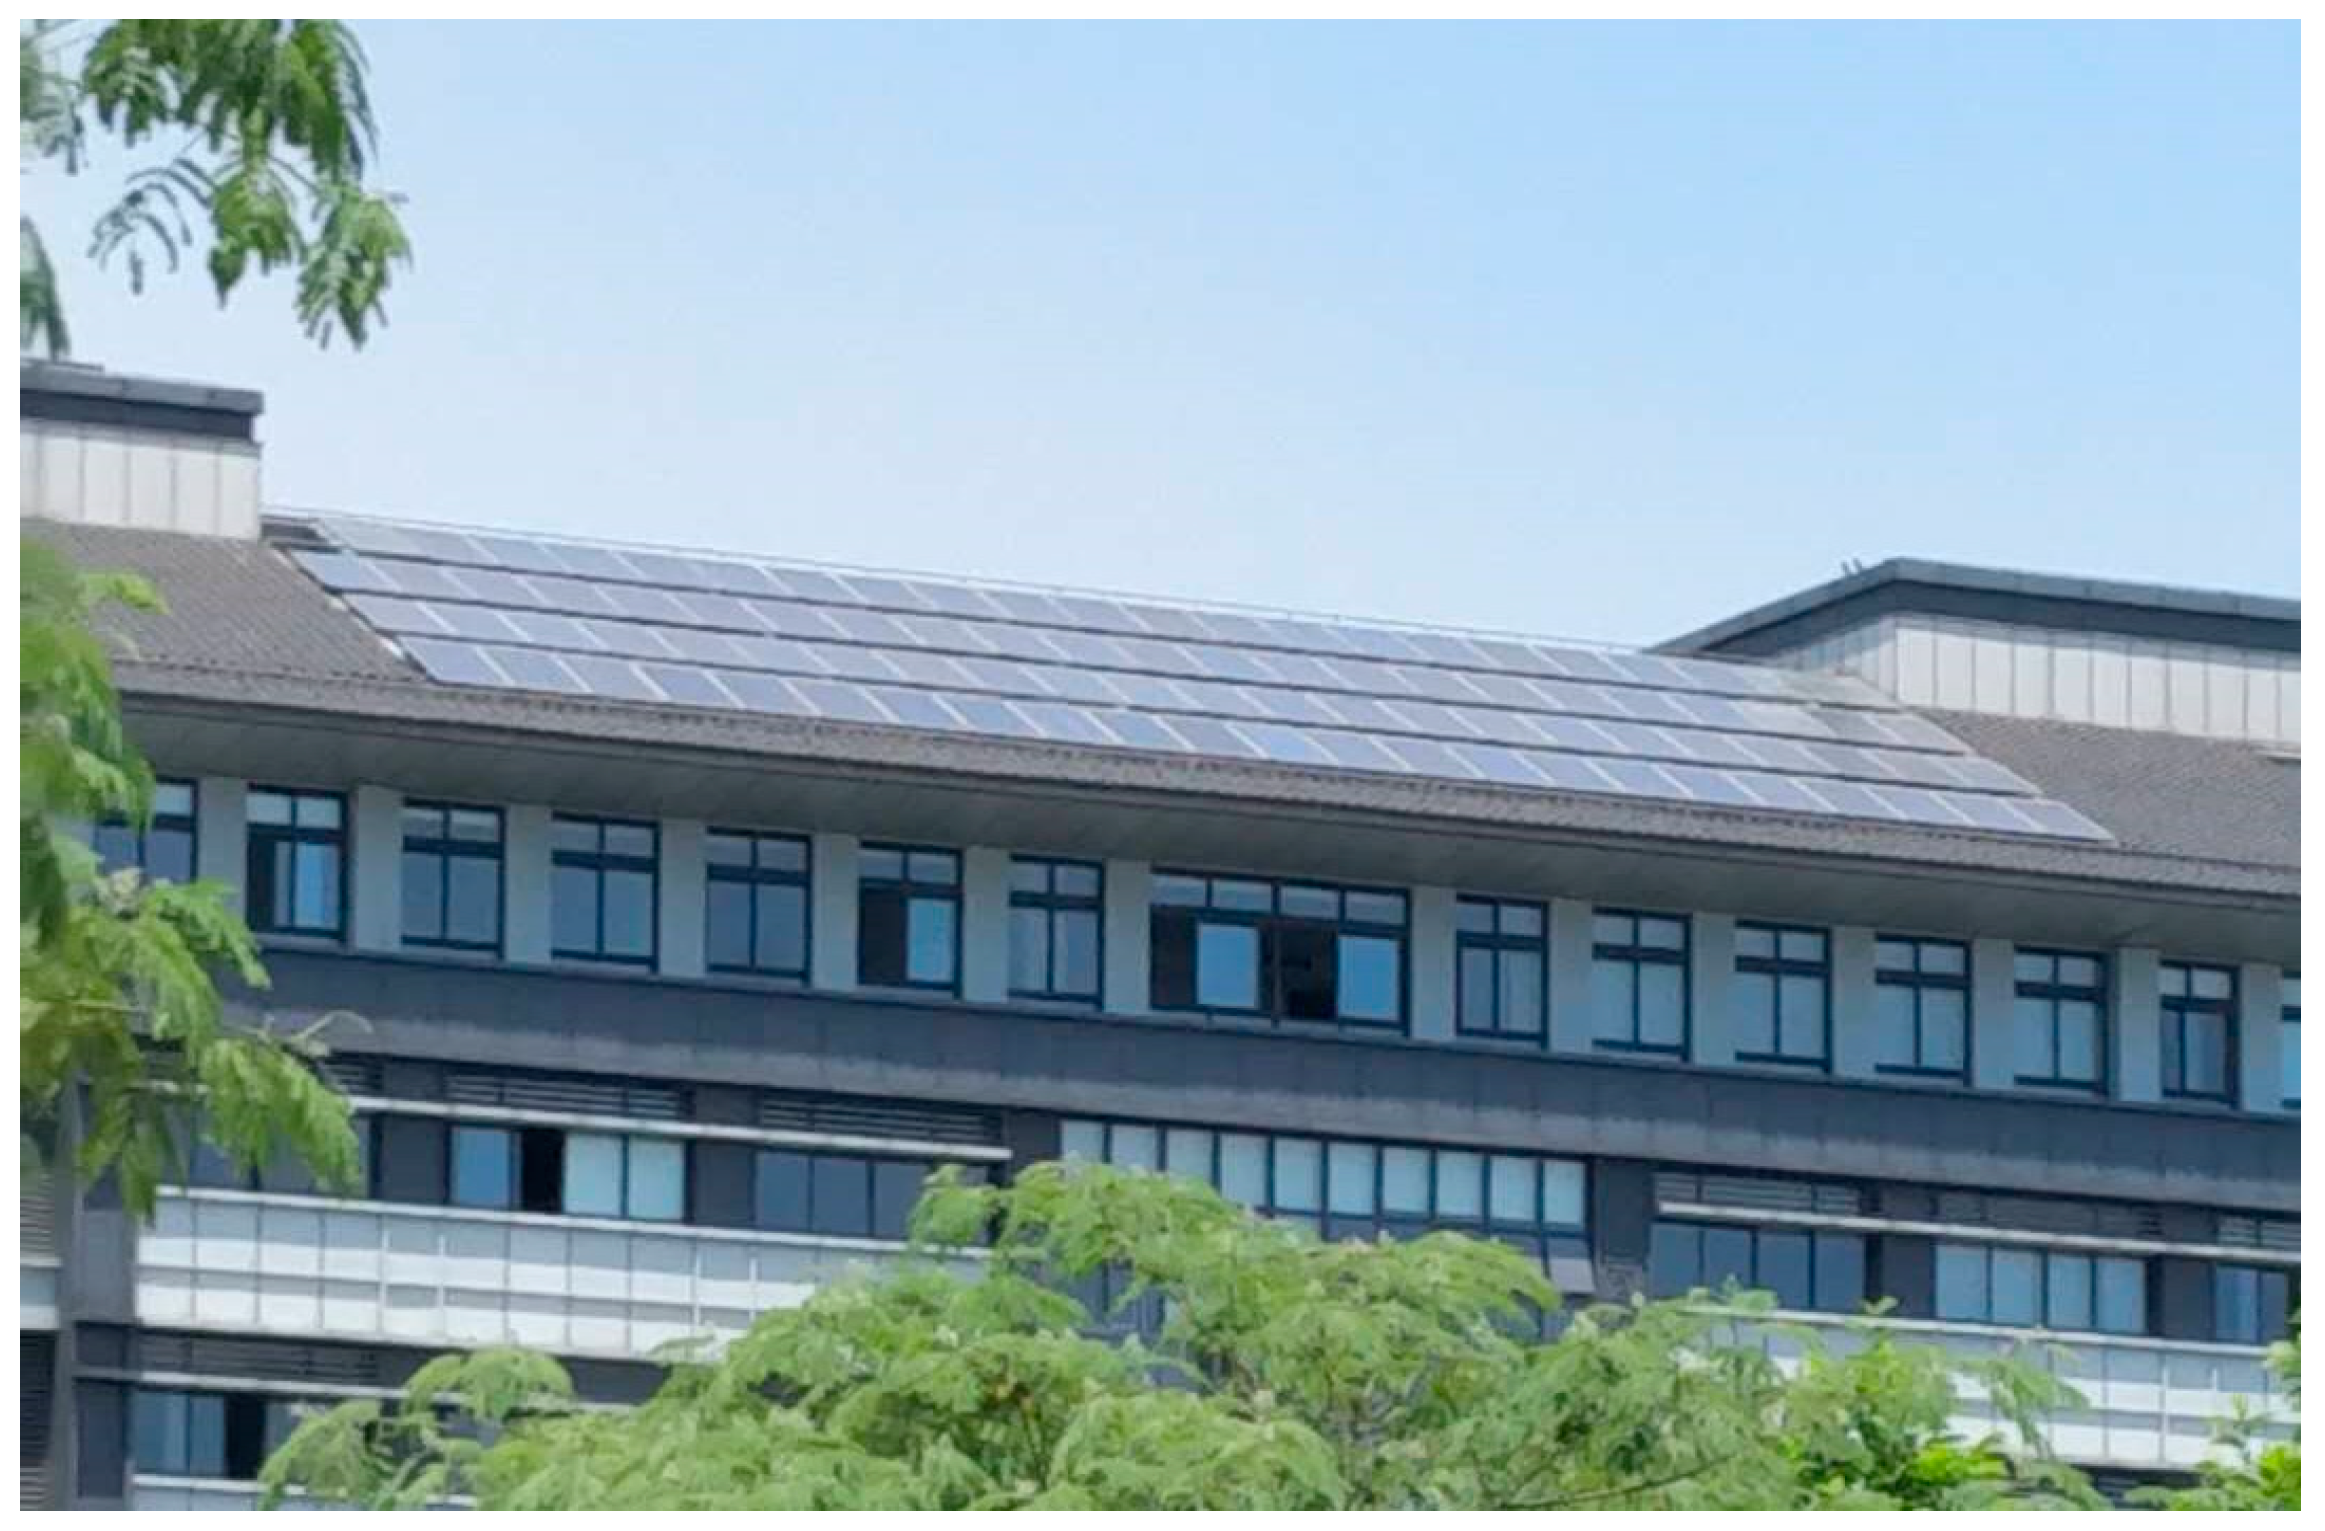
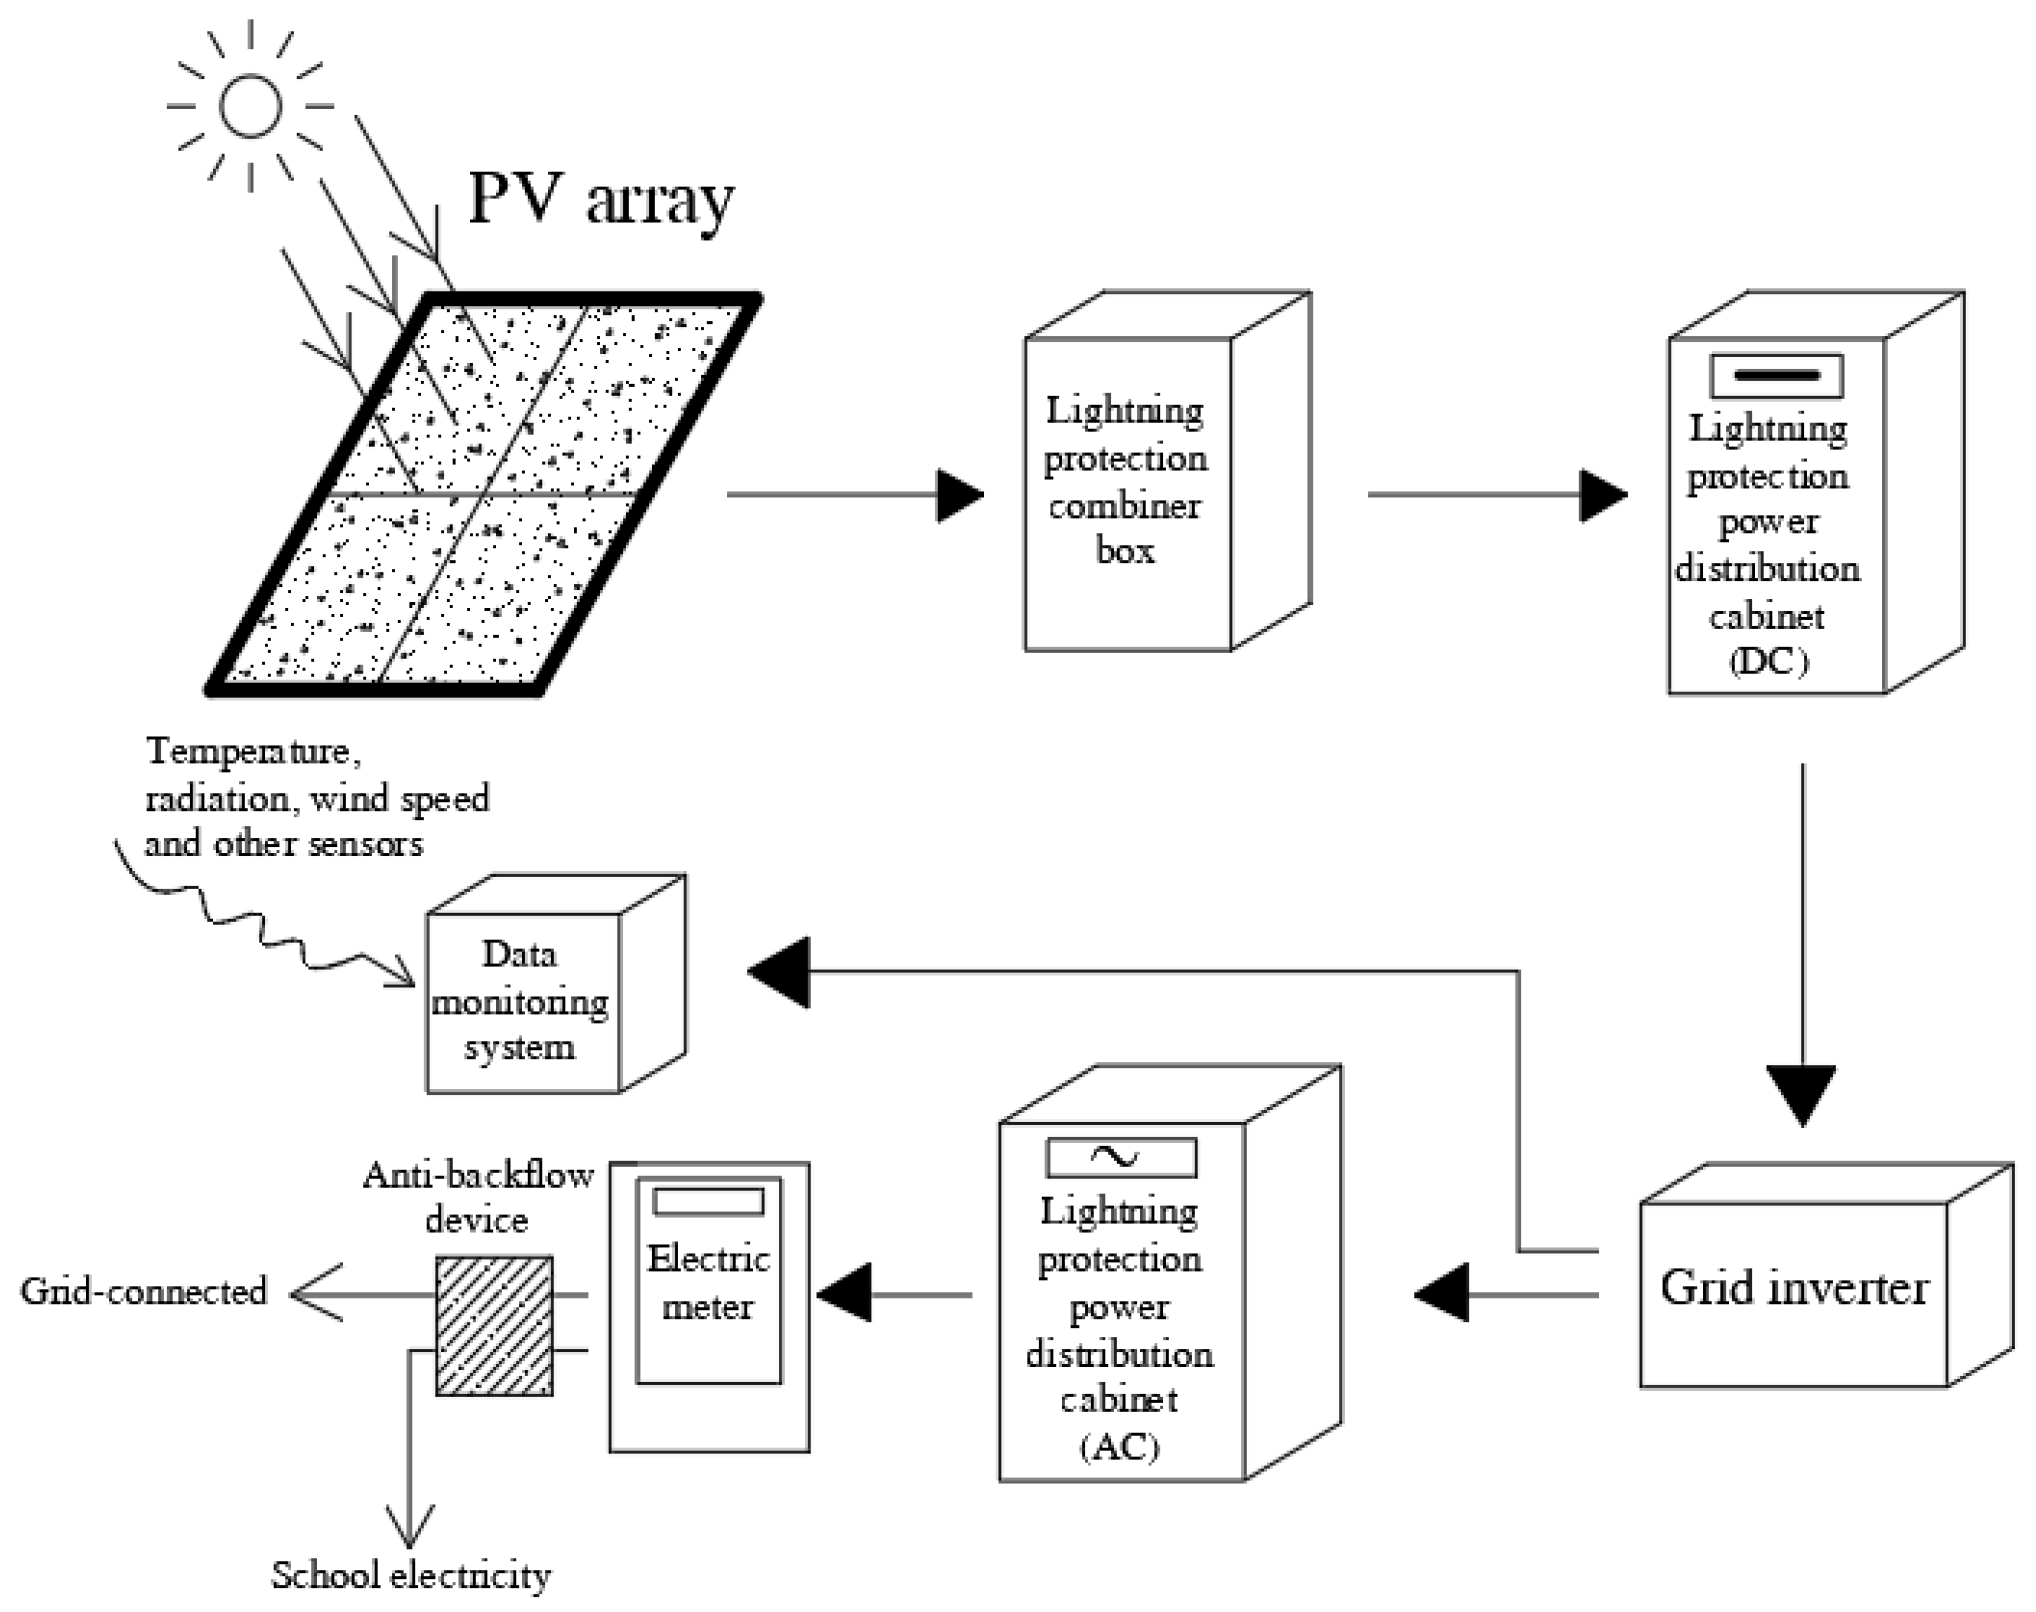
2.2. Introduction to the Campus Photovoltaic Building Experimental Test Platform

Based on the above analysis of the factors affecting the power generation of campus photovoltaic buildings, the campus photovoltaic building studied in this paper was selected at the Jiangsu Vocational College of Urban and Rural Construction in Changzhou City, Jiangsu Province, China. There are four distinct seasons in this area, and the difference in radiation intensity between winter and summer is obvious, which is conducive to comparative analysis and research. The campus photovoltaic building is located in the middle of the school building community, and it is not affected by the shadows of other buildings.
This experiment uses the TRM-FD4 portable solar cell tester shown in Figure 5, which can monitor ambient temperature, radiation, wind speed, and the current and voltage of photovoltaic modules.
As shown in Figure 6, the photovoltaic module is combined with the shape of the building to make full use of the shape and space of the building and has a certain architectural beauty. Furthermore, it also significantly saves valuable land resources.
Figure 7 is the schematic diagram of the campus photovoltaic building power generation system. The solar energy is converted into electric energy through photovoltaic array. The converted electric energy needs to flow through a lightning protection busbar and lightning protection DC power distribution cabinet to reach the inverter, which is then converted into AC power supply. The electric energy is mainly used in the school, and the excess part is connected to the grid. After the inverter, a lightning protection AC power distribution cabinet, an electric meter, and an anti-backflow device are arranged in sequence. The data monitoring system monitors the electrical energy and also records parameters such as irradiation, temperature, and wind speed. The data test platform is located in the southern direction of the roof, and there is no shelter around the monitoring equipment. The irradiator, thermometer, and anemometer are placed horizontally with the ground.

3. Results and Discussion

3.1. Statistics of Photovoltaic Building Power Generation and Total Campus Power Consumption

Figure 8 shows the monthly power generation statistics of photovoltaic buildings on campus (1 MWh = 103 kWh). It can be seen that with the advent of summer, the radiant energy continues to increase, and the total power generation of photovoltaic buildings on campus has shown a steady growth trend. After September, the total power generation of the campus photovoltaic buildings gradually decreased. Compared with other months, the power generation of photovoltaic buildings on campus is the lowest during winter vacation and the highest during summer vacation. Affected by the radiation, the power generation in July was 1.5 times more than that in January. The experimental test result is consistent with the theoretical analysis result.
Figure 9 shows a schematic diagram of the grid-connected scale of campus photovoltaic buildings. The photovoltaic power of the campus photovoltaic buildings first meets their self-use needs, and the remainder is merged into the national grid. However, for colleges and universities, the radiation is low in winter and high in summer, and only a few teachers and students study or work during the holidays. Taking into account the particularity of radiation and electricity consumption during the winter and summer vacations of colleges and universities, a dynamic grid-connected strategy based on meeting the basic power supply requirements of campus buildings is proposed. That is, the proportion of grid-connected in winter vacation is about 15%, and the proportion of grid-connected in summer vacation exceeds 40%.
Combining Figure 8 and Figure 9, it can be found that the solar photovoltaic buildings on campuses affected by radiation continue to increase in the time period from the beginning of the spring school to the beginning of the fall. In this period, not only did the campus photovoltaic buildings generate considerable power generation, but while meeting the power consumption of some buildings on the campus, the grid connection ratio could still maintain a steady growth, which is also the main month for grid connection economic benefits.
Figure 10 compares the total annual power generation (Ea), self-consumption (Es), grid-connected power (Eg), and total campus power consumption statistics of photovoltaic buildings (Et) in 2017 and 2018. It can be seen that the total electricity consumption of the campus increased by 11.4% in 2018. This part of the consumption of electricity is mainly due to the increase in the number of people in the campus and the expansion of the school-enterprise training base, which caused the increase in energy consumption in the campus. Based on the proposed “spontaneous and self-consumed surplus electricity grid connection” strategy, it can be found the average annual total power generation of photovoltaics has reached 2428.5 MWh, of which about 75% is used by the school, and the rest is used for grid connection; the average annual total power consumption of the campus is 6628.8 MWh, 27% of which is electrical energy output of photovoltaic building campus. The electricity generated by the photovoltaic building effectively reduces the electricity purchased by the campus from the grid.

3.2. Comprehensive Energy Consumption

Figure 11 shows the changes of unit building area and per capita comprehensive energy consumption, in which Me represents the comprehensive energy consumption per unit building area of the campus, Me−pv represents the comprehensive energy consumption per unit building area of the campus after deducting the photovoltaic power supply, Pe represents the per capita comprehensive energy consumption, and Pe−pv represents the per capita comprehensive energy consumption after deducting the photovoltaic power supply. As can be seen from the figure, compared with 2017, the comprehensive energy consumption per unit building area and the comprehensive energy consumption per capita increased slightly in 2018, which is mainly due to the impact of the increase in the number of energy-consuming people in schools and the increase in energy-consuming buildings (school–enterprise training bases).
After deducting the electricity supplied by photovoltaics, the comprehensive energy consumption per unit building area was reduced by 21.6% in 2017, and by 22.5% in 2018, with an average reduction of 0.85 kg standard coal per square meter per year; the per capita comprehensive energy consumption was reduced in 2017 22.8%, a decrease of 21.3% in 2018, and an average reduction of 29.7 kg of standard coal/person in a year. Both the comprehensive energy consumption per unit building area and per capita comprehensive energy consumption of the campus have been reduced by more than 20%, which shows that the use of campus photovoltaic buildings can effectively reduce campus energy consumption and has a positive role in promoting energy conservation and emission reduction in universities.

4. Economic and Environment Analysis

4.1. Economic Benefit Analysis

The economic benefits of campus photovoltaic buildings can be analyzed from the following three aspects [43]:
(1)
Net income of the whole life cycle:
I a = n = 1 N E s × P s + E g × P g + n = 1 20 E a × P a 10,000 S n = 1 N C S
where Ia is the total life cycle net income, CNY; Ea is the average annual power generation, in kWh; Pa is the national subsidy for electricity per kilowatt-hour, taken at 0.37 CNY/kWh; Es is the annual average self-consumption, kWh; Ps is the power grid purchase price is 0.538 CNY/kWh; Eg is the average annual grid-connected power, kWh; Pg is the grid-connected power price, which is 0.75 CNY/kWh; S is the initial investment of the system, which is CNY 10 million; Cs is the average annual maintenance cost of the system, which is CNY 200,000; N is the design life of the photovoltaic, which is 25 years.
(2)
Static investment recovery period:
P t = S + n = 1 N C S Δ C
where Pt is the static investment recovery period, year; ΔC is the average annual net cash flow value, CNY 10,000.
The calculation of the average annual net cash flow value is as follows:
Δ C = E s × P s + E g × P g + E a × P a C S / 10,000
(3)
Cost of electricity per kilowatt hour:
M = S + n = 1 N C s n = 1 N E a
where M is the cost of electricity per kilowatt hour, CNY/kWh.

4.2. Electricity Price Sensitivity Analysis

Given the different electricity consumption patterns and the electricity prices in different regions, the changes in the national grid electricity price are taken as a starting point to study the impact of changes in the national grid electricity price on the investment payback period and the net income of the life cycle of photovoltaic building integration projects.
In this paper, the full life cycle net income of the campus photovoltaic building is CNY 38.8 million, the cost per kilowatt-hour is 0.25 CNY/kWh, and the static investment payback period is about 7 years. Combining the effects of radiation on electricity and grid-connected ratio in Figure 8 and Figure 9, in high-irradiation areas such as the equatorial region, the economic benefits of campus photovoltaic buildings will increase and the payback period will be shortened. The analysis of the sensitivity of grid electricity prices is shown in Figure 12. It can be seen that the grid electricity price has a significant impact on the payback period and net income. When the grid electricity price was increased from 0.4 CNY to 1.3 CNY, the payback period was shortened by 3.7 years, and the net income of the project life cycle increased by 1.25 times. For areas with high electricity prices, photovoltaic buildings are considered at the beginning of the design. Combining photovoltaic modules with building facades and roofs will obviously increase the economic benefits of photovoltaic buildings.

4.3. Environmental Benefits

(1)
Energy saving benefits:
E n e r g y   s a v i n g   b e n e f i t s = n = 1 N E a × C c o a l × P s t a n d a r d   c o a l
where C c o a l is average coal consumption, 0.345 kgce/kWh; P s t a n d a r d   c o a l is unit price of kilogram of standard coal, 0.65 CNY/kgce.
In this paper, the total power generation of the campus photovoltaic building in the life cycle is 60,712.5 MWh. Calculated according to the average coal consumption of 0.345 kgce/kWh [44], it is equivalent to saving 20,945.8 tce. If the price of coal is CNY 650 per ton, it will be equivalent to saving CNY 13.61 million
(2)
Emission reduction benefits
E m i s s i o n   r e d u c t i o n   b e n e f i t s = ( E f C O 2 × A c C O 2 + E f S O 2 × A c S O 2 + E f N O x × A c N O x + E f d u s t × A c d u s t ) × n = 1 N E a × C c o a l
where E f X X X is the emission factor of “XXX” for 1 kg standard coal; A c X X X is the treatment cost of “XXX” pollutants, that is, the cost of emission reduction. For example, E f C O 2 represents the CO2 emission factor of 1 kg of standard coal, A c C O 2 represents the emission reduction cost of CO2 pollutants. See Table 1 for relevant content.
Table 1 shows the main pollutants of coal-fired power generation and the corresponding environmental costs. It is calculated that the campus photovoltaic building can save nearly 21,000 tons of standard coal in its life cycle. The emission benefits are 6.51 million CNY.
In summary, the environmental benefits of campus photovoltaic buildings within the design life of the year are CNY 20.12 million, which is significant in terms of energy conservation and environmental protection. The building complex of colleges and universities has high energy consumption. The use of campus photovoltaic buildings has positive publicity significance for energy conservation and emission reduction in colleges and universities. Therefore, in the construction of campus, full consideration should be given to campus photovoltaic buildings to promote the construction of energy-saving and environmentally friendly campuses.

5. Conclusions

This paper establishes a theoretical model to study the main influencing factors of campus photovoltaic buildings and builds a campus photovoltaic experimental platform to verify. In addition, the annual statistics on the electricity and grid connection of photovoltaic buildings on campus were carried out, the impact of photovoltaic buildings on campus energy consumption was studied, and economic and environmental benefits are analyzed. Due to the large difference between the building load and the actual energy consumption of campus buildings during different holidays, the dynamic grid-connected strategy of photovoltaic power generation summarized in this paper provides a reference for it. The application and research of campus photovoltaic building integration can help greatly reduce campus energy consumption. The main conclusions are as follows:
(1)
The dynamic theoretical analysis of the photovoltaic building roof system indicates that radiation is the main factor affecting the revenue of campus photovoltaic construction, and the maximum power generation is more than double the minimum power generation, which is verified and consistent with the experimental results. Therefore, shading should be avoided in the selection of the campus photovoltaic building system;
(2)
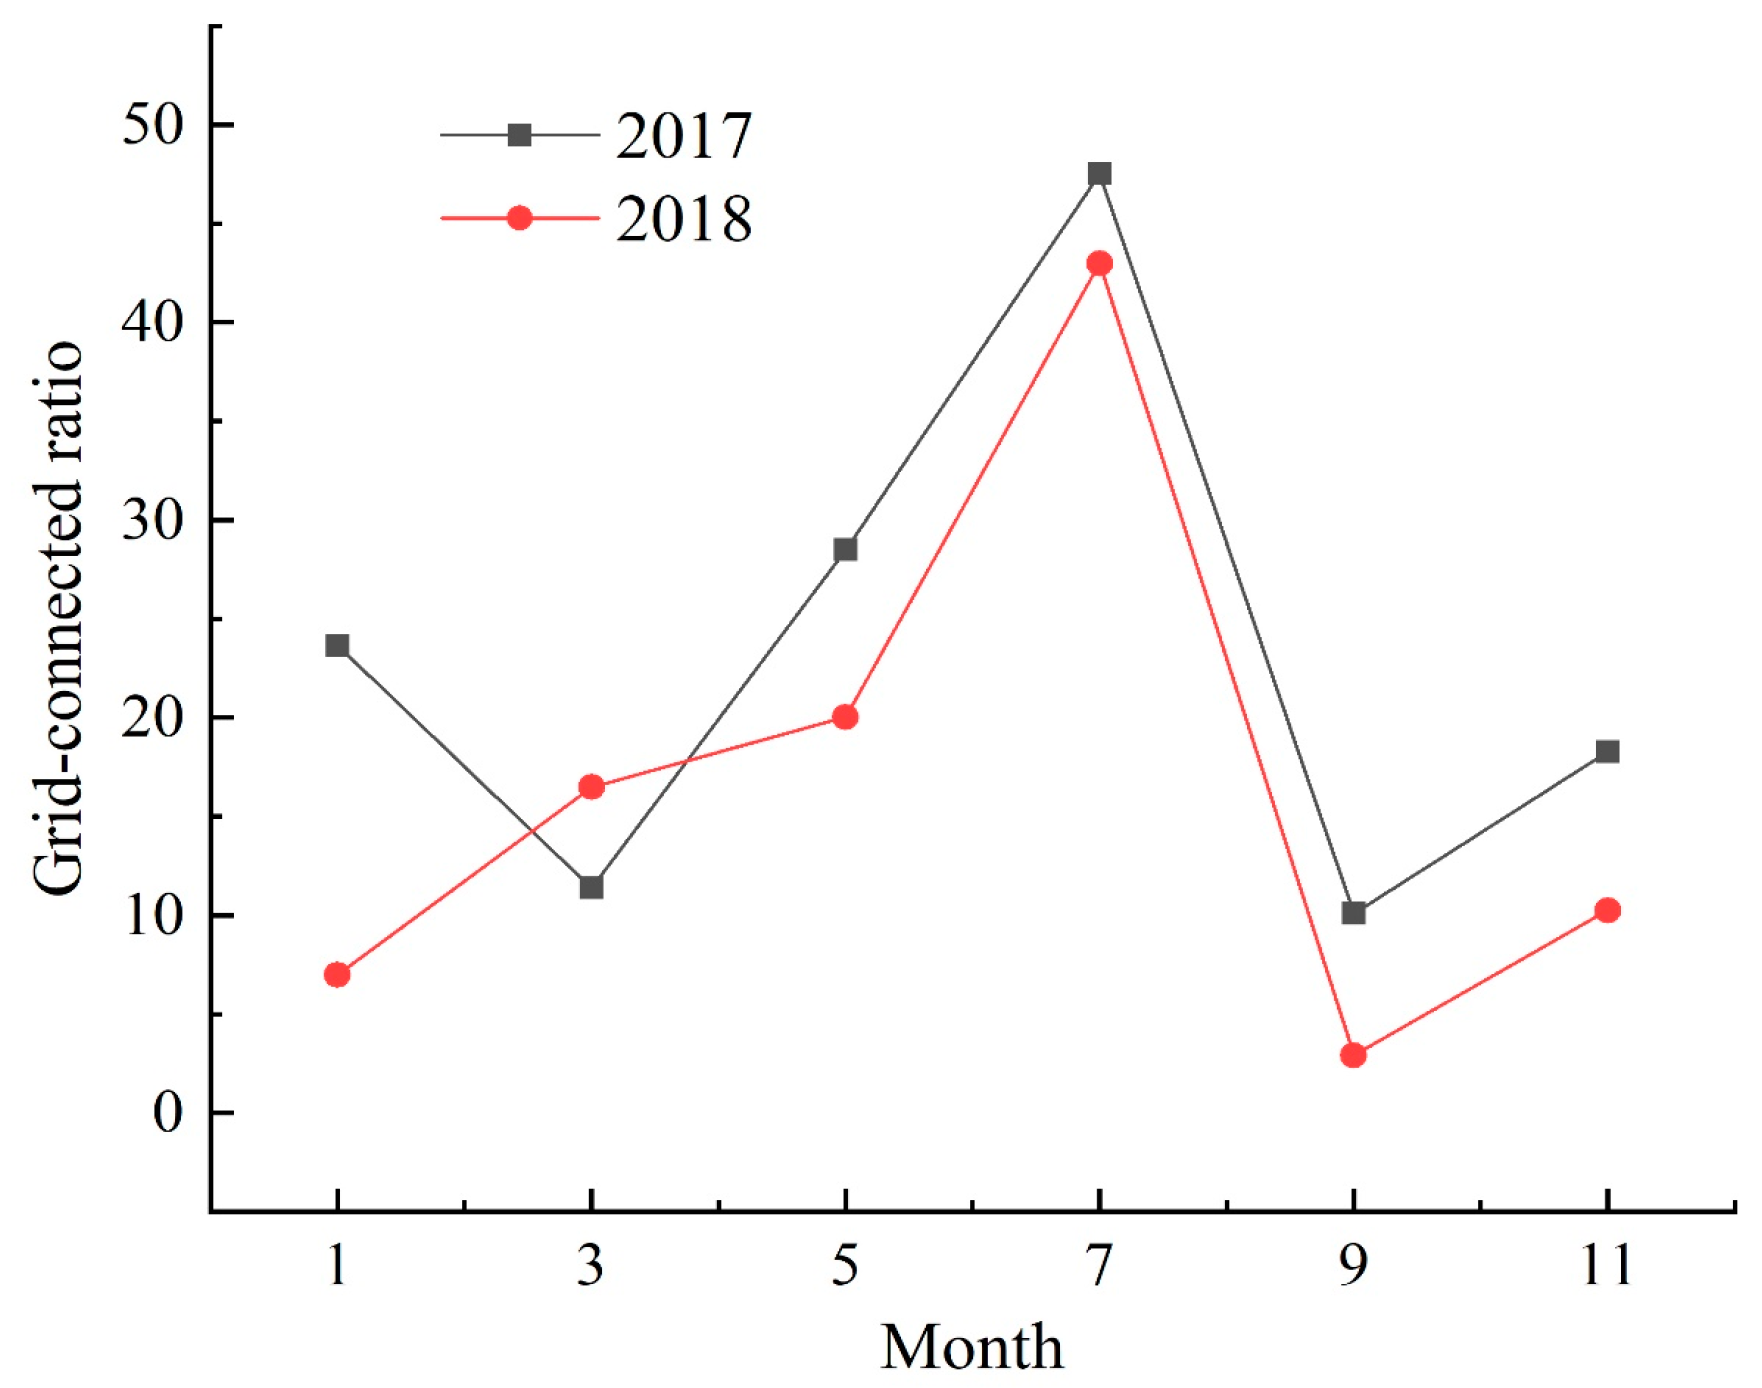
Taking into account the phenomenon that the campus has two levels of radiation intensity and extremely low electricity consumption during winter and summer vacations, a dynamic control strategy of “self-consumption surplus electricity grid connection” is proposed, which is manifested in reducing the grid connection rate to 15% during winter vacations, increasing the grid connection rate during summer vacations to 40%, resulting in the annual grid connection rate reaching 25%. Furthermore, when the irradiation increases significantly from March to July, the proportion of grid-connected campus photovoltaic buildings also raises, which was the main grid-connected revenue period;
(3)
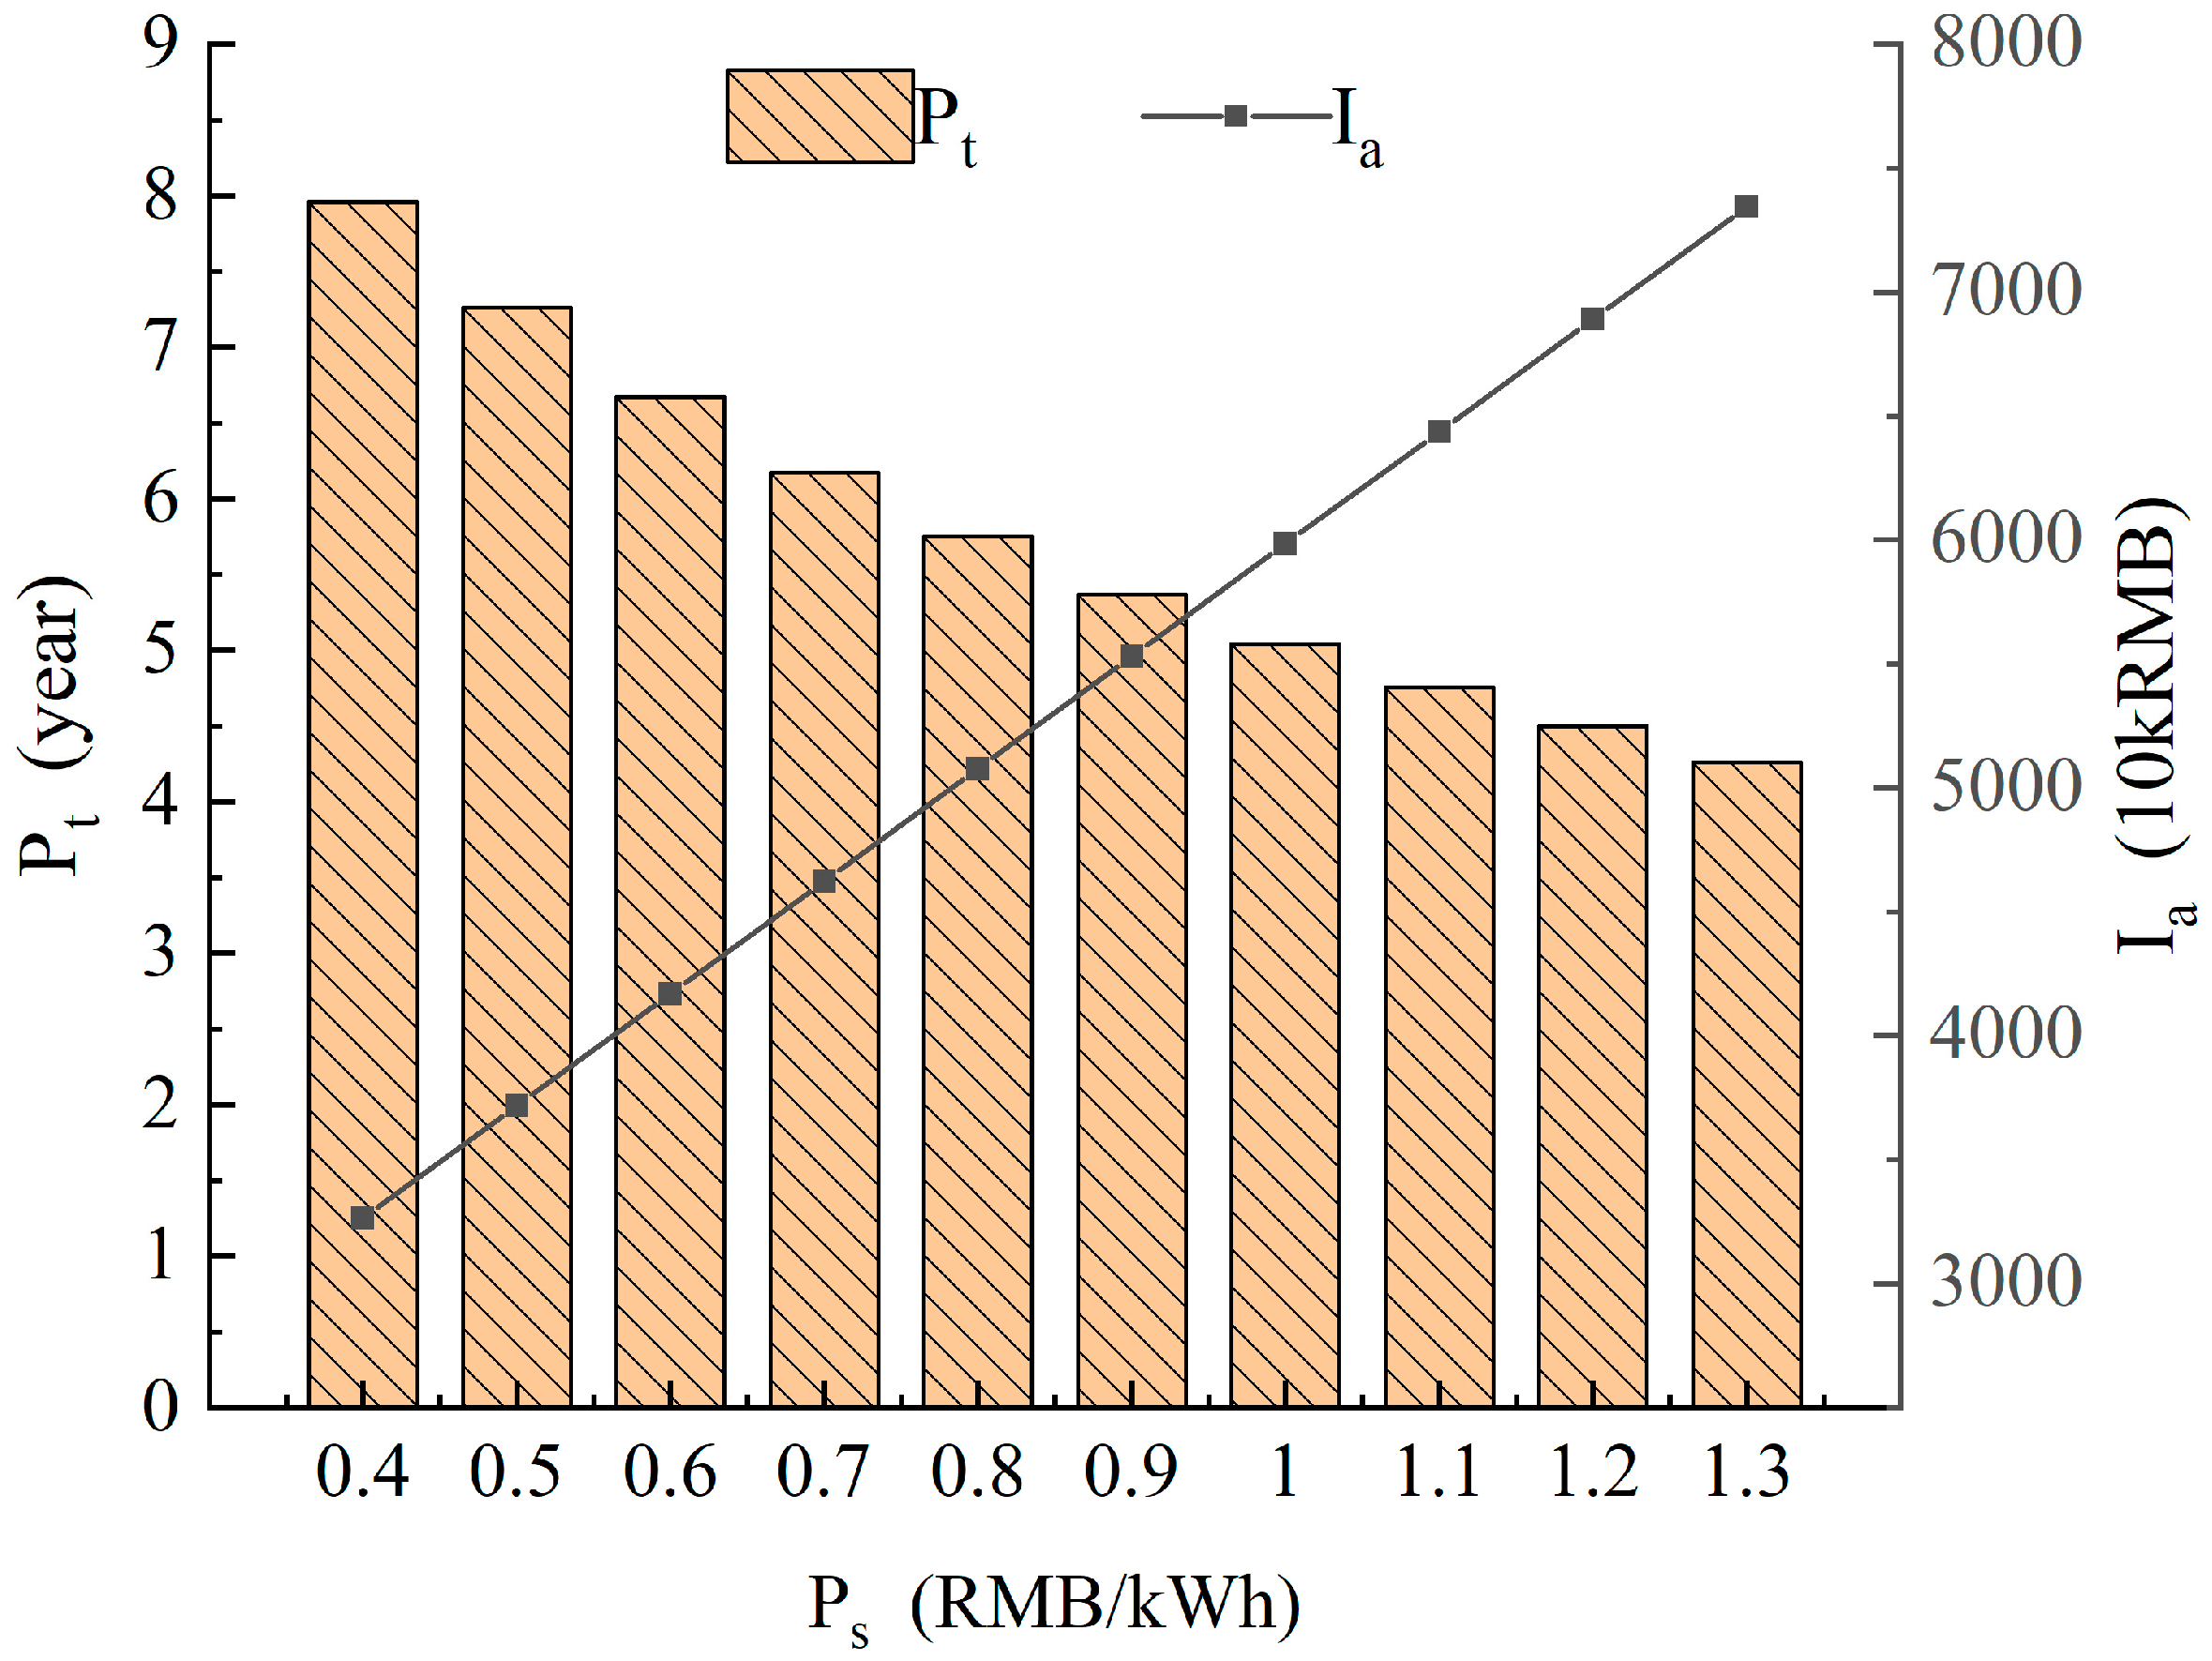
The static investment payback period of this photovoltaic building system is about 7 years. The purchase price of electricity has a greater impact on the investment payback period and economic returns. When the grid price increases from 0.4 CNY/kWh to 1.3 CNY/kWh, the investment payback period can be shortened by 3.7 years, and the project income can more than double;
(4)
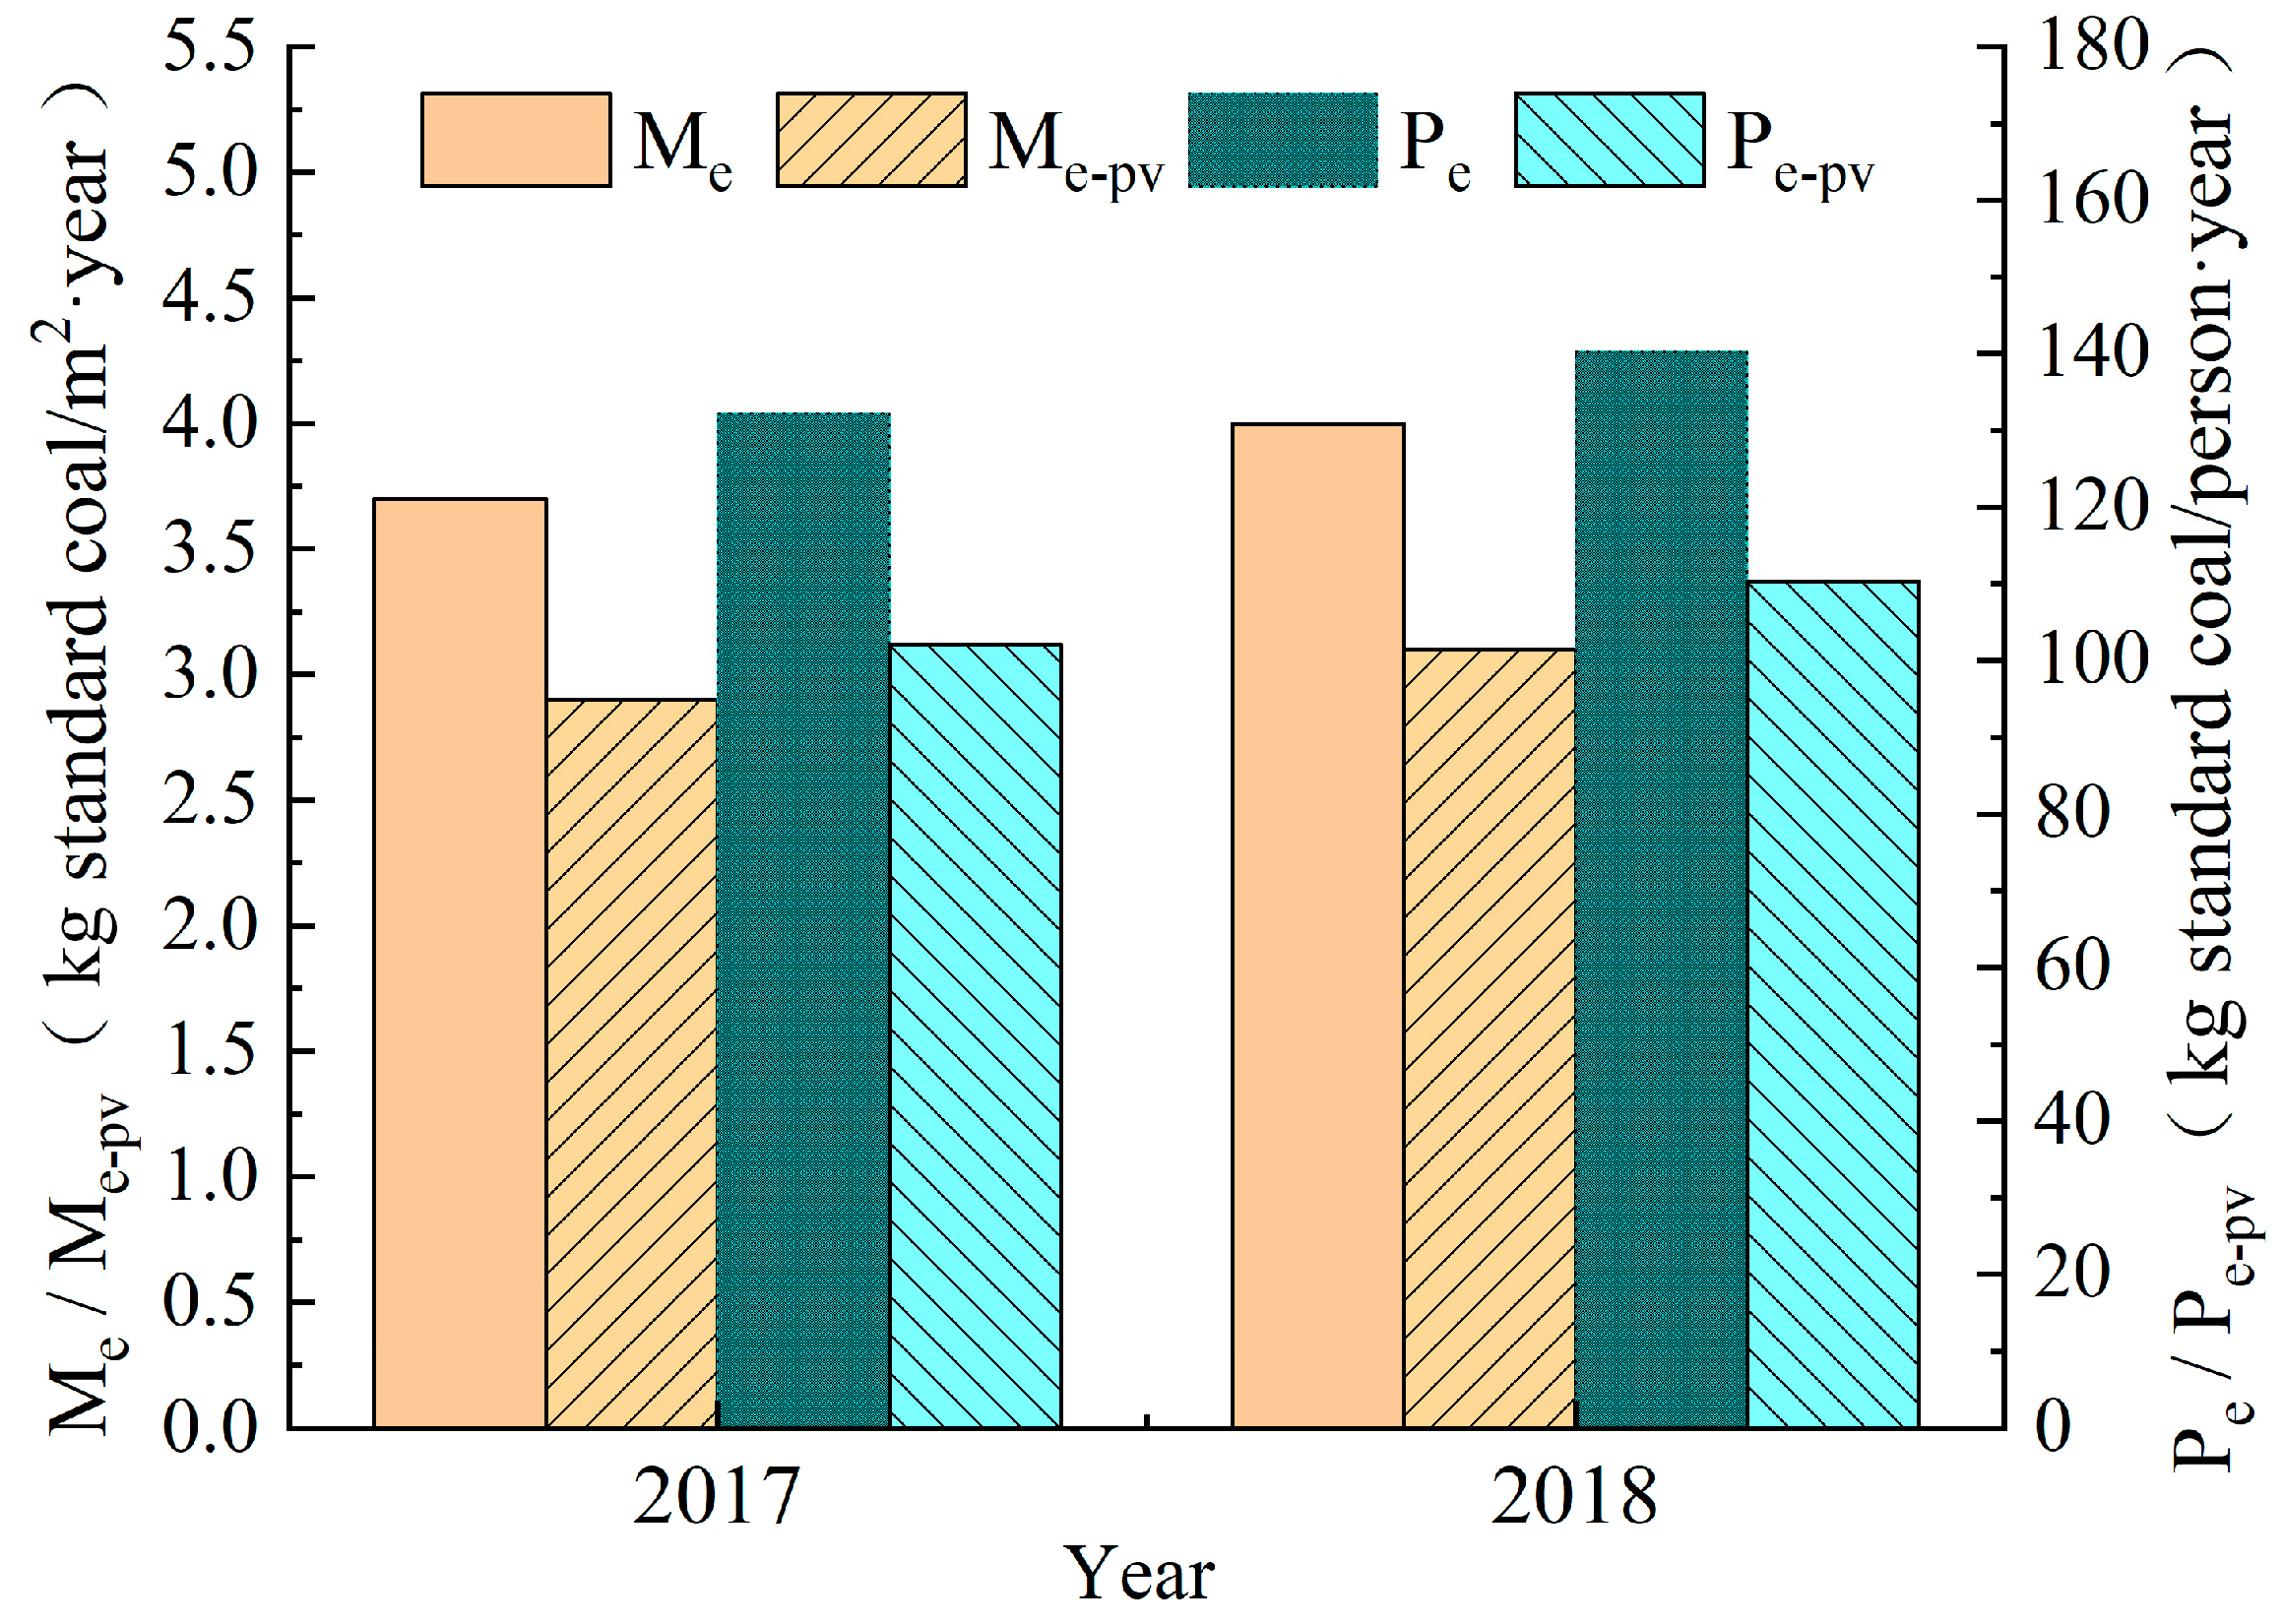
The production of campus photovoltaic buildings accounted for nearly 30% of the school’s annual electricity consumption. Therefore, the energy consumption per unit area of the campus and the comprehensive energy consumption per capita have been reduced by more than 20%. Furthermore, compared with coal-fired power generation, the environmental benefits of the entire life cycle of the campus photovoltaic buildings in this paper are CNY 20.12 million, which is significant in terms of energy saving and emission reduction.

Author Contributions

Methodology, Y.W. and H.Y.; Validation, B.C.; Formal analysis, B.C.; Investigation, J.Y.; Resources, P.Z.; Data curation, Y.W.; Writing—original draft, J.Y.; Writing—review & editing, J.C. and H.Y. All authors have read and agreed to the published version of the manuscript.

Funding

This work was supported by Xiaohe Sci-Tech Talents Special Funding under Hunan Provincial Sci-Tech Talents Sponsorship Program (2023TJ-X79), Hunan Provincial Natural Science Foundation of China (2022JJ40057), Natural Science Foundation of Chongqing, China (CSTB2022NSCQ-MSX1215).

Data Availability Statement

Not applicable.

Conflicts of Interest

The authors declare that they have no conflict of interest regarding this publication.

References

  1. Habib, M.F.; Ali, M.; Sheikh, N.A.; Badar, A.W.; Mehmood, S. Building thermal load management through integration of solar assisted absorption and desiccant air conditioning systems: A model-based simulation-optimization approach. J. Build. Eng. 2020, 30, 101279. [Google Scholar] [CrossRef]
  2. Zhai, H.; Zhang, J.; Wu, Z.; Li, Q.; Xie, H. Photovoltaic output parameters of a mono-crystalline silicon solar cell with non-uniform horizontal temperature distributions. J. Renew. Sustain. Energy 2019, 11, 053505. [Google Scholar] [CrossRef]
  3. Kryszak, M.; Wang, L.W. The value of aesthetics in the BIPV roof products segment: A multiperspective study under European market conditions. Energy Sources Part A Recovery Util. Environ. Eff. 2020, 1–22. [Google Scholar] [CrossRef]
  4. Correia, A.; Ferreira, L.; Coimbra, A.; Moura, P.; de Almeida, A. Smart Thermostats for a Campus Microgrid: Demand Control and Improving Air Quality. Energies 2022, 15, 1359. [Google Scholar] [CrossRef]
  5. Correia, A.; Moura, P.; de Almeida, A. Technical and Economic Assessment of Battery Storage and Vehicle-to-Grid Systems in Building Microgrids. Energies 2022, 15, 8905. [Google Scholar] [CrossRef]
  6. Moura, P.; Correia, A.; Delgado, J.; Fonseca, P.; Almeida, A. University Campus Microgrid for Supporting Sustainable Energy Systems Operation. In Proceedings of the 2020 IEEE/IAS 56th Industrial and Commercial Power Systems Technical Conference (I&CPS), Las Vegas, NV, USA, 29 June–28 July 2020; pp. 1–7. [Google Scholar]
  7. Canale, L.; Di Fazio, A.R.; Russo, M.; Frattolillo, A.; Dell’Isola, M. An Overview on Functional Integration of Hybrid Renewable Energy Systems in Multi-Energy Buildings. Energies 2021, 14, 1078. [Google Scholar] [CrossRef]
  8. Liu, K.; Xu, X.; Zhang, R.; Kong, L.; Wang, W.; Deng, W. Impact of urban form on building energy consumption and solar energy potential: A case study of residential blocks in Jianhu, China. Energy Build. 2023, 280, 112727. [Google Scholar] [CrossRef]
  9. Izquierdo, S.; Rodrigues, M.; Fueyo, N. A method for estimating the geographical distribution of the available roof surface area for large-scale photovoltaic energy-potential evaluations. Sol. Energy 2008, 82, 929–939. [Google Scholar] [CrossRef]
  10. Hong, M.; Feng, C.; Xu, Z.; Zhang, L.; Zheng, H.; Wu, G. Performance study of a new type of transmissive concentrating system for solar photovoltaic glass curtain wall. Energy Convers. Manag. 2019, 201, 112167. [Google Scholar] [CrossRef]
  11. Yoon, J.H.; Song, J.; Lee, S.J. Practical application of building integrated photovoltaic (BIPV) system using transparent amorphous silicon thin-film PV module. Solar Energy 2011, 85, 723–733. [Google Scholar] [CrossRef]
  12. Wu, S.-Y.; Xu, L.; Xiao, L. Performance study of a novel multi-functional Trombe wall with air purification, photovoltaic, heating and ventilation. Energy Convers. Manag. 2019, 203, 112229. [Google Scholar] [CrossRef]
  13. Peng, J.; Lu, L.; Yang, H.; Han, J. Investigation on the annual thermal performance of a photovoltaic wall mounted on a multi-layer façade. Appl. Energy 2013, 112, 646–656. [Google Scholar] [CrossRef]
  14. Cristofari, C.; Carutasiu, M.B.; Canaletti, J.L.; Norvaišienė, R.; Motte, F.; Notton, G. Building integration of solar thermal systems-example of a refurbishment of a church rectory. Renew. Energy 2019, 137, 67–81. [Google Scholar] [CrossRef]
  15. Yang, J.; Jo, H.; Choi, S.-W.; Kang, D.-W.; Kwon, J.-D. Adoption of wide-bandgap microcrystalline silicon oxide and dual buffers for semitransparent solar cells in building-integrated photovoltaic window system. J. Mater. Sci. Technol. 2019, 35, 1563–1569. [Google Scholar] [CrossRef]
  16. Yadav, S.; Panda, S.K. Thermal performance of BIPV system by considering periodic nature of insolation and optimum tilt-angle of PV panel. Renew. Energy 2020, 150, 136–146. [Google Scholar] [CrossRef]
  17. Shao, N.; Ma, L.; Zhang, J. Experimental study on electrical and thermal performance and heat transfer characteristic of PV/T roof in summer. Appl. Therm. Eng. 2019, 162, 114276. [Google Scholar] [CrossRef]
  18. Kant, K.; Pitchumani, R.; Shukla, A.; Sharma, A. Analysis and design of air ventilated building integrated photovoltaic (BIPV) system incorporating phase change materials. Energy Convers. Manag. 2019, 196, 149–164. [Google Scholar] [CrossRef]
  19. Kant, K.; Anand, A.; Shukla, A.; Sharma, A. Heat transfer study of building integrated photovoltaic (BIPV) with nano-enhanced phase change materials. J. Energy Storage 2020, 30, 149–164. [Google Scholar] [CrossRef]
  20. Hadavinia, H.; Singh, H. Modelling and experimental analysis of low concentrating solar panels for use in building integrated and applied photovoltaic (BIPV/BAPV) systems. Renew. Energy 2019, 139, 815–829. [Google Scholar] [CrossRef]
  21. Dos Santos, I.P.; Rüther, R. The potential of building-integrated (BIPV) and building-applied photovoltaics (BAPV) in single-family, urban residences at low latitudes in Brazil. Energy Build. 2012, 50, 290–297. [Google Scholar] [CrossRef]
  22. Peng, C.; Huang, Y.; Wu, Z. Building-integrated photovoltaics (BIPV) in architectural design in China. Energy Build. 2011, 43, 3592–3598. [Google Scholar] [CrossRef]
  23. Yoo, S.-H. Optimization of a BIPV system to mitigate greenhouse gas and indoor environment. Sol. Energy 2019, 188, 875–882. [Google Scholar] [CrossRef]
  24. Toledo, C.; López-Vicente, R.; Abad, J.; Urbina, A. Thermal performance of PV modules as building elements: Analysis under real operating conditions of different technologies. Energy Build. 2020, 223, 110087. [Google Scholar] [CrossRef]
  25. Ghosh, A.; Sarmah, N.; Sundaram, S.; Mallick, T.K. Numerical studies of thermal comfort for semi-transparent building integrated photovoltaic (BIPV)-vacuum glazing system. Sol. Energy 2019, 190, 608–616. [Google Scholar] [CrossRef]
  26. Jia, J.; Gao, F.; Cheng, Y.; Wang, P.; Ei-Ghetany, H.H.; Han, J. A comparative study on thermoelectric performances and energy savings of double-skin photovoltaic windows in cold regions of China. Sol. Energy 2020, 206, 464–472. [Google Scholar] [CrossRef]
  27. Fossa, M.; Ménézo, C.; Leonardi, E. Experimental natural convection on vertical surfaces for building integrated photovoltaic (BIPV) applications. Exp. Therm. Fluid Sci. 2008, 32, 980–990. [Google Scholar] [CrossRef]
  28. Lu, L.; Yang, H.X. Environmental payback time analysis of a roof-mounted building-integrated photovoltaic (BIPV) system in Hong Kong. Appl. Energy 2010, 87, 3625–3631. [Google Scholar] [CrossRef]
  29. Gholami, H.; Røstvik, H.N. Economic analysis of BIPV systems as a building envelope material for building skins in Europe. Energy 2020, 204, 117931. [Google Scholar] [CrossRef]
  30. Sorgato, M.J.; Schneider, K.; Rüther, R. Technical and economic evaluation of thin-film CdTe building-integrated photovoltaics (BIPV) replacing façade and rooftop materials in office buildings in a warm and sunny climate. Renew. Energy 2018, 118, 84–98. [Google Scholar] [CrossRef]
  31. Jung, S.; Kang, H.; Lee, M.; Hong, T. An optimal scheduling model of an energy storage system with a photovoltaic system in residential buildings considering the economic and environmental aspects. Energy Build. 2020, 209, 109701. [Google Scholar] [CrossRef]
  32. Lee, M.; Hong, T.; Jeong, J.; Jeong, K. Development of a rooftop solar photovoltaic rating system considering the technical and economic suitability criteria at the building level. Energy 2018, 160, 213–224. [Google Scholar] [CrossRef]
  33. Sharma, P.; Kolhe, M.; Sharma, A. Economic performance assessment of building integrated photovoltaic system with battery energy storage under grid constraints. Renew. Energy 2020, 145, 1901–1909. [Google Scholar] [CrossRef]
  34. Gholami, H.; Røstvik, H.N.; Müller-Eie, D. Holistic economic analysis of building integrated photovoltaics (BIPV) system: Case studies evaluation. Energy Build. 2019, 203, 109461. [Google Scholar] [CrossRef]
  35. Lee, J.; Chang, B.; Aktas, C.; Gorthala, R. Economic feasibility of campus-wide photovoltaic systems in New England. Renew. Energy 2016, 99, 452–464. [Google Scholar] [CrossRef]
  36. Talavera, D.L.; de la Casa, J.; Muñoz-Cerón, E.; Almonacid, G. Grid parity and self-consumption with photovoltaic systems under the present regulatory framework in Spain: The case of the University of Jaén Campus. Renew. Sustain. Energy Rev. 2014, 33, 752–771. [Google Scholar] [CrossRef]
  37. Slimani, M.E.A.; Amirat, M.; Kurucz, I.; Bahria, S.; Hamidat, A.; Chaouch, W.B. A detailed thermal-electrical model of three photovoltaic/thermal (PV/T) hybrid air collectors and photovoltaic (PV) module: Comparative study under Algiers climatic conditions. Energy Convers. Manag. 2017, 133, 458–476. [Google Scholar] [CrossRef]
  38. Su, D.; Jia, Y.; Huang, X.; Alva, G.; Tang, Y.; Fang, G. Dynamic performance analysis of photovoltaic–thermal solar collector with dual channels for different fluids. Energy Convers. Manag. 2016, 120, 13–24. [Google Scholar] [CrossRef]
  39. Rejeb, O.; Sardarabadi, M.; Ménézo, C.; Passandideh-Fard, M.; Dhaou, M.H.; Jemni, A. Numerical and model validation of uncovered nanofluid sheet and tube type photovoltaic thermal solar system. Energy Convers. Manag. 2016, 110, 367–377. [Google Scholar] [CrossRef]
  40. Hazami, M.; Riahi, A.; Mehdaoui, F.; Nouicer, O.; Farhat, A. Energetic and exergetic performances analysis of a PV/T (photovoltaic thermal) solar system tested and simulated under to Tunisian (North Africa) climatic conditions. Energy 2016, 107, 78–94. [Google Scholar] [CrossRef]
  41. Khanjari, Y.; Pourfayaz, F.; Kasaeian, A.B. Numerical investigation on using of nanofluid in a water-cooled photovoltaic thermal system. Energy Convers. Manag. 2016, 122, 263–278. [Google Scholar] [CrossRef]
  42. Usman, M.; Ali, M.; Rashid Tu Ali, H.M.; Frey, G. Towards zero energy solar households—A model-based simulation and optimization analysis for a humid subtropical climate. Sustain. Energy Technol. Assess. 2021, 48, 101574. [Google Scholar] [CrossRef]
  43. Cucchiella, F.; D’Adamo, I.; Lenny Koh, S.C. Environmental and economic analysis of building integrated photovoltaic systems in Italian regions. J. Clean. Prod. 2015, 98, 241–252. [Google Scholar] [CrossRef]
  44. Liu, B.; Fu, Z.; Wang, P.; Liu, L.; Gao, M.; Liu, J. Big-Data-Mining-Based Improved K-Means Algorithm for Energy Use Analysis of Coal-Fired Power Plant Units: A Case Study. Entropy 2018, 20, 702. [Google Scholar] [CrossRef] [PubMed]
Figure 1. Schematic diagram of photovoltaic roof system.
Energies 16 07152 g001
Figure 2. Schematic diagram of the energy transfer in the photovoltaic panel.
Energies 16 07152 g002
Figure 3. (a) Effect of radiation intensity on power generation efficiency and power generation; (b) effect of ambient temperature on power generation efficiency and power generation; (c) influence of wind speed on power generation efficiency and power generation.
Energies 16 07152 g003
Figure 4. (a) Monthly electricity generation when the photovoltaic roof is adjacent to the surrounding building; (b) monthly electricity generation when the photovoltaic roof is 15 m away from the surrounding building; (c) annual power generation of photovoltaic roof.
Energies 16 07152 g004
Figure 5. TRM-FD4 portable solar cell tester equipment.
Energies 16 07152 g005
Figure 6. Campus photovoltaic building.
Energies 16 07152 g006
Figure 7. Schematic diagram of campus photovoltaic building power generation system.
Energies 16 07152 g007
Figure 8. Campus photovoltaic buildings power generation statistics.
Energies 16 07152 g008
Figure 9. Schematic diagram of grid connection ratio.
Energies 16 07152 g009
Figure 10. Statistics of campus electricity.
Energies 16 07152 g010
Figure 11. Unit building area and per capita comprehensive energy consumption.
Energies 16 07152 g011
Figure 12. The effect of Ps changes on Pt and Ia.
Energies 16 07152 g012
Table 1. Analysis of emission reduction benefits.
CO2SO2NOxDust
Emission factor (kg/kgce)2.670.0220.010.017
Emission reduction (10 kt)5.590.050.020.04
Abatement cost (CNY/kg)0.023682.2
Emission reduction benefits (10 kCNY)128.63276.48167.5778.34
Disclaimer/Publisher’s Note: The statements, opinions and data contained in all publications are solely those of the individual author(s) and contributor(s) and not of MDPI and/or the editor(s). MDPI and/or the editor(s) disclaim responsibility for any injury to people or property resulting from any ideas, methods, instructions or products referred to in the content.

