1. Introduction
The increasing proportion of distributed generators (DGs) in the distribution network has brought a series of new challenges to traditional relay protection. For instance, when utility power is disconnected, unplanned islanding caused by DGs continuing to supply local loads can jeopardize the safety of maintenance personnel, affect auto reclosing, and reduce the quality of supply. For these reasons, grid-tied DGs are now required to be equipped with anti-islanding protection to improve supply reliability and network resilience [
1,
2,
3,
4].
Currently, the main methods of DG anti-islanding protection are categorized into three parts, namely the passive method, the active disturbance method, and the impedance measurement method. The passive method achieves protection by monitoring whether the voltage and frequency and other electrical quantities at the point of DG connection (PoC) exceed the limit, which is simple in principle and easy to implement. However, the non-detection zone (NDZ) is large, and it can easily malfunction if the power system is disturbed [
5,
6,
7,
8]. The active disturbance method promotes the exceeding of voltage, frequency, and other electrical quantities in the islanding state to achieve protection via injecting disturbance signals. Although this method has a low NDZ, it can easily lead to false actions and has a great impact on the stable operation of the power system [
9,
10,
11,
12,
13,
14]. The impedance measurement method achieves protection based on the difference in the measured impedance of the system at grid connection and islanding. This method is gaining attention because of its low NDZ, high immunity to interference, and low impact on power quality [
15,
16]. However, in multi-DG systems, the impedance measurement method suffers from the problem of unsynchronized injection signals, in which the injection signals from different DGs interfere with each other, leading to protection failure.
In order to solve the signal interference problem of the impedance method, the current research mainly focused on three directions: the impedance detection method based on coordinated signal injection between devices, the point of common coupling (PCC) impedance detection method, and the impedance detection method based on synchronous signal injection via DGs. In terms of the coordination of detection between devices, a peer-to-peer islanding detection strategy was proposed in [
17], in which DGs took turns injecting signals if there was no islanding detection signal in the system once islanding occurred, but the detection process was tedious due to the difficulty of cooperation between devices when the number of DGs was large. For this reason, a master–slave islanding detection strategy was proposed in [
18], in which the host DGs injected voltage signals of different frequencies to achieve islanding detection and send trip commands to the slaves, and the slave DGs exited operation when they received voltage signals containing trip commands. However, the reliability of this method is dependent on the normal operation of the host DG. In terms of centralized PCC detection, in [
19,
20], PCC impedance measurements were proposed using grid harmonics and harmonics signals injected via DG, but this method was greatly influenced by the system operating environment, and the impedance identification criterion was difficult to set. In terms of signal synchronization injection, Ref. [
21] used offline pre-sync to achieve the signal synchronization injection of each DG, but the operation was cumbersome and difficult to apply. In [
22], the power-frequency droop control was used to make the frequency and phase of the injected signals of each DG consistent spontaneously, but the synchronization accuracy was affected by the line parameters. In [
23,
24], the synchronous injection of islanding detection signals of different frequencies was achieved using bus voltages, but this required the continuous injection of islanding detection signals and did not address the problem of criterion rectification for multi-frequency signals. The above studies have shown that the impedance method in multi-DG systems still lacks an effective signal injection strategy and a corresponding criterion rectification method.
To address the above problems, an anti-islanding protection method based on impedance angle measurements was proposed. The proposed method takes the ZCPV as the reference to synchronously inject the islanding detection signal, which avoids the islanding detection failure caused by signal interference among DGs. Furthermore, the impedance-angle-based islanding protection criterion was designed based on the analysis of the measured impedance characteristics of the system at grid connection and islanding, which ensures the reliability of islanding detection when the number of DGs changes. To prevent extra hardware investment, a signal injection and detection strategy was designed that can be directly integrated into the existing DG control strategy. Finally, the method was verified using the RTDS real-time digital simulation platform.
2. Signal Interference Issues in Impedance Measurements for Anti-Islanding Protection in Multi-DG Systems
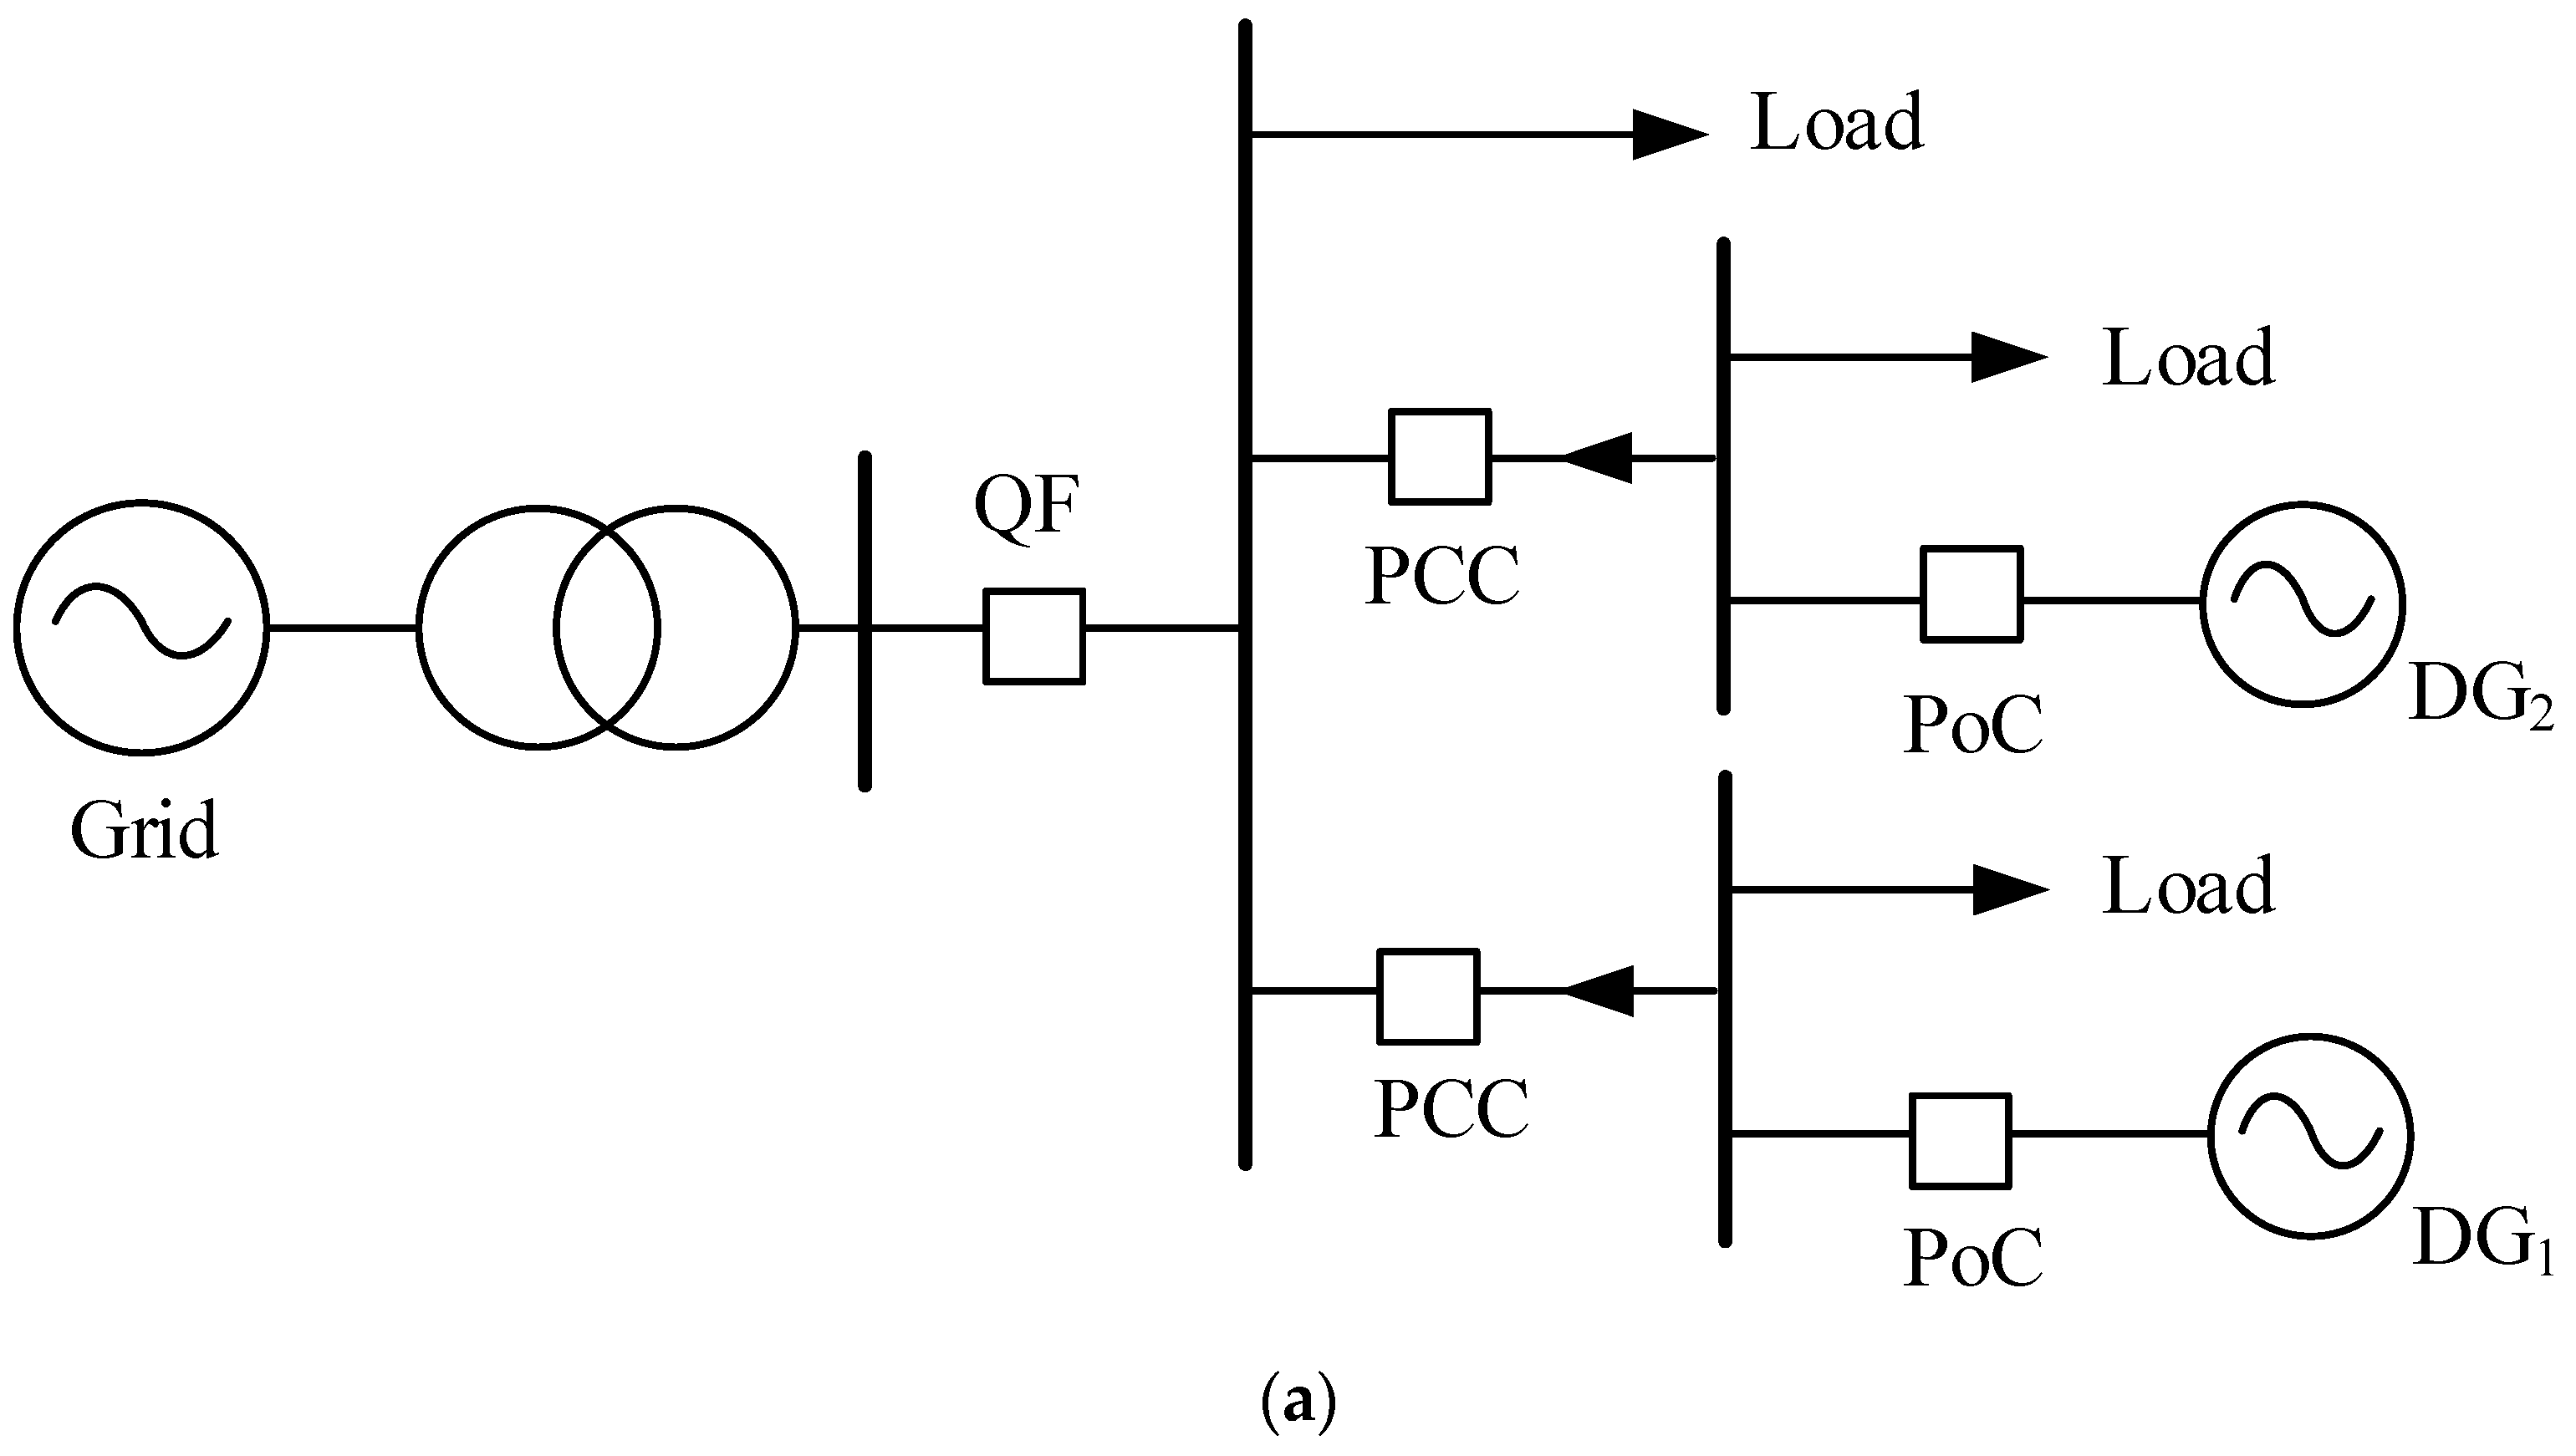
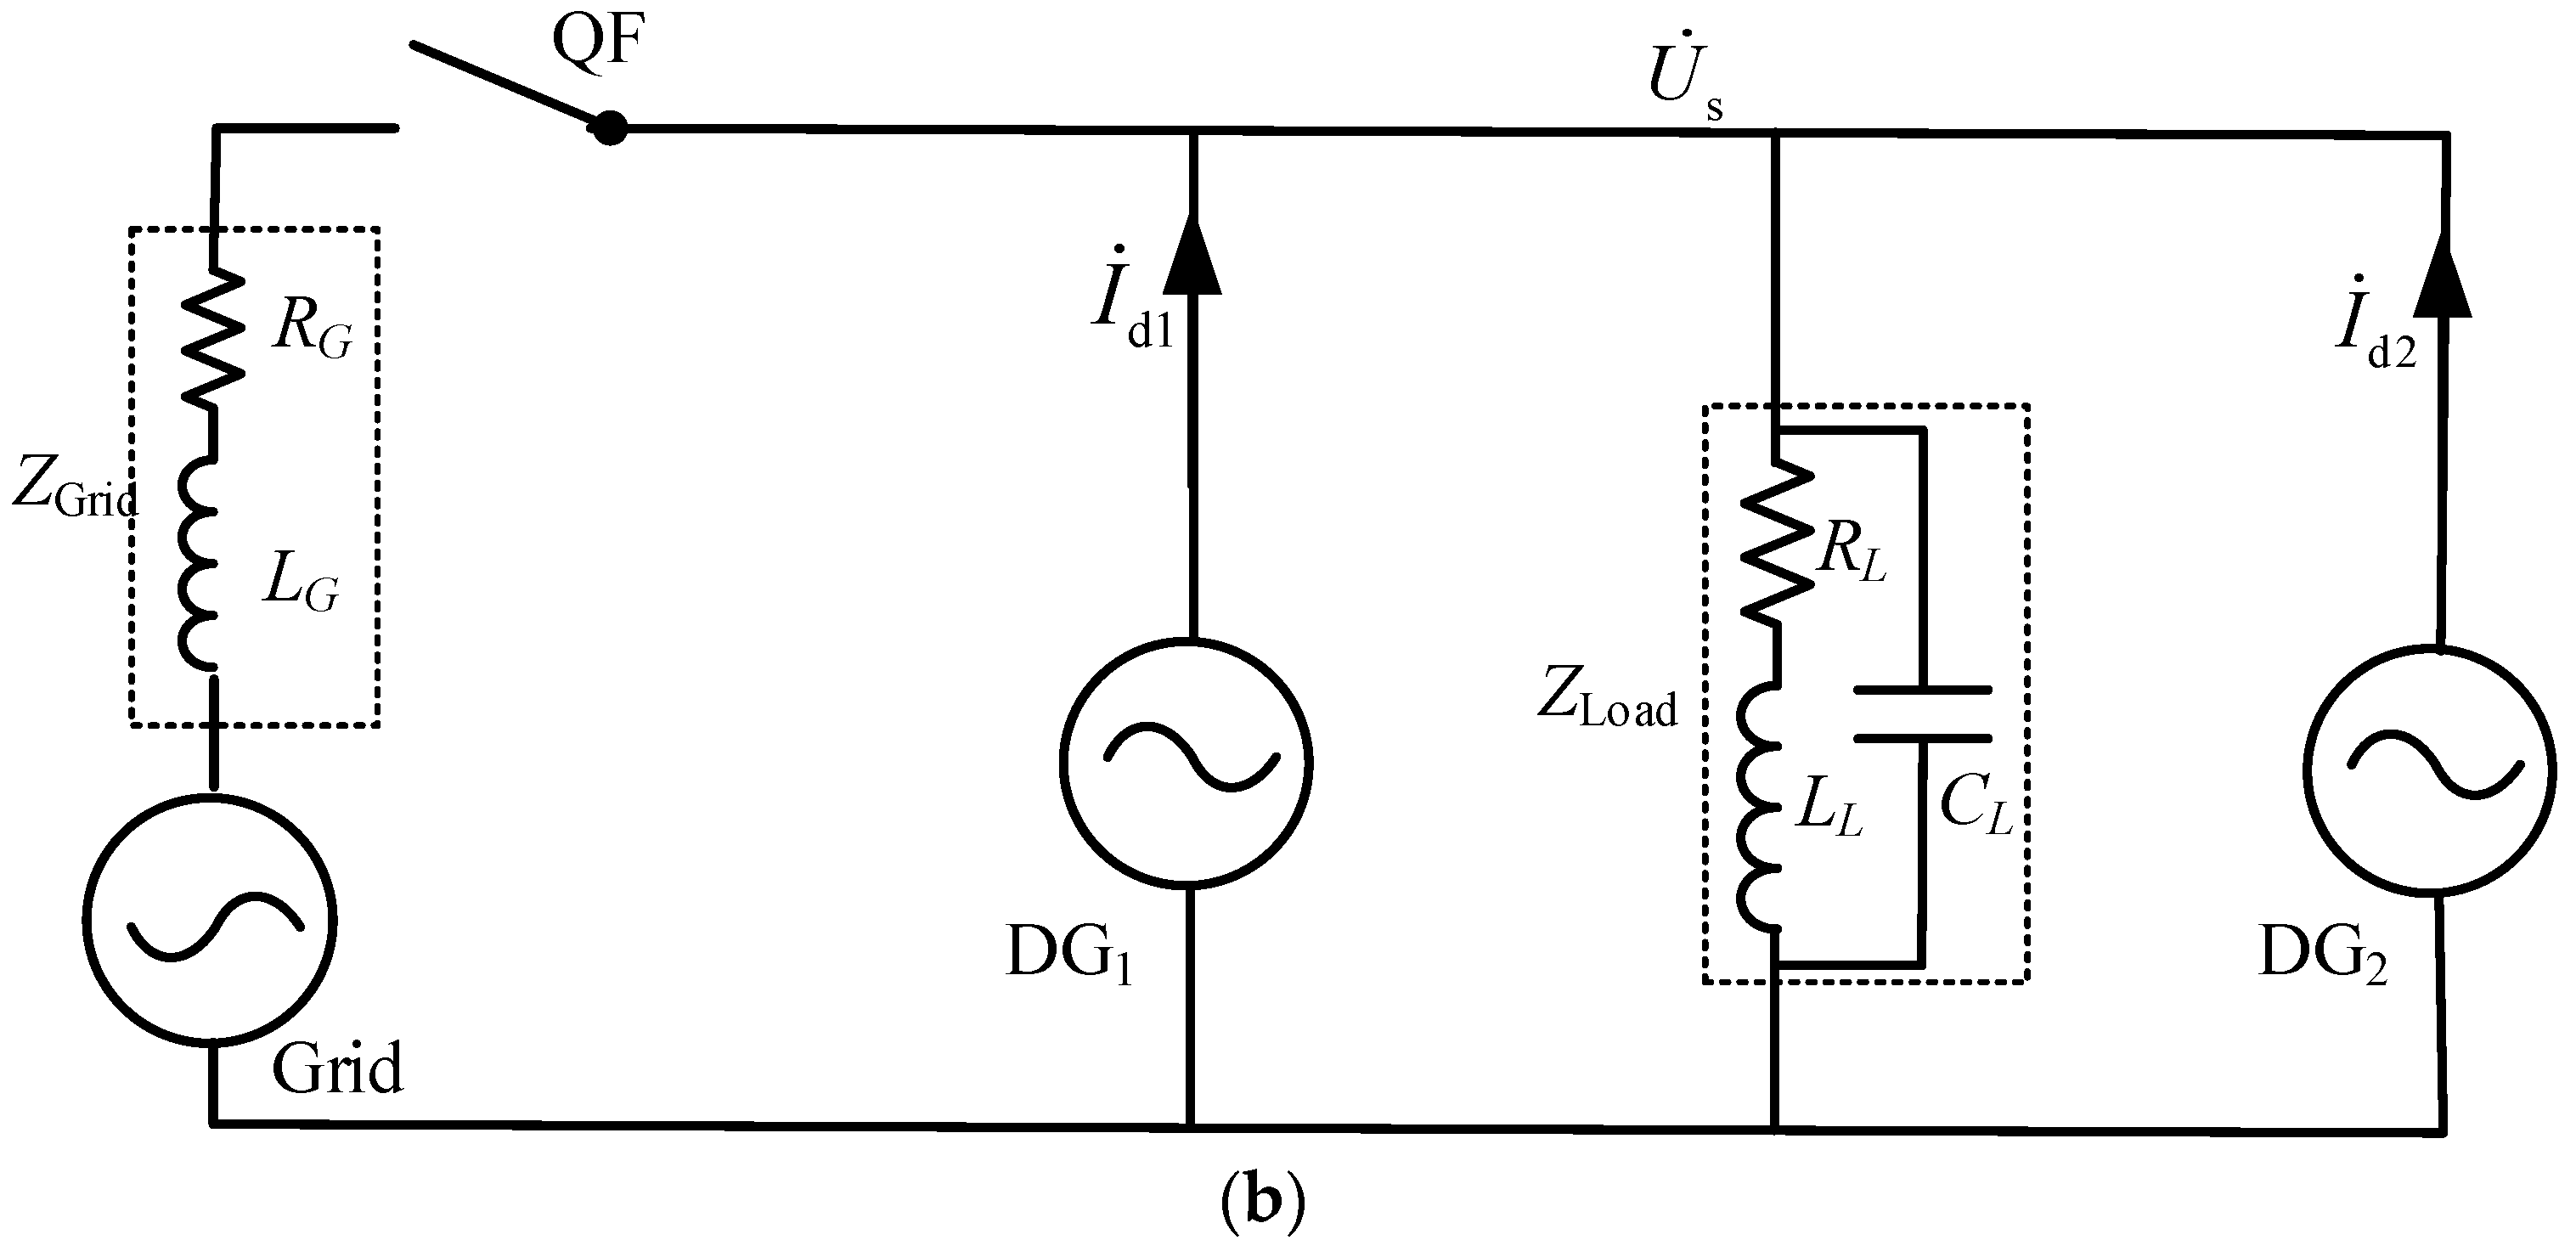
The measurement of impedance is typically performed by detecting signals that inject a current via the DGs. Based on the voltage response of the system, it is possible to determine whether it is currently in the islanding state. However, in a multi-DG system, the timing of signal injection is relatively independent for each DG, resulting in interference between the current detection signals of the DGs. This makes it impossible to accurately obtain the measured impedance of the system.
Take the double DG distribution system and its equivalent circuit shown in
Figure 1 as an example. In
Figure 1b, Z
Grid is the grid impedance, which is mainly derived from the transformer leakage impedance, Z
Load is the load impedance,
and
are the islanding detection signals injected into the system via DG
1 and DG
2, respectively, and
is the voltage response generated by
and
on the system impedance. Then, the grid-tied measuring impedance Z
g1 and the islanding measuring impedance Z
i1 of DG
1 are determined as follows:
In Equation (1), the measured impedance of DG
1 depends not only on the grid-connected mode and islanded mode but also on the phase relationship of the injected signal between the DGs. Given
in the grid-connected mode and
in the islanded mode, Equation (1) can be written as:
In Equation (2), and are the phase relations for and in grid connection and islanding. Since the DGs inject signals independently of each other at all times, the values of and are arbitrary, making it impossible for DG1 to identify the ZGrid and ZLoad based on the measured impedance, which leads to the failure of the anti-islanding protection.
4. Signal Synchronization Injection Strategy in DG
This section describes the design of an islanding detection signal synchronization injection method that is integrated into existing DG control strategies and uses the ZCPV as the synchronization signal. The following section describes the signal injection strategy, signal design, and current loop performance analysis.
4.1. Signal Injection and Islanding Detection Strategies in DG
Most DGs use the current loop as the control inner loop and transform the three-phase AC electrical quantities to the DC component in the dq synchronous rotating coordinate system via park transformation to simplify the control loop design and improve the response performance of the current loop. Meanwhile, to ensure an active output, the DG’s q-axis current command is 0 [
27]. Therefore, combined with the DG control strategy, the signal injection and islanding determination strategy are formed, as shown in
Figure 4.
In
Figure 4, the DG needs to monitor the bus voltage (phase A voltage) to capture the ZCPV in order to ensure synchronous signal injection. The DG starts up islanding detection when voltage distortion is detected and adds the detection signal to the q-axis current control command
iq* to ensure the quality of the injected detection signal and to reduce the disturbance to the bus voltage. In order to avoid the influence of a system frequency change on the measurement of the impedance angle, the islanding detection signal is intercepted from the q-axis component
uoq of the voltage signal and
ioq of the q-axis component of the current signal at the PoC of the DG merging point. The impedance angle is calculated from the DFT of the detection signal to determine the operating status of the islanding. Ultimately, the main workflow of the proposed anti-islanding protection method in the DG is shown in
Figure 5.
4.2. A. Signal Synchronization Injection Strategy
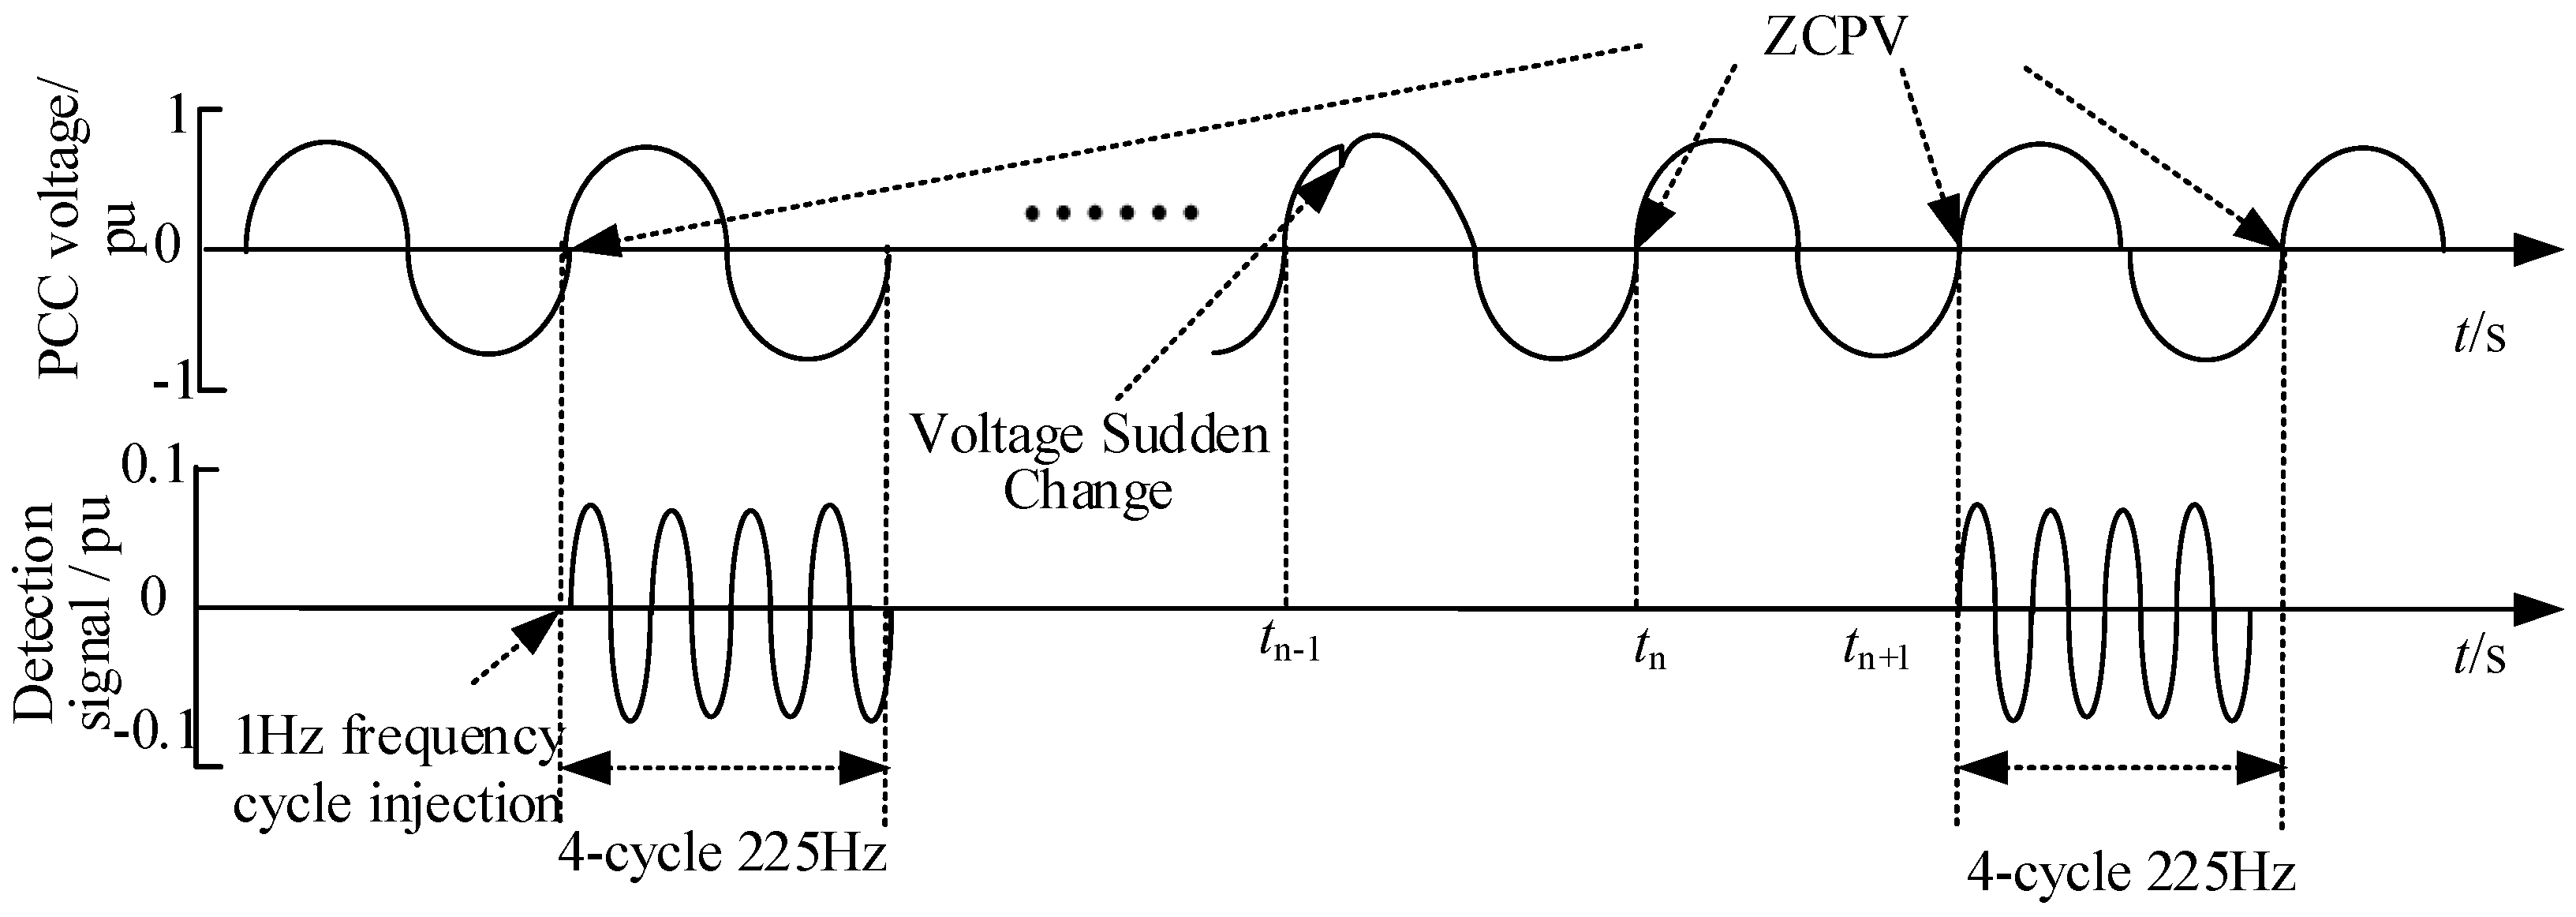
To ensure the reliability of islanding detection, two detection signal injection modes were proposed. One is to use the ZCPV as the signal synchronization injection moment at a frequency of 1 Hz. One is that, when a sudden change in the voltage at the PoC occurs, the DG completes the injection of the islanding detection signal with the adjacent ZCPV after detecting the sudden voltage change, as shown in
Figure 6. In the islanding detection initiated via the voltage mutation, the second-nearest ZCPV should be captured as the injection moment of the islanding detection signal in order to avoid the distortion of the voltage waveform affecting the measurement of the impedance angle. As shown in
Figure 6, if the DG detects a voltage mutation after the end of the ZCPV at moment t
n−1, the ZCPV at moment t
n+1 is the injection moment of the islanding detection signal.
Taking the 225 Hz sinusoidal signal of a 4-week waveform as the islanding detection signal, it can effectively avoid the mutual interference problem when each DG injects signals at different ZCPV due to measurement error. Meanwhile, the injection time of the detection signal is less than 0.02 s when the system frequency is 50 Hz, which effectively avoids the disturbance of the system voltage.
4.3. Self-Synchronization Principle
When injecting the islanding detection signal periodically at a frequency of 1 Hz, each DG can capture a different ZCPV injection signal due to internal clock deviations. For this purpose, it is necessary to introduce an auxiliary synchronization strategy that allows each DG to inject islanding detection signals at the same ZCPV at a frequency of 1 Hz. The specific synchronization strategy is as follows:
Based on the internal timer, if the DG does not detect the pre-synchronization signal within 1 s (or 50 cycles), it injects an islanding detection signal at the first ZCPV thereafter;
If the DG detects an islanding detection signal within 1 s, it resets the internal timer of the DG and takes the ZCPV corresponding to the captured islanding detection signal as the zero moment to synchronize this DG with the DG that injected the signal earlier.
Figure 7 shows a schematic diagram of the synchronization process of the four DGs. If DG
2 in the system injects the signal first and is only received by DG
3, DG
2,3 will inject the signal simultaneously in the next cycle. Thereafter, the detection signal is strengthened and causes the remaining DGs to receive the signal. Eventually, each DG in the system is synchronized to the same time reference datum to achieve the injection of signals at the same ZCPV. Considering the disturbance of the injected signals to the grid voltage during the synchronization process, the injection signal amplitude adjustment curve is introduced, as shown in
Figure 8.
In
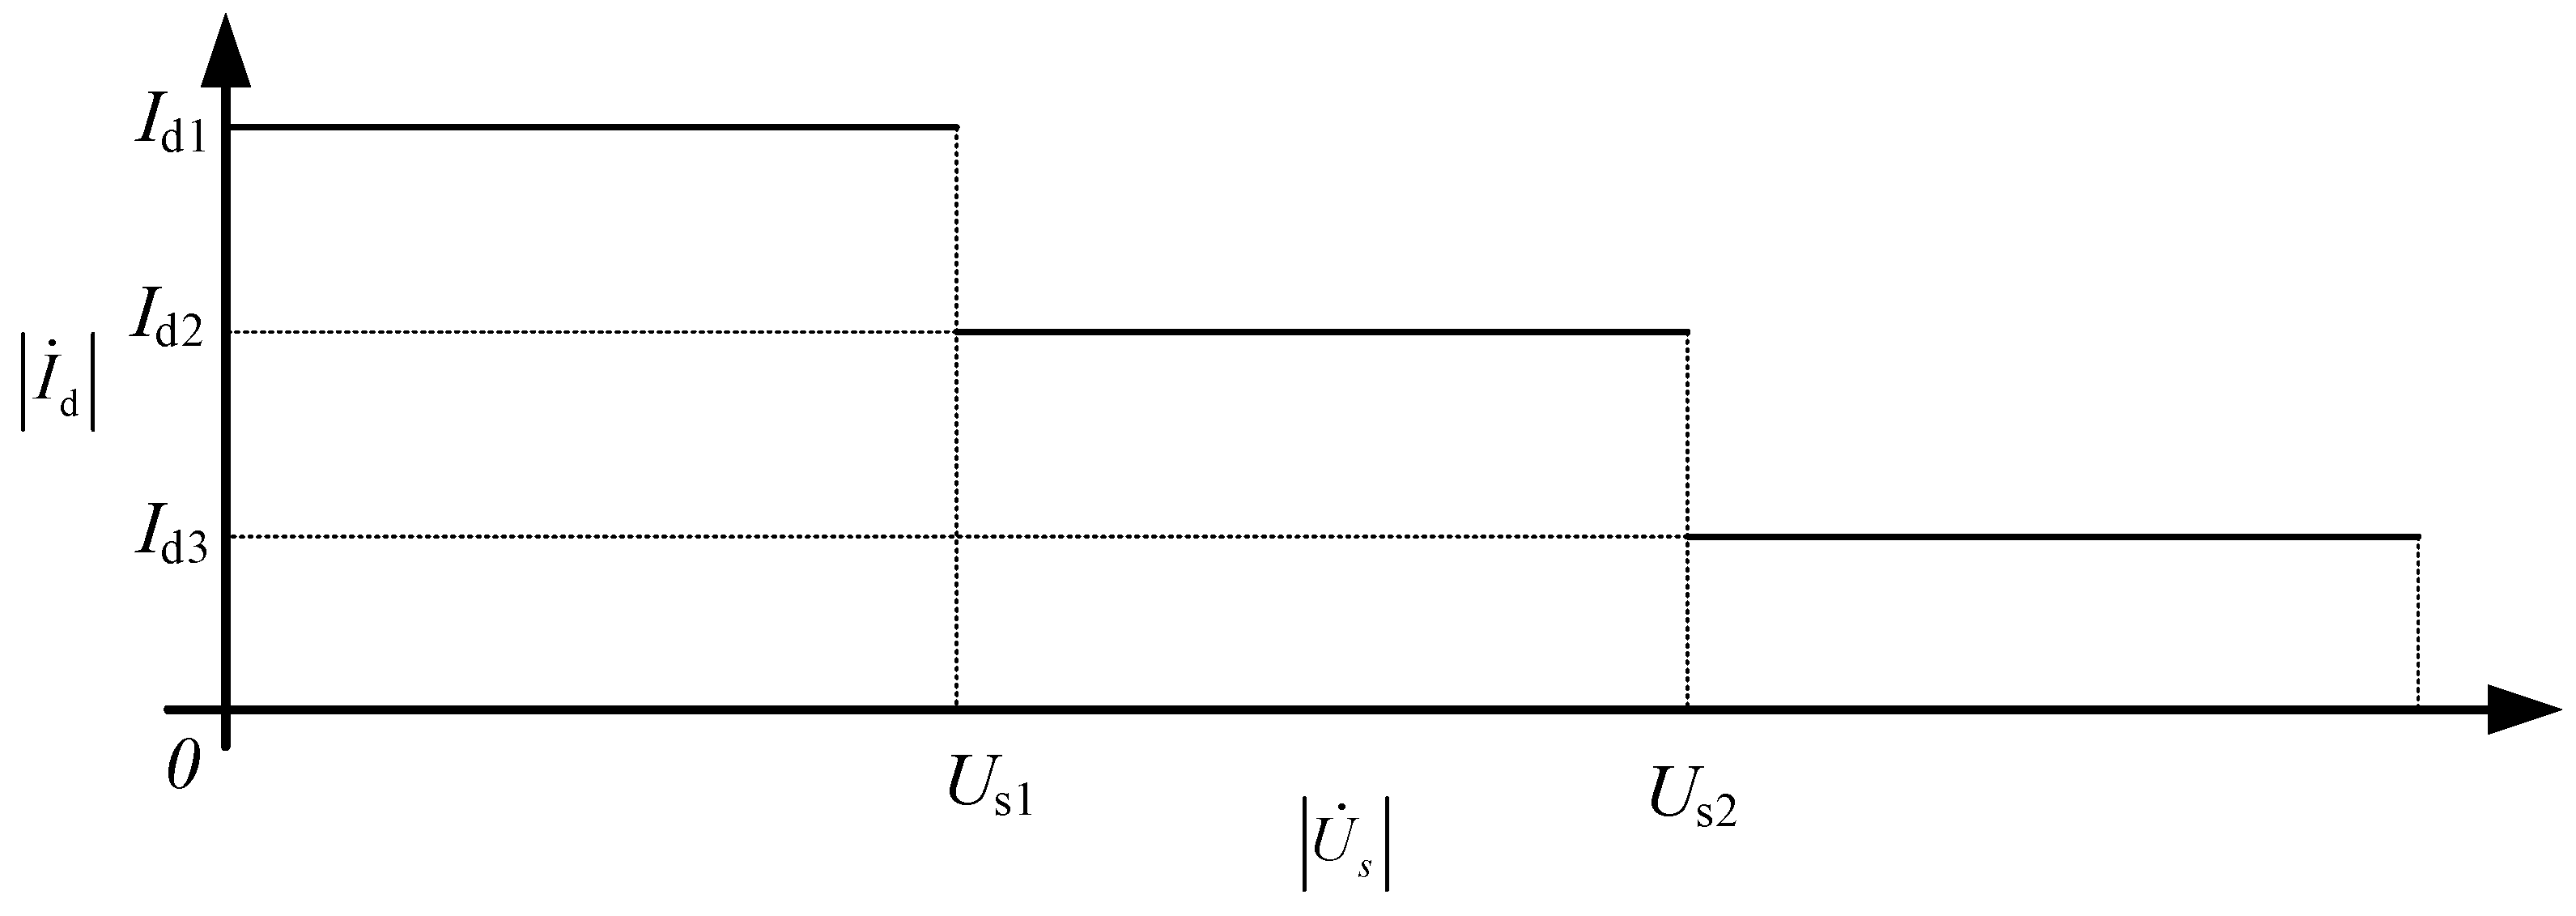
Figure 8, as the amplitude of the voltage response is generated via the islanding detection letter increasing, each DG gradually reduces the amplitude of the output detection signal in order to reduce the disturbance of the system voltage via the islanding detection. To simplify the amplitude adjustment strategy of the islanding detection signal, the adjustment process is divided into three steps, as follows:
In Equation (8), is the islanding detection signal, and is the voltage response generated by the islanding detection signal. Id1, Id2, and Id3 are different amplitude configuration parameters of the islanding detection signal, and Us1 and Us2 are the amplitude boundaries of the voltage response when adjusting the amplitude of the islanding detection signal. With the above strategy, the voltage perturbation via the islanding detection signal can be avoided during the synchronization process of each DG.
4.4. Current Loop Analysis
The output characteristics of the DG current loop will have an effect on the control accuracy of the injected signal [
28,
29]. The bandwidth of the current control loop should be one-tenth of the switching frequency. Considering that the current grid-connected DG mostly adopts 10~20 kHz as the switching frequency [
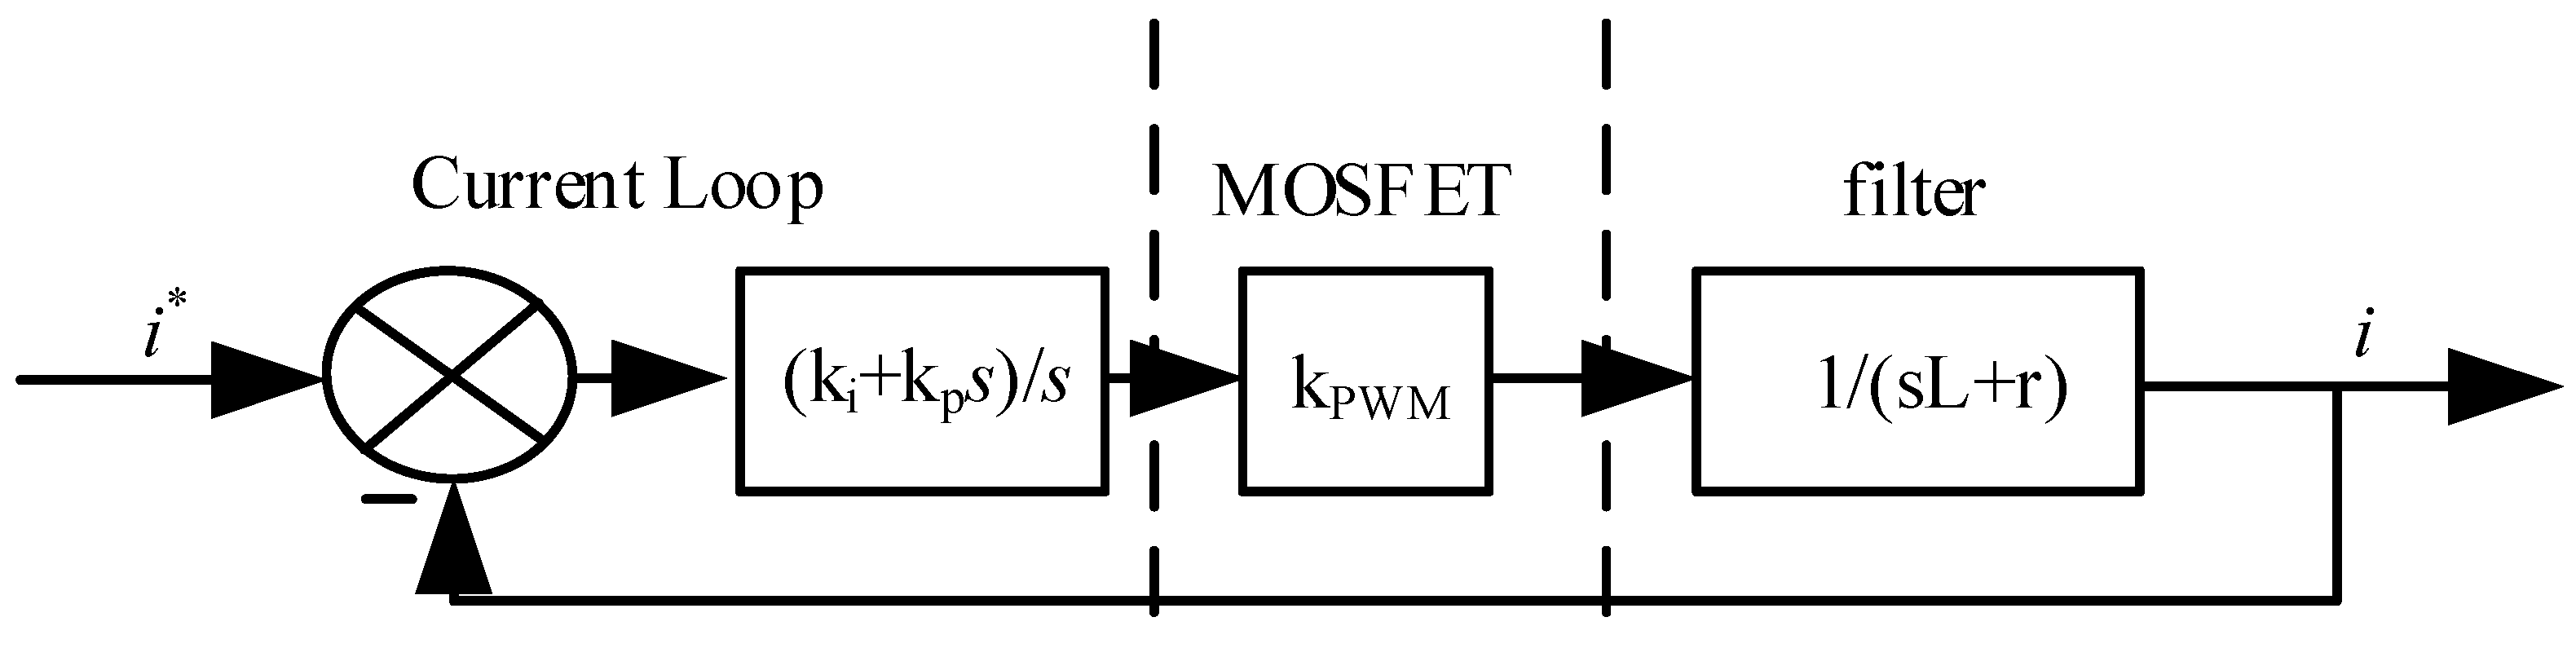
30], it can be seen that the bandwidth of the current control loop should be 1~2 kHz. At present, the current loop control loop adopts the decoupling control design under the dq coordinate system, and its basic structure is shown in
Figure 9.
In
Figure 9,
i* is the current loop control command, and
i is the actual output current signal.
ki and
kp are the proportional and integral coefficients of the current loop PI controller, and
kpwm is the open-loop gain of the inverter circuit.
L and r are the inductance and parasitic resistance of the filter inductor. In order to simplify the analysis, the block diagram of the current loop transfer function in
Figure 9 only considers the pure inductor as the filter, and then the current loop transfer function is obtained according to the block diagram:
Based on Equation (9), the frequency response of the transfer function for a current loop bandwidth of 1 kHz and 2 kHz is found.
As can be seen in
Figure 10, when the current loop bandwidth is in the range of 1 kHz to 2 kHz, the phase angle deviation between the commanded signal and the actual output signal is −9° ± 3° for the 225 Hz signal. Since the measured impedance angle is calculated based on the q-axis components of the voltage and current detection signals at the PoC of the DG, what affects the measurement accuracy is the relative deviation of the injected signals of each DG, which corresponds to ±3° for the 225 Hz signal. It can be seen that the delay characteristic of the current loop has a limited effect on the impedance angle measurement of the 225 Hz signal.
5. Simulation Validation
The simulation circuit was constructed on the RTDS real-time digital simulation platform, as shown in
Figure 11. The simulation circuit consists of four DGs and two loads, where DG
2 and DG
3 are connected by a long section of line. Each DG is controlled with constant power, and the system is operated on the grid with a frequency of 50 Hz and a bus line voltage of 380 V. The specific simulation parameters of the system are shown in
Table 1. The power of DG
1–2 is set to be twice the power of DG
3–4 to reflect the diversity of the equipment on site. The power of Load
1 is twice the power of Load
2 to reflect the diversity of load capacity. Each load is equipped with a reactive power compensation device to meet the power factor constraints. The line impedance Z
line is set to reflect the effect of line parameters in the low-voltage distribution network in the proposed method.
To verify the effectiveness of the proposed method, the following is a comparison and analysis of the proposed method with OFP/UFP and OVP/UVP in terms of grid disturbance identification and islanding identification. The proposed method starts islanding detection when the system frequency change rate exceeds ±0.02 Hz/s, and it sets the detection signal strength at 5% of the DG output frequency’s current amplitude. According to the technical requirements of the distributed power supply grid connection [
3,
31], the voltage protection action criterion is configured as
U ≥ 1.1 or
U ≤ 0.85, and the frequency protection action criterion is
f ≥ 50.5 Hz or
f ≤ 49.5 Hz. To simplify the data analysis, the simulation only presents the results of DG
1 at the transformer outlet and DG
4 at the end of the line. The specific simulation conditions are shown in
Table 2.
5.1. Grid-Tied Identification Simulation Analysis
5.1.1. Frequency Disturbance Simulation Results
Figure 12 shows the simulation results of the system operating frequency suddenly dropping from 50 Hz to 49 Hz at 0.2 s in the grid-connected mode. Whereas
Figure 12a,b shows DG
1 and DG
4 collecting the q-axis voltage
uoq, the q-axis current
ioq, and the A-phase bus voltage
ua at the PoC, respectively,
Figure 12c shows the system frequency
f. Based on the simulation results, it can be seen that the proposed method activates the islanding detection signal injection at the moment of frequency change. According to the design requirements, the synchronous signal injection is completed at the second ZCPV after the islanding detection is activated, and the detection signals of the q-axis voltage and q-axis current are intercepted at the PoC. It can be seen that the q-axis voltage is ahead of the q-axis current waveforms in DG
1 and DG
4, and the corresponding q-axis impedance angles are 87° and 70°. The proposed method identifies grid-tied operation well, but DG
4 has a lower impedance angle due to the influence of line parameters. According to the simulation results in
Figure 12, there is no significant change in voltage, but the operating frequency exceeds the set limit, resulting in OFP/UFP maloperation.
5.1.2. Voltage Disturbance Simulation Results
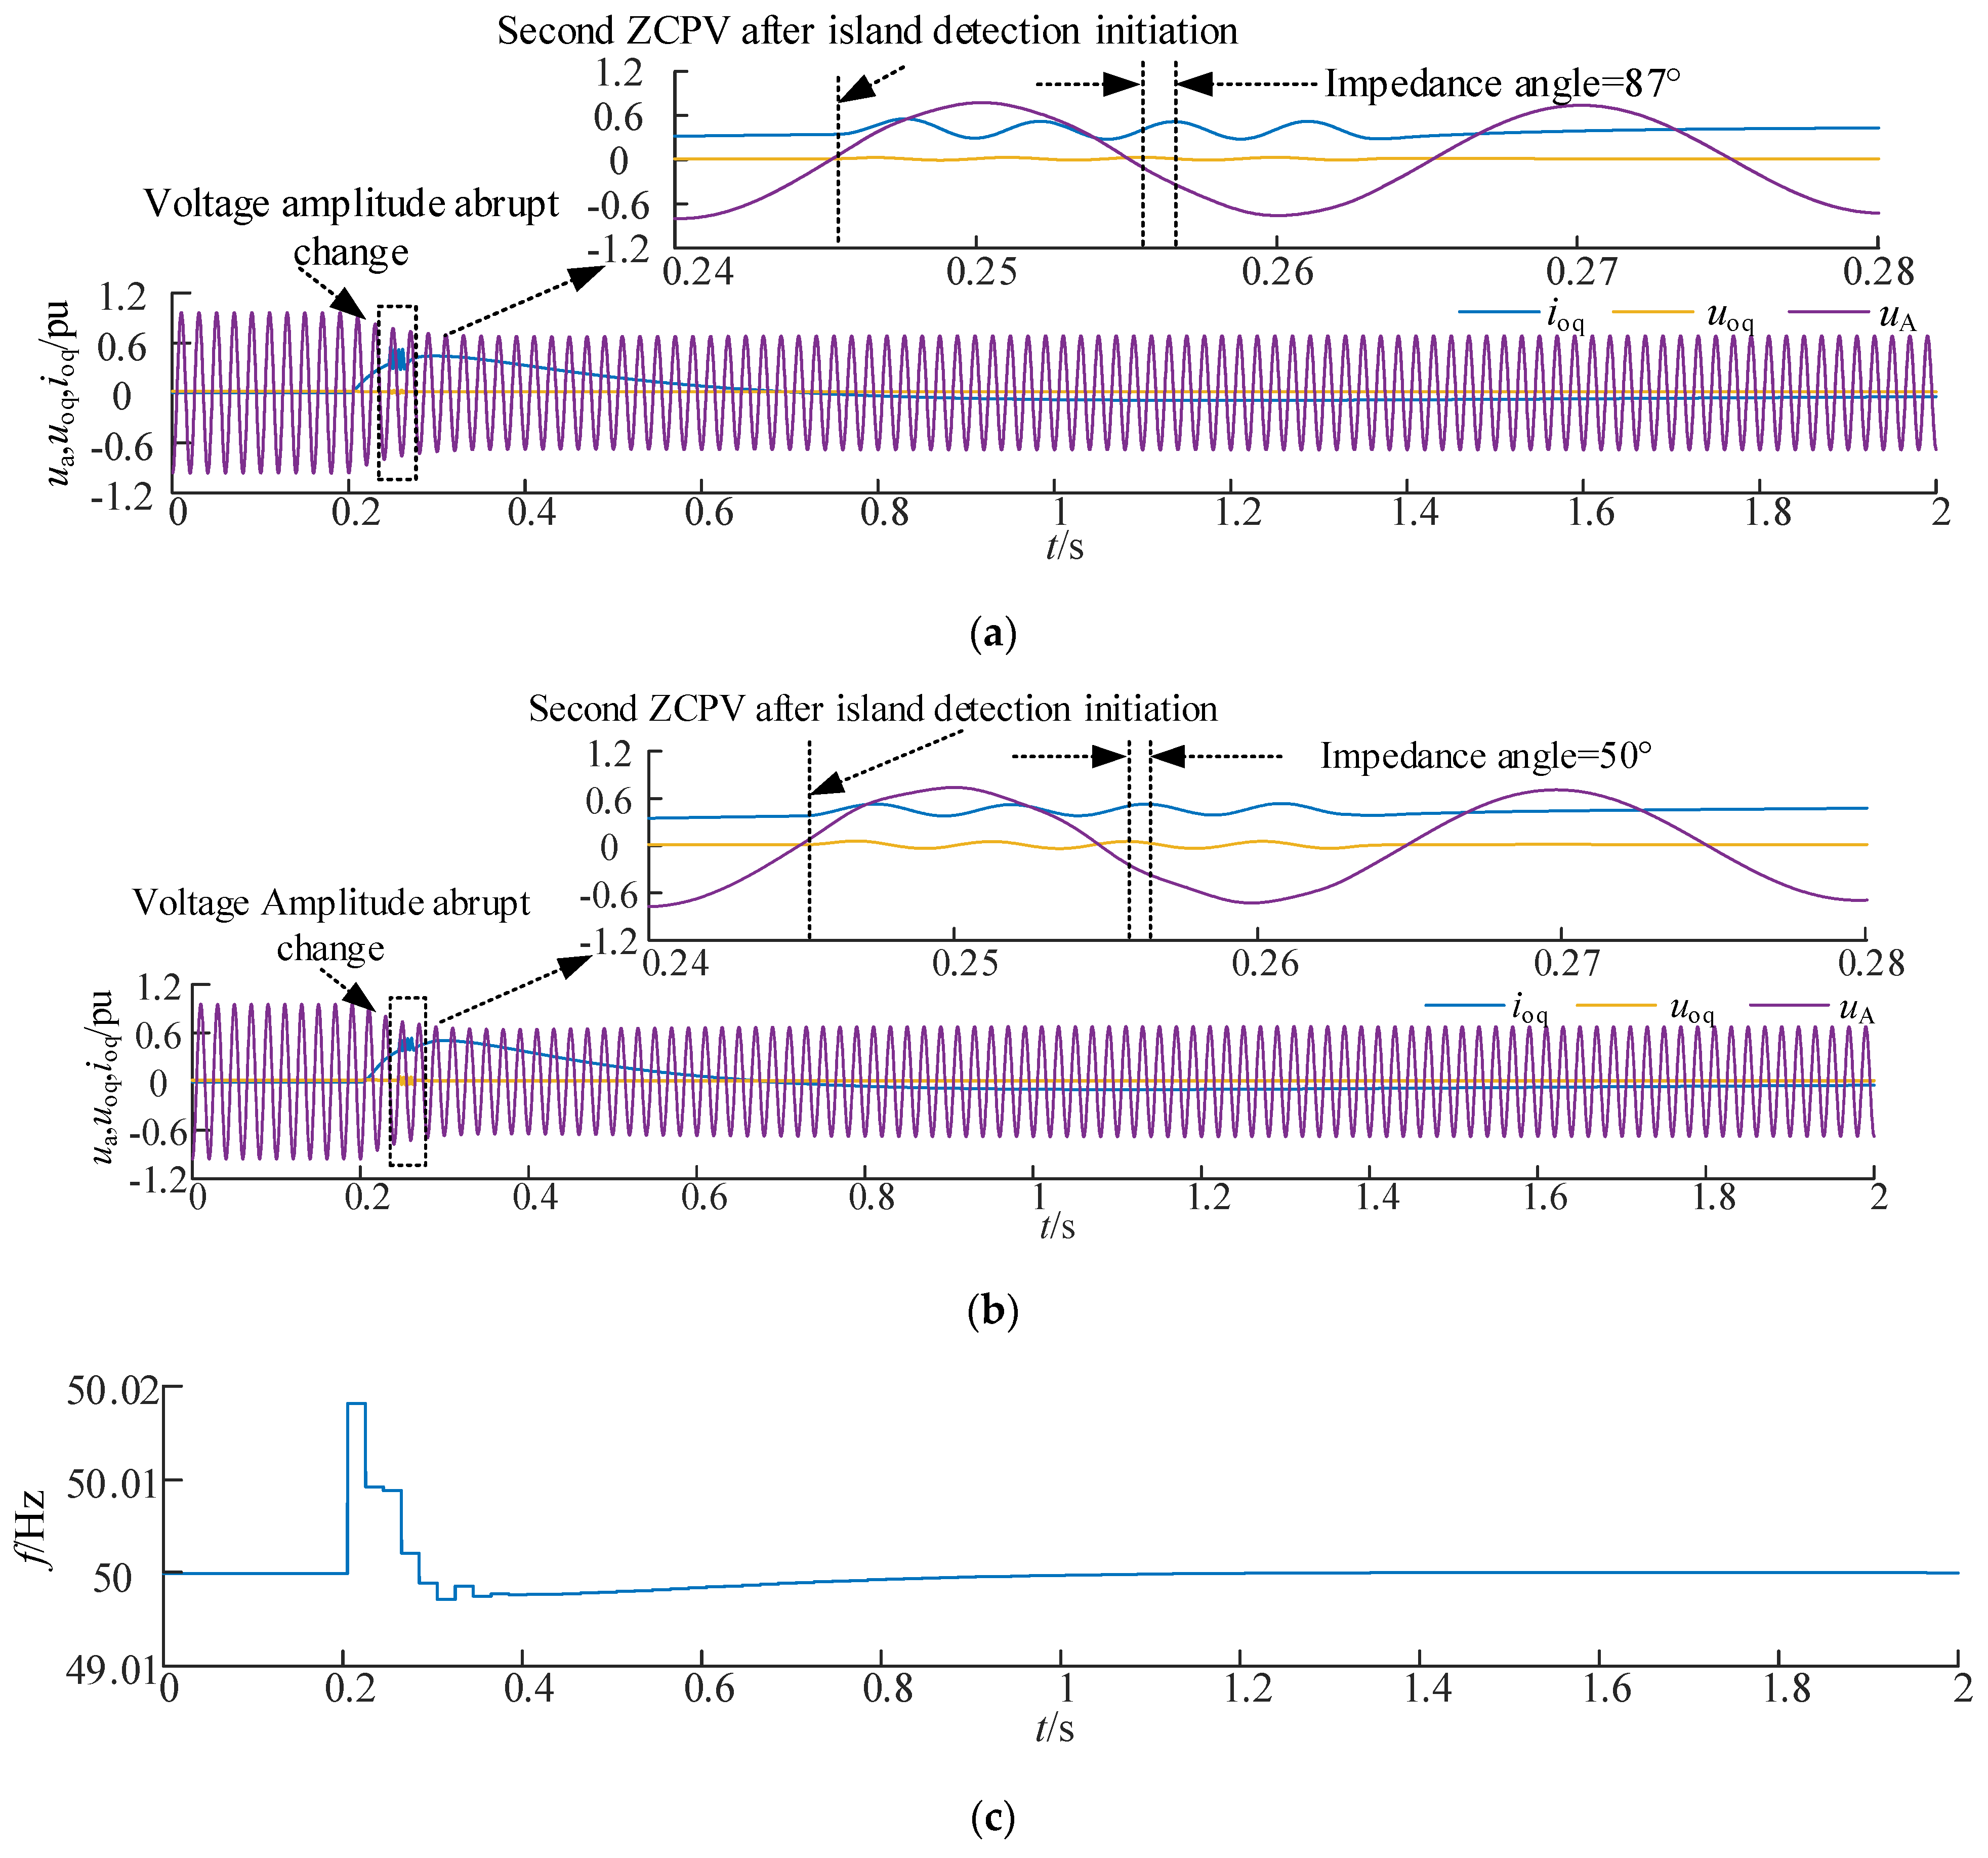
Figure 13 shows the simulation results for a sudden 30% drop in system operating voltage at 0.2 s in the grid-connected mode. Whereas
Figure 13a,b shows DG
1 and DG
4 collecting the q-axis voltage
uoq, the q-axis current
ioq, and the A-phase bus voltage
ua at the PoC, respectively,
Figure 13c shows the system frequency
f. Based on the simulation results, it can be seen that the proposed method activates the islanding detection signal injection at the moment of a voltage change. According to the design requirements, the synchronous signal injection is completed at the second ZCPV after the islanding detection is activated, and the detection signals of the q-axis voltage and q-axis current are intercepted at the PoC. It can be clearly seen that the q-axis voltage waveforms of DG
1 and DG
4 are ahead of the q-axis current waveforms, and the q-axis impedance angles of DG
1 and DG
4 are 87° and 50°, according to the DFT. It can be seen that the sudden drop in voltage causes significant interference in the capture of the detection signal of DG
4, making it unable to identify the grid-connected operation state by criteria, but it has also not been identified as the island state, thus avoiding maloperation. However, the impedance angle measurements of DG
4 show that the DG at the end of a small-capacity line may not be able to accurately identify the grid-connected mode when subjected to voltage disturbances. According to the simulation results in
Figure 13, the voltage drop in this scenario triggers the OVP/UVP maloperation, while the system operating frequency remains in the normal range.
5.1.3. Grid Voltage Phase Jumps
Figure 14 shows the simulation results for a sudden 10° increase in the system voltage phase at 0.2 s in the grid-connected mode. Whereas
Figure 14a,b shows DG
1 and DG
4 collecting the q-axis voltage
uoq, the q-axis current
ioq, and the A-phase bus voltage
ua at the PoC, respectively,
Figure 14c shows the system frequency
f. Based on the simulation results, it can be seen that the proposed method triggers the islanding detection signal injection at the moment of the sudden increase in the voltage phase angle. According to the design requirements, the synchronous signal injection is completed at the second ZCPV after the islanding detection is activated, and the detection signals of the q-axis voltage and q-axis current are intercepted at the PoC. It can be clearly seen that the q-axis voltage waveforms of DG
1 and DG
4 are ahead of the q-axis current waveforms, and the q-axis impedance angles of DG
1 and DG
4 are 86° and 70°, according to the DFT. The proposed method identifies the grid-connected mode well, but the impedance angle measurement results for DG
4 are low due to the influence of line parameters. According to the simulation results in
Figure 14, it can be seen that the sudden increase in the grid voltage phase has an impact on the frequency measurement, once making the instantaneous frequency as high as 51.5 Hz, which may cause the OFP/UFP to misfire.
5.2. Electricity Quality Analysis
The spectral analysis of the PCC voltage before and after signal injection is depicted in
Figure 15. From the spectral analysis of the 0.02 waveform with and without the signal injection, it can be seen that the detection signal caused a significant increase in harmonics in the range of 150 Hz to 450 Hz in the system voltage and increased the THD by 2.79%, which had some impact on the waveform quality of the voltage. Considering that the duration is only 0.02 s, the overall impact was limited.
5.3. Simulation Analysis of Island Identification
5.3.1. Power Balance Islanding Simulation Analysis
Figure 16 shows the simulation results for a system where the QF breaks off at 0.2 s to form the islanded mode when the DG output power is exactly matched to the load. Whereas
Figure 16a,b shows DG
1 and DG
4 collecting the q-axis voltage
uoq, the q-axis current
ioq, and the A-phase bus voltage
ua at the PoC, respectively,
Figure 16c shows the system frequency
f. According to the simulation results, it can be seen that the system generates a frequency disturbance at around 0.25 s, which triggers the islanding detection signal injection. According to the design requirements, the synchronous signal injection is completed at the second ZCPV after the islanding detection is activated, and the detection signals of the q-axis voltage and q-axis current are intercepted at the PoC. It can be clearly seen that the q-axis voltage waveforms of DG
1 and DG
4 lag behind the q-axis current waveforms, and the q-axis impedance angles of DG
1 and DG
4 are −59° and −39°, according to the DFT. It can be seen that each DG can identify the islanded mode. However, the voltage and frequency changes are not obvious at this time, so the OFP/UFP and OVP/UVP may refuse to operate.
5.3.2. Simulation Analysis of Reactive Power Imbalance Islanding
Figure 17 shows the simulation results for a 30% reduction in reactive power compensation based on the initial setting, with the QF breaking off at 0.2 s to form the islanded mode. Whereas
Figure 17a,b shows DG
1 and DG
4 collecting the q-axis voltage
uoq, the q-axis current
ioq, and the A-phase bus voltage
ua at the PoC, respectively,
Figure 17c shows the system frequency
f. According to the simulation results, it can be seen that the system generates a frequency disturbance at around 0.2 s, which triggers the islanding detection signal injection. According to the design requirements, the synchronous signal injection is completed at the second ZCPV after the islanding detection is activated, and the detection signals of the q-axis voltage and q-axis current are intercepted at the PoC. It can be clearly seen that the q-axis voltage waveforms of DG
1 and DG
4 lag behind the q-axis current waveforms, and the q-axis impedance angles of DG
1 and DG
4 are −53° and −34°, according to the DFT. This shows that each DG can identify the islanded mode. However, the shortage of reactive power at this time will cause the system frequency to rapidly exceed the set threshold and trigger OFP/UFP.
5.3.3. Simulation Analysis of Active Unbalance Islanding
Figure 18 shows the simulation results of the system forming the islanded mode when the QF breaks off at 0.2 s based on the initial setting of a 20% reduction in active power. Whereas
Figure 18a,b shows DG
1 and DG
4 collecting the q-axis voltage
uoq, the q-axis current
ioq, and the A-phase bus voltage
ua at the PoC, respectively,
Figure 18c shows the system frequency
f. According to the simulation results, it can be seen that the system generates a frequency disturbance at around 0.2 s, which triggers the islanding detection signal injection. According to the design requirements, the synchronous signal injection is completed at the second ZCPV after the islanding detection is activated, and the detection signals of the q-axis voltage and q-axis current are intercepted at the PoC. It can be clearly seen that the q-axis voltage waveforms of DG
1 and DG
4 lag behind the q-axis current waveforms, and the q-axis impedance angles of DG
1 and DG
4 are −46° and −37°, according to the DFT. This shows that each DG can identify the islanded mode. However, the shortage of reactive power at this time will cause the system voltage and frequency to rapidly exceed the set threshold and trigger OFP/UFP and OVP/UVP.
Combining the above simulation results, a performance comparison of the proposed method with OFP/UFP and OVP/UVP in simulation is shown in
Table 3.
Table 3 shows that the proposed method effectively avoids the rejection and maloperation problems of OFP/UFP and OVP/UVP in the simulated scenarios and provides an effective solution to the problem of anti-islanding protection in multi-DG systems.
6. Conclusions
For the current issue of signal disturbance in the impedance measurement of anti-islanding protection, this article proposed a method for the synchronous injection of detection signals through the ZCPV to avoid the failure of impedance measurements due to signal disturbance. The proposed islanding identification criterion based on the measured impedance angle can accurately identify the islanding operation state under the conditions of grid disturbance and power balance in islanding, avoiding the problem of rejection and false action. Additionally, the signal injection strategy, which can be integrated with existing DG control platforms, allows the method to avoid additional hardware investment in practical applications. The proposed method provides a feasible solution to address the shortcomings of existing anti-islanding protection.
The simulation results show that the impedance angle measurements of the proposed method are more affected by grid voltage disturbances for DGs located at the end of the line. Therefore, optimizing the impedance angle criterion based on the DG connection location and exploring the cooperation strategy with OFP/UFP and OVP/UVP will be the key points of further work.

 ,
, 


