
Quantitative Risk Assessment of Hydrogen Refueling Station in Cheonan City of South Korea


Abstract
:1. Introduction
2. Materials and Methods
2.1. Scenario
2.1.1. HRS Specifications
2.1.2. Accident Scenario
2.1.3. Weather Conditions
2.2. Hydrogen Risk Analysis
2.2.1. Jet Fire
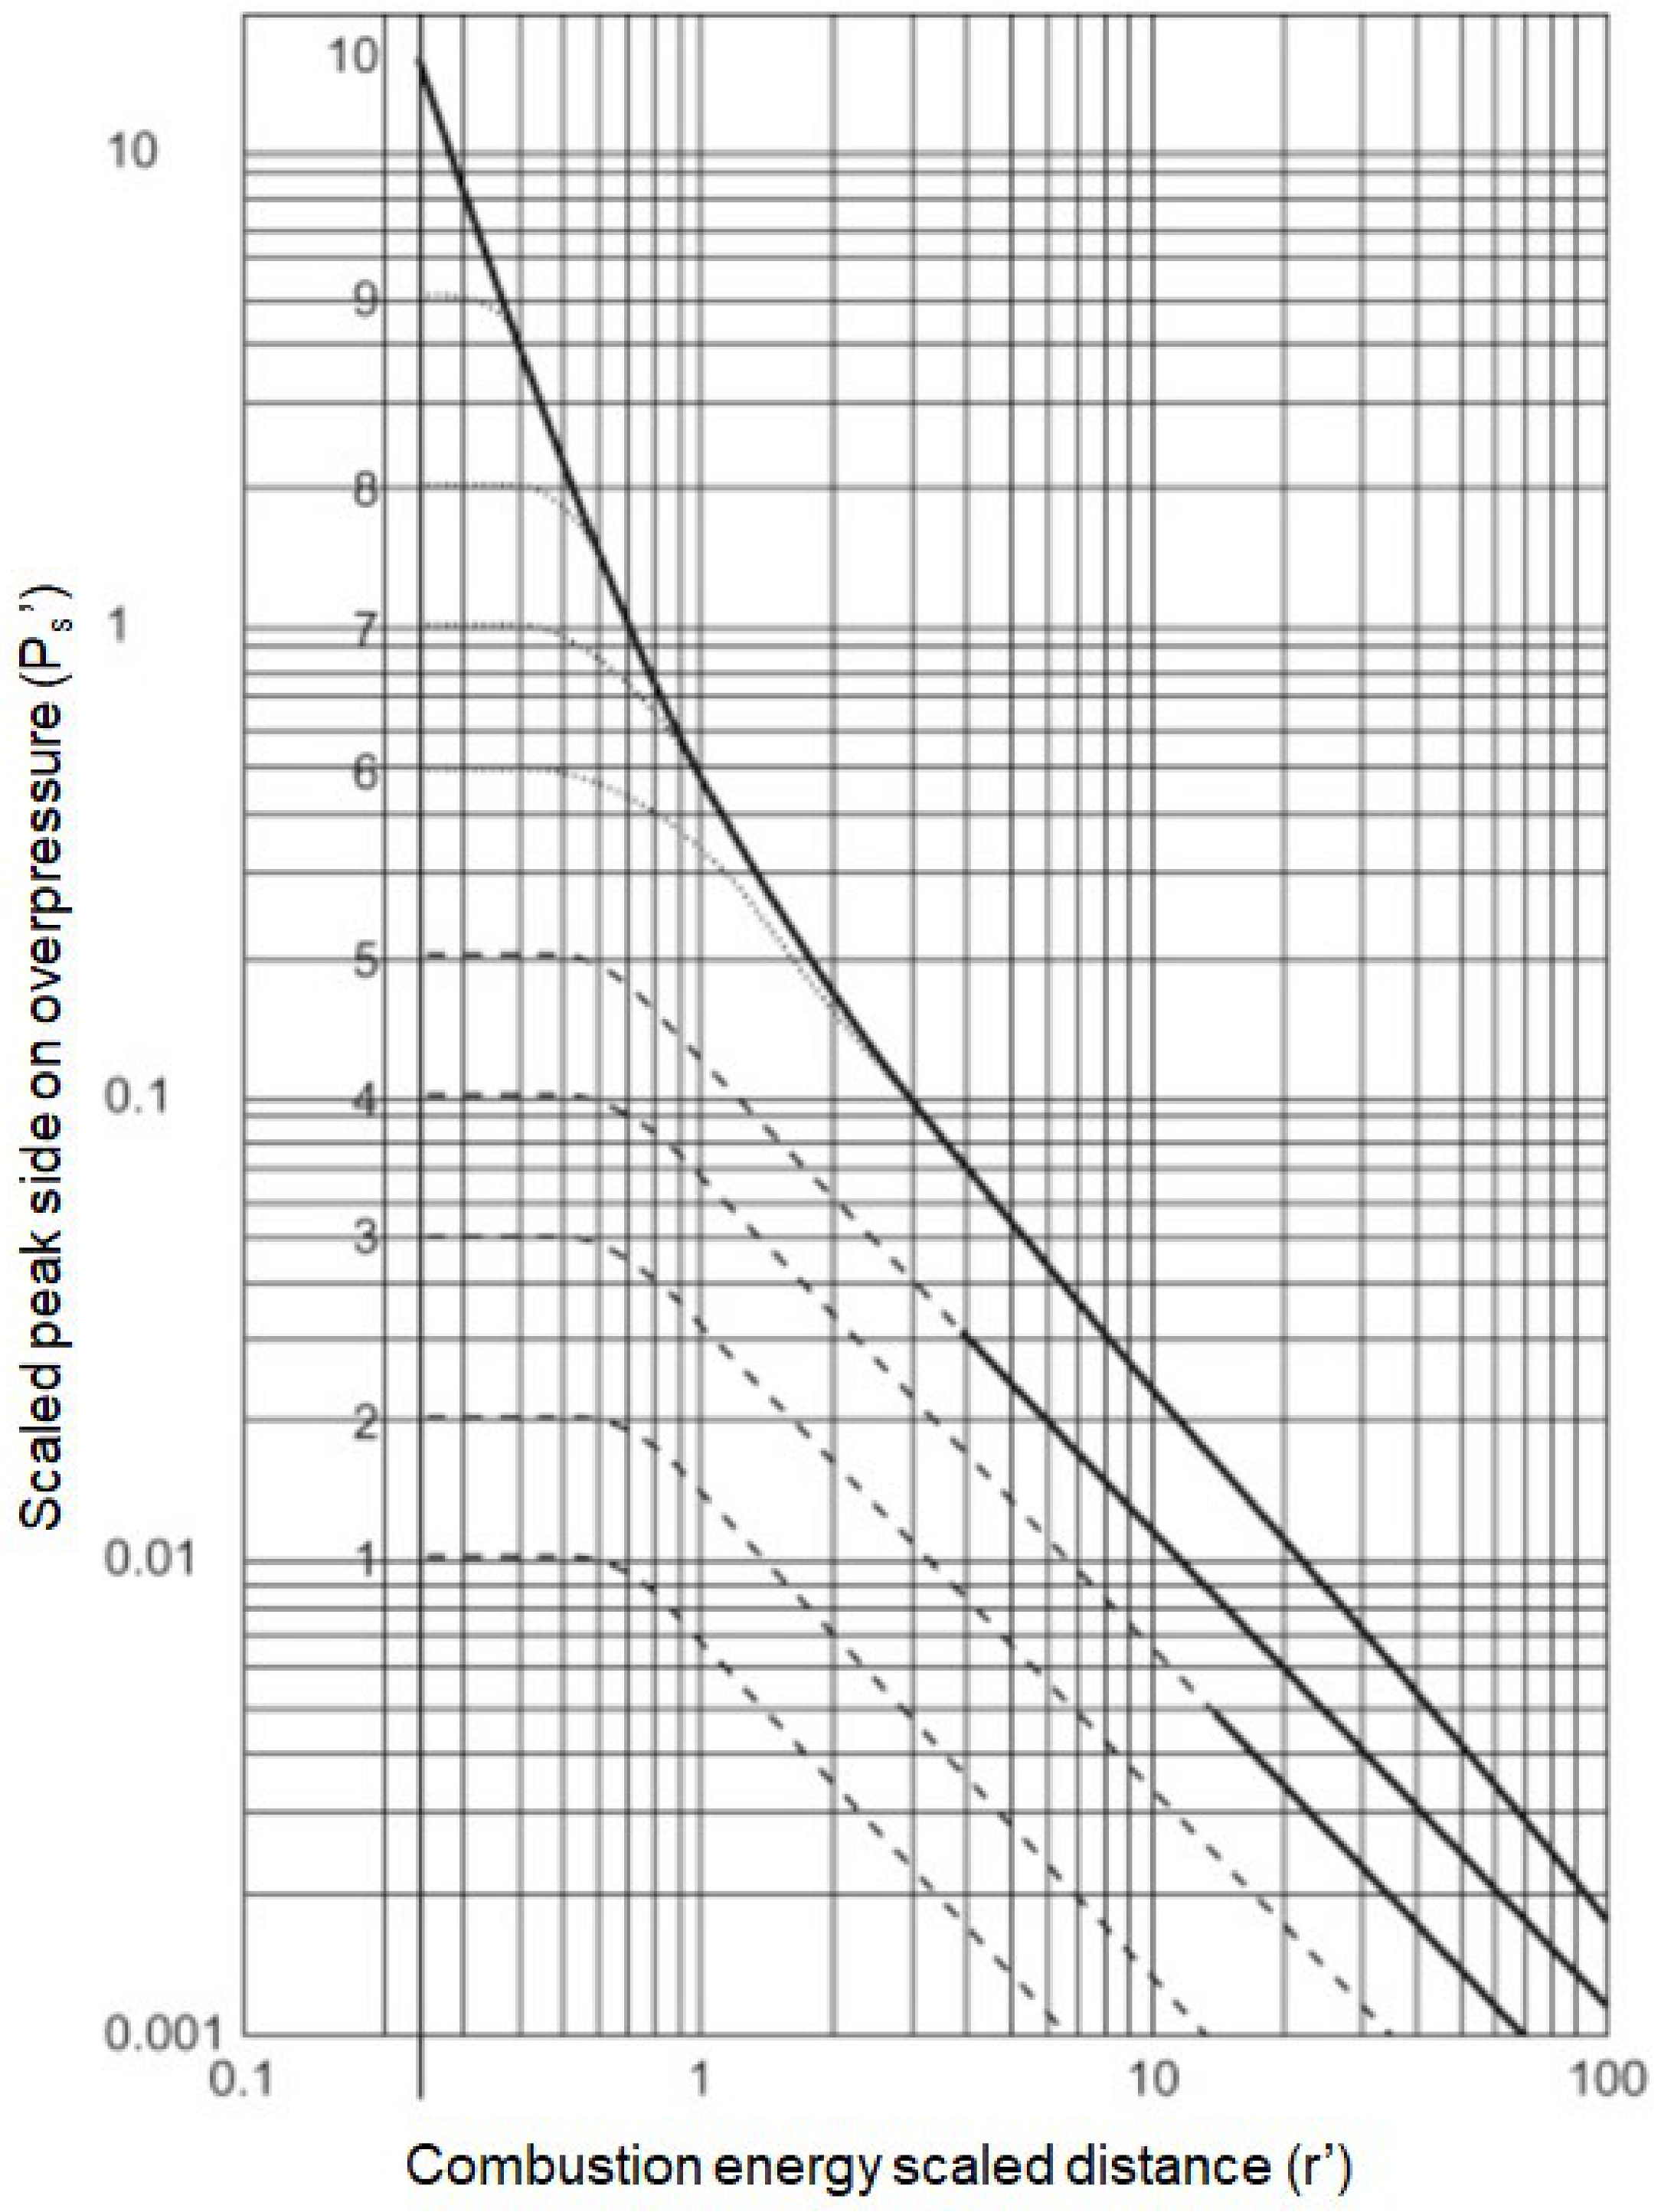
2.2.2. Overpressure
2.3. Societal Risk Analysis Method
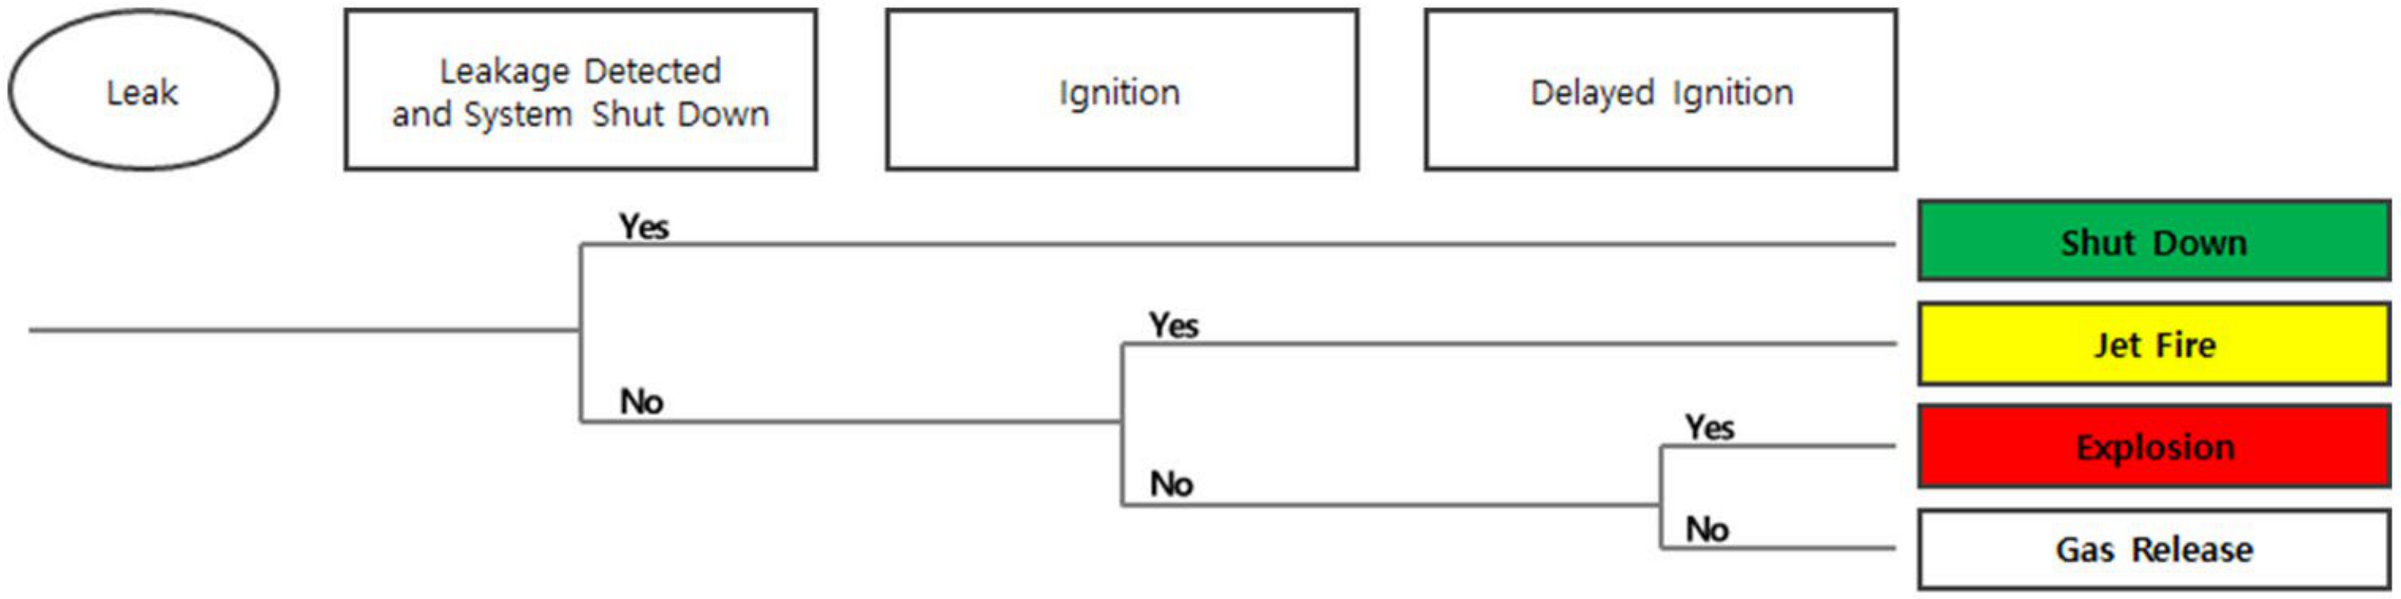
2.3.1. Event Tree Analysis (ETA)
2.3.2. Probit Model
3. Results
3.1. Results in the Case of a Jet Fire
3.2. Results in the Case of Overpressure
3.3. Evaluation of Fatality through Probit Model
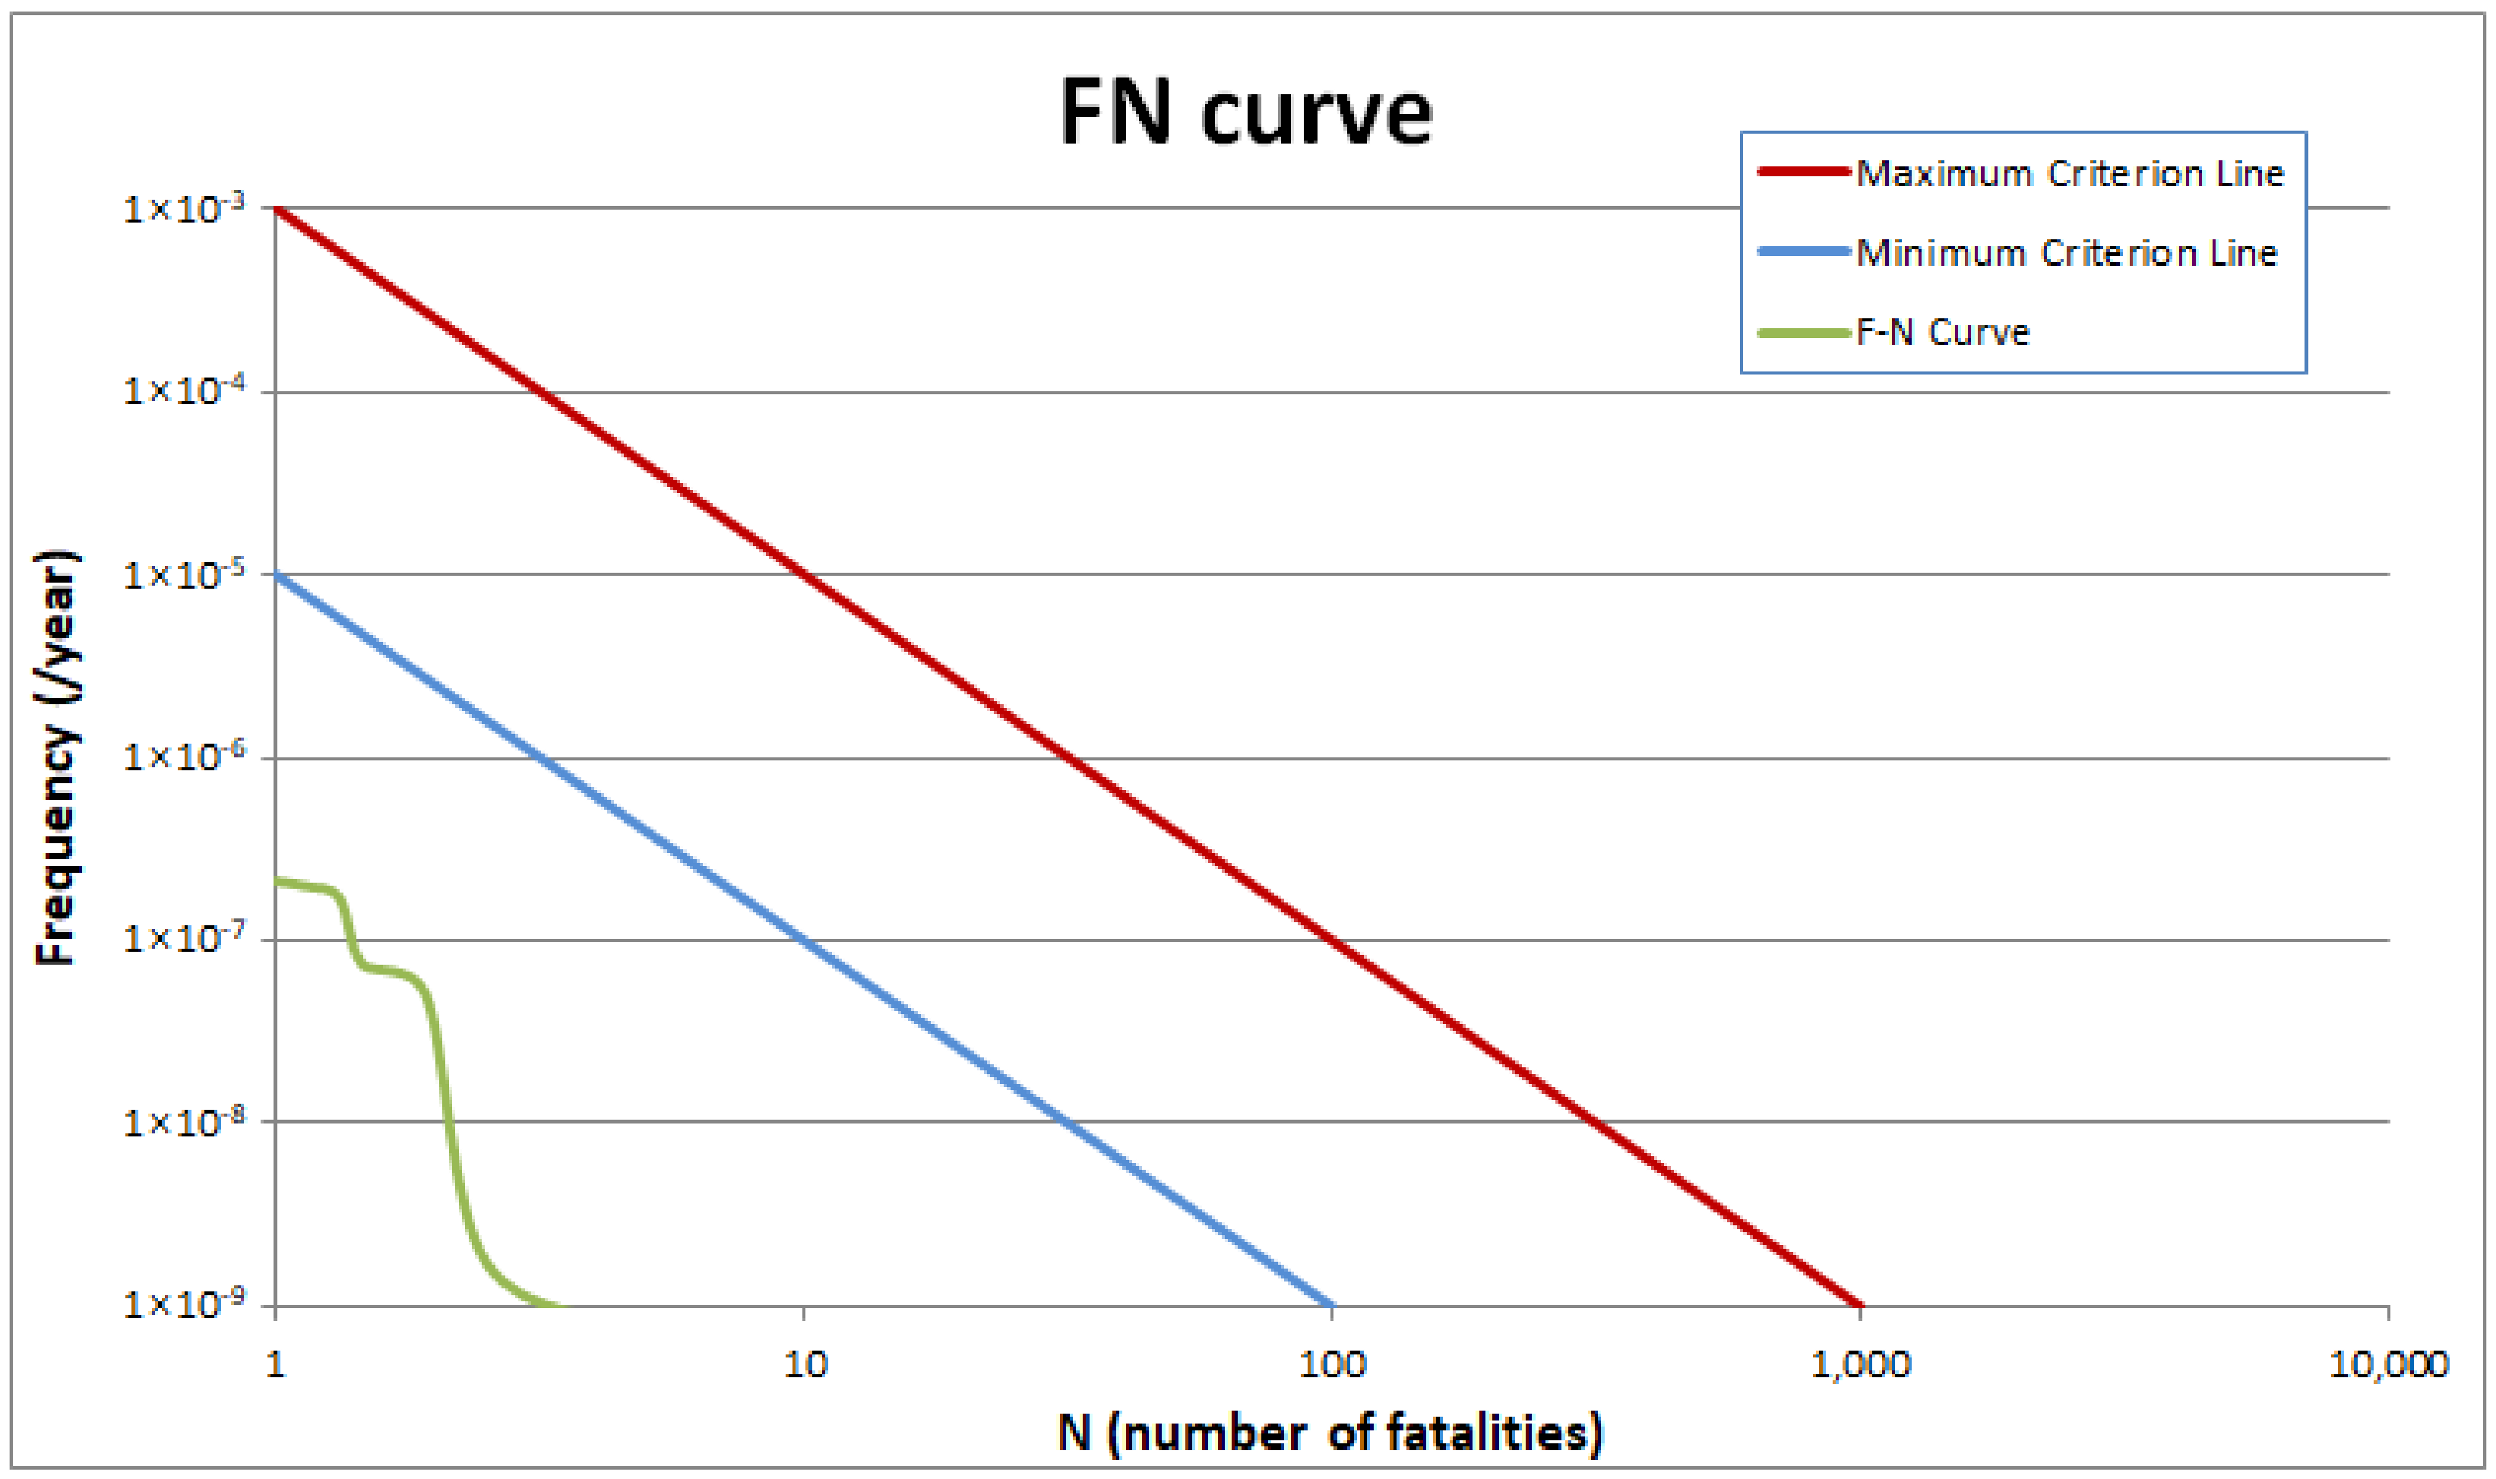
3.4. Societal Risk
4. Conclusions
- Jet fire was modeled using HyRAM. The results showed that the range of fatal impact is at a maximum when a large-sized leak occurs, specifically at a distance of 27 m for a tube trailer and 22 m for a storage tank. When a medium-sized leak occurs, the distance of fatal impact is 8 m for a tube trailer and 5 m for a storage tank. When a small-sized leak occurs, there is no fatal impact.
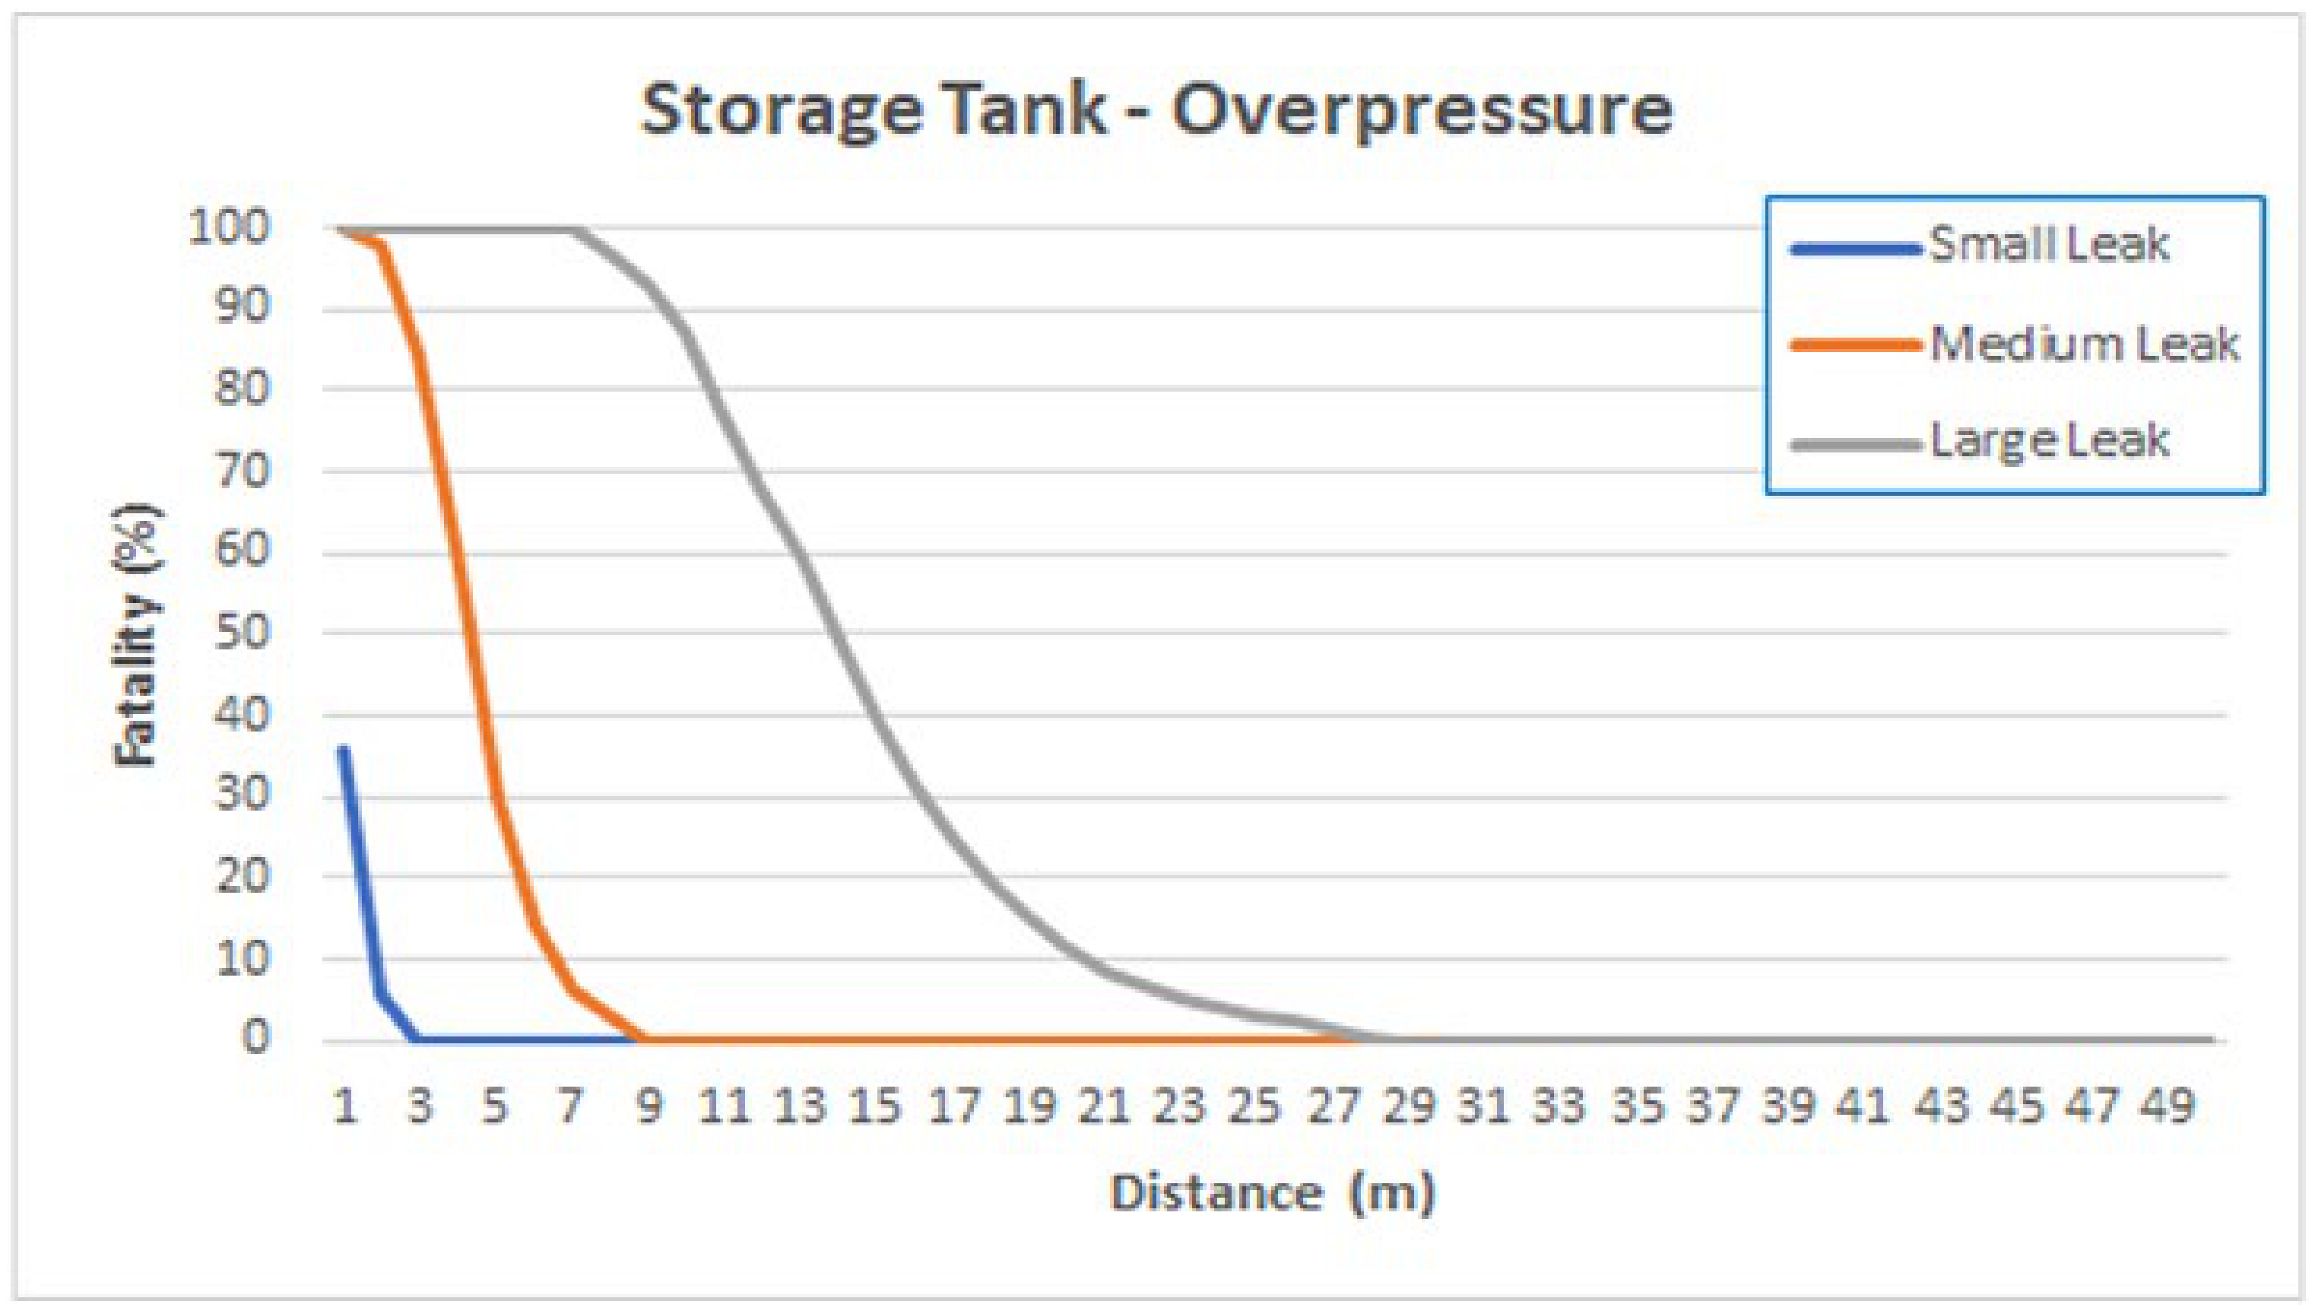
- The analysis performed using PHAST demonstrates a fatal impact for an overpressure radius of up to 11.08 m. The fatal impact of overpressure is not wider than that of HRS facilities. Therefore, the effect of overpressure is expected to be low in fatal effects, except for the workers of the HRS.
- The area of the analyzed HRS is 1997 m2. There is no fatal impact outside the HRS in the cases of small- and medium-sized leaks. Heat flux due to jet fire can have an effect even outside the HRS in the case of a large-sized leak, but the actual risk range may be smaller because the geographical features and firewalls of the HRS were not taken into consideration in modeling the effects of the jet fire and overpressure.
Author Contributions
Funding
Data Availability Statement
Conflicts of Interest
References
- European Parliament, EU Ban on the Sale of New Petrol and Diesel Cars from 2035 Explained. Available online: https://www.europarl.europa.eu/news/en/headlines/economy/20221019STO44572/eu-ban-on-sale-of-new-petrol-and-diesel-cars-from-2035-explained (accessed on 10 October 2023).
- Ministry of Land, Infrastructure and Transport (Korea), Total Registered Motor Vehicles. Available online: https://stat.molit.go.kr/portal/cate/statFileView.do?hRsId=58&hFormId=5409&hKeyWord=%25EC%259E%2590%25EB%258F%2599%25EC%25B0%25A8%25EB%2593%25B1%25EB%25A1%259D&hTotalFlag=Y (accessed on 19 July 2023).
- Hydrogen Council, Hydrogen Insights 2023. Available online: https://hydrogencouncil.com/en/hydrogen-insights-2023/ (accessed on 19 July 2023).
- Energy Efficiency & Renewable Energy, Hydrogen Storage. Available online: https://www.energy.gov/eere/fuelcells/hydrogen-storage (accessed on 19 July 2023).
- Oleszczak, P.; Wolanski, P. Ignition during hydrogen release from high pressure into the atmosphere. Shock. Waves 2010, 20, 539–550. [Google Scholar] [CrossRef]
- Mogi, T.; Kim, D.J.; Shiina, H.; Horiguch, S. Self-ignition and explosion during discharge of high-pressure hydrogen. J. Loss Prev. Process Ind. 2008, 21, 199–204. [Google Scholar] [CrossRef]
- Sakamoto, J.; Sato, R.; Nakayama, J.; Kasai, N.; Shibutani, T.; Miyake, A. Leakage-type-based analysis of accidents involving hydrogen fueling stations in Japan and USA. Int. J. Hydrogen Energy 2016, 41, 21564–21570. [Google Scholar] [CrossRef]
- Kikukawa, S.; Mitsuhashi, H.; Miyake, A. Risk assessment for liquid hydrogen fueling stations. Int. J. Hydrogen Energy 2009, 34, 1135–1141. [Google Scholar] [CrossRef]
- LaFleur, A.C.; Muna, A.B.; Groth, K.M. Application of quantitative risk assessment for performance-based permitting of hydrogen fueling stations. Int. J. Hydrogen Energy 2017, 42, 7529–7535. [Google Scholar] [CrossRef]
- Kikukawa, S.; Yamaga, F.; Mitsuhashi, H. Risk assessment of hydrogen fueling stations for 70 MPa FCVs. Int. J. Hydrogen Energy 2008, 33, 7129–7136. [Google Scholar] [CrossRef]
- Sandia National Laboratories. Analyses to Support Development of Risk-Informed Separation Distances for Hydrogen Codes and Standards (SAND2009-0874); Sandia National Laboratories: Albuquerque, NM, USA; Livermore, CA, USA, 2009. [Google Scholar]
- Korea Occupational Safety and Health Agency. Technical Guidelines on Selection of Worst and Alternative Leakage Scenarios (P-107-2020); Korea Occupational Safety and Health Agency: Ulsan Metropolitan City, Korea, 2020. [Google Scholar]
- Correa-Jullian, C.; Groth, K.M. Data requirements for improving the quantitative risk assessment of liquid hydrogen storage systems. Int. J. Hydrogen Energy 2022, 47, 4222–4235. [Google Scholar] [CrossRef]
- Al-Douri, A.; Ruiz-Tagle, A.; Groth, K.M. A quantitative risk assessment of hydrogen fuel cell forklifts. Int. J. Hydrogen Energy 2023, 48, 19340–19355. [Google Scholar] [CrossRef]
- Dan, S.K.; Moon, D.J.; Yoon, E.S.; Shin, D.G. Analysis of gas explosion consequence models for the explosion risk control in the new gas energy filling stations. Ind. Eng. Chem. Res. 2013, 52–22, 7265–7273. [Google Scholar] [CrossRef]
- Chamberlain, P.; Rosicky, J.G. The effectiveness of family therapy in the treatment of adolescents with conduct disorders and delinquency. J. Marital Fam. Ther. 1995, 21, 441–459. [Google Scholar] [CrossRef]
- Yüceil, K.B.; Ötügen, M.V. Scaling parameters for underexpanded supersonic jets. Phys. Fluids 2022, 14, 4206–4215. [Google Scholar] [CrossRef]
- Birch, A.D.; Hughes, D.J.; Swaffield, F. Velocity decay of high pressure jets. Combust. Sci. Technol. 1987, 52, 161–171. [Google Scholar] [CrossRef]
- Brich, A.D.; Brown, D.R.; Dodson, M.G.; Swaffield, F. The Structure and Concentration Decay of High Pressure Jets of Natural Gas. Combust. Sci. Technol. 1984, 36, 249–261. [Google Scholar] [CrossRef]
- Ewan, B.C.R.; Moodie, K. Structure and velocity measurements in underexpanded jets. Combust. Sci. Technol. 1986, 45, 275–288. [Google Scholar] [CrossRef]
- Molkov, V.; Makarov, D.; Bragin, M. Physics and Modelling of Under-Expanded Jets and Hydrogen Dispersion in Atmosphere; Physics of Extreme States of Matter-2009; Russian Academy of Sciences: Moscow, Russia, 2009. [Google Scholar]
- The World Bank. Techniques for Assessing Industrial Hazards; World Bank Technical Paper No. 55 (WTP55); The World Bank: Washington, DC, USA, 1988. [Google Scholar]
- Health and Safety Executive, Fire Effects. Available online: https://www.hse.gov.uk/offshore/strategy/effects.htm (accessed on 24 May 2023).
- TNO. Methods for the Determination of Possible Damage; The Green Book (CPR16E); TNO: Toronto, ON, USA, 1992. [Google Scholar]
- TNO. Methods for the Calculation of Physical Effects; The Yellow Book (CPR14E); TNO: Toronto, ON, USA, 2005. [Google Scholar]
- CDC. Effects of Blast Pressure on Structures and the Human Body. Available online: https://www.cdc.gov/niosh/docket/archive/pdfs/NIOSH-125/125-ExplosionsandRefugeChambers.pdf (accessed on 24 May 2023).
- Groth, K.M.; Hecht, E.S.; Reynolds, J.T. Methodology for Assessing the Safety of Hydrogen Systems: HyRAM 1.0 Technical Reference Manual (SAND2015-10216); Sandia National Laboratories: Albuquerque, NM, USA; Livermore, CA, USA, 2015. [Google Scholar]
- Groth, K.M.; Hecht, E.S. HyRAM: A methodology and toolkit for quantitative risk assessment of hydrogen systems. Int. J. Hydrogen Energy 2017, 42, 7485–7493. [Google Scholar] [CrossRef]
- Ehrhart, B.D.; Hecht, E.S.; Groth, K.M. Hydrogen Risk Assessment Models (HyRAM) Version 3.0 Technical Reference Manual (SAND2020-10600); Sandia National Laboratories: Albuquerque, NM, USA; Livermore, CA, USA, 2020. [Google Scholar]
- RVIM. Guideline for Quantitative Risk Assessment; Purple Book (CPR 18E); RVIM: Karnataka, India, 2001. [Google Scholar]
- Ehrhart, B.; Hecht, E. Hydrogen Plus Other Alternative Fuels Risk Assessment Models (HyRAM+) Version 4.1 Technical Reference Manual (SAND2022-5649); Sandia National Laboratories: Albuquerque, NM, USA; Livermore, CA, USA, 2022. [Google Scholar]
- National Institute for Public Health and the Environment. Method for Derivation of Probit Functions for Acute Inhalation Toxicity (RIVM Report 2015-0102); National Institute for Public Health and the Environment: Bilthoven, The Netherlands, 2015. [Google Scholar]
- Health and Safety Executive, Methods of Approximation and Determination of Human Vulnerability for Offshore Major Accident Hazard Assessment. Available online: https://www.hse.gov.uk/foi/internalops/hid_circs/technical_osd/spc_tech_osd_30/spctecosd30.pdf (accessed on 23 May 2023).
- Korea Ministry of SMEs and Startups, Commercial District Information System. Available online: https://sg.sbiz.or.kr/godo/index.sg (accessed on 18 June 2023).
- General Electric, Passive IPLs. Available online: https://www.ge.com/digital/documentation/meridium/Help/V43060/IMDQ4MDA1NTYtNTBmZS00N2Y1LThjNzQtMjY4ZTAwYWM5YmNh.html (accessed on 18 June 2023).


| Components | Tube Trailer | Storage Tank |
|---|---|---|
| Pressure (bar) | 350 | 850 |
| Operating Temperature (°C) | 20 | 20 |
| Hydrogen Mass (kg) | 234 | 750 |
| Components | Tube Trailer | Storage Tank | |
|---|---|---|---|
| Leak size (mm) | Small | 1.27 | 0.72 |
| Medium | 4.02 | 2.26 | |
| Large | 12.7 | 7.16 | |
| Leakage frequency (/year) | Small | 4.14 × 10⁻⁴ | 1.23 × 10⁻³ |
| Medium | 3.21 × 10⁻⁴ | 2.09 × 10⁻⁴ | |
| Large | 1.80 × 10⁻⁴ | 1.02 × 10⁻⁴ | |
| Wind Speed | Atmospheric Temperature | Atmospheric Stability | Humidity | |
|---|---|---|---|---|
| Condition | 1.5 m/s | 40 °C | F | 50% |
| Thermal Radiation (kW/m2) | Effects on Humans |
|---|---|
| 4 | Causes pain if the duration is longer than 20 s |
| 12.5 | Fatalities within minutes |
| 37.5 | Instantaneous death |
| Overpressure (psi) | Effects on Humans |
|---|---|
| 1 | Light injuries from fragments |
| 3 | Serious injuries are common; fatalities may occur |
| 5 | Injuries are universal; fatalities are widespread |
| Release Rate (kg/s) | Ignition Probability | |
|---|---|---|
| Immediate | Delayed | |
| <0.125 | 0.008 | 0.004 |
| 0.125 −6.25 | 0.053 | 0.027 |
| >6.25 | 0.230 | 0.120 |
| Distance (m) | Heat Flux (kW/m2) | ||
|---|---|---|---|
| Small Leak | Medium Leak | Large Leak | |
| 0.01 | 3.23 | 11.06 | 27.99 |
| 0.5 | 4.83 | 15.24 | 36.01 |
| 1 | 6.66 | 20.53 | 45.99 |
| 3 | 5.22 | 46.28 | 93.85 |
| 5 | 0.99 | 76.87 | 147.68 |
| 8 | 0.25 | 98.42 | 244.22 |
| 10 | 0.14 | 19.79 | 334.53 |
| 12 | 0.09 | 5.56 | 481.13 |
| 14 | 0.06 | 2.76 | 785.32 |
| 16 | 0.05 | 1.66 | 2046.52 |
| 17 | 0.04 | 1.35 | 2789.11 |
| 18 | 0.03 | 1.22 | 8114.40 |
| 19 | 0.03 | 0.94 | 1599.15 |
| 20 | 0.03 | 0.80 | 967.44 |
| 22 | 0.02 | 0.60 | 469.06 |
| 25 | 0.02 | 0.42 | 172.58 |
| 27 | 0.01 | 0.34 | 89.95 |
| 30 | 0.01 | 0.26 | 36.90 |
| 35 | 0.01 | 0.17 | 12.75 |
| 40 | 0.01 | 0.12 | 6.44 |
| Distance (m) | Heat Flux (kW/m2) | ||
|---|---|---|---|
| Small Leak | Medium Leak | Large Leak | |
| 0.01 | 2.59 | 9.63 | 25.35 |
| 0.5 | 3.88 | 13.48 | 32.91 |
| 1 | 5.20 | 18.34 | 42.34 |
| 3 | 2.32 | 41.57 | 87.56 |
| 5 | 0.51 | 64.84 | 138.65 |
| 8 | 0.14 | 19.22 | 232.94 |
| 10 | 0.08 | 4.74 | 327.19 |
| 12 | 0.05 | 2.18 | 493.88 |
| 14 | 0.04 | 1.26 | 916.83 |
| 16 | 0.03 | 0.82 | 4934.36 |
| 17 | 0.02 | 0.69 | 7296.73 |
| 18 | 0.02 | 0.58 | 1702.80 |
| 19 | 0.02 | 0.50 | 807.08 |
| 20 | 0.02 | 0.43 | 437.55 |
| 22 | 0.01 | 0.33 | 150.71 |
| 25 | 0.01 | 0.24 | 36.85 |
| 27 | 0.01 | 0.19 | 19.07 |
| 30 | 0.01 | 0.15 | 9.78 |
| 35 | 0.00 | 0.10 | 4.68 |
| 40 | 0.00 | 0.07 | 2.77 |
| Equipment | Leak Size | Overpressure | |
|---|---|---|---|
| Level (psi) | Diameter (m) | ||
| Tube trailer | Medium | 1 | 19.34 |
| 3 | 8.29 | ||
| 5 | 6.01 | ||
| Large | 1 | 71.14 | |
| 3 | 30.49 | ||
| 5 | 22.12 | ||
| Storage tank | Medium | 1 | 15.05 |
| 3 | 6.45 | ||
| 5 | 4.68 | ||
| Large | 1 | 57.69 | |
| 3 | 24.73 | ||
| 5 | 17.94 | ||
| Equipment | Leak Size | Frequency (/Year) | |
|---|---|---|---|
| Jet Fire | Flash Fire | ||
| Tube trailer | Small | 3.33 × 10⁻⁸ | 1.64 × 10⁻⁸ |
| Medium | 1.70 × 10⁻⁷ | 8.21 × 10⁻⁸ | |
| Large | 9.54 × 10⁻⁸ | 4.60 × 10⁻⁸ | |
| Storage tank | Small | 9.84 × 10⁻⁸ | 4.88 × 10⁻⁸ |
| Medium | 1.11 × 10⁻⁷ | 5.34 × 10⁻⁸ | |
| Large | 5.41 × 10⁻⁸ | 2.61 × 10⁻⁸ | |
| Time Period | 0–6 | 06–11 | 11–14 | 14–17 | 17–21 | 21–24 | Total |
|---|---|---|---|---|---|---|---|
| Population | 467 | 1832 | 1516 | 1649 | 2254 | 746 | 8464 |
| Ratio (%) | 5.5 | 21.6 | 17.9 | 19.5 | 26.6 | 8.8 | 100 |
Disclaimer/Publisher’s Note: The statements, opinions and data contained in all publications are solely those of the individual author(s) and contributor(s) and not of MDPI and/or the editor(s). MDPI and/or the editor(s) disclaim responsibility for any injury to people or property resulting from any ideas, methods, instructions or products referred to in the content. |
© 2023 by the authors. Licensee MDPI, Basel, Switzerland. This article is an open access article distributed under the terms and conditions of the Creative Commons Attribution (CC BY) license (https://creativecommons.org/licenses/by/4.0/).
Share and Cite
Jeon, B.-i.; Kim, S.; Yoon, Y.S.; Jung, S. Quantitative Risk Assessment of Hydrogen Refueling Station in Cheonan City of South Korea. Energies 2023, 16, 7138. https://doi.org/10.3390/en16207138
Jeon B-i, Kim S, Yoon YS, Jung S. Quantitative Risk Assessment of Hydrogen Refueling Station in Cheonan City of South Korea. Energies. 2023; 16(20):7138. https://doi.org/10.3390/en16207138
Chicago/Turabian StyleJeon, Bo-il, Shinji Kim, Yeo Song Yoon, and Seungho Jung. 2023. "Quantitative Risk Assessment of Hydrogen Refueling Station in Cheonan City of South Korea" Energies 16, no. 20: 7138. https://doi.org/10.3390/en16207138
APA StyleJeon, B.-i., Kim, S., Yoon, Y. S., & Jung, S. (2023). Quantitative Risk Assessment of Hydrogen Refueling Station in Cheonan City of South Korea. Energies, 16(20), 7138. https://doi.org/10.3390/en16207138