Article

An Examination of Households’ Attitudes towards Renewable Energy Source Investments in Lower Silesian Voivodeship

by
Marta Stanisławska
Faculty of Law, Administration and Economics, University of Wroclaw, 50-137 Wroclaw, Poland
Energies 2023, 16(20), 7100; https://doi.org/10.3390/en16207100
Submission received: 2 July 2023 / Revised: 20 September 2023 / Accepted: 24 September 2023 / Published: 15 October 2023
(This article belongs to the Special Issue Modeling Energy–Environment–Economy Interrelations II)

Abstract

:
This study presents findings from an empirical investigation into households’ decisions to further invest in renewable energy sources (RES). In the Lower Silesian Voivodeship, the survey gathered responses from 300 single-family homeowners who had already invested in RES. Notably, household income emerged as a significant influencer, with higher income levels correlating to a greater inclination for RES investment. Surprisingly, owning photovoltaic batteries was associated with reduced intent for further RES investment, potentially indicating contentment with prior outcomes. Moreover, many respondents reported decreased energy costs post-RES investment, underscoring its economic viability. Nonetheless, results also revealed a perceived shortfall in government financial support, suggesting a need for more effective support mechanisms. Economic factors, including financial accessibility and perceived profitability, were pivotal drivers for RES investment. Policy interventions should account for these factors to bolster green energy adoption, particularly for low-income households. Future research should probe the reasons behind perceived government support insufficiency and discern the roles of different forms of financial assistance. These endeavors could refine policy frameworks and invigorate energy transition efforts. In conclusion, the study highlights households’ keen interest in RES investment in the Lower Silesian Voivodeship. Household income stood out as a critical determinant, underlining economic factors’ sway over investment decisions. An intriguing observation was that prior photovoltaic battery ownership might temper enthusiasm for future RES investments. Most respondents experienced energy cost reduction, reinforcing RES benefits, though calls for improved government support remain. Economic considerations drive RES investment and warrant policy attention. Future research could probe the causes of perceived support shortfalls and untangle financial aid impacts for more targeted approaches to energy transition.

1. Introduction

Around the world, one can note the continuous fluctuation of fossil fuel prices and the relentless increase in energy demand, while public awareness of the need to reduce CO2 emissions is growing [1]. It is important to remember that investments in renewable energy sources contribute to the conservation of natural resources and counteract the adverse effects of climate change. Nevertheless, there needs to be a clear indication that financial development can effectively reduce environmental problems in the face of globalization [2]. Among the available research results, it is possible to point to the connection between economical an theoretical justification and the impact of investment and ecological use of resources on global warming [3]. In addition, global population growth (about 9 billion by 2040) will increase greenhouse gas emissions from the agricultural sector. It will be desirable to improve conventional agriculture [4], which, in turn, will lead to an increase in greenhouse gas emissions (which are subject to emission limits in an attempt to limit climate warming to less than 2 degrees Celsius by 2050) [5]. Trying to minimize the adverse effects of civilization’s development on the environment is undoubtedly a difficult task [6]. Nevertheless, sustainable energy consumption and investments in renewable energy are essential at present [7]. And proper state financial support for the assets in question seems inevitable [8].
In addition, it should be noted that countries worldwide are facing the challenge of ensuring energy security for their citizens [9]. Furthermore, the ongoing energy crisis, which Russia’s aggression against Ukraine has highlighted, has underscored the need for EU countries to quickly become independent of Russian fuels, as well as the need to secure energy supplies, including by increasing the share of renewable energy sources, which are expected to help stem the climate crisis simultaneously [10]. The joint development strategies of many countries (including a standard EU policy), as part of the European Green Deal [11], have contributed to the formulation of several procedures associated with a range of support instruments in the form of subsidies or fixed energy prices, among others, to stimulate the sustainable development of renewable energy [12]. According to EU legislation, the share of energy from renewable sources in the EU’s final energy consumption has been set as a target of 32% by the end of 2030 (increased to 42.5%), while, by 2050, the EU should achieve climate neutrality [13]. In Europe, the Scandinavian countries are the undoubted leaders in the RES sector; nevertheless, an interesting example is Estonia, which has achieved a 30% share of renewable energy in gross final energy consumption over the past few years. Central European countries are just a little behind [14]. For example, in April 2023, power plants in Poland, which is the subject of the study in this paper, produced 12.9 TWh of electricity, of which 3.5 MWh came from RES installations (27%). In the last year, the electricity production from RES increased by only 2.5%, and consumer installations amounted to 1.25 million units [15].
Regardless of the theoretical and legal doubts associated with the title question, the thesis of this article remains the following: Households want to invest in renewable energy sources. Nevertheless, financial support from the state is required. This article aims to indicate whether households that have invested in renewable energy sources (in photovoltaic panels) in previous years have contributed to a decrease in the cost of electricity and to examine whether households are willing to make further investments in renewable energy sources. Taking the above into account, the following hypotheses were invited. Hypothesis 1 (H1): The proportion of households who see the need to invest in RES and want to make further expenditures related to green energy is more significant than 50%. Hypothesis 2 (H2) states that the proportion of households who have reported a decrease in energy fees after investing in RES is greater than 50%. Hypothesis 3 (H3) states that the proportion of families who have invested in RES and perceive the government’s financial support as sufficient is less than 50%. Another research question involved identifying factors among the questionnaire survey results that would significantly impact the decision to invest further in RES.
This article analyzes household investment in renewable energy sources and points out the need for further investment with state financial support, which needs to be improved. Empirical studies indicate the need for investment. Moreover, the results of the presented research indicate a need for changes in existing financial support programs for investments in renewable energy sources. In addition, the study suggests scientific contributions to energy, environmental sustainability, and household activity in connection with the ongoing energy transition. In addition, in most academic papers, the focus is primarily on the development of countries’ policies, the reconstruction of energy networks, or RES management, without analyzing the activities undertaken by households for sustainable development. Researchers focus primarily on regulations or analysis of renewable energy efficiency and sustainability goals. Therefore, this study examined the behavior of households and the investments they undertake on their own (or with state assistance). The analysis subjects were households that installed photovoltaic panels in 2020–2021. Even the most developed policies for financing investment in renewable energy sources will only have the desired effect with the willingness and sense of responsibility on the part of the public. Hence, behavioral studies conducted in the form of surveys and their analysis indicate scientific contributions on renewable energy investments, evaluation of current financial support solutions, and public attitudes towards further investments. Therefore, this study analyzes the impact of household investments on sustainable green energy procurement activities, reduction of energy costs, and propensity for further investment to comprehensively understand the topic under study and fill the existing gap. The research will help understand household measures’ importance and significance in achieving energy efficiency and independence. The research can also help national authorities create friendly policies on green transition, highlighting social needs for financial support programs for households investing in renewable energy sources.
The article is organized as follows. The first part of the article briefly presents the motivation for the research undertaken and the purpose of the work. The second part includes the theoretical background, current trends of ongoing household investment in energy sources, and its relevance to society. It highlights the effects of household investments, their attitudes toward further spending on renewable energy sources, and their level of satisfaction with the state assistance they received. The third section presents a description of the methods and data used. Moreover, the following sections present the results of the research. The article concludes with conclusions, concluding remarks, discussion, and research limitations.

2. Literature Overview

Green Finance As a Form of Investment Support

Rapid industrial development creates significant environmental challenges, which include increasing pollution [16] and resource depletion [17,18], and it is for these reasons that these issues have become major threats to human health, survival, and development [19,20,21]. In response to these challenges, countries worldwide have recognized the need for sustainable development and ecological restoration, which requires immediate action to mitigate the conflict between economic growth and environmental protection [22,23]. Various countries have committed to reducing carbon emissions and achieving carbon neutrality. For example, China has pledged to reduce carbon emissions by 2030 and achieve carbon neutrality by 2060 (National Development and Reform Commission, stated by the Chinese president at the 75th General Debate of the UN General Assembly), while the United States pledged to reduce emissions by 50–52% by 2030 compared to 2005 and achieve net zero emissions by 2050 at the April 2021 Leaders’ Climate Summit. (White House, 2021),and Canada pledged to reduce emissions by 40–45% by 2030 compared to 2005. At the same time, Japan pledged to reduce emissions by 46% by 2030 compared to 2013. The UK pledged to reduce emissions by 78% by 2035 compared to 1990, while Brazil has pledged to achieve carbon neutrality by 2050 (Government of Canada, 2020; Ministry of Economy, Trade and Industry, 2021; Department of Business, Energy and Industrial Strategy, 2021; Ministry of Environment of Brazil, 2021). These commitments emphasize the urgent need for economic transformation, sustainable development, and energy transition [24,25].
However, achieving significant environmental improvements rapidly requires important state financial support, as communities alone cannot make such extensive investments [26]. Traditional economic models have centered around profit maximization without adequate consideration of externalities [27], and companies and financial institutions have been skeptical of investing in pro-social or pro-environmental initiatives due to high initial investments and long payback periods [28]. However, with the growing recognition of corporate externalities, there has been a shift toward integrating considerations for various stakeholders, including society and the environment. Opportunities associated with clean technologies and other “green” initiatives that demonstrate high financial returns have attracted investor attention [29]. The introduction of the Equator Principles in 2002 further linked the finance and environmental spheres, promoting a more pro-environmental approach to finance.
Financial derivatives play a key role in financing environmental projects [30]. For example, one should point to the World Bank’s initiative to launch the Global Environment Facility (GEF) to raise funds for environmental projects through partnerships involving international institutions, community groups, and the private sector (World Bank, 2021). Financial instruments have now become widely used in environmental and energy transition projects. Governments worldwide have implemented regulations and introduced fiscal and tax incentives to force or encourage the financial sector to adopt green governance models [31]. At the same time, financial institutions have begun integrating environmental and fiscal policies into economic development to attract private capital to low-carbon businesses and projects [32]. The ongoing COVID-19 pandemic has prompted governments to propose and implement “green recovery programs” to spur economic recovery, emphasizing the importance of environmental protection and green energy transition in post-pandemic economic development [33]. Companies, especially those in the financial and ecological industries, play an important role in accelerating green recovery. Through innovative financial instruments and informed investment, a more sustainable development model for economic recovery and carbon neutrality can be achieved [34]. As a result, environmental finance has become increasingly important.
The term “environmental finance” is often used in academic research [35], but its definition remains ambiguous and is often confused with “green finance” and “sustainable finance”. The European Economic Commission (2017) suggests that “environmental finance” can be interpreted as “green finance”, “green growth/economic finance”, “environmentally friendly finance”, “sustainable finance”, or “clean technology finance” [36]. It should be noted that “environmental finance” is generally referred to as “sustainable finance”, while some international research institutes, such as the International Finance Corporation, commonly use “environmental finance” to mean “green finance”. Initially, the term referred to applying environmental economics paradigms to finance and investment, including using financial derivatives to protect the environment [37]. Over time, the concept of environmental finance has expanded as environmental financial instruments have evolved, the impact of environmental issues has deepened, and environmental regulations have tightened. As a result, the concept of environmental finance continues to evolve, adding new aspects over time. Existing research on environmental finance covers a variety of topics, including climate change adaptation and mitigation [38], energy price fluctuations [39], international cooperation [40], international politics, and capital markets [40]. However, existing research on environmental finance is often fragmented, mainly examining relevant topics from a financial perspective.
The economies of all countries in the world at the present time are in a difficult situation due to the unforeseen situations that occurred in the 21st century (which include the 2003–2008 energy price shocks [41], the 2007–2009 financial crisis [42], COVID-19 [43], and the war in Ukraine [44]). The ongoing crisis has indicated the need for countries to adjust their actions in unforeseen situations, resulting in an accelerated energy transition toward green energy and independence from solid fossil sources, which have largely provided energy security for many countries around the world [45].
The uncertain and variable characteristics of renewable energy sources (RES) can significantly impact investment risk [46]. Two approaches have been employed to overcome these obstacles: political measures and financial incentives. The European Union took a significant step in promoting renewable energy in 1997 by adopting the “White Paper for a Community Strategy and Action Plan” to increase the share of renewable energy from 6% of gross energy consumption [47]. Subsequently, the European Parliament and Council set targets for energy consumption, CO2 emission reductions, and RES shares in total energy production by 2020 [48]. Political measures primarily fall under the jurisdiction of member states and regional governments as they establish support mechanisms to stimulate investors and RES producers [49]. Incentive models for RES differ based on classifications such as primary and secondary models. Primary models form the basis of RES integration and transfer the costs of purchasing electricity from RES producers to end consumers. These models include feed-in tariffs and renewable portfolio standard (RPS) models [50]. Feed-in tariffs offer fixed long-term support, preferential pricing for purchased electricity, and prioritized grid access, while RPS uses green certificates to facilitate a market where eligible producers sell certificates to retailers [51,52,53,54]. Strengths and weaknesses of feed-in tariffs and RPS models have been extensively studied, with feed-in tariffs proving more effective in promoting RES development and decreasing market prices [55,56,57,58]. Within feed-in tariffs, different models exist, including market-independent models (e.g., fixed price, front-end loaded, spot market gap) and market-dependent models (e.g., models with premium) [59]. Various papers focus on RES incentive mechanisms, including policy development, technology-specific analysis, and future policy recommendations, but few encompass the comprehensive development and incentive policies of all RES technologies in the European Union [60].
Green finance in Poland encompasses a range of financial mechanisms and investments aimed at promoting environmentally sustainable projects and initiatives [61]. As a country that recognizes the importance of transitioning to a low-carbon economy and addressing environmental challenges, Poland has taken significant steps to promote and facilitate green finance [62].
One notable initiative in the country is the issuance of green bonds specifically designed to raise funds for environmentally friendly projects [63]. Green bonds allow investors to support initiatives that contribute to sustainability while offering them financial returns. This financial instrument has gained traction in Poland and has been utilized to finance various green projects, such as renewable energy installations and energy-efficient infrastructure [64].
To further incentivize and support green investments, Poland has implemented policies and regulations that create a favorable environment for sustainable finance. These include renewable energy support schemes, feed-in tariffs, and investment subsidies for renewable energy projects [63]. The government has also introduced tax incentives and favorable lending conditions for businesses and projects focusing on sustainability [65].
Financial institutions in Poland are increasingly recognizing the importance of integrating environmental, social, and governance (ESG) factors into their investment decisions [66]. Many banks and financial institutions now offer a range of green financial products, such as green loans, green mortgages, and sustainability-focused investment funds [67]. These products aim to channel financial resources towards projects that align with environmental sustainability objectives.
The demand for green finance in Poland is rising as businesses and individuals prioritize sustainable development and environmental responsibility. There is a particular emphasis on financing renewable energy projects, energy efficiency improvements, sustainable infrastructure development, and other initiatives contributing to mitigating climate change and protecting the environment [65].
Poland’s government and financial sector are increasingly collaborating to strengthen the framework for green finance. Efforts are underway to enhance transparency and disclosure practices related to environmental and social risks and develop standardized green finance guidelines and metrics [68].
In conclusion, green finance in Poland plays a crucial role in driving the transition to a low-carbon economy and achieving sustainable development goals. By aligning economic growth with environmental sustainability, green finance fosters a greener and more resilient future for the country [69].
Based on the existing legal solutions and support instruments, the article analyzes the investments made by households in photovoltaic panels.

3. Materials and Methods

The purpose of the analysis was to test the following hypotheses:
H1. 
The proportion of households who see the need to invest in RES and want to make further expenditures related to green energy is more significant than 50%.
H2. 
The proportion of households who have reported a decrease in energy fees after investing in RES is greater than 50%
H3. 
The proportion of families who have invested in RES and perceive the government’s financial support as sufficient is less than 50%.
Another research question involved identifying factors among the questionnaire survey results that would significantly impact the decision to invest further in RES.

3.1. Significance Level

The significance level of the statistical tests in this analysis was set at α = 0.05.

3.2. Analysis of the Normality of the Distributions of the Numerical Variables

The normality of the distributions of the variables was analyzed using the Shapiro–Wilk test.

3.3. Reporting of Variable Distributions

Numerical variables with distributions deviating from the normal distribution were reported as Mdn (Q1, Q3). Categorical variables were reported as counts (n) and percentages (%).

3.4. Estimation of Differences between Groups

Examination of differences within a numerical variable with a non-normal distribution between two groups was performed using the Wilcoxon rank sum test.

3.5. Estimation of Independence of Categorical Variables

The independence of categorical variables was examined using the Pearson chi-square test, proportion test, and Fisher’s exact test.
Differences between the observed and expected distributions for variables with multiple categories were estimated using the chi-square test for goodness of fit.

3.6. Multivariate Analysis

Multivariate analysis of the effect of selected parameters on the dichotomous factor was examined using a logistic regression model based on a generalized linear model.
The logit of the unknown probability was modeled as a linear function of the predictors Xi based on Equation (1):
l o g i t ( p i ) = l n ( p i 1 p i ) = β 0 + β 1 · x 1 , i + . . . + β k · x k , i
where the observed values of Yi~binomial with probability p = pi for a given coefficient xi and n = k for binary responses. The coefficients βj (j = 1, … k) were estimated using the maximum likelihood method. The interpretation of the parameter βj was the additive effect that a one-unit change in variable j has on the odds ratio defined by Equation (2):
O R A x B = S ( A ) S ( B ) = P ( A ) 1 P ( A ) P ( B ) 1 P ( B ) = P ( A ) × ( 1 P ( B ) ) P ( B ) × ( 1 P ( A ) )  
where: A, B—study groups, P—probability of positive attitude in the group, S—chance of probability of positive attitude [70]. The description of the error distribution and the joint function was designed on the basis of objects of the Gaussian family.

3.7. Selection of Variables for the Final Regression Model

The selection of explanatory variables for the regression model was based on automatic stepwise selection [71] of the original model with backward analysis.
The selection of variables for the original regression model was made according to Baron et al. [72], Aiken et al. [73], Hayes et al. [74], Cohen et al. [75], Pedhazur et al. [76].
Variable selection for the final model was calculated using the Akaike information criterion (AIC). The model with the smallest value of the criterion and the smallest value of the deviation of the residuals of the fitted model was considered the best model.

3.8. Verification of the Assumptions of the Regression Model

The quality of the fitted model was assessed by determining whether it met the necessary assumptions of the logistic regression model:
-
The degree of collinearity between model conditions was examined by estimating variance inflation factors (VIF). VIF values of less than 3.0 indicate low correlation between model predictors [77].
-
Estimation of extreme values and outliers was estimated using the leverage parameter.
-
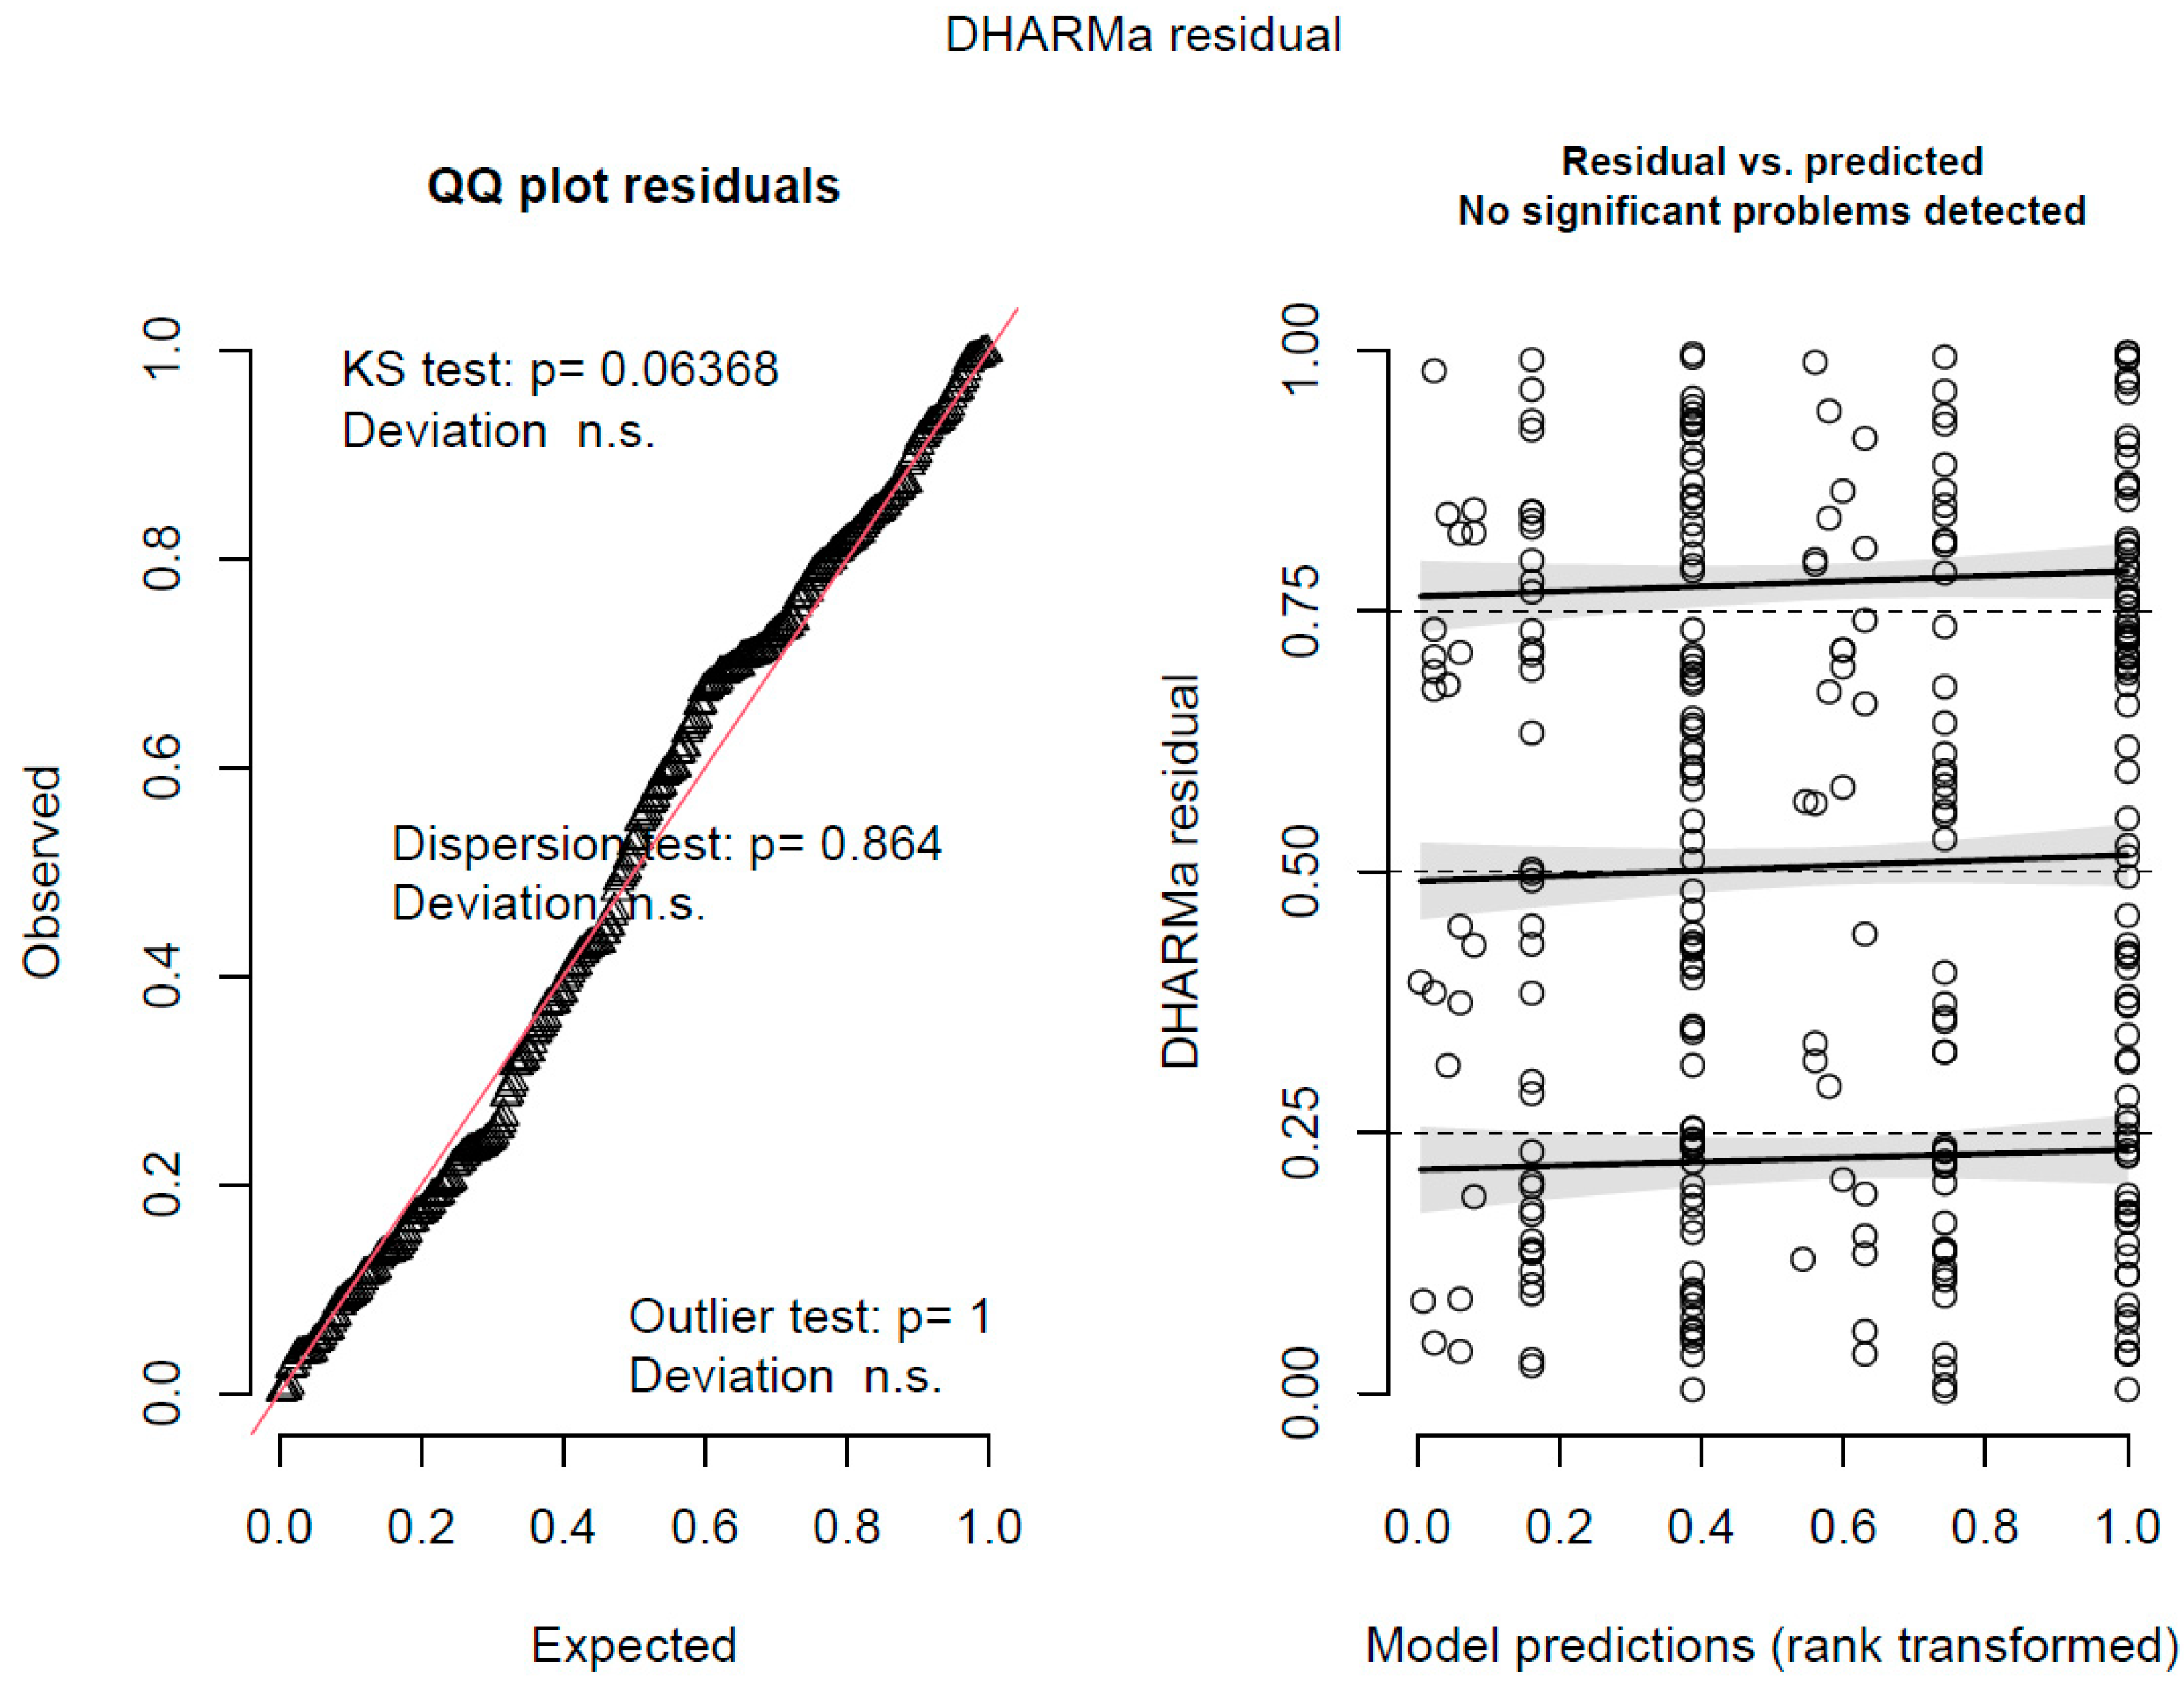
The normality of the distribution of the residuals (Most distributions of generalized linear models (including the binomial distribution) are asymptotically normal, with some dependence of the variance on the mean, and, in this case, one can expect normal Pearson deviations/residual distributions. Therefore, for large sample sizes with binomial distribution, it makes sense to check the distribution of the residuals for normality.) was examined using a visual method based on the distributions of the residuals against a normal distribution, Q-Q (quartile-quartile) plots for quartiles, and probabilities. The final conclusion on the normality of the distribution of the residuals was performed based on the results of the Kolmogorov–Smirnov normality test, dispersion, and outlier tests.
-
A posterior predictive check was performed to evaluate the predictive power of the model for real data [78,79,80,81], to test the ability of the model to effectively simulate real data.

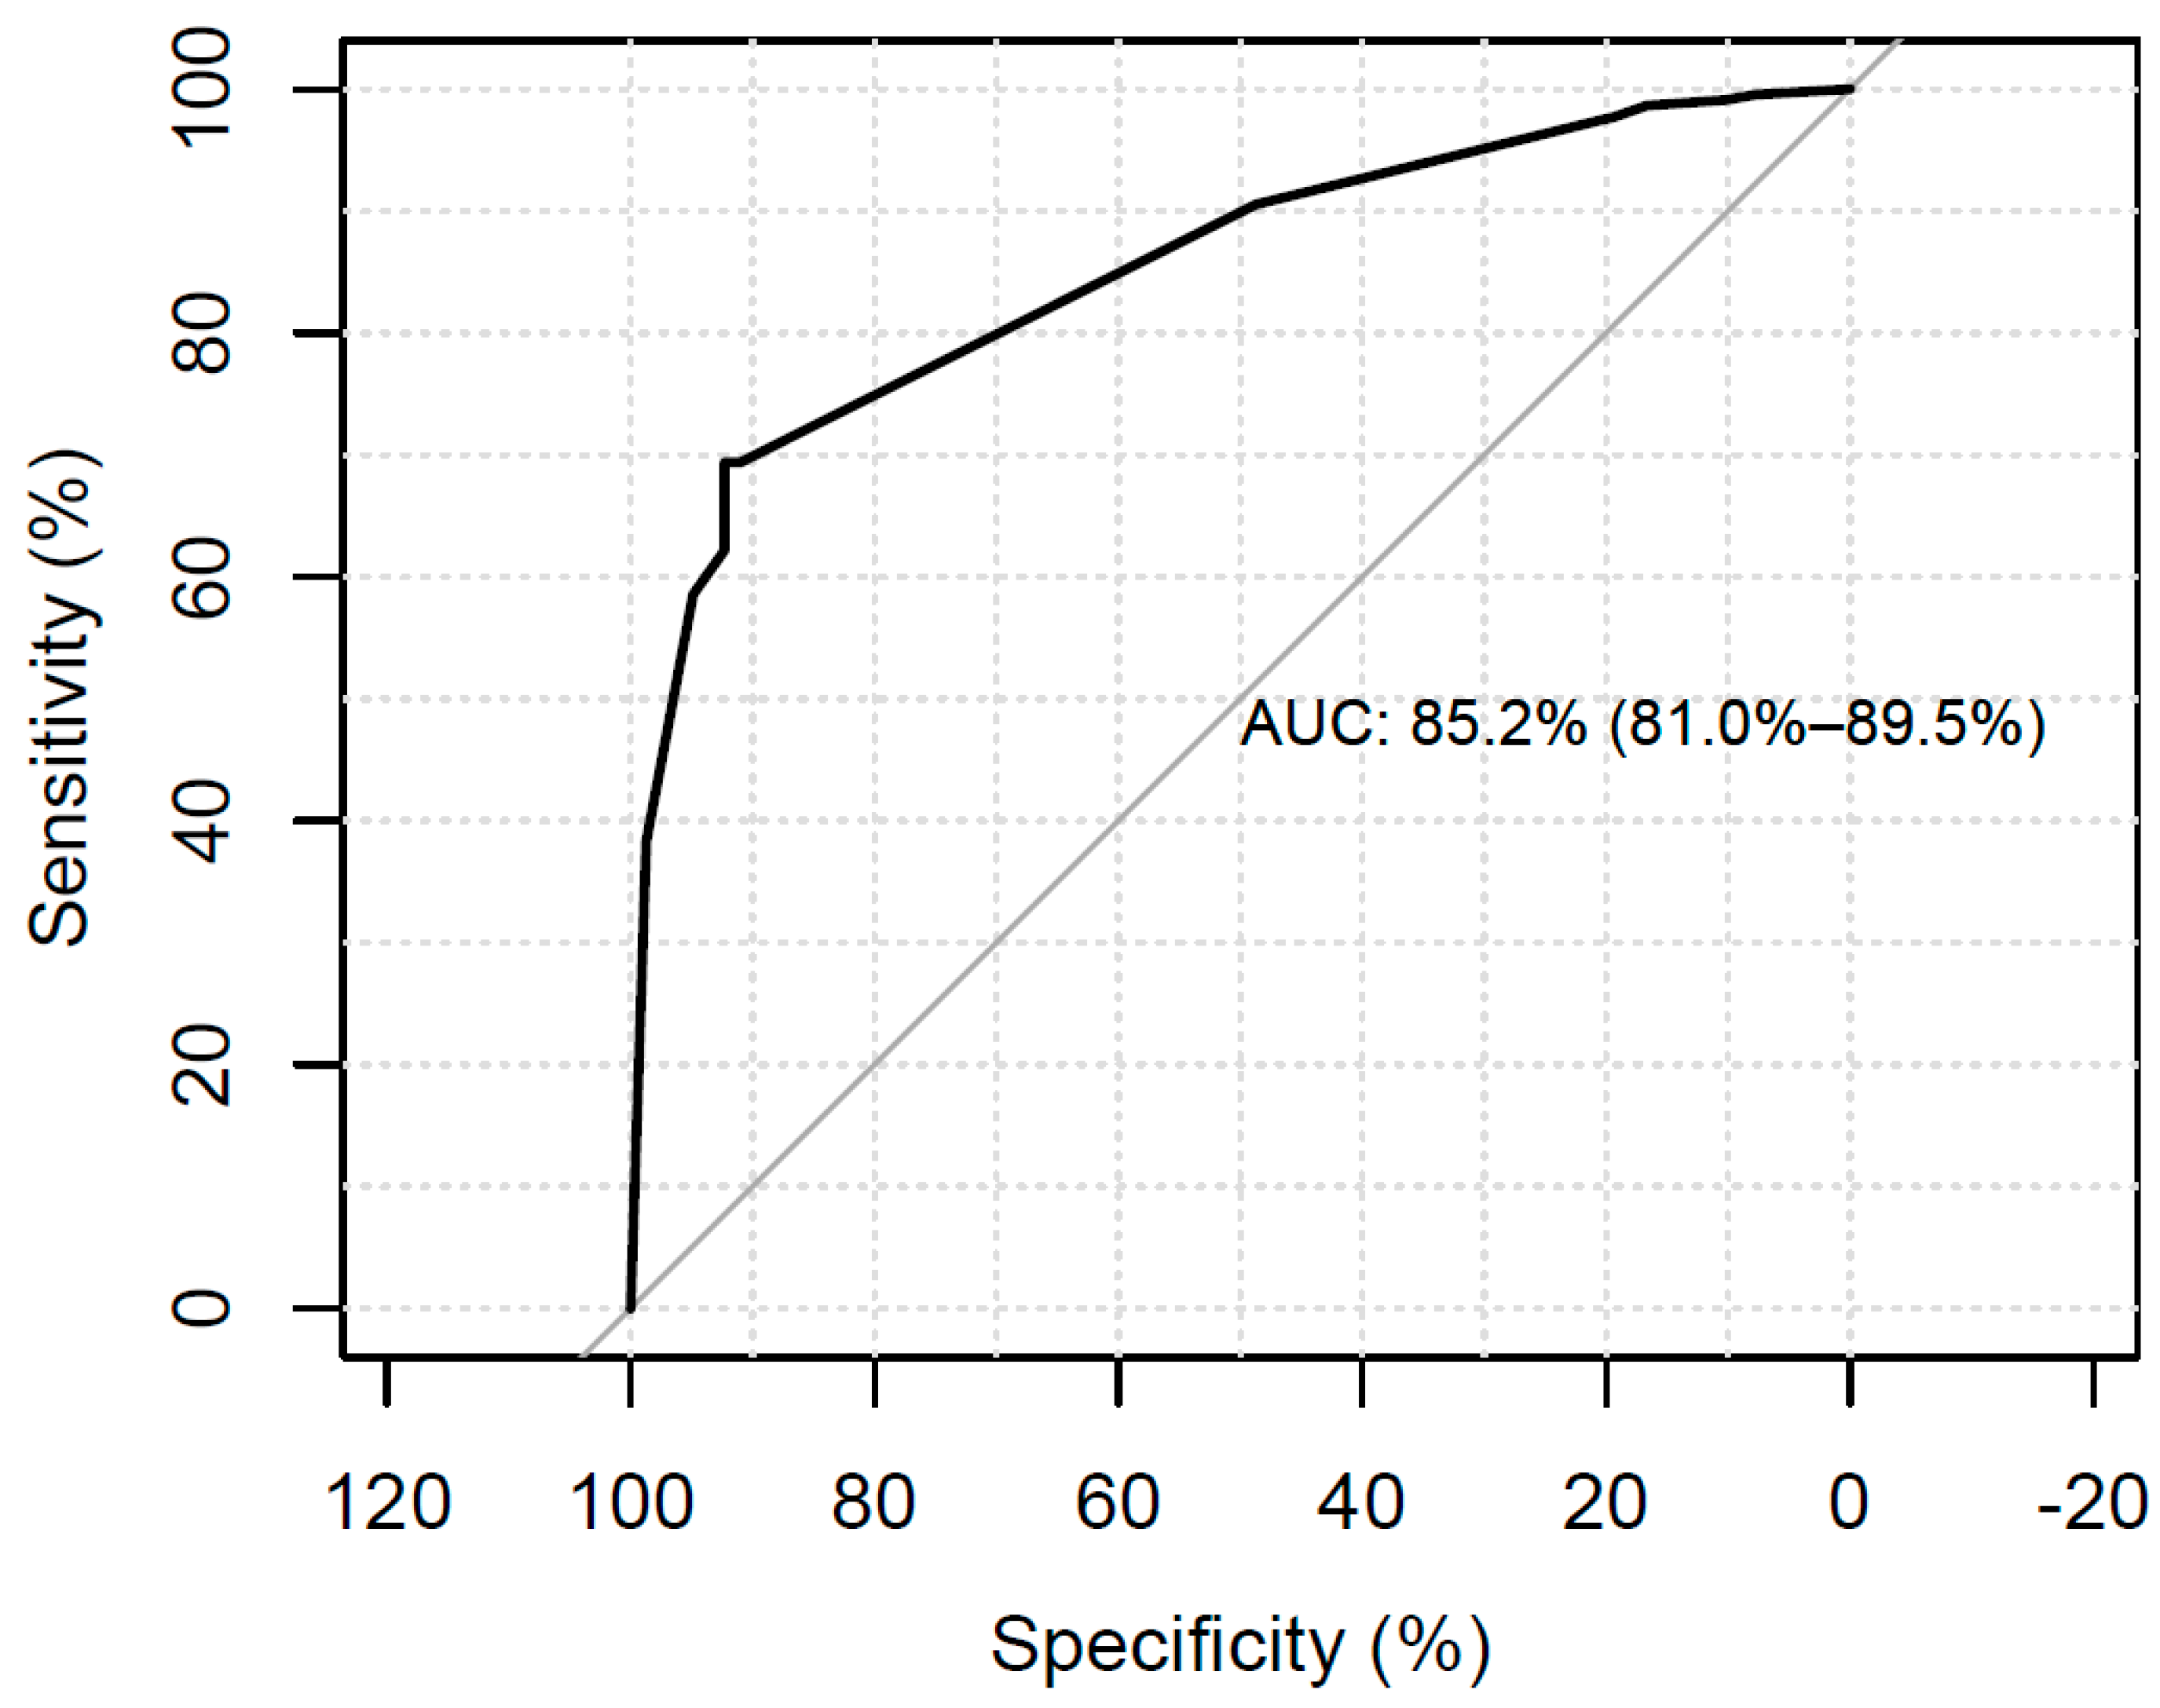
3.9. Evaluation of the Discriminatory Effect of the Model

The discriminatory effect of the fitted model was tested by visualizing the ROC curve and estimating the area under the curve (AUC). In addition, the quality of model fit was tested using the Hosmer–Lemeshow test [82], modified Hosmer–Lemeshow test [83], and Osius and Rojek test [84].

3.10. Statistical Environment

Analyses were conducted using the R statistical language (version 4.1.1; R Core Team, 2021) on Windows 10 Pro 64 (build 19045), using the packages DHARMa (version 0.4.6) [85], sjPlot (version 2.8.14) [86], performance (version 0.10.4) [87], report (version 0.5.7) [88], gtsummary (version 1.6.2) [89], readxl (version 1.3.1) [90], and dplyr (version 1.1.2) [91].

4. Results

4.1. Sample Characteristics, Estimation of Differences between Groups in Variables by Factor Further Investment in RES

A questionnaire survey was conducted among owners of single-family homes in the Lower Silesian Voivodeship who have made investments in renewable energy sources (RES). The survey, which had a sample size of N = 300, examined 12 different parameters. The properties of the variables under study, both for the total sample and for different groups based on future RES investment intentions, are detailed in Table 1.
The data presented in Table 1 show that of the N = 300 households surveyed, n = 222 (74%) showed interest in investing further in RES. This percentage was significantly higher compared to a 50% base level, χ2 (1) = 69.12, p < 0.001, affirming hypothesis H1.
A vast majority of respondents (99%) had received subsidies, and 92.7% benefited from thermal modernization relief. The average RES system capacity was 5.8 kW, with one-quarter of the systems exceeding a capacity of 7.5 kW.
The majority of these investments (75%) were undertaken in 2021, whereas only a quarter were executed in 2020. Around half of the respondents (49.7%) reported investment costs in the range of 10,000–20,000 PLN, and 12.3% of investments exceeded 40,000 PLN. The proportion of investments in photovoltaic battery systems was relatively low, at 6.3%.
Two-thirds of the cases utilized additional financing options, out of which over 80% were 0% credits, and the rest were loans.
A significant majority (89%) of respondents reported a decrease in energy costs subsequent to the RES investment. The percentage was significantly higher than 50%, χ2 (1) = 182.52, p < 0.001, which supports hypothesis H2.
Only 39% of the households surveyed rated the government’s financial support for investments in RES as sufficient. This proportion was significantly lower than 50%, χ2 (1) = 68.9, p < 0.001, which also supports the confirmation of hypothesis H3.
Upon analyzing the financed assets, it was found that heat pumps (43.3%) and photovoltaic batteries (34.2%) were the most frequently reported. A substantial segment of the households that profited from the investment had an annual income that did not exceed 100,000 PLN.
Intriguingly, households that had not made prior investments in photovoltaic batteries were more inclined to indicate future investment plans in RES. The annual income of the household also emerged as a crucial determinant of future RES investment. A significant majority of households with income up to 100,000 PLN were disinterested in further RES investment. In contrast, households with an income surpassing 100,000 PLN demonstrated a readiness for continued RES investment. Remarkably, all households with an annual income exceeding 200,000 PLN expressed a desire for continued investment in RES.

4.2. Examining the Factors That Influence Decisions about Further Investment in RES

The aim of the analysis was to use a multifactorial approach to identify the factors (and their effects) that have a significant influence on decisions about further investments in RES.

4.2.1. Selection of Variables for the Final Model

The original model, which examined the effects of all completed variables in Table 1 on further investment in RES, consisted of the following 10 predictors: subsidy received, thermal modernization relief, power, year of investment, investment cost, investment in battery, additional financing, reduction of energy costs, financing sufficiency, and annual household income (pre-transformed into a dichotomous variable with values up to PLN 100,000 and over PLN 100,000).
Adding an independent variable to a multivariate model that does not have a significant univariate effect on the dependent variable should allow control for confounding and for a more robust analysis that accounts for the joint influence of multiple variables and potentially reveals significant effects that were not apparent in the univariate analysis.
After applying a stepwise algorithm, the AIC value decreased from 257.73 to 243.75. The final regression model consisted of four predictors (thermal modernization relief, battery, additional financing, and annual household income) and included N = 300 observations.

4.2.2. Fitting of the Regression Model

As a result of the stepwise algorithm, the final model, fitted via AIC using a logit link function, contained four predictors and was described by the following formula:
F u r t h e r   i n v e s t m e n t   i n   R E S = β 0 + β 1 · T h e r m a l   m o d e r n i z a t i o n   r e l i e f + + β 2 · B a t t e r y + β 3 · A d d i t i o n a l   f u n d i n g + β 4 · A n n u a l   h o u s e h o l d   i n c o m e
The explanatory power of the model estimated with ML was substantial (Tjur’s R2 = 0.33). The intercept of the model corresponding to thermal modernization relief [no], battery [no], additional financing [no], and annual household income up to PLN 100 K was −1.59 (Log OR) (95% CI [−3.01, −0.25], p = 0.022).
The fitted model met the assumptions for the logistic regression model in terms of the multicollinearity parameter and normality of the distributions of the residuals (see the results of the review in Appendix A). The assumptions about missing influential observations and the ability to simulate the observed data were also verified.
Satisfying the assumptions of the regression model allowed us to conclude that the predictions, confidence intervals, and scientific observations obtained with the fitted model were not misleading or biased.
The receiver operating characteristic curve (ROC) of the fitted model with the estimated area under the curve (AUC) is shown in Figure 1.
The area under the curve in Figure 1 is 85.2%, CI 95% [81.0%, 98.5%]. The values of above 80% are considered to have good discriminating effect.
The results of the Hosmer–Lemeshow test (p = 0.957), the modified Hosmer–Lemeshow test (p = 0.958), and the Oseo–Rojek test (p = 0.864) were all non-significant. This indicated that there was no significant difference between the observed data and the predicted values and supported the assumption that the model had a good fit.
The results of the fitted model are shown in Table 2.
The data in Table 2 show that:
-
receiving a thermal modernization relief increased (result was significant at trend level (0.050 ≤ p < 0.100)) the odds of further investment in RES by 3.53 times (controlling for the other predictors—here and below);
-
battery possession significantly reduced the odds of further investment in RES by 74%;
-
the odds of additional financing significantly increased the chances of further investment in RES by 2.02-fold;
-
the odds of further investment in RES were significantly (30.8 times) higher for households with an annual income of more than PLN 100,000 than for households with an income of less than PLN 100,000.
From the comparison of the standardized effects of the regression model, it can be deduced that the largest absolute effect on decisions about further investment in RES was exerted by the factor of the annual household income, βstd = 1.71, while the smallest effect was on the side of the factor of additional financing, βstd = 0.70.

5. Discussion

Based on the results of the empirical study, it is necessary to point out the identified factors influencing the decision of households to further invest in RES. The first important aspect is the significant role of household income, which determines the willingness to invest in RES. Considering the economic aspect, this is an understandable result, since RES investments require an initial financial contribution, and households with higher incomes have greater financial flexibility and are willing to take investment risks. An additional finding in the study’s results indicated that previously owning a photovoltaic battery reduces the likelihood of further investment in RES. This unexpected relationship may be related to satisfaction with the results already achieved from the investment and may lead to a reduction in the need for further RES investments. Another critical issue is the result indicating that many households experienced decreased energy costs after investing in RES. This result confirms that investments in RES lead to environmental protection and bring tangible economic benefits that provide a significant incentive for further investments in this area. However, although RES investments appear economically viable, more government support must be indicated. This serious aspect requires further consideration and potential action by the authorities to encourage more households to invest in RES. In addition, one of the main challenges in the context of the survey results is the need to understand why such a number of households believe that government support is insufficient, even though they clearly indicate interest in further investment. This may indicate gaps in the current support mechanisms or inadequate communication regarding the discounts, subsidies, or external financing opportunities offered.
It should be noted that the surveys conducted contain limitations. These include geographic limitations, as the research focused exclusively on the Lower Silesia region. This makes it difficult to generalize the results to the whole country, considering, among other things, differences in climate, economy, and availability of RES, which may affect household decisions. It should be pointed out that it would be worthwhile to conduct such surveys in the future over a broader area to obtain more representative results.
Another limitation is sampling bias. The limitation related to sampling bias is an important aspect that requires deeper analysis. The survey focused exclusively on households that have already made investments in RES. This equal focus may lead to the introduction of a form of bias, as these households may differ from those that have not yet taken such action. While telling a lot about the attitudes and investment decisions of the already-invested group, the results do not necessarily reflect the general population of households that have yet to make such investments.
Differences between households that have already invested in RES and those that have yet to may be caused by factors such as environmental awareness, availability of information, or the initial capital for investment. Failure to include the latter group of households that have not yet decided to take a step towards RES limits the survey’s ability to understand the national RES investment landscape fully.
In practice, the results may be highly representative only of those households that have already broken through specific barriers and invested in RES. These results may not capture the full range of reasons why other households have yet to take such action or may not capture the barriers that currently inhibit RES expansion in society.
Extending the analysis to the households that still need to invest in RES could allow a better understanding of the differences in attitudes, motivations, and barriers between the two groups. A comparative analysis of the two groups would allow the critical determinants of investment decisions to emerge and identify the barriers that limit RES proliferation. Therefore, in the context of a comprehensive approach to renewable energy, including both households—those who are already investing and those who have not yet taken such steps—is crucial for a fuller understanding of the directions and strategies promoting a sustainable energy transition.
The lack of inclusion of a control group is an essential limitation of the study that may affect the reliability and generality of the results obtained. The survey focused only on households already invested in renewable energy sources (RES), leaving out the group that still needed to do so. This gap in methodology leads to the need for a baseline—a group that could serve as a comparative control in the analysis.
The presence of a control group is crucial in studies of this type, as it allows comparisons to be made between two different states or behaviors. In this case, the absence of a control group of households that have yet to invest in RES makes it challenging to estimate the impact of the investment on household decisions reliably. A definitive assessment of whether the investments have influenced attitudes and behavior change is hampered when it is not possible to compare these households with the other group.
In the absence of a control group, whether the differences in outcomes result from the impact of the RES investment or other unidentified factors is still being determined. While the survey can provide valuable information about the investing group, it is still being determined whether these results are transferable to the general household population.
Adding a control group, i.e., households that still need to make a RES investment decision, would allow a more accurate estimation of the actual impact of investments on attitudes and decisions. Comparing the two groups would make it possible to isolate the causal effect of investment and distinguish it from other factors influencing these decisions. In future studies, it is recommended that a control group be included to construct a more complete picture of the impact of RES investments on various household attitudes and behaviors.
Limiting the range of variables in the study is a significant challenge that may introduce some distortion in the analysis of the impact on households’ RES investment decisions. Although 12 parameters have already been included, other vital factors that influence these decisions may remain outside the scope of the study.
One such overlooked factor is household environmental awareness. Today’s society is increasingly concerned about the environment, which could be an essential motivator for undertaking RES investments. Regardless of economic aspects, households driven by environmental protection may be more inclined to invest in green energy technologies. The inability to include this aspect in the analysis could lead to a distorted interpretation of the results, as this factor could significantly impact investment decisions.
The availability of information about RES and the actions taken by local authorities to promote sustainable energy could also be important determinants of household decisions. The absence of these variables in the analysis may not show the full spectrum of factors influencing these decisions. Households with easy access to reliable information about the benefits of investing in RES, or those encouraged by local institutions to take environmentally friendly measures, may be more inclined to invest.
It is also worth noting that local and national government policies can significantly impact households’ RES investment behavior. Supportive programs, subsidies, or tax incentives can change the perception of investment as an attractive and profitable option. Omitting these aspects from the impact analysis may lead to an incomplete understanding of the context in which investment decisions are made.
In future studies, it would be worthwhile to expand the variables to include the mentioned factors to construct a more complete picture of households’ decisions to invest in RES. Only in this way will it be possible to estimate the impact of all relevant determinants on these decisions and to understand how different factors interact and influence each other. Future research could address these limitations by including a more diverse geographic sample, including households that have not invested in RES, and examining a more comprehensive range of influencing factors.

6. Conclusions

In conclusion, the results of this study reveal a clear interest among households in investing in renewable energy sources (RES) in the Lower Silesian Voivodeship. The pivotal determinant of willingness to invest in RES emerged as household income. This underscores the significance of economic factors as the primary driver influencing the decision to undertake investment risks in sustainable energy. A surprising finding was that prior possession of photovoltaic batteries might be associated with a reduced propensity for further RES investments. This intriguing phenomenon could signify a sense of contentment with previously achieved investment outcomes and potentially lessen the necessity for further engagement in this domain.
Furthermore, most surveyed households reported experiencing a reduction in energy costs following their RES investments, substantiating the economic benefits of such initiatives. However, the study results also underscore the perceived inadequacy of governmental financial support. This leads to discussions about the necessity for more suitable and effective support mechanisms for households engaging in RES investments.
The role of economic factors, encompassing financial accessibility and perceived profitability, in fostering RES investments is undeniable. Policy initiatives should duly consider these factors to bolster the growth of green energy adoption within the domestic sector. Introducing incentives such as tax benefits, preferential loans, or subsidies can enhance the appeal of RES investments, especially for households with lower incomes.
As for future research directions, a more comprehensive exploration of the reasons behind the perceived insufficiency of government support becomes essential. This can offer better insights into the expectations and needs of households, facilitating a tailored adjustment of support policies to align with their genuine requirements. Additionally, it is imperative to investigate the distinct roles of various forms of financial assistance in promoting RES investments, aiming to identify those with the most significant impact on investment decisions. Pursuing these avenues of research can contribute to a more efficient and targeted approach toward driving energy transition at the household level.

Funding

This research was funded by departmental funds of the University of Wroclaw.

Data Availability Statement

All statistical, financial, and non-financial statement data can be found with the author. Available upon request.

Conflicts of Interest

The authors declare no conflict of interest. The funders had no role in the design of the study; in the collection, analyses, or interpretation of the data; in the writing of the manuscript; or in the decision to publish the results.

Abbreviations

List of abbreviations of the names of statistical measures:
Nsample size;
ngroup size;
pthe p-value of the statistical test;
padjp-value adjusted for multiple comparisons;
Mdnmedian;
Q1the first quartile (25%);
Q3the third quartile (75%);
CI 95%95% confidence interval;
βregression coefficient;
βstdstandardized regression coefficient;
ORodds ratios;
dfdegrees of freedom;
χ2chi-square test statistic for goodness of fit.

Appendix A

The distribution of residuals together with a normality test for the fitted multivariate model is shown in Figure A1.
Figure A1. Q-Q plot of the distribution of residuals along with the distribution of each quartile.
Energies 16 07100 g0a1
From the data in Figure A1, it can be seen that the expected residuals of the model lie along the red reference line compared to the observed residuals. Furthermore, the KS, dispersion, and outlier tests performed show that there are no deviations from normality. Furthermore, no significant deviations were found for the individual quartiles.

Test of Multicollinearity

The multicollinearity results of the predictors of the fitted model are shown in Table A1.
Table A1. Results of the predictors of the fitted model.
PredictorVIF95% CI
Thermal modernization relief1.08[1.02, 1.40]
Battery1.05[1.01, 1.52]
Additional financing1.00[1.00, 2.25]
Annual household income1.14[1.05, 1.39]
Based on the data in Table A1, the VIF parameters for all predictors were lower than 3.0, allowing us to infer that there was low collinearity between the explained variables.

References

  1. Knopf, B.; Nahmmacher, P.; Schmid, E. The European renewable energy target for 2030—An impact assessment of the electricity sector. Energy Policy 2015, 85, 50–60. [Google Scholar] [CrossRef]
  2. Zhang, L.; Saydaliev, H.B.; Ma, X. Does green finance investment and technological innovation improve renewable energy efficiency and sustainable development goals. Renew. Energy 2022, 193, 991–1000. [Google Scholar] [CrossRef]
  3. Azimian, B.; Biswas, R.S.; Moshtagh, S.; Pal, A.; Tong, L.; Dasarathy, G. State and Topology Estimation for Unobservable Distribution Systems Using Deep Neural Networks. arXiv 2021, arXiv:2104.07208. Available online: https://arxiv.org/abs/2104.07208 (accessed on 13 June 2023). [CrossRef] [PubMed]
  4. Martínez, G.; Merinero, M.; Pérez-Aranda, M.; Pérez-Soriano, E.M.; Ortiz, T.; Villamor, E.; Begines, B.; Alcudia, A. Erratum: Guillermo, M.; et al. Environmental Impact of Nanoparticles’ Application as an Emerging Technology: A Review. Materials 2021, 14, 166, Erratum in Materials 2021, 14, 1710. [Google Scholar] [CrossRef] [PubMed]
  5. Saidi, K.; Omri, A. The impact of renewable energy on carbon emissions and economic growth in 15 major renewable energy-consuming countries. Environ. Res. 2020, 186, 109567. [Google Scholar] [CrossRef] [PubMed]
  6. Wu, B.; Liang, H.; Chan, S. Political Connections, Industry Entry Choice and Performance Volatility: Evidence from China. Emerg. Mark. Financ. Trade 2021, 58, 290–299. [Google Scholar] [CrossRef]
  7. Hiemstra, C.; Jones, J.J. Testing for Linear and Nonlinear Granger Causality in the Stock Price-Volume Relation. J. Financ. 1994, 49, 1639–1664. [Google Scholar] [CrossRef]
  8. Haque, M.I. Oil price shocks and energy consumption in GCC countries: A system-GMM approach. Environ. Dev. Sustain. 2021, 23, 9336–9351. [Google Scholar] [CrossRef]
  9. Jiaping, X.; Zhong, L.; Yu, X.; Ling, L.; Weisi, Z. Optimizing capacity investment on renewable energy source supply chain. Comput. Ind. Eng. 2017, 107, 57–73. [Google Scholar] [CrossRef]
  10. Renewable Energy: Setting Ambitious Targets for Europe. Available online: https://www.europarl.europa.eu/news/pl/headlines/economy/20171124STO88813/energia-odnawialna-wyznaczanie-ambitnych-celow-dla-europy?at_campaign=20234-Green&at_medium=Google_Ads&at_platform=Search&at_creation=DSA&at_goal=TR_G&at_audience=&at_topic=Renewables&gclid=Cj0KCQjwtO-kBhDIARIsAL6LorcP3aoozWgiRsqCeyl2WaxZKMfLPUVf2BweYXvInFVPHlgvN_3Lm3IaAqcIEALw_wcB (accessed on 1 June 2023).
  11. Green Deal: The Key to a Climate-Neutral and Sustainable EU. Available online: https://www.europarl.europa.eu/news/pl/headlines/society/20200618STO81513/zielony-lad-klucz-do-neutralnej-klimatycznie-i-zrownowazonej-ue?&at_campaign=20234-Green&at_medium=Google_Ads&at_platform=Search&at_creation=RSA&at_goal=TR_G&at_audience=zielony%20ład%20ue&at_topic=Green_Deal&at_location=PO&gclid=Cj0KCQjwtO-kBhDIARIsAL6LordH4r7OGNqlWBc55hUKMwjZnDmQhtwQ4bTlqSnrVvSxT6Am5vYb0icaAvXZEALw_wcB (accessed on 1 June 2023).
  12. Ehrenmann, A.; Smeers, Y. Generation Capacity Expansion in a Risky Environment: A Stochastic Equilibrium Analysis. Oper. Res. 2011, 59, 1332–1346. [Google Scholar] [CrossRef]
  13. Renewable Energy. Available online: https://www.europarl.europa.eu/factsheets/pl/sheet/70/energia-ze-zrodel-odnawialnych (accessed on 1 June 2023).
  14. RES in Europe. Which Countries Are Currently the Greenest? Available online: https://magazynprzemyslowy.pl/artykuly/oze-w-europie-ktore-panstwa-sa-obecnie-najbardziej-zielone (accessed on 5 June 2023).
  15. Electricity Production from Renewable Energy Sources. Available online: https://www.rynekelektryczny.pl/energia-elektryczna-ze-zrodel-odnawialnych/ (accessed on 5 June 2023).
  16. Lee, C.C.; Chang, C.P. Energy consumption and economic growth in Asian economies: A more comprehensive analysis using panel data. Resour. Energy Econ. 2008, 30, 50–65. [Google Scholar] [CrossRef]
  17. Jayanthakumaran, K.; Verma, R.; Liu, Y. CO2 emissions, energy consumption, trade and income: A comparative analysis of China and India. Energy Policy 2012, 42, 450–460. [Google Scholar] [CrossRef]
  18. Hanif, I. Impact of fossil fuels energy consumption, energy policies, and urban sprawl on carbon emissions in East Asia and the Pacific: A panel investigation. Energy Strategy Rev. 2018, 21, 16–24. [Google Scholar] [CrossRef]
  19. Settele, J.; Díaz, S.; Brondizio, E.; Daszak, P. COVID-19 stimulus measures must save lives, protect livelihoods, and safeguard nature to reduce the risk of future pandemics. IPBES Expert Guest Artic. 2020, 27. Available online: https://www.globalissues.org/news/2020/04/27/26337 (accessed on 1 June 2023).
  20. Klenert, D.; Funke, F.; Mattauch, L.; O’Callaghan, B. Five lessons from COVID-19 for advancing climate change mitigation. Environ. Resour. Econ. 2020, 76, 751–778. [Google Scholar] [CrossRef] [PubMed]
  21. Sharma, G.D.; Tiwari, A.K.; Jain, M.; Yadav, A.; Srivastava, M. COVID-19 and environmental concerns: A rapid review. Renew. Sustain. Energy Rev. 2021, 148, 111239. [Google Scholar] [CrossRef]
  22. Tian, J.F.; Yu, L.G.; Xue, R.; Zhuang, S.; Shan, Y.L. Global low-carbon energy transition in the post-COVID-19 era. Appl. Energy 2022, 307, 118205. [Google Scholar] [CrossRef] [PubMed]
  23. Zhao, J.; Dong, K.; Dong, X.; Shahbaz, M. How renewable energy alleviates energy poverty? A global analysis. Renew. Energy 2022, 186, 299–311. [Google Scholar] [CrossRef]
  24. Nelson, S.; Allwood, J.M. The technological and social timelines of climate mitigation: Lessons from 12 past transitions. Energy Policy 2021, 152, 112155. [Google Scholar] [CrossRef]
  25. Kang, J.; Yu, C.; Xue, R.; Yang, D.; Shan, Y. Can regional integration narrow city-level energy efficiency gap in China? Energy Policy 2022, 163, 112820. [Google Scholar] [CrossRef]
  26. Elheddad, M.; Benjasak, C.; Deljavan, R.; Alharthi, M.; Almabrok, J.M. The effect of the Fourth Industrial Revolution on the environment: The relationship between electronic finance and pollution in OECD countries. Technol. Forecast. Soc. Chang. 2021, 163, 120485. [Google Scholar] [CrossRef]
  27. Friedman, M. The social responsibility of business is to increase its profits. In Corporate Ethics and Corporate Governance; Springer: Berlin/Heidelberg, Germany, 2007; pp. 173–178. [Google Scholar] [CrossRef]
  28. Jeucken, M. Sustainability in Finance: Banking on the Planet; Eburon Uitgeverij BV: Delft, The Netherlands, 2004. [Google Scholar]
  29. Liu, H.; Wang, Y.; Xue, R.; Linnenluecke, M.; Cai, C.W. Green commitment and stock price crash risk. Financ. Res. Lett. 2021, 47, 102646. [Google Scholar] [CrossRef]
  30. Tamazian, A.; Chousa, J.P.; Vadlamannati, K.C. Does higher economic and financial development lead to environmental degradation: Evidence from BRIC countries. Energy Policy 2009, 37, 246–253. [Google Scholar] [CrossRef]
  31. Stavins, R.N. Experience with market-based environmental policy instruments. In Handbook of Environmental Economics; Mäler, K.G., Vincent, J.R., Eds.; Elsevier: Amsterdam, The Netherlands, 2003; Volume 1, pp. 355–435. [Google Scholar] [CrossRef]
  32. Aizawa, M.; Yang, C. Green credit, green stimulus, green revolution? China’s mobilization of banks for environmental cleanup. J. Environ. Dev. 2010, 19, 119–144. [Google Scholar] [CrossRef]
  33. Chen, Z.; Marin, G.; Popp, D.; Vona, F. Green stimulus in a post-pandemic recovery: The role of skills for a resilient recovery. Environ. Resour. Econ. 2020, 76, 901–911. [Google Scholar] [CrossRef]
  34. Tian, J.F.; Pan, C.; Xue, R.; Yang, X.T.; Wang, C.; Ji, X.Z.; Shan, Y.L. Corporate innovation and environmental investment: The moderating role of institutional environment. Adv. Clim. Chang. Res. 2020, 11, 85–91. [Google Scholar] [CrossRef]
  35. White, M.A. Environmental finance: Value and risk in an age of ecology. Bus. Strategy Environ. 1996, 5, 198–206. [Google Scholar] [CrossRef]
  36. Sandor, R. How I Saw It; World Scientific: Singapore, 2017. [Google Scholar] [CrossRef]
  37. Allan, S.; Bahadur, A.V.; Venkatramani, S.; Soundarajan, V. The Role of Domestic Budgets in Financing Climate Change Adaptation. Rotterdam and Washington, DC. 2019. Available online: https://gca.org/reports/the-role-of-domestic-budgets-in-financing-climate-change-adaptation/ (accessed on 1 June 2023).
  38. Apergis, N.; Payne, J.E. Renewable energy consumption and economic growth: Evidence from a panel of OECD countries. Energy Policy 2010, 38, 656–660. [Google Scholar] [CrossRef]
  39. Ciplet, D.; Adams, K.M.; Weikmans, R.; Roberts, J.T. The transformative capability of transparency in global environmental governance. Glob. Environ. Politics 2018, 18, 130–150. [Google Scholar] [CrossRef]
  40. Henke, H.M. The effect of social screening on bond mutual fund performance. J. Bank. Financ. 2016, 67, 69–84. [Google Scholar] [CrossRef]
  41. Kilian, L.; Hicks, B. Did Unexpectedly Strong Economic Growth Cause the Oil Price Shock of 2003–2008? J. Forecast. 2013, 32, 385–394. [Google Scholar] [CrossRef]
  42. Mala, R.; Chand, P. Effect of the global financial crisis on accounting convergence. Account. Financ. 2012, 52, 21–46. [Google Scholar] [CrossRef]
  43. Rutkowska-Tomaszewska, E.; Łakomiak, A.; Stanisławska, M. The Economic Effect of the Pandemic in the Energy Sector on the Example of Listed Energy Companies. Energies 2022, 15, 158. [Google Scholar] [CrossRef]
  44. Chepeliev, M.; Maliszewska, M.; Seara e Pereira, M. The War in Ukraine, Food Security and the Role for Europe. EuroChoices 2023, 22, 4–13. [Google Scholar] [CrossRef]
  45. Russo, T.N. US and Global Energy Security: Where We Are Falling Short. Clim. Energy 2022, 39, 9–22. [Google Scholar] [CrossRef]
  46. Abolhosseini, S.; Heshmati, A. The main support mechanisms to finance renewable energy development. Renew. Sustain. Energy Rev. 2014, 40, 876–885. [Google Scholar] [CrossRef]
  47. European Commission. Energy for the Future: Renewable Sources of Energy; White Paper for a Community Strategy and Action Plan COM(97)599 Final. 1997. Available online: https://eur-lex.europa.eu/legal-content/EN/ALL/?uri=CELEX%3A51997DC0599 (accessed on 1 July 2023).
  48. Directive 2009/28/EC of the European Parliament and of the Council of 23 April 2009 on the Promotion of the Use of Energy from Renewable Sources and Amending the Subsequently Repealing Directives 2001/77/EC and 2003/30/EC. 2009. Available online: https://eur-lex.europa.eu/legal-content/EN/TXT/PDF/?uri=CELEX:32009L0028 (accessed on 1 July 2023).
  49. Klein, A.; Pfluger, B.; Held, A.; Ragwitz, M.; Resch, G.; Faber, T. Fraunhofer Institute for Systems and Innovation Research. 2008. Available online: http://www.renewwisconsin.org/policy/ARTS/MISCDocs/best_practice_paper_2nd_edition_final.pdf (accessed on 1 June 2023).
  50. del Río, P.; Mir-Artigues, P. Combinations of support instruments for renewable electricity in Europe: A review. Renew. Sustain. Energy Rev. 2014, 40, 287–295. [Google Scholar] [CrossRef]
  51. Schallenberg-Rodriguez, J.; Haas, R. Fixed feed-in tariff versus premium: A review of the current Spanish system. Renew. Sustain. Energy Rev. 2012, 16, 293–305. [Google Scholar] [CrossRef]
  52. Huenteler, J. International support for feed-in tariffs in developing countries–a review and analysis of proposed mechanisms. Renew. Sustain. Energy Rev. 2014, 39, 857–873. [Google Scholar] [CrossRef]
  53. Ramli, M.A.M.; Twaha, S. Analysis of renewable energy feed-in tariffs in selected regions of the globe: Lessons for Saudi Arabia. Renew. Sustain. Energy Rev. 2015, 45, 649–661. [Google Scholar] [CrossRef]
  54. Wiser, R.; Barbose, G.; Heeter, J.; Mai, T.; Bird, L.; Bolinger, M.; Millstein, D.; A Retrospective Analysis of the Benefits and Impacts of U.S. Renewable Portfolio Standards. Available online: https://emp.lbl.gov/sites/all/files/lbnl-1003961.pdf (accessed on 1 June 2023).
  55. Sun, P.; Nie, P. A comparative study of feed-in tariff and renewable portfolio standard policy in the renewable energy industry. Renew. Energy 2015, 74, 255–262. [Google Scholar] [CrossRef]
  56. Couture, T.; Gagnon, Y. An analysis of feed-in tariff remuneration models: Implications for renewable energy investment. Energy Policy 2010, 38, 955–965. [Google Scholar] [CrossRef]
  57. Ringel, M. Fostering the use of renewable energies in the European Union: The race between feed-in tariffs and green certificates. Renew. Energy 2006, 31, 1–17. [Google Scholar] [CrossRef]
  58. Midttun, A.; Gautesen, K. Feed-in or certificates, competition or complementarity? Combining a static efficiency and a dynamic innovation perspective on the greening of the energy industry. Energy Policy 2007, 35, 1419–1422. [Google Scholar] [CrossRef]
  59. An Overview of Renewable Energy Sources in SE Europe: Challenges and Opportunities. 2014. Available online: www.iene.eu/articlefiles/serbia.pdf (accessed on 10 March 2023).
  60. Lalic, D.; Popovski, K.; Gecevska, V.; Vasilevska, S.P.; Tesic, Z. Analysis of the opportunities and challenges for the renewable energy market in the Western Balkan countries. Renew. Sustain. Energy Rev. 2011, 15, 3187–3195. [Google Scholar] [CrossRef]
  61. Sustainable Finance in Poland. Available online: https://wise-europa.eu/wp-content/uploads/2019/11/Sustainable-Finance-in-Poland-1-1-1.pdf (accessed on 13 June 2023).
  62. Green Bond Report on the Use of Proceeds. 2021. Available online: https://www.google.com/url?sa=t&rct=j&q=&esrc=s&source=web&cd=&ved=2ahUKEwj1n_T9yfD_AhXIS_EDHaLyDY4QFnoECBgQAQ&url=https%3A%2F%2Fwww.gov.pl%2Fdocuments%2F1079560%2F1080340%2FGreen_Bond_Report_on_the_Use_of_Proceeds.pdf&usg=AOvVaw3olUrrnfzCMTAhUF2hPCrD&opi=89978449 (accessed on 14 June 2023).
  63. Prospects for the Development of the Green Bond Market in Poland. 2021. Available online: https://www.google.com/url?sa=t&rct=j&q=&esrc=s&source=web&cd=&ved=2ahUKEwjJ9MWqyvD_AhWrQfEDHfYdApwQFnoECAYQAQ&url=https%3A%2F%2Fwww.gov.pl%2Fattachment%2F86458c27-a259-4b6c-bd8f-27b58689d420&usg=AOvVaw3Di2zr96kmVAsUg6ROZDcn&opi=89978449 (accessed on 14 June 2023).
  64. Polish Ministry of Climate and Environment, Polish Energy Policy until 2040. Available online: https://www.gov.pl/web/climate/energy-policy-of-poland-until-2040-epp2040 (accessed on 14 June 2023).
  65. Renewable Energy. Available online: https://www.paih.gov.pl/archiwum-newslettera-6983/rok-2010-17341/fundusze-europejskie-wsparcie-nie-tylko-dla-inwestycji-8092/ (accessed on 14 June 2023).
  66. Enablon ESG. Available online: https://www.wolterskluwer.com/en/solutions/enablon/esg?utm_source=google&utm_medium=cpc&utm_campaign=[SEM]-GoogleAds-Performance-[SEARCH]-APPLICATIONS-EMEA-ESG&gad=1&gclid=Cj0KCQjwwISlBhD6ARIsAESAmp4uugGD7eLyFV6ekGRIDGtneQH9NycCeKWu-uREa7BezV4v93SFj00aAt3UEALw_wcB (accessed on 14 June 2023).
  67. Polish Bank Association, ESG in the Polish Banking Sector. Available online: https://callback-css.bnpparibas.pl/?gclid=Cj0KCQjwwISlBhD6ARIsAESAmp7u101eJGbDp6yogD23HMOCrcoq8pN6hQAxAZ3P2kQpILaAdH1i_mAaAoZtEALw_wcB&gclsrc=aw.ds (accessed on 14 June 2023).
  68. Renewable Energy Sources in Poland-Development and Prospects. Available online: https://www.cire.pl/artykuly/materialy-problemowe/125119-odnawialne-zrodla-energii-w-polsce-rozwoj-i-perspektywy (accessed on 14 June 2023).
  69. Work on a Roadmap for the Development of Sustainable Finance in Poland Begins. Available online: https://www.gov.pl/web/finanse/ruszaja-prace-nad-mapa-drogowa-dla-rozwoju-zrownowazonych-finansow-w-polsce (accessed on 14 June 2023).
  70. Danieluk, B. Zastosowanie regresji logistycznej w badaniach eksperymentalnych. Psychol. Społeczna 2010, 14, 199–216. [Google Scholar]
  71. Venables, W.N.; Ripley, B.D. Modern Applied Statistics with S, 4th ed.; Springer: New York, NY, USA, 2002; ISBN 0-387-95457-0. Available online: https://www.stats.ox.ac.uk/pub/MASS4/ (accessed on 15 June 2023).
  72. Baron, R.M.; Kenny, D.A. The moderator-mediator variable distinction in social psychological research: Conceptual, strategic, and statistical considerations. J. Personal. Soc. Psychol. 1986, 51, 1173–1182. [Google Scholar] [CrossRef]
  73. Aiken, L.S.; West, S.G. Multiple Regression: Testing and Interpreting Interactions; Sage Publications: New York, NY, USA, 1991. [Google Scholar]
  74. Hayes, A.F. Introduction to Mediation, Moderation, and Conditional Process Analysis: A Regression-Based Approach; Guilford Press: New York, NY, USA, 2013. [Google Scholar]
  75. Cohen, J.; Cohen, P.; West, S.G.; Aiken, L.S. Applied Multiple Regression/Correlation Analysis for the Behavioral Sciences; Routledge: Oxfordshire, UK, 2013. [Google Scholar]
  76. Pedhazur, E.J.; Schmelkin, L.P. Measurement, Design, and Analysis: An Integrated Approach; Psychology Press: London, UK, 1991. [Google Scholar]
  77. Zuur, A.F.; Ieno, E.N.; Walker, N.J.; Saveliev, A.A.; Smith, G. Mixed Effects Models and Extensions in Ecology With R; Springer: New York, NY, USA, 2009. [Google Scholar] [CrossRef]
  78. Statisticat, LLC. Laplaces Demon: Complete Environment for Bayesian Inference. R Package Version 16.1.6. 2021. Available online: https://web.archive.org/web/20150206004624 (accessed on 15 June 2023).
  79. Statisticat, LLC. Bayesian Inference. R package, Version 16.1; R Foundation: Vienna, Austria, 2021. [Google Scholar]
  80. Gelman, A.; Hill, J. Data Analysis Using Regression and Multilevel/Hierarchical Models; Cambridge University Press: New York, NY, USA, 2007. [Google Scholar]
  81. Gelman, A.; Carlin, J.B.; Stern, H.S.; Dunson, D.B.; Vehtari, A.; Rubin, D.B. Bayesian Data Analysis, 3rd ed.; Chapman and Hall/CRC: Boca Raton, FL, USA, 2013. [Google Scholar] [CrossRef]
  82. Hosmer, D.; Hosmer, T.; Le Cessie, S.; Lemeshow, S. A comparison of goodness-of-fit tests for the logistic regression model. Stat. Med. 1997, 16, 965–980. [Google Scholar] [CrossRef]
  83. Hosmer, D.W.; Lemeshow, S. Applied Logistic Regression; Wiley: New York, NY, USA, 2013; ISBN 978-0-470-58247-3. [Google Scholar]
  84. Osius, G.; Rojek, D. Normal goodness-of-fit tests for multinomial models with large degrees of freedom. J. Am. Stat. Assoc. 1992, 87, 1145–1152. [Google Scholar] [CrossRef]
  85. Hartig, F. DHARMa: Residual Diagnostics for Hierarchical (Multi-Level/Mixed) Regression Models. R Package Version 0.4.6. 2022. Available online: https://CRAN.R-project.org/package=DHARMa> (accessed on 15 June 2023).
  86. Lüdecke, D. sjPlot: Data Visualization for Statistics in Social Science. R Package Version 2.8.14. 2023. Available online: https://CRAN.R-project.org/package=sjPlot> (accessed on 15 June 2023).
  87. Lüdecke, D.; Ben-Shachar, M.; Patil, I.; Waggoner, P.; Makowski, D. Performance: An R Package for Assessment, Comparison and Testing of Statistical Models. J. Open Source Softw. 2021, 6, 3139. [Google Scholar] [CrossRef]
  88. Makowski, D.; Lüdecke, D.; Patil, I.; Thériault, R.; Ben-Shachar, M.; Wiernik, B. Automated Results Reporting as a Practical Tool to Improve Reproducibility and Methodological Best Practices Adoption. CRAN. 2023. Available online: https://easystats.github.io/report/> (accessed on 16 June 2023).
  89. Sjoberg, D.; Whiting, K.; Curry, M.; Lavery, J.; Larmarange, J. Reproducible Summary Tables with the gtsummary Package. R J. 2021, 13, 570–580. [Google Scholar] [CrossRef]
  90. Wickham, H.; Bryan, J. readxl: Read Excel Files. R Package Version 1.3.1. 2019. Available online: https://CRAN.R-project.org/package=readxl> (accessed on 10 June 2023).
  91. Wickham, H.; François, R.; Henry, L.; Müller, K.; Vaughan, D. dplyr: A Grammar of Data Manipulation, R Package Version 1.1.2. 2023. Available online: https://CRAN.R-project.org/package=dplyr> (accessed on 20 June 2023).
Figure 1. ROC curve of fitted model.
Energies 16 07100 g001
Table 1. Characteristics of the distributions of the variables in the sample and by groups of further investments in RES, together with an estimate of the differences between the groups (relationships).
CharacteristicNOverall 1Further Investment in RESp-Value 2
no, n = 78 1yes, n = 222 1
Subsidy received
(3000 PLN)
300297.0 (99%)76.0 (97.4%)221.0 (99.5%)0.167 4
Thermal modernization relief300278.0 (92.7%)71.0 (91.0%)207.0 (93.2%)0.518 4
Power, kW3005.8 (4.6, 7.5) 25.7 (4.7, 8.3) 25.8 (4.6, 7.2) 20.167 5
Year of investment300 0.404 4
 2020 76.0 (25.3%)17.0 (21.8%)59.0 (26.6%)
 2021 224.0 (74.7%)61.0 (78.2%)163.0 (73.4%)
Investment cost, PLN300
 <10 K 4.0 (1.3%)1.0 (1.3%)3.0 (1.4%)1.000 3
 10–15 K 56.0 (18.7%)10.0 (12.8%)46.0 (20.7%)0.170 6
 15–20 K 93.0 (31.0%)29.0 (37.2%)64.0 (28.8%)0.219 6
 20–25 K 25.0 (8.3%)4.0 (5.1%)21.0 (9.5%)0.341 3
 25–30 K 22.0 (7.3%)3.0 (3.8%)19.0 (8.6%)0.262 3
 30–35 K 47.0 (15.7%)12.0 (15.4%)35.0 (15.8%)1.000 6
 35–40 K 16.0 (5.3%)5.0 (6.4%)11.0 (5.0%)0.842 3
 >40 K 37.0 (12.3%)14.0 (17.9%)23.0 (10.4%)0.120 6
Investment in battery for photovoltaics30026.0 (5.3%)12.0 (15.4%)14.0 (6.3%)0.014 4
Additional financing300192.0 (64.0%)43.0 (55.1%)149.0 (67.1%)0.058 4
Source of additional financing202 0.532 4
 credit 0% 166.0 (82.2%)38.0 (79.2%)128.0 (83.1%)
 loan 36.0 (17.8%)10.0 (20.8%)26.0 (16.9%)
 missing data 983068
Reduction of energy costs300267.0 (89.0%)67.0 (85.9%)200.0 (90.1%)0.309 4
The financing sufficiency300117.0 (39.0%)25.0 (32.1%)92.0 (41.4%)0.144 4
Subject of the investment222 -
 battery for photovoltaics 76.0 (34.2%)-76.0 (34.2%)
 heat pump 96.0 (43.3%)-96.0 (43.3%)
 recuperation 50.0 (22.5%)-50.0 (22.5%)
 missing data 78.0780
Annual household income, PLN300
 up to 100,000 139.0 (46.3%)71.0 (91.0%)68.0 (30.6%)<0.001 6
 100,000–200,000 67.0 (22.3%)7.0 (9.0%)60.0 (27.0%)0.002 6
 200,000–300,000 37.0 (12.3%)0.0 (0.0%)37.0 (16.7%)<0.001 6
 over 300,000 57.0 (19.0%)0.0 (0.0%)57.0 (25.7%)<0.001 6
1 n (%); 2 Mdn (Q1, Q3); 3 Fisher’s exact test; 4 Pearson’s chi-squared test; 5 Wilcoxon rank sum test; 6 proportion test.
Table 2. Results of the fitted logistic regression model, N = 300.
PredictorOR 195% CI 2p-Value
Thermal modernization relief
 no— (Reference level (here and below))
 yes3.530.97, 13.30.057 (The increase in the significance of the effect of the thermal modernization relief variable can be explained by the confounding effect of the annual household income variable and higher statistical power of multivariate regression models, which can help detect smaller effects that may not reach significance in the univariate analysis.)
Battery for photovoltaics
 no
 yes0.260.08, 0.780.019
Additional financing
 no
 yes2.021.04, 3.950.038
Annual household income, PLN
 up to 100,000
 over 100,00030.813.4, 83.8<0.001
1 OR = Odds Ratio; 2 CI = Confidence Interval.
Disclaimer/Publisher’s Note: The statements, opinions and data contained in all publications are solely those of the individual author(s) and contributor(s) and not of MDPI and/or the editor(s). MDPI and/or the editor(s) disclaim responsibility for any injury to people or property resulting from any ideas, methods, instructions or products referred to in the content.

