Article

Possibility of Energy Recovery from Airflow around an SUV-Class Car Based on Wind Tunnel Testing

1
Aerodynamics Department, Łukasiewicz Research Network—Institute of Aviation, Al. Krakowska 110/114, 02-256 Warszawa, Poland
2
Department of Production Management, Faculty of Engineering Management, Bialystok University of Technology, Wiejska Street 45A, 15-351 Bialystok, Poland
3
Department of Production Engineering, Institute of Mechanical Engineering, Warsaw University of Life Sciences, Nowoursynowska Street 164, 02-787 Warsaw, Poland
*
Authors to whom correspondence should be addressed.
Energies 2023, 16(19), 6965; https://doi.org/10.3390/en16196965
Submission received: 5 September 2023 / Revised: 20 September 2023 / Accepted: 4 October 2023 / Published: 6 October 2023
(This article belongs to the Special Issue Modeling Energy–Environment–Economy Interrelations II)

Abstract

:
For many years, technological progress has been observed in the field of minimizing energy consumption by devices and increasing the efficiency of energy generation from freely available sources. Energy harvesting (EH) is one of the ways to increase the energy available in vehicles. The manuscript presents the results of a series of laboratory tests carried out in a wind tunnel using a 1:10 scale model of an SUV. The aim of the tests was to measure the air velocity in the footsteps of the car. The speed field has been identified at more than 188,000 points in the space behind or next to the car, considering the symmetry of the vehicle. The total energy was aggregated for 2760 points in a vertical plane perpendicular to the plane of symmetry. From the tests carried out, it was found that the highest speed was achieved just behind the trunk of the car, at a distance of about 20% of the length of the car. Interestingly, the speed in this area was higher than the speed of the car.

1. Introduction

1.1. Energy Harvesting: Concept and Principles

A consumption of so-called primary energy sources have increased systematically for decades [1,2]. From the volumetric point of view, the world relies on the exploitation of motherlodes, e.g., the mineral oil, the carbon and the natural gas—despite a constant growth of nuclear energy, water energy and renewable energy [3,4,5]. The researchers focused on these aspects and aimed to develop modern and effective techniques of gathering, conversion and utilization of energy [6,7,8].
A competition, visible in every aspect of science and technology, is heading towards effective energy management that includes smart materials (SM)—the materials that can be modified via external interaction [9,10]. In other words, a feature of such materials is that one physical field, which depicts the attributes of the material, is dependent on another field. Eventually, smart materials enable a utilization of cross-effects, including magnetomechanical, electromechanical or magnetothermal phenomena. The level of the widespread utilization of SM may be treated as one of the metrics of technological innovation [11,12].
A significant amount of smart materials are materials which attributes may be controlled using a magnetic field, including SMM (smart magnetic materials) or GMM (giant magnetostrictive materials) [13,14]. Such materials are characterized by a possibility of converting magnetic energy into mechanical energy (and vice versa) with high efficiency [15,16]. Increasing efficiency of energy conversion is a far-reaching goal of intense scientific research in the field of smart materials, which is focused mostly on ferrofluids, magnetorheological fluids, GMMs, magnetocaloric materials and composites created using these materials. The efficiency gain should ultimately lead to the creation of smaller and more cost-affordable SM-based devices.
In relation to smart materials, one of key examples are magnetovision measurements, which are non-intrusive experiment techniques of measurement and visualization of the magnetic field around the investigated object [17,18]. This technique is based on magnetomechanical effects that appear in smart magnetic materials. However, a field of practical application of SM, which is gaining popularity, is energy harvesting (EH). The scientific literature also depicts synonyms of this term such as power harvesting and energy scavenging. Regardless of the name, EH is an exploitation of electric energy from commonly distributed, adverse sources (the background), e.g., noise, vibration, energy losses due to friction or combustion, etc. Other sources of energy, such as the heat of the human body or the kinetic energy of moving masses (air, water, etc.) are also considered [19,20].

1.2. Energy Harvesting in Road Transport

Energy harvesting gives a possibility of energy acquirement in road and rail transport using kinetic energy, heat, light, electromagnetic field and other sources [21,22]. Such an approach is very promising as it can supply zero-cost energy (the only cost is related to purchase and installation of energy harvesters). Currently, it seems to be possible to use EH for low-power devices (electronic devices, systems of sensors, etc.). However, in the future, some complex systems of energy harvesters can be exploited as a power supply for higher power devices, such as wireless sensors and actuators, air conditioners, charging batteries or supercapacitors. The EH application, known for decades, is the use of solar panels mounted on a roof of a car. In this case, harvesting the solar energy increases the range by roughly 6–8 percent; hence, the fuel consumption eventually decreases [23,24].
Another application of EH that gained popularity in recent years is the kinetic energy recovery system (KERS), which recovers the kinetic energy of a car during braking [25,26]. This system was applied for the first time in Formula 1 cars in 2009, but its concept resembles an energy management system in trams or electric locomotives where motors can be used as power generators quite easily. Shortly after, KERS was applied in concept cars and in commercially available vehicles (Volvo, Volkswagen and Audi, among others). For the cars used on public roads, the KERS system is mounted on the rear axis of the car. The heat generated by the brake discs is converted (using MGU-K, motor generator unit—kinetic) into kinetic energy of the flywheel, which rotates with the speed of up to 60,000 RPM. Alternatively, this energy can be utilized to charge a supercapacitor using MGU-E (motor generator unit—electric); this system is currently developed mainly in Formula 1 cars. Improvement of cars’ performance is very promising—the range may be increased up to 35%. Alternatively, the energy of the flywheel can be combined with the power of the engine to improve the acceleration or speed, e.g., an experimental Volvo S60 achieved a time of acceleration (from 0 to 100 km/h) of 5.5 s.
Along with the well-known solutions of EH, new ways are still discovered and developed. For example, intensive research is focused on thermoelectric generators (TEG), including dual-stage generators firstly applied by BMW, and then in cars manufactured by Ford and Volvo–Renault Trucks. In this case, a key object of interest is the amount of heat located in the exhaust fumes. Approximately two-thirds of the combustion energy in the internal combustion engine is lost as heat (in general), and 40% is lost as heat from exhaust gases. The use of TEG with an operating temperature of 400–800 °C can lead up to 5% of the energy being recovered as electric energy. In 2007, the TEG applied by BMW enabled a recycling of the power of 200 W; currently, this value has increased up to 600 W. It is worth mentioning that the system designed for the recycling of 1 MW is currently being developed [27,28].
Another approach that is currently being developed is the energy harvesting absorbed by shock absorbers due to vibrations on uneven surfaces. It is assessed that the power of hundreds of watts can be recycled in passenger cars and seven thousands of watts can be recycled in trucks.

1.3. Objectives

As it was briefly described, a majority of energy harvesters applied in cars are car-mounted devices. However, this energy can be utilized by the car itself. Meanwhile, it seems promising to use harvesters on roadsides to pass energy from cars to the stationary receivers. In such an approach, the energy could be utilized by any car without mounting any external devices on it. Thus, the efficiency of such harvesters should be dependent mostly on traffic intensity. Moreover, if a pattern of harvesters is applied, a highway can be treated as a linear source of energy, i.e., every mile of the road can generate some amount of electric energy.
The method of energy harvesting in this particular case arises from the main source of energy losses in cars, which—in case of high-speed driving—is the aerodynamic drag, which it is discussed further. The car partially passes its energy to the surrounding air, which causes an increment of its velocity and, eventually, its kinetic energy.
This work is dedicated towards studies on energy distribution in the air flow around a moving car. This research was performed in an aerodynamic tunnel in order to obtain a qualitative and quantitative distribution of air velocity and the associated distribution of energy flow. The further aim of this work is related to the possibility of at least a partial recovery of this energy in order to improve a car’s performance.
As the test object, an SUV-class car was chosen, which is a compromise between saloon cars and trucks. The former group seems to be more popular on the highways while the latter vehicles generate higher energy due to higher drag.

2. Materials and Methods

The aerodynamics of cars is a thoroughly investigated subject that covers a wide spread of topics. It is fully justified as aerodynamic drag becomes a major source of energy losses, especially in the case of high-speed driving. Thus, the designers constantly improve the shapes of cars to improve drag. Commonly, a quantitative metric of the shape quality, in terms of aerodynamic drag, is the drag coefficient defined as follows:
C D = D q · A = D ρ · V c a r 2 2 · A
where D —drag force; q —dynamic pressure of the flow; ρ —air density; V c a r —car speed; A —reference area (frontal area).
A tendency of minimization of the drag coefficient is clearly visible for decades in case of all cars—including SUV (sport utility vehicles) concerned in this paper (Figure 1). In this case, the issue of drag and energy losses is particularly important because a typical SUV has greater frontal area and drag coefficient than an exemplary saloon car. Eventually, the total resistance and aerodynamic drag of such a car (at the speed of 150 km/h), according to Table 1, is about twice as high as in the case of a saloon car. Moreover, the drag coefficient can be significantly increased by accessories, e.g., roof box, snorkel, mudflaps, additional lamps, etc., which are eagerly mounted on off-road cars. A drag penalty in this case may achieve a value of 50%, e.g., a total drag coefficient of 0.62 was obtained for the fully loaded Range Rover Discovery 3 during full-scale car wind tunnel testing [29].
Obviously, the drag minimization is not the only parameter of a car’s aerodynamics. This branch includes, among others, the topic of car stability in the presence of a sidewind, effectiveness of engine cooling, cabin aeroacoustics, etc. It should also be underlined that an impact of tiny details such as mirrors, roof box, etc. are considered within drag minimization [30], which makes the wind tunnel tests—especially covering full-scale objects instead of scaled ones—a basic investigatory tool. On the other hand, the overall picture of the airflow, velocity field and flow pattern, and the estimation of the aerodynamic loads may be achieved with the use of simpler tools, e.g., scaled wind tunnel models, CFD code, etc.
The general picture of the SUV’s airflow resembles an airflow around a blunt body (Figure 2).
Behind its rear wall one may observe a strong recirculation area, where the velocity magnitude is at its lowest. This is clearly the main source of aerodynamic drag. Secondly, the front part of the car deflects the flow upwards and sideways, which leads to the creation of the corner vortex that is smaller in the roof corners and stronger behind the wheels. Moreover, the velocity near the front window and front wall (near the engine cooler intake) reduces due to stagnation. Lastly, the lower velocity areas are observed in the wheel bays and behind the mirrors. The underbody of the car in Figure 2 is simplified as a flat plate; hence, the flow below the car is roughly undisturbed, despite the friction which occurs.
It is also worth mentioning that the Reynolds number has a minor impact on the SUV drag coefficient, as well as on the flow pattern (Figure 3). As it is presented in Figure 2, the flow separation appears due to presence of edges and a blunt rear part rather than due to the viscous boundary layer effects, which play a dominant role in the flow around a flat plate, a sphere or an airfoil.

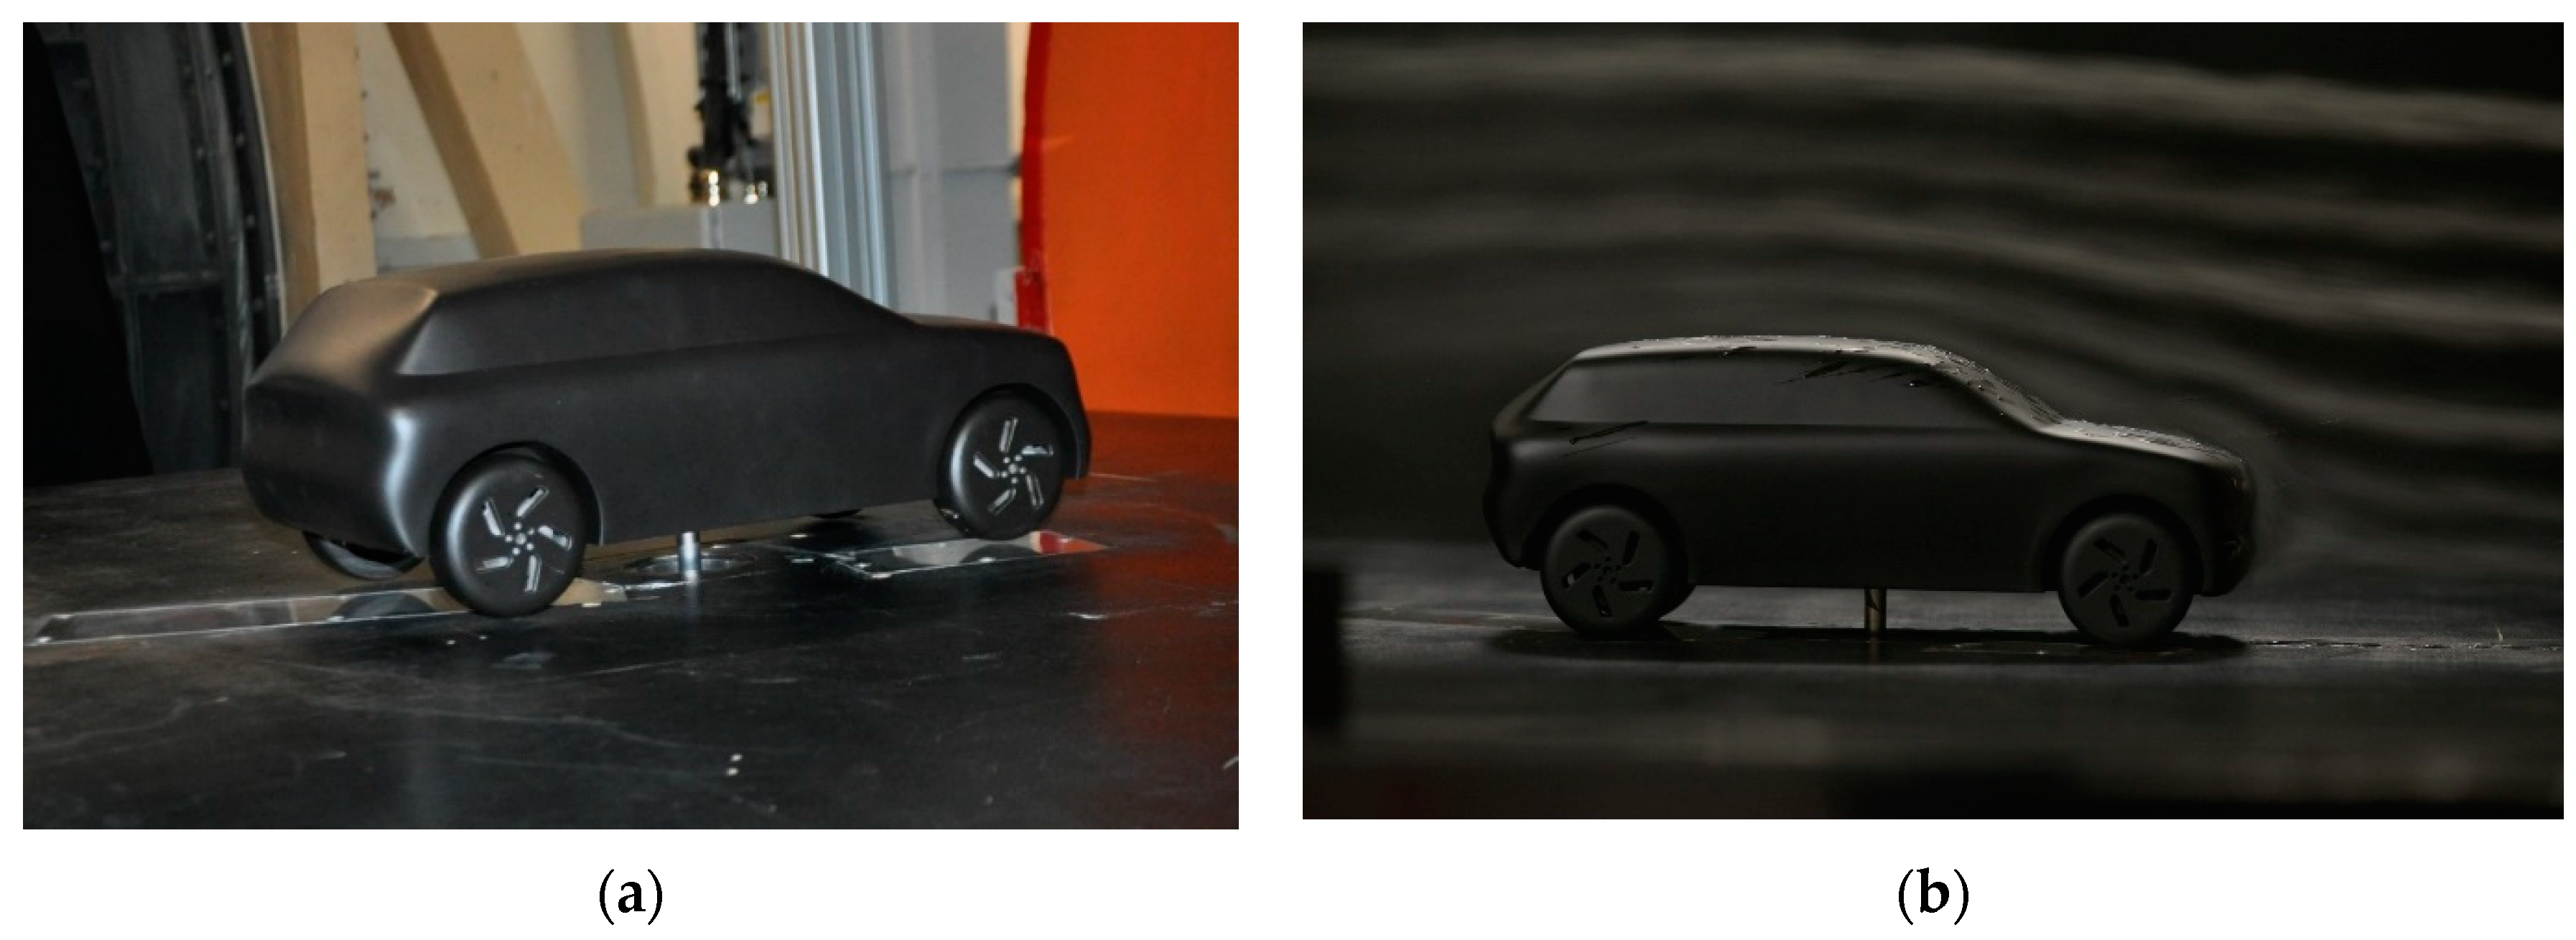
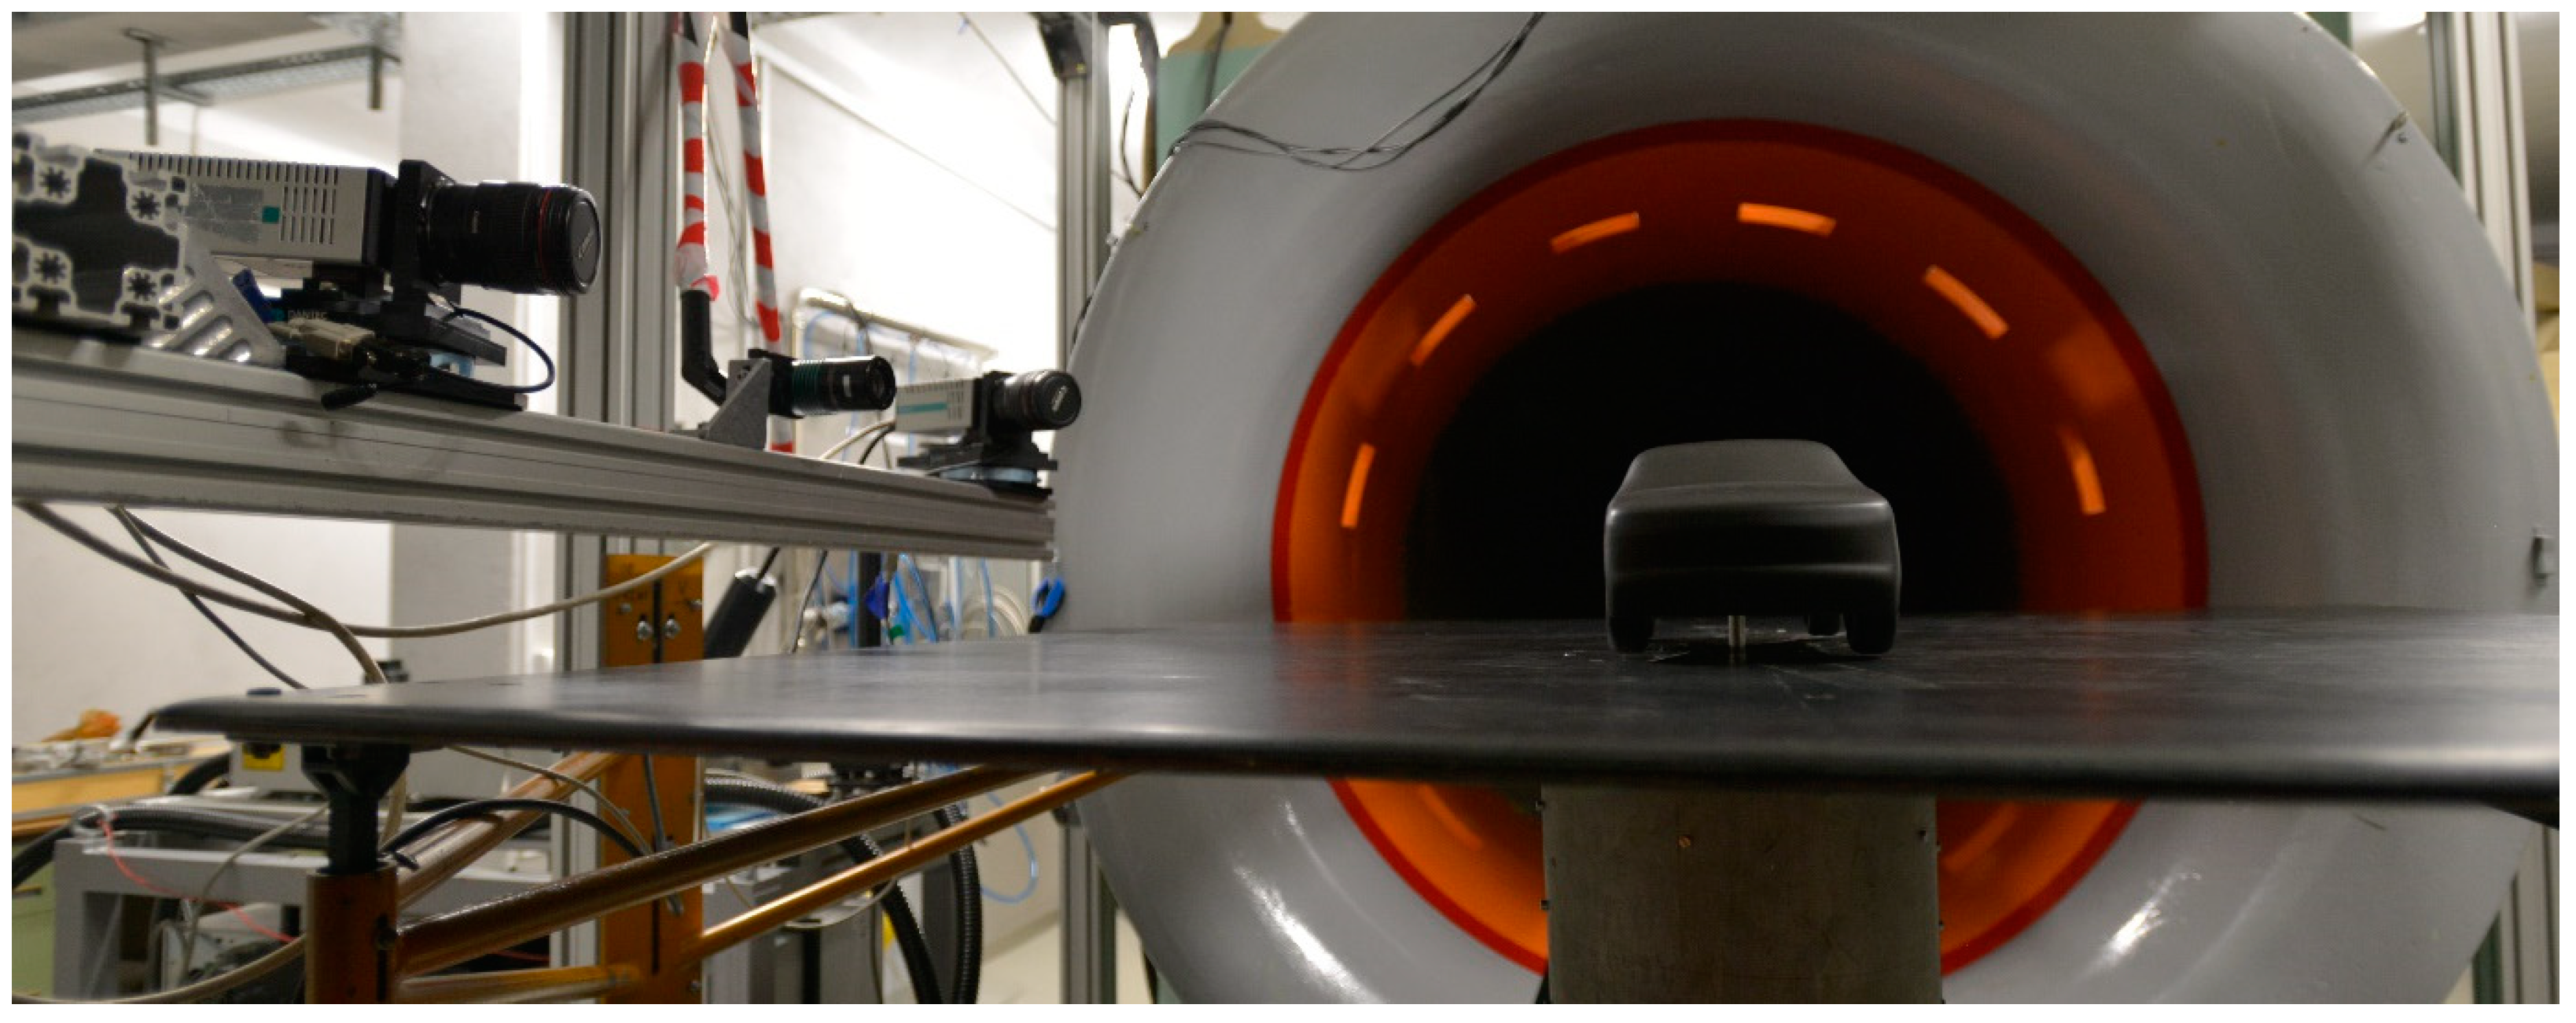
2.1. Experimental Setup

To capture the velocity field around the car, we performed a series of wind tunnel tests on a 1:10 scale model of a generic SUV-class vehicle (Figure 4).
The test object was designed solely for the wind tunnel testing campaign presented in this paper, including the equipment and technical requirements of the wind tunnel. The main dimensions of the object were as follows:
  • Length (L) = 422 mm.
  • Width (W) = 186 mm.
  • Height (H) = 161 mm.
  • Wheelbase (WB) = 277 mm.
The car was manufactured from a polymer using an additive manufacturing technique, and had a two-part hollowed body and interchangeable wheels. The design of the car body included the use of an internal force/torque sensor SCHUNK (ATI) FTD-Delta, which measured the aerodynamic loads acting on the car—including the drag force. The drag coefficient of the car was about 0.44 for the Reynolds number of 0.72 × 10⁶ (referred to as the wheelbase). The detailed drag measurement and optimization was performed in the range of airspeed values from 10 m/s to 40 m/s to include the impact of the Reynolds number.
The investigated car object was fixed in the wind tunnel with the underbody strut passing through the plate. This type of support system is common, particularly in commercial vehicle testing [33,34,35]. The underbody strut method tends to minimize the impact on the surrounding flow field, with an additional advantage of limiting any adverse impact when testing at yaw. However, the major drawback of this method is that the movable ground plate is nearly impossible to apply, except for some complex multi-belt configurations. Thus, in this paper, a fixed ground plane method was applied where the car model was mounted in the wind tunnel above a fixed plate, which simulated the presence of ground surface. The impact of the boundary layer of the plate, which appeared in the wind tunnel (and not in the real scenario) was compensated by the offset of the car wheels’ 1δ from the plate—where δ denotes the boundary layer thickness. The wheels of the car remained steady.
The car described above was an object of the wind tunnel test campaign, aimed at measuring the speed of the air in the wake behind the car. To achieve this goal, we applied particle image velocimetry (PIV), which is a modern technique of measurement and visualization of the flow velocity field [36,37,38].

2.2. Methods Applied in the Experiment

The particle image velocimetry (PIV) is a non-intrusive, optical technique. To perform the measurement, particles of the seeding (the DEHS oil) must be atomized in the flow. Droplets of the seeding were illuminated with a lightsheet (i.e., a laser light, formed in a thin sheet using the lenses) and photographed with a camera. The diameter of the seeding droplet was a few microns.
The diameter of seeding droplets play an important role in the PIV method, as it determines how accurately the movement of particles replicate the movement of the airflow. The reason is that the diameter of the particles is a metric of their inertia, which causes a difference in the trajectory between the flow and the particle. It is schematically explained in Figure 5 that the red lines denote a flow path line and the displacement of a fluid element between timestamps t and t + t . Similarly, black lines denote the displacement of the particle during the same time range. It may be described quantitatively with the Basset–Boussinesq–Oseen equation [39] as follows:
π 6 ρ p a r t · d p a r t 3 d u p a r t d t = 3 π μ d p a r t u p a r t u f l u i d + π 6 ρ f l u i d · d p a r t 3 d u p a r t d t + 1 2 π 6 ρ f l u i d · d p a r t 3 d u p a r t u f l u i d d t + 3 2 · d p a r t 3 π μ d p a r t t 0 t d u p a r t u f l u i d d t 1 1 τ d τ + F e x t
where ρ —density; d —diameter; u velocity; μ —fluid viscosity; F e x t —external force. Clearly, parameters of the particle were noted with the p a r t index and parameters of the fluid with the f l u i d index.
The formula above was derived from the second Newton’s law for the particle moving in a fluid. The left-hand side of the equation denotes the change of the particle’s momentum, and the right-hand terms describe the following:
  • Stokes force—a viscous drift force, acting on the particle’s boundary with the fluid.
  • Force caused by the pressure gradient.
  • Resistance of adjoint mass.
  • Basset force—the force related with the unsteady movement of a spherical particle.
  • Other external forces (magnetic, thermal, etc.).
The Basset–Boussinesq–Oseen equation shows that the ratio between the fluid density and particle density has a major impact on the particle’s movement. In the case where both values are approximately equal, inertia forces and the sedimentation do not interfere with the particle’s movement. As a result, the particle moves along the fluid, which is clearly desirable. To achieve that, one should apply the seeding with a similar density as the fluid. It is easy to do so in case of liquid flow investigation due to high liquid density. On the other hand, an application of soap bubbles filled with helium (HFSB) has recently been proposed and developed.
In the case when the particle density is significantly greater than the fluid density, the inertia forces cause a disturbance of the particle’s displacement. The Basset–Boussinesq–Oseen equation can be, in this case, estimated with the following formula [40]:
d u p a r t d t 18 μ ρ p a r t d p a r t 2 u p a r t u f l u i d = 1 τ p a r t u p a r t u f l u i d
where τ p a r t = ρ p a r t d p a r t 2 18 μ is the characteristic time of the particle’s response on the flow change. Clearly, this parameter should be minimized, which is achievable in practical applications by using particles with a diameter of a few micrometers—see Table 2. However, the selection of the particles depends also on the flow density, characteristic dimensions and velocity. The commonly applied metric of the accuracy of the flow replicate with a particle is the Stokes number, defined as
S t k = τ p a r t τ f l u i d
where τ f l u i d is a characteristic time of the fluid, determined by characteristic dimensions of the fluid and its velocity magnitude. It is assumed that the particles replicate the flow path line with reasonable accuracy if S t k < 10 1 [37].
The camera records two frames per measurement (Δt = 80 μs - time interval between frames). The velocity field measured in the final processing phase was obtained from particle displacement analysis. An adaptive correlation scheme was used (with an integration window size of 64 × 64 pixels with 50% window coverage). To calculate the velocity fields of displacement were divided by the time interval Δt. In the postprocessing stage, outgoing vectors, as well as places with missing data, were removed using the mean and median filtering function.
The general principle of the system, described above, provides only two components of velocity in the two-dimensional area (2D2C case—2 dimensions, 2 components). However, in presented tests, the 2D3C method—known also as stereo-PIV—was also applied. In this case, the region of interest was observed by two cameras with skewed optical axes, as presented in Figure 6 and Figure 7. As a result, the third component of the velocity (perpendicular to the lightsheet plane) was obtained as well. However, the area of observation remains two-dimensional, and the spatial distribution of the flow was obtained by traversing the lightsheet, placed vertically, along the transversal direction of the car. It must be underlined that this simplification only enforces the analysis of time-averaged results.
The observation area included the following:
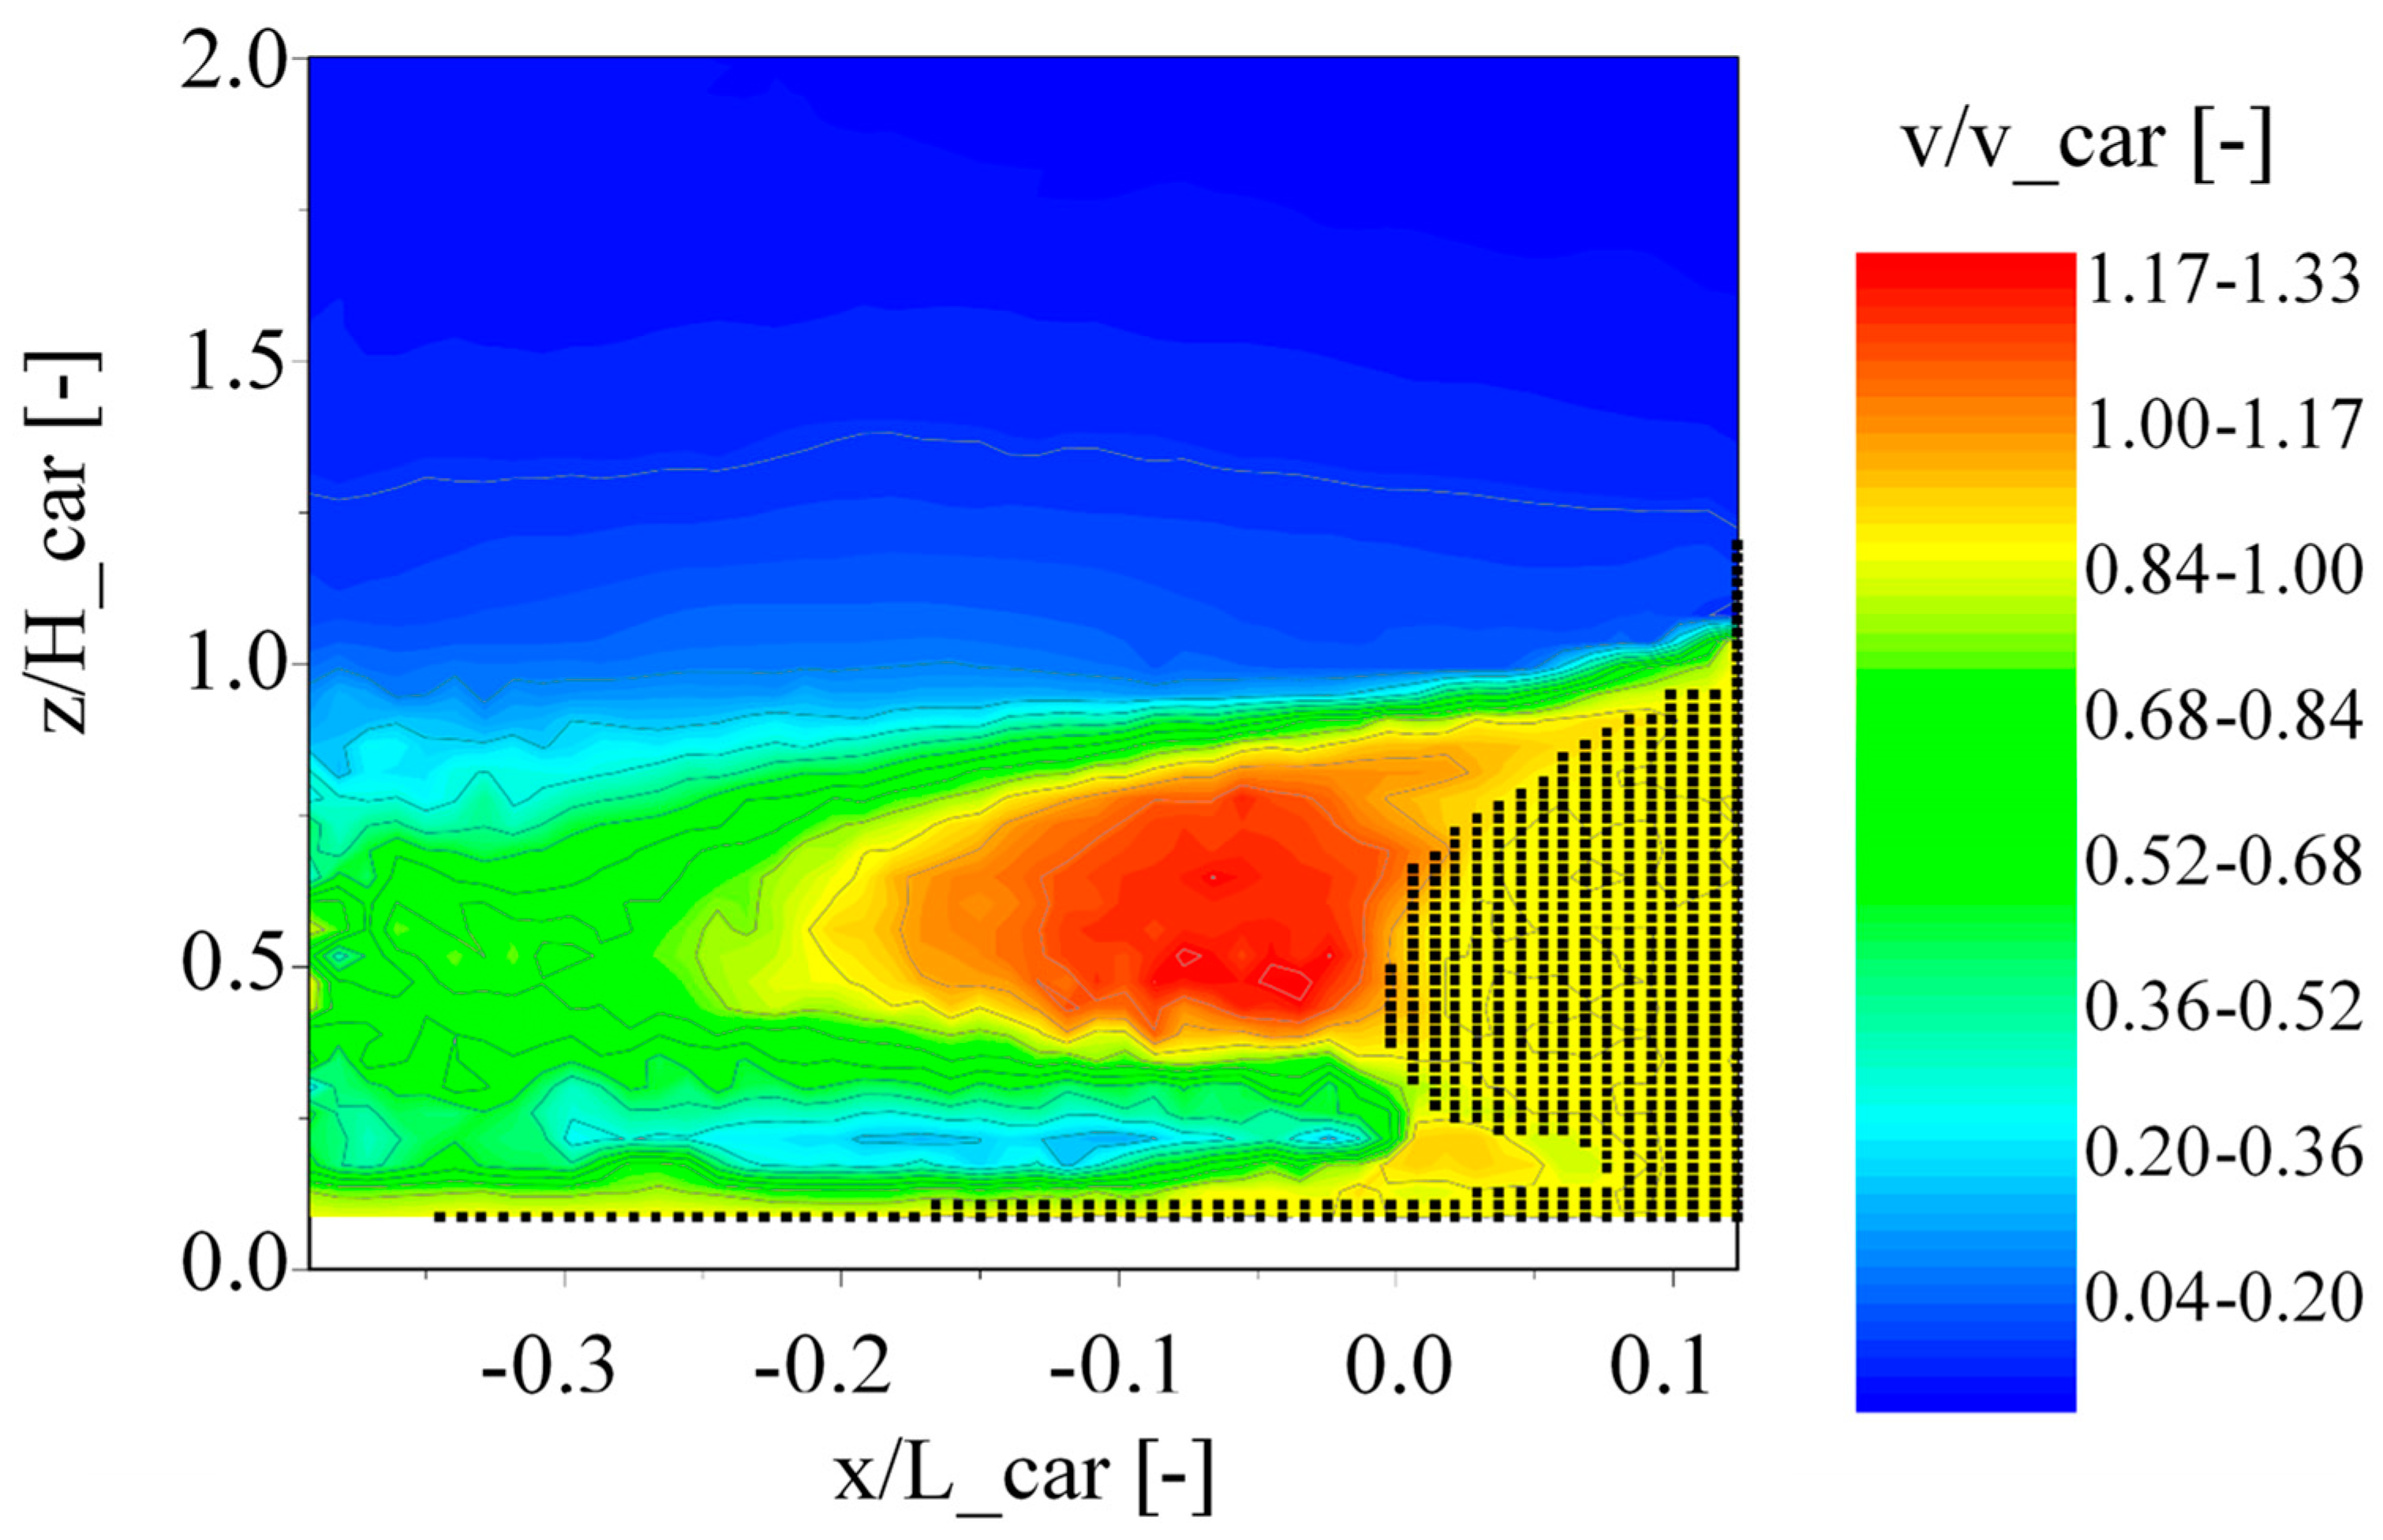
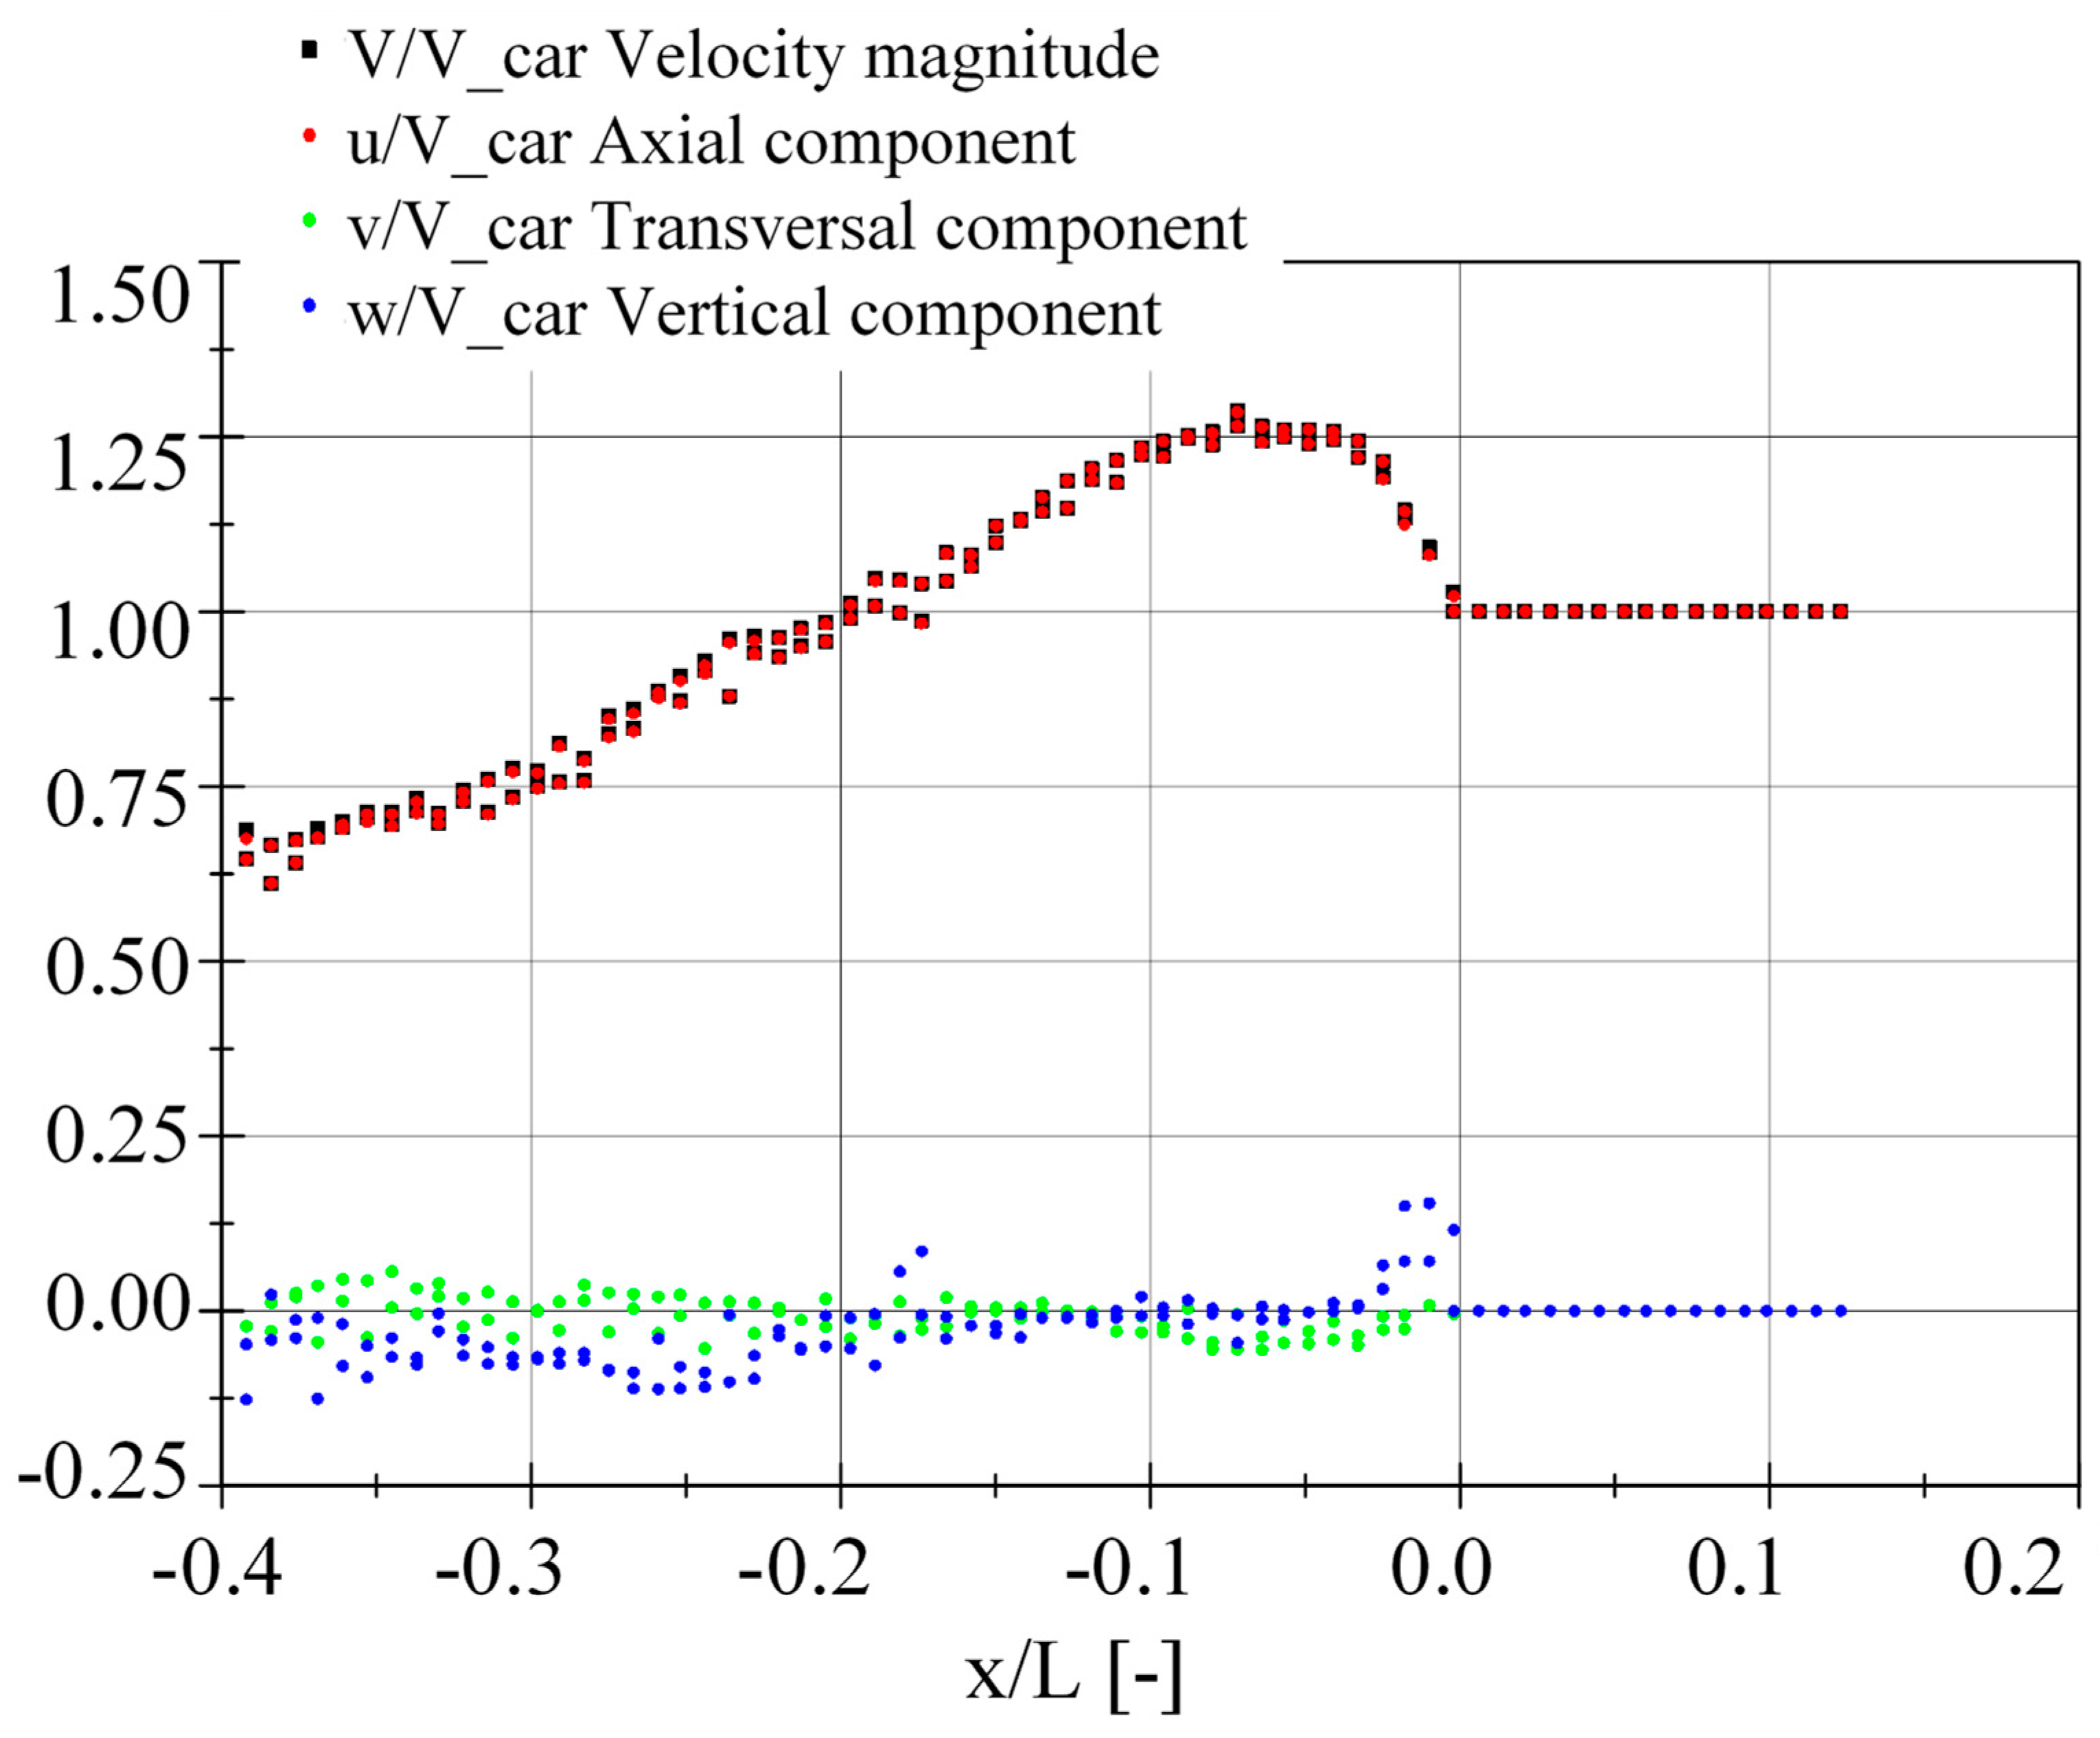
  • Longitudinal position from x = −0.4 L to x = 0.1 L (point of x = 0 lies on the aft point of the car, i.e., rear bumper).
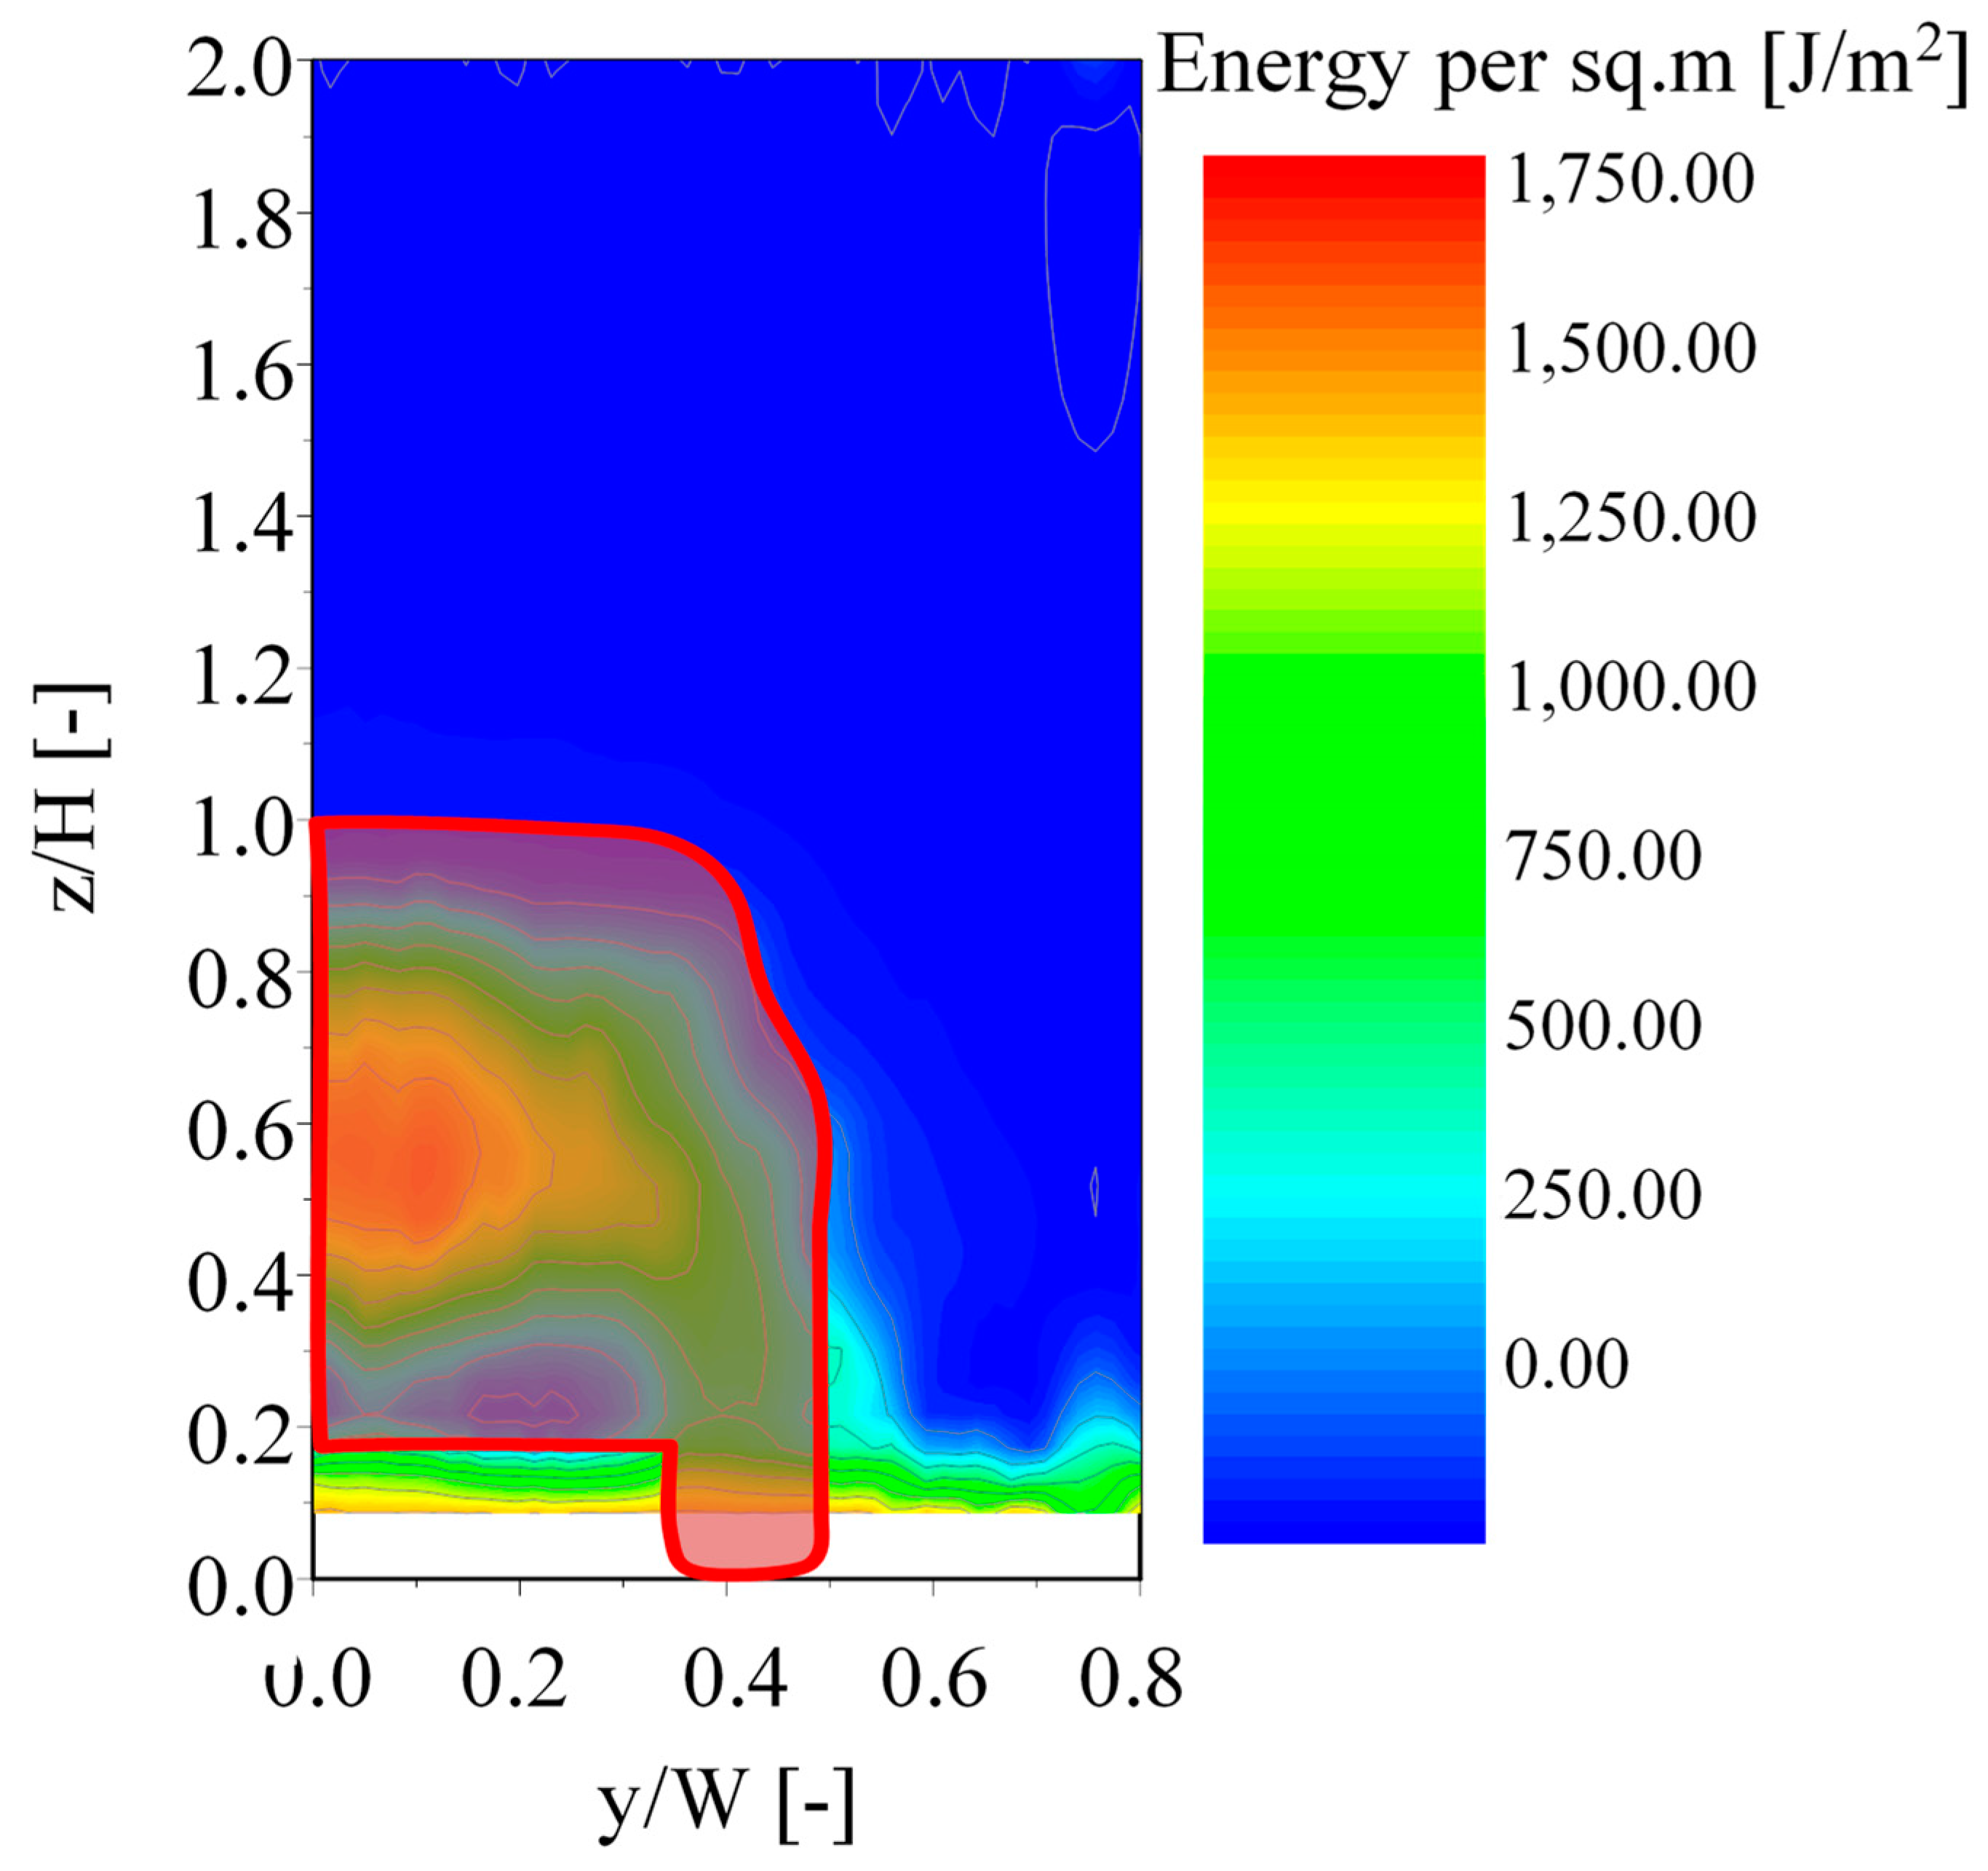
  • Transversal position from y = 0 to y = 0.8 W (point of y = 0 lies in the plane of symmetry of the car; due to expected symmetry of the flow, only a half of the object was observed).
  • Vertical position from z = 0 to z = 2 H (point of z = 0 lies on the ground).
The use of the PIV method in the wind tunnel testing allowed us to obtain a velocity field in the wake behind the car. However, the velocity vectors were obviously defined in the coordinate system connected to the car. Meanwhile, to calculate the kinetic energy of the flow, it was crucial to express the velocity in the inertial coordinate system that was connected to the ground. That was achieved by adding the car velocity versus ground to the flow velocity vectors. In this particular case, the car velocity components were u_car = −40 m/s, v_car = 0, w_car = 0.
To ease the transfer of results to the real-scale case, we non-dimensionalized all the velocities by equaling them to the car speed.
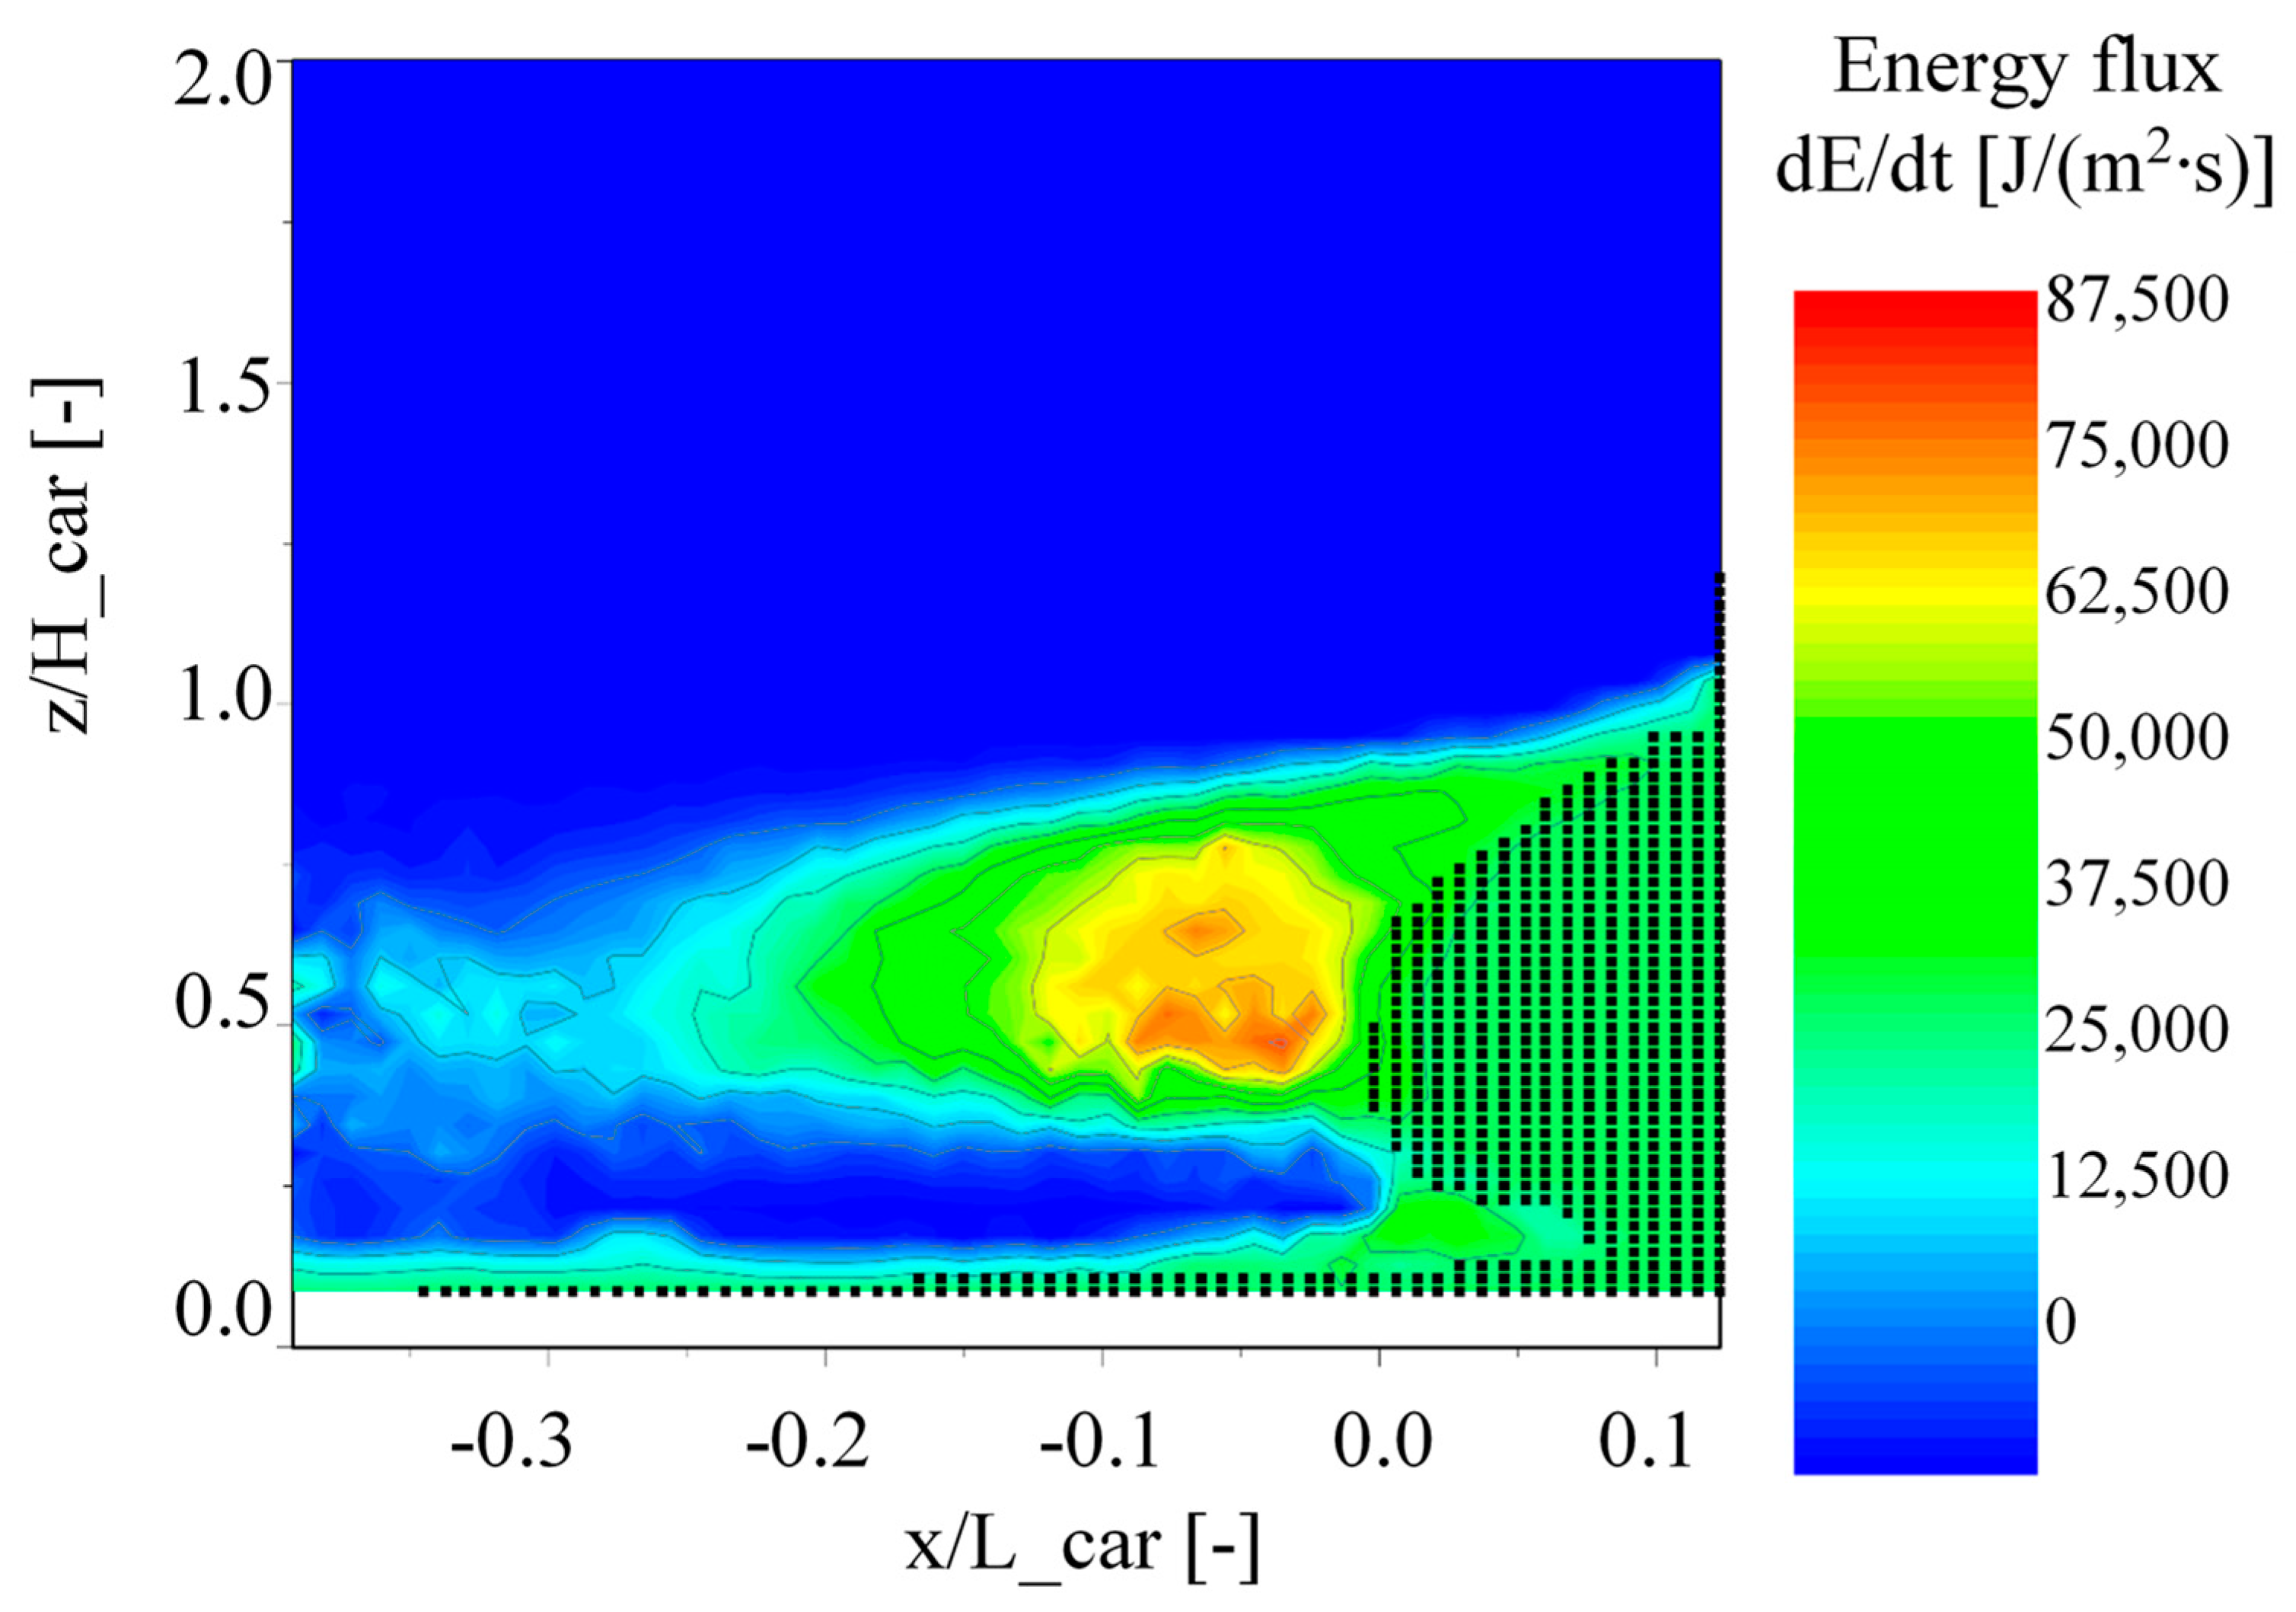
  • As we obtained the spatial distribution of the velocity in the inertial coordinate system, it was possible to calculate the kinetic energy of the flow that passed through a selected control section with an elementary area d A during a unitary time—which means an energy flux, d E d t . According to [21], this parameter may be then calculated using the basic equation as follows:
d E d t = 1 2 ( ρ · V · d A ) · V 2 = 1 2 ρ · V 3 · d A
While the flow velocity magnitude varies depending on the distance from the car, the energy flux is also a function of the distance and, consequently, of time. If we have the values of energy flux in two adjacent points, in the distance of dx, we can express the time between these two measurements (in the inertial coordinate system) using the following simple formula:
d t = 1 V d x
Eventually, the total energy per elementary area dA may be calculated by integrating the energy flux over time as follows:
E = 1 2 ρ · V 3 · d A   d t
As we have discrete values, we can replace the integral with summation.
E = 1 2 ρ · V 2 · d A · d x
The velocity field was identified in over 188,000 points in the space behind the car or next to it—only on one side of the car, due to its symmetry. The total energy was integrated for 2760 points in the vertical plane, perpendicular to the plane of symmetry, i.e., the region of interest (ROI).

3. Results

In Figure 8, we presented the distribution of velocity magnitude of the flow (related to the car speed) in its plane of symmetry. Black dots mark points where the measurement was incorrect—mainly in the area of the car trunk. As one could expect, the greatest speed was captured closely behind the car’s trunk, at a distance of about 20% of the car’s length. In this area, the speed was greater than the car’s speed. Behind this area, this speed decayed steeply due to dissipation. It should be underlined that one may observe an area of reduced speed below this area due to the flow below the car’s floor. Further downwards, the speed starts to grow again—which is an adverse effect of the boundary layer of the fixed ground plate. If the ground was modelled with a belt, this effect would be mitigated. In the proximity of the ground, a layer of erroneous points is clearly visible—which is the result of light reflection from the ground plate, which eventually affects the visibility of the particles.
The major share in the velocity magnitude was attributed to the axial velocity u, as can be seen in Figure 9, where the distribution of all velocity components (and the velocity magnitude) is presented along the longitudinal axis of the car. The side position was set to y = 0 and the vertical position was z = 0.5 H.
The distribution of the energy flux in the plane of symmetry of the car is presented in Figure 10. Clearly, the greatest energy was captured in the area of the greatest speed and the value of d E d t = 80,000 J m 2 s was exceeded. It is also worth noting that the area of observation seems to be large enough to capture the total (aggregated) energy.
Having the energy flux spatial distribution, we could find the total energy per elementary area dA by integrating the energy flux over time. This energy was distributed in a vertical plane, as it is presented in Figure 11.
Exemplary results are presented in Table 3.
The results presented above are promising on the one hand. However, on the other hand, the area of the highest energy flux is narrow and located behind the moving car; hence, this energy would be difficult (or even impossible) to harvest.

4. Discussion

At first glance, the results presented above are promising. The energy (per unitary area) located in the airflow behind the moving SUV car exceeds the value of 1600 J/m2. This amount of energy is passed to the air by a single car—in this case, the time of such an impulse of energy is about 0.03 s (the time a car takes to travel through the analyzed distance). Thus, the power can be estimated based on the intensity of traffic. For example, the average daily traffic intensity in Poland, including highways only, was 33,749 cars per day in 2020/21. It gives the value of 0.4 cars per second. Eventually the power dissipated in the air, in a single cross-section of the road, can be assessed as 640 W/m2. It must be noted that the maximum speed on the highway in Poland is 140 km/h ≈ 40 m/s, and this was selected in this paper. Obviously, it is an optimistic assumption that all cars travel at this speed—as there would be no traffic jams nor overspeeding.
The power of 640 W/m2 seems optimistic when we compare it with the power of energy harvesters already implemented in car transport. As we mentioned above, in 2007, the TEG applied by BMW enabled a recycling of the power of 200 W and this value has currently increased up to 600 W. However, such a simple comparison should not be made, as we did not include the efficiency of the harvesters nor their precise dimensions. Moreover, this amount of energy is concentrated in a relatively narrow area just behind the car. Moreover, the energy of the wake next to the car or above it is minor. As a result, the utilization of the dissipated energy would require some redirecting of the wake sidewards, upwards or downwards.
It should be noted that this paper did not include a measurement of velocity below the car nor next to it due to technical limitations. Such results could be useful, especially in estimating the kinetic energy of the airflow underneath the car body.
Developers of modern hybrid and electric drives strive to maximize the use of available energy while minimizing losses. Intelligent technologies and advanced solutions that enable modern vehicles to go further, wear down slower and generate savings for every mile are currently being studied by the leading research centers around the world. The result does not only equal the ability to travel extra distances, but also slows down component wear and decreases environmental pollution.
For many years, the use of artificial intelligence methods (in particular, neural networks and genetic algorithms) in the engineering design process have been observed. Over a dozen years ago, original concepts of genetic algorithms used in the process of optimizing the efficiency of energy devices were being developed [41,42]. With the development of technology and the increasingly easier access to open-source environments, the design philosophy and the use of artificial intelligence methods in the design process have changed. Nowadays, the capabilities of artificial intelligence are increasingly being used in the field of entire energy storage systems [43,44]. The development of multifunctional energy storage systems with high specific energy, high specific power and long life cycles is one of the most important fields of research in modern science [45].
Supercapacitors are used to store and release electrical charges. In contrast to conventional capacitors, they have a higher capacity and power density and charge faster than batteries. A distinction is made between hybrid supercapacitors, pseudo-capacitors and electrochemical double-layer capacitors. Artificial intelligence, particularly, machine language [46], is used to optimize and predict the performance of supercapacitors.
Artificial intelligence is used to predict the remaining lifetime of supercapacitors, which are widely used in power systems. In this case, a method based on the Harris Hawks optimization algorithm (HHO) and long-term short-term memory (LSTM) recursive neural networks (RNN) [47] is used. Neural networks are also used to evaluate the state of lithium-ion batteries based on electrochemical impedance spectroscopy [48].
Among energy storage devices, the rapid spread of carbon electrodes has been recorded in recent decades, and neural networks are increasingly being used to predict the capacity of porous electrodes of carbon-based supercapacitors [49].
Artificial intelligence methods also support the optimization of non-linear controllers for hybrid energy storage systems of hybrid electric vehicles based on fuel cells, batteries, supercapacitors and hybrid photoelectrochemical and photovoltaic cells [50]. Based on the research, the proposed optimized non-linear controller reduces errors and improves the performance of the dynamic system.
For vehicles with multiple energy storage, the effectiveness of an online predictive energy management strategy is largely dependent on the length and effective use of predictive information. In this context, the spatial and temporal prediction of the full driving cycle for optimal energy management in electric vehicles with batteries/supercapacitors is important for the development of knowledge [51]. In this case, long-term and short-term memory networks and long-term prediction generated with the spatiotemporal interpolation method were used.
Machine learning algorithms are used to find a correlation between selected properties (e.g., electrode materials, type of electrolytes) and the performance of the supercapacitor in terms of cyclic stability. New ways of finding new material combinations to achieve high cyclic stability are still being defined [52].
This literature review justifies the need for further research, particularly with the use of laboratory tests. This manuscript combines issues related to energy generation, wind tunnel tests and vehicles. This is an original approach to the studied research topic, and the application of published research results on energy storage systems offers opportunities for further progress in this field of science.
In this manuscript, the authors focused on the source of energy, which could be harvested much more than the energy receivers, which could also be utilized to harvest energy. We decided to use wind tunnel testing and capture the velocity field using particle image velocimetry (PIV), which is a well-established method applied numerous times in the scientific community for at least 20 years. As experimental researchers, we acknowledge the reliability and predictability of the system despite its limitation—but the boundaries of the application of the method are well known and can be included in the planning of the experiment. Using brand new methods just for the novelty was inacceptable in terms of time, costs and reliability. Moreover, it was significantly beyond the scope of this particular study.

Author Contributions

Conceptualization, P.R., W.S., O.O. and K.T.; methodology, P.R., W.S., O.O. and K.T.; software, P.R., W.S. and O.O.; validation, P.R. and W.S.; formal analysis, P.R., W.S., O.O. and K.T.; investigation, P.R., W.S. and O.O.; data curation, P.R., W.S., O.O. and K.T.; writing—original draft preparation, P.R., W.S., O.O. and K.T.; writing—review and editing, P.R., W.S., O.O. and K.T.; visualization, P.R., W.S., O.O. and K.T.; supervision, P.R., W.S., O.O. and K.T. All authors have read and agreed to the published version of the manuscript.

Funding

Financing by Bialystok University of Technology under the project WZ/WIZ-INZ/4/2022 (Olga Orynycz) research conducted in part during cooperation stays in Łukasiewicz Institute of Aviation, 2/Ł-ILOT/CŁ/2021, akronim PROPEL, Warsaw 2023 r.

Data Availability Statement

This study did not report any data.

Conflicts of Interest

The authors declare no conflict of interest.

References

  1. Tutak, M.; Brodny, J. Renewable energy consumption in economic sectors in the EU-27. The impact on economics, environment and conventional energy sources. A 20-year perspective. J. Clean. Prod. 2022, 345, 131076. [Google Scholar] [CrossRef]
  2. Shirazi, M.; Fuinhas, J.A. Portfolio decisions of primary energy sources and economic complexity: The world’s large energy user evidence. Renew. Energy 2023, 202, 347–361. [Google Scholar] [CrossRef]
  3. Boldyryev, S.; Kuznetsov, M.; Ryabova, I.; Krajačić, G.; Kaldybaeva, B. Assessment of renewable energy use in natural gas liquid processing by improved process integration with heat pumps. e-Prime—Adv. Electr. Eng. Electron. Energy 2023, 5, 100246. [Google Scholar] [CrossRef]
  4. Usman, M.; Radulescu, M. Examining the role of nuclear and renewable energy in reducing carbon footprint: Does the role of technological innovation really create some difference? Sci. Total Environ. 2022, 841, 156662. [Google Scholar] [CrossRef] [PubMed]
  5. Jiang, L.; Jiang, H. Analysis of predictions considering mineral prices, residential energy, and environmental risk: Evidence from the USA in COP 26 perspective. Resour. Policy 2023, 82, 103431. [Google Scholar] [CrossRef]
  6. Krzywonos, M.; Skudlarski, J.; Kupczyk, A.; Wojdalski, J.; Tucki, K. Forecast for transport biofuels in Poland in 2020–2030. Przem. Chem. 2015, 94, 2218–2222. [Google Scholar] [CrossRef]
  7. Vujanović, M.; Besagni, G.; Duić, N.; Markides, C.N. Innovation and advancement of thermal processes for the production, storage, utilization and conservation of energy in sustainable engineering applications. Appl. Therm. Eng. 2023, 221, 119814. [Google Scholar] [CrossRef]
  8. Sharmin, T.; Khan, N.R.; Akram, M.S.; Ehsan, M.M. A State-of-the-Art Review on Geothermal Energy Extraction, Utilization, and Improvement Strategies: Conventional, Hybridized, and Enhanced Geothermal Systems. Int. J. Thermofluids 2023, 18, 100323. [Google Scholar] [CrossRef]
  9. Sagdic, K.; Eş, I.; Sitti, M.; Inci, F. Smart materials: Rational design in biosystems via artificial intelligence. Trends Biotechnol. 2022, 40, 987–1003. [Google Scholar] [CrossRef]
  10. Mishra, A.; Gangele, A. Smart Materials For Clean And Sustainable Technology For Smart Cities. Mater. Today Proc. 2020, 29, 338–342. [Google Scholar] [CrossRef]
  11. Maurya, K.K.; Rawat, A.; Jha, G. Smart materials and electro-mechanical impedance technique: A review. Mater. Today Proc. 2020, 33, 4993–5000. [Google Scholar] [CrossRef]
  12. Sossou, G.; Demoly, F.; Belkebir, H.; Qi, H.J.; Gomes, S.; Montavon, G. Design for 4D printing: A voxel-based modeling and simulation of smart materials. Mater. Des. 2019, 175, 107798. [Google Scholar] [CrossRef]
  13. Jiao, P.; Chen, T.; Xie, Y. Self-adaptive mechanical metamaterials (SMM) using shape memory polymers for programmable postbuckling under thermal excitations. Compos. Struct. 2021, 256, 113053. [Google Scholar] [CrossRef]
  14. Wang, Y.; Qiu, Y.; Kong, F.; Zhang, H. Research on nonlinear correction of giant magnetostrictive material optical current transformer. Energy Rep. 2022, 8, 983–988. [Google Scholar] [CrossRef]
  15. Xu, H.; Pei, Y.; Fang, D.; Ai, S. An energy-based dynamic loss hysteresis model for giant magnetostrictive materials. Int. J. Solids Struct. 2013, 50, 672–679. [Google Scholar] [CrossRef]
  16. Singh, P.K.; Pareta, A.S.; Panda, S.K. Influence of the bi-nonlinearity on the characterization of mode I fracture parameter JIc for a cracked giant magnetostrictive material in the coupled magneto-elastic field: An experimental and numerical study. Eng. Fract. Mech. 2023, 279, 109046. [Google Scholar] [CrossRef]
  17. Kaleta, J.; Wiewiórski, P. Magnetovisual method for monitoring thermal demagnetization of permanent magnets used in magnetostrictive actuators. J. Rare Earths 2014, 32, 236–241. [Google Scholar] [CrossRef]
  18. Nandy, M.; Lahiri, B.B.; Philip, J. Visual detection of defects in carbon steel using magnetic nanoemulsions: Effect of stabilizing moieties on the defect detection sensitivity. Sens. Actuators A Phys. 2020, 314, 112220. [Google Scholar] [CrossRef]
  19. Boumaiz, M.; Ghazi, M.; Mazer, S.; Fattah, M.; Bouayad, A.; Bekkali, M.; Balboul, Y. Energy harvesting based WBANs: EH optimization methods. Procedia Comput. Sci. 2019, 151, 1040–1045. [Google Scholar] [CrossRef]
  20. Zhang, Z.; Zhang, X.; Rasim, Y.; Wang, C.; Du, B.; Yuan, Y. Design, modelling and practical tests on a high-voltage kinetic energy harvesting (EH) system for a renewable road tunnel based on linear alternators. Appl. Energy 2016, 164, 152–161. [Google Scholar] [CrossRef]
  21. Pan, H.; Qi, L.; Zhang, A.; Yan, J. Kinetic energy harvesting technologies for applications in land transportation: A comprehensive review. Appl. Energy 2021, 286, 116518. [Google Scholar] [CrossRef]
  22. Zuo, J.; Dong, L.; Yang, F.; Guo, Z.; Wang, T.; Zuo, L. Energy harvesting solutions for railway transportation: A comprehensive review. Renew. Energy 2023, 202, 56–87. [Google Scholar] [CrossRef]
  23. Bai, S.; Liu, C. Overview of energy harvesting and emission reduction technologies in hybrid electric vehicles. Renew. Sustain. Energy Rev. 2021, 147, 111188. [Google Scholar] [CrossRef]
  24. Vu, N.H.; Pham, T.T.; Shin, S. Flat concentrator photovoltaic system for automotive applications. Sol. Energy 2019, 190, 246–254. [Google Scholar] [CrossRef]
  25. Rakov, V. Determination of optimal characteristics of braking energy recovery system in vehicles operating in urban conditions. Transp. Res. Procedia 2020, 50, 566–573. [Google Scholar] [CrossRef]
  26. Buenaventura, A.B.; Azzopardi, B. Energy recovery systems for retrofitting in internal combustion engine vehicles: A review of techniques. Renew. Sustain. Energy Rev. 2015, 41, 955–964. [Google Scholar] [CrossRef]
  27. Shen, Z.G.; Tian, L.L.; Liu, X. Automotive exhaust thermoelectric generators: Current status, challenges and future prospects. Energy Convers. Manag. 2019, 195, 1138–1173. [Google Scholar] [CrossRef]
  28. Carvalho, R.; Martins, J.; Pacheco, N.; Puga, H.; Costa, J.; Vieira, R.; Goncalves, L.M.; Brito, F.P. Experimental validation and numerical assessment of a temperature-controlled thermoelectric generator concept aimed at maximizing performance under highly variable thermal load driving cycles. Energy 2023, 280, 127979. [Google Scholar] [CrossRef]
  29. Howell, J.; Gaylard, A. Improving SUV Aerodynamics. In Proceedings of the 6th MIRA International Vehicle Aerodynamics Conference, Gaydon, Warwickshire, UK, 25–26 October 2006; Volume 1, pp. 1–17. [Google Scholar]
  30. Chaligné, S.; Turner, R.; Gaylard, A. The Aerodynamics Development of the New Land Rover Discovery. Prog. Veh. Aerodyn. Therm. Manag. 2018, 1, 145–159. [Google Scholar] [CrossRef]
  31. Scurtu, I.L.; Balcau, M.; Jurco, A.; Craciun, I.; Kiraly, A.; Szabo, I. Evaluation and improving the aerodynamics of the commercial van. J. Ind. Des. Eng. Graph. 2023, 18, 17–22. [Google Scholar]
  32. Jazar, R.M. Vehicle Dynamics Theory and Applications, 1st ed.; Springer: New York, NY, USA, 2008; pp. 37–888. [Google Scholar] [CrossRef]
  33. Fago, B.; Lindner, H.; Mahrenholtz, O. The effect of ground simulation on the flow around vehicles in wind tunnel testing. J. Wind Eng. Ind. Aerodyn. 1991, 38, 47–57. [Google Scholar] [CrossRef]
  34. An Experimental Study of the Ground Transportation System(GTS) Model in the NASA Ames 7- by 10-Ft Wind Tunnel. Available online: https://ntrs.nasa.gov/citations/20010038028 (accessed on 4 September 2023).
  35. Rejniak, A.A.; Gatto, A. Upstream wind tunnel model mounting: The forgotten method for road vehicle aerodynamics. Proc. Inst. Mech. Eng. Part D J. Automob. Eng. 2021, 235, 1992–2012. [Google Scholar] [CrossRef]
  36. Stryczniewicz, W. Anemometria Obrazowa PIV w Praktyce Badań Aerodynamicznych, 1st ed.; Wydawnictwa Naukowe Sieć Badawcza Łukasiewicz—Instytutu Lotnictwa: Warsaw, Poland, 2020; pp. 1–105. [Google Scholar]
  37. Raffel, M.; Willert, C.E.; Wereley, S.T.; Kompenhans, J. Particle Image Velocimetry—A Practical Guide, 3rd ed.; Springer: Cham, Switzerland, 2007; pp. 33–641. Available online: https://link.springer.com/content/pdf/10.1007/978-3-319-68852-7.pdf (accessed on 4 September 2023).
  38. Adrian, R.J. Twenty Years Of Particle Image Velocimetry. Exp. Fluids 2005, 39, 159–169. [Google Scholar] [CrossRef]
  39. Corradini, M.L.; Zhu, C.; Fan, L.S.; Jean, R.H. Multiphase Flow. In Handbook of Fluid Dynamics, 2nd ed.; Johnson, R.W., Ed.; CRC Press: UK, London, 2016; pp. 20.1–20.104. ISBN 978-143984957-6/978-143984955-2. Available online: https://www.routledge.com/Handbook-of-Fluid-Dynamics-Second-Edition/Johnson/p/book/9781439849552 (accessed on 4 September 2023).
  40. Kompenhans, J.; Schröder, A.; Raffel, M.; Kähler, C.; Arnott, A.; Bao, F.; Sammler, B.; Schneider, G.; Stasicki, B.; Frahnert, H.; et al. Application of Particle Image Velocimetry, Theory and Practice. In Application of Particle Image Velocimetry, Theory and Practice, Ordner-. PIV-Course. Available online: https://elib.dlr.de/12616/ (accessed on 4 September 2023).
  41. Kosowski, K.; Tucki, K.; Kosowski, A. Application of Artificial Neural Networks in Investigations of Steam Turbine Cascades. J. Turbomach.-Trans. ASME 2010, 132, 014501–014505. [Google Scholar] [CrossRef]
  42. Kosowski, K.; Tucki, K.; Kosowski, A. Turbine stage design aided by artificial intelligence methods. Expert Syst. Appl. 2009, 36, 11536–11542. [Google Scholar] [CrossRef]
  43. Şahin, M.E.; Blaabjerg, F.; Sangwongwanich, A. A comprehensive review on supercapacitor applications and developments. Energies 2022, 15, 674. [Google Scholar] [CrossRef]
  44. Laadjal, K.; Cardoso, A.J.M. A review of supercapacitors modeling, SoH, and SoE estimation methods: Issues and challenges. Int. J. Energy Res. 2021, 45, 18424–18440. [Google Scholar] [CrossRef]
  45. Gao, D.; Luo, Z.; Liu, C.; Fan, S. A survey of hybrid energy devices based on supercapacitors. Green Energy Environ. 2023, 8, 972–988. [Google Scholar] [CrossRef]
  46. Adekoya, G.J.; Adekoya, O.C.; Ugo, U.K.; Sadiku, E.R.; Hamam, Y.; Ray, S.S. A mini-review of artificial intelligence techniques for predicting the performance of supercapacitors. Mater. Today Proc. 2022, 62, S184–S188. [Google Scholar] [CrossRef]
  47. Ma, N.; Yin, H.; Wang, K. Prediction of the Remaining Useful Life of Supercapacitors at Different Temperatures Based on Improved Long Short-Term Memory. Energies 2023, 16, 5240. [Google Scholar] [CrossRef]
  48. Sun, X.; Zhang, Y.; Zhang, Y.; Wang, L.; Wang, K. Summary of Health-State Estimation of Lithium-Ion Batteries Based on Electrochemical Impedance Spectroscopy. Energies 2023, 16, 5682. [Google Scholar] [CrossRef]
  49. Tawfik, W.Z.; Mohammad, S.N.; Rahouma, K.H.; Tammam, E.; Salama, M.G. An artificial neural network model for capacitance prediction of porous carbon-based supercapacitor electrodes. J. Energy Storage 2023, 73, 108830. [Google Scholar] [CrossRef]
  50. Mian, S.H.; Nazir, M.S.; Ahmad, I.; Khan, S.A. Optimized nonlinear controller for fuel cell, supercapacitor, battery, hybrid photoelectrochemical and photovoltaic cells based hybrid electric vehicles. Energy 2023, 283, 129121. [Google Scholar] [CrossRef]
  51. Wu, Y.; Huang, Z.; Zheng, Y.; Liu, Y.; Li, H.; Che, Y.; Peng, J.; Teodorescu, R. Spatial–temporal data-driven full driving cycle prediction for optimal energy management of battery/supercapacitor electric vehicles. Energy Convers. Manag. 2023, 277, 116619. [Google Scholar] [CrossRef]
  52. Nanda, S.; Ghosh, S.; Thomas, T. Machine learning aided cyclic stability prediction for supercapacitors. J. Power Sources 2022, 546, 231975. [Google Scholar] [CrossRef]
Figure 1. Drag coefficient change in time for SUV cars based on MIRA wind tunnel tests. Open symbols represent highly utilitarian vehicles similar to the Land Rover Defender and are not included in the trend line [29].
Energies 16 06965 g001
Figure 2. Velocity magnitude and the path lines around the Dacia Dokker car [31].
Energies 16 06965 g002
Figure 3. The impact of the Reynolds number on the drag coefficient [32].
Energies 16 06965 g003
Figure 4. Test object: (a) generic SUV-class car, approximately 1:10 scale; (b) its exemplary flow visualization.
Energies 16 06965 g004
Figure 5. A difference between displacement of particle (black lines) and fluid (red lines) [36].
Energies 16 06965 g005
Figure 6. Test stand scheme.
Energies 16 06965 g006
Figure 7. Test setup—the car on the ground plate and PIV cameras on the left.
Energies 16 06965 g007
Figure 8. Velocity magnitude (related to the car speed) of the wake in the car’s plane of symmetry.
Energies 16 06965 g008
Figure 9. Velocity magnitude of the air in the wake of the car (black points) and the cartesian component, as a function of longitudinal position x.
Energies 16 06965 g009
Figure 10. Energy flux of the wake in the car’s plane of symmetry.
Energies 16 06965 g010
Figure 11. Total energy per elementary area behind the car.
Energies 16 06965 g011
Table 1. Comparison of an exemplary SUV and a saloon car [29].
ParameterSUVSaloon Car
Drag coefficient0.40.3
Frontal area3.0 m22.0 m2
Weight2500 kg1700 kg
Total resistance at 150 km/h1720 N943 N
Rolling resistance at 150 km/h423 N300 N
Aerodynamic drag force at 150 km/h1276 N646 N
Table 2. Seeding materials commonly applied in the PIV technique [36].
MaterialState of Matter d p a r t [ μ m ] τ p a r t [ μ s ]
Di-ethil-hexil-sebacate (DEHS) oilLiquid12
Olive oilLiquid25
Titanium dioxide TiO2Solid0.50.5
Helium filled soap bubbles (HFSB)Liquid30025
Table 3. Total energy per elementary area captured in various spatial positions.
YZyz y/Wz/HEnergy Per sq.m
60−243.999000.20948238.044
150−214.233000.3943631191.37
250−181.159000.5997881665.08
350−148.086000.8052141019.41
440−118.32000.99009652.8572
540−85.2459001.1955225.1932
68−243.999400.2150540.20948186.518
158−214.233400.2150540.394363881.242
258−181.159400.2150540.5997881384.61
358−148.086400.2150540.805214596.567
448−118.32400.2150540.99009652.3818
548−85.2459400.2150541.1955222.2057
615−243.999750.4032260.20948799.63
1515−214.233750.4032260.394363870.287
2515−181.159750.4032260.599788578.935
3515−148.086750.4032260.805214285.509
4415−118.32750.4032260.99009636.0309
5415−85.2459750.4032261.1955217.4157
Disclaimer/Publisher’s Note: The statements, opinions and data contained in all publications are solely those of the individual author(s) and contributor(s) and not of MDPI and/or the editor(s). MDPI and/or the editor(s) disclaim responsibility for any injury to people or property resulting from any ideas, methods, instructions or products referred to in the content.

