Abstract
As new algorithms incorporate occupancy count information into more sophisticated HVAC control, these technologies offer great potential for reductions in energy costs while enhancing flexibility. This study presents results from a two-year field evaluation of an occupancy-based HVAC control system installed in an office building. Two wings on each of the building’s 2–11 floors were equipped with occupancy counters to learn occupancy patterns. In combination with proprietary machine learning algorithms and thermal modeling, the occupancy data were leveraged to implement optimized start, early closure, and adjustments to fan operation at the air handling unit (AHU) level. This study conducted a holistic evaluation of technical performance, cost-effectiveness analysis, and user satisfaction. Results show the platform reduced weekday AHU run times by 2 h and 35 min per AHU per day during the pandemic time period. Simulation shows that 6.1% annual whole-building savings can be achieved when the building is fully occupied. The results are compared with prior studies, and potential drivers are discussed for future opportunities. The assessment results shed light on the expected in-the-field performance for researchers and industry stakeholders and enabled practical considerations as the technology strives to move beyond research-grade pilot trials into product-grade deployment.
1. Introduction
The United States government has imposed ambitious federal goals to slash carbon emissions and reach net-zero by 2050 [1]. The building sector is a major energy consumer globally. Specifically, buildings were responsible for 39% of the worldwide global energy-related carbon dioxide (CO2) emissions in 2017, corresponding to more than 11 gigatonnes of CO2 [2]. Therefore, in order to meet these decarbonization goals, a radical advancement in technologies that can lead to significant emissions reductions from existing buildings is required. New smart building analytics technologies, referred to as Energy Management and Information Systems (EMIS), present promising solutions for improving building operational efficiency [3] and meeting the federal decarbonization goal.
EMIS integrates data coming from multiple sources, such as building automation systems (BAS), interval smart meters, Internet of Things (IoT) devices, and occupancy counters, to monitor, analyze, and even control building system performance and energy use. EMIS offers one or a combination of three main functionalities [4]: (1) energy information system (EIS) that focuses on the analysis and visualization of interval meter data; (2) fault detection and diagnostics (FDD) that focuses on the detection of operational faults and suboptimal performance of building systems and helps to diagnose potential causes; and (3) automated system optimization (ASO) that focuses on the optimal control of heating, ventilation, and air conditioning (HVAC) systems. A two-way interface (read and write) with a BAS during the HVAC operation process distinguishes ASO solutions from EIS and FDD tools. ASO tools usually use a dynamic system model and disturbance forecast to predict system performance with a given control law, thereby allowing the control law to be optimized for a given objective and taking into consideration future events. They combine the model with the data from a BAS to determine the optimal schedule or control setpoints (e.g., static pressure setpoint, chilled water leaving temperature setpoint, and zone air temperature setpoint) and write analytically based optimal schedules or setpoints back to the BAS.
There has been significant growth in the adoption of EIS and FDD tools over the past decade among large commercial buildings. With data from over 15 million square meters of installed space (28 organizations and 1343 buildings), it was reported that FDD and EIS software enabled a median annual energy savings of 9% and 3%, respectively, by the second year of installation [5]. ASO (or optimal control) has gained attention among researchers in the past few years because of its potential for energy savings. There are a large number of research studies about optimal control summarized in the published review papers [6,7,8,9], as well as several pilot installations [10,11,12], but the transfer of this technology from research to the building market is still in its early stages [13,14]. As the most emergent technology type in the EMIS family, ASO solutions have a limited number of commercial product offerings and building users [15].
Occupancy-based automated system optimization integrates occupancy data into control decisions. At present, a lot of the HVAC systems in commercial buildings are designed to provide space conditioning for maximum occupancy levels [16], often operating on a predefined or fixed schedule that does not account for occupancy. Ballinger [17] reports that 58% of the 109 buildings participating in the Building Tune-Up Accelerator Program in Seattle, Washington, United States, were advised to improve schedules to optimize operations for actual building occupancy patterns. Delivering the right amount of cooling, heating, or ventilation only when and where they are needed is a key to saving energy and associated carbon emissions [18]. Thus, research on occupancy-based ASO has grown significantly over the past decade. Reviewed papers about occupancy-based control for commercial buildings are summarized in Table 1. In the literature, multiple methods are used for occupancy detection—such as passive infrared (PIR) sensors and cellular network Wi-Fi to get a binary indication if a space is occupied, and camera/thermal sensors and PIR sensors to indicate the occupancy level (i.e., the number of people occupying a space). Binary sensing has been used for HVAC system scheduling or space temperature control. The number of people in a room has been used for ventilation rate control.

Table 1.
Summary of studies on occupancy-based control technologies that have been developed and tested in commercial buildings.
The majority of studies of occupancy-based control technologies for commercial buildings are based on simulation, as shown in Table 1. The field evaluations documented in prior work are constrained in terms of scale of implementation (a limited area of university office buildings) or duration of the study (days to a month). There are very few papers that document the performance of occupancy-based control technologies based on in situ deployment in existing buildings, as used by operational staff. Simulation-based studies have the advantage of ease of implementation but do not reflect the effort needed for implementation in the real world and may not reveal the real performance of non-idealized building operations. Long-term field evaluation is important, as such a study can draw a full picture of technology’s effectiveness under various weather conditions and building operations. It is also critical for understanding the state of commercial offerings in spite of the performance documented in vendor-provided case studies and customer testimonials. Compared with previous works, this paper presents its contributions in several ways. The study: (1) evaluated a commercialized occupancy-based control product that was installed in a 12-floor commercial office building, which offers relevant benchmarks and references from the market to help researchers develop improved solutions; (2) conducted holistic evaluation including technical performance, cost-effectiveness analysis, and user satisfaction, which enabled practical considerations as we strive to move beyond research-grad pilot trials into product-grade deployment through commercial products; and (3) identified the drivers of savings achieved by occupancy-based control for future opportunities. More information on field testing in real buildings can allow building stakeholders to make better decisions with regard to the aforementioned trade-off between the cost of installation and the benefits and will thus encourage building designers and owners to take advantage of new developments in ASO technologies with a greater degree of certainty.
In the remainder of this article, Section 2 and Section 3 describe the technology, the demonstration site, and the methodology that was used to evaluate the technology’s performance; Section 4 and Section 5 present the evaluation findings, followed by a discussion of the results. Concluding remarks and potential avenues for future research are outlined in Section 6.
2. Technology and Site Description
The technology evaluated in this study is a commercialized building EMIS product that integrates disparate building data streams and provides occupancy-based HVAC control and analytics. The technology provides a single integrated operating platform connecting all building functions and has the following unique features:
Data Integration and Visualization: It integrates and visualizes the data from various sources, including but not limited to BAS, utility meters (e.g., electricity, gas, and water), occupancy counters, IoT sensors, isolated HVAC units, and localized weather. It provides a “single pane of glass” interface to monitor multiple real-time data streams.
Occupancy-based Automated System Optimization: Traditional control algorithms do not consider real-time building occupancy, as it is not monitored in the BAS. In this study, 22 occupancy counters were installed (two on each floor) to track the occupancy. The occupancy data were combined with the other data streams (weather, operational trends) and proprietary machine learning (ML) algorithms to determine the AHUs’ start and stop times, as well as enable and disable the static pressure setpoints’ adjustments to reduce total energy consumption while satisfying estimated human thermal comfort. Specifically, the following four energy conservation measures (ECMs) are included in the offering.
- Optimal start: The startup of AHUs is based on proprietary ML algorithms that aggregate historical occupancy data, space temperature, space temperature setpoints, and the next day’s weather. The recommended start time for AHUs is designed to consume the least amount of energy while ensuring the space reaches its desired temperature by the time required in the lease agreement. It uses day-ahead prediction of interior space temperatures, occupancy profiles, and building thermal capacity developed using ML methodologies. As defined in the BAS sequence of operations, the chiller plant turned on after the startup of the AHUs.
- Early shutdown: The shutdown times of AHUs are based on real-time occupancy. If the occupancy count on a particular floor reads as 0 after a specific time pre-determined by the building operator, the unit waits 15 min before shutting down the AHU for the rest of the day. This measure is applicable during the pandemic, as only limited tenants come to the building on weekdays, and they typically do not stay in the building for the whole day.
- Midday ramp-down/up: During the lunch hours, HVAC ramp-down sequences (tentatively reducing AHU static pressure setpoint) are implemented based on variations in occupancy. The reduction in the static pressure setpoint decreases fan speed. Thus, fan electricity use decreases while chilled water energy use may increase as the supply air temperature setpoint might be reset to lower values. Occupancy is estimated using historical occupancy data and a proprietary ML algorithm to decide the enabled and disabled time of the midday ramp-down/up strategy. When the occupancy level is decreased, the strategy is enabled, and the static pressure setpoint is reduced to a pre-defined minimum static pressure setpoint.
- End-of-day static pressure setpoint ramp-down: The same occupancy-based control also allows for the end-of-day ramp-down to occur as soon as the occupancy level starts to decrease.
Analytics, Reporting, and Data Export: It incorporates machine learning to correlate, trend disparate data streams, and learn, thus providing predictive and prescriptive insights. Benchmarks consider similar operating and weather days from the past, calculating the expected amount of energy to use throughout the current day. It provides an operational guide for demand and consumption performance daily. The technology also provides reporting and data export features.
The site where the technology was installed for evaluation as a single-site pilot demonstration is a 12-floor, 27,778-square-meter commercial office building located in downtown Washington, DC, USA, built in 1965. Each floor has two wings, an East and West wing, with the first floor consisting of retail space, while office space occupies floors 2 through 11. The HVAC system is mostly hydronic, with a central plant consisting of two chillers (1760 and 1230 kW), two primary chilled water (CHW) pumps (one for backup), two cooling towers with variable speed fans, two secondary CHW pumps (one for AHUs, the other for fan coil units [FCUs]), four boilers, and three hot water pumps (one for AHUs, one for FCUs, and the other for backup). Four unitary heat pumps serve the ground floor, while 22 AHUs serve the second to twelfth floors, with each AHU serving a wing on each floor. All AHUs have variable speed supply fans, and all but six AHUs also have variable speed return fans. Cooling or heating is provided to the space by a large number of variable-air-volume terminal units and FCUs. The HVAC controls are provided by a Tridium JCI Niagara AX BAS. HVAC units are set to turn on and off based on a programmed operating schedule (M–F 6:00–18:00). The AHU controls the supply air temperature setpoint, which is reset by the return air temperature. Supply and return fans modulate to maintain the supply air static pressure setpoint. In addition to the existing BAS, there is also an energy meter data management system provided by MACH Energy. The building’s operational hours are Monday to Friday, from 8:00 to 18:00.
3. Evaluation Methodology
Lin et al. [5] proposed a standardized field evaluation protocol to assess EMIS energy and non-energy benefits in order to produce consistent evaluation results that can be generalized across multiple studies to support the adoption and further advancement of EMIS. The evaluation of this study follows this evaluation protocol. It assessed the ease of installation, the capability to enable energy efficiency, energy and utility cost savings, cost-effectiveness, and user satisfaction.
3.1. Ease of Installation
The EMIS installation and commissioning process is a comprehensive process involving multiple stakeholders, such as the site’s facilities team, IT security team, BAS contractor, and EMIS vendor. The evaluation of the installation process was completed based on surveys with site operation engineers and activity documentation during the evaluation process. This portion of the evaluation documented: (1) the activities undertaken and the lead time to complete them; and (2) the type of support needed from on-site engineers and other staff, as well as estimated labor hours.
3.2. Capability to Enable Energy Efficiency
Validating the capability to enable energy efficiency confirms whether or not the targeted control schedule or setpoints can be successfully changed by the technology. The validation results can explain how savings are generated in this machine learning, occupancy-based control optimization, and verify the ECMs being modeled for savings determination in Section 3.3. The main energy savings of the technology can be directly attributed to the occupancy-based ASO capability that covers the four ECMs discussed in Section 2: optimal start, early shutdown, midday static pressure setpoint ramp-down/up, and end-of-day static pressure setpoint ramp-down. The implementation of those four ECMs is fully automated on the platform and the BAS. The optimal operation schedule and setpoints are determined in the platform and then written into the BAS. To validate the successful implementation of ECMs, the data trends of the targeted control settings or measurements are plotted in the post-installation period (2021 COVID-19 time period) to validate if the settings change successfully.
3.3. Energy and Utility Cost Savings
Energy savings associated with each of the ECMs were quantified using the International Performance Measurement and Verification Protocol (IPMVP) Option D calibrated simulation approach [32]. Option D was used because the technology was installed in July 2020, just as the COVID-19 pandemic drove a deep reduction in building occupancy, from 100% to 5% of standard levels. This change in occupancy meant that the 2019 energy use data could not be used as a baseline to compare 2020–2021 energy use data, challenging the application of meter-based Option C or Option B savings approaches. As such, a calibrated simulation was used to model the energy savings potential of the technology under fully occupied conditions. Utility cost savings were calculated with a blended, estimated cost of electricity and natural gas from site-specific utility bills, together with energy savings results.
EnergyPlus [33] was the simulation tool used to model the savings. The savings calculation followed five steps:
- (1)
- Collect data and building information: Various data and information were collected for modeling inputs, including monthly energy use and weather data in 2019, building architecture, mechanical, control drawings, site survey, energy-consuming loads, and space use conditions. Occupancy information was collected from building managers. The occupancy profile in the EnergyPlus model was adjusted to match the time-averaged electric power profile of 2019.
- (2)
- Build and test the baseline model: Input data for the envelope, internal load, and HVAC system configuration in EnergyPlus to create the baseline model, run a few simulations to debug the model, and check the model output files to verify that there are no errors in the program.
- (3)
- Calibrate the simulation model: Model calibration was accomplished by adjusting simulation inputs to actual operating conditions and comparing simulation results with monthly whole building electricity and natural gas energy use data. ASHRAE Guideline 14 [34] recommends acceptable tolerances for calibration using monthly data: a mean-bias error (MBE) within ±5% and a coefficient of variation of the root mean squared error (CV(RMSE)) of less than 15%. In this study, MBE and CV(RMSE) were calculated following Equations (1) and (2), where yi is the actual metered value, is the predicted value, is the average of yi, and is the total number of data points.
- (4)
- Create and refine the post-installation model: Starting with the calibrated baseline model, the model is updated to include the building’s ECMs to create the post-installation period model. Four individual ECMs (optimal start, midday ramp-down and up, early shutdown, and end-of-day ramp-down) were simulated in this study. The technology provider of the platform used its internal algorithm to determine the optimal start time of each AHU, the enabled and disabled times of midday ramp-down/up, the early shutdown time, and the enabled time of the end-of-day ramp-down for each weekday in 2019 based on simulated 2019 space temperature data, correlating 2020–2021 actual space temperature and normalized occupancy, and weather data. In the post-installation simulation model, we used EnergyPlus’ Energy Management System (EMS) to model the detailed control of static pressure reset for each weekday of 2019. In the EMS codes, we defined a “sensor” object as a 10 min interval schedule of static pressure ramp-down. The schedule was set as 0 when the AHU was off, as 1 when the AHU was on and there was no change in the static pressure setpoint, and as 0.5 when the AHU was on and the static pressure setpoint was scheduled to ramp-down. The sensor schedule for each AHU was provided via a csv schedule file, which marked the 10-min interval timestamp and schedule value (0, 1, or 0.5). We also set fan pressure rise as the actuated component control type in the EMS “actuator” object. The EMS program links the “sensor” and the “actuator” together. When the “sensor”, aka the static pressure ramp-down schedule label, equals 0.5, the “actuator”, the fan pressure rise of the AHU supply fan, is set to the minimum static pressure setpoint (Table 2) accordingly. The results of optimal start and early shutdown were applied in the post-installation model via a schedule:file item. Each AHU’s status was marked as 0 (AHU off) or 1 (AHU on) with a 10 min time interval in a schedule csv file that was fed into the EnergyPlus model file. The AHU start time, shutdown time, and static pressure setpoint were changed day by day, accordingly, in the post-installation EnergyPlus model.
 Table 2. Comparison between the AHU normal and minimum static pressure setpoints.
 - (5)
- Calculate energy savings: Run the baseline model and post-installation model under 2019 conditions. The savings are calculated by subtracting the post-installation model results from the baseline model results.
3.4. Cost-Effectiveness
Simple payback period (SPP) is a widely used and easily interpreted financial metric for energy efficiency projects. It quantifies the time required to recover the initial technology investment through project savings, as defined in Equation (3):
For many efficient technologies, costs are primarily composed of the “up-front” purchase as well as the installation and commissioning labor. However, for smart building software-based technologies such as those tested in this work, ongoing annual subscription fees may also accrue. In applying the simple payback metric, we framed the findings using 2-year, 5-year, and 10-year horizons, consistent with the range of hurdles that are commonly used in corporate efficiency investment decisions. In so doing, we quantified an x-year cost by summing up front and ongoing subscription fees and determined x-year savings by multiplying field testing annual savings by 2, 5, or 10. This methodology allowed us to assess cost-effectiveness scenarios while incorporating ongoing costs into the most widely used and well-understood financial metric.
3.5. User Satisfaction
The assessment of user satisfaction was based on interviews with site operation staff. Interviews were structured around a set of 12 survey questions (Appendix B), each framed according to a 1–5 Likert score, with 5 representing most satisfactory and 1 representing least satisfactory. The 12 questions assessed satisfaction with respect to four key dimensions: (1) the technology overall and its usefulness during the pandemic; (2) features accessible through the interface, for example, the AHU scheduler, energy and demand tracking, custom KPIs, dynamic graphs, and data export; (3) occupancy counting and reporting; and (4) technical support offered by the technology provider. Interviews and surveys were administered to three different staff members in sustainability management and day-to-day operations. The results that are reported correspond to the average Likert scores across these three staff members.
4. Results
4.1. Ease of Installation
In this study, two FLIR occupancy counters were installed at each elevator bay on floors 2 through 12 in the building. The occupancy sensors are camera-based 3-D vision counters that were installed at the egress and ingress points on each wing on each floor. They calculated occupancy in real-time by collecting the enter/exit counts from the cameras. The occupancy counter installation took several steps, including (1) running Ethernet cables, (2) installing recess mount kits and occupancy counters on the ceiling wall, (3) installing network switches and bringing them online, (4) labeling counters and integrating occupancy data sources into the platform, and (5) working with onsite facility engineers to run several tests validating the occupancy counter accuracy. Each of the counters was calibrated to ensure accurate counting.
Fifty Monnit wireless temperature and humidity sensors were also installed in the building to provide increased visibility of the interior environments in various tenant spaces. As the existing BAS zone temperature sensors were found to be inaccurate at times, Monnit sensors provided zone temperature readings on each wing of the floor that fed into the optimal start algorithms. The technology successfully integrated ~21,000 data points from the BAS (all associated AHUs, fan coil units, variable air volume (VAV), chilled/condenser water systems and associated pumps/sensors/valves/chillers/cooling towers, and all equipment associated with the hot water system such as boilers and heat exchangers), existing and new wireless sensors, electric and natural gas meters, and occupancy counters (Figure 1). The data points from the BAS were integrated through pathway 1, and the data points from the Monnit wireless sensors, meters, and occupancy counters were integrated through pathway 2. A graphical user interface dashboard was created inside the BAS to allow building operators to enable or disable the new schedule or setpoint sent by the platform.
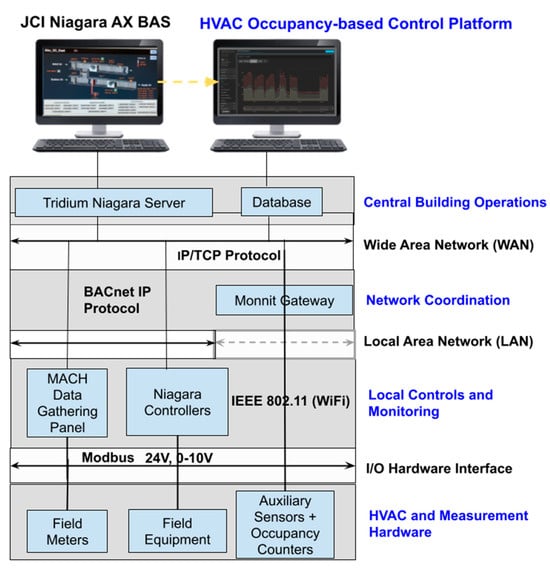
Figure 1.
Schematic illustration of the data acquisition process.
The standard process to implement the platform starts with a period of installation and configuration, which took about one month in total. This process involved both building staff and the technology provider and included data integration, connecting the platform to the BAS, tagging all points, installing and connecting gateways and additional IoT sensors, and finally validating the accuracy of the occupancy counters. The technology provider team then set up, reviewed, and configured the user interface for the building operators. The configuration step was followed by a machine learning period, which involved the technology provider collecting data over a period of two and half months to train the ML algorithms. The algorithms were tuned to fit the specific site using measured operational, energy use, and occupancy data. Finally, the commissioning period consisted of the technology provider working with building operation staff to test if the optimized start, early shutdown signal, or new control setpoint signal could be delivered to the BAS and successfully override the existing settings, which took a total of one month.
The onboarding and provisioning processes were very smooth. The total 4.5-month installation and commissioning time was a marked improvement over the six to twelve months reported in the field evaluation of an HVAC optimization system evaluated in prior work [35].
The primary point of contact at the test site estimated that about 50 h of staff time was dedicated to the platform implementation. The following activities were the most common ones required of the site’s facility team during the installation and configuration phases:
- Scheduled, performed site walkthroughs for occupancy counters and IoT sensor installation, and met with in-house electricians for hardware installation.
- Provided full access to JACE controllers and BAS for data integration.
- Provided sequences of operation programmed into the BAS, utility bills, meter information, and historical energy data.
- Involved with IT for network switches and IP configuration for occupancy counters, IoT sensors, and the platform.
- Helped install occupancy counters and verify their accuracy, turned or tilted occupancy counters to get a better field of view.
- Helped test software connectivity and configurations.
- Provided feedback on graphical user interface design.
4.2. Capability to Enable Energy Efficiency
4.2.1. Optimal Start and Early Shutdown Validation
The technology successfully implemented the optimal start and early shutdown strategies. With the platform in place, AHU’s optimized start and early shutdown times were based on multiple factors, as described in Section 2. Figure 2a shows an example one-day (16 December 2021) pandemic-era operation of an AHU serving the sixth-floor west wing with an optimal start and early shutdown implemented by the platform. The building’s interior temperature and the weather forecast for the next day allowed for a later start-up time, saving energy and costs compared with a fixed and unchanging start-up schedule. For example, on this selected day, the changes in AHU_2W fan status indicate that the AHU started at 7:45 and stopped at 14:20, following the optimized schedule. The platform reduced the AHU_2W run time by 5 h 20 min on this day. Similarly, the start and shutdown times of all AHUs from the second floor to the eleventh floor are shown in Figure 2b. These AHUs were turned on at 6:55 to 7:55 and turned off at 14:15 to 18:00. On average, the run time decreased by three hours per AHU on that day compared with the 12 h baseline operation time. Figure 3 shows the daily reduced running time per AHU through each weekday of 2021. The reduced running time is the sum of the delayed start time and the advanced end time. During the 2021 pandemic time frame, the technology decreased the AHUs’ operation time by 2 h 35 min per AHU per day.
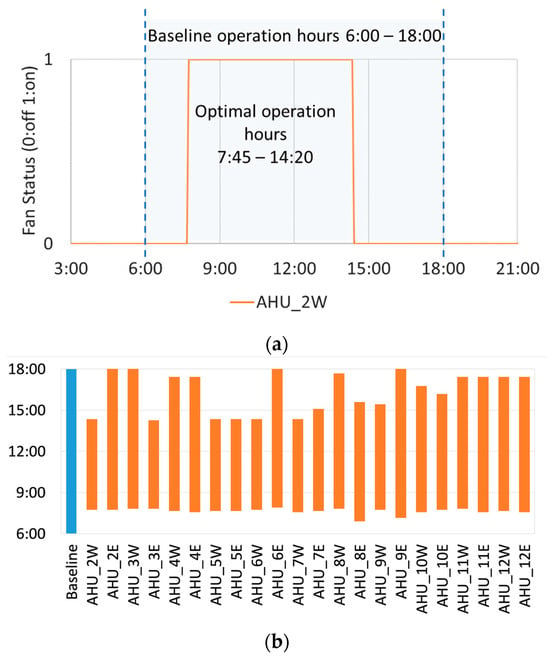
Figure 2.
An example one-day optimal start and early shutdown of AHU_2W (a) and 22 AHUs (b) at all 11 studied floors.
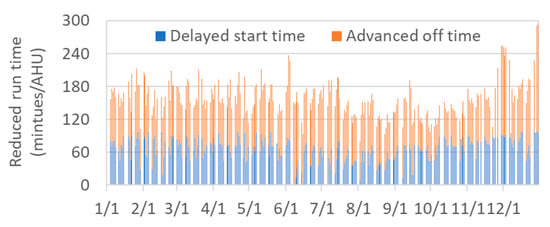
Figure 3.
Reduced AHU run time (minutes/AHU) in 2021.
4.2.2. Midday Ramp-Down, Ramp Up, and End of Day Ramp-Down Validation
It was observed that the occupancy would begin to decrease near lunchtime and rise again in the early afternoon. This occupancy pattern offered an opportunity to reduce energy consumption by adjusting the AHU static pressure setpoints (and associated fan speeds) to match the building profile. When occupancy dropped near lunchtime, the platform executed a predetermined ramp-down sequence to the BAS to reduce the energy use, then also to automatically command the BAS to ramp the AHUs back up as occupancy returned after lunch. Table 2 summarizes the normal static pressure setpoints and the minimum static pressure setpoint when midday ramp-down was deployed for all the AHUs. The AHU static pressure setpoints were dropped by 5 to 50 pascals (Pa) when the ramp-down sequence was executed. Later in the study, the platform enabled an early ramp-down, in which the static pressure setpoints were reduced to the minimum setpoint once a drop in occupancy was detected later in the afternoon. Three AHUs (AHU_2W, AHU_3W, and AHU_8W) did not implement the pressure setpoint ramp strategies due to various reasons, including no discernible change in occupancy during the middle of the day or that the zone had opted out per facility request, and therefore the minimum setpoint was not written to the AHU.
The technology successfully executed both the midday ramp and end-of-day ramp strategies. Figure 4 shows a one-day example of an AHU. Due to the change in the static pressure setpoint, the fan speed of AHU_10W was roughly reduced from 80% to 60% at 11:20 a.m. when the occupancy count dropped during the lunch hours and went back to 80% at 12:45 p.m. when the occupancy count rose after lunch. The fan speed dropped again at about 15:00 following the drop in occupancy count. Figure 5 presents a one-day example of these midday ramp-down and ramp-up sequences across all AHUs from floors 2 to 12. Upon execution, the ramp sequence reduced the baseline static pressure setpoint to the minimum static pressure setpoint in Table 2 in order to reduce fan speeds and overall building electrical demand. At the end of the ramp period, the static pressure setpoint was returned to the baseline value.
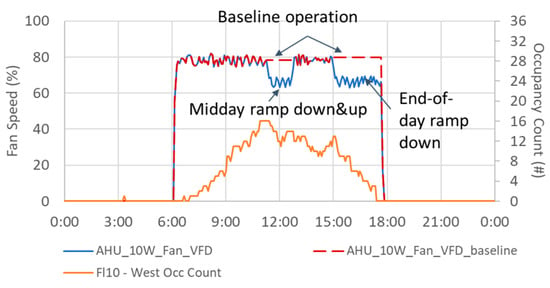
Figure 4.
A one-day example of occupancy counts, estimated baseline fan speed, and reduced fan speed due to a midday and end-of-day ramp of AHU_10W.
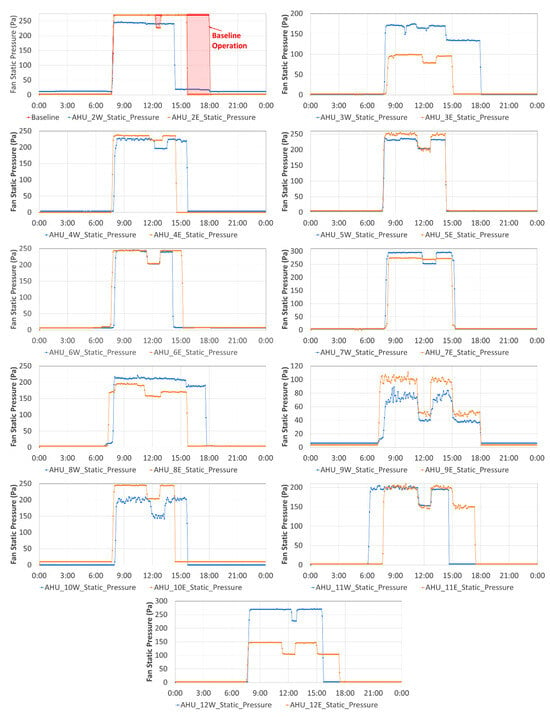
Figure 5.
A one-day example of midday and end-of-day ramp of all AHU at floors 2–12.
4.3. Energy and Utility Cost Savings
Reduced occupancy during the pandemic significantly impacts the energy use of the building. For example, the total electricity use in June 2020 was 272,900 kWh, which is 70% of the total energy use in June 2019 (391,389 kWh). Therefore, the difference between the energy use before and after technology installation can’t be taken as the energy savings of the technology. As discussed in Section 3.3, instead of the IPMVP meter-based Option C or Option B approach, this study applies the IPMVP Option D calibrated simulation approach to determine the energy savings.
Figure 6 shows a visualization of the building energy model developed for the test. The 2019 weather file was obtained from the NASA Power API, given the latitude, longitude, and time interval [36]. Figure 7 shows the hourly dry bulb temperature and global horizontal radiation. The key simulation model inputs after calibration can be found in Appendix A. The coefficient of performance of chillers is 5.5. The motor efficiency of pumps and cooling towers is 0.9. The thermal efficiency of boilers is 0.8. Calibration results include MBE values of −0.60% and −4.14% for electricity and natural gas consumption, respectively. CV (RMSE) values were 5.17% for electricity and 12.94% for gas consumption. The indices for both electricity and natural gas are within the acceptable tolerances (MBE < 5%, CV(RMSE) < 15%) specified by ASHRAE Guideline 14 [34]. The peak cooling demand of 488.5 kW happened on July 22, and the peak heating demand of 970.2 kW happened on January 14.
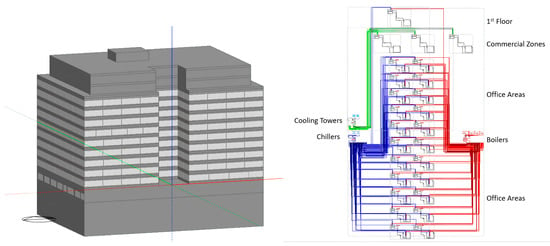
Figure 6.
Model view in the DesignBuilderV5.5 program.
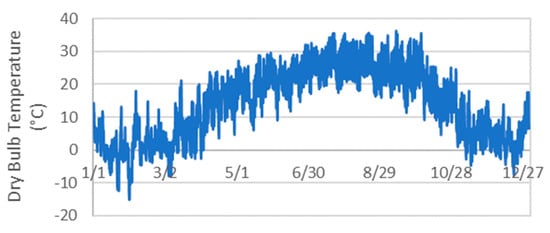
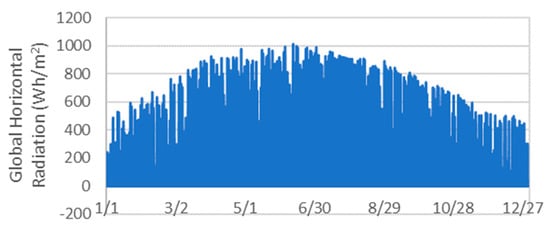
Figure 7.
Dry bulb temperature (top) and global horizontal solar radiation (bottom) of 2019.
The annual energy savings were simulated under four ECMs. In the midday ramp-down and up scenario and the end-of-day ramp-down scenario, the minimum AHU static pressure setpoints in Table 2 were implemented in the 2019 calibrated model during the weekday lunchtime (approximately 11:30–12:30) and later afternoon (approximately 15:00–18:00), respectively. The start and end times of the lunch hours, as well as the start time of the end-of-day ramp-down, were slightly different for each AHU and were determined from 2020–2021 data. In the early shutdown case, it was conservatively assumed AHUs could shut down at 16:00.
Table 3 shows the whole building’s energy and cost savings results. In the table, the whole building energy use intensity (EUI) of the baseline and four post-installation cases is presented, followed by the energy and cost savings. The final two columns contain the absolute savings from electricity and natural gas. The whole building energy savings were 2.6%, 0.07%, 0.1%, and 2.8% for the optimal start, midday ramp-down and ramp up, end-of-day ramp-down, and early shutdown cases, respectively. Since only one ECM can be implemented in the later afternoon, the total annual whole building energy savings of the three ECMs is 2.8% ($10,829) if the end-of-day ramp-down is implemented and is 6.1% ($23,111) if an early shutdown is implemented. Figure 8 shows the monthly electricity and natural gas consumption in each case. As the boilers were off from May to September, the gas consumption from May to September was zero.

Table 3.
Whole building energy and utility cost savings.
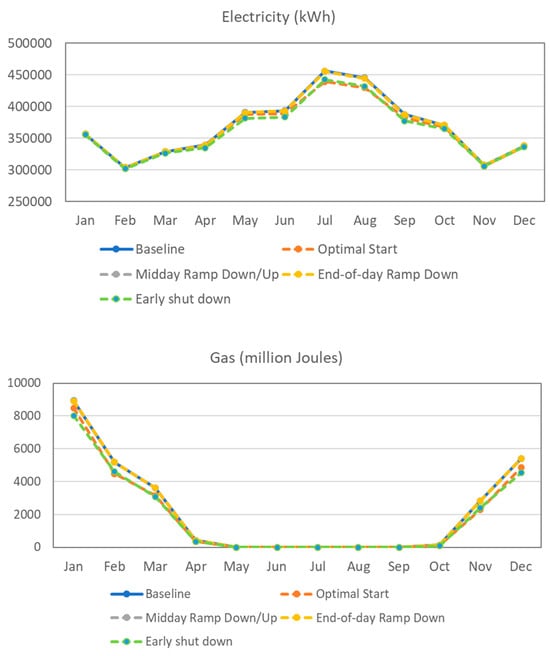
Figure 8.
Simulated monthly energy consumption of baseline and four post-installation cases ((top) electricity, (bottom) natural gas).
4.4. Cost Effectiveness
Table 4 summarizes the upfront and ongoing technology costs associated with labor to install, integrate, and commission system components, equipment purchases, and licensing fees. The five-year cost of the technology—that is, the total up-front costs ($48,425) and five years of licensing ($114,000)—amounted to $162,425. As reported in Table 4, the annual technology savings were $23,111 (ECMs 1, 2, and 4), or $115,555 over a five-year horizon. To meet a five-year payback, technology costs would need to decrease by $46,870 (29%) over those required for the single-site pilot demonstration. Conversely, technology savings could be increased by the same amount, $46,870 (41%). Using the same analysis approach, a 2-year or 10-year payback can also be assessed. Each of these scenarios is presented in Table 5.

Table 4.
Upfront and ongoing costs for the evaluated technology.

Table 5.
Scenario analysis of technology payback.
4.5. User Satisfaction
Responses to 12 assessment questions from three site staff were collected as indicative of the user experience in this specific field installation. Across all questions, the average user rating was 4.2 on the 5-point scale, and every aspect of the technology that was surveyed was rated above 3.0. The technology’s energy and demand tracking, as well as the dynamic graphs, were the most highly valued features, with an average score of 5.0. Technical support also received a 5.0. The optimal start scheduler and AHU ramp function themselves were also highly rated, at 4.3. The technology’s value to operations staff during the pandemic, as well as the portfolio and sensor views, were less consistently highly rated across staff. The surveys also confirmed that the platform complied with the organization’s cybersecurity requirements. The 12 questions and the average user ratings for each technology aspect are presented in Appendix B.
5. Discussion
Proprietary ML algorithms were adopted by the evaluated technology to determine the optimal start time and enabled and disabled time of static pressure setpoint adjustments during the noon and late afternoon. The early shut-down time was determined based on real-time occupancy data and rules. The annual modeled whole-building savings achieved with the optimal start, midday ramp-down and up, and end-of-day ramp-down were 2.8%; savings increased to 6.1% if an early shutdown was implemented rather than an end-of-day ramp-down. These savings results are smaller than the 10–42% savings reported in the prior simulated and experimental studies of occupancy-based control technologies that are reported in the literature and summarized in Table 1. There are three likely drivers of this disparity: the baseline or reference control strategy, the occupancy-based control approach itself, and the HVAC system configuration.
Baseline/reference strategy: The prior studies used less efficient baseline control strategies, which led to higher savings potential. For example, the 26% savings reported by Lee et al. [20] were quantified relative to a baseline in which the HVAC system was always on. The 30% savings reported by Erickson V. et al. [22] were determined based on a baseline of a fixed space temperature setpoint and ventilation rate for maximum occupancy from 6:00–1:00 the following day. In contrast, in this study, the baseline system operated only from 6:00–18:00, thus limiting the savings percentage. Pachuta et al. [37] provided an assessment of the same technology (associated with ECMs 1, 2, and 3) studied in this work. They reported modeled savings of 11% in one building and 5% in another, with a baseline start around 3:00. When the results are normalized to align with the baseline 6:00–18:00 schedule in this work, the savings are consistent with the 3% observed in this work.
Occupancy-based control approach: The occupancy-based control offered by the technology in this study provided later AHU start times and earlier stop times. Throughout the day, the static pressure setpoints were reduced by 10–25% in most of the AHUs for a couple of hours. In other studies [19,21,24,25,26,27], the space temperature setpoint and/or ventilation rate were dynamically modulated between occupied and unoccupied values based on the variation in occupancy (e.g., a temperature deviation of 6 °C in Gluck et al. [24]). These dynamic adjustments not only delayed the start time and advanced the stop time; they also let the HVAC system operate in unoccupied mode during periods of the normal operation time.
System configuration: At the test site in this study, space cooling was provided by both the AHUs and the fan coils. The AHU fan energy use at this site accounts for a smaller fraction of the whole building energy use than in other studies that do not also use fan coils for cooling. As a result, the percent energy savings contributed by the reduction in fan energy that is caused by the midday ramp-down/ramp-up and end-of-day ramp strategies is also smaller.
The savings and cost-effectiveness observed in this study suggest several ways to advance the state of the art of this and other similar commercialized occupancy-based HVAC control products. Returning to the five-year payback scenario and the cost elements reported in Table 5, beyond-pilot cost reductions (29% for this product) could potentially be achieved through economies-of-scale-driven reductions in equipment costs as well as licensing fees. It is also possible that through repeated installations, labor costs could be reduced as familiarity with the technology integration and commissioning grows.
Technology savings could be increased through expanded functionality that would expand the optimal control approach and also increase the suite of strategies to include things like demand limiting and demand response, occupancy-based reset of AHU minimum outdoor air flowrate setpoint and terminal unit minimum airflow setpoint, high-performance AHU reset sequence documented in ASHRAE guideline 36 [38], proper economizing, and systems other than AHUs. It is unlikely that the increase in savings required for a five-year payback (41% in this case) would be attained on a routine basis. As such, full-scale cost-effectiveness would most practically be attained through a combination of savings increases and cost reductions. Future occupancy-based control technology development should also make sure reduced ventilation air is not below acceptable minima and consider thermal capacitance and heat transfer to adjacent zones when changing the temperature setpoint in a subset of zones.
The installation and commissioning process for this technology was more streamlined than in other cases documented in the literature. The third-party off-the-shelf occupancy counters were conveniently installed on each floor of the building, and the optimization technology successfully integrated the data to determine optimized schedules and setpoints. Overall, the facility operations and energy management staff were satisfied with the technology. Taken as a whole, the results of this study indicate that occupancy-based optimal control is maturing and has progressed well from the domain of research into commercialized products for real-world adoption.
6. Conclusions
In this study, an occupancy-based commercial HVAC optimization technology was implemented in an office building as a single-site pilot demonstration for evaluation. The study was designed to evaluate several aspects of technology performance, including the ease of the installation and commissioning process, the capability to enable energy efficiency, energy and cost savings, cost-effectiveness, and user satisfaction. The platform successfully integrated ~21,000 data points from diverse data streams such as BAS, meters, occupancy counters, and IoT sensors in a month. Twenty-two off-the-shelf occupancy counters were installed as part of the platform to track floor-by-floor building occupancy in real-time. The platform utilized floor-level occupancy data, together with thermal modeling and machine learning algorithms, to implement optimal start-up, early shutdown, and intra-day fan speed adjustments to the AHUs for each floor during the pandemic. The onboarding and provisioning processes were very smooth. In general, this work illustrates that occupancy-based optimal control has progressed well from research into commercial products and that it is being considered for integration into standard facilities and energy management practices.
The technology reduced weekday AHU run time significantly during the 2020–2021 COVID-19 pandemic time period. The simulation shows that 2.8% annual whole building energy savings ($10,829 per year) can be achieved if optimal start, midday ramp-down and up, and end-of-day ramp-down are applied when the building is fully occupied in the post-COVID-19 time period, and 6.1% annual whole building energy savings ($23,111 per year) can be obtained when early shutdown is implemented rather than end-of-day ramp-down. The disparity between the savings seen in this study’s results and the savings of prior studies in the literature is associated with three potential drivers: the baseline or reference control strategy, the occupancy-based control approach itself, and the HVAC system configuration. The expansion of occupancy-based control approaches and targeted HVAC system and equipment are key to the increase in technology savings. Future work is needed to continue to publicly document field studies of commercialized optimization products to provide a deeper understanding of what today’s technology is delivering, how it evolves over time, and what further advances can be made.
Author Contributions
G.L.: Methodology, Investigation, Writing—original draft, Writing Review & Editing; A.C.: Methodology, Formal analysis, Investigation, Writing—original draft, Writing Review & Editing; M.S.: Formal analysis, Investigation; J.G.: Conceptualization, Methodology, Funding acquisition, Writing—original draft, Writing Review & Editing. All authors have read and agreed to the published version of the manuscript.
Funding
This work was supported by the Assistant Secretary for Energy Efficiency and Renewable Energy, Building Technologies Office, of the U.S. Department of Energy under Contract No. DE-AC02-05CH11231.
Data Availability Statement
Not applicable.
Acknowledgments
This work was supported by the Assistant Secretary for Energy Efficiency and Renewable Energy, Building Technologies Office, of the U.S. Department of Energy under Contract No. DE-AC02-05CH11231. The authors thank each of the following for their contributions to this evaluation: Evan Levy, Byron Avery, Jonathan Bauer, Jim Lewis, Marvin Atwell, and Katie Rothenberg.
Conflicts of Interest
The authors declare that they have no known competing financial interests or personal relationships that could have appeared to influence the work reported in this paper.
Appendix A

Table A1.
Inputs for the energy model.
Table A1.
Inputs for the energy model.
| Baseline Building Inputs | Source | |
|---|---|---|
| Envelope | Wall: 10.16 cm glazed brick + 10.16 cm pierced concrete block, U-Factor = 1.647 W/m2-K | Construction blueprints; [39] |
| Window: U-Factor = 2.726 W/m2-K, Solar heat gain coefficient (SHGC) = 0.706, Visual Transmittance (VT) = 0.637 | ||
| Window-Wall Ratio: 0.58 | ||
| Roof: U-Factor = 0.250 W/m2-K | ||
| Internal Load | Lighting: 7.5~10.8 W/m2, vary between zones | DesignBuilder default library [39]; Building manager |
| Equipment: varies between zones | ||
| Occupancy: varies between zones | ||
| Occupancy Schedule | Monday to Friday, 8:00 to 18:00 | Building manager |
| HVAC—Water Cooling System | Two electric chillers (1230 kW and 1760 kW): Monday to Friday, 6 am to 6 pm, cut-in at 12.8 °C, cut-out at 10 °C, chilled water at 7.2 °C, chiller coefficient of performance (COP) of 5.5 | Building manager; Equipment nameplates |
| Chiller continuous supply pump: design pump head at 343.4 Pa, design power at 149.14 kW, motor efficiency 0.9 | ||
| Variable speed cooling towers: condenser temperature fixed at 26.6 °C, Monday to Friday, 6:00–18:00, design pump head at 20 kPa, design power at 44,742 W, motor efficiency 0.9 | ||
| HVAC—Water Heating System | Four natural gas boilers (880 kW each): Monday to Friday, 6:00–18:00, manually turned off from May through September, cut-in at 4.4 °C, cut-out at 16.7 °C, when outdoor air temperature (OAT) = −12.2 °C, hot water temperature (HWT)= 76.7 °C, when OAT = 4.4C, HWT = 71.1 °C, thermal efficiency = 0.8 | Building manager; Equipment nameplates |
| Boiler continuous supply pump: Design pump head at 20 kPA, design power at 44.7 kW, motor efficiency 0.9 | ||
| HVAC—Zone | AHU without reheat: fan efficiency 0.8, economizer fixed dry bulb lockout, minimum temperature −10 °C, maximum temperature 20 °C | Building manager; calibration |
| Fan coil units: constant fan, variable water flow, cooling coil inlet water temperature at 7.2 °C, heating coil inlet water temperature 71.1 °C, outlet water temperature 65 °C | ||
| Zone thermostat setpoints: occupants have manual control, calibrated in models based on locations (perimeter or core zones) and months; perimeter zones cooling setpoint—occupied 23.9 °C, unoccupied 24 °C; heating setpoint—occupied 16.7 °C to 22.2 °C, unoccupied 16 °C to 22 °C; core zones cooling setpoint—occupied 23 °C to 23.5 °C, unoccupied 23.9 °C; heating setpoint—occupied 17 °C to 23 °C, unoccupied 16 °C to 22.2 °C | ||
Appendix B
Please indicate on a scale of 1 to 5 for the 12 items below, with 5 being most satisfactory, your thoughts on the technology’s performance, regarding your expectations.

Table A2.
Survey questions and answers.
Table A2.
Survey questions and answers.
| Items | Averaged User Satisfaction Scores (1–5) across the Responses from Three Site Staffs |
|---|---|
| Energy or demand Benchmarking | 5 |
| Optimal startup and shutdown scheduler | 4.3 |
| Midday ramp-down and up and end-of-day ramp-down capability | 4.3 |
| Portfolio overview and sensor data visualization | 3 |
| Occupancy counting and reporting | 3.7 |
| Operation abnormality detection | 4 |
| COVID building operation assistance | 3.3 |
| Custom key performance indicators | 4 |
| Report center | 4.3 |
| Data export tool | 3.7 |
| Dynamic graphs | 5 |
| Contacting technical support | 5 |
References
- Kerry, J. The Long-Term Strategy of the United States, Pathways to Net-Zero Greenhouse Gas Emissions by 2050; The United States Department of State and the United States Executive Office of the President: Washington, DC, USA, 2021. [Google Scholar]
- IEA—International Energy Agency. 2018 Global Status Report: Towards a Zero-emission, Efficient and Resilient Buildings and Construction Sector; IEA: Paris, France, 2018. [Google Scholar]
- Lin, G.; Kramer, H.; Nibler, V.; Crowe, E.; Granderson, J. Building Analytics Tool Deployment at Scale: Benefits, Costs, and Deployment Practices. Energies 2022, 15, 4858. [Google Scholar] [CrossRef]
- Lin, G.; Kramer, H.; Granderson, J. Energy Management and Information Systems (EMIS) Specification and Procurement Support Materials, Better Buildings; U.S. Department of Energy: Washington, DC, USA, 2020.
- Lin, G.; Nibler, V.; Crowe, E.; Granderson, J. Assessing EMIS benefits: A new field evaluation protocol offers rigor and flexibility. In Proceedings of the 7th International High Performance Buildings Conference, West Lafayette, IN, USA, 10–14 July 2022; Conference Paper 431. Available online: https://docs.lib.purdue.edu/ihpbc/431 (accessed on 25 September 2023).
- Ala’raj, M.; Radi, M.; Abbod, M.F.; Majdalawieh, M.; Parodi, M. Data-driven based HVAC optimisation approaches: A Systematic Literature Review. J. Build. Eng. 2022, 46, 103678. [Google Scholar] [CrossRef]
- Taheri, S.; Hosseini, P.; Razban, A. Model predictive control of heating, ventilation, and air conditioning (HVAC) systems: A state-of-the-art review. J. Build. Eng. 2022, 60, 105067. [Google Scholar] [CrossRef]
- Serale, G.; Fiorentini, M.; Capozzoli, A.; Bernardini, D.; Bemporad, A. Model Predictive Control (MPC) for Enhancing Building and HVAC System Energy Efficiency: Problem Formulation, Applications and Opportunities. Energies 2018, 11, 631. [Google Scholar] [CrossRef]
- Afram, A.; Janabi-Sharifi, F. Theory and Applications of HVAC Control systems–A Review of Model Predictive Control (MPC). Build. Environ. 2014, 72, 343–355. [Google Scholar] [CrossRef]
- Kim, D.; Wang, Z.; Brugger, J.; Blum, D.; Wetter, M.; Hong, T.; Piette, M.A. Site demonstration and performance evaluation of MPC for a large chiller plant with TES for renewable energy integration and grid decarbonization. Appl. Energy 2022, 321, 119343. [Google Scholar] [CrossRef]
- Bengea, S.C.; Li, P.; Sarkar, S.; Vichik, S.; Adetola, V.; Kang, K.; Lovett, T.; Leonardi, F.; Kelman, A.D. Fault-tolerant optimal control of a building HVAC system. Sci. Technol. Built Environ. 2015, 21, 734–751. [Google Scholar] [CrossRef]
- West, S.R.; Ward, J.K.; Wall, J. Trial results from a model predictive control and optimisation system for commercial building HVAC. Energy Build. 2014, 72, 271–279. [Google Scholar] [CrossRef]
- Drgoňa, J.; Arroyo, J.; Figueroa, I.C.; Blum, D.; Arendt, K.; Kim, D.; Ollé, E.P.; Oravec, J.; Wetter, M.; Vrabie, D.L.; et al. All you need to know about model predictive control for buildings. Annu. Rev. Control. 2020, 50, 190–232. [Google Scholar] [CrossRef]
- Arroyo, J.; Spiessens, F.; Helsen, L. Comparison of Optimal Control Techniques for Building Energy Management. Front. Built Environ. 2022, 8, 849754. [Google Scholar] [CrossRef]
- Kramer, H.; Lin, G.; Crowe, C.C.E.; Granderson, J. Proving the Business Case for Building Analytics; Lawrence Berkeley National Laboratory: Berkeley, CA, USA, 2020. [Google Scholar] [CrossRef]
- Kitzberger, T.; Kotik, J.; Pröll, T. Energy savings potential of occupancy-based HVAC control in laboratory buildings. Energy Build. 2022, 263, 112031. [Google Scholar] [CrossRef]
- Ballinger, N. Building Tune-Up Accelerator Program (Final Technical Report) (No. DOE-SEATTLE--07556, 1630737); OSTI: Tel Aviv, Israel, 2020. [Google Scholar] [CrossRef]
- Roetzel, A.; Tsangrassoulis, A.; Dietrich, U. Impact of building design and occupancy on office comfort and energy performance in different climates. Build. Environ. 2014, 71, 165–175. [Google Scholar] [CrossRef]
- Erickson, V.L.; Carreira-Perpiñán, M.Á.; Cerpa, A.E. OBSERVE: Occupancy-based system for efficient reduction of HVAC energy. In Proceedings of the 10th ACM/IEEE International Conference on Information Processing in Sensor Networks, Chicago, IL, USA, 12–14 April 2011; pp. 258–269. [Google Scholar]
- Lee, S.; Chon, Y.; Kim, Y.; Ha, R.; Cha, H. Occupancy Prediction Algorithms for Thermostat Control Systems Using Mobile Devices. IEEE Trans. Smart Grid 2013, 4, 1332–1340. [Google Scholar] [CrossRef]
- Beltran, A.; Erickson, V.L.; Cerpa, A.E. ThermoSense: Occupancy Thermal Based Sensing for HVAC Control. In Proceedings of the 5th ACM Workshop on Embedded Systems For Energy-Efficient Buildings, BuildSys’13, Rome, Italy, 11–15 November 2013; Association for Computing Machinery: New York, NY, USA, 2013; pp. 1–8. [Google Scholar] [CrossRef]
- Erickson, V.L.; Achleitner, S.; Cerpa, A.E. POEM: Power-efficient occupancy-based energy management system. In Proceedings of the 2013 ACM/IEEE International Conference on Information Processing in Sensor Networks (IPSN), Philadelphia, PA, USA, 8–11 April 2013; pp. 203–216. [Google Scholar]
- Balaji, J.X.; Nwokafor, A.; Gupta, R.; Agarwal, Y. Sentinel: Occupancy based HVAC actuation using existing wifi infrastructure within commercial buildings. In Proceedings of the 11th ACM Conference on Embedded Network Sensor Systems, Rome, Italy, 11–15 November 2013. [Google Scholar] [CrossRef]
- Gluck, J.; Koehler, C.; Mankoff, J.; Dey, A.; Agarwal, Y. A systematic approach for exploring tradeoffs in predictive HVAC control systems for buildings. arXiv 2017, arXiv:1705.02058. [Google Scholar]
- Yang, Z.; Becerik-Gerber, B. Assessing the impacts of real-time occupancy state transitions on building heating/cooling loads. Energy Build. 2017, 135, 201–211. [Google Scholar] [CrossRef]
- Nikdel, L.; Janoyan, K.; Bird, S.D.; Powers, S.E. Multiple perspectives of the value of occupancy-based HVAC control systems. J. Affect. Disord. 2018, 129, 15–25. [Google Scholar] [CrossRef]
- Peng, Y.; Rysanek, A.; Nagy, Z.; Schlüter, A. Using machine learning techniques for occupancy-prediction-based cooling control in office buildings. Appl. Energy 2018, 211, 1343–1358. [Google Scholar] [CrossRef]
- Salimi, S.; Hammad, A. Optimizing energy consumption and occupants comfort in open-plan offices using local control based on occupancy dynamic data. J. Affect. Disord. 2020, 176, 106818. [Google Scholar] [CrossRef]
- Dong, J.; Winstead, C.; Nutaro, J.; Kuruganti, T. Occupancy-Based HVAC Control with Short-Term Occupancy Prediction Algorithms for Energy-Efficient Buildings. Energies 2018, 11, 2427. [Google Scholar] [CrossRef]
- Pang, Z.; Chen, Y.; Zhang, J.; O’Neill, Z.; Cheng, H.; Dong, B. Nationwide HVAC energy-saving potential quantification for office buildings with occupant-centric controls in various climates. Appl. Energy 2020, 279, 1157277. [Google Scholar] [CrossRef]
- Kong, M.; Dong, B.; Zhang, R.; O’Neill, Z. HVAC energy savings, thermal comfort and air quality for occupant-centric control through a side-by-side experimental study. Appl. Energy 2022, 306, 117987. [Google Scholar] [CrossRef]
- Efficiency Valuation Organization (EVO). International Performance Measurement and Verification Protocol: Concepts and Options for Determining Energy and Water Savings; EVO: Washington, DC, USA, 2012; Volume I, EVO 10000-1:2012. [Google Scholar]
- Crawley, D.B.; Lawrie, L.K.; Winkelmann, F.C.; Buhl, W.; Huang, Y.; Pedersen, C.O.; Strand, R.K.; Liesen, R.J.; Fisher, D.E.; Witte, M.J.; et al. EnergyPlus: Creating a new-generation building energy simulation program. Energy Build. 2001, 33, 319–331. [Google Scholar] [CrossRef]
- American Society of Heating Refrigerating and Air Conditioning Engineers (ASHRAE). ASHRAE Guideline 14-2014, Measurement of Energy and Demand Savings; American Society of Heating Refrigeration and Air Conditioning Engineers: Peachtree Corners, GA, USA, 2014; ISSN 1049-894X. [Google Scholar]
- Granderson, J.; Lin, G.; Singla, R.; Fernandes, S.; Touzani, S. Field evaluation of performance of HVAC optimization system in commercial buildings. Energy Build. 2018, 173, 577–586. [Google Scholar] [CrossRef]
- Stackhouse, P., Jr.; Macpherson, B.; Mikovitz, J.; Zhang, T. Providing long-term solar and meteorological resource information from NASA research through the GIS-enabled POWER web services portal. In Proceedings of the American Meteorological Society 101st Annual Meeting, Atlanta, GA, USA, 10–15 January 2021. [Google Scholar]
- Pachuta, S.; Dean, J.; Kandt, A.; Cu, K. Field Validation of a Building Operating System Platform (No. NREL/TP-5R00-83236); National Renewable Energy Laboratory: Golden, CO, USA, 2022. [Google Scholar]
- American Society of Heating Refrigerating and Air Conditioning Engineers (ASHRAE). Guideline 36–2018. High Performance Sequences of Operation for HVAC Systems; ASHRAE: Akron, OH, USA, 2018. [Google Scholar]
- International Energy Conservation Code (IECC). International Code Council: Falls Church, VA, USA, 1998.
Disclaimer/Publisher’s Note: The statements, opinions and data contained in all publications are solely those of the individual author(s) and contributor(s) and not of MDPI and/or the editor(s). MDPI and/or the editor(s) disclaim responsibility for any injury to people or property resulting from any ideas, methods, instructions or products referred to in the content. |
© 2023 by the authors. Licensee MDPI, Basel, Switzerland. This article is an open access article distributed under the terms and conditions of the Creative Commons Attribution (CC BY) license (https://creativecommons.org/licenses/by/4.0/).