Article

Tariff-Based Optimal Scheduling Strategy of Photovoltaic-Storage for Industrial and Commercial Customers

1
School of Electrical Engineering and Automation, Xiamen University of Technology, No. 600, Ligong Road, Jimei District, Xiamen 361024, China
2
Xiamen Key Laboratory of Frontier Electric Power Equipment and Intelligent Control, Xiamen 361024, China
*
Author to whom correspondence should be addressed.
Energies 2023, 16(20), 7079; https://doi.org/10.3390/en16207079
Submission received: 7 August 2023 / Revised: 25 September 2023 / Accepted: 10 October 2023 / Published: 13 October 2023
(This article belongs to the Topic Distributed Generation and Storage in Power Systems)

Abstract

:
Photovoltaic (PV) power generation exhibits stochastic and uncertain characteristics. In order to improve the economy and reliability of a photovoltaic-energy storage system (PV-ESS), it is crucial to optimize both the energy storage capacity size and the charging and discharging strategies of the ESS. An optimal scheduling model for PV-ESS is proposed in this paper, comprehensively considering factors in terms of energy cost and charging/discharging constraints of the PV-ESS. Moreover, the model employs a particle swarm optimization-backpropagation (PSO-BP) neural network to predict the PV power using historical generation data from a factory in Xiamen. The proposed two PV-ESS scheduling strategies are compared under three weather conditions. In the demand management strategy, the ESS can flexibly respond to different weather conditions and load demand changes, and effectively reduce the electricity cost for users.

1. Introduction

In recent years, the need for reductions in fossil fuel consumption and greenhouse gas emissions has been the driving force behind technological progress [1]. Many governments around the world had plans to develop renewable energy generation and reduce dependence on fossil fuels as long-term schemes to build new power systems [2,3]. As the global emphasis on environmental protection and sustainable development increases, solar energy has become an essential component of renewable energy generation. The photovoltaic (PV) power generation is widely used in various fields owing to its high efficiency and cleanliness.
As PV power-generating technology continues to evolve, the scale of grid-connected PV power stations is expanding. Many factories and household users are increasingly concerned about the environmental value and economic benefits [1,4]. Installing PV power stations allows for on-site consumption of PV power and online sales of surplus power to the national grid, while also reducing environmental pollution. However, PV power generation is uncertain due to constantly changing weather conditions [5,6]. Thus, accurately predicting PV power can effectively schedule it, optimize energy utilization, and improve the system’s efficiency and economy.
Under the dual-carbon goal, distributed renewable energy is gradually becoming an essential form of renewable energy development, such as photovoltaic-energy storage system (PV-ESS) [7,8]. By 2030, the global energy demand is expected to continue to increase and the requirements for energy storage are expected to triple. This means that ESS will become an important part of sustainable development and energy transformation in the coming years [9,10]. Configuring ESS can address the uncertainty of PV power generation, promote its consumption, and prepare for the application of energy storage [11,12]. Within this process, distributed energy storage comes to the fore. The distributed energy storage is a form of energy storage configuration with smaller capacity and power and close to the load side [13], which makes it possible to combine it with a virtual power plant, thus extending its application scenarios from stand-alone users to communities [14]. In [14], it is illustrated that energy communities equipped with service-oriented energy storage systems can bring economic benefits to both consumers and suppliers. This paper focuses on the study of PV-ESS for independent users. Hence, configuring the capacity and charging/discharging power reasonably and optimizing the scheduling of ESS can reduce the total electricity cost for industrial and commercial users and electricity demand and improve electricity efficiency.
The existing research on user-side PV-ESS primarily focuses on cost reduction, load shifting or peak demand reduction, and time of use (TOU) pricing arbitrage [15]. In [16], the study employs an improved particle swarm optimization (PSO) algorithm to address the scheduling scheme with varying objectives, aiming to minimize battery degradation while achieving optimal generation cost reduction. However, the investigation was limited to a single sunny day, precluding the assessment of system performance and optimal scheduling strategies across diverse weather conditions. In [17], the authors present a joint optimization model for wind-loaded multi-scenario microgrids that integrates multiple costs and constraints. Although scheduling strategies for a variety of scenarios are considered in the study, the scope of the study is limited to a typical sunny day.
It directly affects the economic benefits and efficiency of the system. The previous research [16,17,18] primarily focused on analyzing a single weather condition and did not consider the influence of varying weather conditions on the capacity configuration of the PV-ESS. This assumption of a single weather condition may lead to inaccurate system design and erratic performance in actual variable meteorological environment. Therefore, it is necessary to extend the scope of the study to consider diverse weather conditions in depth to better understand the capacity optimization and optimal scheduling of PV-ESS. In this paper, the effects of different weather conditions are considered to analyze the electricity load situation of a factory. The main contributions are as follows:
  • The particle swarm optimization-backpropagation (PSO-BP) neural network algorithm is used to optimize the weights and thresholds of the BP algorithm using PSO to improve the accuracy of the prediction model.
  • Based on the PV power prediction, the storage capacity and charging/discharging power under different weather conditions are configured according to the information of TOU tariffs and investment costs of the ESS.
  • According to the proposed capacity allocation scheme, different scheduling strategies are developed for different weather conditions to solve the optimization problem caused by TOU tariffs and base tariffs.
The remainder of this paper is organized as follows. Section 2 details the PSO-BP neural network algorithm for PV power prediction. Section 3 describes the configuration of energy storage capacity. Section 4 describes the process of optimal scheduling of PV-ESS integrated system. In Section 5, a case study is conducted in which three typical days are analyzed using two different strategies in order to validate the feasibility of the proposed method. Finally, conclusions are drawn in Section 6. Table 1 shows a flowchart of the indicated code implementation.

2. PV Power Prediction

2.1. PSO-BP PV Power Prediction Model

Due to the increase in electricity demand and the stochastic nature of PV power generation, the accuracy of PV power prediction is of great significance for power scheduling [19]. It is crucial for the prediction model to obtain the historical data and environmental data. The main factors affecting PV power prediction include temperature, humidity, irradiance, etc. [20].
In the PV power prediction field, various prediction methods are widely used. These include BP neural network, support vector machine (SVM), and extreme learning machines. However, each of these methods has some shortcomings. For example, the performance of both backpropagation (BP) and extreme learning machine (ELM) is significantly influenced by the careful choice of their respective parameters [21]. The SVM has relatively high computational complexity when dealing with large-scale data and has high parameter requirements for the model [22]. In [23], a comparison of the maximum and minimum deviations between the predicted values and actual values for BP neural network and SVM methods clearly demonstrates the superior predictive performance of the BP neural network over the SVM. Through an analysis of the data, it is evident that the BP neural network achieves smaller predictive deviations at multiple time points, indicating its ability to more accurately capture the intricate relationship between PV power and meteorological factors. In contrast, the SVM method exhibits more significant predictive deviations at certain time points, suggesting that it may not fit data patterns optimally in certain scenarios. To deal with the disadvantages such as slow convergence and possible local convergence [24], one promising approach is the PSO-BP algorithm. The PSO-BP algorithm has achieved more mature applications in fault detection [25], and power load forecasting [26]; however, its use in the field of PV forecasting is relatively rare. This algorithm can make full use of the global search characteristics of PSO and the nonlinear modeling ability of BP neural network to avoid local optimal solutions, which helps to find better weights and thresholds and improve the prediction performance of the model.
The PV power prediction is obtained by learning and training the meteorological data and the actual data of the PV plant. Specifically, the model includes the input layer, the hidden layer, and the output layer to process meteorological data and PV plant monitoring data to output the PV power prediction value.
As shown in Figure 1, the PSO-BP neural network algorithm is used to predict PV power under sunny, cloudy, and rainy conditions. This approach combines the training process of the BP neural network with PSO to optimize the network’s weights and thresholds. This can effectively mitigate the issue of local optima commonly encountered in BP neural network and enhances the accuracy of predictions [26]. The steps of PV power prediction using PSO-BP neural network are as follows:
  • Initialization: Determining BP network structure, including the number of nodes and connection weights of the input layer, hidden layer, and output layer, etc. Initializing the relevant parameters of PSO, such as population size, maximum number of iterations, inertia weights, etc.
  • Random initialization of the population: A certain number of particles are randomly initialized. Each particle represents a possible BP neural network structure. The speed and position of particles are initialized as required by the PSO algorithm.
  • Calculate the fitness value: For each particle, the training set is trained using the BP algorithm based on parameters such as current weights and thresholds, and its error on the validation set is calculated as the fitness, and the current speed and position are updated according to the optimal fitness. The fitness is repeatedly calculated, and the speed and position of particles are updated until the preset maximum number of iterations is reached or the error requirement is met.
  • Output the optimal solution: Output the BP neural network with the best fitness and its corresponding weights and thresholds.
  • Training the neural network: Based on the derived optimal weights and thresholds, the neural network is trained and the prediction results are output when the accuracy requirements or the maximum number of iterations are met.

2.2. PV Power Prediction Results

The data acquisition platform utilized in this study is the environmental monitoring cloud platform, in conjunction with specific meteorological instruments. The comprehensive data collection process encompasses measurements of temperature, humidity, and irradiance, ensuring the capture of crucial environmental variables. The user interface and specific environmental monitoring platform are illustrated in Figure 2 and Figure 3.
Although the PSO algorithm can reduce the time of BP neural network training, the associated computational complexity is high. According to the above process, April 2023 is taken as a typical month. The PV power prediction curve and irradiance curve of this month are derived from the data collection of the platform, as shown in Figure 4. The highlighted portions represent typical days under different weather conditions, which will be deployed as inputs in the proposed scheduling strategy. In addition, the predicted PV power of these typical days are displayed in Figure 5.
In predictive modeling, different evaluation indexes are usually used to measure performance. In this paper, predictive models are evaluated by R 2 , RMSE and MAPE. The coefficient of determination ( R 2 ) assesses the model’s fitting ability by measuring the variance proportion between predicted and actual values. The higher its value is, the better it is. Root Mean Square Error (RMSE) quantifies the average magnitude of prediction errors, with smaller values indicating better predictive accuracy. Mean Absolute Percentage Error (MAPE) gauges the average percentage difference between predictions and actual values, reflecting the model’s average precision [27,28,29]. The definitions of the above performance indicators and the representation of the equations are presented in Table 2.
Based on Table 2, the values of the evaluation measures R 2 , RMSE and MAPE for this typical month are 0.9174, 3.8682 and 1%, respectively. The prediction model can track the power change with good prediction performance.

3. Energy Storage Capacity Configuration

The cost efficiency of the ESS is directly linked to the size of energy storage at the user end. The primary objectives include maximizing the utilization of energy storage capacity and ensuring the stability and safety of the operation. For commercial and industrial users, the energy storage configuration mainly includes capacity and charging/discharging power, and its economics include peak-to-valley arbitrage and reduction of maximum demand. This paper establishes an optimization model for energy storage capacity configuration by incorporating load and PV power prediction from the user, and solves for the optimal configuration capacity and maximum charging and discharging power.
The CPLEX is a mathematical planning and optimization tool with powerful solving capabilities, especially for complex optimization problems. The CPLEX helps to determine the optimal values of the decision variables by using optimization techniques such as linear programming and integer programming, as well as efficient solving algorithms, to achieve the best objective under the constraints. This paper is based on Matlab2022b platform for programming simulation, using YALMIP (R20230622) language to construct the capacity allocation model, and adopting the method of mixed integer programming solution software (CPLEX 12.10.0) to solve the optimization model.

3.1. Cost Analysis of Energy Storage Capacity Configuration

3.1.1. Electricity Cost

The daily cost of electricity for the factory is given in the following formula:
C 1 = C buy t P net t Δ t
where C buy t is the real-time electricity price at time t; P net t is the power exchanged between the user and the grid at time t; Δ t is the time interval, taken as 1 h.

3.1.2. Average Daily Investment Cost of Energy Storage

The ESS investment cost evaluation requires consideration of capacity and power.
C 2 = ( α 1 P max + α 2 E max ) / T
where α 1 and α 2 are the power cost and capacity cost of energy storage, respectively; P max and E max are the maximum charge and discharge power and maximum capacity of the ESS, respectively; T is the expected time of use of the ESS.
The program provided by the energy storage company indicates that the expected service life of the energy storage equipment is about 10 years. However, in consideration of factors such as the life decay of batteries during actual operation, this paper sets the expected service life to 8 years.

3.1.3. Operation and Maintenance (O&M) Cost

O&M cost is the cost of maintaining the proper operation and performance of an energy storage system throughout its life cycle.
C 3 = a P max ( 1 + r ) T 1 r ( 1 + r ) T / ( 365 T )
C 3 is the daily O&M cost of energy storage, a is the unit price of maintenance, taken as CNY 70 (CNY)/kW; r is the discount rate, taken as 6%.

3.1.4. Objective Function

The goal of optimizing the energy storage configuration is to minimize the total cost, which comprises the user’s electricity cost, the average daily investment cost of energy storage, and the operation and maintenance (O&M) cost of energy storage [30]. The objective function can be mathematically expressed as:
M in   F 1 = C 1 + C 2 + C 3

3.2. Restrictions

3.2.1. Power Balance Constraint

In Equation (5), this equation ensures that the PV-ESS maintains the power balance of the system even after taking into account the power variations of PV generation, electricity consumption and storage [31].
P net t + P pv t = P Load t + P b _ cha t + P b _ dis t
where P L o a d t , P pv t , P b _ cha t and P b _ dis t are the user’s load, PV power, charging power, and discharging power at t, respectively.

3.2.2. State of Charge (SOC) Constraint

In Equation (6), it is ensured that the SOC fluctuates within a certain range.
S O C min S O C S O C max
where S O C min and S O C max are the lower and upper limits of the SOC for energy storage. The initial SOC of energy storage was 0.2, and the maximum SOC was 0.9.

3.2.3. Power Balance Constraint SOC Continuity Constraint

The SOC changes during the charging and discharging process, and to ensure smooth operation of the system, it is necessary to constrain the change of SOC between adjacent time steps from becoming excessively large, and to avoid drastic changes of SOC in Equation (7).
S O C ( 1 ) = S O C ( t ) S O C ( t + 1 ) = S O C ( t ) + 0.95 ( P b _ c h a ( t ) + P b _ d i s ( t ) ) / E
where S O C ( t + 1 ) and S O C ( t ) are the SOC at times t + 1 and t, respectively; E is the capacity size of the ESS.

3.2.4. Charging/Discharging Power Constraint

This constraint allows the system to function without surpassing its allowed charging and discharging power limits.
0 P b _ cha t P b _ max λ b _ cha P b _ min λ b _ dis P b _ dis t 0
where P b _ min and P b _ max are the lower and upper limits of the energy storage charging and discharging power.

3.2.5. Charging/Discharging Status Flag Bit

λ b _ c h a + λ b _ d i s = 1
where λ b _ c h a and λ b _ d i s are the storage charging and discharging states and take the values 0 or 1; λ b _ c h a is 1, indicating the charging state of the energy storage, λ b _ d i s is zero, indicating the discharging state of the energy storage.

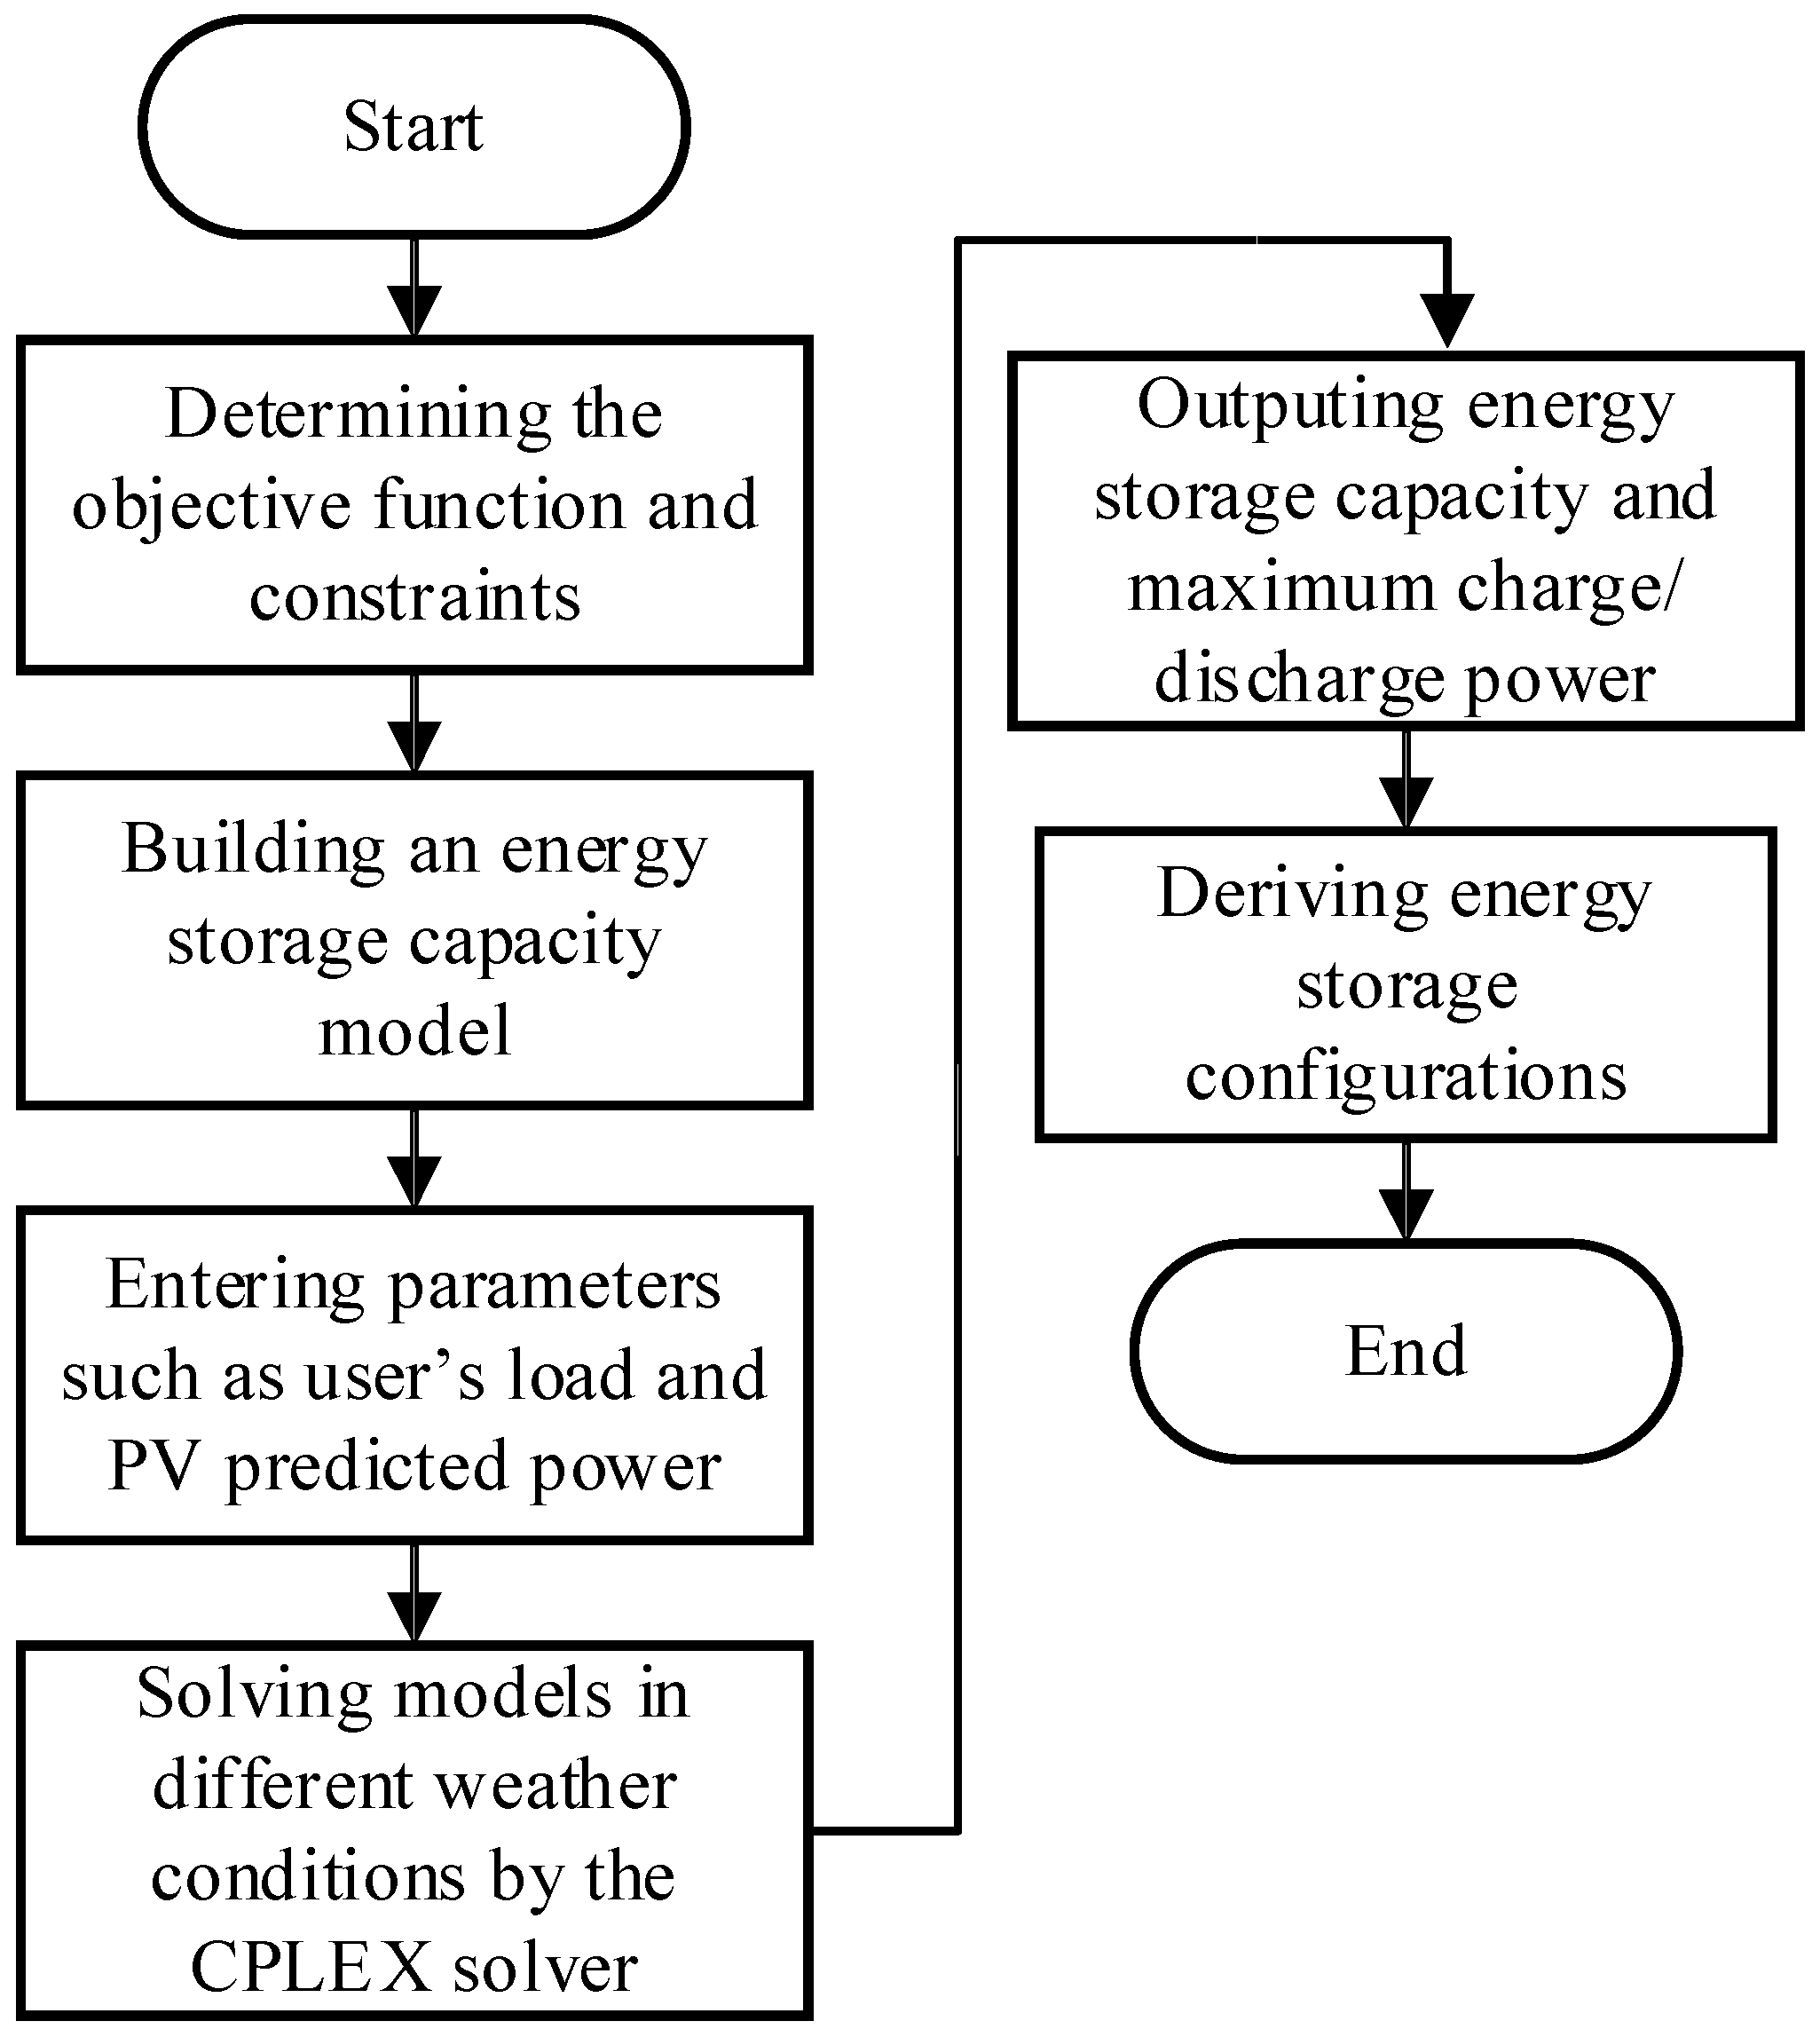
3.3. Energy Storage Configuration Process

This paper takes a comprehensive view of the user’s electricity cost, investment cost and O&M cost. It considers weather conditions as a key factor in configuring energy storage capacity, and the flow of configuration is shown in Figure 6, which mainly involves the following steps:
  • Based on the user’s load and predicted photovoltaic output, priority should be given to meeting the user load, onsite photovoltaic consumption and reducing electricity costs.
  • Determine the constraints of the ESS and establish an energy storage capacity configuration model with the sum of the electricity cost, the average daily investment cost and the daily O&M cost as the goal.
  • The configuration model is solved using CPLEX on the MATLAB platform to obtain the optimal energy storage capacity and maximum charging and discharging power under different weather conditions.
  • After analyzing the obtained results of the solution, this paper designs an ESS that meets practical needs, cooperates with PV power generation, and optimizes scheduling.

4. Optimal Scheduling Strategy for PV-ESS Integrated System

The aim of optimal scheduling PV-ESS is to find a balance between the PV generation and the demand of the load. These strategies divide the load demand into different periods and compare the demand of each time period with the capacity of the PV generation. The demand management strategy can reduce the cost by regulating energy storage and reducing peak loads of electricity. Under the TOU tariffs, the additional cost of peak load is fed back to the user in the form of demand charge or capacity charge. The configuration of the ESS on the industrial user side reduces demand/capacity charge by minimizing peak load. The peak shaving strategy focuses on the balanced regulation of peak and valley load to reduce the peak demand of the system. In order to obtain the optimal operation of the PV-ESS, this paper considers the optimization model of the PV-ESS with the objective function of minimizing the total electricity cost of the plant.

4.1. Electricity Cost Analysis

4.1.1. Electricity Tariff Cost

The electricity tariff cost is the cost of the electricity purchased in a day in addition to the PV.
C 4 = C buy t ( P L o a d t + P b _ cha t + P b _ dis t - P pv t ) Δ t
where P L o a d t , P pv t , P b _ cha t and P b _ dis t are the user’s load, charging power, discharging power and PV power at t, respectively.

4.1.2. Demand Charge

The average daily basic cost of electricity based on the highest monthly demand is as follows:
C 5 = bmax   P net t / d
where b is the unit price according to the maximum monthly demand, taken as 34.2 CNY/kW·Month., d is the number of days in a month, taken as 30.

4.1.3. Objective Function

The PV combined with ESS station is influenced by many factors. This paper considers some factors such as peak and valley price and basic price, and takes the lowest daily cost of electricity for users as the optimization target, optimizes the two-part price and volatility for users, and comes up with a daily operation and scheduling strategy for PV-ESS. The total daily cost of electricity used in the factory includes the cost of electricity and the basic cost of electricity:
M in   F 2 = C 4 + C 5

4.2. Restrictions

4.2.1. Demand Constraint

The power balance constraint and energy storage constraints of demand management strategy are the same as in Section 3.2, with the addition of a maximum demand constraint to ensure that the strategy does not exceed the demand. The combined load of PV and ESS and the user does not exceed the optimized maximum demand value:
P Load t + P b _ cha t + P b _ dis t - P pv t P d
where P d is the maximum demand.

4.2.2. Maximum Grid Power Constraint

The maximum grid power constraint ensures that the sum of load demand and generation capacity does not exceed the maximum carrying capacity of the grid to maintain stable grid operation.
P net _ max P net t P net _ max
where P net _ max is the maximum grid power.

4.3. Solution Method

In order to compare the effect of these two strategies in the optical storage scheduling, this paper presents a comparative analysis in practical applications. Within three typical days, the demand management strategy and the peak-valley arbitrage strategy are used to dispatch and control the PV power generation and storage charging and discharging, respectively. Figure 7 illustrates the flow of the optimization model. The specific process of building an optimization model for PV-ESS optimization model is as follows:
  • Based on the plant user load and PV predicted power, the objective function and constraints are determined, and the optimization objective of the PV-BESS is to minimize the total electricity cost. The PV-BESS is subject to several constraints, such as ensuring power balance, adhering to the ESS’s capacity limit, and meeting the maximum demand requirement, among other considerations.
  • Based on the objective function and constraints, an optimization model is developed.
  • Determine whether it is the new scheduling moment, if it is, execute the next step, otherwise execute the original scheduling policy.
  • Utilizing the specified objective function and constraints, the CPLEX solver is employed to solve the model and optimize the charging and discharging power of the ESS. This process yields scheduling results for various weather conditions.
  • After analyzing the results obtained from solving the model, the PV-BESS scheduling strategy is designed to meet the actual demand in order to reduce load fluctuations, lower electricity costs, and improve the cost-effectiveness for plant users.

5. Application Case Study

5.1. User Profile

The load profile of a factory customer in Xiamen was selected for testing purposes, which had an installed capacity of 315 kVA transformer and a PV installed capacity of 309.32 kWp to verify the validity of the model. The actual situation of the plant is shown in Figure 8. An aerial photograph of the factory is shown in Figure 8a. The meteorological instrument was installed on the roof of the office building near the factory as shown in Figure 8b. The load of April is taken as a typical month, and three typical days with different weather conditions are selected for the study, whose typical daily load conditions are shown in Figure 9.
For large industrial users, the regional TOU electricity tariff is displayed in Figure 10. Each time period is divided into: peak hours (11:00–12:00, 17:00–18:00), peak hours (10:00–11:00, 15:00–17:00, 18:00–20:00, 21:00–22:00), normal hours (8:00–10:00, 12:00–15:00, 18:00–20:00), and valley hours (0:00–8:00, 20:00–21:00, 22:00–24:00). The corresponding tariffs for each period are 0.9470, 0.8594, 0.5964 and 0.3333 CNY/kWh.

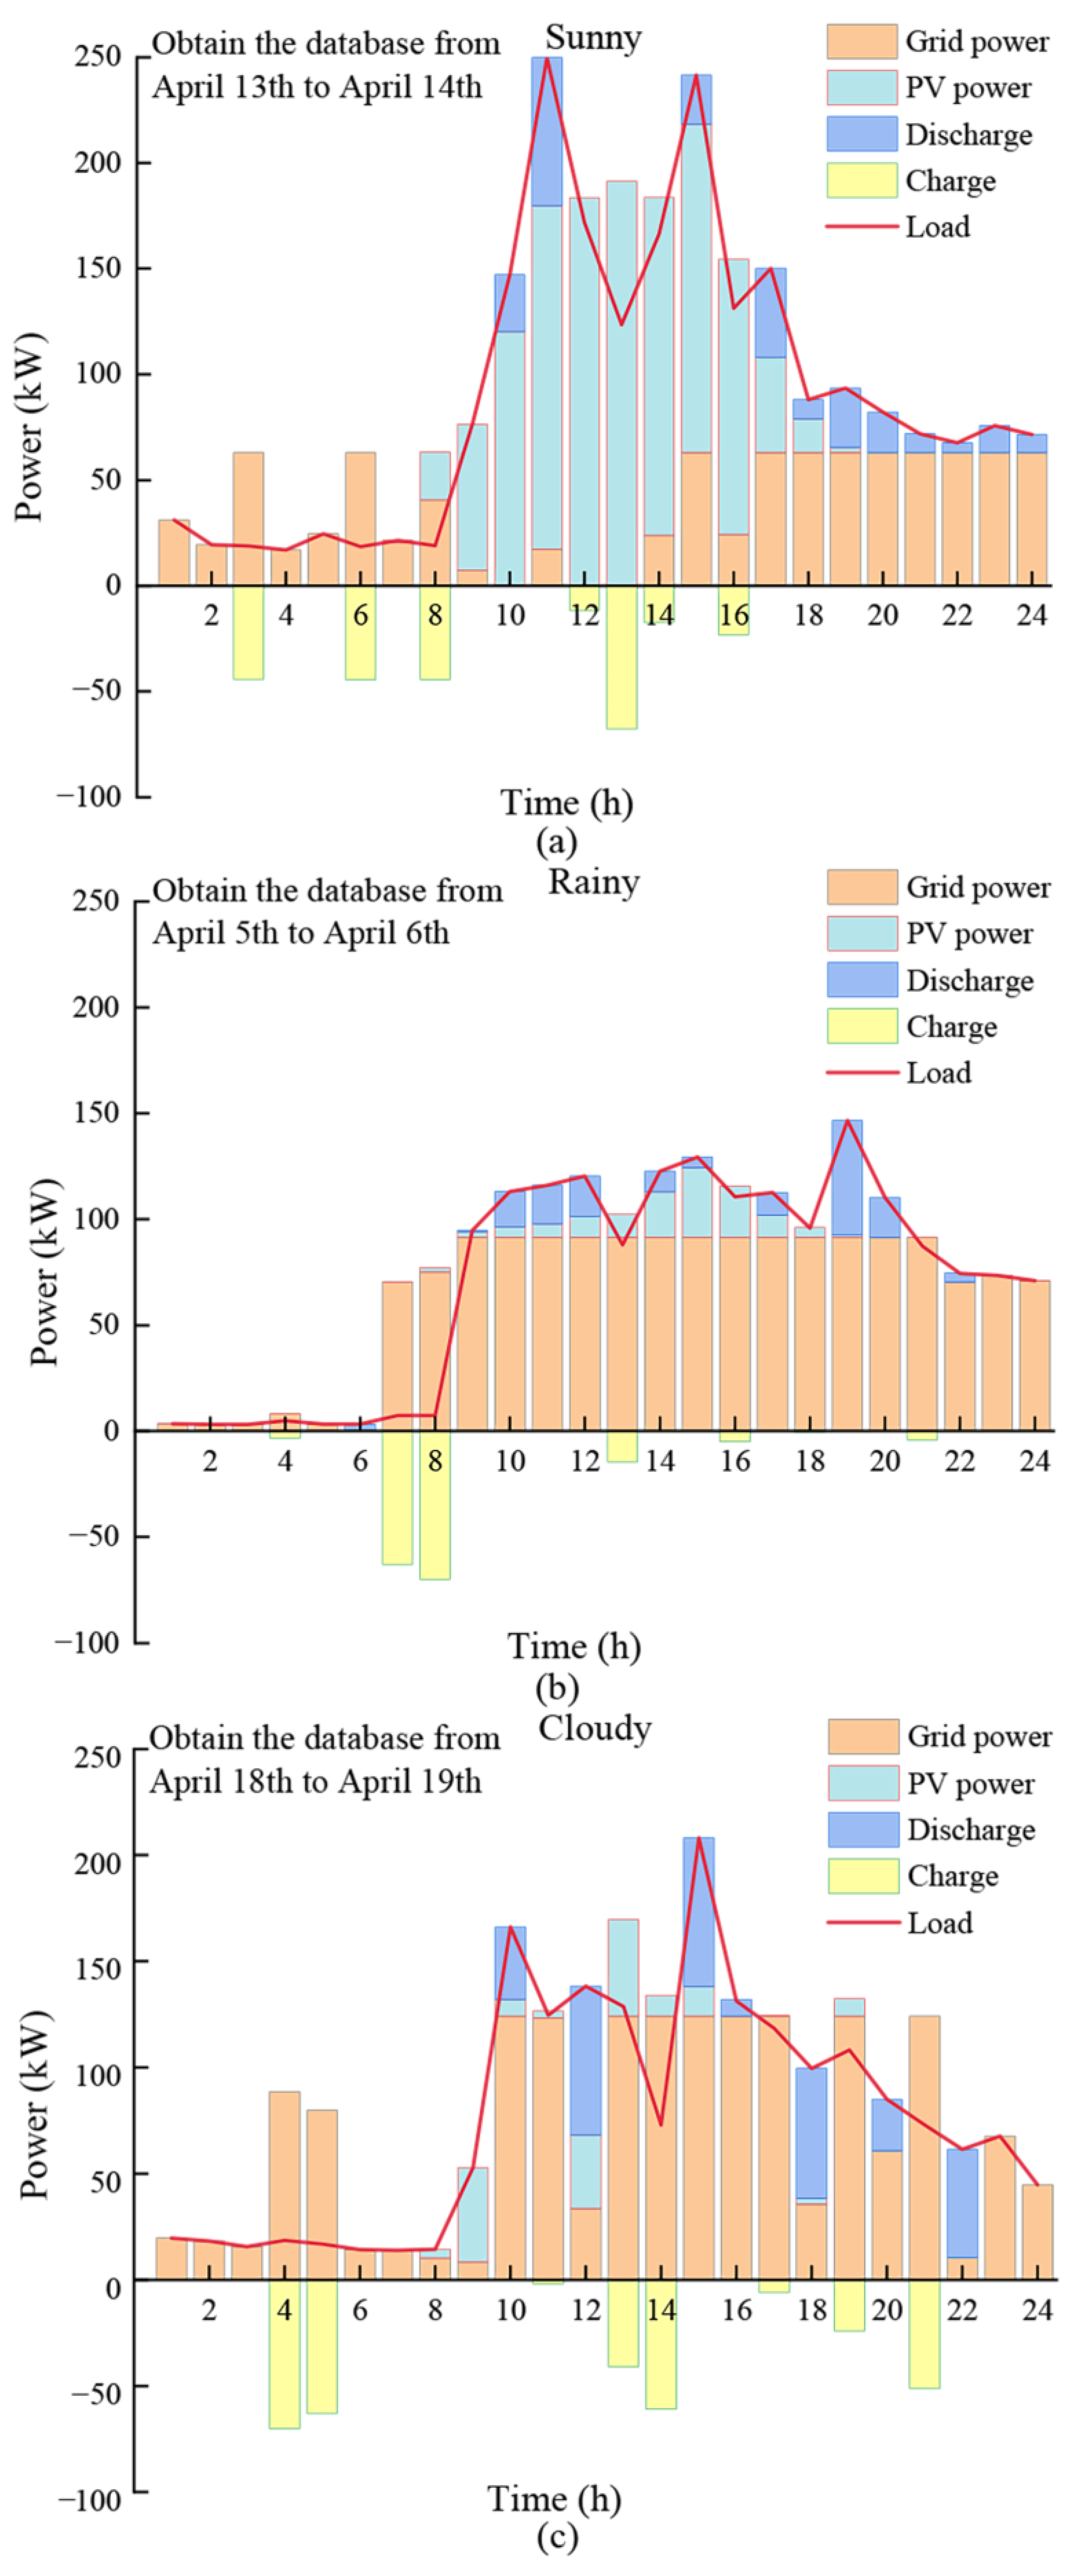
5.2. Analysis of Application Results

The capacity configuration of the ESS is calculated with the user’s historical data, and the optimal storage capacity and maximum charging and discharging power under three weather conditions are analyzed, with the outcomes of the configuration shown in Table 3.
As analyzed in Table 3, during sunny days, the PV output is large, and the required storage capacity and charging/discharging power are small. In cloudy and rainy weather, the PV output is small, requiring the installation of ESS with a larger capacity. It is necessary to determine the amount of energy storage based on the frequency of weather conditions in order to ensure that the customer’s load does not exceed the power demand limit. It is assumed that the three weather types have the same incidence and the average storage capacity required is calculated to be 187.2 kWh.
The site is located in an area where rainy weather is more frequent, considering the increased demand for energy storage on rainy days and the lower maximum power on sunny days, while being able to accommodate higher charging and discharging demands for energy generation. In summary, the configuration of energy storage capacity is 190 kWh, the maximum charge and discharge power is 70 kW. This can take into account the load demand under different weather conditions, but also avoids unnecessary investment caused by excessive capacity.
Based on the outcomes obtained from the configuration process, the optimal scheduling was carried out under three different weather conditions. The scheduling optimization results of the peak-valley arbitrage strategy and demand management strategy under different weather conditions are shown in Figure 11 and Figure 12.
Referring to Figure 11 and Figure 12, the corresponding data from the database for different date ranges are from the April 13th to April 14th (a), April 5th to April 6th (b), and April 18th to April 19th (c), respectively.
As shown in Figure 11, the charging and discharging of the ESS are roughly similar whether the weather conditions are sunny, cloudy, or rainy. Charging during the valley hours of low demand and then releasing power during the peak hours of large demand is a common mode of operation.
Figure 12 illustrates that the ESS may act at various times in order to reduce the overall load fluctuations. From the time when the demand for electricity starts to increase gradually, the ESS starts to discharge. This strategy is not only limited to the peak hours, but is also enacted during the usual hours.
According to the analysis in Figure 11 and Figure 12, under sunny condition, the ESS can be charged due to the surplus power of the PV power generation between 12:00 and 13:00. However, under cloudy and rainy conditions, the PV power decreases and the ESS is recharged by purchasing power from the grid during the time period from 13:00 to 15:00 in order to satisfy the power demand of the second peak hour. Under the peak-valley arbitrage strategy (e.g., Figure 11), renewable energy is maximized through arbitrage operations. And under the demand management strategy (e.g., Figure 12), the ESS is operated more frequently under cloudy and rainy conditions than under sunny condition to adapt to different weather conditions and power demand.
According to the above scheduling results, the variations in the SOC curve during the execution of the peak-valley arbitrage strategy and demand management strategy are shown in Figure 13 and Figure 14. The fluctuation of the SOC curve reflects the process of charging the battery during high tariff hours and discharging it during low tariff hours.
Figure 13 shows that the SOC curve fluctuates over a wide range and is primarily used to store electricity for usage during high tariff hours, thus generating a profit. It can be seen that the reason why the SOC of the ESS in Figure 13a does not drop to 0.2 after discharging during the first peak hour compared to Figure 13b,c is that the PV power is large and there is surplus available to charge the ESS, which is validated with the scheduling results in Figure 11. And Figure 14 displays the SOC curve with less fluctuation. The ESS is not limited to reducing load peak during peak hours to smooth out load fluctuation. So the charging and discharging frequency of the ESS in Figure 14a–c may be related to the load and PV power on that day.
From the analysis, the peak load and the optimized grid power exchange peak are derived from the two strategies under the three typical weather conditions, as shown in Table 4 and Table 5.
Under the peak-valley arbitrage control strategy, the cost of tariff for different typical days with different weather are CNY 536.63, CNY 1027.70 and CNY 1042.15, respectively, with a difference of no more than 100 CNY. Considering the cost of tariff for different typical days under the demand management strategy is CNY 573.75, CNY 1095.23 and CNY 1081.13, respectively. It can be seen that the cost of tariff under the consideration of demand management will be slightly more expensive than that of the single peak-shaving and valley-filling, and the maximum demand for the month under the two strategies is 194.09 kW and 124.09 kW, respectively, with a difference of CNY 2394 in the base tariffs.
With the access of user-side storage, under the peak-valley arbitrage control strategy, it can be seen that the charging and discharging of ESS is relatively disordered, and the optimized demand increases instead, which can lead to premature charging and discharging of ESS and inefficiency of ESS.
In summary, considering demand management strategies under different weather conditions and the stochastic nature of energy storage allows for more flexible optimization of energy utilization in optical storage systems. The ESS is no longer limited only to the peak hours of electricity prices, but the energy is stored and released at any time according to the actual situation, so as to meet the power demand more efficiently.

6. Conclusions

In this paper, an optimal model of user-side energy storage considering weather factors is established. The PSO-BP neural network is proposed to predict PV power under different weather conditions. The storage capacity of the PV-ESS is calculated by considering the daily electricity cost, daily storage investment cost and operation cost. Furthermore, a factory in Xiamen is used as an application scenario to verify the PV-ESS optimization model. The proposed two PV-ESS scheduling strategies are compared under three weather conditions. In the demand management strategy, the ESS can flexibly respond to different weather conditions and load demand changes, and effectively reduce the cost of electricity for users. The configuration considers different weather characteristics, which improves the system’s adaptability to weather changes and helps achieve better scheduling strategies. In the technical-economic comparison, the demand management scheduling bears a lower cost in terms of demand charge, and its demand charge is roughly CNY 2000 lower than the arbitrage control strategy.
Two issues remain for future work: charge/discharge cycles could have a significant impact on the battery degradation, so as to affect the long-term dispatch and economics of the system. Due to the limit of the computation scale, only 24 h rather than a longer time period was selected as a time horizon for the optimized scheduling. Additionally, although the current capacity allocation methodology focuses on three weather conditions within a month; it is also important to consider the energy implications of seasonal and annual variations. Future work should take these factors into account, not just to achieve efficient energy use over time, but to move toward capacity allocation based upon a broader range of annual weather variability.

Author Contributions

Methodology, Z.Z., T.L. and J.S.; software, Z.Z. and T.L.; writing—original draft preparation, Z.Z.; writing—review and editing, T.L.; supervision, J.S. and L.S. All authors have read and agreed to the published version of the manuscript.

Funding

This research was funded by Xiamen University of Technology scientific research project, Research on key technology of “source-network-load” electric-carbon coupling optimized operation in active distribution networks, grant number YKJ22020R and the Natural Science Foundation of Fujian Province, China (Grant No. 2022J05284), Research on key technologies of intelligent diagnosis and monitoring considering distributed photovoltaic generation.

Data Availability Statement

No new data were created in this research.

Conflicts of Interest

The authors declare no conflict of interest.

References

  1. Torres-Moreno, J.L.; Gimenez-Fernandez, A.; Perez-Garcia, M.; Rodriguez, F. Energy Management Strategy for Micro-Grids with PV-Battery Systems and Electric Vehicles. Energies 2018, 11, 522. [Google Scholar] [CrossRef]
  2. Nazari, A.A.; Keypour, R. A two-stage stochastic model for energy storage planning in a microgrid incorporating bilateral contracts and demand response program. J. Energy Storage 2019, 21, 281–294. [Google Scholar] [CrossRef]
  3. Sharma, P.; Mathur, H.D.; Mishra, P.; Bansal, R.C. A critical and comparative review of energy management strategies for microgrids. Appl. Energy 2022, 327, 120028. [Google Scholar] [CrossRef]
  4. Roberts, M.B.; Bruce, A.; MacGill, I. Impact of shared battery energy storage systems on photovoltaic self-consumption and electricity bills in apartment buildings. Appl. Energy 2019, 245, 78–95. [Google Scholar] [CrossRef]
  5. Liu, L.; Zhao, Y.; Chang, D.; Xie, J.; Ma, Z.; Sun, Q.; Yin, H.; Wennersten, R. Prediction of short-term PV power output and uncertainty analysis. Appl. Energy 2018, 228, 700–711. [Google Scholar] [CrossRef]
  6. Rana, M.M.; Uddin, M.; Sarkar, M.R.; Shafiullah, G.M.; Mo, H.; Atef, M. A review on hybrid photovoltaic–Battery energy storage system: Current status, challenges, and future directions. J. Energy Storage 2022, 51, 104597. [Google Scholar] [CrossRef]
  7. Hongxia, L.; Jianlin, L.; Yang, M. Summary of research on new energy side energy storage optimization configuration technology. Energy Storage Sci. Technol. 2022, 11, 3257. [Google Scholar]
  8. Xu, G.; Cheng, H.; Ma, Z.; Fan, S.; Fang, S.; Ma, Z. Overview of ESS planning methods for alleviating peak-shaving pressure of grid. Electr. Power Autom. Equip. 2017, 37, 3–11. [Google Scholar]
  9. Mitali, J.; Dhinakaran, S.; Mohamad, A. Energy storage systems: A review. Energy Storage Sav. 2022, 1, 166–216. [Google Scholar] [CrossRef]
  10. Ralon, P.; Taylor, M.; Ilas, A.; Diaz-Bone, H.; Kairies, K. Electricity Storage and Renewables: Costs and Markets to 2030; International Renewable Energy Agency: Abu Dhabi, United Arab Emirates, 2017; Volume 164. [Google Scholar]
  11. Li, X.; Ma, H.; Jiang, Q. Review of energy storage configuration technology on renewable energy side. Electr. Power 2022, 55, 13–25. [Google Scholar]
  12. Zheng, Q.; Jiang, L.; Xu, Y.; Gao, S.; Liu, T.; Qu, C.; Chen, H.; Li, X. Research progress and development suggestions of energy storage technology under background of carbon peak and carbon neutrality. Bull. Chin. Acad. Sci. 2022, 37, 529–540. [Google Scholar]
  13. Kou, L.; Zhang, Y.; Ji, Y.; Wu, M.; Xiong, X.; Hu, C. Typical application scenario and operation mode analysis of distributed energy storage. Power Syst. Prot. Control 2020, 48, 177–187. [Google Scholar]
  14. Mignoni, N.; Scarabaggio, P.; Carli, R.; Dotoli, M. Control frameworks for transactive energy storage services in energy communities. Control Eng. Pract. 2023, 130, 105364. [Google Scholar] [CrossRef]
  15. Jeong, H.C.; Jung, J.; Kang, B.O. Development of Operational Strategies of Energy Storage System Using Classification of Customer Load Profiles under Time-of-Use Tariffs in South Korea. Energies 2020, 13, 1723. [Google Scholar] [CrossRef]
  16. Li, Y.; Wang, H.; Zhang, Z.; Li, H.; Wang, X.; Zhang, Q.; Zhou, T.; Zhang, P.; Chang, F. Optimal Scheduling of the Wind-Photovoltaic-Energy Storage Multi-Energy Complementary System Considering Battery Service Life. Energies 2023, 16, 5002. [Google Scholar] [CrossRef]
  17. Wang, H.; Wu, X.; Sun, K.; Du, X.; He, Y.; Li, K. Economic Dispatch Optimization of a Microgrid with Wind–Photovoltaic-Load-Storage in Multiple Scenarios. Energies 2023, 16, 3955. [Google Scholar]
  18. Nazir, M.S.; Abdalla, A.N.; Wang, Y.; Chu, Z.; Jie, J.; Tian, P.; Jiang, M.; Khan, I.; Sanjeevikumar, P.; Tang, Y. Optimization configuration of energy storage capacity based on the microgrid reliable output power. J. Energy Storage 2020, 32, 101866. [Google Scholar] [CrossRef]
  19. Wu, Y.-K.; Huang, C.-L.; Phan, Q.-T.; Li, Y.-Y. Completed review of various solar power forecasting techniques considering different viewpoints. Energies 2022, 15, 3320. [Google Scholar] [CrossRef]
  20. Ahmed, R.; Sreeram, V.; Mishra, Y.; Arif, M.D.; Kazmerski, L. A review and evaluation of the state-of-the-art in PV solar power forecasting: Techniques and optimization. Renew. Sustain. Energy Rev. 2020, 124, 109792. [Google Scholar] [CrossRef]
  21. Li, L.-L.; Wen, S.-Y.; Tseng, M.-L.; Wang, C.-S. Renewable energy prediction: A novel short-term prediction model of photovoltaic output power. J. Clean. Prod. 2019, 228, 359–375. [Google Scholar] [CrossRef]
  22. Das, U.K.; Tey, K.S.; Seyedmahmoudian, M.; Mekhilef, S.; Idris, M.Y.I.; Van Deventer, W.; Horan, B.; Stojcevski, A. Forecasting of photovoltaic power generation and model optimization: A review. Renew. Sustain. Energy Rev. 2018, 81, 912–928. [Google Scholar] [CrossRef]
  23. Niu, D.; Wang, Y.; Wu, D.D. Power load forecasting using support vector machine and ant colony optimization. Expert Syst. Appl. 2010, 37, 2531–2539. [Google Scholar] [CrossRef]
  24. Liu, L.; Liu, D.; Sun, Q.; Li, H.; Wennersten, R. Forecasting power output of photovoltaic system using a BP network method. Energy Procedia 2017, 142, 780–786. [Google Scholar] [CrossRef]
  25. Yang, D.-W.; Li, H.-R.; Xiang, W.-D.; Ren, Z.; Li, Z.-W. Power transformer fault diagnosis based on improved PSO-BP hybrid algorithm. J. Electr. Power Sci. Technol. 2011, 26, 99–103. [Google Scholar]
  26. Wang, D.; Yue, C.; ElAmraoui, A. Multi-step-ahead electricity load forecasting using a novel hybrid architecture with decomposition-based error correction strategy. Chaos Solitons Fractals 2021, 152, 111453. [Google Scholar] [CrossRef]
  27. Elsheikh, A.H.; Sharshir, S.W.; Abd Elaziz, M.; Kabeel, A.E.; Guilan, W.; Haiou, Z. Modeling of solar energy systems using artificial neural network: A comprehensive review. Sol. Energy 2019, 180, 622–639. [Google Scholar] [CrossRef]
  28. Jobayer, M.; Shaikat, M.A.H.; Rashid, M.N.; Hasan, M.R. A systematic review on predicting PV system parameters using machine learning. Heliyon 2023, 9, e16815. [Google Scholar] [CrossRef]
  29. Teferra, D.M.; Ngoo, L.M.; Nyakoe, G.N. Fuzzy-based prediction of solar PV and wind power generation for microgrid modeling using particle swarm optimization. Heliyon 2023, 9, e12802. [Google Scholar] [CrossRef]
  30. Li, L.; Xu, Q.; Wang, X.; Ling, J.; Sun, H. Optimal Economic Scheduling of Industrial Customers on the Basis of Sharing Energy-Storage Station. Electr. Power Constr. 2020, 41, 100–107. [Google Scholar]
  31. Venkatesan, K.; Govindarajan, U. Optimal power flow control of hybrid renewable energy system with energy storage: A WOANN strategy. J. Renew. Sustain. Energy 2019, 11, 015501. [Google Scholar] [CrossRef]
Figure 1. Photovoltaic power forecasting flow chart.
Energies 16 07079 g001
Figure 2. User interface.
Energies 16 07079 g002
Figure 3. Environmental monitoring interface.
Energies 16 07079 g003
Figure 4. Comparison of PV power generation and irradiance curves across various weather conditions.
Energies 16 07079 g004
Figure 5. Three typical daily predicted power measurements.
Energies 16 07079 g005
Figure 6. Energy storage configuration flow chart.
Energies 16 07079 g006
Figure 7. Optimal scheduling flow chart of optical storage.
Energies 16 07079 g007
Figure 8. The facilities of the factory: (a) Aerial map of the factory; (b) Meteorological Instrument.
Energies 16 07079 g008
Figure 9. Typical Power Consumption Curves at User End.
Energies 16 07079 g009
Figure 10. TOU electricity tariff.
Energies 16 07079 g010
Figure 11. Optimization results based on peak-valley arbitrage control strategy: (a) Optimization results for sunny day; (b) Optimization results for rainy day; (c) Optimization results for cloudy day.
Energies 16 07079 g011
Figure 12. Optimization results based on demand management strategy: (a) Optimization results for the sunny day; (b) Optimization results for the rainy day; (c) Optimization results for the cloudy day.
Energies 16 07079 g012
Figure 13. SOC results based on peak-valley arbitrage control strategy.
Energies 16 07079 g013
Figure 14. SOC results based on demand management strategy.
Energies 16 07079 g014
Table 1. Computation flowchart for optimization of PV-ESS integrated system.
Optimization of PV-ESS integrated system
Basic data for PV power prediction:
Temperature, Humidity, Irradiance, Actual PV power.
Obtaining the predicted PV power ( P pv t ) by using PSO-BP neural network algorithm
Capacity configuration and optimized scheduling data input:{ P Load t , P pv t , t a r i f f }
Solving the optimization problem by CPLEX solver
Output: the capacity configuration of the ESS and charging/discharging power
The extra inputs: {the capacity, the charging/discharging power, P d }
Solving the optimization problem by CPLEX solver
Outputs: the optimized results
Table 2. Definitions of measures.
MeasureFormulaJudgment
R 2 R 2 = 1 i ( y ^ i y i ) 2 i ( y ¯ i y i ) 2 The higher its value is, the better it is.
Range: [0, 1]
RMSE R M S E = 1 m i = 1 m ( y ^ i y i ) 2 The larger the error, the larger the value
MAPE M A P E = 100 % m i = 1 m y ^ i y i y i
where y ^ i is the predicted value; y i is the actual value; y ¯ i is the mean value.
Table 3. Energy storage configuration results.
Weather ConditionsCapacity/kWhMaximum Charge/
Discharge Power/kW
Sunny108.8167.77
Rainy204.7868.09
Cloudy248.0382.47
Table 4. Optimization results of peak-valley arbitrage control strategy.
Weather
Conditions
Peak Load/kWGrid Power/kWEnergy Charge/CNYDemand Charge/CNYTotal Charge/CNY
Sunny249.80139.42536.636637.887174.51
Rainy208.06194.091027.706637.887665.58
Cloudy146.70171.241042.156637.887680.03
Table 5. Optimization results of demand management strategy.
Weather
Conditions
Peak Load/kWGrid Power/kWEnergy Charge/CNYDemand Charge/CNYTotal Charge/CNY
Sunny249.8063.01573.754243.884817.63
Rainy208.06124.091095.234243.885339.11
Cloudy146.7091.411081.134243.885325.01
Disclaimer/Publisher’s Note: The statements, opinions and data contained in all publications are solely those of the individual author(s) and contributor(s) and not of MDPI and/or the editor(s). MDPI and/or the editor(s) disclaim responsibility for any injury to people or property resulting from any ideas, methods, instructions or products referred to in the content.

