1. Introduction
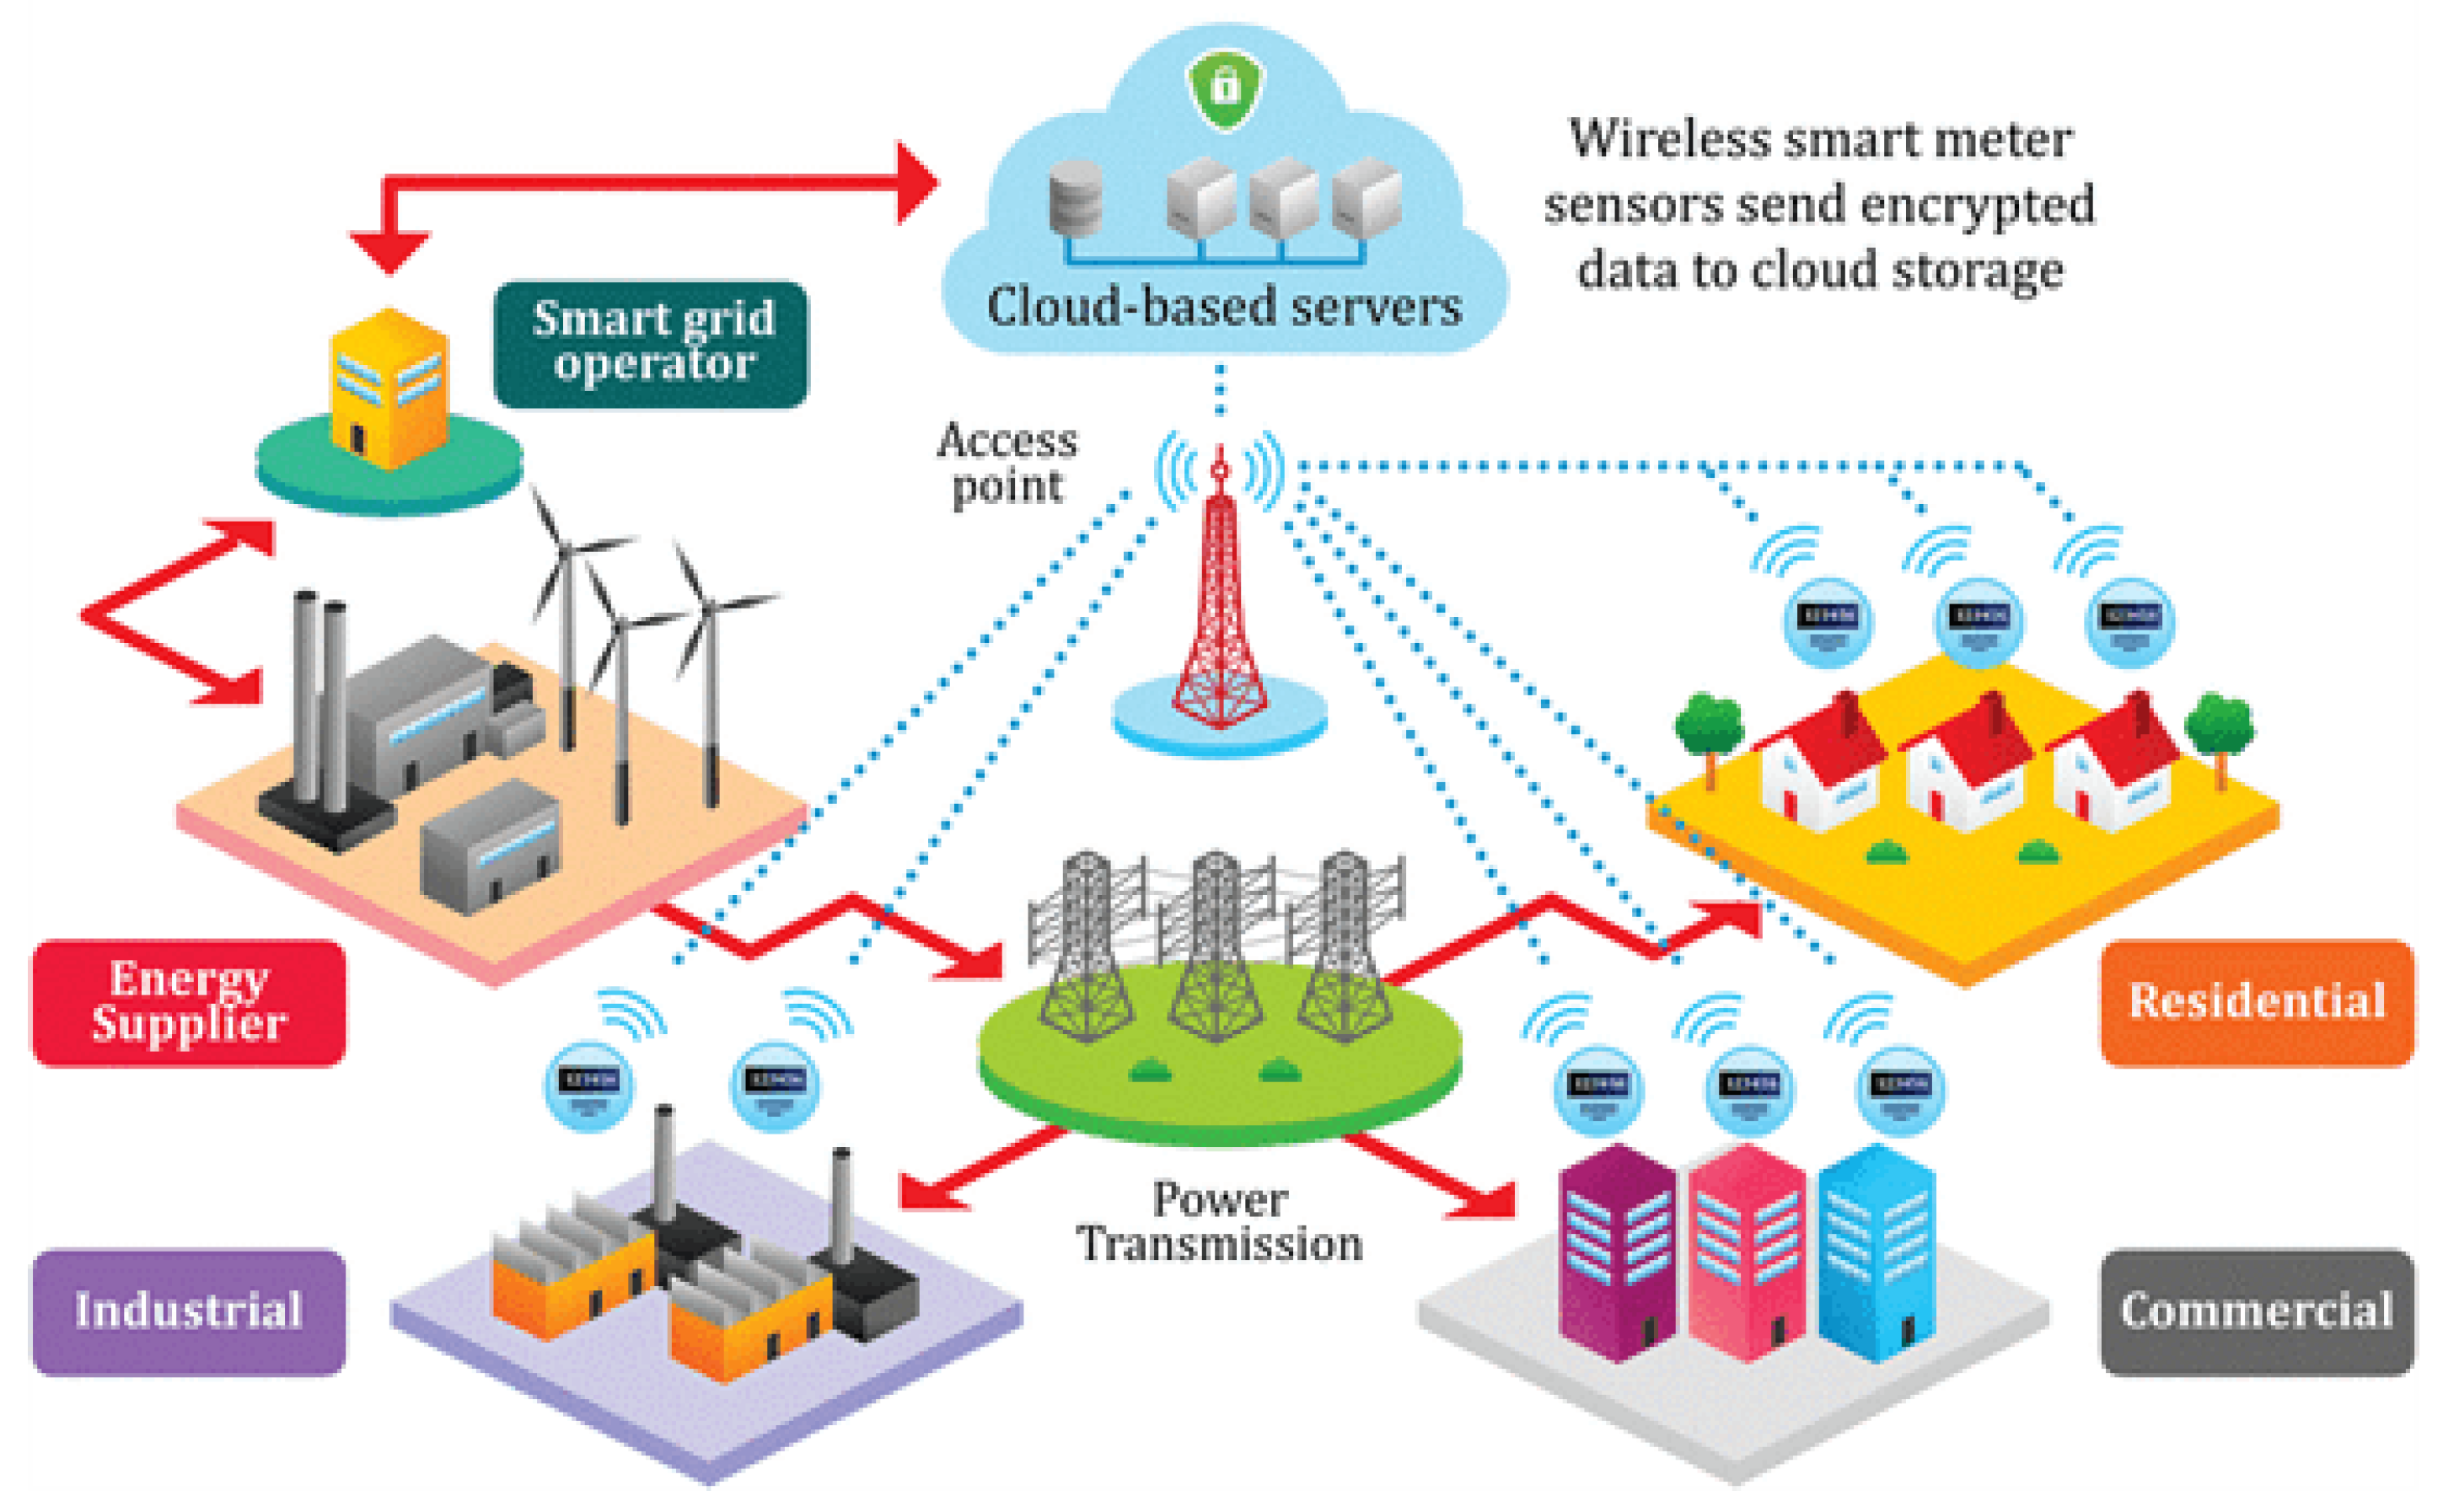
The concept of smart grids (SGs) aims to revolutionize the energy sector by facilitating intelligent monitoring, control, and management of power generation and distribution. With the advancement of smart metering technologies, an enormous amount of energy consumption data is being generated and collected at unprecedented scales. These data can be used for smart management of energy generation, load forecasting and billing using dynamic tariffs as well. However, this vast volume of data has also brought significant challenges, particularly in the detection and prevention of electricity theft, a growing concern for energy providers worldwide [
1].
The idea is that malicious consumers may tamper with their smart meters (SMs) to report false power consumption readings to reduce their electrical bills. The false data not only leads to substantial financial losses for the electrical utility companies, but they also pose a significant threat to the performance and stability of the
SGs because they can cause suboptimal energy management decisions. Traditional detection methods have struggled to keep pace with the sophisticated techniques employed by perpetrators, necessitating more advanced and intelligent solutions [
2,
3]. The current advancement in artificial intelligence (
AI) and big data technologies and the possibility of seamless integration of them have opened up new avenues for remarkable advancements in electricity theft detection (
ETD) within the
SG environment. The marriage of
AI techniques with big data technologies enables the efficient processing, storage, and analysis of massive volumes of energy-consumption data [
4]. This powerful synergy empowers utilities with real-time insights to combat theft with unparalleled effectiveness and precision [
5].
Smart meters provide an abundance of energy consumption data, encouraging researchers to introduce machine learning (
ML) models for the detection of electricity theft [
6,
7]. These
ML-based detectors encompass both supervised classifiers and anomaly detectors, aiming to accurately identify instances of suspicious electricity usage patterns [
8]. Supervised classifiers utilize both benign and malicious energy consumption profiles of customers during training. However, they have a limitation, heavily relying on the availability of both benign and malicious samples in customers’ energy consumption data for effective training. This condition poses challenges, particularly in case of new attacks. Consequently, in such cases, supervised classifiers are not practical choices, as their detection capability is confined to the attacks they have been trained on (seen attacks) only [
9], and their detection accuracy significantly degrades when new attacks are launched.
In contrast, unsupervised (or anomaly) detectors exclusively use benign data for training to learn legitimate customer consumption patterns [
10]. During testing, these detectors identify false power consumption readings by detecting deviations from the learned benign power consumption patterns. The key advantage of unsupervised detectors over the supervised ones lies in their ability to detect new attacks because unlike supervised learning detectors that are trained on the false data of specific attacks, the unsupervised learning detectors are trained only on benign data and thus any deviations from the benign patterns are indicators for false data [
11,
12]. However, most of the existing unsupervised anomaly detectors suffer from low detection accuracy and high false alarm. Specifically, they suffer from several limitations that result in low detection accuracy. These include: (1) shallow-architecture based unsupervised detectors struggle with capturing temporal correlations of the power consumption readings; (2) other detectors need knowledge on the malicious data to compute detection threshold that can achieve high detection accuracy; and (3) unsupervised detectors struggle in addressing the class overlapping issue posed by some deceptive attacks. To address these limitations, this paper presents a deep support vector data description (
DSVDD) based unsupervised detector for false data in smart grid.
Initially, time-series
SM readings are transformed into images (RGB and grayscale). The model is then exclusively trained on benign images.
DSVDD has emerged as a promising one-class deep learning (
DL) approach [
13]. It trains a deep neural network while also optimizing a hypersphere encapsulating the data in the output space. This unique approach allows
DSVDD to extract shared factors of variation from the benign data, ultimately utilizing these benign samples to construct a hypersphere feature space that serves as an effective detection threshold. Because
DSVDD leverages
DL, it can learn the inherent characteristics of legitimate energy consumption patterns and accurately identifies deviations caused by fraudulent activities.
Additionally, we investigate how to address the challenge of overlapping data and empower electrical utilities to combat electricity theft with greater precision, efficiency, and scalability. To achieve this, we employ DSVDD, which effectively reduces the span of benign data within the feature space, addressing the issue of class overlapping. We also utilize the likelihood metric to fit the probability distribution of benign data within the feature space. By addressing the issue of the overlap of benign and malicious data, caused by deceptive attacks, and developing an accurate detector that is not trained on specific attacks, our goal is to contribute to the development of robust and secure SG systems capable of effectively mitigating the adverse impacts of electricity theft.
The primary contributions of this paper can be outlined as follows:
We create and propose utilizing an image-based dataset for our detector. To achieve this, we leverage the Irish Smart Energy Trial (
ISET) dataset [
14], which was initially captured in a time series format and stored as a .csv file. By converting the
SM readings into image representations, both RGB and grayscale, we aim to enhance the effectiveness of electricity theft detection. Additionally, we can take advantage of the significant advancements in the field of computer vision and
DL, which have demonstrated remarkable progress when applied to image-based datasets.
Given the availability of only benign data for power consumption readings, our objective is to build a robust one-class classifier that can accurately classify data, even in the presence of overlapping classes. To achieve this, we first investigate a One Class DSVDD (OC-DSVDD)-based scheme to reduce the span of benign data within the feature space, addressing the issue of class overlapping. Then, we investigate using DSVDD with one-class support vector machine (OC-SVM) to leverage the decision boundary created by OC-SVM for detecting malicious data and providing a decision. Concurrently, we utilize the reduced span characteristics generated by DSVDD to address the issue of class overlap. Finally, we investigate using DSVDD with Gaussian Mixture Model (GMM) to fit the probability distribution after reducing the span of benign data within the feature space using the likelihood metric. The likelihood, derived from GMM, serves as an anomaly score, allowing for the identification of malicious samples as they exhibit lower likelihood values.
Extensive experiments have been conducted to evaluate our detector and compare it to the state-of-the-art detectors. The results demonstrate that the performance of our DSVDD with GMM is superior in terms of accuracy, precision, recall, F1 score, and Area Under the Curve (AUC).
The subsequent sections of this article are organized as follows.
Section 2 offers an inclusive overview of various
ETD techniques, encompassing both supervised and unsupervised models.
Section 3 delves into data preparation, including energy consumption profiles, along with the conversion of the dataset from its time series format into RGB and grayscale images. Moving on,
Section 4 furnishes essential preliminaries, including key concepts such as autoencoders, one-class classification,
OC-SVM,
SVDD,
DSVDD, and
GMM. In
Section 5, the architecture of the proposed
DSVDD-based schemes is presented. Subsequently,
Section 6 showcases the results of the conducted experiments. Lastly,
Section 7 offers a conclusive summary to round off this article.
3. Data Preparation
In this section, we present the electricity consumption data that has been employed for the training and testing of the investigated detectors. Anomaly detectors are exclusively trained on benign dataset, and subsequently tested on both benign and malicious datasets, while supervised classifiers are trained and tested using both benign and malicious datasets. The dataset utilized in our study comprises real electricity consumption samples obtained from the ISET [
14]. In addition to this benign data, we have generated malicious samples using six different attack functions introduced in [
16,
43] and widely used in the literature. The malicious dataset is used only for evaluation purpose and it is not needed at all to compute the detector.
The ISET dataset encompasses data obtained from
SMs installed in approximately 3600 residential units. These meters record electricity consumption every 30 min over a span of 536 days. This results in approximately 25,728 readings per customer, providing an ample amount of data for training and testing our electricity theft detectors.
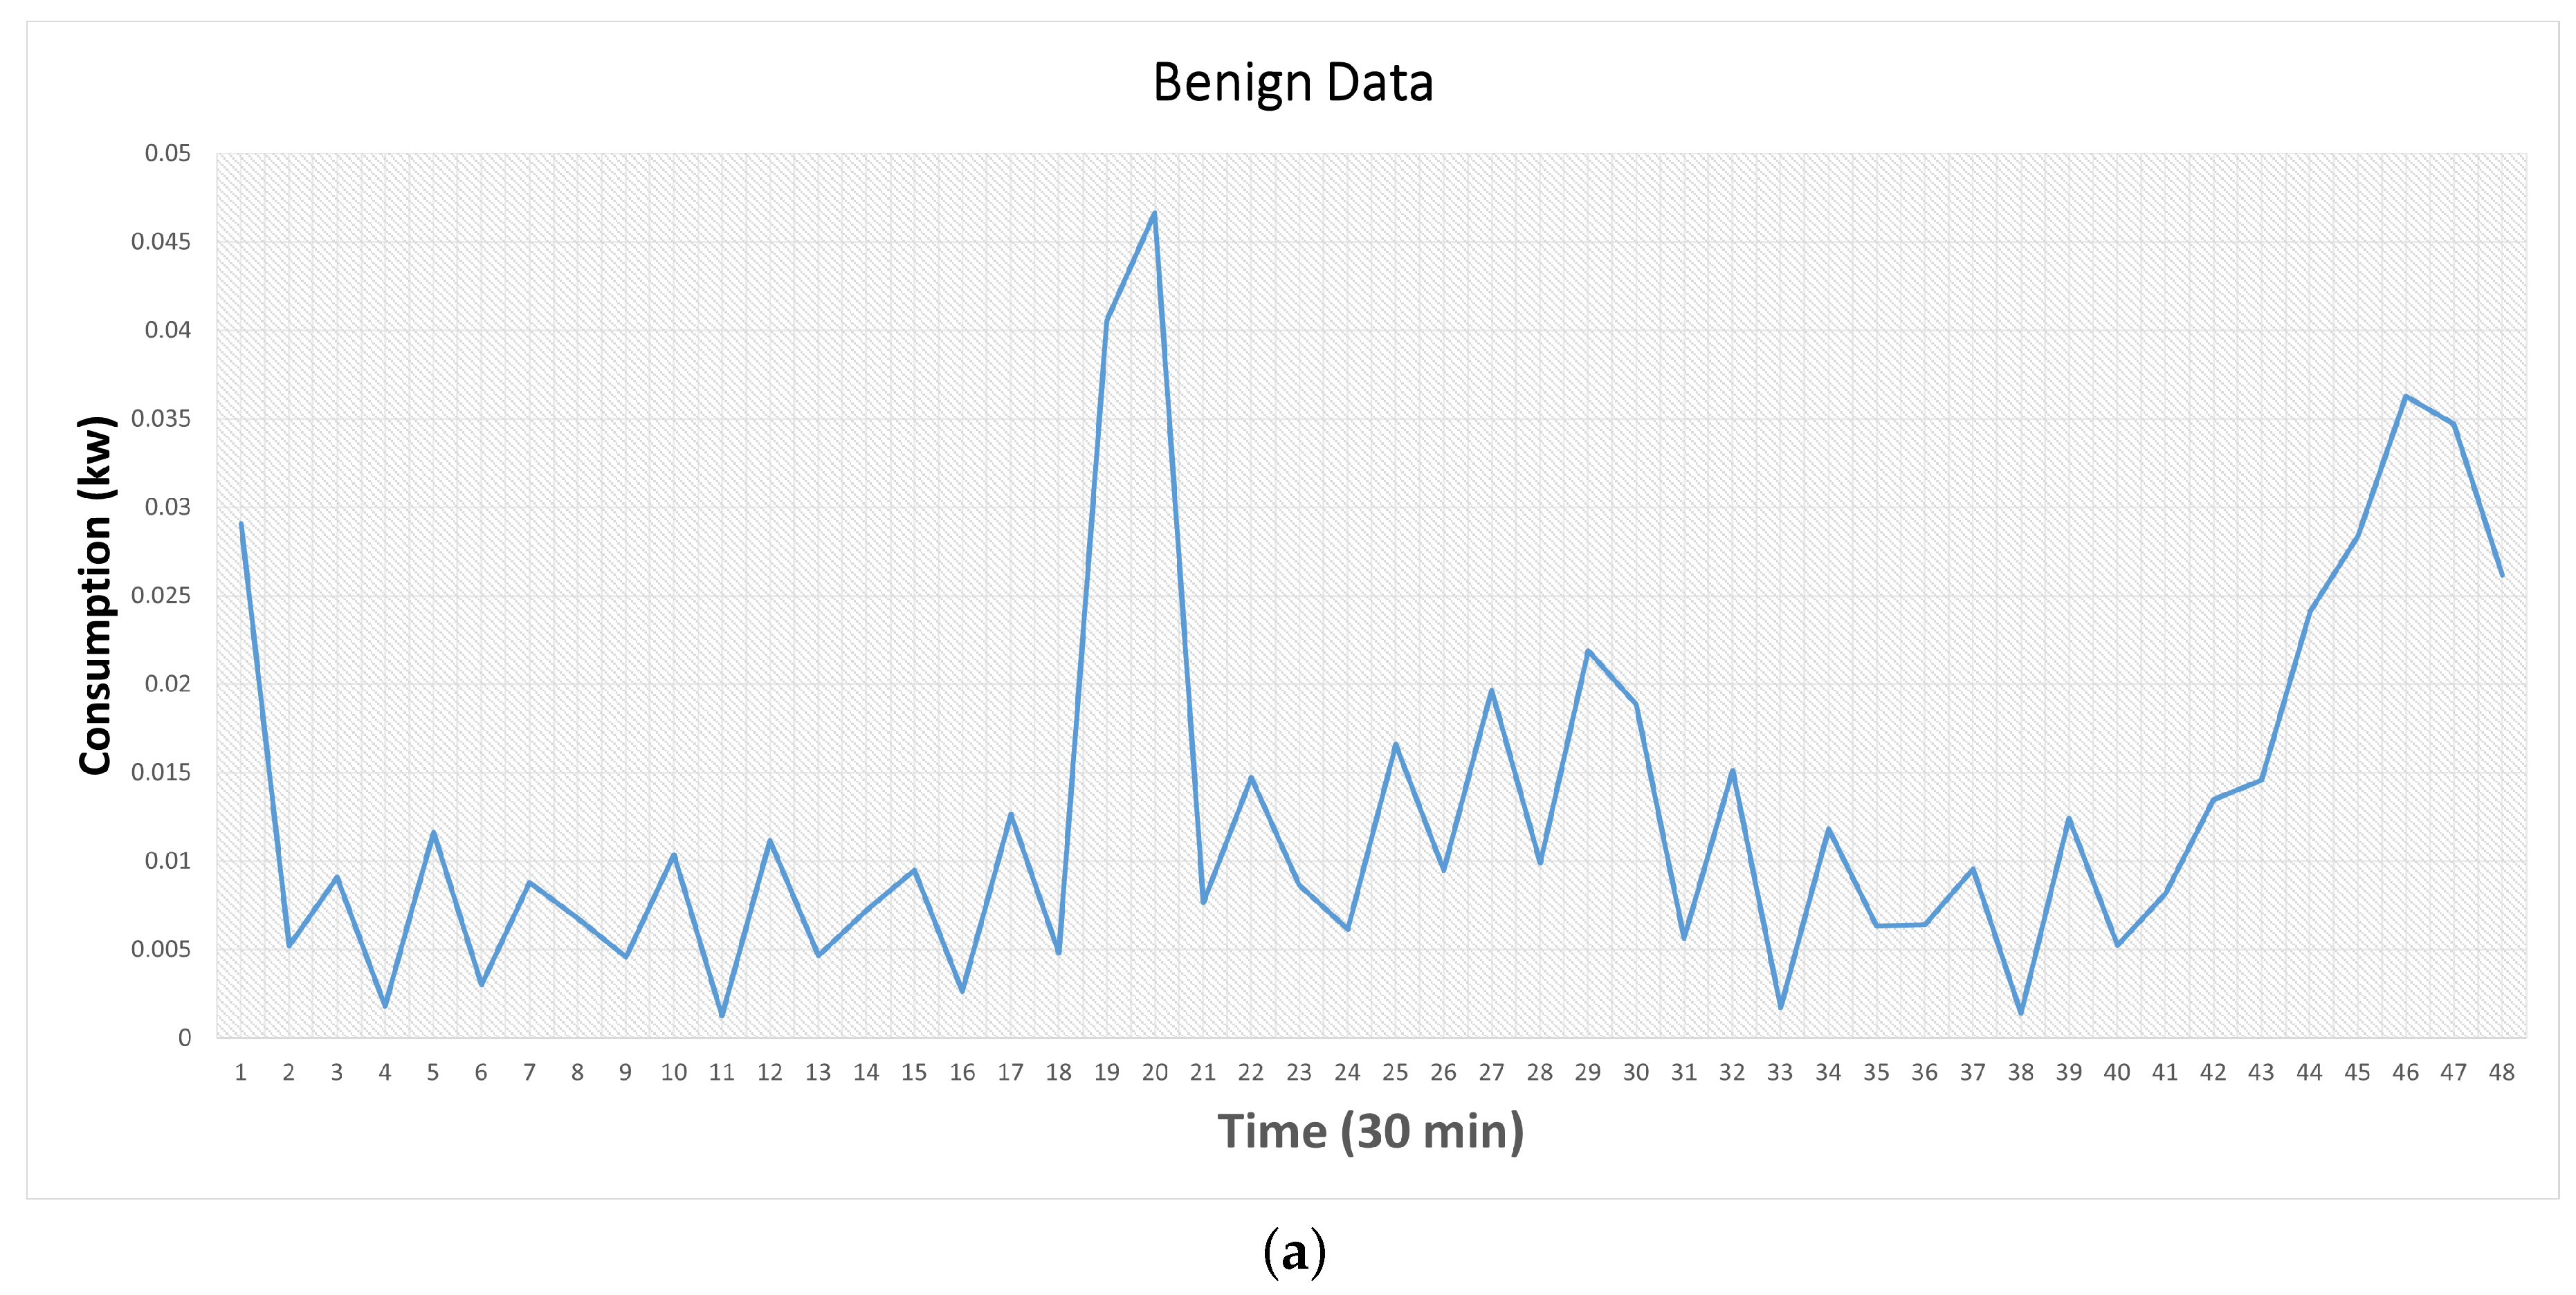
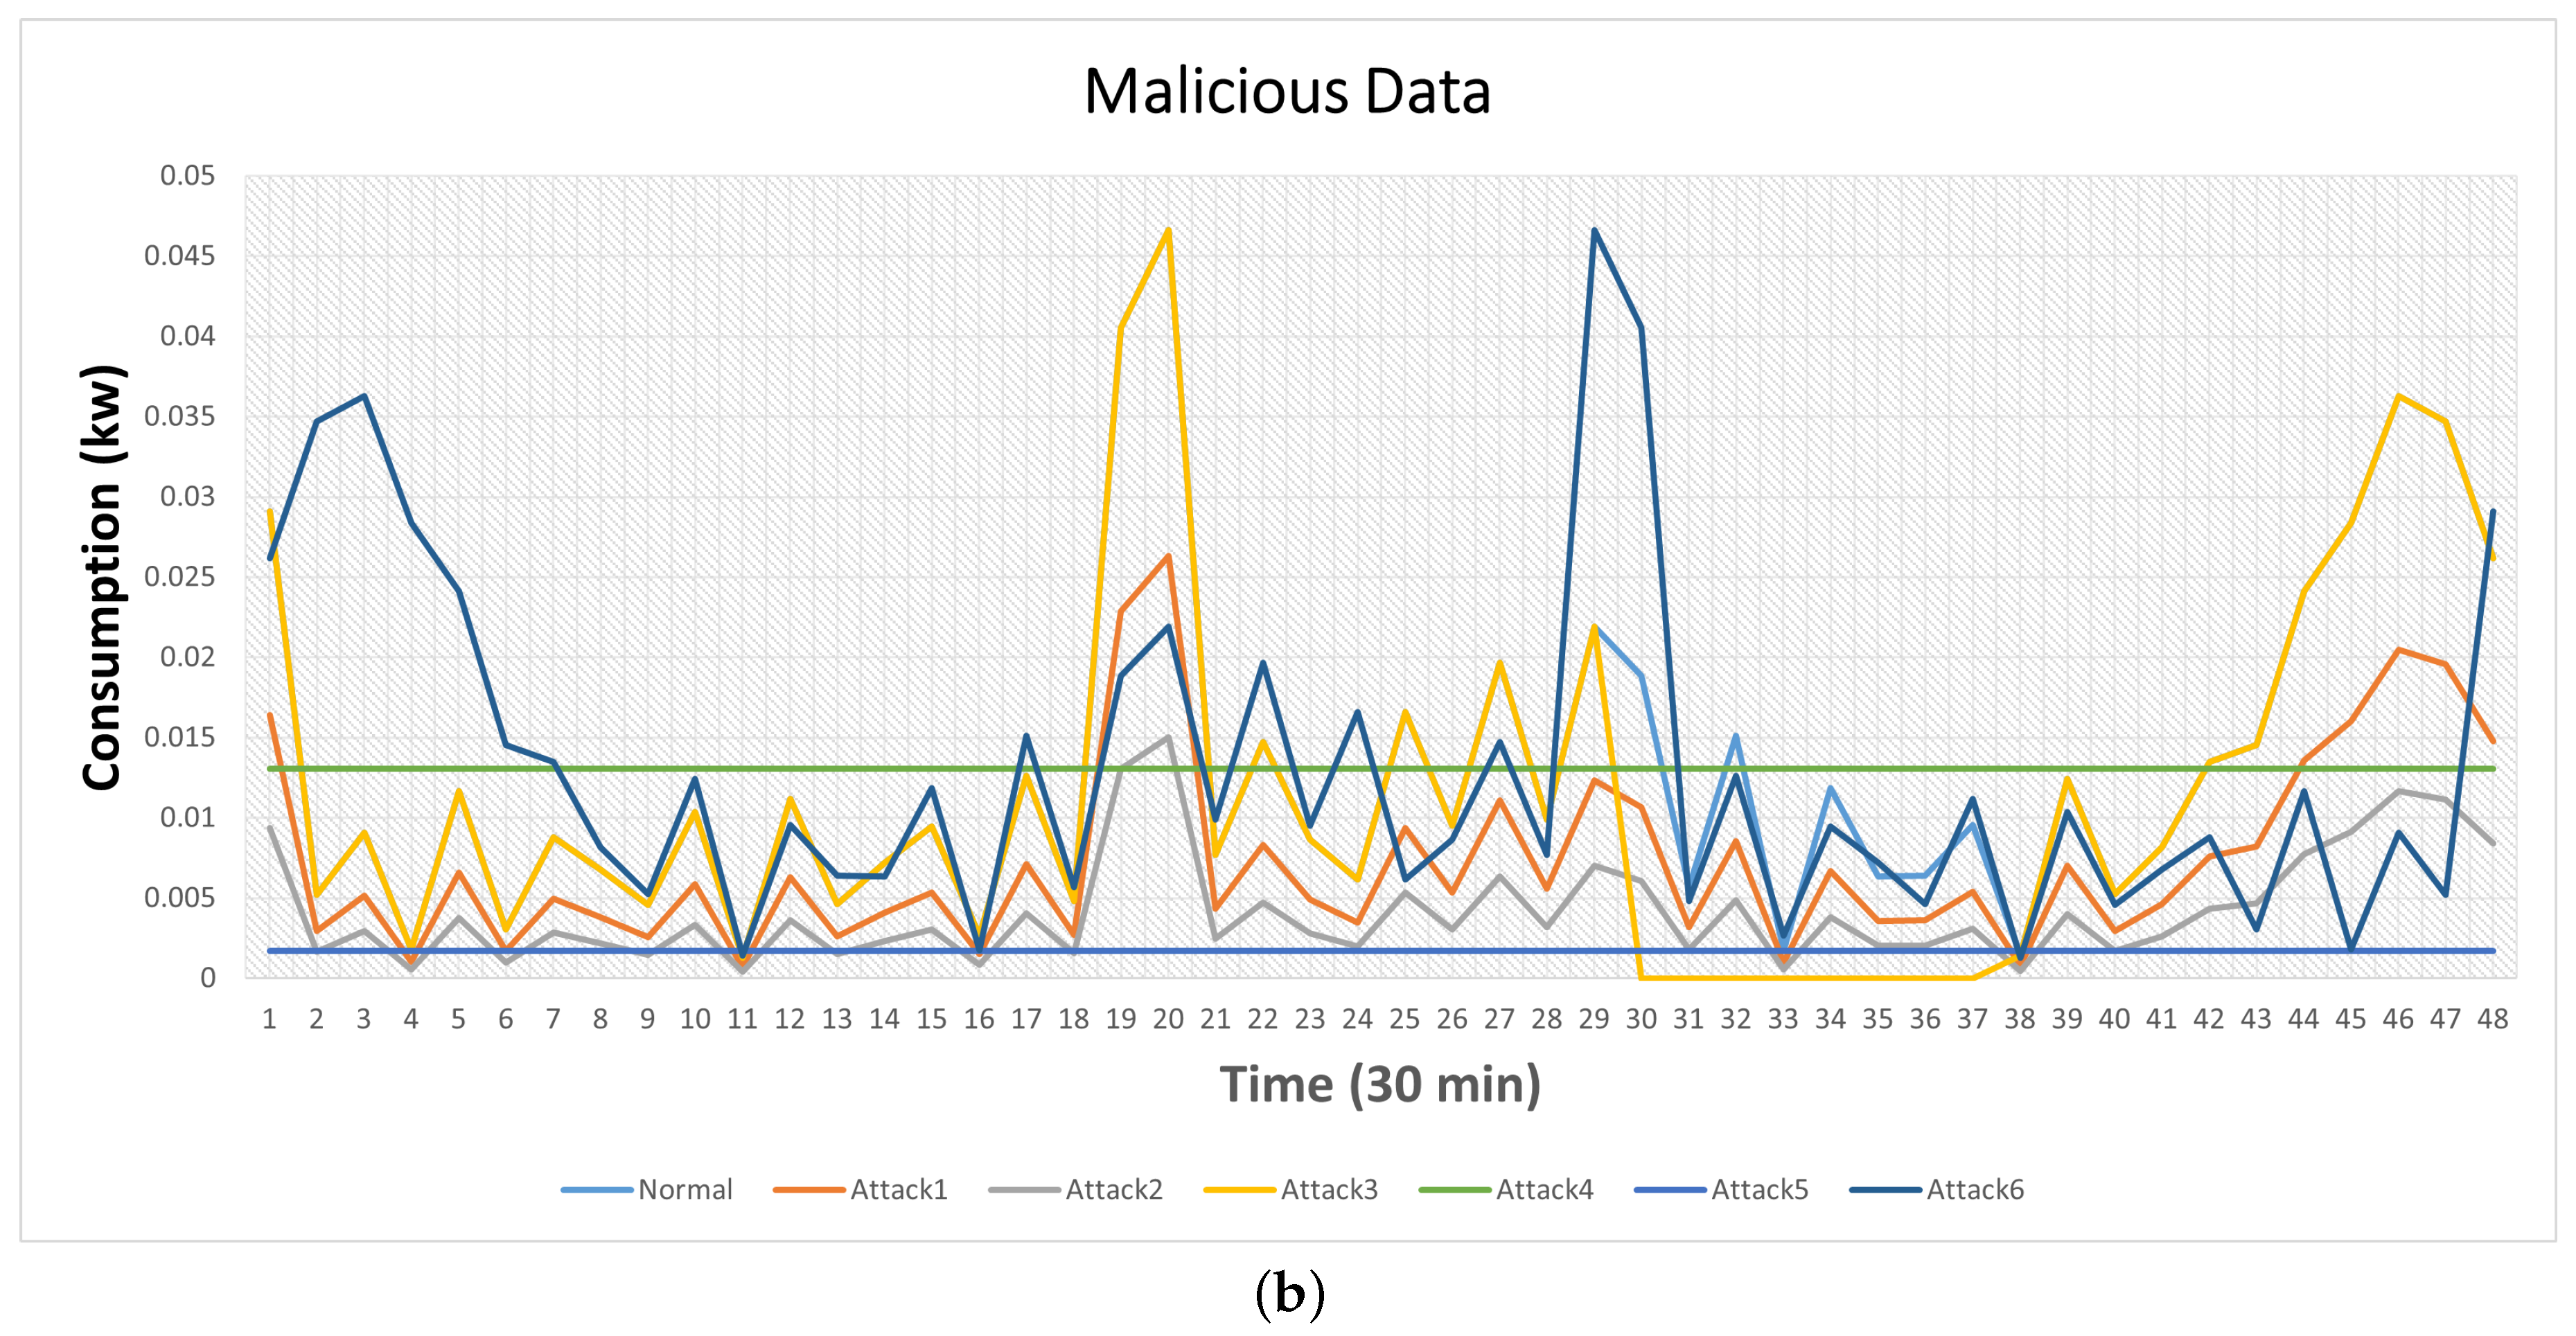
Figure 1a illustrates a sample electricity consumption pattern throughout a day for a benign customer sourced from the ISET dataset.
3.1. Generating Malicious Data
Dishonest users manipulate their meters to report inaccurate power consumption readings in an effort to reduce their electricity expenses. The malicious customers employ diverse attack methods to manipulate the integrity of consumption readings, with the intention of reducing their electricity bills by causing a discrepancy between the reported consumption
and the actual consumption
, where,
denote the electricity consumption value for customer
c on a particular day
d and time
t. These values collectively form the entries of matrix
. In the case of an honest customer, the reported energy consumption by their
SMs,
, adheres to the condition
. Consequently, matrices
and
are identical. In order to construct the malicious dataset, we utilize the electricity theft attacks outlined in [
16,
36]. The attacks we adopted to compute the malicious data can be classified intopartial reduction, selective by-pass, and price-based load control attacks.
In the partial reduction attacks, an attack function denoted as
reduces the actual electricity consumption reading by a fixed random fraction,
. This captures both low-level and high-level attacks across all samples. As a consequence, the reported electricity consumption reading
is altered accordingly as shown in Equation (
1).
The attack function
applies a dynamic random fraction,
, to multiply each reading of the electricity consumption data as follows:
In the second category of attacks, known as selective by-pass attacks, the reported energy consumption reading is set to zero during a specific time interval . Outside of this interval, the reported electricity consumption readings reflect the actual consumption levels.
The interval is determined by an initial time, , which is randomly selected from the range of 0 to . The length of the interval, , is also randomly selected from the range of 4 to 24. The final time, , is calculated as . This range encompasses low-level attacks with a minimum off-time of 4 h and high-level attacks with a maximum off-time of 24 h.
Price-based load control attacks can be launched when there are varying electricity tariffs throughout the day. In one way to launch these attacks, an attack function is employed to report a constant consumption value throughout the entire day as shown in Equation (
4). Here,
represents the expected average consumption value, and
represents the power consumption readings of day
d.
To make the attack stealth and avoid the easy detection of constant consumption values reported throughout the day, a random and time-varying fraction
is applied as shown in Equation (
5).
The final attack function reports high values of energy consumption readings during the time intervals of low electricity tariff, and vice versa (
6).
For each customer, we apply the previously-explained six attack functions to their benign consumption profile matrix,
. As a result, each customer is left with six malicious matrices.
Figure 1b showcases examples of malicious energy consumption patterns created using the six attack functions, using the benign energy consumption pattern depicted in
Figure 1a.
Figure 1.
A sample of benign and malicious power consumption readings. (a) A benign power consumption reading. (b) Malicious power consumption readings computed by the six attacks.
Figure 1.
A sample of benign and malicious power consumption readings. (a) A benign power consumption reading. (b) Malicious power consumption readings computed by the six attacks.
It can be seem from
Figure 1 that some attacks possess a deceptive nature. For instance, attack 3 exhibits high similarity to the benign data, except for a specific period where it provides zero readings. Attack 4 employs an averaging technique, resulting in a constant value throughout the entire day, leading to a good overlap between benign and malicious data. Similarly, Attack 6 reports elevated electricity consumption during periods of low electricity tariffs and vice versa, exacerbating the issue of overlapping between the two types of data.
3.2. Transforming Consumption Readings into Images
To address the challenge of data overlapping, which occurs in specific attacks such as 3, 5, and 6 where benign and malicious data overlap, we propose employing an image-based dataset. Leveraging recent advancements in computer vision and deep learning, we convert the time-series
SM readings from the ISET dataset into image representations [
44,
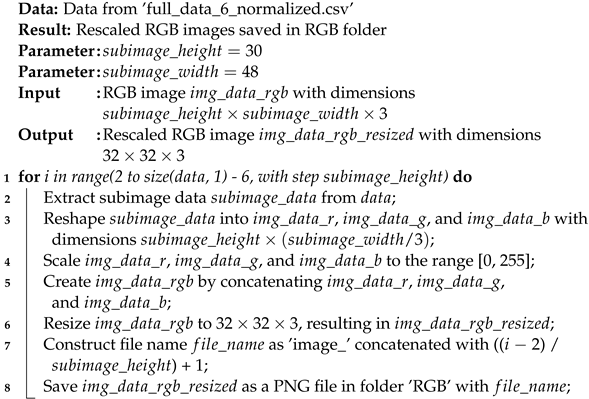
45]. To facilitate this conversion, we initially transformed the CSV file format into 48 columns, each representing one day of data for each user from a total of 536 days. These days were divided into 17 months per user, creating data segments of 30 rows and 48 columns for each month. Subsequently, using Matlab version 2023, we converted these monthly datasets into image representations. Both RGB and grayscale images were generated for both benign and malicious data. During the training phase, we exclusively utilized benign images, while during the testing phase, we employed both benign and malicious images. The resulting images were resized to 32 × 32 pixels for further analysis. The provided MATLAB code reads data from the CSV file, converts it into RGB and grayscale images, and saves them to a designated folder. It defines the dimensions for each image, extracts the image data from the CSV file, and resizes the images to 32 × 32 pixels, as demonstrated in Algorithms 1 and 2.
| Algorithm 1:
Convert CSV Data to Grayscale Images
|
![Energies 16 07069 i001]() |
| Algorithm 2:
Convert CSV Data to RGB Images
|
![Energies 16 07069 i002]() |
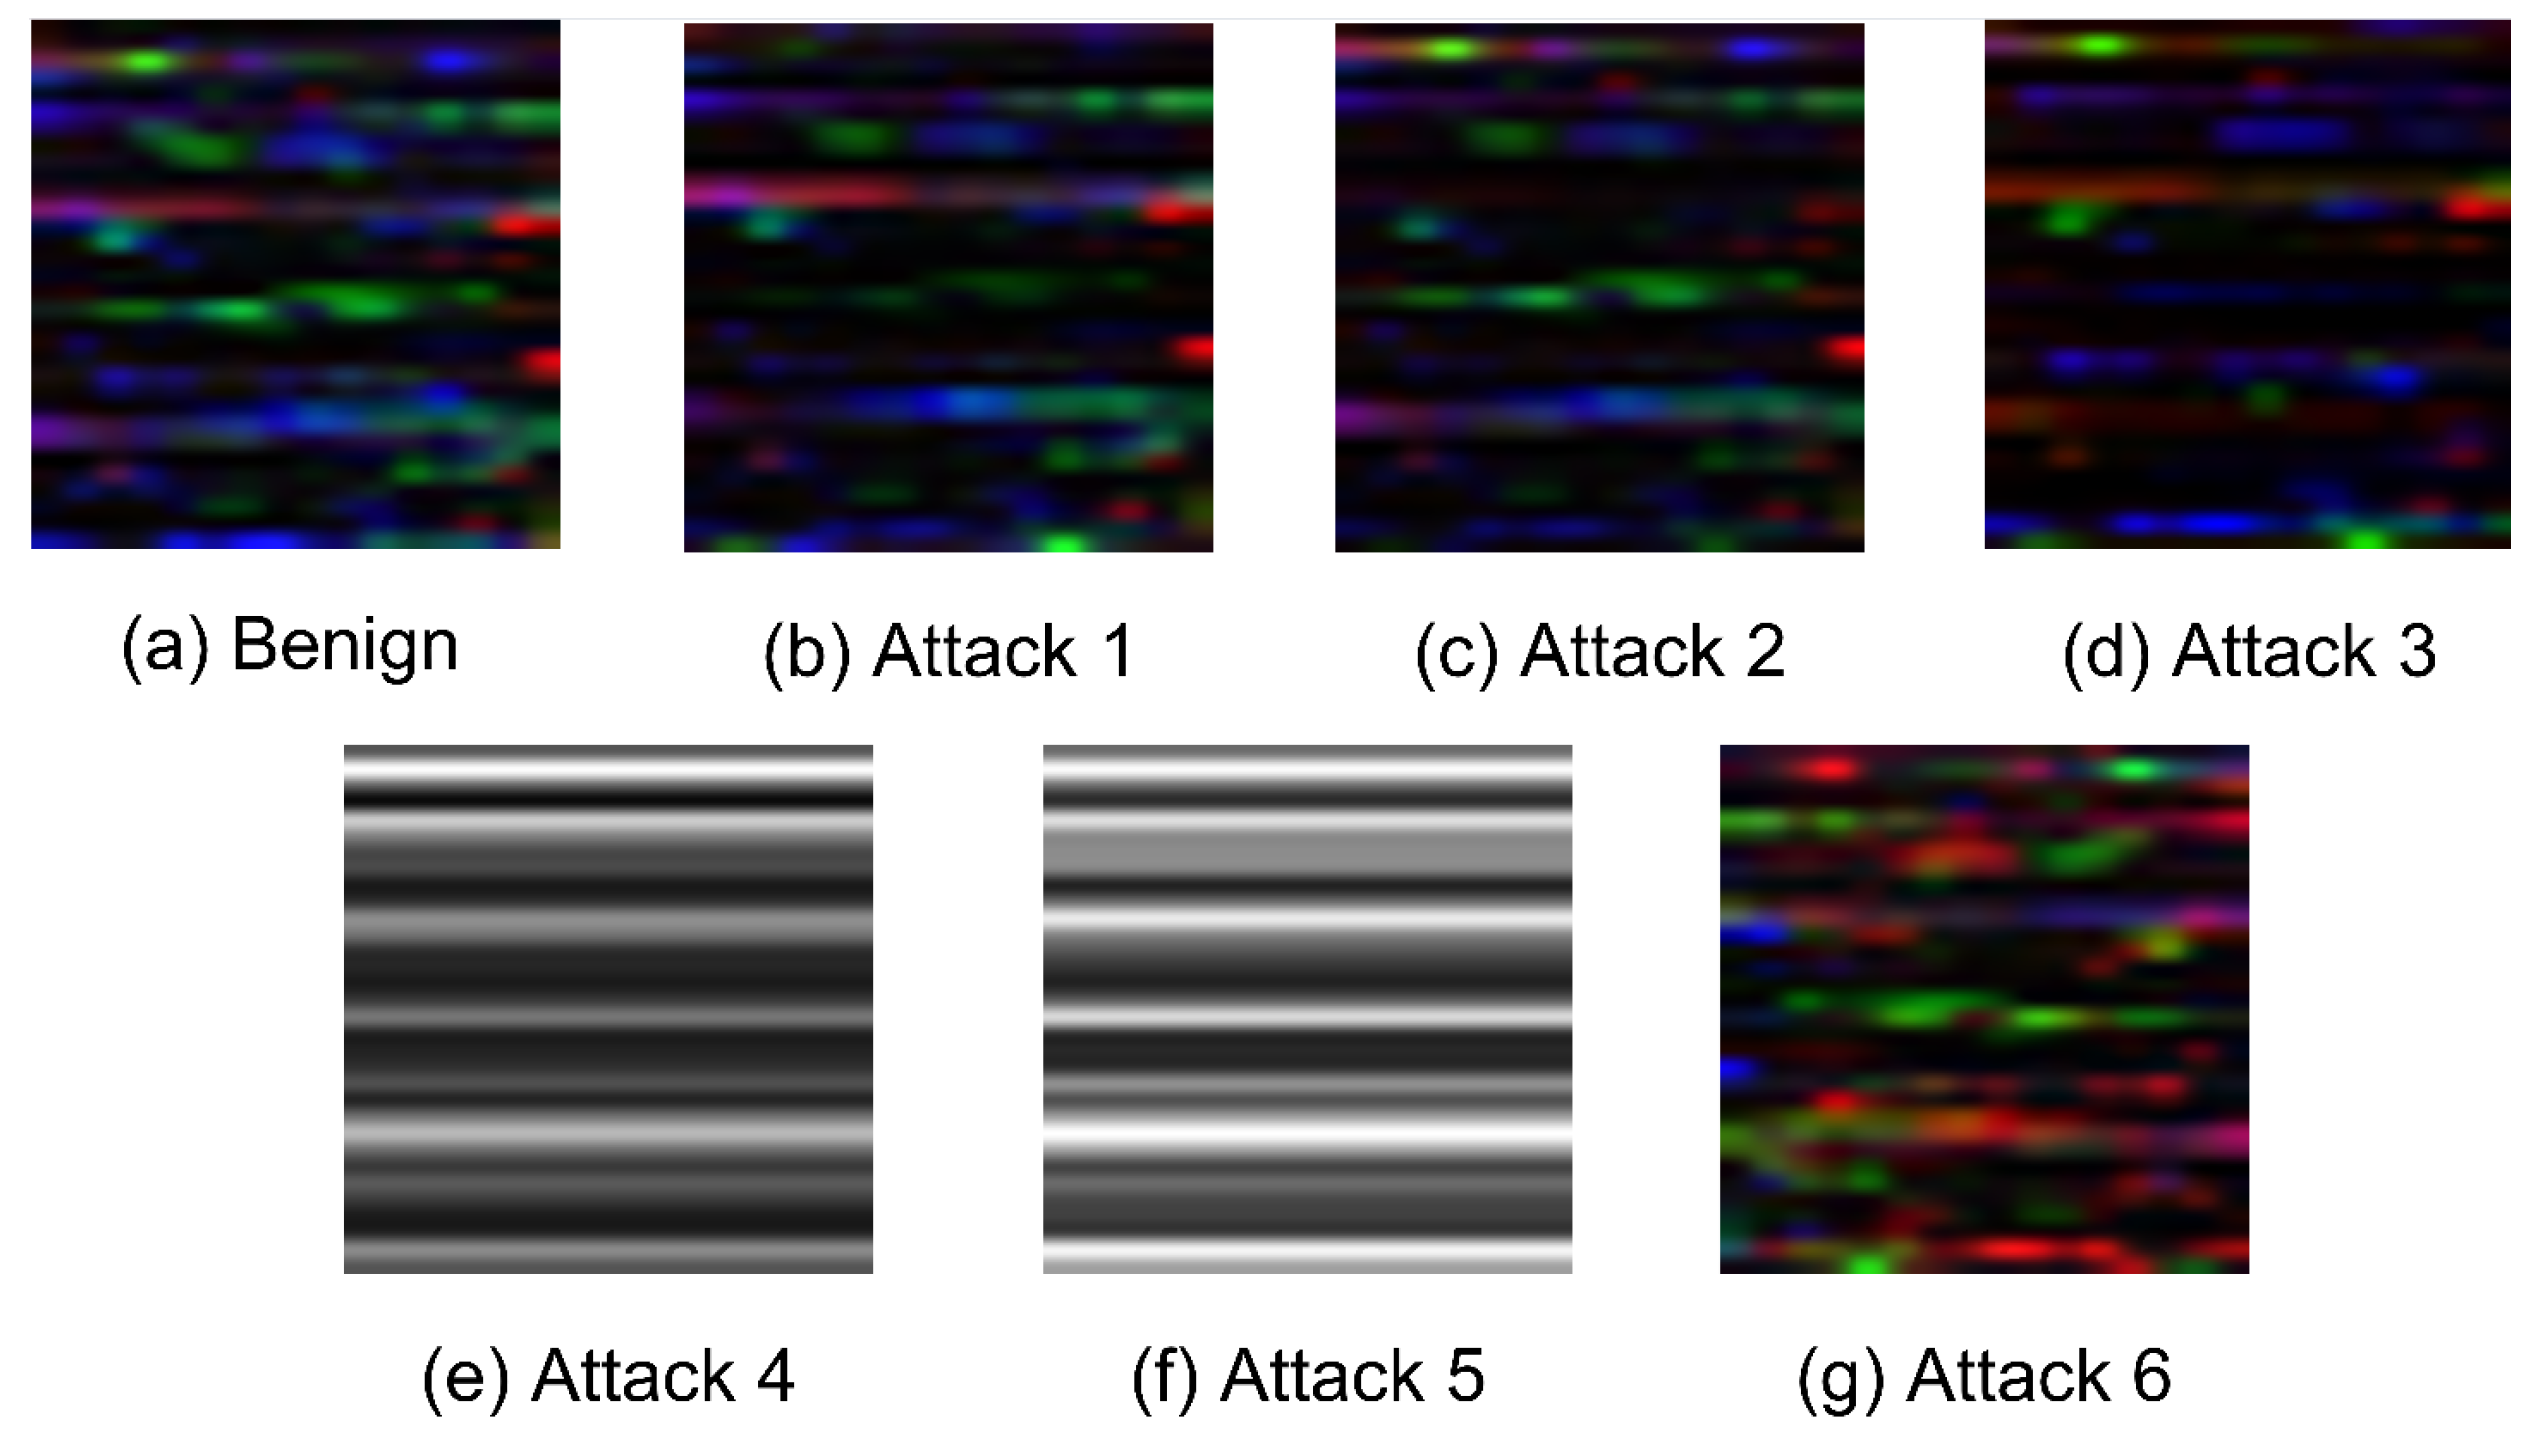
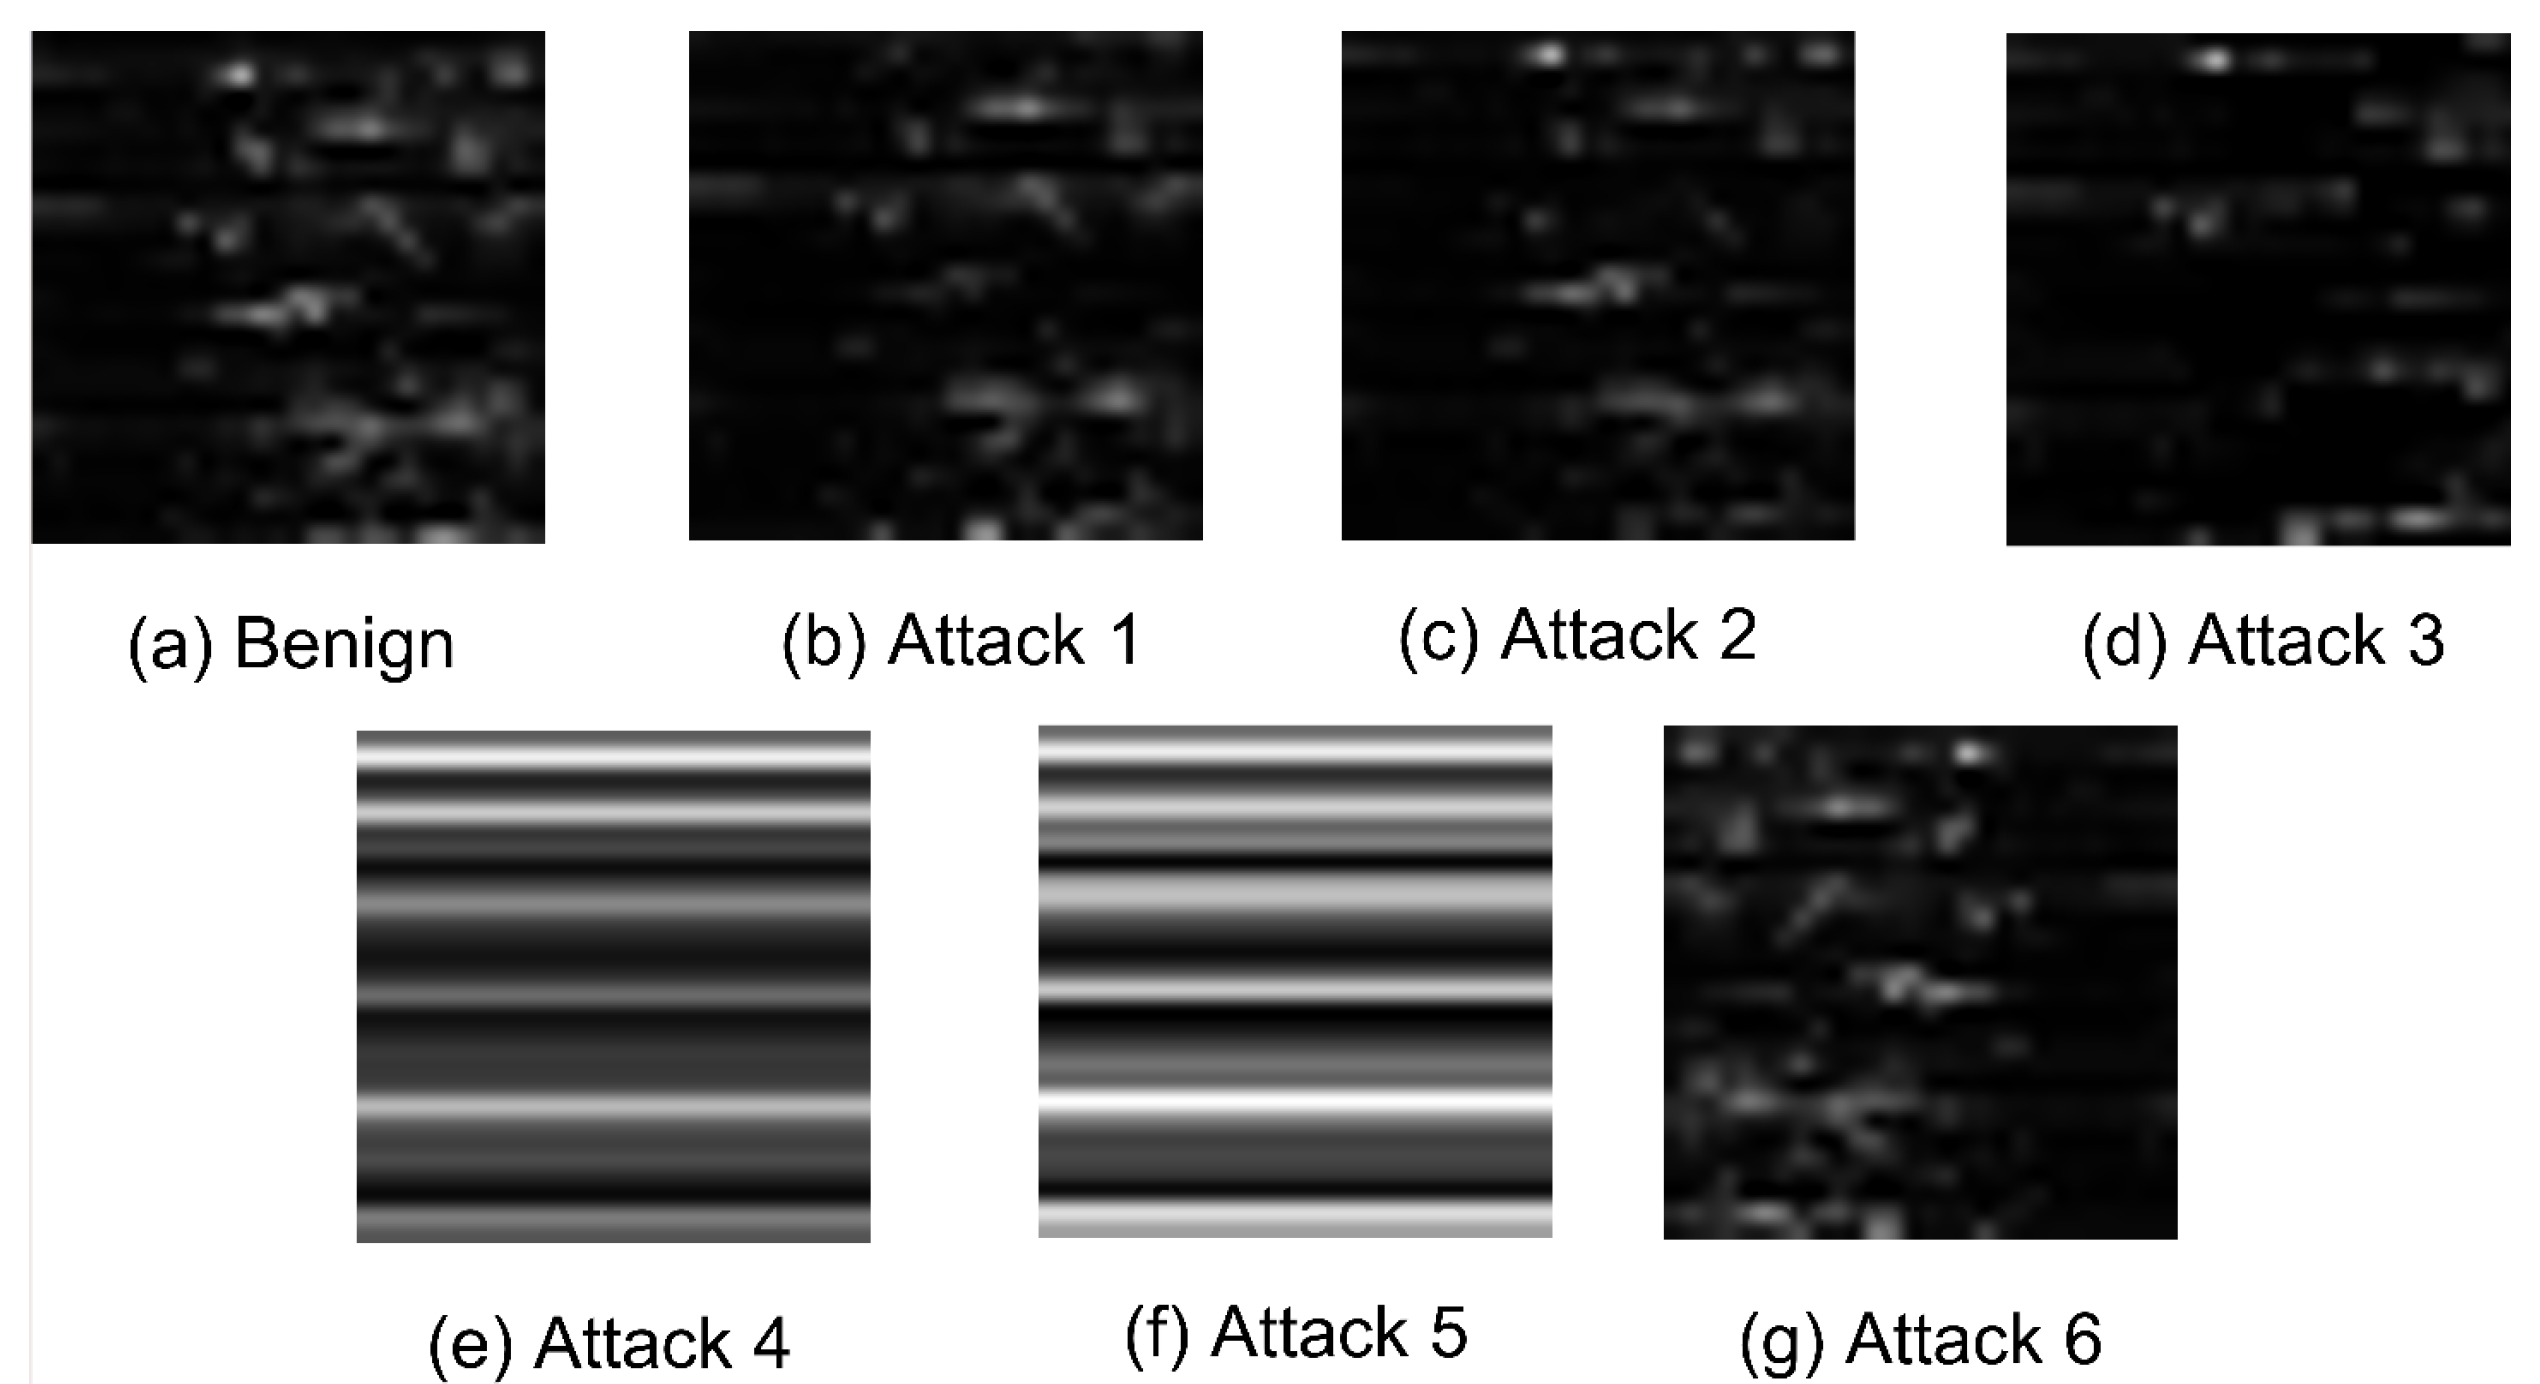
Figure 2 and
Figure 3 illustrate samples of the converted images from each class. Specifically,
Figure 2a and
Figure 3a depict the benign images in RGB and grayscale formats, respectively. Meanwhile,
Figure 2b–g and
Figure 3b–g illustrate the six types of attacks in both RGB and grayscale images. Notably, attacks 4 and 5 produce distinctive images in both RGB and grayscale formats compared to the other attacks and the benign image. This distinction arises because these two attacks entirely replace the benign sample with a new sample containing the average power consumption throughout the day. This indicates that the malicious sample significantly differs from the benign data, making it easier for the detector to identify them.
On the other hand, the images of attack 3 in
Figure 2d and
Figure 3d indicate that the detection of this attack relies on the duration of zero-time interval
introduced by the malicious consumer. As this interval increases, so does the probability of detection by the detector because the image becomes far from the benign image. Furthermore, the images of attack 6 in
Figure 2g and
Figure 3g indicate that they are far from the benign images because of the flipping done by the attack and thus by detecting the correlations within the data, the attack can be detected.
4. Preliminaries
In this section, we provide an overview of the essential concepts utilized in our solution, including Autoencoders, one-class classification, OC-SVM, SVDD, DSVDD, and GMM.
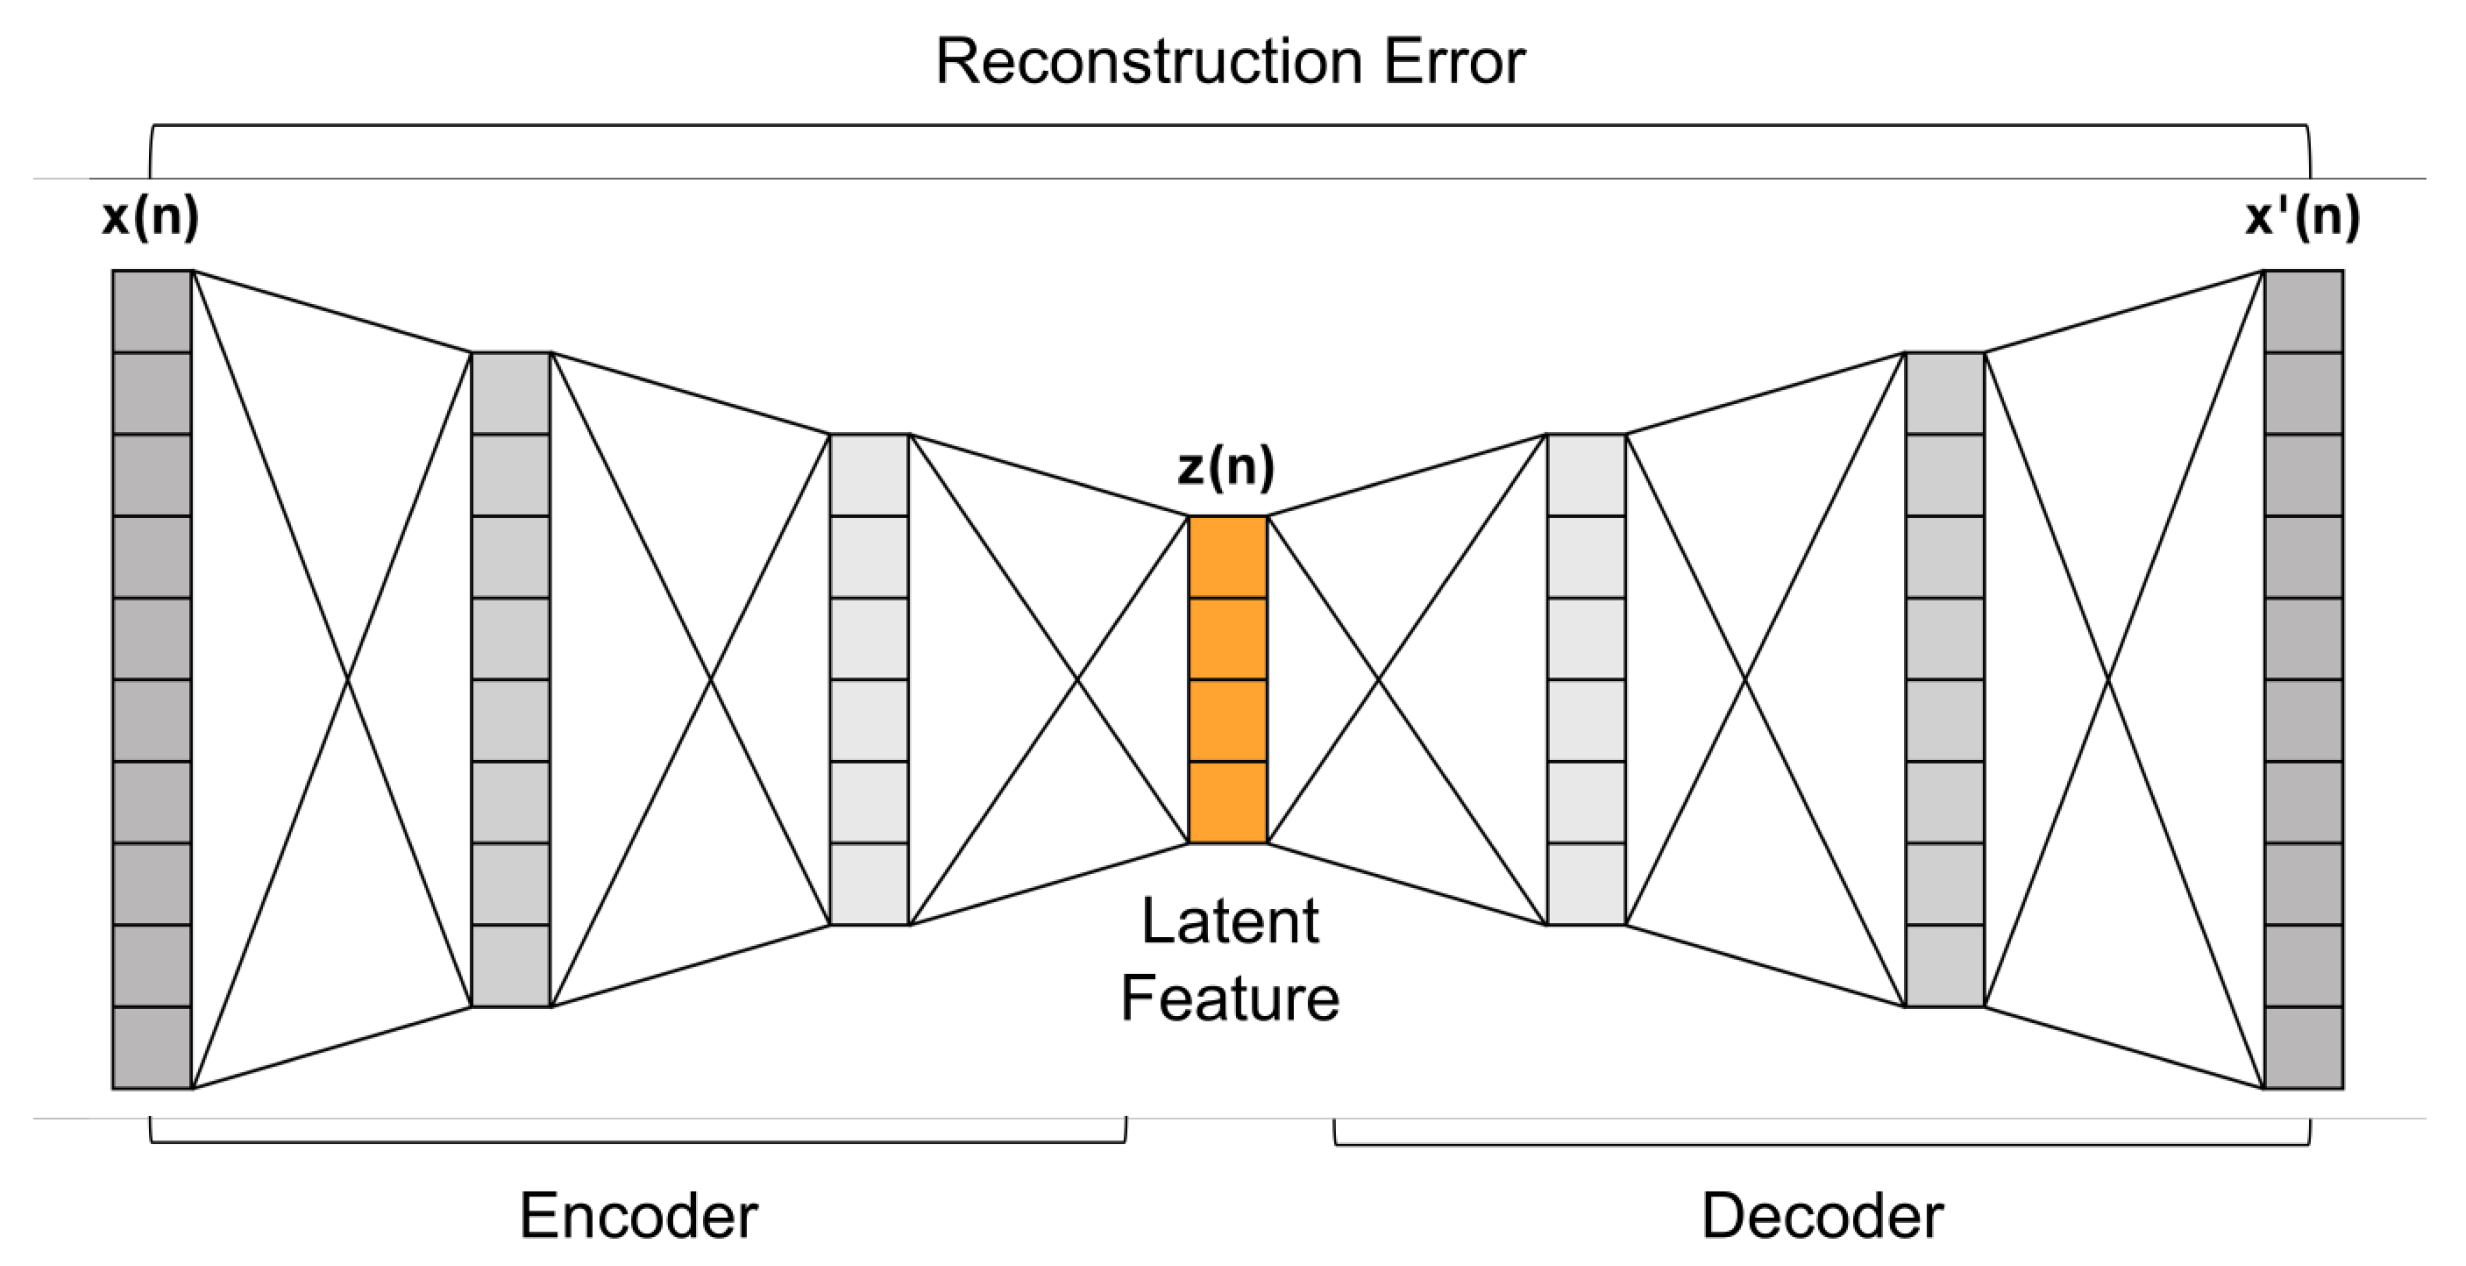
4.1. Autoencoders
Autoencoders are a type of artificial neural network architecture that learns compression and reconstruction of input data [
46]. They consist of an encoder network and a decoder network, which are typically symmetrical in structure as illustrated in
Figure 4. The encoder network takes the input data and maps it to a lower-dimensional latent space representation [
47]. This latent representation serves as a compressed encoding of the input data, capturing its most essential features. The decoder network then aims to reconstruct the original input from the latent representation [
48].
During the training process, autoencoders aim to reduce the gap between the original input and its reconstruction version [
49]. This is achieved through an optimization algorithm such as gradient descent. By minimizing the reconstruction error, the autoencoder learns a compressed representation that captures the most salient information in the data. This capability makes autoencoders useful for dimensionality reduction tasks, where high-dimensional data can be efficiently represented in a lower-dimensional space [
50].
Autoencoders can also be used for anomaly detection. During training, they learn the reconstruction of normal or expected patterns in the data [
51]. When presented with anomalous data during testing, the reconstruction error tends to be higher, indicating the presence of anomalies. This makes autoencoders valuable in various applications including fraud detection and fault diagnosis [
52].
In addition to their utility in unsupervised learning tasks, autoencoders have found applications in supervised learning as well. They can be trained on unlabeled data to learn meaningful features and then optimized for a particular supervised task, such as image classification or sentiment analysis. This process, known as pre-training, enables the model to leverage the learned representations and potentially improve performance on the supervised task [
53,
54].
Furthermore, autoencoders have been extended with variations such as variational autoencoders (VAEs) and denoising autoencoders [
55]. VAEs introduce a probabilistic interpretation to the latent space, allowing for generating new data samples [
36,
38]. Denoising autoencoders are trained to reconstruct clean versions of input data corrupted by noise, which helps in learning robust representations and denoising capabilities.
In summary, autoencoders are powerful neural network architectures that learn to compress and reconstruct input data. Their versatility and ability to capture meaningful features make them valuable in tasks such as dimensionality reduction, anomaly detection, pre-training for supervised learning, and generative modeling.
4.2. One-Class Classification
One-class classification, also known as one-class learning or outlier detection, is an
ML approach that focuses on training a model to classify instances belonging to a single class. Unlike traditional classification, where multiple classes are considered, one-class classification aims to distinguish normal (or inlier) instances from anomalies (or outliers) [
56]. In one-class classification, the training data consists only of examples from the target class, representing the normal behavior or characteristics of the data. The goal is to build a model that can accurately identify and generalize the patterns and properties of the target class, enabling it to identify cases that substantially differ from the learnt normal behavior [
57,
58].
One-class classifiers, such as
OC-SVM, attempt to define a decision boundary or construct a representation of the target class in the feature space. During the testing or inference phase, the model assigns new instances either as part of the target class (inliers) or as outliers based on their proximity to the learned representation or decision boundary [
59].
One-class classification finds applications in various domains, such as fraud detection, network intrusion detection, anomaly detection in industrial systems, and outlier detection in healthcare or finance. It is particularly useful in scenarios where obtaining labeled instances of outliers or anomalies is difficult or costly. By focusing on learning the characteristics of the target class alone, one-class classification provides a valuable tool for identifying unusual or potentially harmful instances in real-world data [
60].
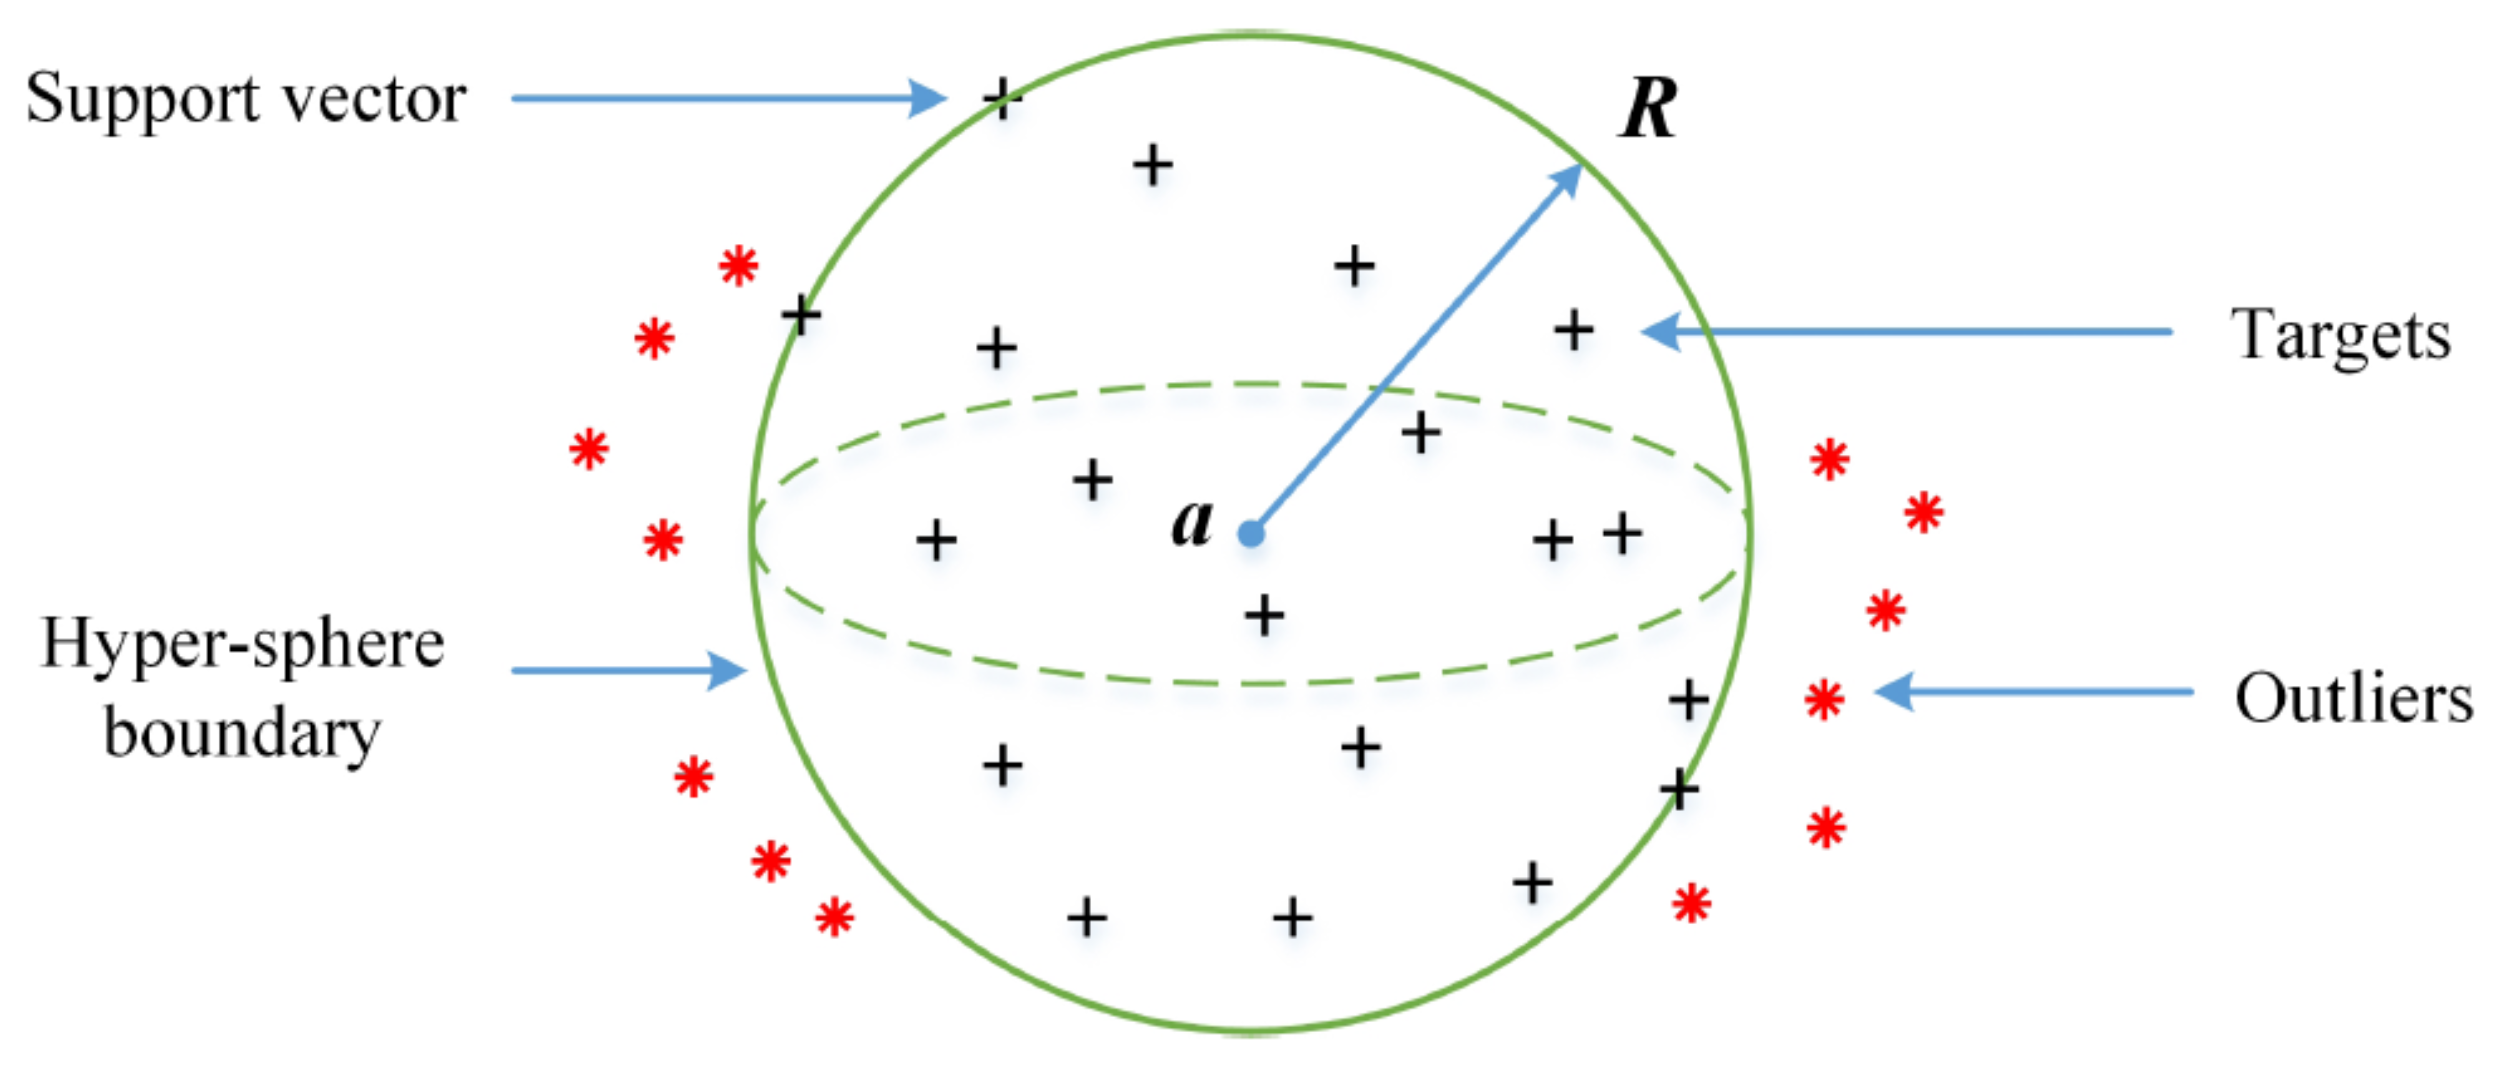
4.3. OC-SVM
OC-SVM is a specific approach within the family of SVM that is used for one-class classification or outlier detection tasks.
OC-SVM is designed to learn a boundary or decision function that encapsulates the normal data instances, aiming to separate them from outliers or anomalies
Figure 5. The training process of
OC-SVM involves constructing a hypersphere or a hyperplane in a high-dimensional feature space. This boundary is positioned to enclose as many normal instances as possible while maintaining a maximal distance from the origin or center of the feature space. By doing so,
OC-SVM effectively captures the support of the normal class, encompassing the majority of normal instances within the hypersphere or hyperplane [
61]. During the testing or inference phase,
OC-SVM assigns new instances as either normal or anomalous based on their proximity to the learned boundary. Instances lying within the boundary are classified as normal, while those outside are classified as outliers [
62,
63].
OC-SVM is particularly useful in situations where the training data only contains examples from the normal class, making it suitable for one-class classification problems where labeled instances of outliers are scarce or unavailable. It relies on the assumption that the normal class occupies a relatively small region in the feature space, allowing the model to identify instances that significantly deviate from this region. Applications of OC-SVM include fraud detection, intrusion detection in network security, anomaly detection in industrial systems, and outlier detection in various domains. It offers an effective approach for identifying and flagging unusual or potentially harmful instances that do not conform to the learned patterns of the normal class.
4.4. SVDD
SVDD is an
ML algorithm that belongs to the family of SVM but it is specifically designed for one-class classification or anomaly detection.
SVDD aims to construct a hypersphere or a hyperellipsoid in the feature space that encapsulates most of the training data, which represents the target class or typical instances [
64]. In
SVDD, the objective is to find the center and radius of the hypersphere or hyperellipsoid that minimizes the volume or surface area while containing the training instances. This is achieved by solving an optimization problem that involves maximizing the margin or distance between the center and the data instances, subject to a constraint that all instances should lie within or on the boundary of the hypersphere or hyperellipsoid as shown in
Figure 6. During testing or inference,
SVDD classifies new instances as either normal or anomalies based on their proximity to the learned boundary. Instances that fall within the boundary are classified as normal, while those lying outside are classified as anomalies.
SVDD is a powerful technique for one-class classification because it can effectively learn the characteristics of the target class and capture the distribution of normal instances in the feature space. It is particularly useful when only instances from the normal class are available for training, making it suitable for scenarios where labeled instances of anomalies or outliers are scarce or difficult to obtain. Applications of SVDD include anomaly detection in various domains such as intrusion detection, fraud detection, medical diagnosis, and quality control. By learning a compact representation of the normal instances, SVDD provides a robust method for identifying and isolating instances that exhibit substantial deviations from the learnt patterns of the target class.
4.5. DSVDD
The utilization of DNNs offers a new and innovative method for extracting discriminative features directly from raw data. These features, obtained through DNNs, can be defined as some input space
and some output space
. Let
be a neural network with weights
, where
corresponds to the weight of hidden layer
l. To effectively train the network parameters
while simultaneously minimizing the volume of the
SVDD hypersphere, the objective function of the
OC-DSVDD can be formulated as follows:
where
a denotes the center of the sphere, and
is the Frobenius norm. The first term of Equation (
7) computes the quadratic loss based on the distances to the sphere center. The second term represents a weight decay regularizer of
with
introduced as a hyperparameter [
13,
64].
Equation (
7) demonstrates that in the context of
OC-DSVDD, the characterization of the sphere solely requires the center
a. On the other hand, the contraction of the sphere is accomplished by taking the mean value of the distances from each feature to
a. It is important to note that
OC-DSVDD strictly encloses every sample from the training set within the sphere, without allowing any tolerance for outliers. To address this limitation and introduce a more flexible approach, a variant of
DSVDD with a soft boundary is proposed, outlined as follows:
In contrast to the previous formulation Equation (
7), the soft-boundary
DSVDD incorporates both the center
a and the radius
R to characterize the sphere. The presence of a penalty term in Equation (
8), where
manages the trade-off between the volume of the sphere and the extent of violations of the boundary. In other words, it allows for the possibility of certain points being mapped outside the sphere, introducing a level of flexibility in the model. Flexibility refers to the ability of the method to accommodate the case of some benign points being mapped outside the sphere. This ensures that all points inside the sphere are indeed benign while sacrificing a few benign points outside the sphere to prevent any malicious data from being classified as benign.
4.6. Gaussian Mixture Model
GMM is a probabilistic model that represents a dataset as a mixture of multiple Gaussian distributions as shown in
Figure 7. It is a popular technique used for unsupervised learning tasks such as clustering and density estimation. In a
GMM, each Gaussian component represents a cluster or mode in the data distribution [
65]. The
GMM assumes that the recorded data points arise from a combination of gaussian distributions, where each component is associated with a weight indicating its contribution to the overall distribution. The model’s goal is to estimate the parameters of the Gaussian components (mean, covariance, and weight) that best fit the data [
66].
The training process of a GMM involves an iterative algorithm, such as the Expectation-Maximization (EM) algorithm that has two steps, named expectation step (E-step) and maximization step (M-step). In E-step, the algorithm estimates the posterior probabilities of each data point belonging to each Gaussian component. These probabilities represent the soft assignments of data points to different clusters. In the M-step, the algorithm updates the parameters of the Gaussian components based on the weighted data points.
GMMs have several advantages, including their flexibility in modeling complex data distributions, their ability to capture different modes of data, and the ability to provide probabilistic assignments rather than hard clustering. However, they may be sensitive to the choice of the number of Gaussian components and are prone to overfitting if the model is overly complex.
The GMM can be used for various tasks. In clustering, the GMM assigns each data point to the most likely component, allowing for the identification of clusters in the data. GMMs can also be used for density estimation, where they can estimate the probability density function of the data. This makes GMMs useful for tasks such as outlier detection, anomaly detection, and data generation.
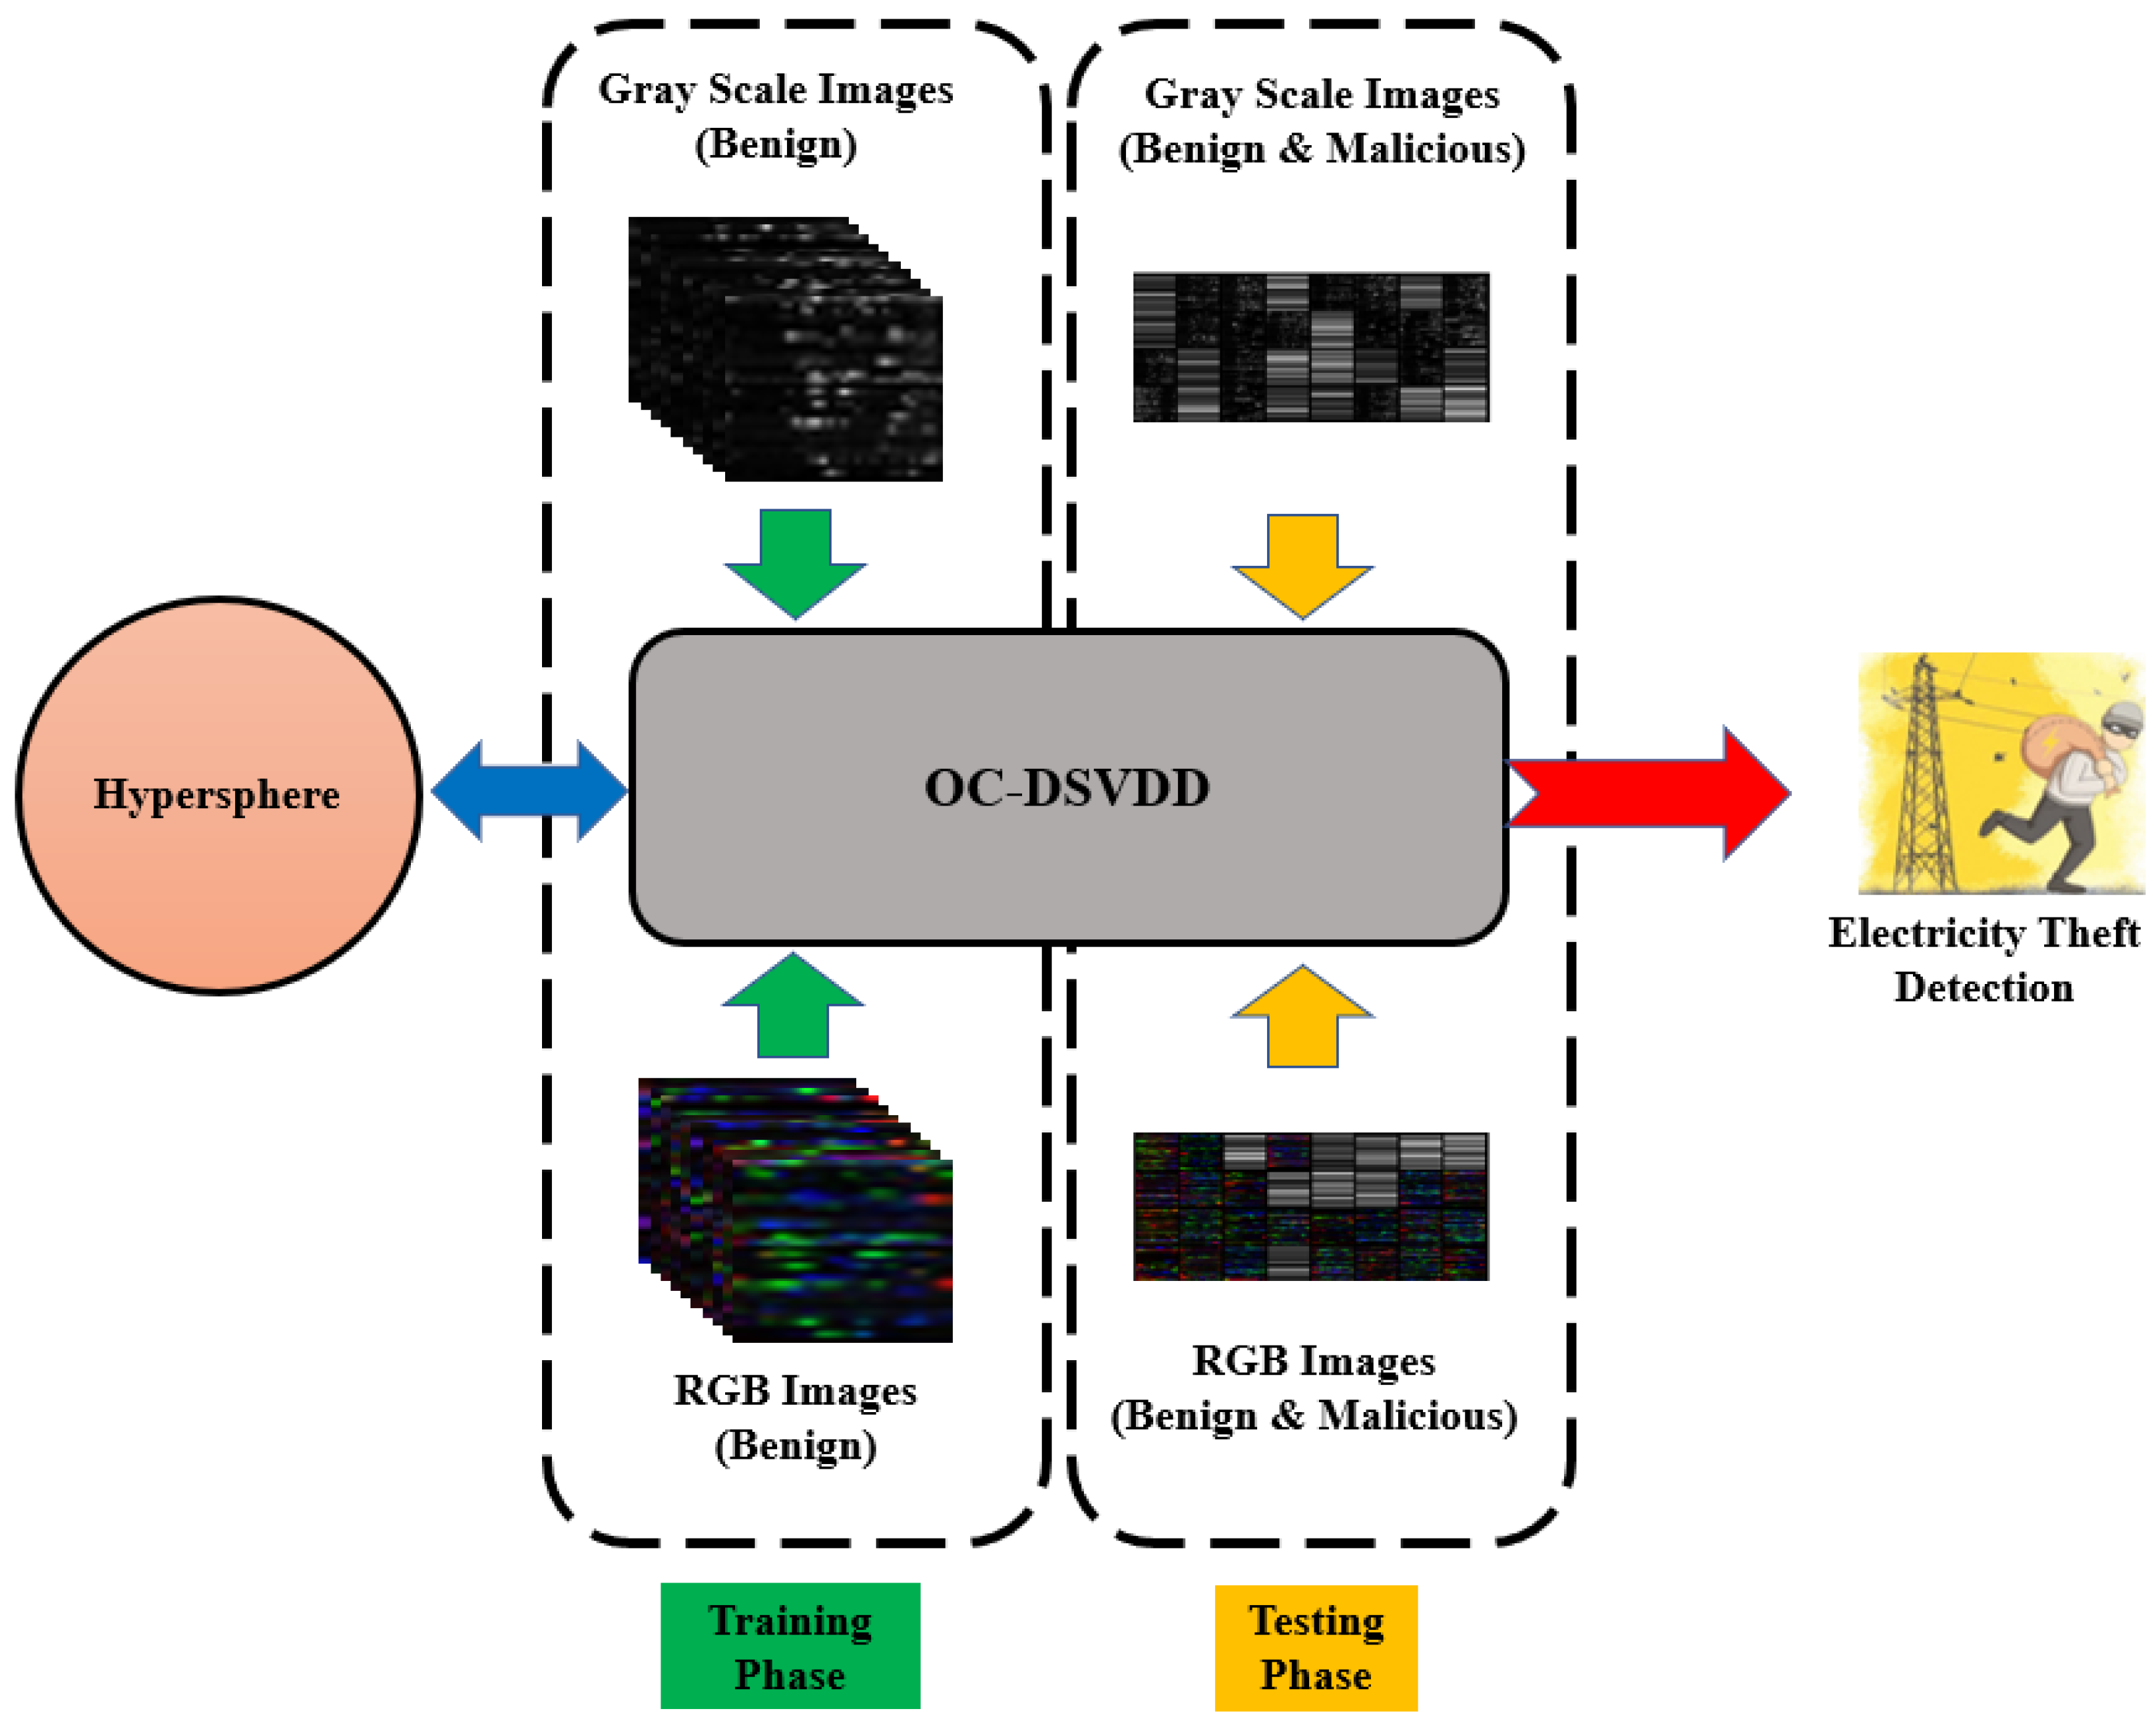
5. Proposed Scheme
In this section, we present the design of our image-based anomaly detectors, which have been developed to identify electricity theft attacks in smart grid AMI as shown in
Figure 8.
Our approach introduces new architectures that leverage DSVDD techniques. These architectures are specifically designed to improve the overall performance of detecting electricity theft attacks in multiple aspects. Firstly, our detectors should accurately identify instances of electricity theft by relying solely on benign data. This ensures that the detectors are effective in flagging abnormal consumption patterns associated with theft. Secondly, our detectors should be able to identify new types of attacks that have not been trained on before. This adaptability allows for robust detection capability even in the presence of evolving attack methods. Lastly, our detectors should address the challenge of data overlapping between benign and malicious samples. This issue arises due to deceptive attacks that attempt to make malicious data resemble benign patterns. By incorporating advanced techniques, our detectors can effectively differentiate between the two types of data, overcoming the challenge of data overlapping.
Deep learning is a subfield within representation learning that leverages model architectures featuring multiple processing layers. These layers work together to acquire data representations characterized by multiple levels of abstraction. This characteristic enables the encoding of a diverse range of features within a compact and distributed framework. Deep neural networks, particularly those with multiple layers, excel at learning hierarchical representations of data. This capability is especially advantageous for handling data with inherent hierarchical structures, such as images or text.
In the context of
DSVDD, we present a pioneering approach to unsupervised anomaly detection [
13].
DSVDD is designed to uncover the shared underlying patterns within a data distribution. This is achieved through the training of a neural network, which is tasked with fitting the network outputs within a hypersphere of minimal volume. This innovative approach harnesses the power of deep learning to distill and represent complex data distributions efficiently.
5.1. OC-DSVDD
After transforming the ISET dataset from its original time series format, stored as a .csv file, into both RGB and grayscale images, we proceeded to employ a 2D autoencoder to build the
OC-DSVDD. This
OC-DSVDD utilizes the latent features extracted by the autoencoder to construct a hypersphere within the feature space. This hypersphere is characterized by a center, denoted as
a, and a radius, denoted as
R. The primary objective is to encapsulate the majority of the training data, which corresponds to the benign images, as elaborated in
Section 4.4.
Figure 9 visually outlines the architecture of the proposed scheme incorporating
OC-DSVDD.
Within the broader context of OC-DSVDD, we introduce an innovative approach to unsupervised anomaly detection. DSVDD’s core mission is to unveil shared underlying patterns within a given data distribution. This is effectively accomplished by training a neural network, tasked with fitting the network outputs within a hypersphere of minimal volume. This pioneering approach effectively leverages the capabilities of deep learning to efficiently distill and represent complex data distributions.
5.2. DSVDD with OC-SVM
In this section, we integrate
OC-SVM with
DSVDD to leverage its capability of making decisions based on the decision boundary obtained during the training process, rather than relying on the threshold created by
OC-DSVDD. Furthermore, we propose that integrating
OC-SVM with
DSVDD can enhance the results and eliminate the need for using a threshold to do classification. In the case of
DSVDD, the threshold is calculated solely based on benign data using the center
a and radius
R, without considering the malicious data, as done in [
36,
38] that uses the autoencoder alone.
Figure 10 depicts the structure of the proposed scheme employing DSVDD-OCSVM.
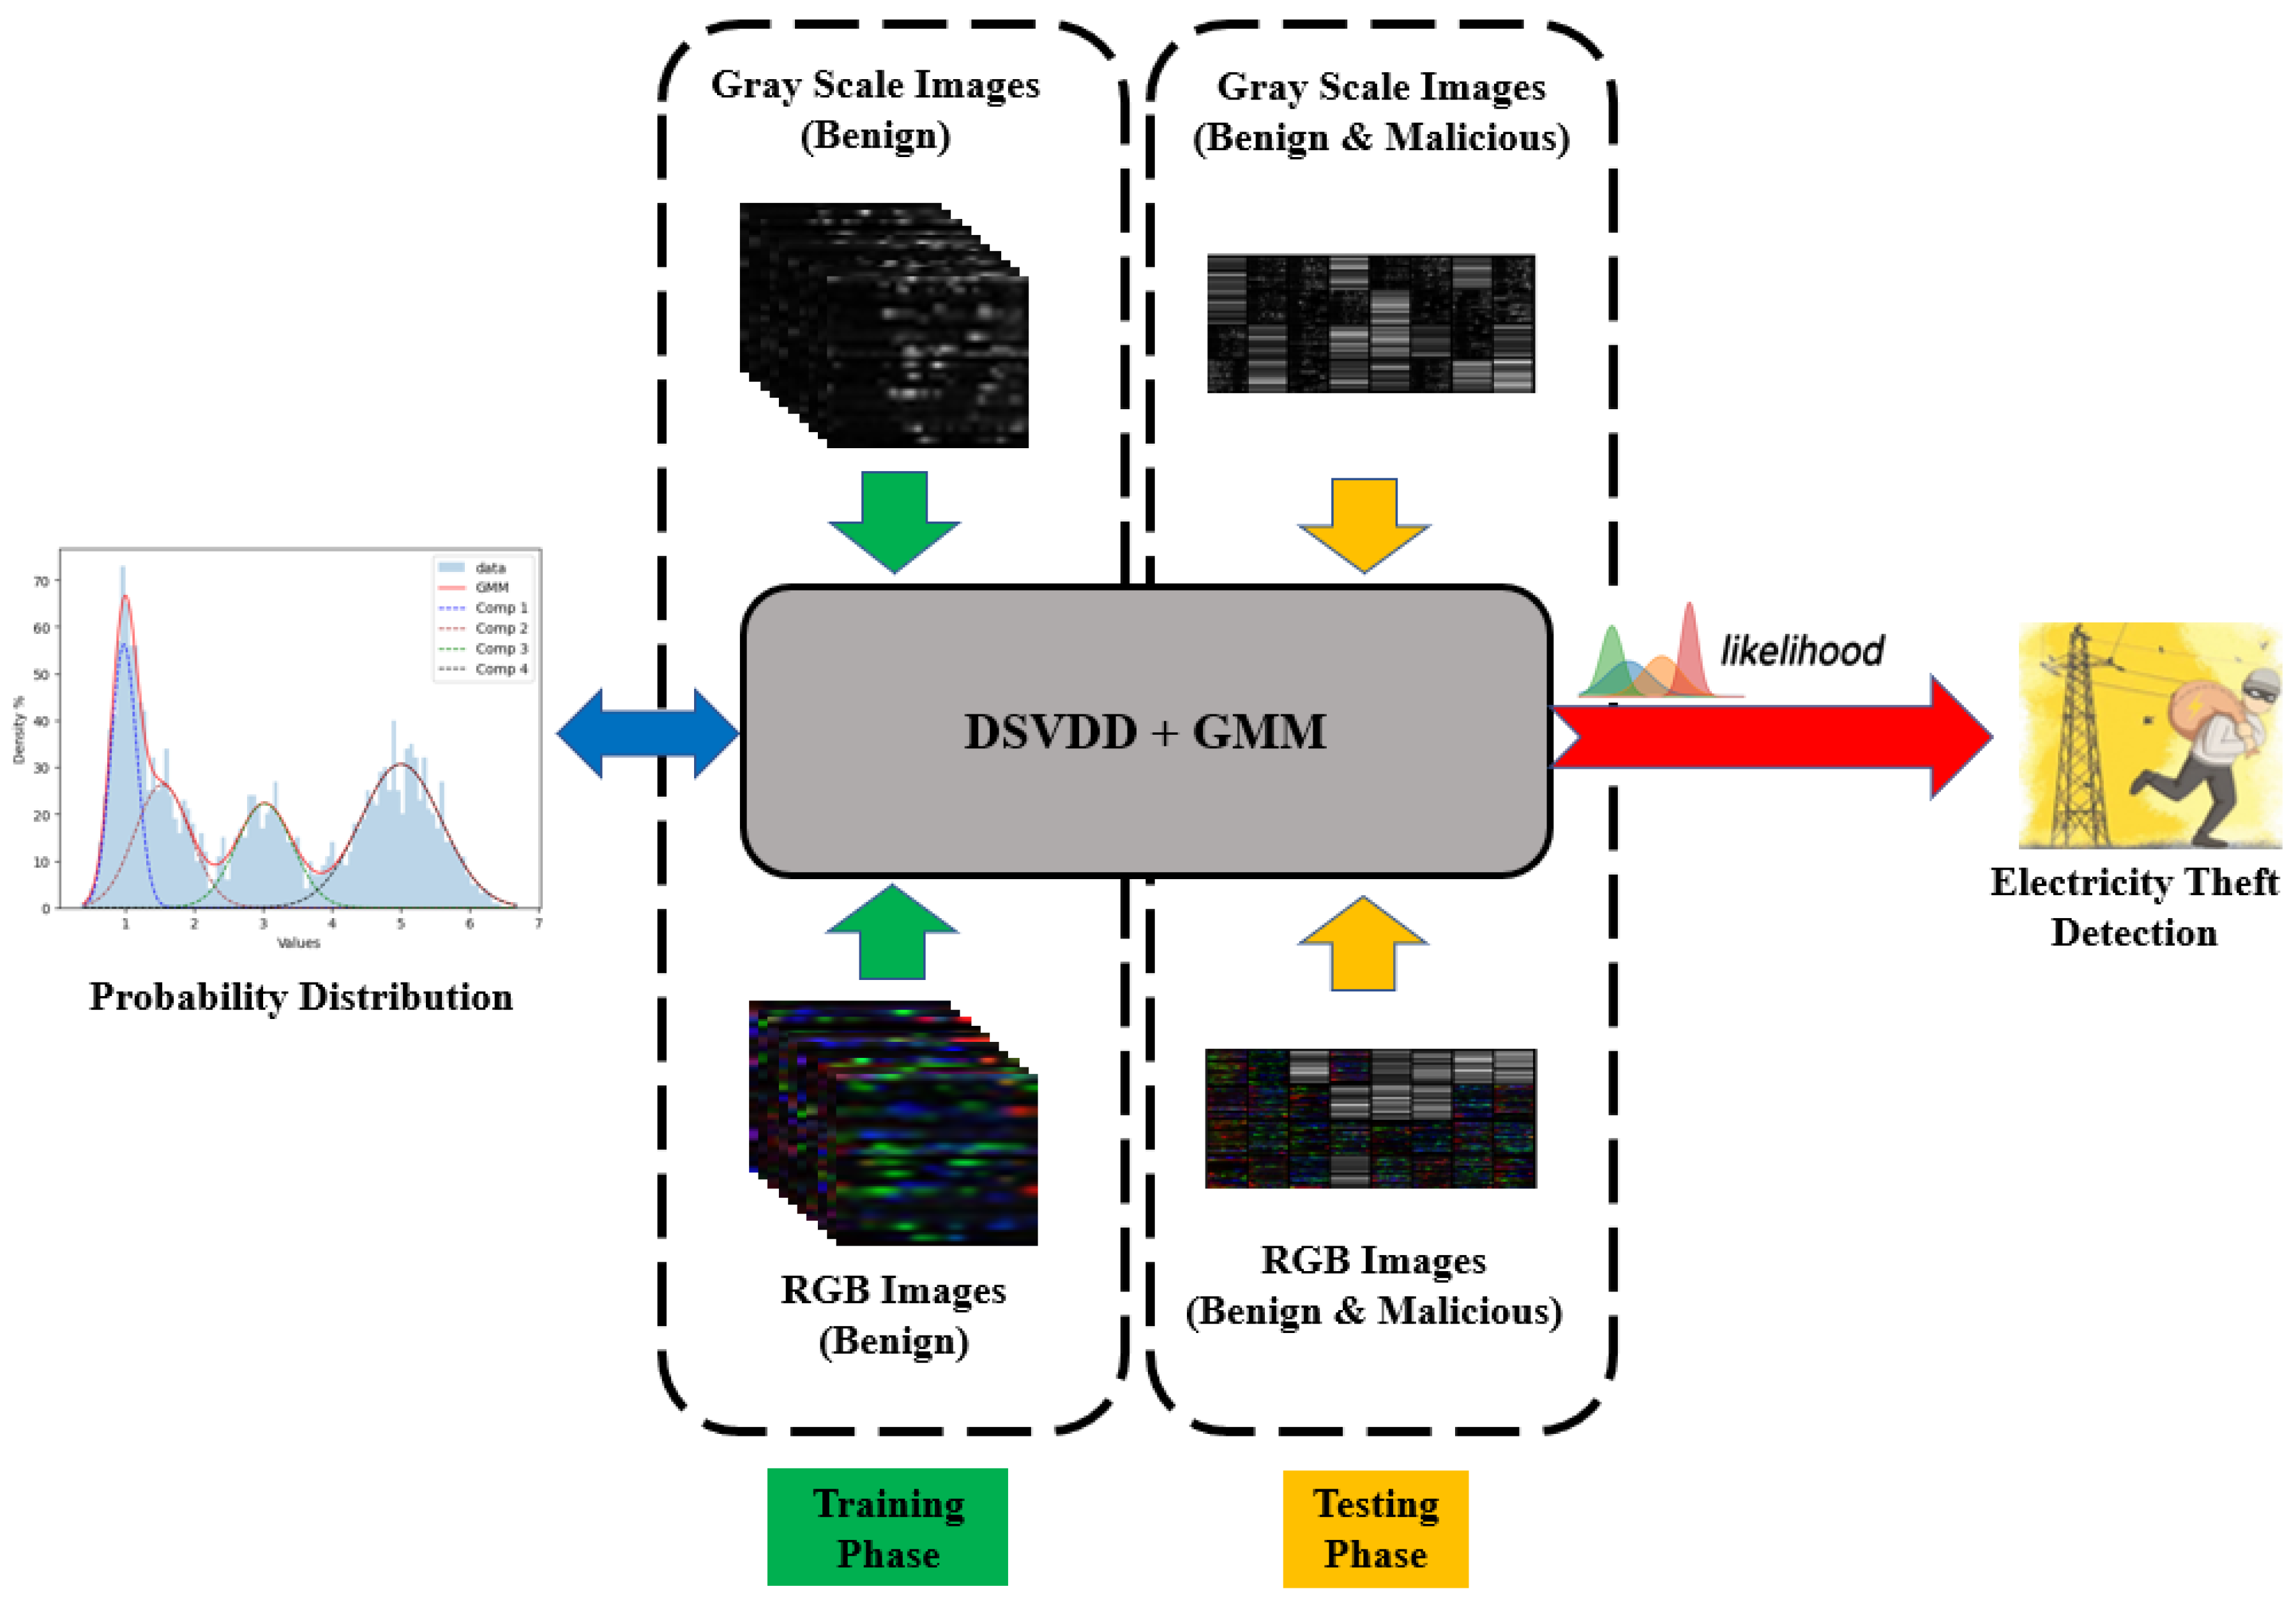
5.3. DSVDD with GMM
GMM possesses the capability of estimating the probability density function of data and exhibits flexibility in modeling complex data distributions. It can capture different modes of data and provides probabilistic assignments, making it useful for tasks such as outlier detection and anomaly detection. To determine the maximum likelihood, the EM algorithm is employed, updating parameters iteratively through the expectation step and the maximization step as described in
Section 4.6. Note that the maximum likelihood indicates the highest probability that a point is benign, while minimum probability suggests that the point is an outlier. When
GMM is used in anomaly detection, it can generate probability densities for the samples after training. Consequently, the likelihood serves as an anomaly score for detecting anomalous samples, as abnormal ones exhibit lower likelihoods.
GMM is a good option for better precision and recall in the context of anomaly detection due to its ability to handle the class overlap problem, which can be effectively mitigated by utilizing GMM after DSVDD. The class overlap problem arises when normal and anomalous data instances share similar characteristics, making it challenging to accurately distinguish between them. DSVDD is a powerful technique for defining a decision boundary around normal data, aiming to encapsulate it within a hypersphere. However, when there is significant class overlap, DSVDD alone struggles to precisely identify and separate anomalous instances.
By incorporating
GMM after
DSVDD as illustrated in
Figure 11, the performance in terms of precision and recall can be improved.
GMM has the ability to model complex data distributions and capture different modes, which allows it to better handle situations where there is an overlap between normal and anomalous data.
GMM can provide a more nuanced understanding of the underlying data distribution and assign probabilistic scores to individual instances. This combination of
DSVDD and
GMM leverages the strengths of both methods, where the
DSVDD’s strength is in its ability for defining the initial decision boundary and
GMM’s strength is for refining anomaly detection by considering the probability densities of the samples. By utilizing
GMM after
DSVDD, the class overlap problem can be mitigated, leading to improved precision and recall in electricity theft detection.
6. Experimental Work
The detectors being investigated are trained and tested using the PyTorch API. The electricity theft detectors, including benchmarks, are first trained offline at the electricity utility company. Following that, the electricity company performs real-time online detection to identify malicious samples.
6.1. Evaluation Matrices
The number of correctly identified malicious samples is represented by true positive (), while the number of correctly identified benign samples is represented by true negative (). On the other hand, a false positive refers to the number of benign samples wrongly identified as malicious, and a false negative represents the number of malicious samples wrongly identified as benign. To evaluate the performance of the detectors under investigation, we employ multiple evaluation metrics, including accuracy, precision, recall, F1-score, and AUC of the Receiver Operating Characteristics (ROC) curve. These evaluation metrics provide comprehensive insights into the performance of classification models, allowing for a more thorough assessment of their effectiveness in differentiating between positive and negative instances. In this subsection, we define these metrics.
Accuracy assesses the model’s overall prediction correctness, calculated as the ratio of correctly classified instances to the total number of instances. The accuracy is computed using Equation (
9).
Precision measures the quality of positive predictions, specifically, the proportion of correctly identified affirmative cases
among all instances identified as positive. The precision is computed using Equation (
10). It helps determine the model’s ability to avoid false positives.
Recall, referred to as true positive rate or sensitivity, quantifies the model’s capability to correctly detect malicious consumption. The recall is computed using Equation (
11). Recall provides insight into the model’s ability to avoid false negatives.
The F1-score is a metric that consolidates precision and recall into one value. It signifies the harmonic mean of precision and recall, offering a balanced assessment of the model’s performance. The F1-score is calculated using Equation (
12).
ROC-curve plots the true positive rate (recall) against the false positive rate at different classification thresholds. AUC-curve summarizes the performance of the classifier across all possible thresholds. A higher AUC value indicates better overall performance, as the model achieves higher true positive rates while maintaining lower false positive rates.
6.2. Benchmark Detectors
We evaluate the performance of our proposed
DSVDD-based detectors by conducting a comparative analysis against existing supervised and unsupervised detectors. The supervised detectors undergo training and testing using both benign and malicious samples. These encompass shallow classifiers such as Naïve Bayes [
15] and multiclass SVM [
16], as well as deep classifiers like FF-RNN [
22] and CNN-LSTM [
26]. Conversely, the unsupervised detectors are trained exclusively on benign samples and subsequently tested on datasets comprising both benign and malicious instances. This category includes shallow models such as
OC-SVM [
16] and ARIMA [
31], alongside a variety of deep autoencoders [
36,
37,
38,
39,
40].
However, static classifiers like SVM, Naïve Bayes, and feed forward-based detectors lack the ability to capture the time-series nature of the dataset or handle the overlap between malicious and benign data. The dynamic ARIMA model can capture temporal dependencies but it has a shallow architecture that fails to detect data overlap adequately. Moreover, the autoencoders introduced in [
36,
37,
38,
39,
40] assume the existence of malicious data and use it to optimize the threshold of the detector. This dependency on specific malicious data limits the detector’s practicality in detecting new attacks, particularly deceptive attacks that cause data overlap.
6.3. Experimental Results and Discussion
Table 4 provides a summary of the performance of the proposed and benchmark detectors using the ISET dataset. The performance metrics are computed using entirely unseen data, i.e., test dataset. It is important to note that this dataset is distinct from the data used for selecting hyperparameters and constructing the
ROC curves, which were derived from the validation dataset.
The experimental results presented in
Table 4 indicate that
OC-DSVDD demonstrates significant enhancement in performance compared to the best results achieved in the literature. Specifically, achieving a 1.5% increase in recall,
in precision,
in accuracy,
in F1-score, and an impressive
boost in
AUC compared to the
LSTM-AEA model, which represents the best performing model in the literature. When we integrate
DSVDD with
OC-SVM, further improvements are observed, with a 0.5% and 6% increase in recall and precision respectively,
in accuracy,
in F1-score, and
in
AUC. Additionally, the
DSVDD-GMM combination results in remarkable enhancements of
in recall,
in precision,
in accuracy,
in F1-score, and a substantial
improvement in
AUC.
Notably, when compared to benchmark detectors,
DSVDD-GMM achieves the most impressive results, surpassing both supervised and unsupervised models. This demonstrates that the deep
SVDD and probabilistic attributes of
DSVDD-GMM contribute to its superior performance compared to shallow and deep classifiers, as well as other models investigated in our study.
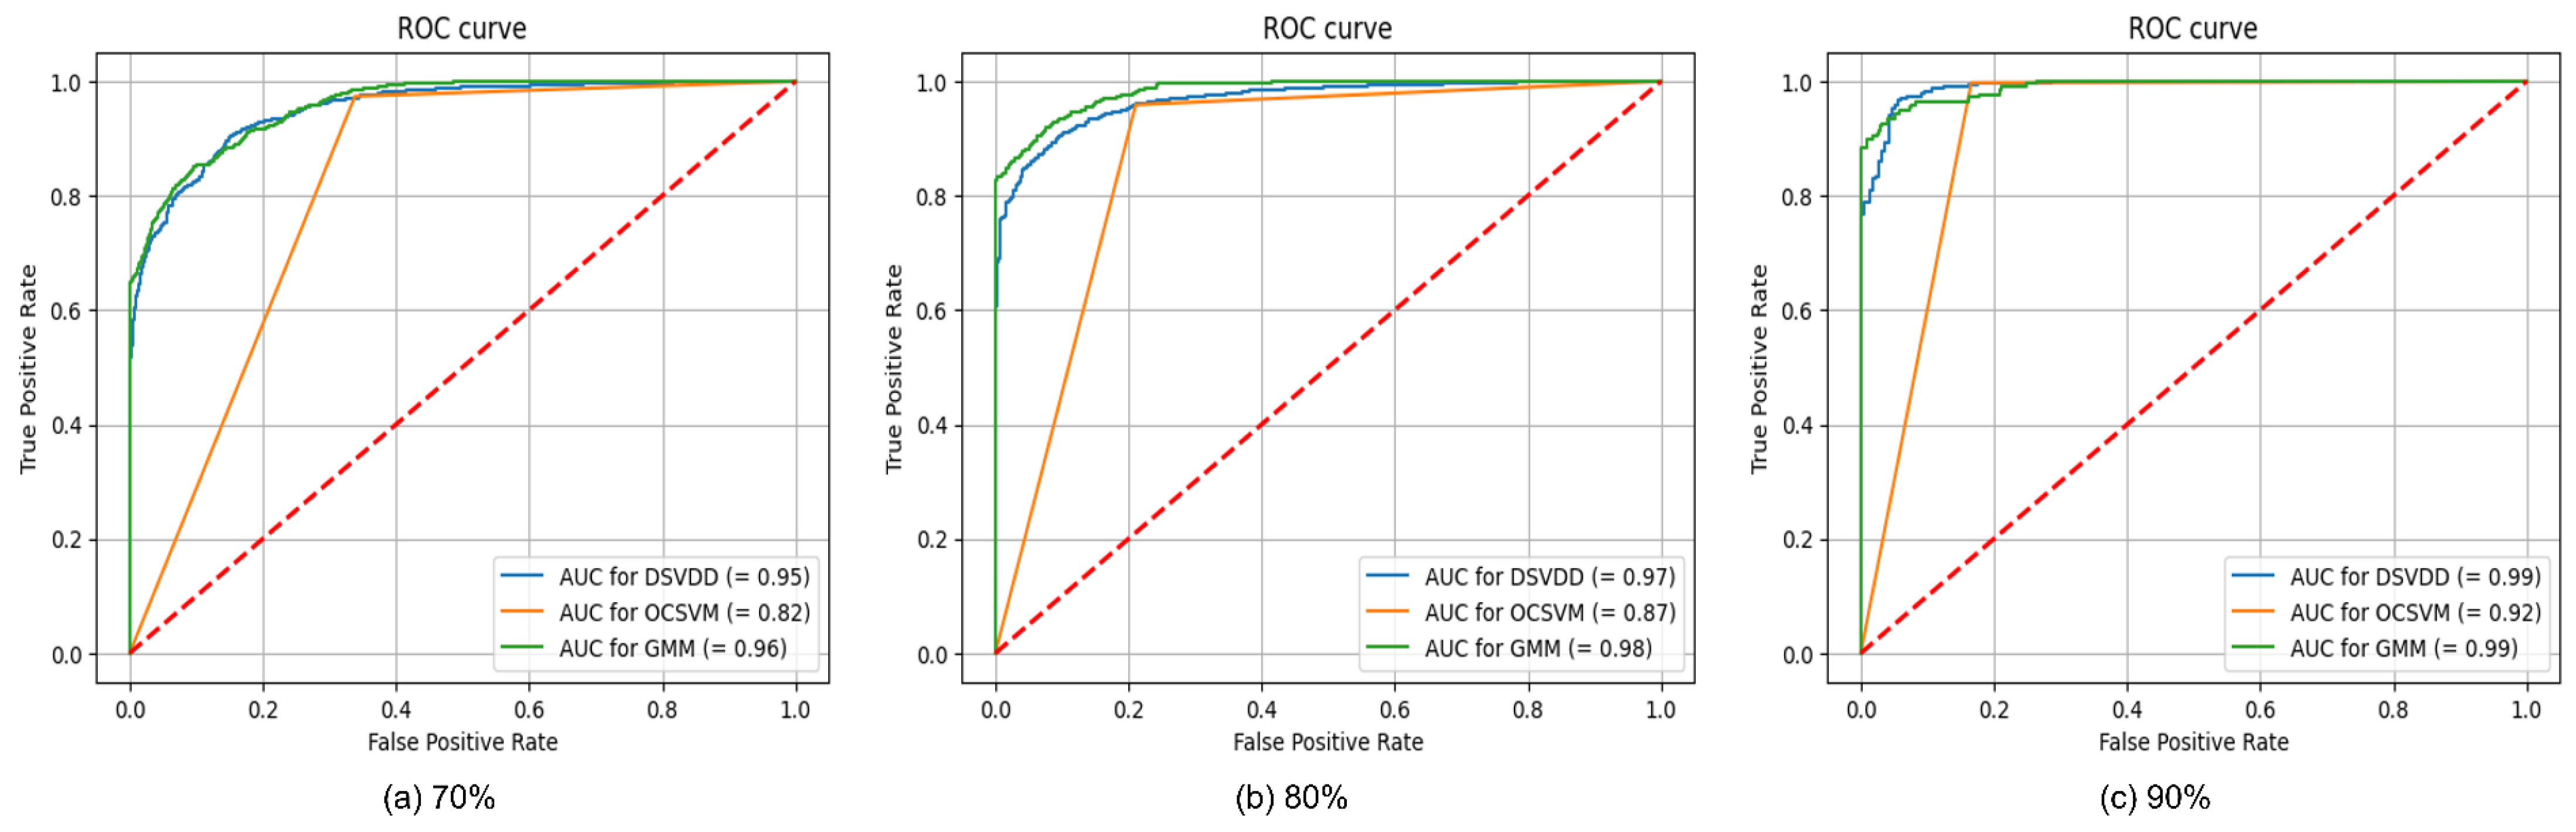
Figure 12 and
Figure 13 illustrate the
AUC-ROC curves for our proposed detectors in both RGB and grayscale formats, using varying training dataset sizes of 70%, 80%, and 90%, respectively.
To assess the influence of varying training dataset sizes on the performance of the detectors, we partitioned the dataset into different ratios, including 70:30, 80:20, and 90:10, where the first number represents the size of the training dataset and the second number represents the size of the test dataset. The detectors’ performance results with using these three different ratios are given in
Table 5,
Table 6 and
Table 7. As evident from the tables, increasing the size of the training data results in improvement across several metrics, including recall, precision, accuracy, F1-Score, and
AUC.
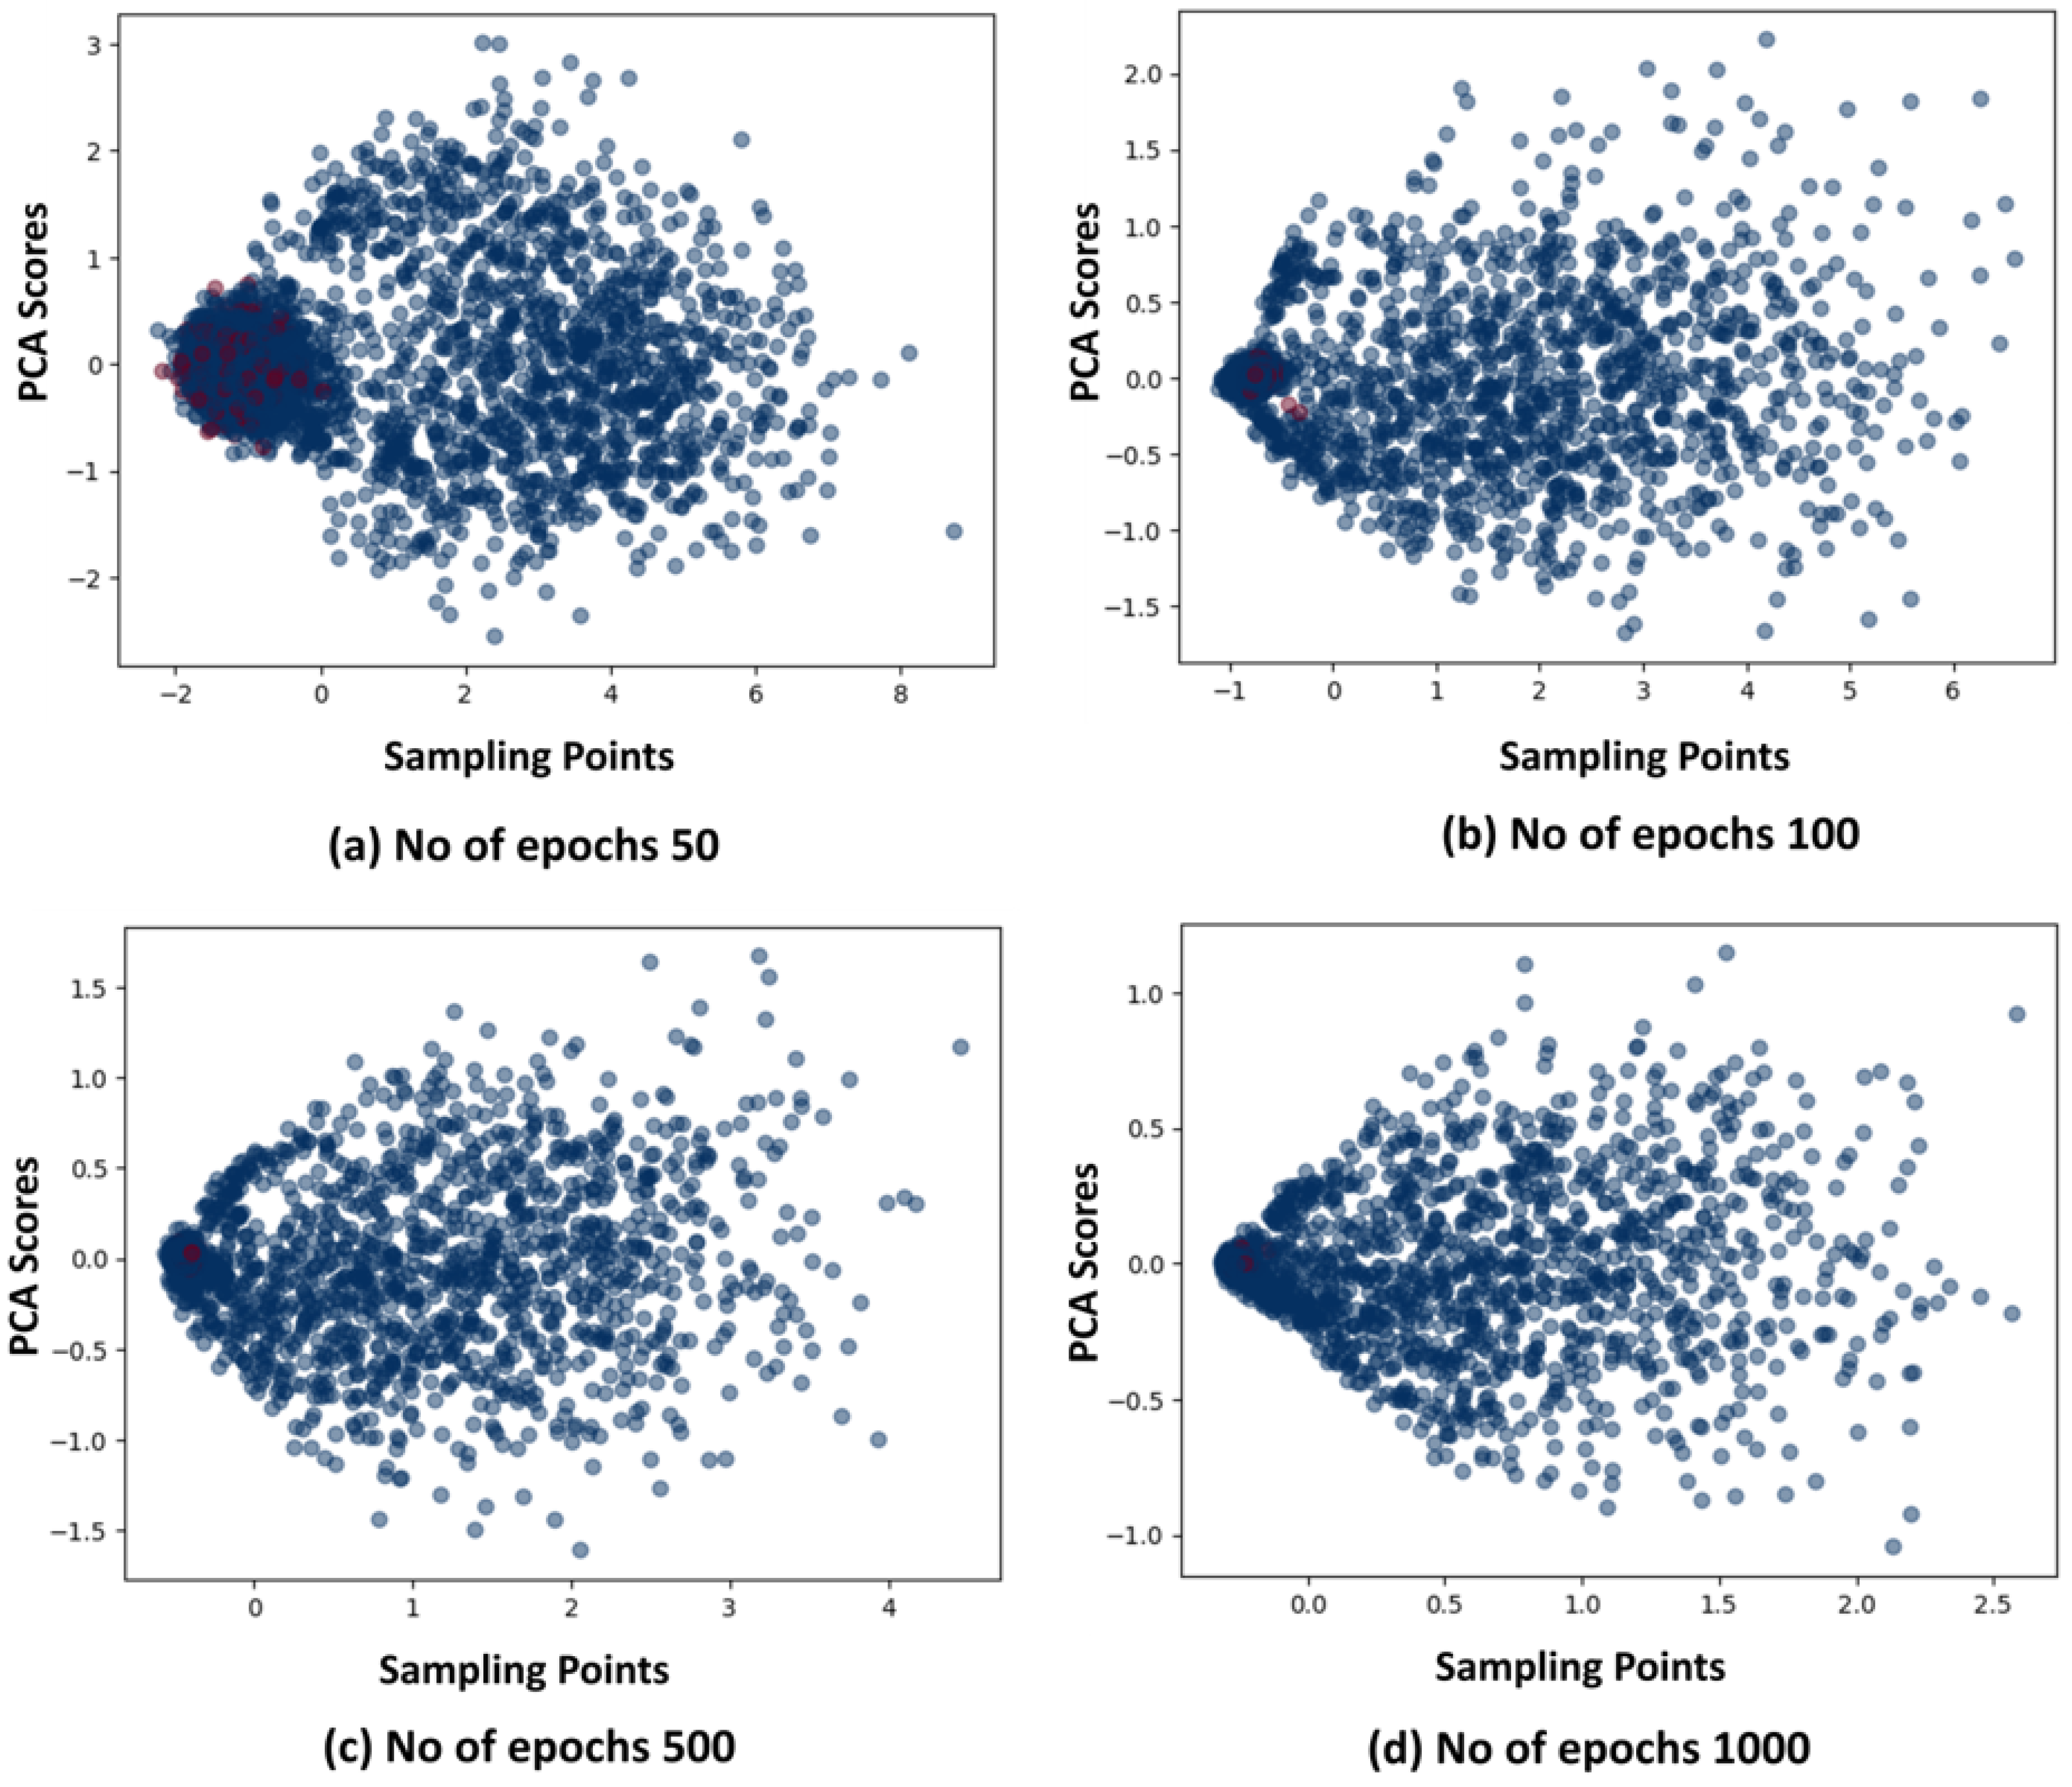
In addition, we conducted experiments with varying numbers of epochs to assess their impact on the performance of the proposed detectors. Through this exploration, we observed that increasing the number of epochs led to improved data compactness and overall performance enhancement. These findings are illustrated in
Figure 14, where the PCA method was used for visualization. From
Figure 14, it is noticeable that the red dots, representing benign samples, exhibit increased compactness as the number of epochs rises. The maximum level of compactness is observed in
Figure 14d, where the number of epochs reaches 1000, resulting in the minimum hypersphere radius (
R). While the blue dots, which represent the malicious samples, become outside the hypersphere radius (
R) and can be easily identified as outliers. This enhanced compactness is reflected in the evaluation metrics, thus addressing the issue of overlapping between benign and malicious samples.
7. Conclusions and Future Work
In conclusion, we have proposed an efficient one-class false data detector based on DSVDD for smart grids. Our work can address two main limitations including the unavailability of malicious data and the inability to detect new (unseen) attacks. Our approach enhances data representation by converting smart meter time-series readings into images, which serve as the input to our machine learning model. Additionally, it does not only train a DNN but also optimizes a hypersphere that encapsulates the data within the output space. A distinctive feature of our proposal is the integration of both OCSVM and GMM into a unified class classifier, greatly enhancing the overall effectiveness of our approach. To address the problem of data overlapping, we have introduced a solution that effectively manages these cases, significantly improving the accuracy of our approach. Additionally, we have eliminated the reliance on thresholds for the detection of false data because finding optimal thresholds without knowledge on the malicious data is a challenge. This enhancement greatly boosts the reliability and flexibility of our approach, particularly in boundary decision-making and likelihood estimation. To assess the performance of our detector, we have conducted extensive experiments. The results have demonstrated better performance across a range of evaluation metrics, including accuracy, AUC, precision, recall, and F1-score, comparing to the existing proposals in the literature. Specifically, comparing to the current cutting-edge detectors, the results have showed enhancements of 1–3% in terms of recall and 3–9% in terms of AUC. However, although our classifier is performing well on the consumption patterns it learned during the training, it may fail when the consumption pattern changes and in this case new retraining process is needed which require high computation resources. To address this limitation, in our future work, we will integrate our classifier with a reinforcement learning approach. This integration will empower our classifier to efficiently adapt and detect new power consumption patterns.


 ,
, 


