Article

Interaction among Multiple Electric Vehicle Chargers: Measurements on Harmonics and Power Quality Issues

1
Dipartimento Energia “Galileo Ferraris”, Politecnico di Torino, 10129 Turin, Italy
2
Edison SpA, 20121 Milano, Italy
*
Author to whom correspondence should be addressed.
Energies 2023, 16(20), 7051; https://doi.org/10.3390/en16207051
Submission received: 31 July 2023 / Revised: 25 September 2023 / Accepted: 26 September 2023 / Published: 11 October 2023
(This article belongs to the Special Issue Smart Electric Vehicle Charging Approaches for Demand Response)

Abstract

:
The electric vehicle (EV) market is growing rapidly due to the necessity of shifting from fossil fuel-based mobility to a more sustainable one. Smart charging paradigms (such as vehicle-to-grid (V2G), vehicle-to-building (V2B), and vehicle-to-home (V2H)) are currently under development, and the existing implementations already enable a bidirectional energy flow between the vehicles and the other systems (grid, buildings, or home appliances, respectively). With regard to grid connection, the increasingly higher penetration of electric vehicles must be carefully analyzed in terms of negative impacts on the power quality; and hence, the effects of electric vehicle charging stations (EVCSs) must be considered. In this work, the interactions of multiple electric vehicle charging stations have been studied through laboratory experiments. Two identical bidirectional DC chargers, with a rated power of 11 kW each, have been supplied by the same voltage source, and the summation phenomenon of the current harmonics of the two chargers (which leads to an amplification of their values) has been analyzed. The experiment consisted of 100 trials, which considered four different combinations of power set-points in order to identify the distribution of values and to find suitable indicators for understanding the trend of the harmonic interaction. By studying the statistical distribution of the Harmonic Summation Index, defined in the paper, the impact of the harmonic distortion caused by the simultaneous charging of multiple electric vehicles has been explored. Based on this study, it can be concluded that the harmonic contributions of the electric vehicle charging stations tend to add up with increasing degrees of similarity of the power set-points, while they tend to cancel out the more the power set-points differ among the chargers.

1. Introduction

The increasing share of renewable energy sources (RESs) in the electrical infrastructure is a mandatory consequence of the European set of proposals, designed to make the EU’s climate, energy, transport and taxation policies fit for reducing net greenhouse gas emissions by at least 55% by 2030, compared to 1990 levels [1]. As a result, in the last few years, the Electric Vehicle (EV) market has experienced a rapid growth, as the world is moving toward more sustainable mobility systems, sustained by the increasing electrification of the road transport sector, with a consequent reduction in its carbon emissions. According to the Global EV Outlook 2023 [2], the sales of EVs, including both Battery Electric Vehicles (BEVs) and Plug-in Hybrid Electric Vehicles (PHEVs), reached USD 10.5 million, and this rising trend seems to be continuing. Moreover, according to the IEA report [3], by 2030, EVs will represent more than 60 % of vehicles sold globally, so the the number of public (or publicly accessible) charging points (2.7 million reached in 2022) will continue to expand. This will be reflected in the number of products available on the market for charging vehicles, which need to be evaluated as in the review [4]. In the context of a rising number of EVs, the Vehicle-to-X (V2X) paradigm, including both Vehicle-to-Grid (V2G) and Vehicle-to-Building (V2B), is becoming increasingly interesting, both for the grid and for different energy community configurations. In these applications, a high number of Electric Vehicle Charging Stations (EVCSs) will be connected to a grid infrastructure (either public or part of an energy community) close to each other. The storage capabilities of EVs have led to the development of smart charging approaches, enabling to use of EV batteries in the most cost-effective way. In fact, thanks to the bidirectional electricity flow between vehicles and the network, the power can be sent back to the grid when needed, thus providing benefits both to the vehicle owners (in terms of additional revenues) and to grid operators (in terms of the offered services that may improve quality, reliability, and sustainability of the grid itself) [5]. The harmonic current content has to adhere to the limits established by the IEEE Standards [6] or to those fixed by the European Standards [7]. The widespread adoption of EVs may however have negative effects on the power quality of the electrical grid. Therefore, it is crucial to consider the impact of EVCSs on the grid side. According to [8], integrating several EVs into the grid could lead to voltage imbalances and to a decrease in the transformer efficiency. Moreover, when multiple vehicles are charging or discharging simultaneously, as in large parking lots, the individual harmonics could add up and hence approach the standard limits, resulting in strong harmonic injections into the power grid. This behavior can negatively impact the energy supplied to the relevant electrical node, potentially hindering proper equipment functioning. This paper will try to study the disturbances injected from multiple EV chargers connected to the same electrical node, as in a realistic environment. Unlike other works, the results of this paper have been obtained by analyzing the currents coming from two identical real chargers, by studying the contribution of each of them to the selected frequencies and by comparing the theoretical sum of the current harmonics with the measured harmonics. The paper explores the known effects of the EV charger aggregation in Section 2 and introduces the setup of the tests in Section 3. Then, Section 4 reports the approach used to carry out to the tests. In Section 5, the results for the considered harmonic orders are reported. Finally, some concluding remarks are given.

2. Overview of the Effects of Aggregating Several EV Charging Points

The expression “power quality” indicates the “characteristics of the electric current, voltage and frequency at a given point in an electric power system, evaluated against a set of reference technical parameters” [9]. In Europe, the EN 50160 Standard specifies the main characteristics that the grid voltage should meet at the public low-, medium-, and high-voltage AC supply terminals [10]. Any deviation in the voltage or current waveforms that can degrade the performance of a device, equipment, or system, or adversely affect living or inert matter is an “electromagnetic quality disturbance”, as stated in [11]. In more detail, the definition of a power quality disturbance is generally accepted as any change in voltage, current, or frequency that interferes with the normal operation of electrical equipment [12] or in the quality of power while supplying an electrical equipment [13].
The integration of several EVs can have a potential impact on the power quality of the grid they are connected to: the magnitude of the impact depends on the number of EVs being charged at the same time, their location, and their charging rate [14]. The paper [15] examines the impact of V2G operation when multiple vehicles are connected. Various scenarios and EV penetration levels are analyzed to study both the harmonic distortion and stability effects. The results indicate that the primary concern for power quality is the harmonic distortion; in fact, the higher the EV share, the higher the Total Harmonic Distortion (THD). Consequently, the number of equipment affected by the reduced power quality and absorbing distorted current from the grid increases. Some studies, such as [16], have analyzed the impact of equipment diversity within a EVCS. The study tested four different fast chargers and recorded full charging cycles four times for each charger, analyzing the amplitude and phase angles of each harmonic. The research found that the phase angles of the current harmonics varied within a preferential range that could potentially lead to an increase in the current THD. In [17], one EV charger was analyzed both in AC and DC. Current harmonics emissions and conductive electromagnetic disturbances were considered, while the THD was used to evaluate the global power quality level. This analysis, however, was based on a single EV charger, so it was suggested that it should be repeated by including different Devices Under Test (DUT) to highlight possible differences. Another case study which considers both the harmonics and supra-harmonics content is presented in [18]. Supra-harmonics are defined in [19] as waveform distortions in the frequency range from 2 to 150 kHz. This range is still only partially standardized, while the amount of devices emitting in this range is increasing [20], so it could lead to undesirable effects. In [18], the emissions caused by nine different BEV models have been studied and eigth out of nine have proven to be the source of supra-harmonics. The tests have also been conducted for power levels differing by the nominal one: they show a variation of the fundamental reactive power and lead to the recommendation to execute future tests at non-nominal power in order to account for possible differences. With reference to the aggregation of EV charging points, the effects of multiple EVs connected to electrical grids have already been studied in order to assess how the disturbances injected from the aggregate propagate in the low- and medium-voltage networks. For example, the JRC report [21] studied the grid harmonic impact of multiple EVs. Focusing on the phase summation or cancellation of the harmonics, it was revealed that the phase angles between the same harmonic order tend to be lower than 90°, leading to a summation of the harmonics and therefore suggesting that there could be a maximum acceptable number of chargers connected to the same infrastructure. In contrast, the authors of [22] had previously pointed out how adding chargers from different manufacturers may result in a notable harmonic cancellation. Some of the tests, however, showed how the chargers failed to comply to standard limits, suggesting that the harmonics added up until reaching a maximum tolerable value. What seems to be a recurrent element in these published works is that when multiple chargers are operating together on the same electrical node (e.g., a parking lot), their disturbances would sum-up, approaching the standard limits, potentially amplifying their values and hence causing issues to the other customers.

3. Laboratory Set-Up

The authors of previous work established a laboratory test bed using real-time simulation and Power Hardware-in-the-Loop (PHIL) layout to study bidirectional EVCSs [23,24]. In this setup, the currents measured on a single EV charging point under test were multiplied to emulate 20 charging points connected to the same electrical node. However, this resulted in a harmonic spectrum summation, leading to instabilities and preventing the equipment from operating correctly. Starting from those results, the current work studies the behavior of the charger in depth without the simulated environment, evaluating the interaction of multiple chargers by employing two identical EV DC chargers with a rated power equal to 11 k W . The chargers were supplied by the same voltage source: in Case 1, the voltage source was a linear power amplifier; in Case 2, the voltage source was the electrical grid. The latter case enabled us to achieve the maximum power for both chargers simultaneously. Figure 1 shows a simplified layout of the test bed, with the current measurement points highlighted.
The main components used to carry out the tests are as follows:
  • Power amplifier: A three-phase linear power amplifier with a nominal power of 7 k V A per phase has been used. This technology has been chosen because of its performance. In fact, the linear amplifier has a maximum distortion on the generated voltages equal to 0.7 % at the maximum output power [25]. Moreover, the introduced short time delay enables the use of a simple interface topology and guarantees high stability.
  • Chargers and electric vehicles: The cars used are two Nissan Leaf, with battery capacities of 62 k W h and 40 k W h, respectively, and equipped with the DC CHAdeMO plug. The model of charger (which cannot be disclosed for confidentiality reasons) is a bidirectional WB, with rated power 11 k W in G2V and 10 k W in V2G operation.
  • Data acquisition: The HBM GEN7tA is a transient recorder and data acquisition system. It has been used to visualize, monitor, record, and post-process the electrical quantities involved in the tests. Three identical Hioki 9018-50 clamp probes have been employed for capturing the currents during the tests. The clamps have a range from 10 A to 500 A AC, for a total of six ranges, with the amplitude accuracy equal to ± 1.5 % rdg ± 0.1 % f.s. (45 to 66   Hz ) and the phase accuracy equal to ± 2.5 ° for frequencies from 40 Hz to 3 k Hz .

4. Test Description

The WBs were supplied with a standard voltage V n o m = 230   V by the linear power amplifier in order to have low disturbances injected from the amplification stage. The testing was conducted using different charging power set-points. Initially, the vehicles were charged at power P 1 = 4   k W , and then the power set-point was changed for the two chargers. To ensure that the tests were independent from each other, the WBs were turned in the stand-by state after each measurement. Different power scenarios were studied as suggested by the authors of [18], which indicated that there may be slight variations in the disturbance during a charging with power differing by the nominal one. The preliminary measurements and comparisons were carried out by using the power amplifiers (Case 1); after that, we proceeded by using as a voltage source the real network, in order to reach the maximum rated power for both the WBs (Case 2). The harmonic content was similar in both cases, as the THD of the network supply was very low. The power set-point combinations and the relative cases are listed in Table 1.

4.1. Procedure

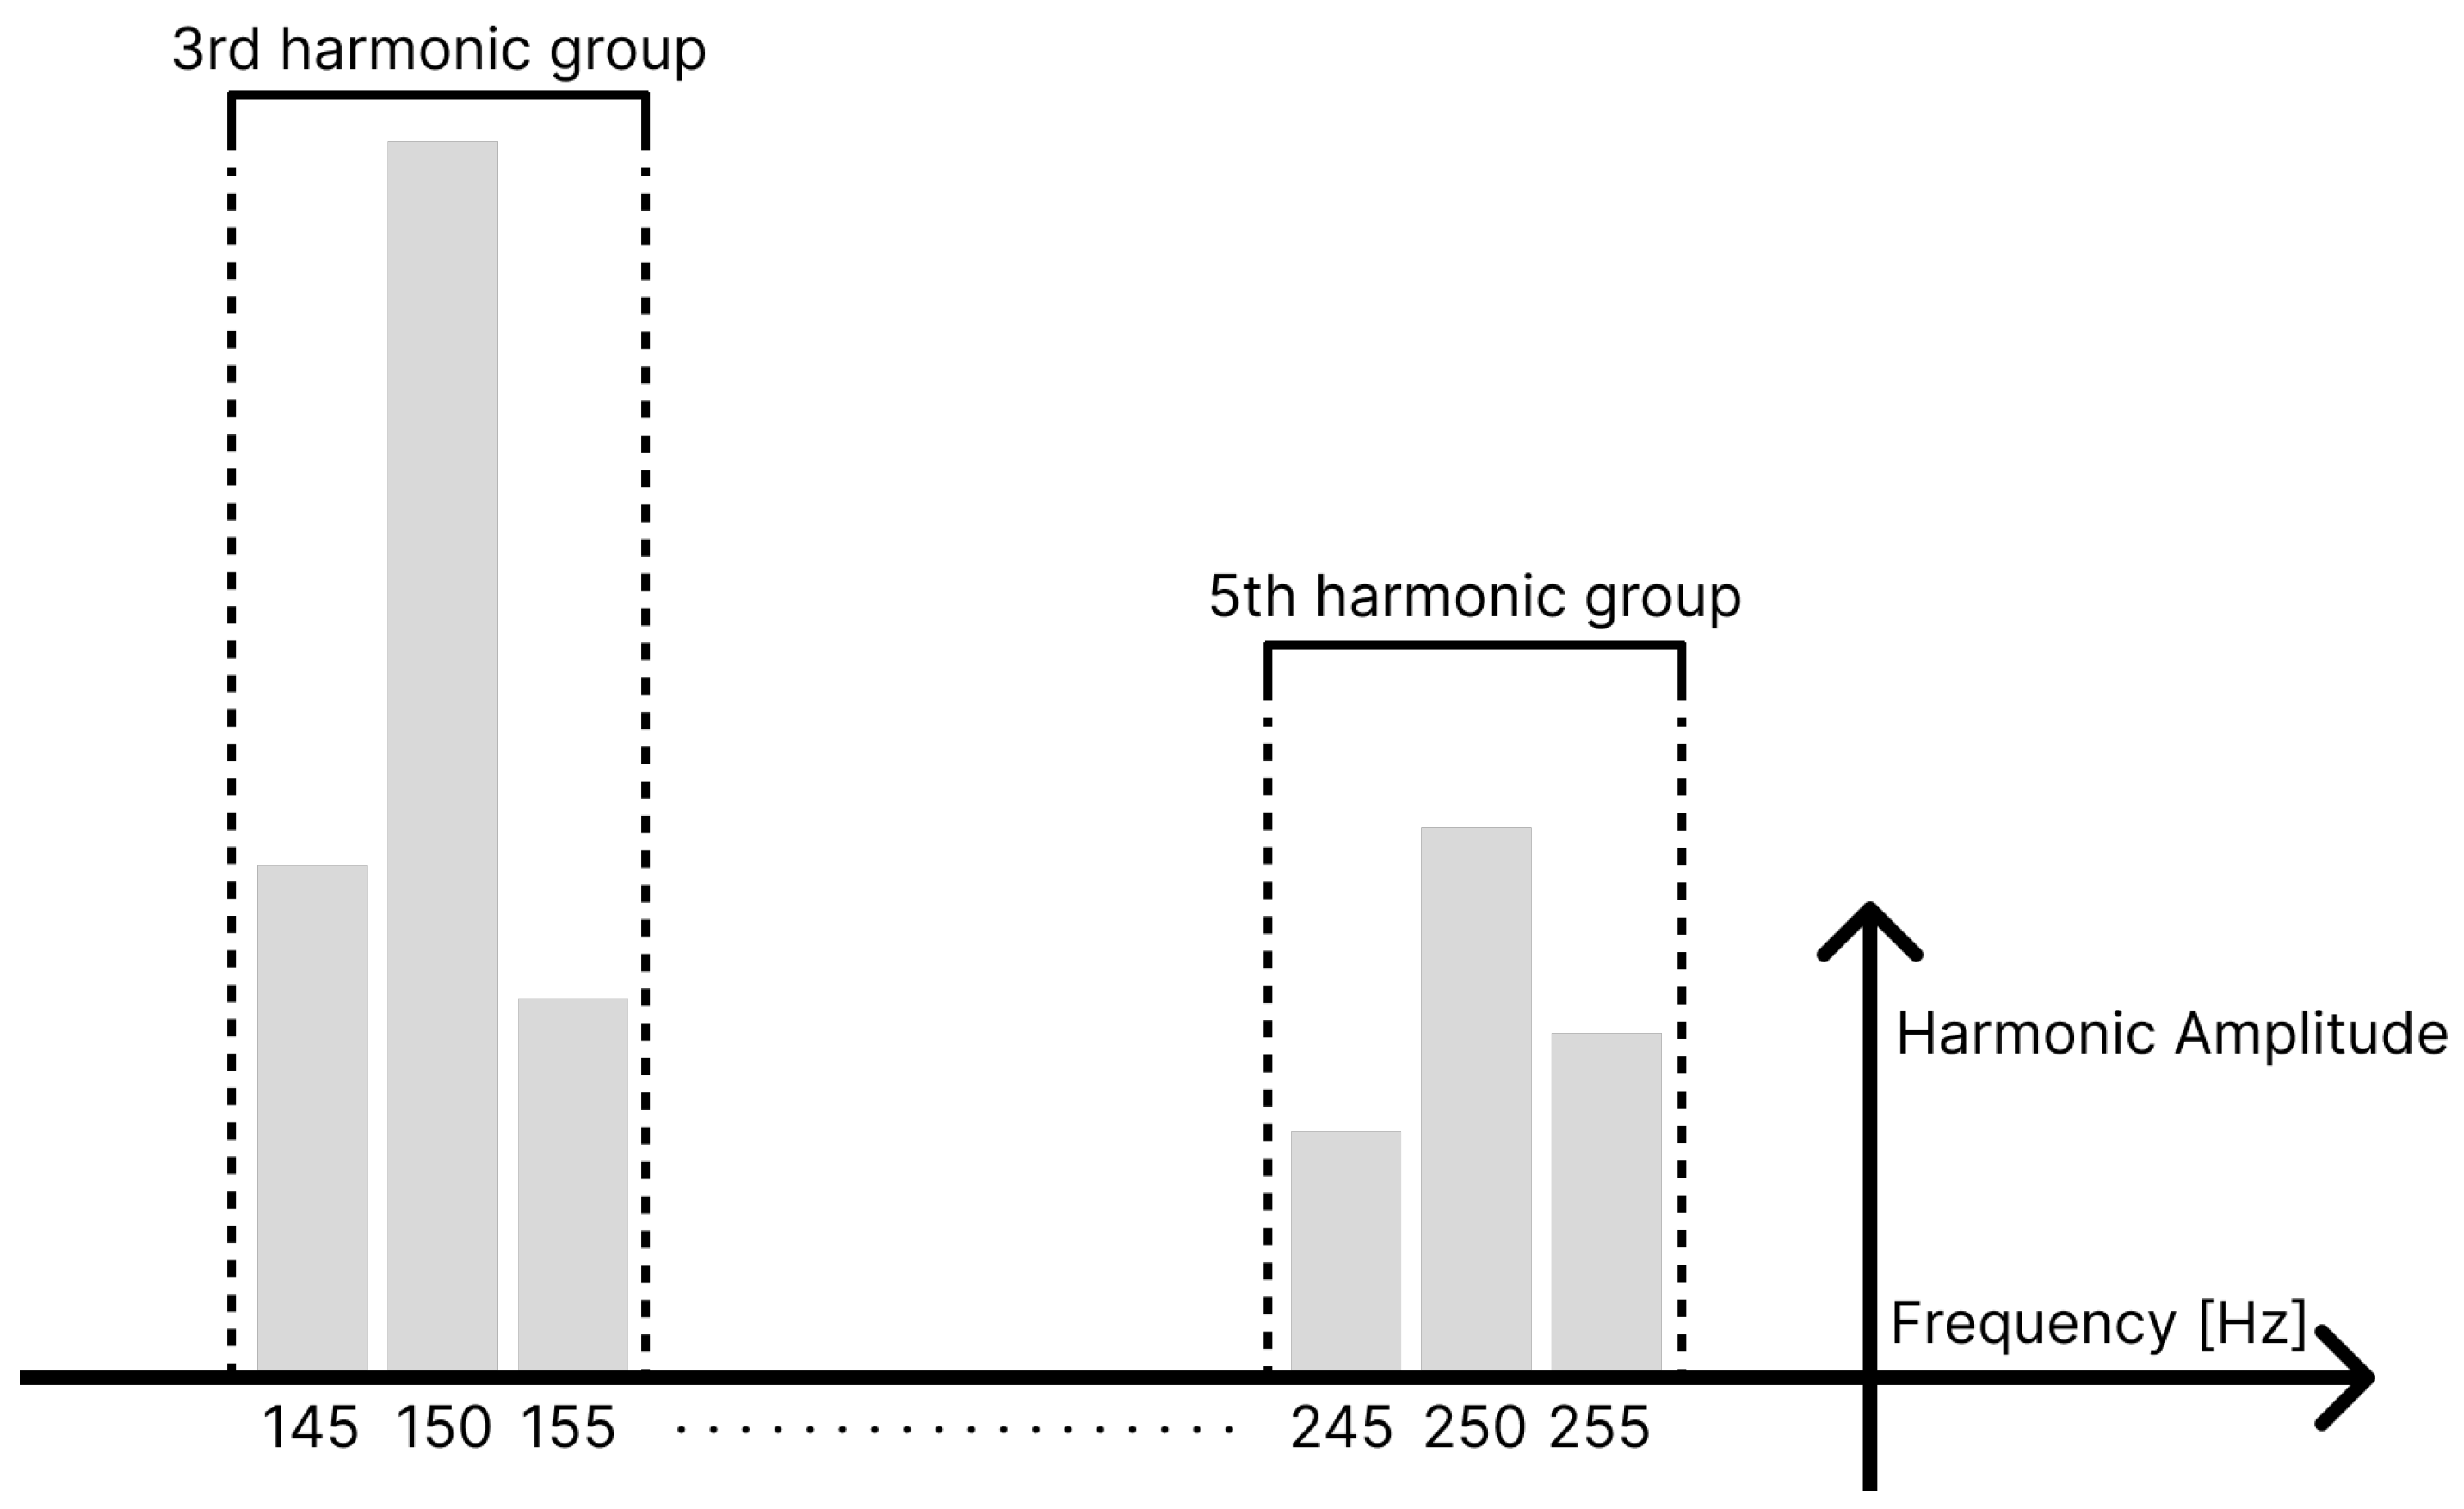
The current measurements, as depicted in Figure 1, have been taken on the first phase of each WB and on the output of the power amplifier (in Case 1), or grid supply (in Case 2), in order to acquire the sum of the currents of the two WBs. The observed behavior was the same for the other phases, so, the results are reported for the first phase only. The data gathering consisted of acquiring the current waveforms 100 times for each power set-point combination, with a sampling rate of 20 kSample/s. This sampling frequency will be sufficient to avoid the aliasing phenomenon till the 40th order, as the frequency of the acquisition is ten times higher than the highest measured order. The acquisitions have been made with the recorder presented above. The Fast Fourier Transform (FFT) has been calculated in Matlab from the acquired current recordings, based on 10 cycles of the target currents, as stated in the IEEE Standard [26], in order to achieve a 5 Hz resolution. The harmonic component magnitude is then calculated by taking the RMS value of the center frequency combined with the values at the two adjacent ± 5 Hz frequency bins as calculated in Equation (1) for the example in Figure 2.
G h = i = 1 1 X ( 10 h + i ) Δ f 2
where:
  • Δ f = Bins width (5 Hz in this case);
  • h = Harmonic order;
  • G h = Group value at the order h.

4.2. THD Evaluation

Harmonics can be evaluated in two ways:
  • Individually, by comparing their amplitude to the fundamental frequency;
  • Globally, using the THD.
The THD% has been computed for each one of the 100 tests. Table 2 and Table 3 contain the mean values of the THD for the 100 tests for each set-point combination under test. Currents and voltages of the THD have been measured both on the power supply (as shown in Figure 1) and on the two WBs. The THD% is always below the 8% limit, so the disturbances are acceptable in all tests. Based on the previous measurements, it was noted that on the grid side, the THD was under the limits, so the impact of the grid voltage harmonics on the tests was considered negligible. It is visible how the total THD can be lower than the one on each WB; nevertheless, as the THD averages on all the harmonic orders, the contribution on each frequency needs to be investigated due to possible problems caused by some specific harmonics.

4.3. Harmonic Sum Evaluation

After collecting all the measurements for the 100 tests, a dataset has been extracted, whereby an example of the structure (for the case P 1 = 10   k W , P 2 = 2   k W ) is reported in Table 4. Each column shows the harmonic order, whereas the rows represent the data collected in terms of the value of HSI as defined in Equation (2). Then, in Table 5, Table 6 and Table 7, the harmonic current components used to calculate the HSI for the same case are reported. A similar approach, which defines an index to evaluate the summation phenomenon called the diversity factor, was adopted by the authors of [27] for the study of harmonics summation or cancellation at an industrial facility. This index is the ratio between the RMS current value extracted from the FFT of the grouping described in Equation (1) and is directly measured on the first phase of the network (namely I h , S U P P L Y ), and is the sum of the same quantities measured on the first phase of each one of the two WBs (i.e., I h , W B 1 and I h , W B 2 ). This ratio is the only cause of error propagation due to the elaboration of the data that will reflect on the HSI and, from the current clamp specification, will be around the 3% of the HSI index itself.
H S I = I h , S U P P L Y I h , W B 1 + I h , W B 2
This index can be:
  • HSI ≥ 1: The harmonics summed;
  • HSI < 1: The harmonics canceled.
The lower the HSI, the highest is the cancellation effect on a certain harmonic order.

4.4. Data Cleaning

Based on the experience gained from previous studies [23,24] on the analyzed DUT, it has been observed that the power set-point of the charger exhibits high variability. To obtain a more accurate representation of this phenomenon, a statistical approach has been used. This approach does not only focus on increasing the number of measurements taken, but also enables both removing possible outliers and analyzing the probability distribution of the index defined for each acquired harmonic. Firstly, the instantaneous currents acquired have been elaborated through the FFT in order to obtain the RMS value of the current for each frequency. The first outcome was a spectrum of the absorbed current harmonics from the two chargers for each of the one hundred tests and for each of the four power set-points. In Figure 3, the FFT spectrum of one charger at the power of 10 k W is shown. The harmonic spectra of the same charger for the other five power set-points are presented in Appendix A. The amplitudes of each frequency have been collected in a dataset and used to compute the index defined in Equation (2).
Then, the point cloud plot of each frequency for the four different power set-points has been created to identify possible outliers in order to find non-reliable points. The outlier identification was firstly conducted with the box plots of each frequency, but the number of non-feasible points was not reasonably high, so a second approach, based on the distance calculation, has been used. For this purpose, the Mahalanobis distance m is calculated for all the observations as in Equation (3). The Mahalanobis distance is an effective multivariate distance metric that measures the distance between a point and a distribution. It has excellent applications in multivariate anomaly detection and classification on highly imbalanced datasets.
m = ( x x ¯ ) · S 1 · ( x x ¯ ) T
where:
  • x is the measured sample (taken as column);
  • x ¯ is the mean value of the measured sample;
  • S is the variance–covariance matrix of the transposed measured sample;
  • T represents the transpose operator.
The confidence ellipse, whose dimensions depend on the distance calculated using Equation (3), is then used to graphically distinguish the possible outliers, as shown in Figure 4, where, for the third harmonic order taken as an example, the point cloud plot is reported and the points outside the confidence ellipse are the possible outliers. The found distances are then compared with a cut-off value based on a chi-squared distribution with the probability of rejecting the null hypothesis when it is true and equal to 0.02 .

5. Test Results

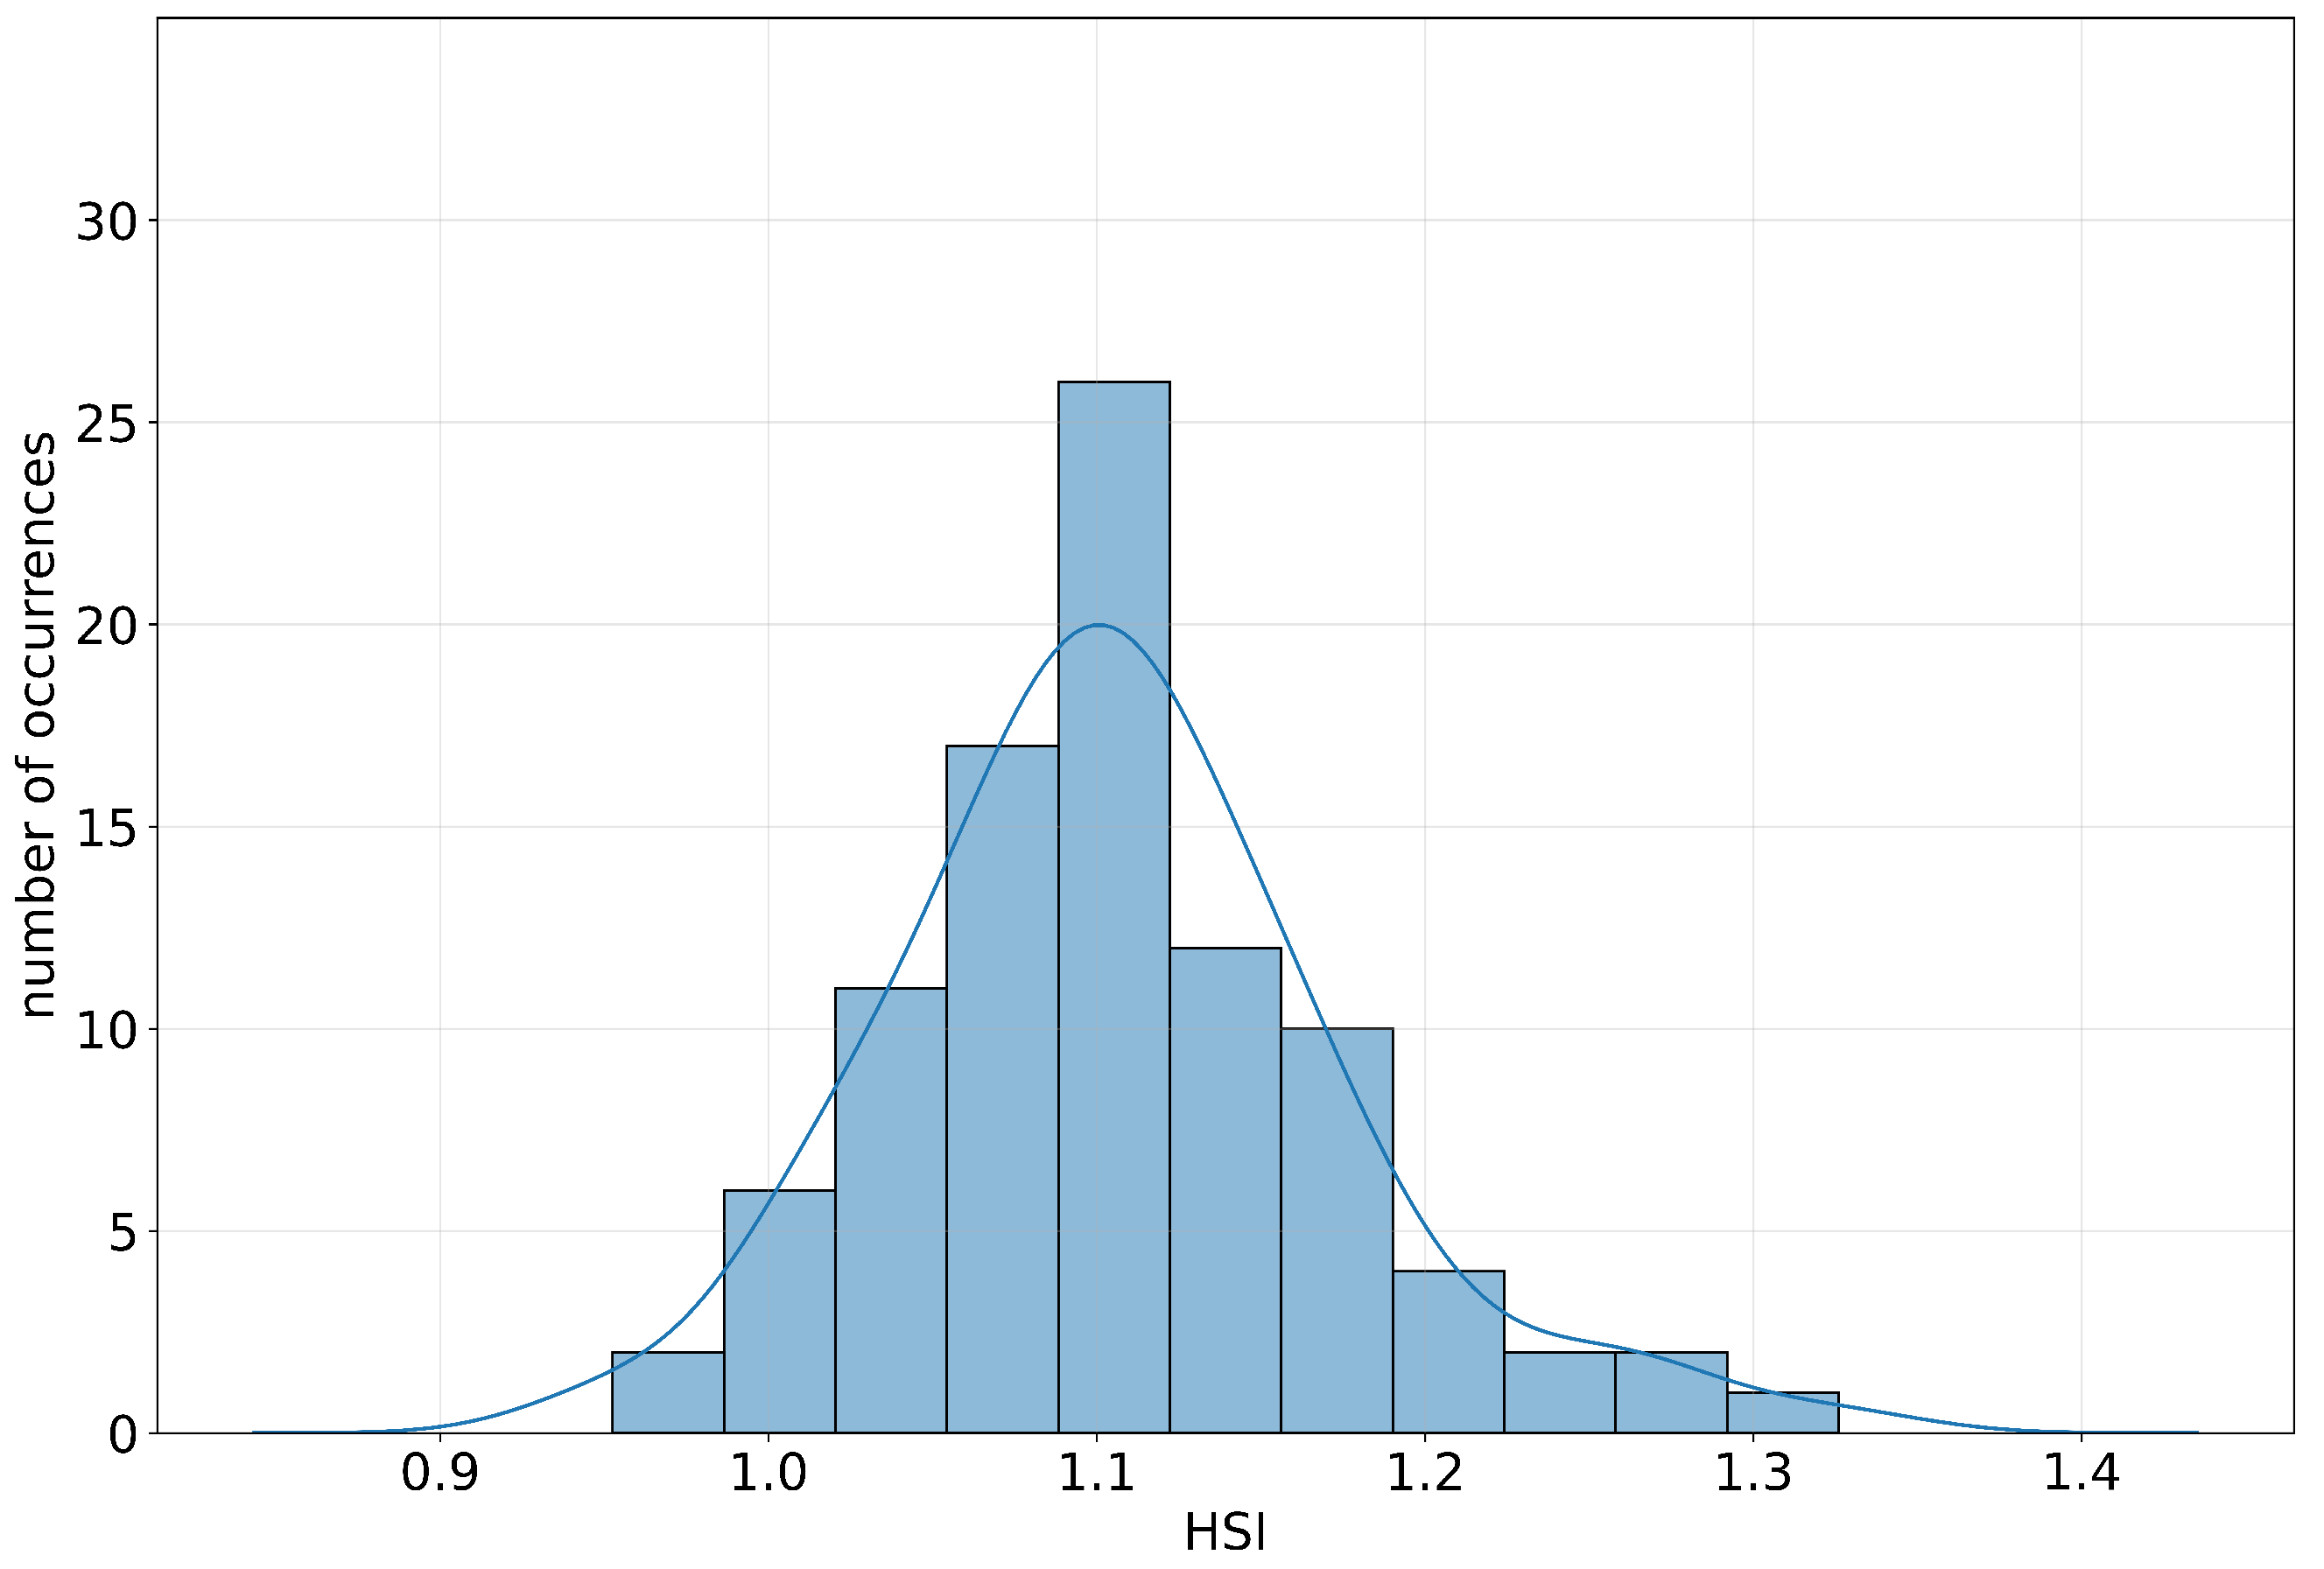
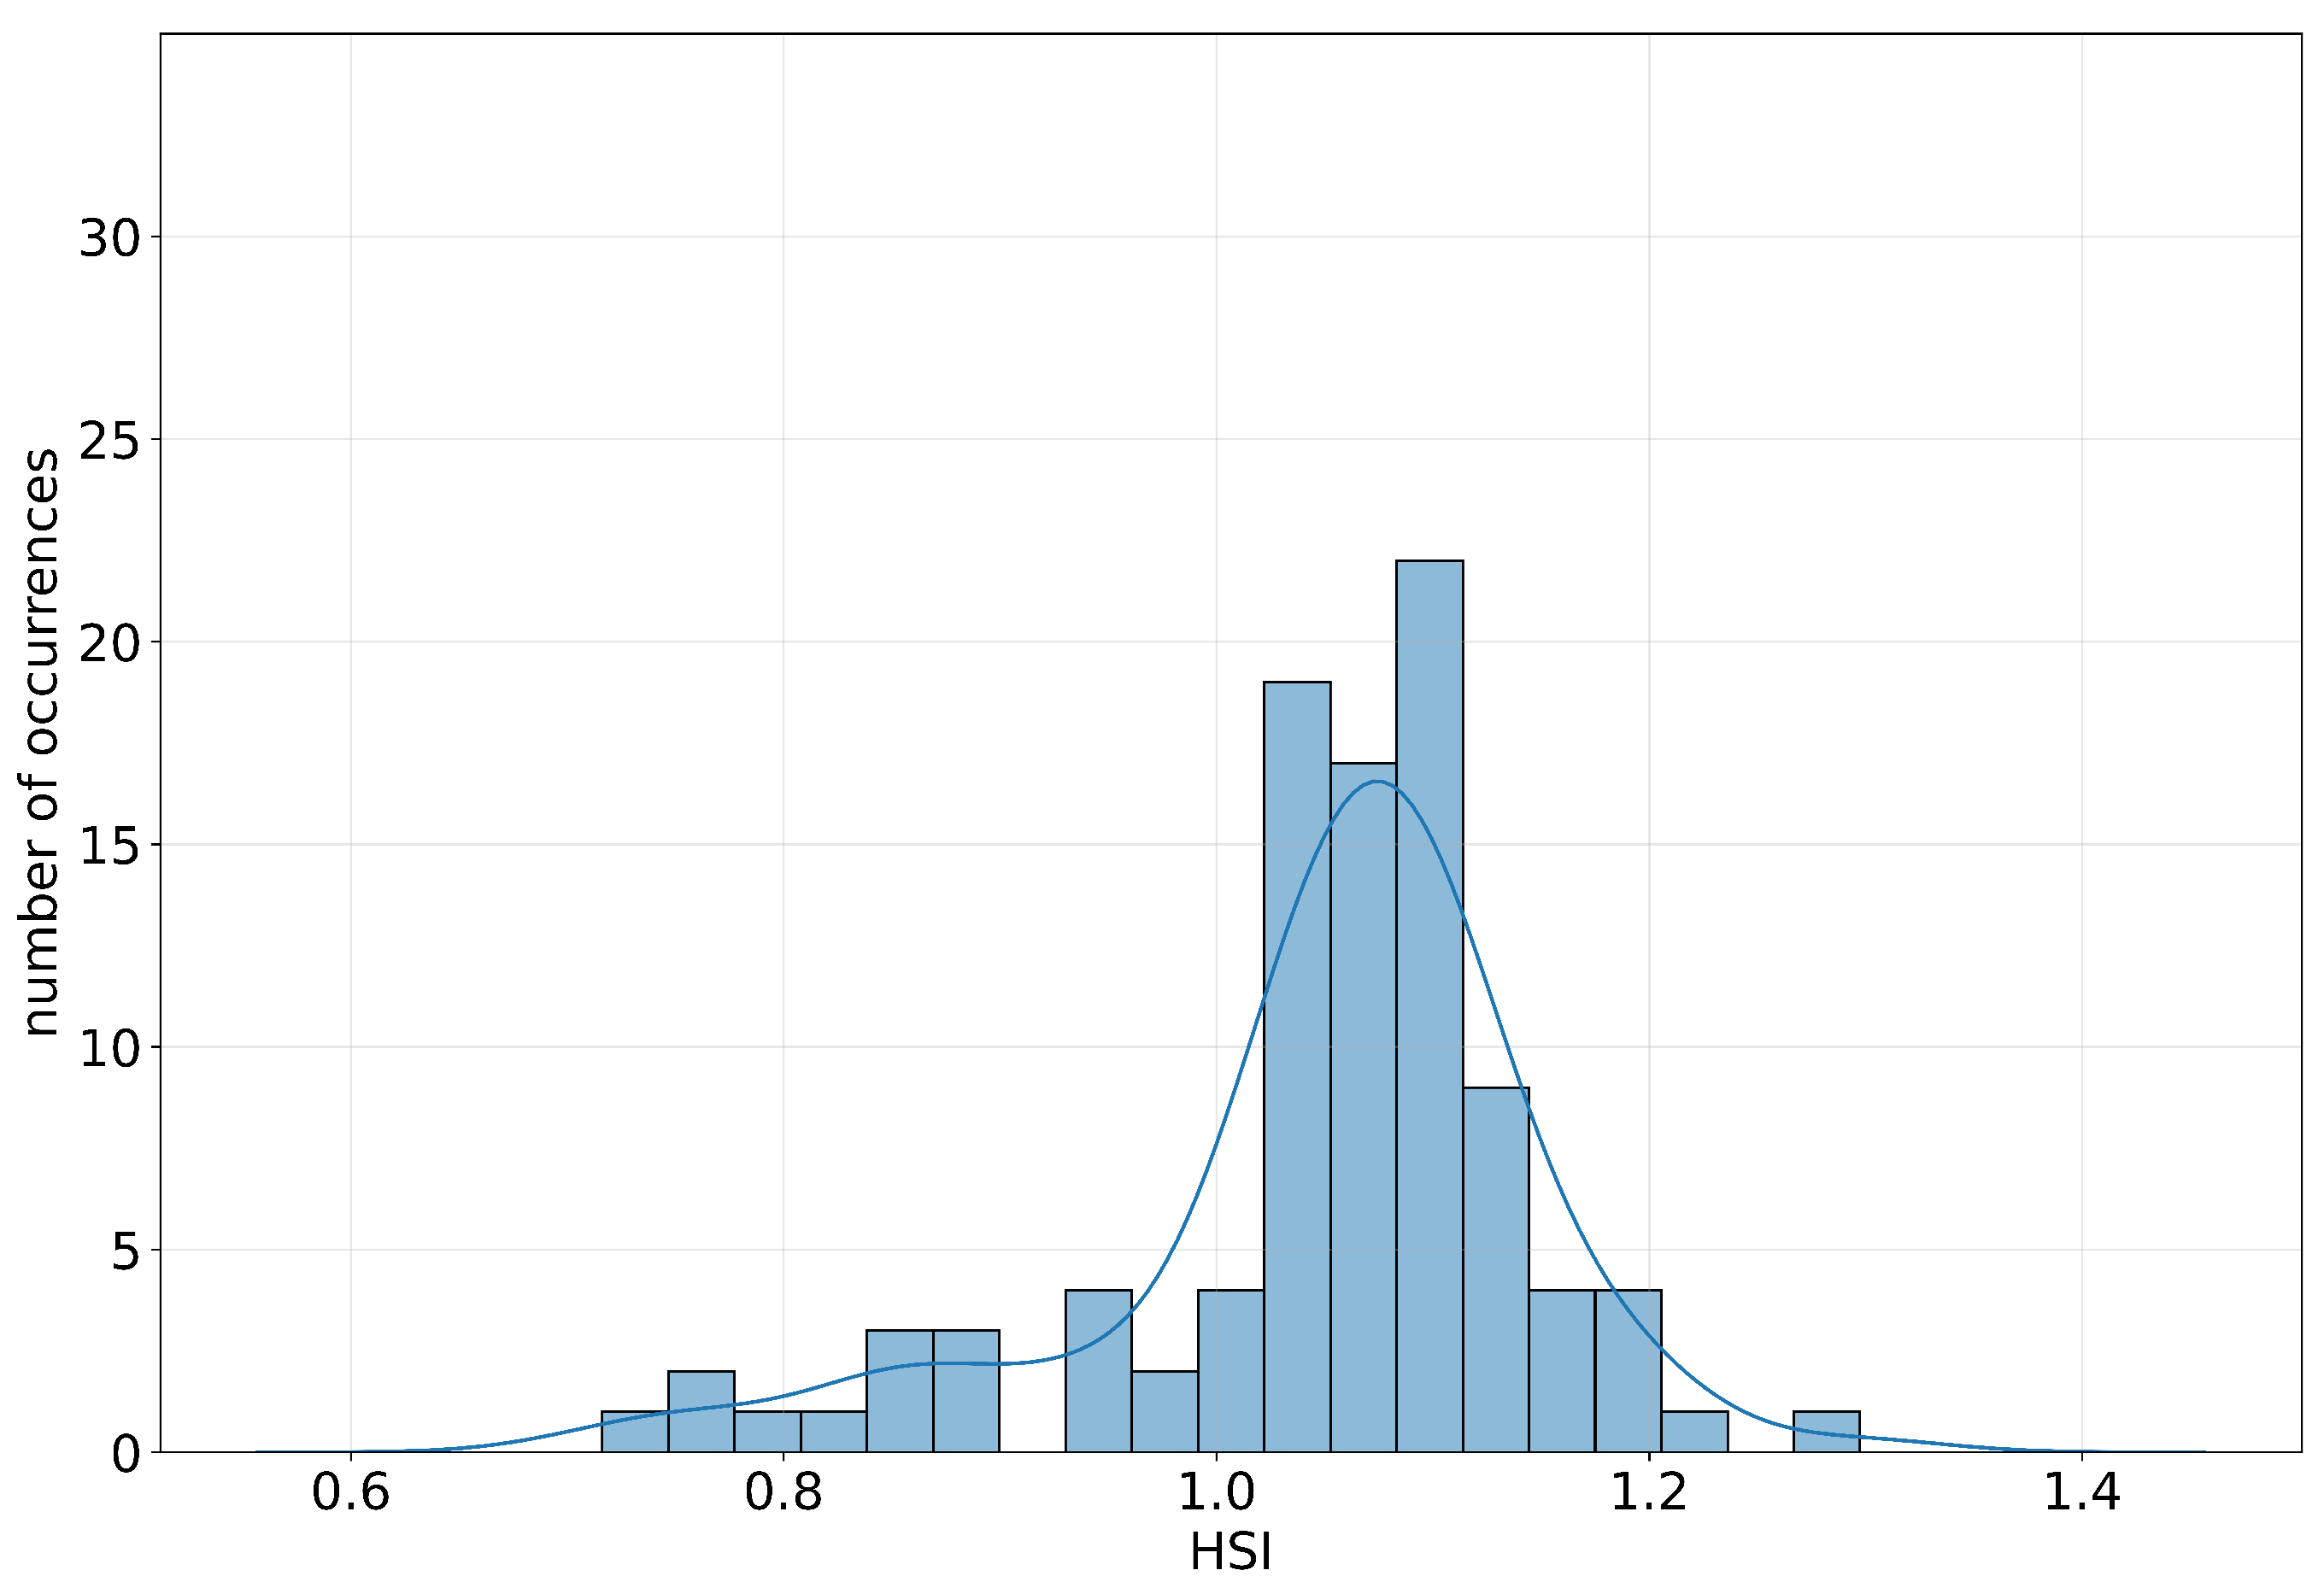
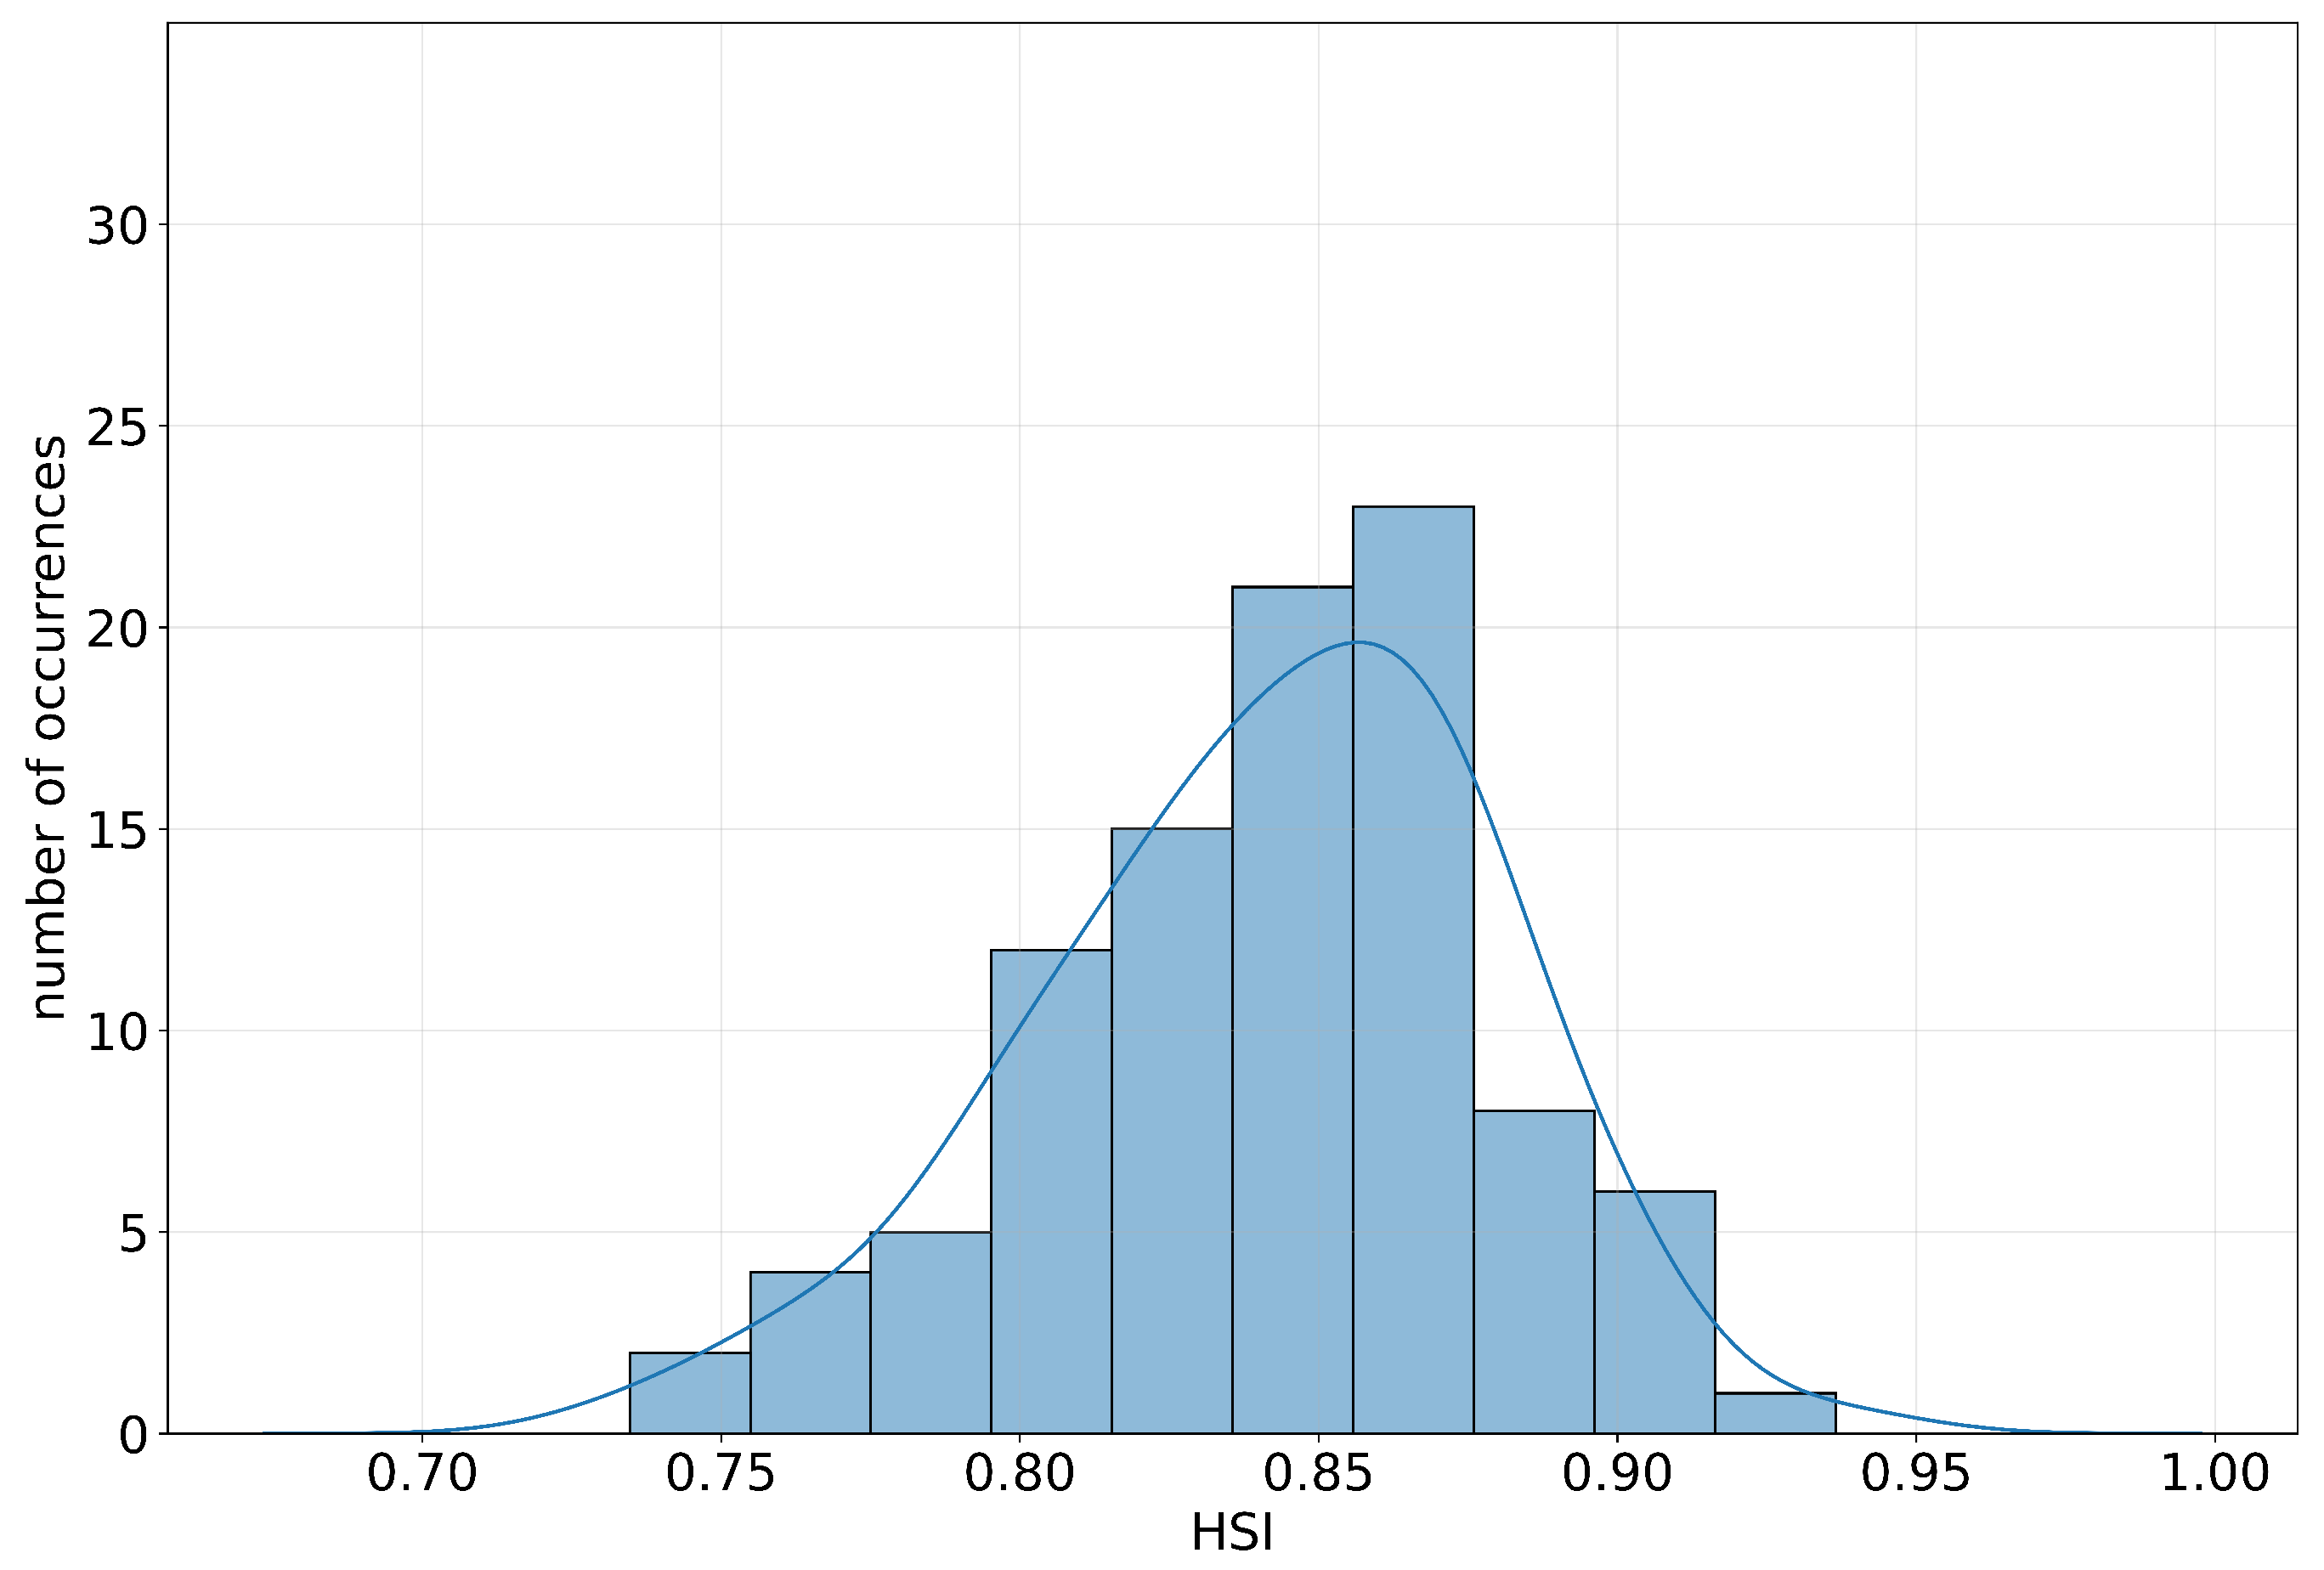
The main hypothesis, as mentioned in other works like [16,23,24], was that the harmonics will add-up due the common supply voltages. The HSI represents how much each harmonic tends to sum up with the frequency of the same order injected by the other chargers connected nearby. For this purpose, each frequency multiple of the fundamental, up till the 40th harmonics, has been individually analyzed based on the valid measures obtained from the data cleaning process previously described in Section 4.4. Figure 5, Figure 6, Figure 7 and Figure 8 show the third harmonic HSI distribution for each tested power set-point in the form of both a continuous distribution and a bar plot. On the the x-axis, the index is reported, while on the y-axis, the number of occurrences is shown. The third order was chosen due to the importance noted on this specific hardware; however, the behavior is the same for the other studied frequencies. Is is clear that varying the power set-point impacts the distribution of the index, moving its average values.
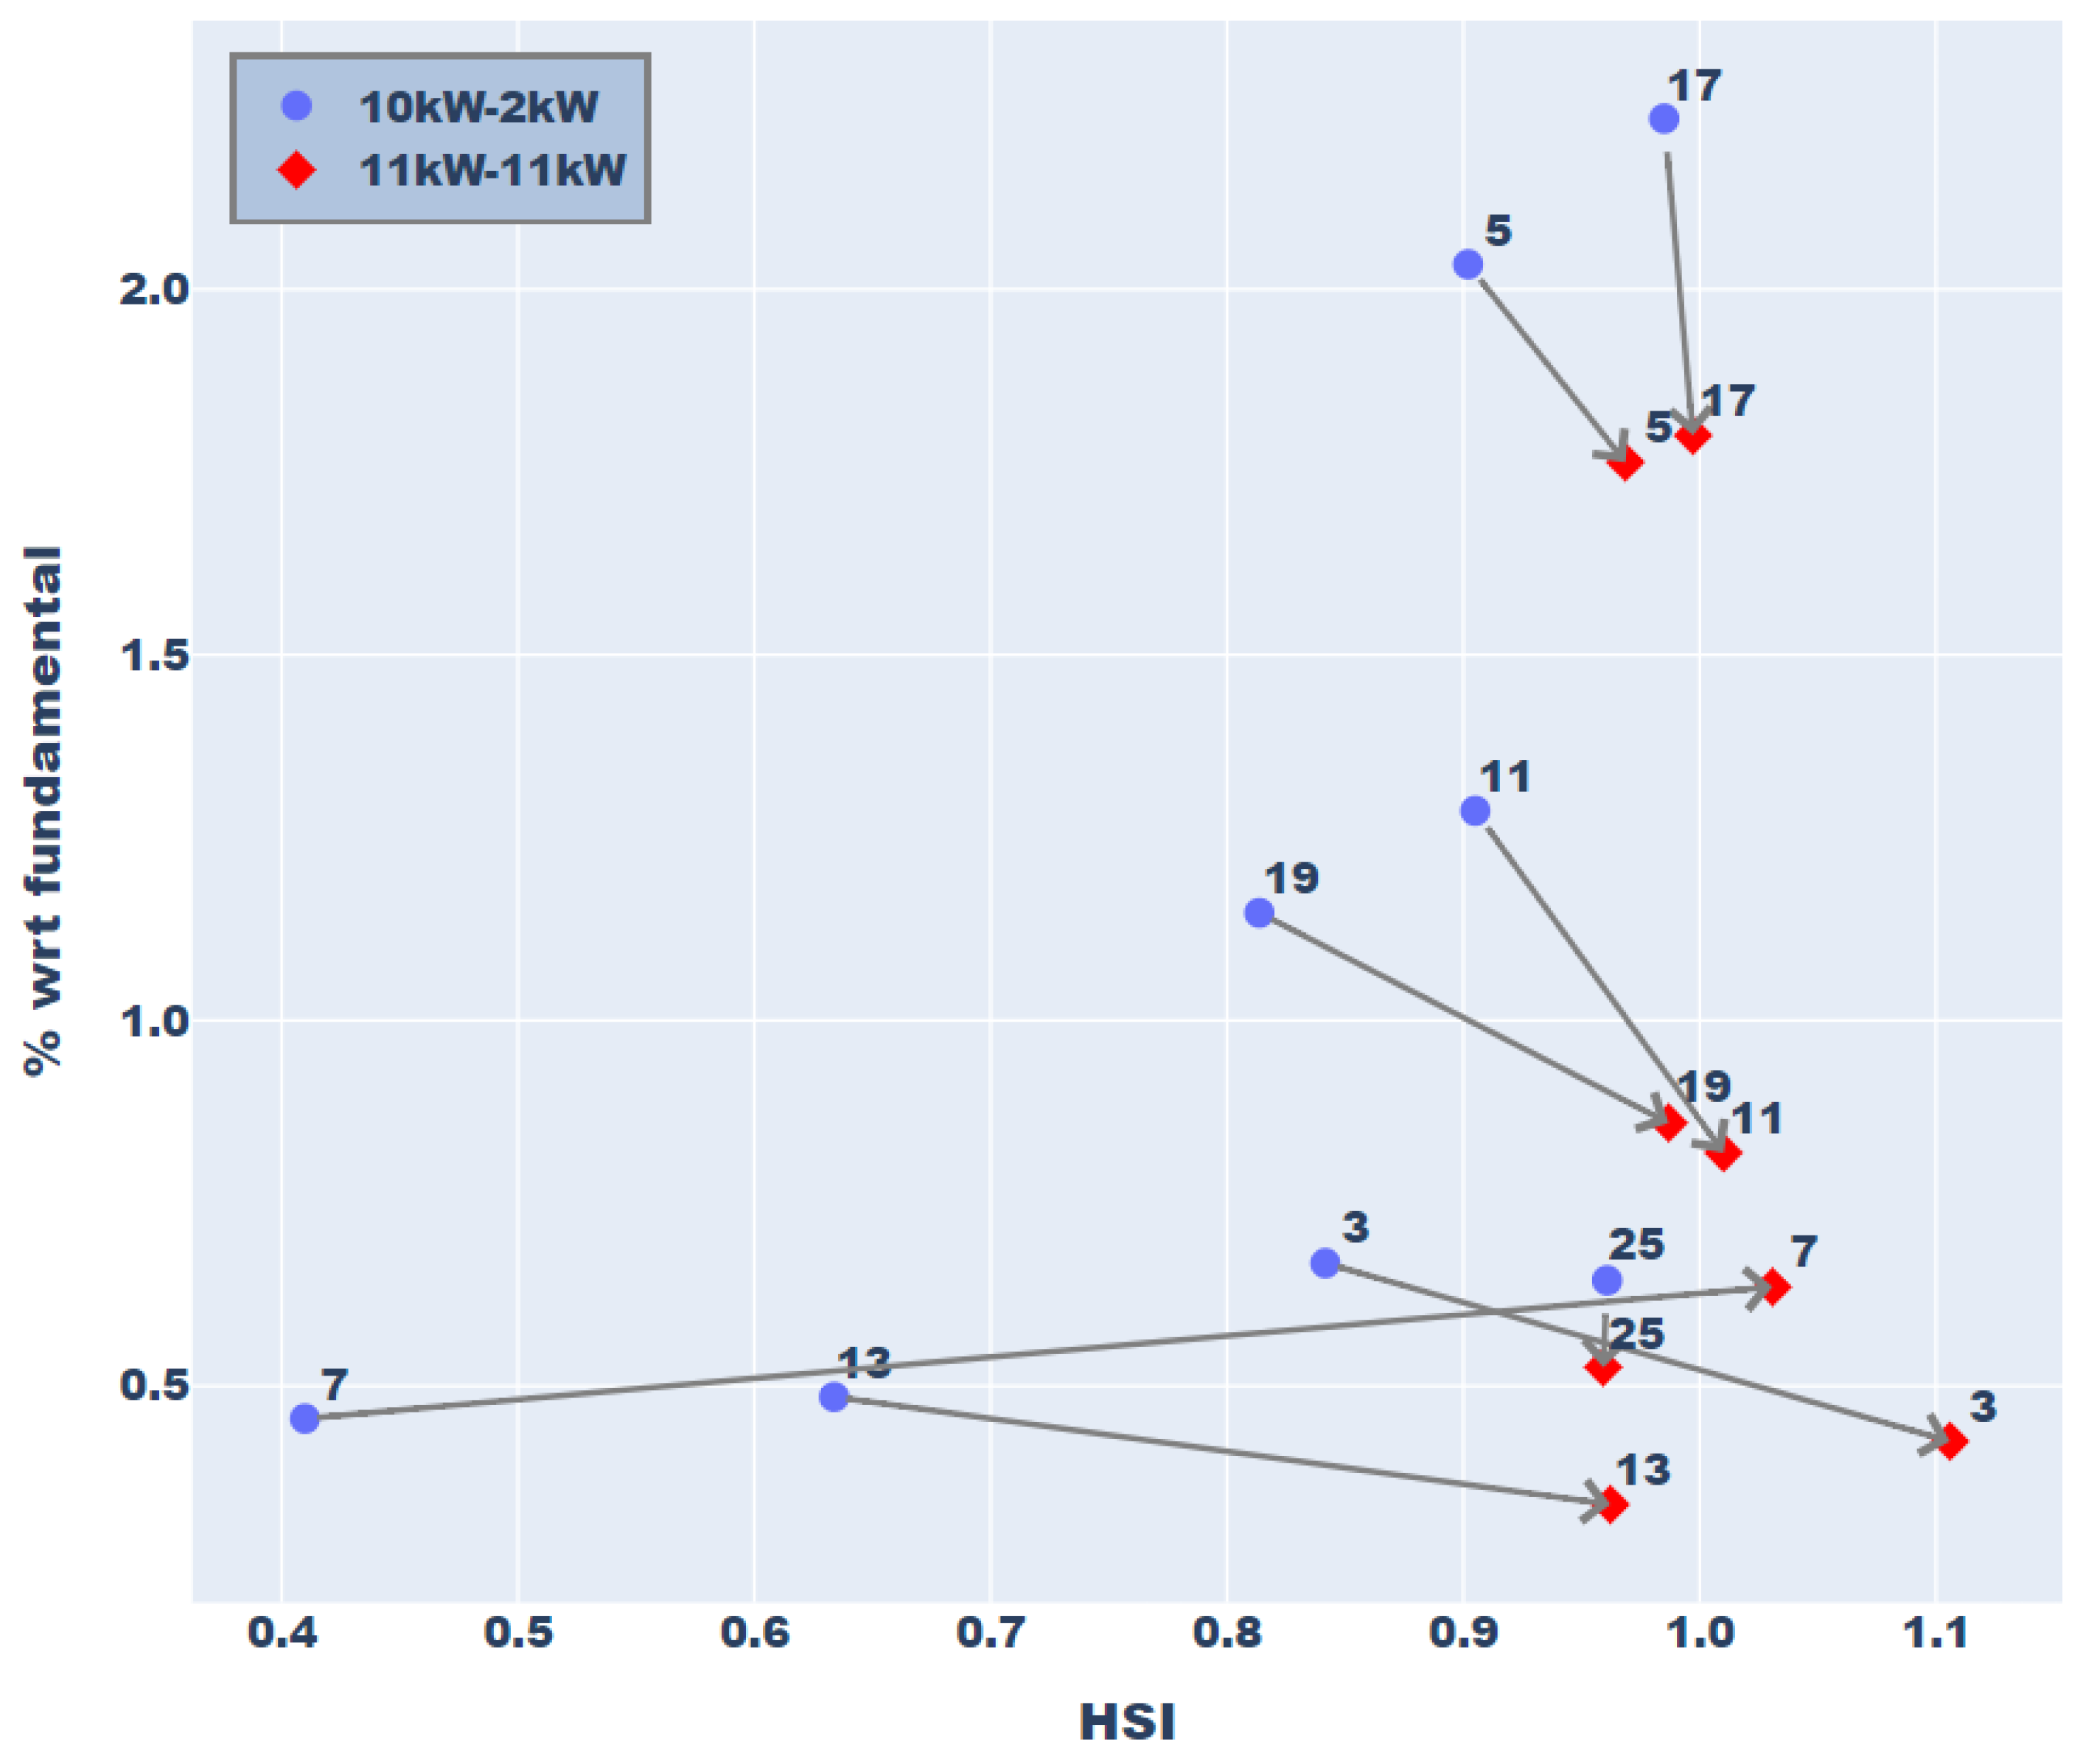
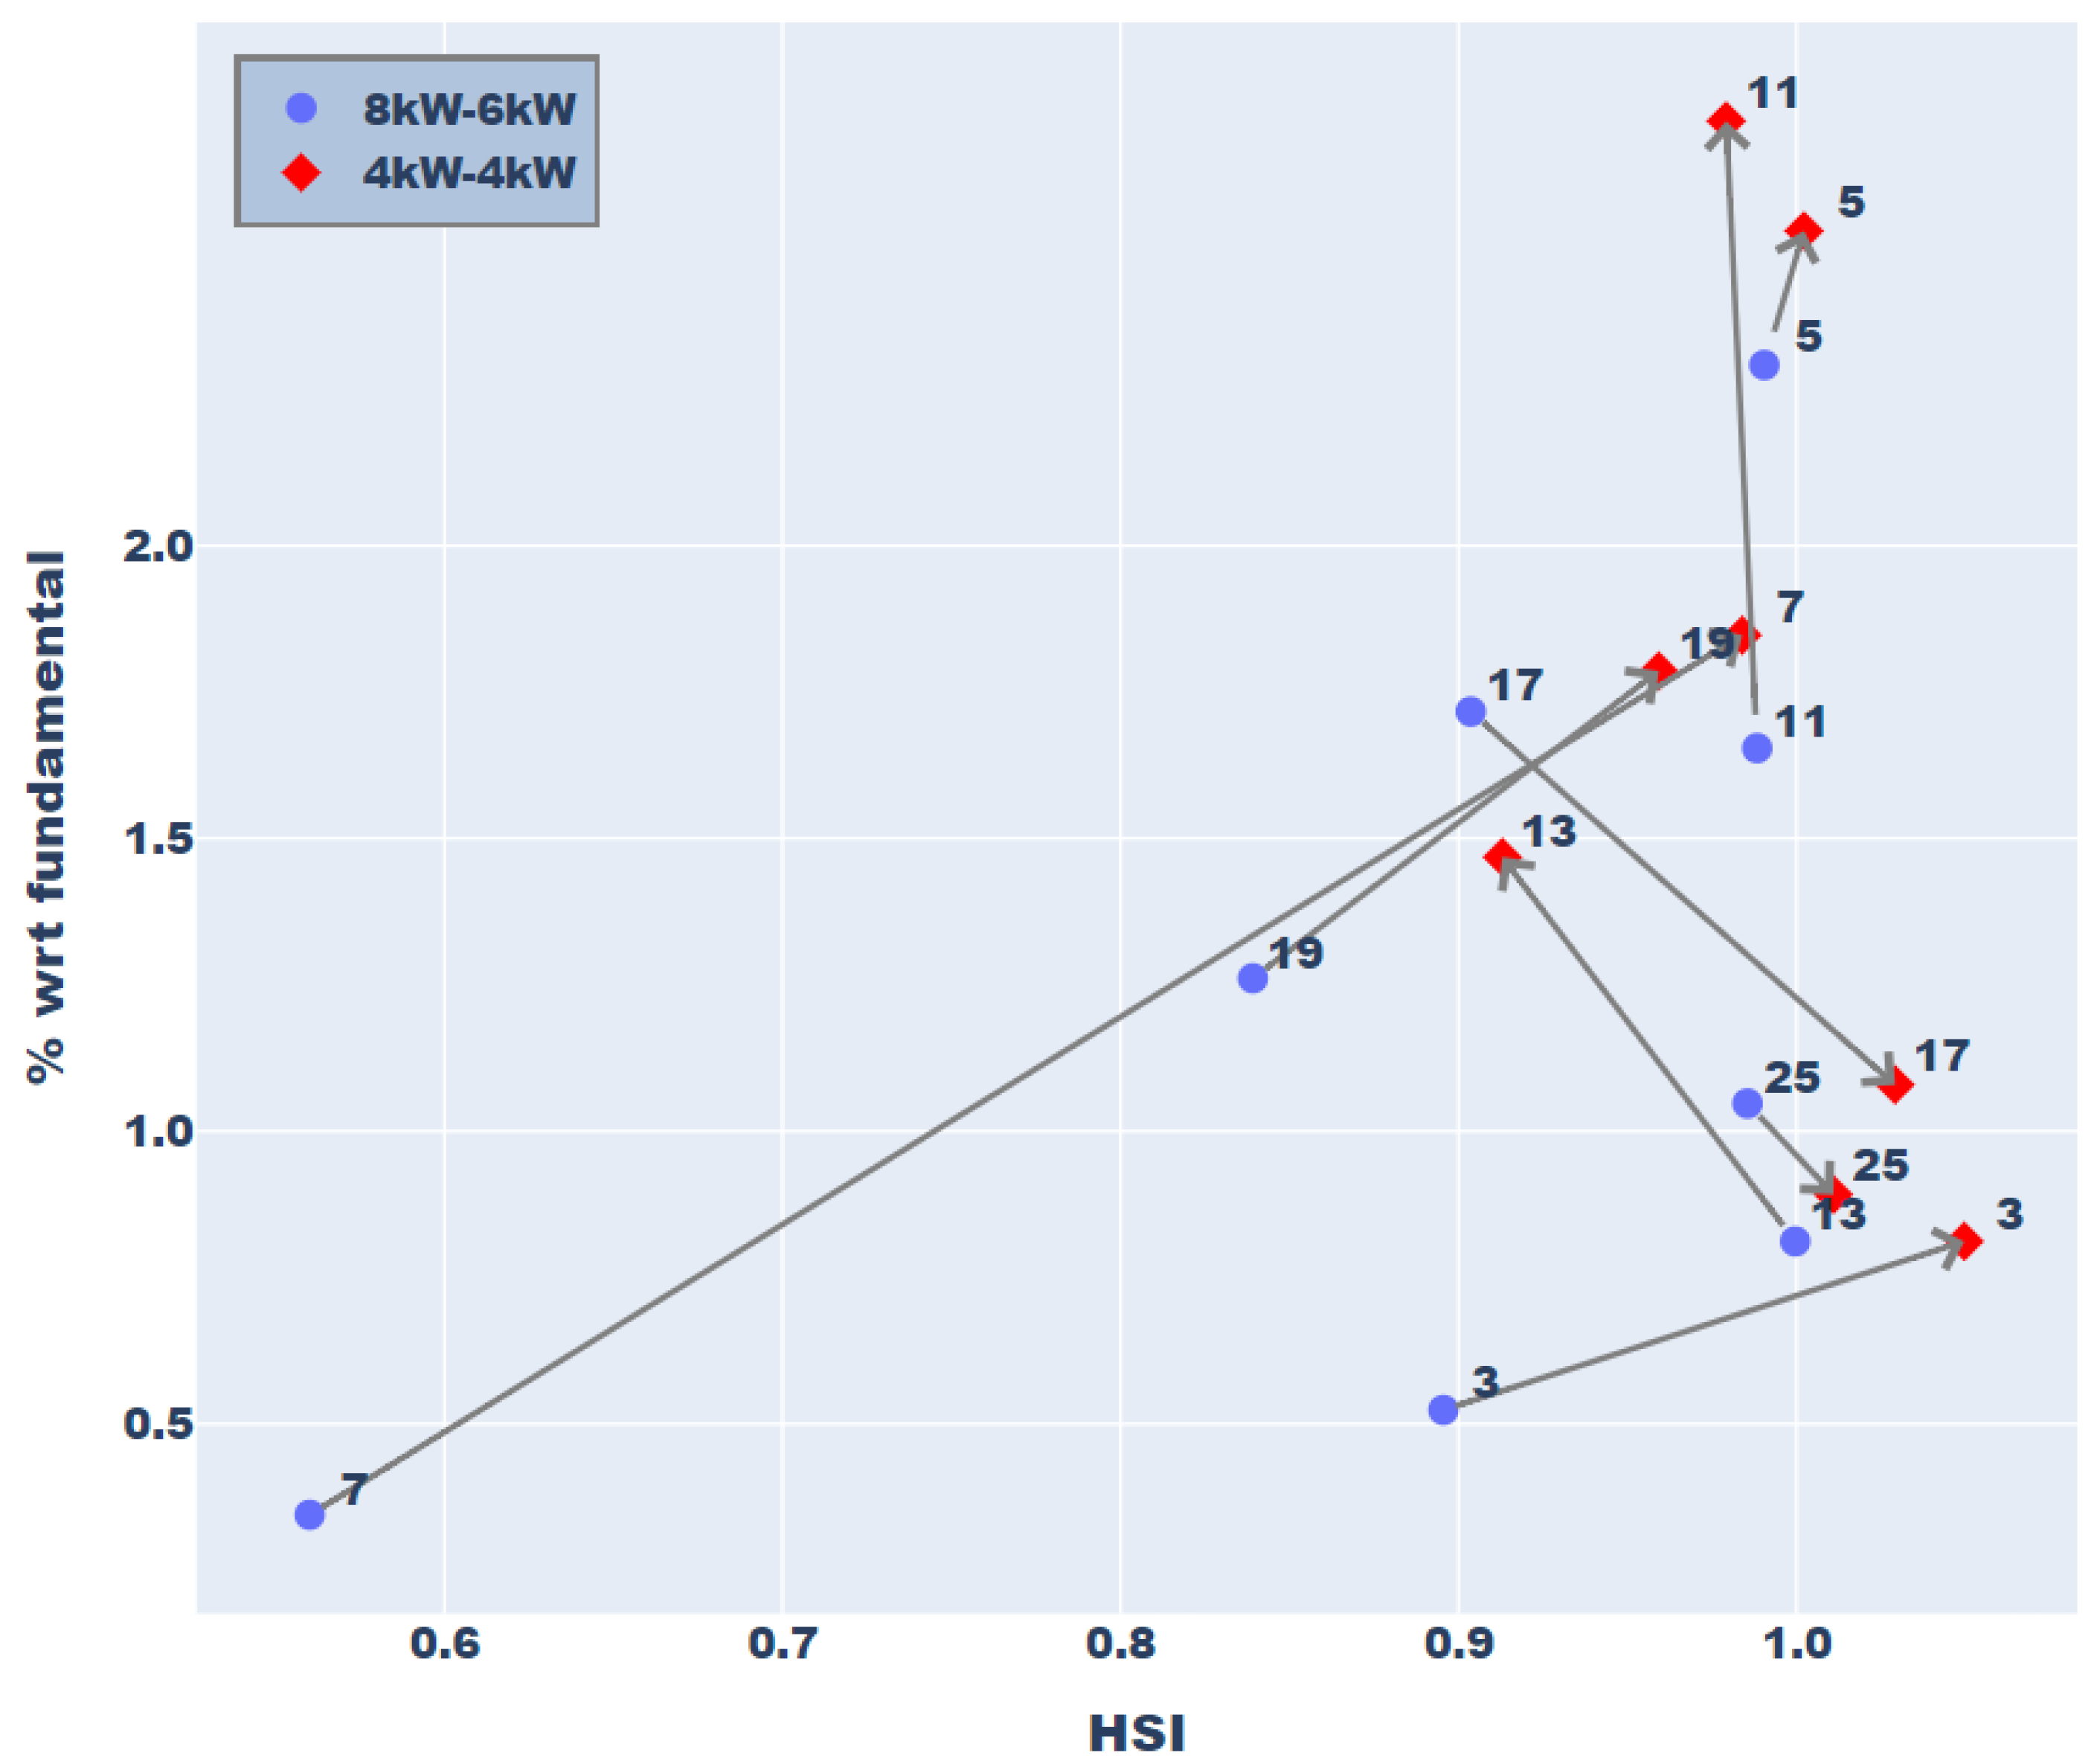
Figure 9 and Figure 10 and Table 8 and Table 9 summarize the phenomenon, showing the two most different scenarios in terms of the power level of the tested chargers’ set-points for two of the analyzed cases. The y-axis represents the amplitude of a certain harmonic order expressed in percentage with respect to the fundamental. The shown frequencies are the nine with a higher amplitude in percentage with respect to the fundamental, since real-life applications could benefit more from their cancellation. The x-axis represents the HSI as computed using Equation (2). The values presented are the average values of the 100 tests, after the removal of the outliers. It is clear how the summation index increases as the difference between power set-points decreases. In certain cases, the HSI can reach values slightly larger than 1. This can be due to the combination of the measurement errors of the current probes and data acquisition system.

6. Conclusions

This paper presents an analysis of the harmonics interaction between two electric vehicle chargers based on measurements on real devices. These results are applicable on the specific tested hardware, but in future works, different charging converter topologies will be studied, both in terms of technology and rated charging power. The experimental distributions show how the summation phenomenon appears on the tested hardware for some specific harmonic orders. It is clearly visible how the power set-points impact the cancellation of certain harmonics. The results are presented in detail for the third harmonic; even though other frequencies have slightly different behavior, the trend of the harmonic cancellation was essentially repeated. The phenomenon is all the more evident the more distant the setpoints are in terms of power. From these results, it can be stated that to decrease the impact of the harmonics on the low-voltage grid, in the case of a high number of chargers connected to the same electrical node, it is possible to elaborate a control strategy of the power set-points of the WB, in order to keep the power of the chargers as different as possible.

Author Contributions

Conceptualization, E.P.; Software, G.B. and C.N.; Validation, M.Z.; Formal analysis, A.M.; Investigation, G.B.; Resources, P.T., M.Z. and R.J.; Data curation, G.B. and C.N.; Writing—original draft, A.M., G.B. and E.P.; Writing—review & editing, A.M. and E.P.; Supervision, E.P.; Project administration, R.J.; Funding acquisition, E.B. and P.T. All authors have read and agreed to the published version of the manuscript.

Funding

This publication is part of the project NODES, which has received funding from the MUR—M4C2 1.5 of PNRR, with grant agreement no. ECS00000036, and of the project PNRR-NGEU, which has received funding from the MUR—DM352/2022.

Data Availability Statement

The data presented in this study are available on request from the corresponding author. The data are not publicly available due to confidentiality reasons.

Conflicts of Interest

The authors declare no conflict of interest. The funders had no role in the design of the study; in the collection, analyses, or interpretation of data; in the writing of the manuscript; or in the decision to publish the results.

Abbreviations

The following abbreviations are used in this manuscript:
BEVBattery Electric Vehicle
DUTDevice Under Test
G2VGrid-to-Vehicle
EVElectric Vehicle
EVCSElectric Vehicle Charging Station
FFTFast Fourier Transformation
HSIHarmonic Summation Index
PHEVPlug-in Hybrid Electric Vehicle
PHILPower Hardware-in-the-Loop
RESRenewable Energy Source
RMSRoot Mean Square
THDTotal Harmonic Distortion
V2XVehicle-to-Everything
V2BVehicle-to-Building
V2GVehicle-to-Grid
WBWallBox

Appendix A

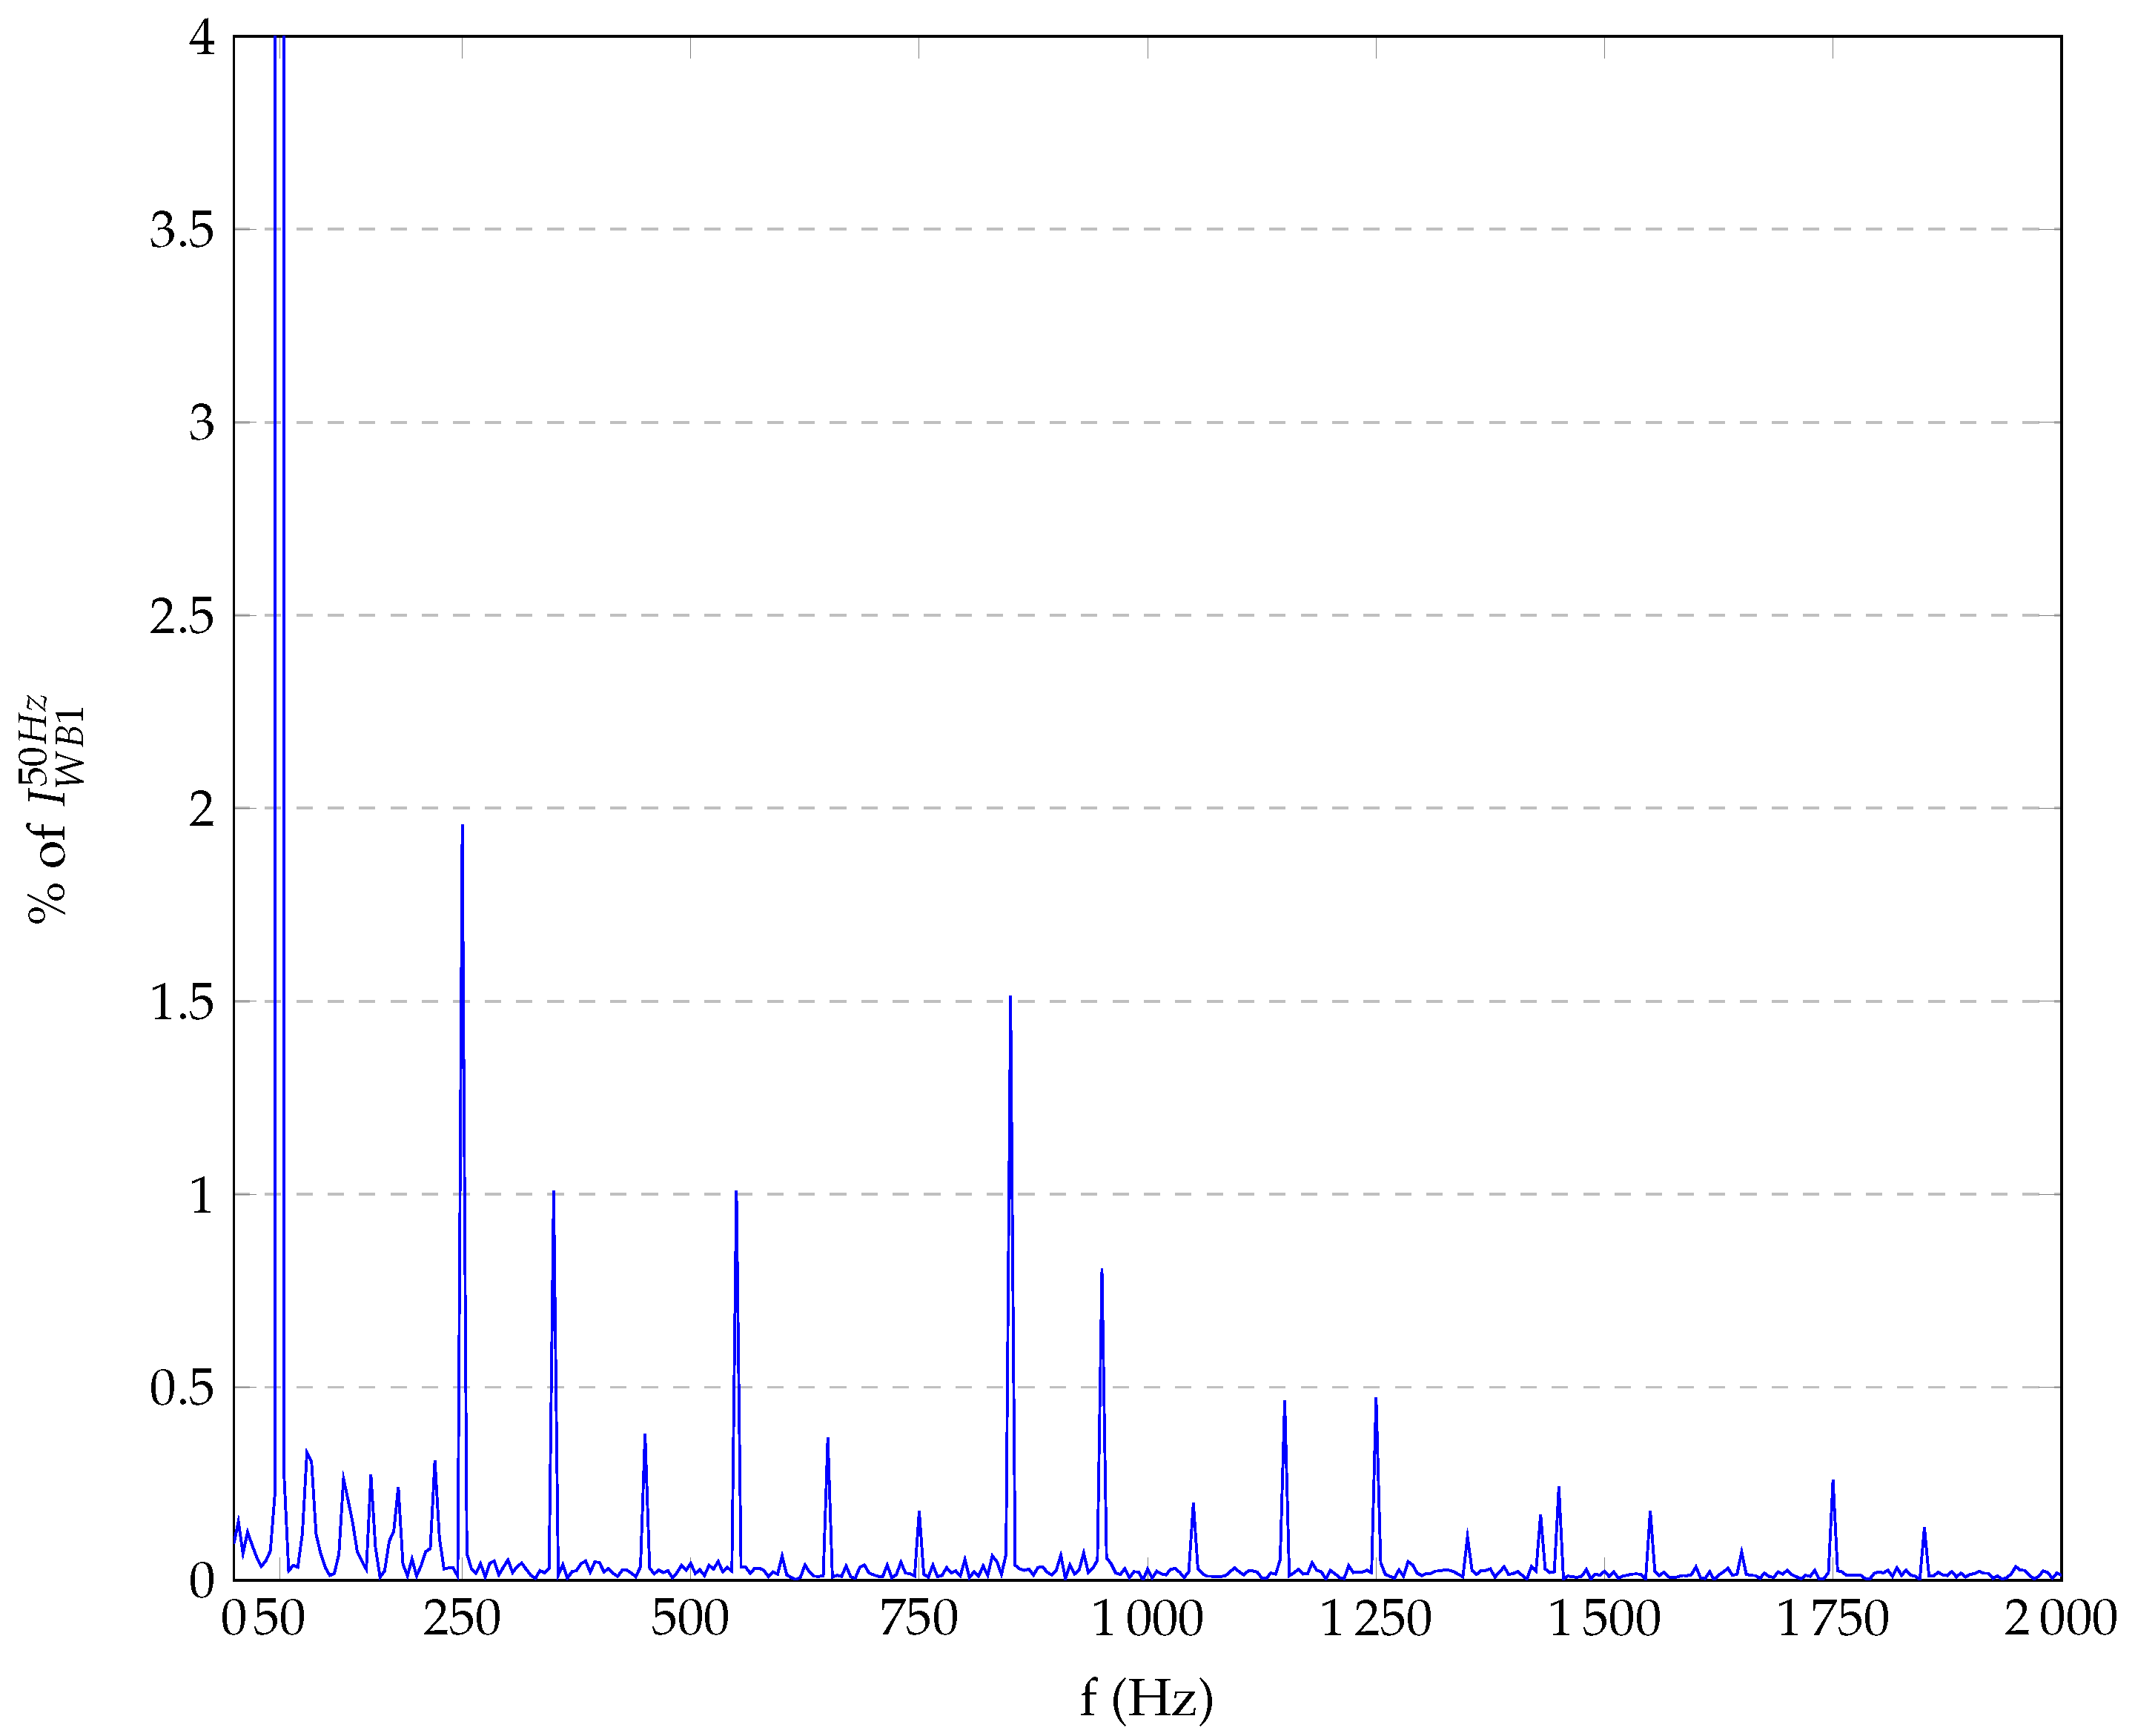
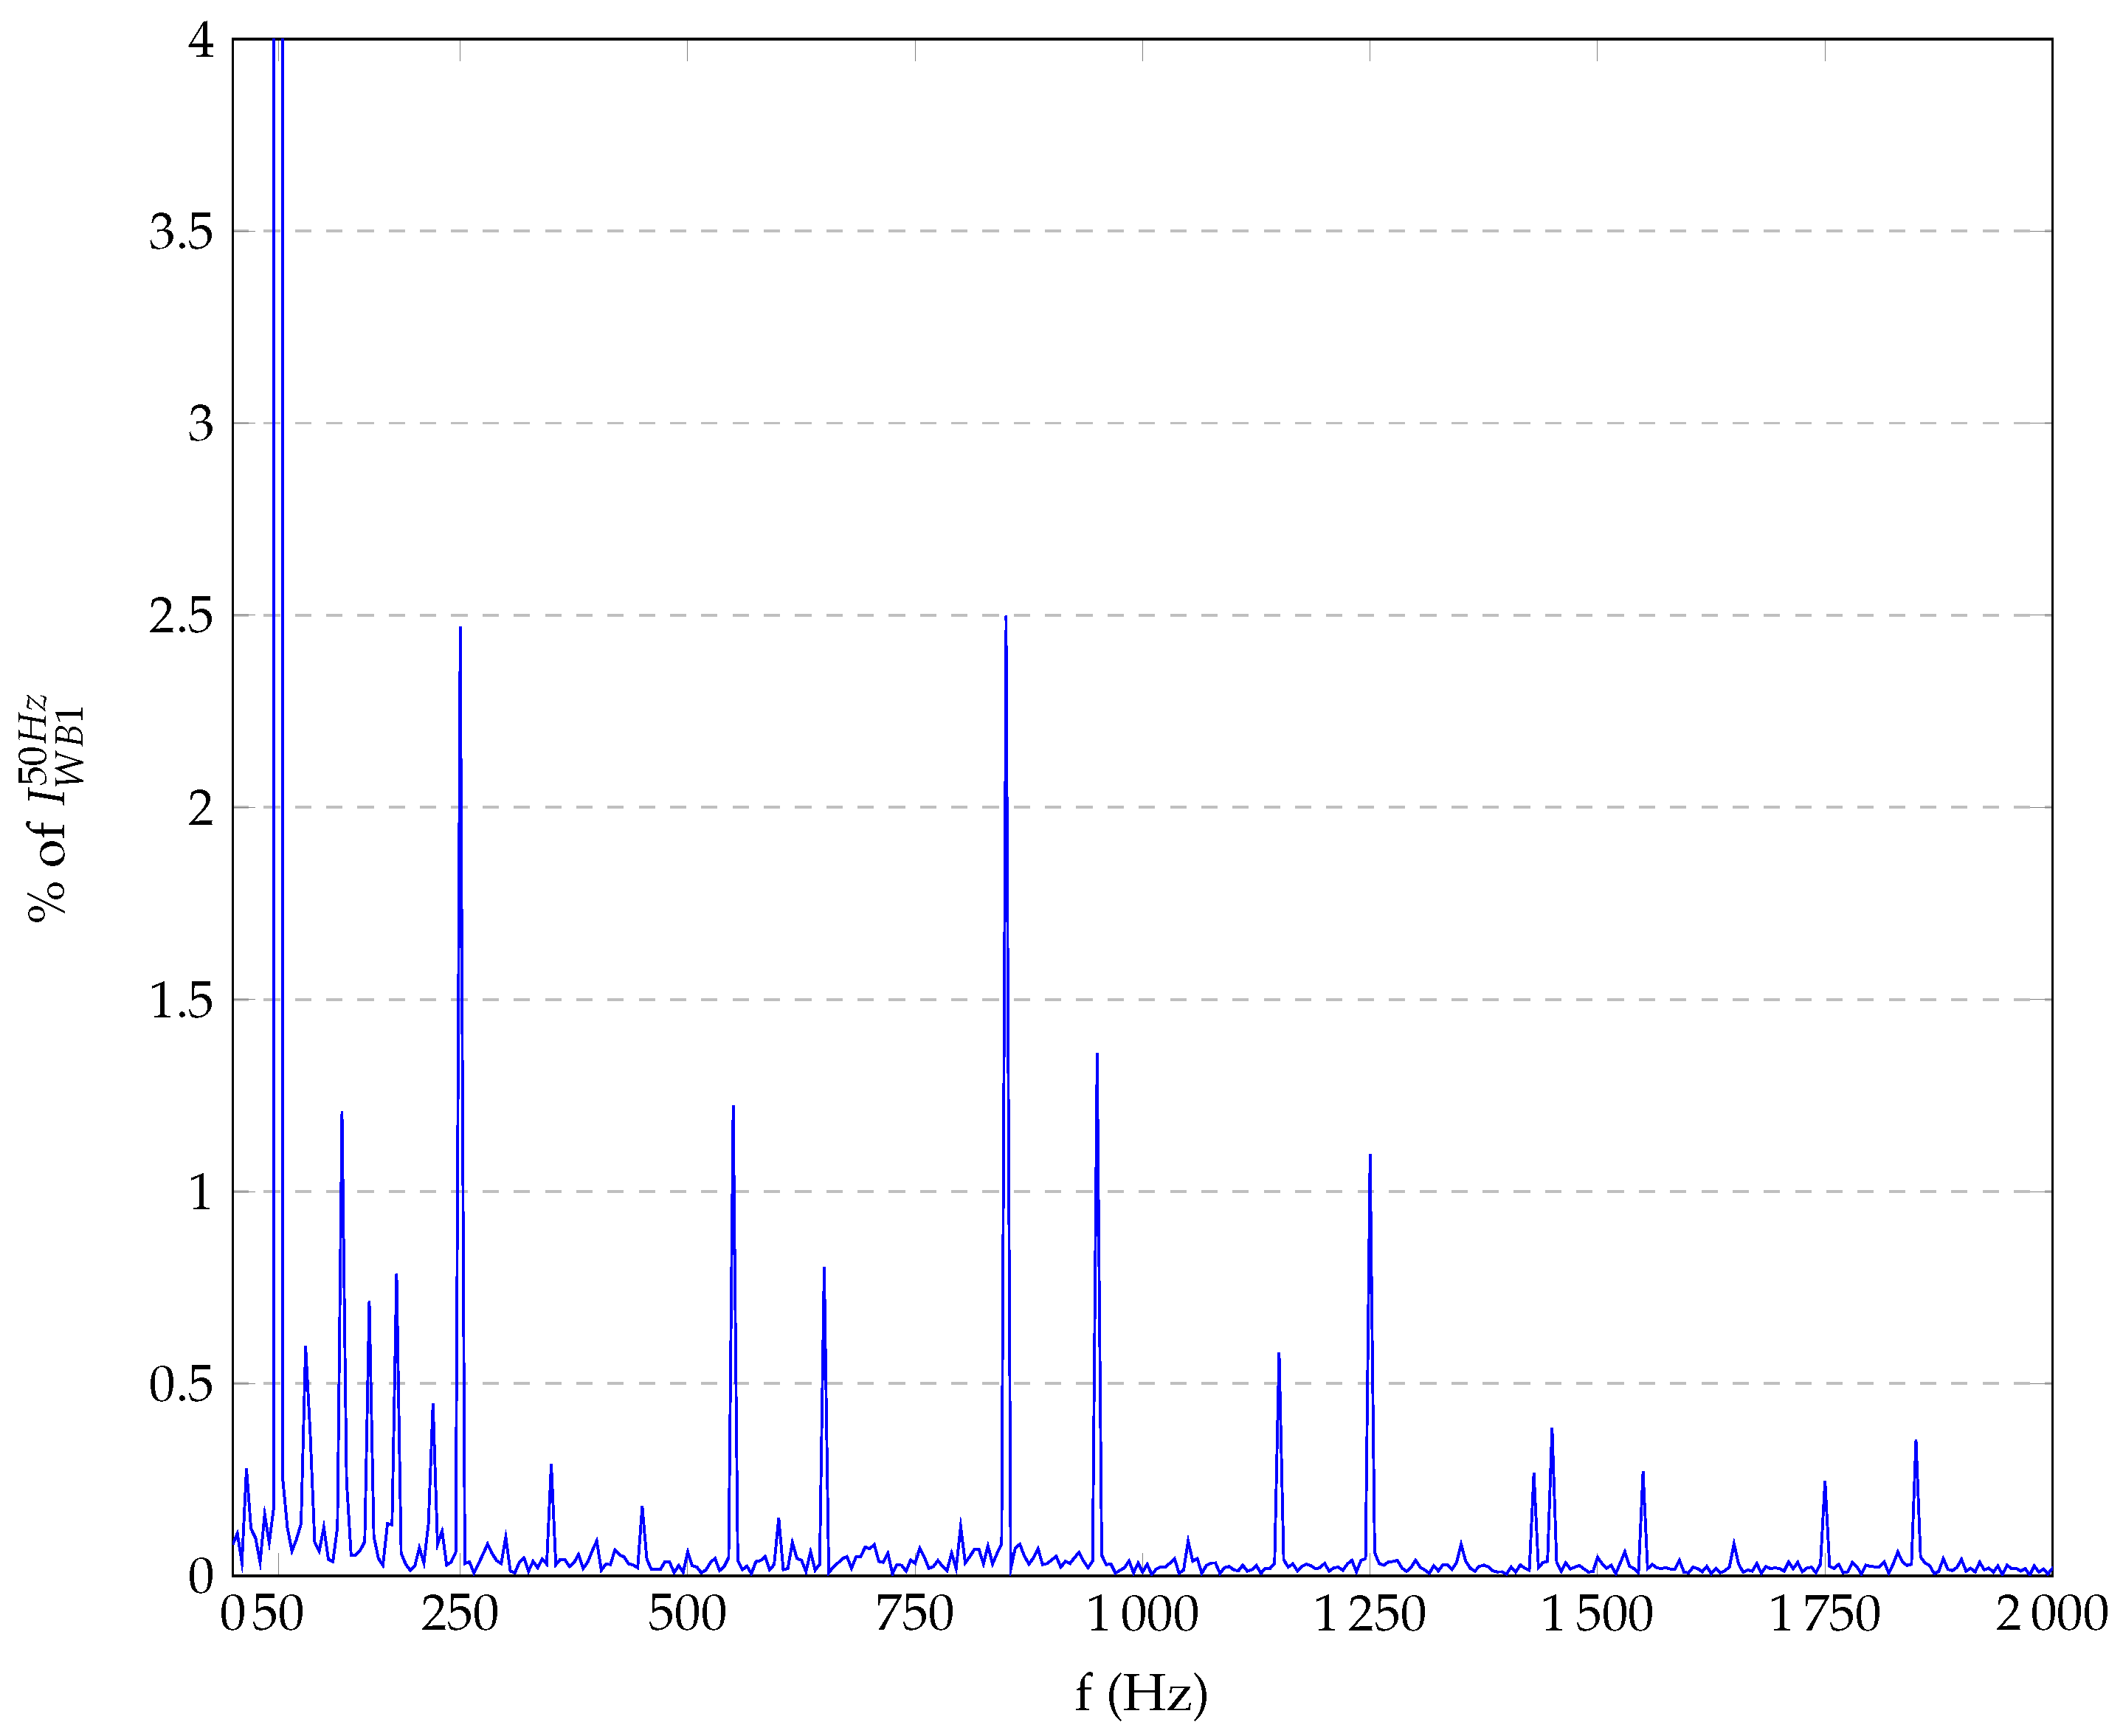
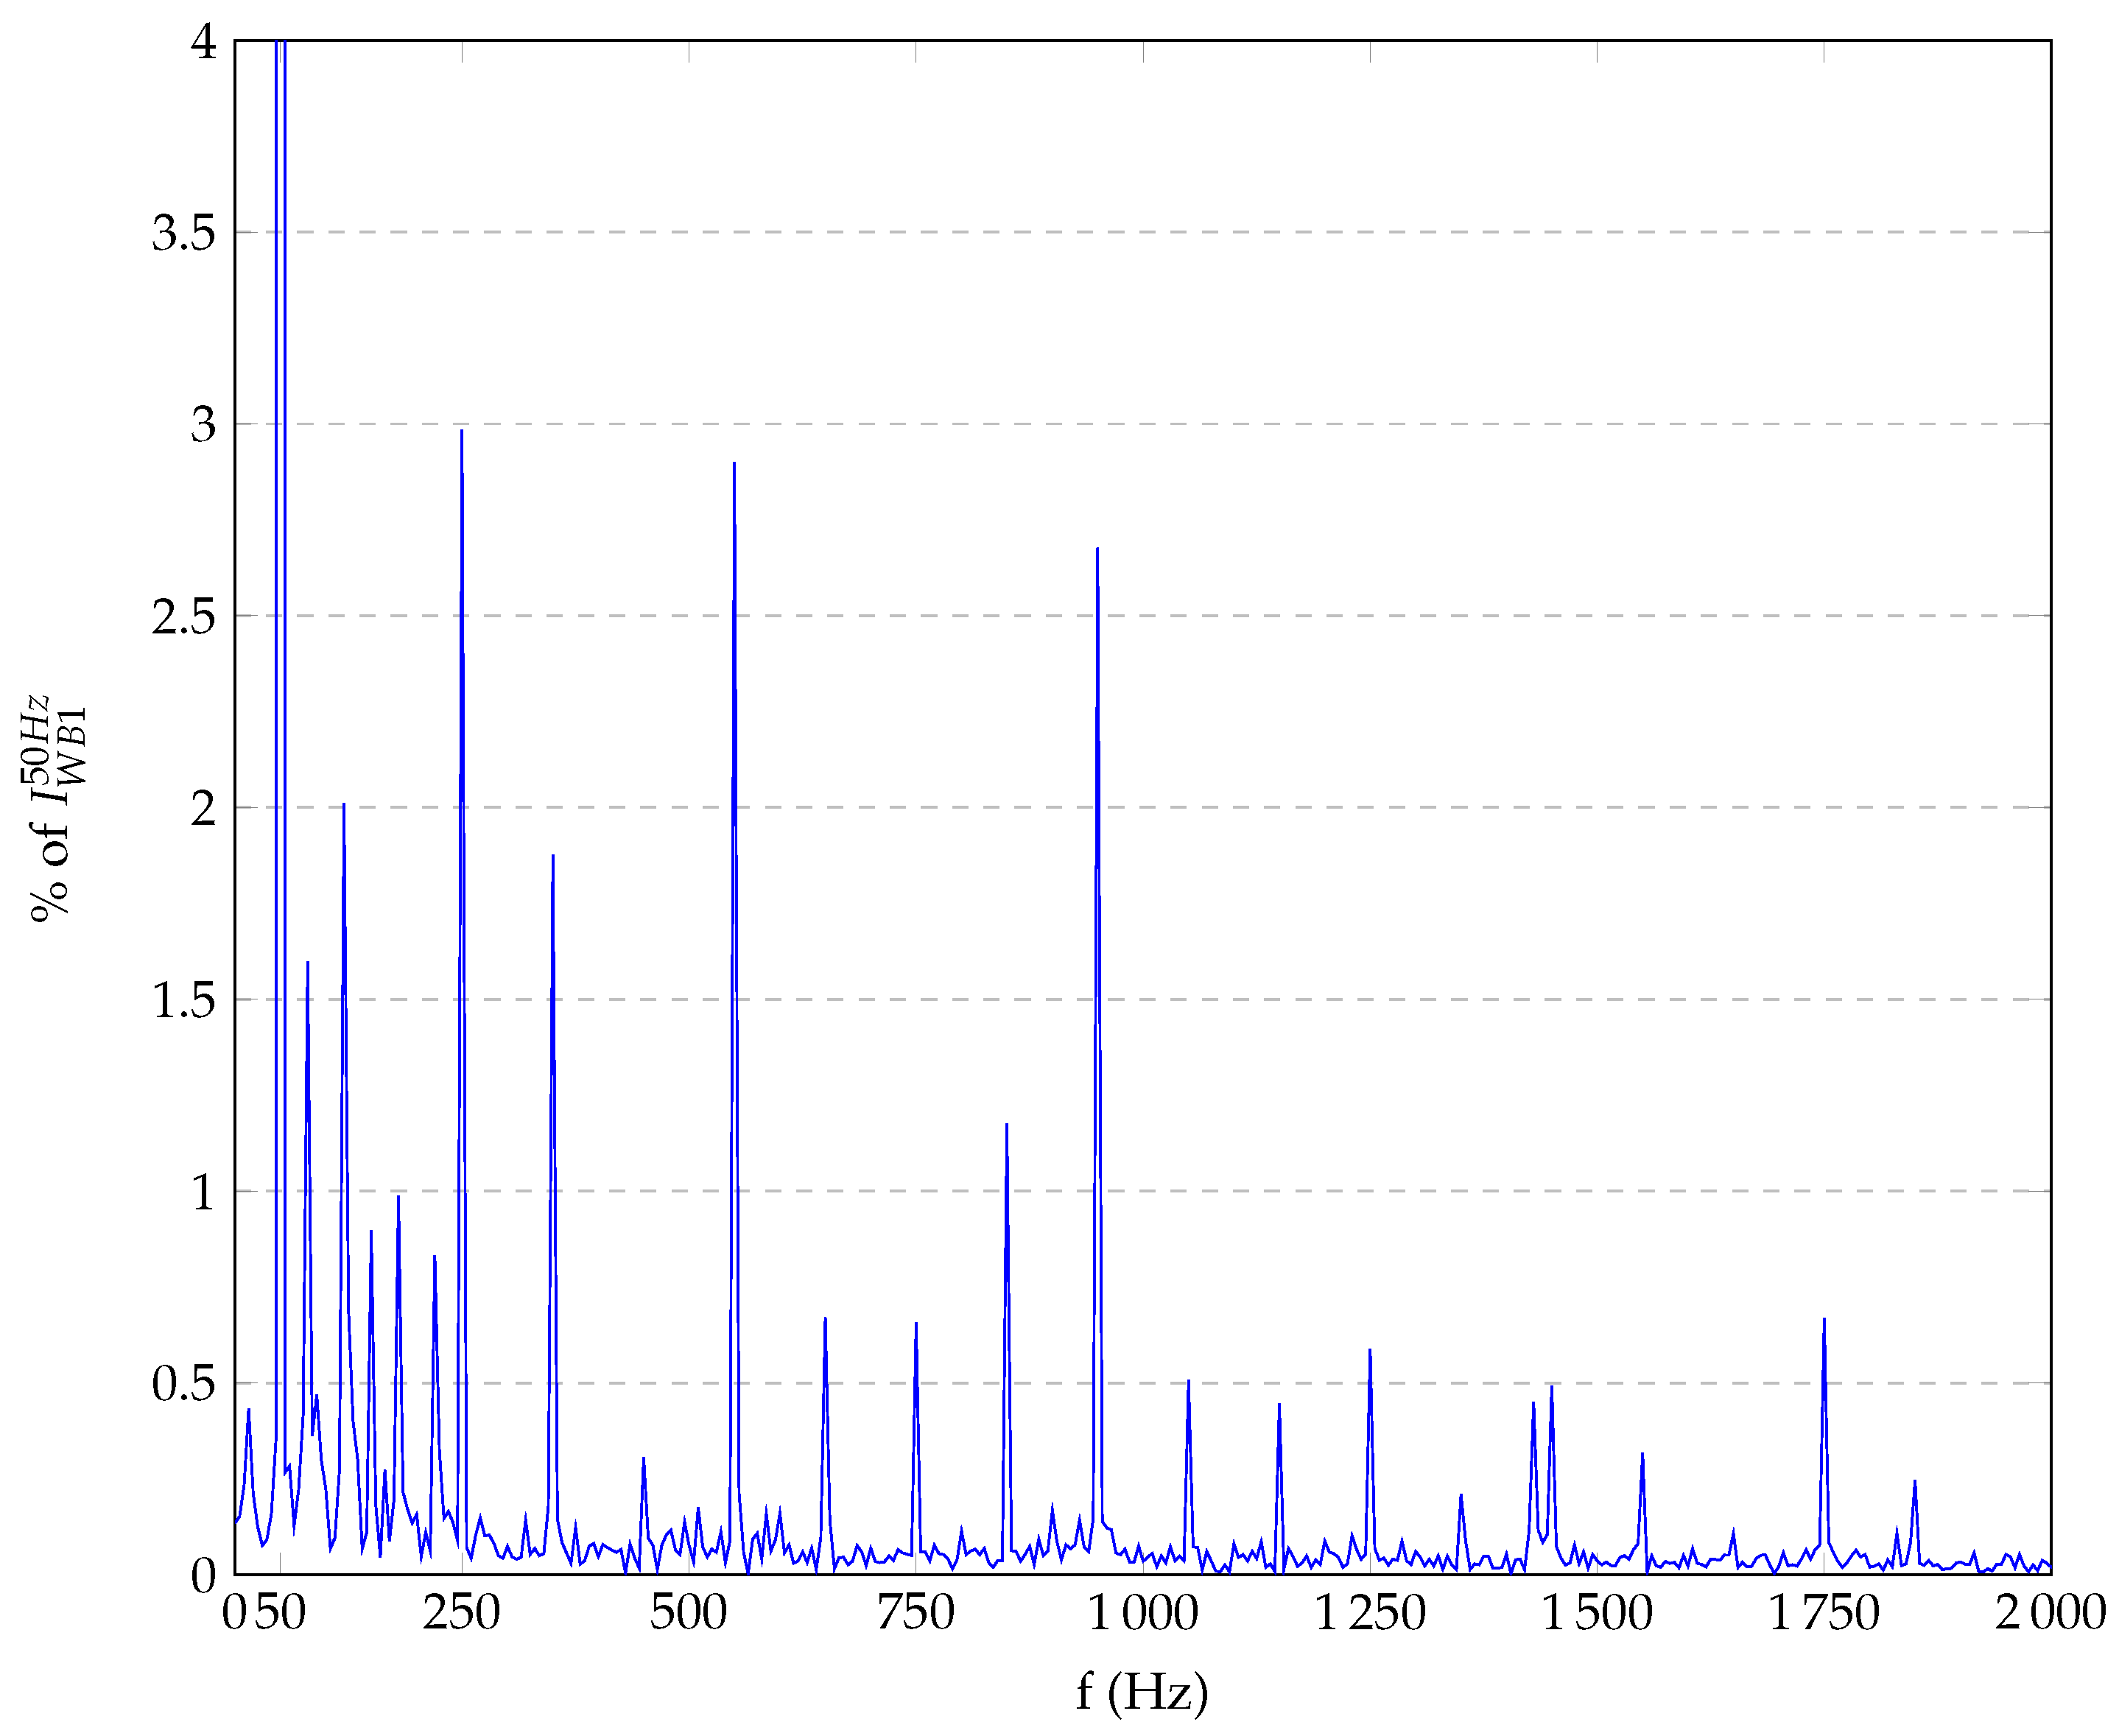
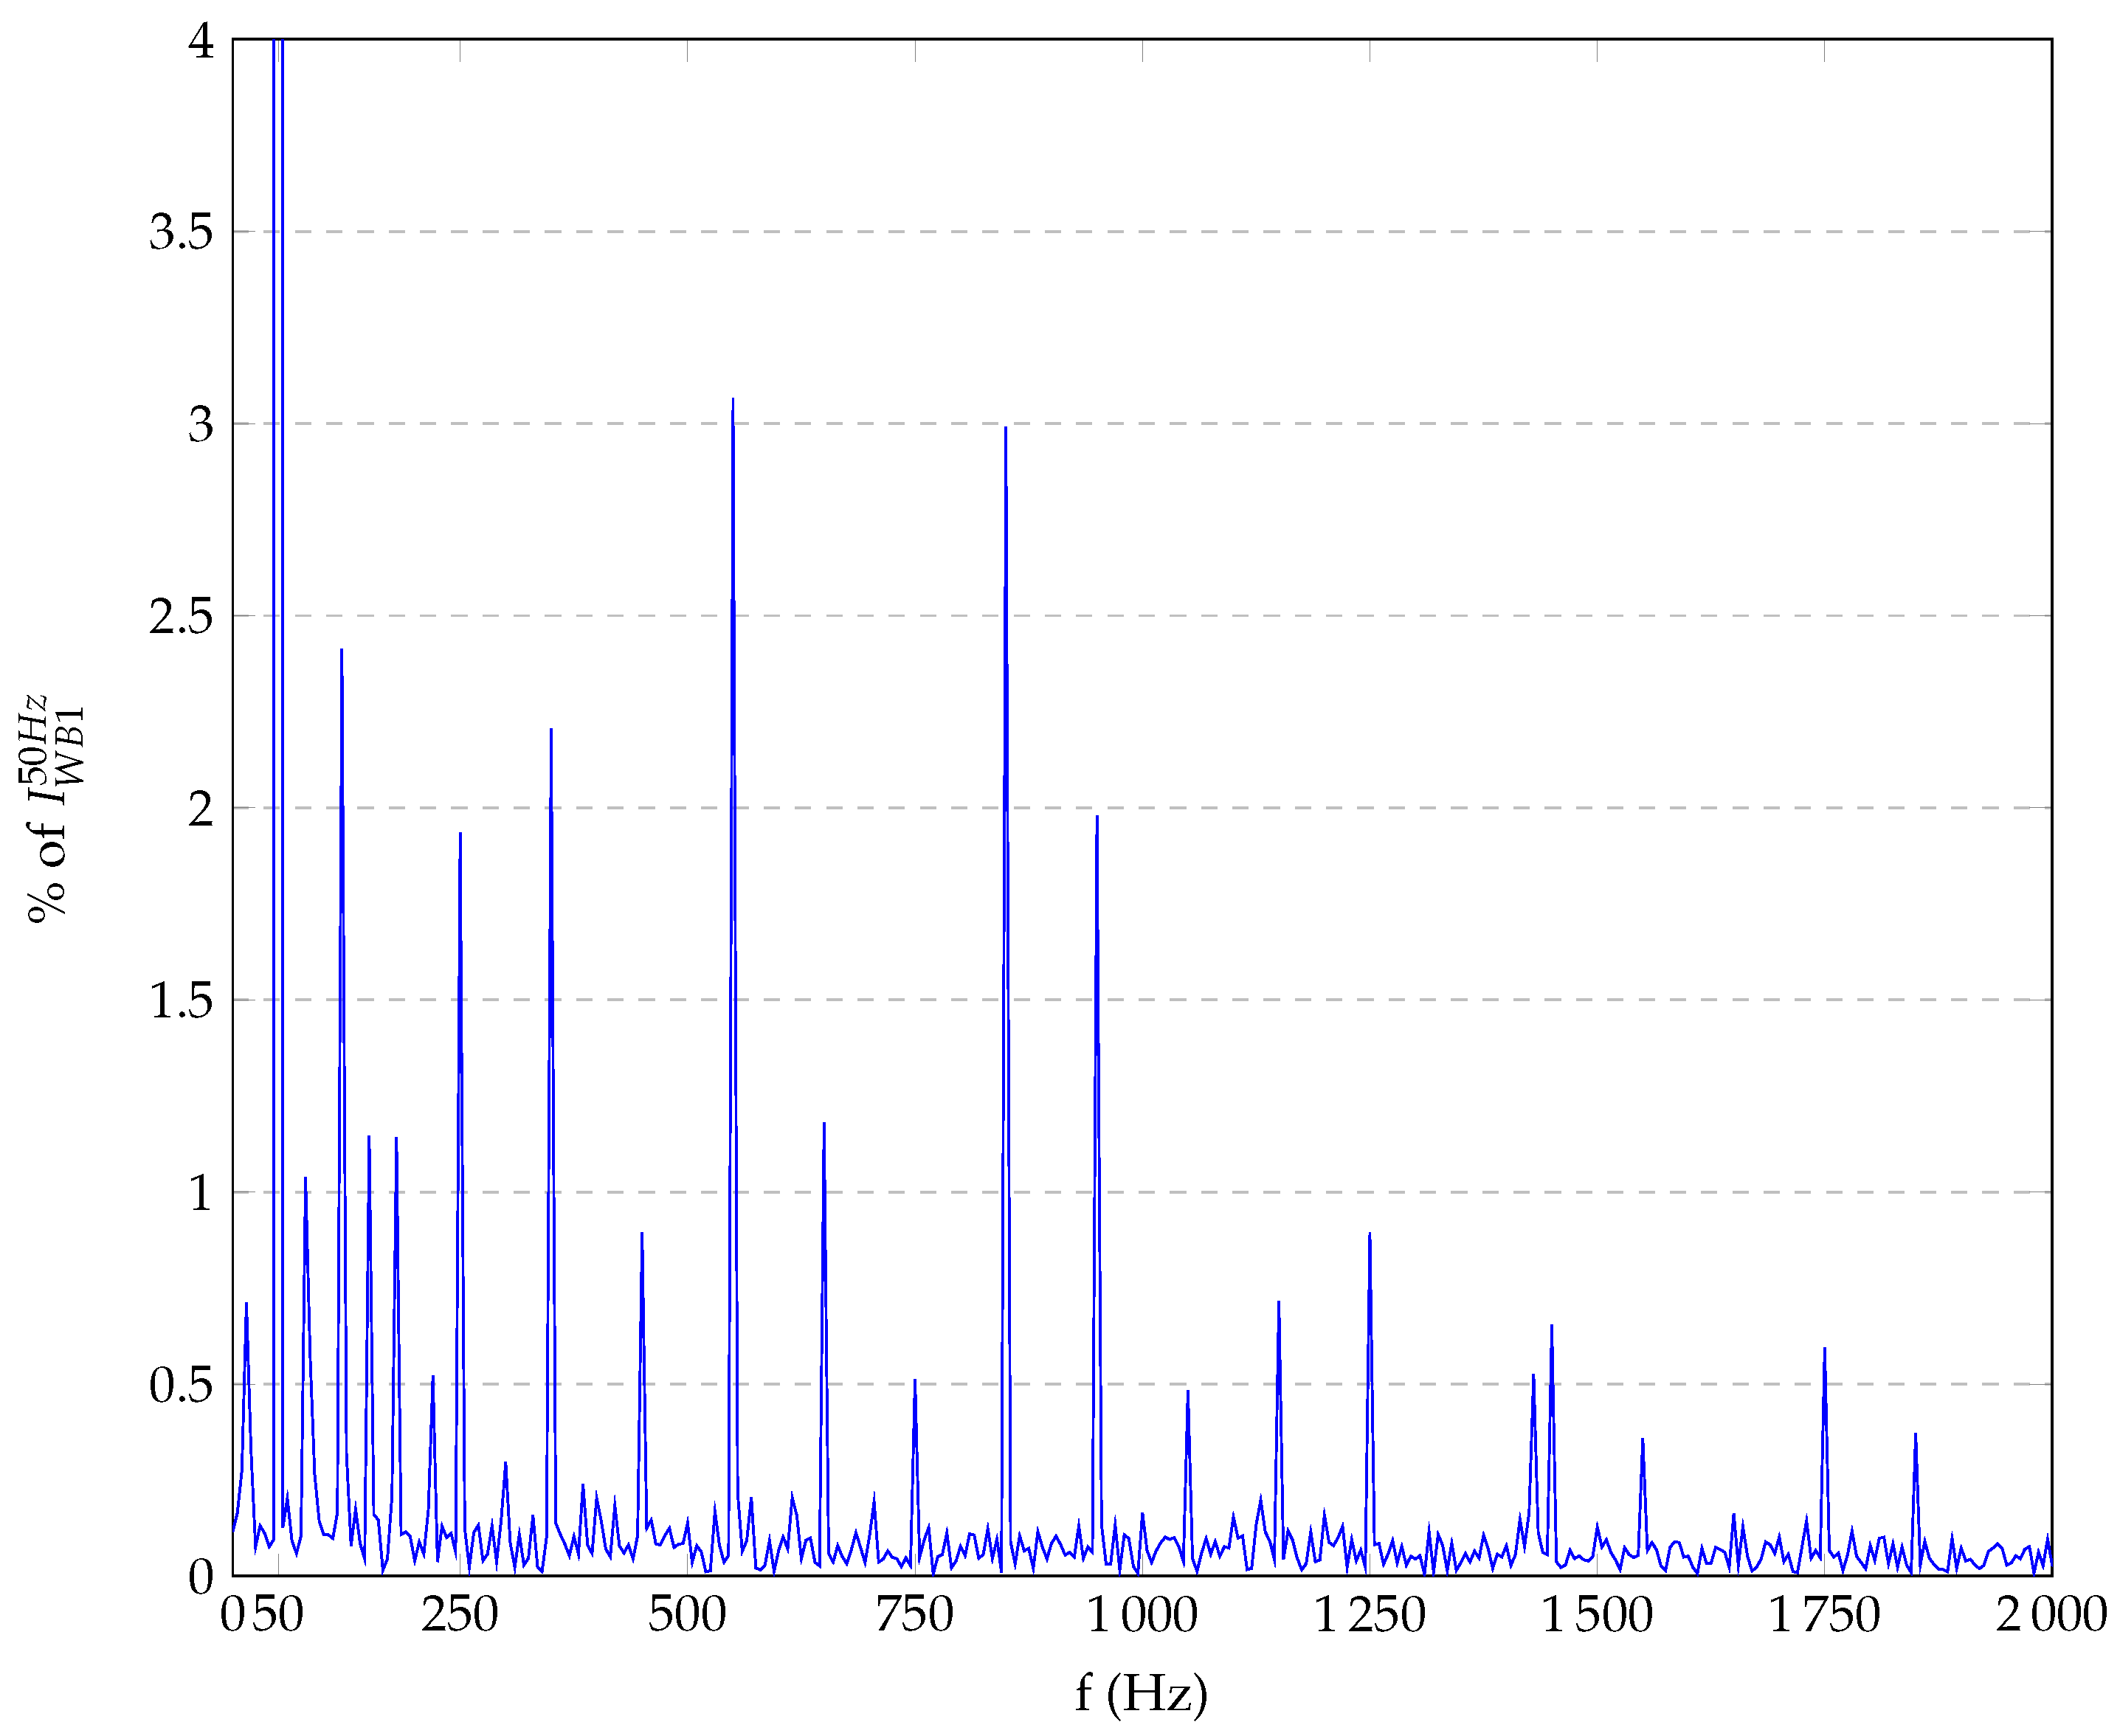
In Figure A1Figure A5, the harmonic spectra of the same charger for the other five power set-points are shown; note that these signatures are only one of the one hundred measurements taken in the study. The behavior among the tests are similar, but some differences can be found; this aspect has been considered in the present work to find the distribution of the HSI.
Figure A1. FFT spectrum of I W B 1 at 11 kW.
Energies 16 07051 g0a1
Figure A2. FFT spectrum of I W B 1 at 8 kW.
Energies 16 07051 g0a2
Figure A3. FFT spectrum of I W B 1 at 6 kW.
Energies 16 07051 g0a3
Figure A4. FFT spectrum of I W B 1 at 4 kW.
Energies 16 07051 g0a4
Figure A5. FFT spectrum of I W B 1 at 2 kW.
Energies 16 07051 g0a5

References

  1. EU. European Green Deal. Available online: https://commission.europa.eu/strategy-and-policy/priorities-2019-2024/european-green-deal_en (accessed on 28 July 2019).
  2. IEA. Global EV Outlook 2023–Analysis; IEA: Paris, France, 2023. [Google Scholar]
  3. IEA. Technology and Innovation Pathways for Zero-Carbon-Ready Buildings by 2030–Analysis; IEA: Paris, France, 2022. [Google Scholar]
  4. Savari, G.F.; Sathik, M.J.; Raman, L.A.; El-Shahat, A.; Hasanien, H.M.; Almakhles, D.; Abdel Aleem, S.H.E.; Omar, A.I. Assessment of charging technologies, infrastructure and charging station recommendation schemes of electric vehicles: A review. Ain Shams Eng. J. 2023, 14, 101938. [Google Scholar] [CrossRef]
  5. Barreto, R.; Faria, P.; Vale, Z. Electric Mobility: An Overview of the Main Aspects Related to the Smart Grid. Electronics 2022, 11, 1311. [Google Scholar] [CrossRef]
  6. IEEE Std 519-2014 (Revision of IEEE Std 519-1992); IEEE Recommended Practice and Requirements for Harmonic Control in Electric Power Systems. IEEE: New York, NY, USA, 2014; pp. 1–29. [CrossRef]
  7. IEC 61000-4-30; Standard IEC 61000-4-30 Electromagnetic Compatibility (EMC). Testing and Measurement Techniques. Power Quality Measurement Methods. International Electrotechnical Commission: Geneva, Switzerland, 2015.
  8. Nour, M.; Chaves-Avila, J.P.; Magdy, G.; Sanchez-Miralles, A. Review of Positive and Negative Impacts of Electric Vehicles Charging on Electric Power Systems. Energies 2020, 13, 4675. [Google Scholar] [CrossRef]
  9. IEC. International Electrotechnical Vocabulary; International Electrotechnical Committe (IEC): Geneva, Switzerland, 2016. [Google Scholar]
  10. EN 50160; Standard EN 50160 Voltage Characteristics of Electricity Supplied by Public Electricity Networks. CENELEC: Brussels, Belgium, 2022.
  11. TR 61000-1-1; IEC TR 61000-1-1 Electromagnetic Compatibility (EMC)-Part 1-1: General-Application and Interpretation of Fundamental Definitions and Terms. International Electrotechnical Commission: Geneva, Switzerland, 2023.
  12. Dougherty, J.; Stebbins, W. Power quality: A utility and industry perspective. In Proceedings of the 1997 IEEE Annual Textile, Fiber and Film Industry Technical Conference, Greenville, SC, USA, 6–8 May 1997; pp. 5–10. [Google Scholar] [CrossRef]
  13. Pandya, R.; Bhavsar, F. An Overview on Power Quality Issues In Smart Grid. IOSR J. Electr. Electron. Eng. 2018, 13, 1–4. [Google Scholar]
  14. Awadallah, M.A.; Singh, B.N.; Venkatesh, B. Impact of EV Charger Load on Distribution Network Capacity: A Case Study in Toronto. Can. J. Electr. Comput. Eng. 2016, 39, 268–273. [Google Scholar] [CrossRef]
  15. Alghsoon, E.; Harb, A.; Hamdan, M. Power quality and stability impacts of Vehicle to grid (V2G) connection. In Proceedings of the 2017 8th International Renewable Energy Congress (IREC), Dead Sea, Jordan, 21–23 March 2017; pp. 1–6. [Google Scholar] [CrossRef]
  16. Fast Charging Diversity Impact on Total Harmonic Distortion Due to Phase Cancellation Effect: Fast Charger’s Testing Experimental Results; Publications Office of the European Union: Brussels, Belgium, 2017.
  17. Mazurek, P.; Chudy, A. An Analysis of Electromagnetic Disturbances from an Electric Vehicle Charging Station. Energies 2022, 15, 244. [Google Scholar] [CrossRef]
  18. Slangen, T.M.H.; van Wijk, T.; Ćuk, V.; Cobben, J.F.G. The Harmonic and Supraharmonic Emission of Battery Electric Vehicles in The Netherlands. In Proceedings of the 2020 International Conference on Smart Energy Systems and Technologies (SEST), Istanbul, Turkey, 7–9 September 2020; pp. 1–6. [Google Scholar] [CrossRef]
  19. Bollen, M.H.J.; Olofsson, M.; Larsson, A.; Ronnberg, S.K.; Lundmark, M. Standards for supraharmonics (2 to 150 kHz). IEEE Electromagn. Compat. Mag. 2014, 3, 114–119. [Google Scholar] [CrossRef]
  20. Rönnberg, S.; Bollen, M. Propagation of Supraharmonics in the Low Voltage Grid. Report 2017:461; Energiforsk: Stockholm, Sweden, 2017. [Google Scholar]
  21. Lucas, A.; Bonavitacola, F.; Kotsakis, E.; Fulli, G. Grid harmonic impact of multiple electric vehicle fast charging. Electr. Power Syst. Res. 2015, 127, 13–21. [Google Scholar] [CrossRef]
  22. Dharmakeerthi, C.; Mithulananthan, N.; Saha, T. Overview of the impacts of plug-in electric vehicles on the power grid. In Proceedings of the 2011 IEEE PES Innovative Smart Grid Technologies, Perth, WA, Australia, 13–16 November 2011; pp. 1–8. [Google Scholar] [CrossRef]
  23. Mazza, A.; Pons, E.; Bompard, E.; Benedetto, G.; Tosco, P.; Zampolli, M.; Jaboeuf, R. A Power Hardware-In-the-Loop Laboratory Setup to Study the Operation of Bidirectional Electric Vehicles Charging Stations. In Proceedings of the 2022 International Conference on Smart Energy Systems and Technologies (SEST), Eindhoven, The Netherlands, 5–7 September 2022; pp. 1–6. [Google Scholar] [CrossRef]
  24. Benedetto, G.; Bompard, E.; Mazza, A.; Pons, E.; Jaboeuf, R.; Tosco, P.; Zampolli, M. Impact of bidirectional EV charging stations on a distribution network: A Power Hardware-In-the-Loop implementation. Sustain. Energy Grids Netw. 2023, 35, 101106. [Google Scholar] [CrossRef]
  25. 4Q POWER AMPLIFIER PCU-3x7000-AC/DC-400V-54A-4G with Different Options-User Manual; Spherea Puissance Plus: Colomiers, France, 2019.
  26. IEEE Std 519-2022 (Revision of IEEE Std 519-2014); IEEE Standard for Harmonic Control in Electric Power Systems. IEEE: New York, NY, USA, 2022; pp. 1–31.
  27. Ćuk, V.; Cobben, J.F.; Kling, W.L.; Ribeiro, P.F. Analysis of harmonic current summation based on field measurements. IET Gener. Transm. Distrib. 2013, 7, 1391–1400. [Google Scholar] [CrossRef]
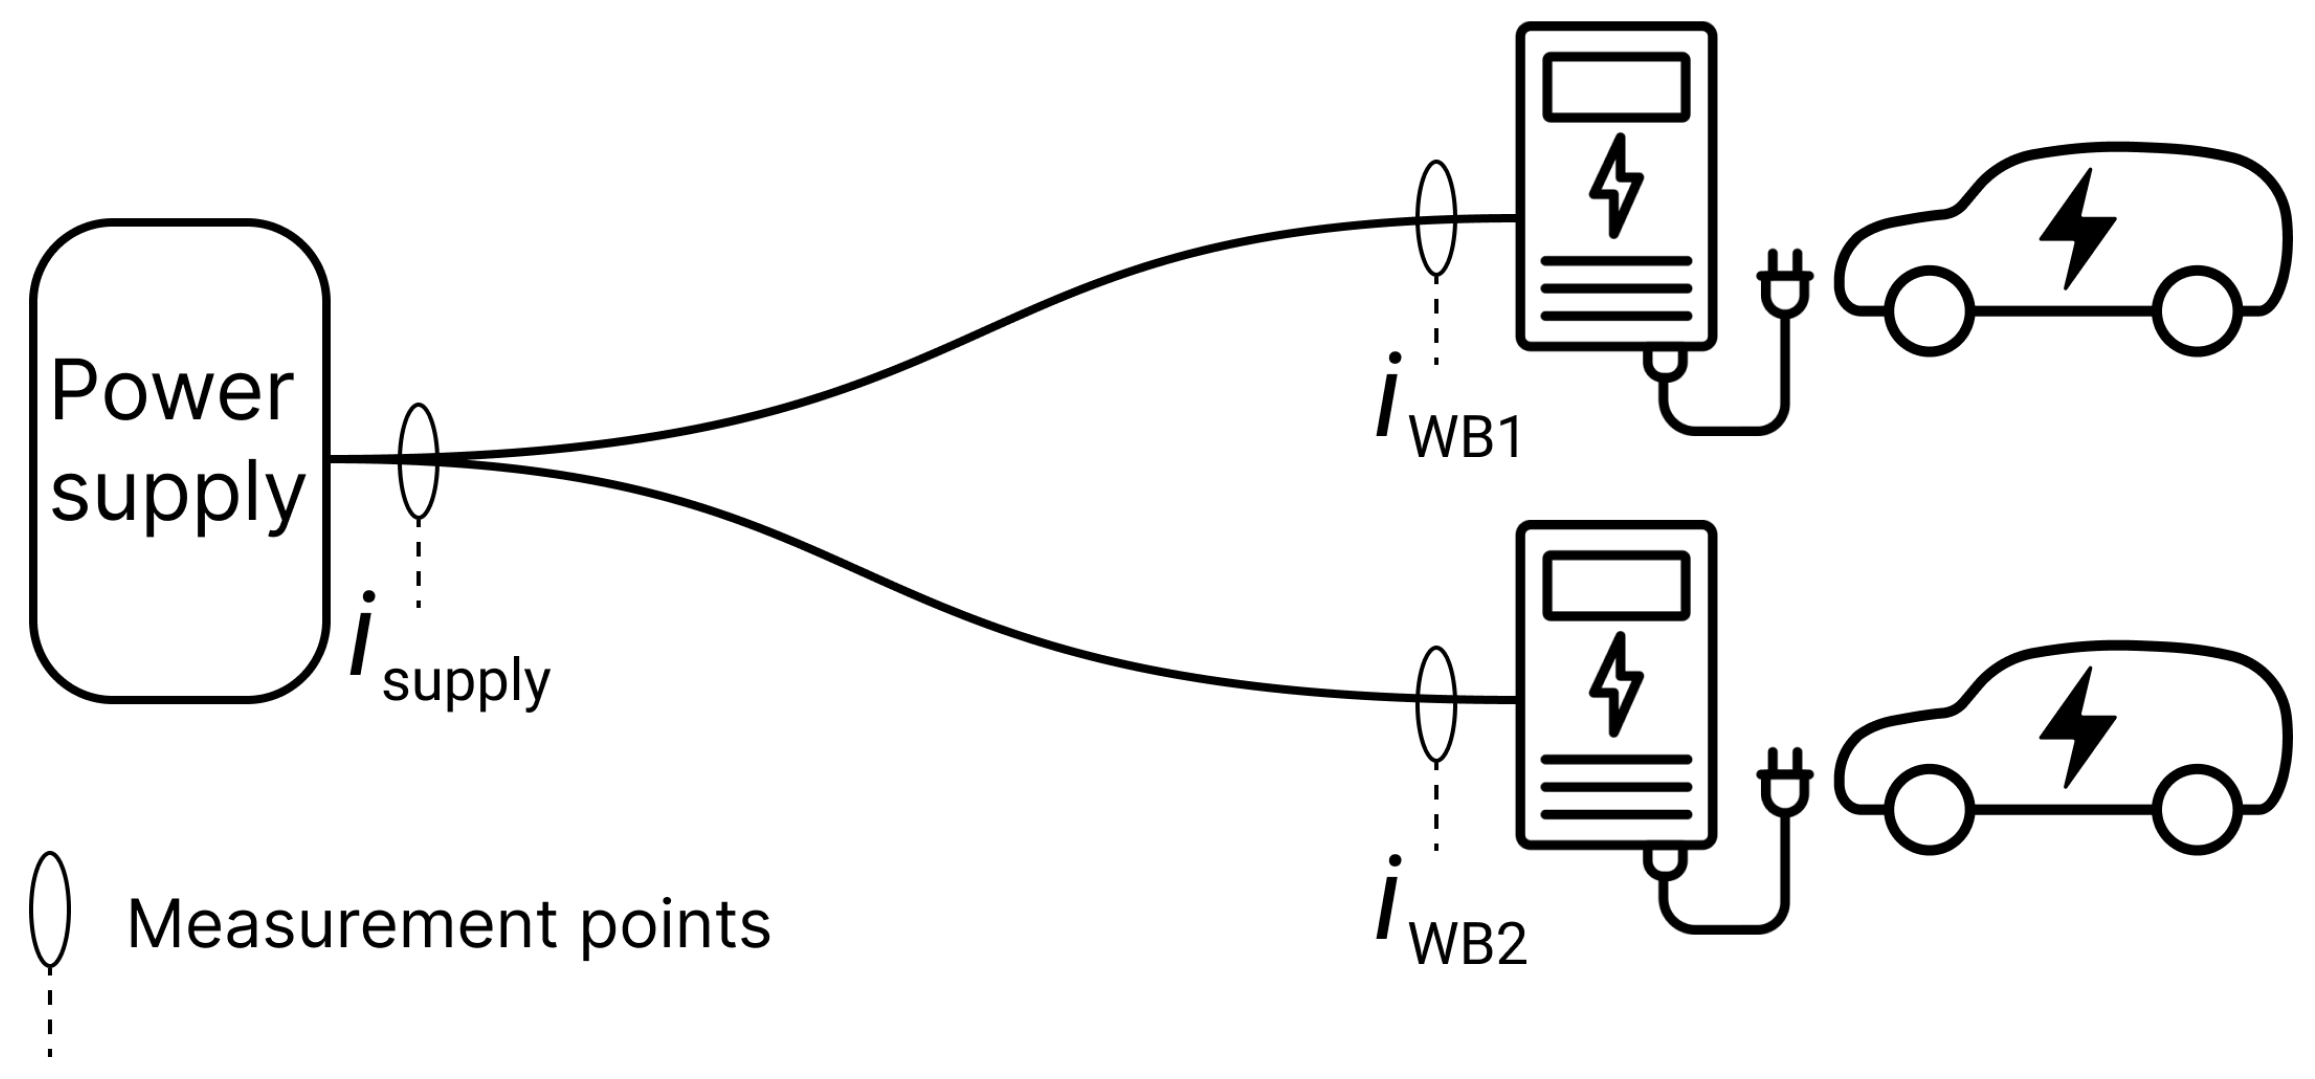
Figure 1. Representation of the experimental setup with measurement points.
Energies 16 07051 g001
Figure 2. Main order grouping.
Energies 16 07051 g002
Figure 3. FFT spectrum of I W B 1 at 10 k W .
Energies 16 07051 g003
Figure 4. Third harmonic HSI scatter plot with confidence ellipse in the 10/2 kW case.
Energies 16 07051 g004
Figure 5. Third harmonic HSI distribution for the combination WB1 = 11 kW, WB2 = 11 kW.
Energies 16 07051 g005
Figure 6. Third harmonic HSI distribution for the combination WB1 = 4 kW, WB2 = 4 kW.
Energies 16 07051 g006
Figure 7. Third harmonic HSI distribution for the combination WB1 = 8 kW, WB2 = 6 kW.
Energies 16 07051 g007
Figure 8. Third harmonic HSI distribution for the combination WB1 = 10 kW, WB2 = 2 kW.
Energies 16 07051 g008
Figure 9. Difference between power set-points: 10/2 kW and 11/11 kW.
Energies 16 07051 g009
Figure 10. Difference between power set-points: 4/4 k W and 8/6 k W .
Energies 16 07051 g010
Table 1. Set-point combinations.
CasesWB1 (kW)WB2 (kW)
Case 144
86
102
Case 21111
Table 2. Current THD %.
CasesWB1 PowerWB2 PowerPower SupplyWB1WB2
Case 14 kW4 kW5.26%5.63%5.25%
8 kW6 kW4.05%4.30%4.57%
10 kW2 kW3.79%3.52%7.30%
Case 211 kW11 kW3.01%3.05%3.10%
Table 3. Voltage THD %.
CasesWB1 PowerWB2 PowerPower SupplyWB1WB2
Case 14 kW4 kW2.08%2.09%2.07%
8 kW6 kW2.31%2.32%2.30%
10 kW2 kW2.22%2.26%2.22%
Case 211 kW11 kW2.08%2.11%2.07%
Table 4. HSI dataset structure.
Test No.Harmonic Order
123940
00.99760.60730.73671.0349
10.99730.76110.87930.6176
20.99750.48131.02360.9997
980.99770.39990.86070.7854
990.99740.46601.01500.3912
1000.99760.88010.55480.9968
Table 5. I W B 1 harmonic components.
Test No.Harmonic Order
123940
014.57760.02490.00820.0027
114.33110.02240.00820.0048
214.45970.01870.00480.0042
9814.44200.02010.00970.0059
9914.47450.01750.00690.0037
10014.59090.01540.00790.0025
Table 6. Current I W B 2 harmonic components.
Test No.Harmonic Order
123940
04.23470.01230.00470.0042
14.23240.01920.00620.0049
24.26470.02040.00300.0035
984.26830.01670.00450.0041
994.27810.01280.00320.0046
1004.27310.01060.00490.0045
Table 7. Current I S U P P L Y harmonic components.
Test No.Harmonic Order
123940
018.76760.02260.00950.0071
118.51420.03170.01270.0060
218.67800.01880.00790.0077
9818.66650.01470.01220.0078
9918.70410.01410.01020.0032
10018.81890.02290.00710.0070
Table 8. Difference between power set-points: 10/2 k W and 11/11 k W .
Harmonic OrderIndexValues
P1 = 10 kW
P2 = 2 kW
P1 = 11 kW
P2 = 11 kW
P1 = 10 kW
P2 = 2 kW
P1 = 11 kW
P2 = 11 kW
170.9812.231.8
50.90.972.031.76
110.911.011.290.82
190.810.991.150.86
30.841.110.670.42
250.960.960.640.53
130.630.960.480.34
70.411.030.460.64
Table 9. Difference between power set-points: 4/4 k W and 8/6 k W .
Harmonic OrderIndexValues
P1 = 8 kW
P2 = 6 kW
P1 = 4 kW
P2 = 4 kW
P1 = 8 kW
P2 = 6 kW
P1 = 4 kW
P2 = 4 kW
110.990.981.652.73
50.9912.312.54
70.560.980.341.85
190.840.961.261.79
1310.910.811.47
170.91.031.721.08
250.991.011.050.89
30.91.050.520.81
Disclaimer/Publisher’s Note: The statements, opinions and data contained in all publications are solely those of the individual author(s) and contributor(s) and not of MDPI and/or the editor(s). MDPI and/or the editor(s) disclaim responsibility for any injury to people or property resulting from any ideas, methods, instructions or products referred to in the content.