Abstract
This study covers the technical and economic analysis of a grid-connected rooftop 216 kWp photovoltaic (PV) system to meet the average annual energy demand of 45,327 kWh of a dairy farm. According to the results of the analysis, an average of 326,819 kWh/year is received at the output of the panel arrays, while 294,838 kWh/year is supplied to the grid. The amount of energy to be received from the grid was found to be 25,013 kWh/year, and the performance ratio of the system was 0.808. The net present value (NPV) of the system was calculated as $36,463.39, and the levelized cost of electricity (LCOE) was calculated as 0.065 $/kWh. Considering that the annual electricity generation amount of the rooftop PV system evaluated within the scope of the study is 315,152 kWh, it is estimated that 127.419 tCO2 per year of emission release will be prevented annually with the installation of the system.
1. Introduction
The demand for renewable energy resources is increasing daily due to the 4–5% increase in energy demand on a global scale every year, affecting the change in the supply status of fossil fuels and the damage caused by these fuels to the environment [1]. Some of them are applied to generate power at a large scale, such as in the case of photovoltaic energy [2]. In the report prepared by Solar Power Europe, it is stated that while countries struggling with climate change and global warming prioritize solar energy investments, this resource will provide advantages in terms of energy security and employment. According to the report, 239 GW of solar power plants will be installed worldwide in 2022, of which 118 GW will be rooftop solar power plants. In this context, the solar industry is expected to witness remarkable growth in 2023. According to the medium scenario, newly installed solar capacity is projected to reach 341 GW, reflecting a growth rate of 43% compared to those newly installed in 2022. There are industry experts who believe the market will absorb as much as 400 GW. On the other hand, the IEA expects only 286 GW of solar additions in 2023 in its main scenario, and slightly above 300 GW in its accelerated scenario [3]. The total electricity generation from installed power increased to 1.289 TWh. According to the report, solar power capacity is predicted to reach a total of 2031 GW in 2026. In this context, it is estimated that China will reach 814.1 GW, the USA will reach 311.4 GW, India will reach 176 GW, Germany will reach 132.8 GW, and Japan will reach 112.4 GW [3]. In Türkiye, 9353 solar power plants were installed by the end of 2022, and the total installed solar power capacity reached 9.425 GW. Accordingly, 9.3% of the total installed capacity in Türkiye consists of solar power plants. It is estimated that the installed solar power capacity will reach at least 12 GW in 2023 and 40 GW by 2030 [3]. When the installed capacity of rooftop solar power is analyzed, it is estimated that installed solar energy capacity will reach at least 12 GW in 2023 and 40 GW by 2030. The technical potential of rooftop solar energy on buildings in Türkiye is stated to be at least 20 GW [4].
The increase in energy costs forces agricultural farms, as in all sectors, to save money and find solutions to obtain electricity at the lowest possible price. For this purpose, farms are turning to renewable energy sources. Attractive government incentives for the use of renewable energy sources in livestock farms, dairy farms, and agricultural irrigation play an important role in increasing the number of unlicensed rooftop solar power plants. In order for agricultural enterprises to meet their self-consumption goals from renewable energy sources, the Agriculture and Rural Development Support Institution provides incentive supports up to 65% [5] of the investment, the Small and Medium Enterprises Development Organization of Türkiye provides up to 40–100% [6] of the investment, and the Türkiye Sustainable Energy Financing Facility provides up to 40% [7] of the investment. Moreover, in Türkiye, the Unlicensed Electricity Production Regulation allows the installation of rooftop and façade-type PV systems, as well as the carrying out and sale of electricity generation activities without the need for a license or establishing a company. Unlicensed production is an important practice that provides incentives and support to investors after the fixed feed-in tariff application in Türkiye. Within the scope of this application, no distribution fee is charged for the electricity transferred to the grid in 50 kW and sub-roof PV systems. In this way, there has been a significant increase in the number of rooftop PV systems. The unlicensed installed power, which was 0.4 GW at the end of 2015, reached 8.6 GW as of December 2022 [8].
Among the expectations of agricultural farms in meeting their electrical energy needs are to obtain their needs from renewable energy sources, and to sell excess energy to the grid. For example, in Kirklareli Province, 750 kWh of energy is produced from 528 solar panels installed on the roof of the farm, which produces an average of 19 tons of milk per day. The energy produced supplies a 67% profit on the electricity bill [9]. In Aydın province, a dairy farm with a capacity of 3500 tons of milk processing and 1000 tons of feed production meets the energy it needs from a 538.8 kW solar energy system installed on its roof. In the installation, 1,380,390 W panels and 5 inverters with 82.8 kW power were used. As a result of feasibility studies, it is foreseen that the system will generate approximately 760,000 kWh of energy per year and sell the surplus consumption to the grid. The installed power plant is expected to prevent approximately 326.8 tons of carbon emissions per year [10]. A 491 kW solar power plant installed on the roof of a dairy farm in Bursa produces 589,680 kWh of energy per year. In return, it was calculated that 259,459 kg of CO2 emissions could be avoided annually, 23,646 trees would be saved, and 50.7 TOE (ton of oil equivalent) would not be consumed [11]. In addition to similar projects, a rooftop solar power plant with an installed capacity of 1984.48 kW was installed in Gaziantep [12], and a rooftop solar power plant with an installed capacity of 324.72 kW was established in the Serik district of Antalya Province [13] to meet the self-consumption of dairy farms.
Simulation software, PVsyst version 7.2 [14] used in the feasibility studies of renewable energy power plants enables easy and fast technical and economic evaluations. Thanks to the developed models, the feasibility of the project can be evaluated as a result of optimization and sensitivity analyses, as well as determining the most cost-effective energy system for the relevant geographical region [15]. As an example of these studies, Yadav et al. [16] calculated the performance ratio of the solar energy system as 72% in their study. Similar performance rates were also obtained in other studies; 63.68% [17], 71.6% [18], 74% [19], and 78% [20] ratios were obtained in India. Compared to these studies, higher PR rates were obtained in studies carried out in Indonesia and Singapore (80%) [21], Ireland (81%) [22], and South Africa (81.5%) [23]. In contrast, lower PR rates were achieved at 67.36% in Greece [24], 59% in Thailand [25], and 49% in Spain [26]. According to the feasibility results obtained, the PV system is a suitable alternative for meeting the deficient energy demands of Hamirpur (India). Sharma et al. [27] analyzed energy systems consisting of PV panels placed at different azimuth angles and fixed angles. According to the results of the comparative analysis, an attempt was made to obtain the system with the highest reliability. In a study conducted in the southern region of Tamilnadu [28], the output ratio and several types of power losses (temperature, internal network, power electronics) were evaluated using PVsyst software version 5.06. As a result of the feasibility study, the solar power generation and various life cycle costs of a 1 MW photovoltaic power plant were compared. Nirwan and Thakur [29] examined a 1 MW grid-connected solar power plant at the PEC University of Technology and evaluated its performance by using PVsyst software. According to the results obtained, 4.71% more energy can be produced if the 15° tilt angle and −30° azimuth angle is optimized as a 30° tilt angle and 0° azimuth angle. Kumar et al. [30], in their study conducted using PVsyst software, found that the amount of energy that a 100 kWp grid-connected poly-Si system can generate and deliver to the grid is 165.38 MWh/year and 161.6 MWh/year, respectively. It was concluded that the performance rate of the system was 80%, and that the available energy was 4.42 kWh/kWp/day. Çaglayan [31] comparatively analyzed independent photovoltaic, wind, and combined energy generation systems for a medium-sized dairy farm. According to the optimization results, it was found that the most feasible system consists of a 264 kW photovoltaic array with 202,820 Ah batteries and a 28.6 kW converter. The payback period of the system is 4.4 years, and the internal rate of return is calculated as 14.4%.
The effect of environmental factors on photovoltaic panel performance was examined, and it was concluded that temperature reduces panel efficiency; wind speed [32], radiation, and air pressure have a positive effect on panel efficiency; and humidity causes corrosion [33]. Although the increase in solar radiation and sunshine duration increases the benefit from photovoltaic systems, the increase in temperature causes a decrease in panel efficiency [34]; this decrease is 1–2% at temperatures above 30 °C [35,36]. It has been determined that each degree increase in air temperature reduces panel efficiency by 0.5% [37] and 0.7% [38].
Energy yield estimation and modeling can be carried out using solar irradiance, local weather conditions, and estimates of plant losses based on nominal values seen in existing projects [39]. PVsyst is one software capable of modeling the system [40]. Apart from this, modeling and simulation software such as HOMER, PVSOL, Retscreen, PVWATTS, TRNSYS, PVFORM, INSEL, P-Spice, SolarPro, and PVcad are also widely used in the design of photovoltaic systems to calculate energy efficiency [18,41,42,43].
The purpose of the current analysis is:
- To identify and evaluate the solar resource potential in the region,
- To simulate a 216 kWp grid-connected rooftop solar power plant using PVsyst software.
- To assess the annual energy efficiency and performance rate of the PV system.
- To assess the energy production of the planned PV system and the results of techno-economic analysis.
Research Significance
Renewable energy sources have become very important for the whole world due to the increasing dependence on fossil fuels in energy consumption. Although Türkiye is among the richest regions in the world in terms of solar energy, PV power plant investments are not yet sufficient. There is a need for investments to increase the use of solar energy, especially in agricultural areas and farms. Therefore, in this study, how to design a rooftop PV system for dairy farms using PVsyst software, its contribution to the economy, and its depreciation period were investigated, and we aimed to present the benefits that will arise from the implementation of the facility.
The energy consumed in air conditioning, ventilation, lighting, and feeding systems in farms is increasing rapidly. In this way, facilities to produce electricity from agricultural energy will be provided, excess energy will be sold to the state, and financial income will be obtained. Thus, by installing the PV system on roofs, land use will be reduced, and individual electricity generation systems will be developed. This study aims to be useful to investors in the application of solar energy systems in agricultural farms.
2. Materials and Methods
2.1. Performance Parameters
2.1.1. Reference Yield (YR)
The YR defines the solar radiation resource for the PV system and is a function of the location, orientation of the PV array, and month-to-month or year-to-year weather variability [44]. It is calculated according to Equation (1).
where YR is the reference yield (h/d), Ht is total plane of array solar irradiation (kWh/m2d), and GSTC is the reference radiation (kWh/m2). If GSTC equals 1 kW/m2, then the reference yield is the number of peak sun hours, which will be numerically the same as the solar insolation in units of kWh/m2.
2.1.2. Final Yield (YF)
The YF represents the number of hours that the PV array would need to operate at its rated power to provide the same energy, and normalizes the energy produced with respect to the system size [44]. It is calculated according to Equation (2).
where YF is the final yield (h), EAC is the AC electricity generation (kWh), and Prated is the rated power of the PV plant (kWp) at STC (1000 W/m2 at 25 °C).
2.1.3. Performance Ratio (PR)
The PR is defined as the ratio of YF to YR (Equation (3)) [45]. The PR is stated as a percentage, and describes the relationship between the actual and theoretical energy outputs of the PV plant.
2.1.4. Capacity Factor (CF)
The CF is the ratio (%) of the actual total amount of power produced by a power plant in a given time period (usually calculated annually) to the amount of power it can produce by operating at full capacity each hour of that time period. It is calculated according to Equation (4) [46].
2.1.5. System Efficiency (ηPV)
System efficiency is one of the most important values used in the comparison of solar panels. The overall efficiency of a photovoltaic system is the measurement of how much of the available solar energy is converted into usable AC electrical energy [47]. It is calculated according to Equation (5).
where ηPV is system efficiency (%), and APV is the total area of the PV array (m2).
2.2. Financial Analysis
The payback period (PBP), net present value (NPV), and levelized cost of energy (LCOE) methods [48,49] were used to assess the profitability of the investment.
2.2.1. Payback Period (PBP)
The PBP is the time it takes to recover all the money spent on the investment. According to this method, the payback period is the year in which the sum of annual net profits equals the initial investment costs, and a positive net return is achieved [50]. It is calculated according to Equation (6).
2.2.2. Net Present Value (NPV)
The NPV is the difference between the present value of the return over the economic life of the investment minus the present value of the investment costs (Equation (7)). If NPV > 0, the investment is accepted, and if NPV = 0, it is understood that the annual revenue streams barely cover the operating costs and annual investment costs [51].
where Co is the initial investment, Ci is the cash flow in years, r is the discount rate, and t is the total system lifetime (year).
2.2.3. The Levelized Cost of Energy (LCOE)
The LCOE is the unit cost of energy calculated by taking into account all of the costs incurred from the installation phase of the power plant to the start of production. The obtained figure gives the break-even point in the sale of energy. It is calculated according to Equation (8) [52].
where It is the investment expenditure in year t, Mt is the operation and maintenance expenditure in year t, Et is the electricity generated in year t, r is the discount rate, and n is the lifetime of the system (year).
2.3. Proposed Rooftop PV System
2.3.1. Meteo Database
In this study, the feasibility of a rooftop grid-connected PV system planned to be installed for a dairy farm established on an area of 8134 m2 in the Elmali district of Antalya Province is discussed. The farm has 127 cattle. There is a shelter and milking building with an area of 1176 m2 (42 × 28 m) within the farm area. Within the building, there is a (2 × 3) milking room with a fishbone system, where six cows are milked at the same time, and there is a milk cooling tank with a capacity of 2 tons. The distribution of the total daily energy consumption of the farm is given in Figure 1. According to the data, the highest energy consumption of the farm is carried out for milk cooling and storage, at 43%.
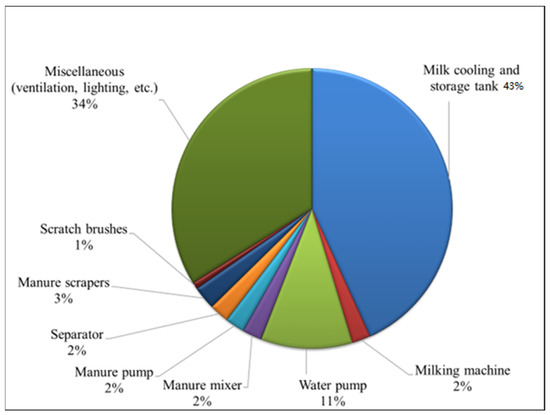
Figure 1.
Distribution of the total daily energy consumption of the farm.
The daily and monthly average electricity consumption of the farm in 2021 was determined to be 124.25 kWh and 3777.25 kWh, respectively, as shown in Table 1. The total energy consumption of the farm for one year is 45,327 kWh. The farm will supply all of the electricity to be produced from solar energy to the grid and receive the electricity it needs from the grid. At the end of each month, offsetting will be made with the electricity supply company.

Table 1.
Monthly electricity consumption of the farm.
The solar energy potential, daily radiation values, and average sunshine hours of the Elmali district are given in Figure 2 and Figure 3. The lowest air temperature of the district was 2.4 °C in January, the highest was 25.4 °C in July, the annual average temperature was 13.4 °C, and the average relative humidity was 59.5%. The annual average wind speed was measured as 1.8 m/s [53]. The month with the highest radiation and sunshine duration in the district is July, and the month with the lowest duration is December [54].
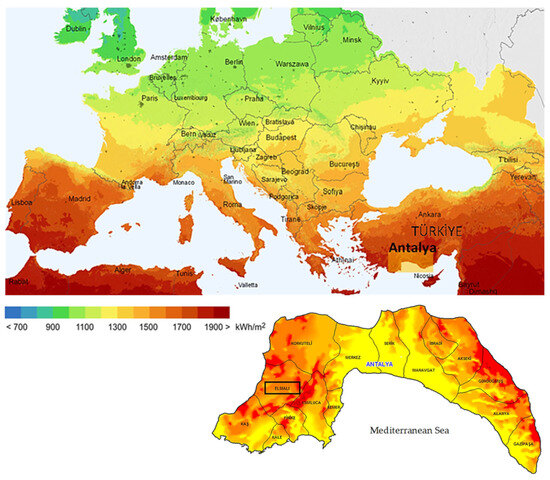
Figure 2.
Solar energy potential atlas [54,55].
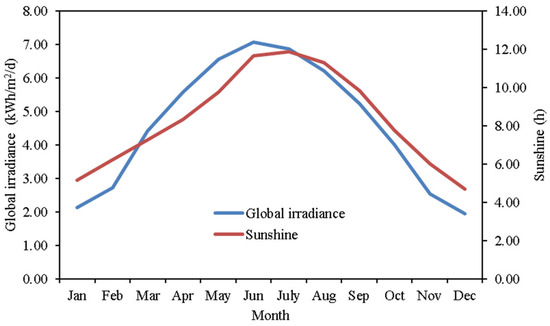
Figure 3.
Global irradiance values and sunshine hours for the Elmali district [54].
2.3.2. Configuration of the System
The roof of the shelter and milking building located in the farm site has two surfaces facing south (S) and north (N), and both surfaces have a tilt of 6° (Figure 4). Panel arrays will be placed on the (S) surface of the roof at 0° and on the (N) surface at 180° with azimuth angles.
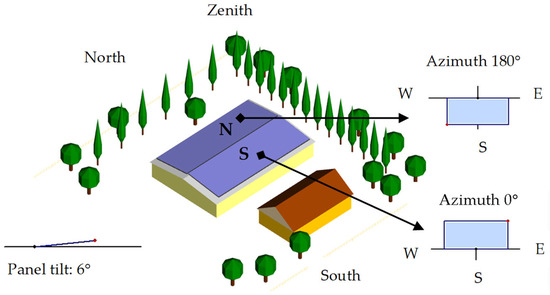
Figure 4.
View of the dairy farm site and panel placement on the building roof.
The number of panels is planned to be 360 in total, 180 on both surfaces of the roof equally. The panels will be placed on a total area of 1019 m2 (13.21 × 39.44 m), with a gap of 0.02 m between them. It is predicted to use 600 Wp monocrystalline panels in the system [54]. The technical specifications of the solar panel are given in Table 2. The construction carrying the panels will be placed at the same angle as the roof.

Table 2.
Technical specifications of the solar panel (CWT600 120PM12) [56].
A total of four grid-connected inverters, each with a power of 49.5 kW, will be used in the system. Technical details of the inverter are given in Table 3 [56].

Table 3.
Technical specifications of the inverter used in the system (SUNGROW/SG49K5J) [57].
In the analysis, it was found appropriate to place 10 strings on each of the (S) and (N) surfaces of the roof, with a total of 20 strings of panels. There are 18 panels in each string. The layout of the strings (for one surface of the roof) is given in Figure 5, and the electrical connection diagram to be used by the inverter and the plant is given in Figure 6. Two of the four inverters in the system are connected to the 10 strings (S1 to S10) on the (S) surface of the roof, and the other two are connected to the 10 strings (S11 to S20) on the (N) surface.
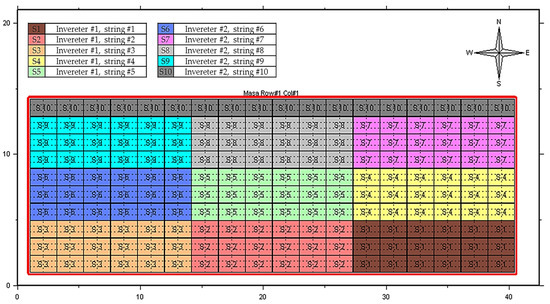
Figure 5.
Layout of panel strings (for one surface of the roof).
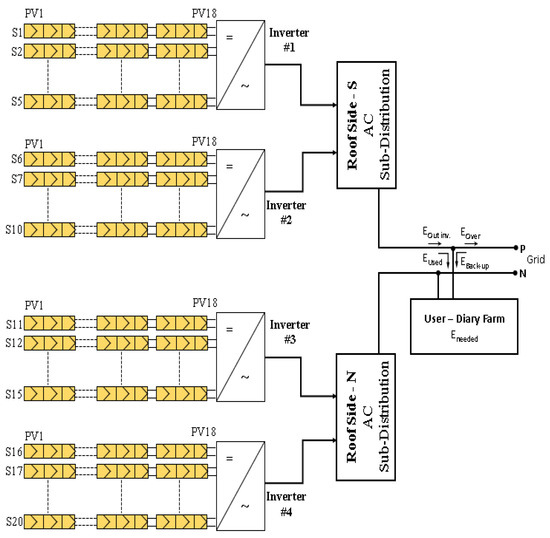
Figure 6.
Electrical connection diagram.
3. Results and Discussion
3.1. Electricity Generation of Rooftop PV Systems
Since the (S) surface of the roof faces south, electricity generation is higher compared to the (N) side. The solar radiation from the sun to the panels is exposed to shading at some hours of the day due to the trees in and around the farm site as well as the building that is used as a worker’s house. This situation affects the amount of energy that is obtained. The highest loss on the (S) surface of the roof was found to be in January, with 12.3%, and the highest loss on the (N) surface was found to be in June, with 21.7%. According to the findings, the Pmpp values obtained on the (S) surface of the roof in January, February, and March are 3.07, 2.81, and 1.49 kW, respectively, in the unshaded condition, and 2.17, 2.79, and 1.48 kW, respectively, in the shaded condition. On the surface of the roof (N) in the same months, the Pmpp values are 0.74, 1.87, and 3.31 kW in the unshaded condition and 0.83, 1.85, and 1.84 kW in the shaded condition. The shading factor between 1–40% in direct radiation is given in Figure 7, and the trajectory of the sun passing over the farm is given in Figure 8.
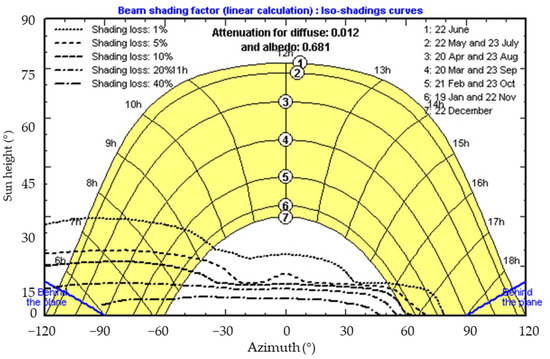
Figure 7.
Shading factor curves for the solar power plant to be installed.
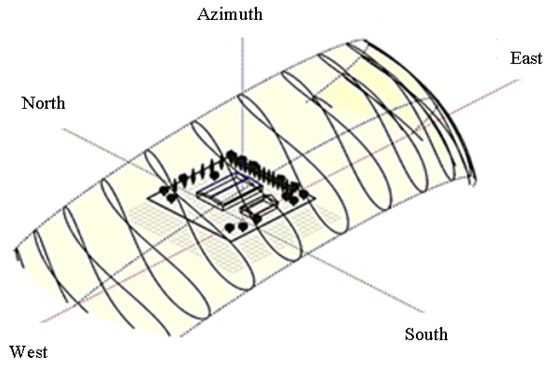
Figure 8.
The trajectory of the sun passing over the farm.
Considering the monthly solar radiation and duration of the region where the farm is located, the amounts of energy produced, used, and supplied to the grid by the PV system are given in Table 4. The performance ratio of the system was obtained as 0.808 (Figure 9). The acceptable performance ratio range of grid-connected PV systems varies between 60 and 80% [58]. According to the results obtained, the PV system performs well at this site. According to the analysis results, the highest monthly energy amount produced by the panels was achieved in June, with 41,966 kWh, and the lowest was achieved in December, with 13,237 kWh. The annual average production was found to be 326,819 kWh. When the inverter output is analyzed, the highest monthly output was achieved in July, with 41,403 kWh, and the lowest was achieved in December, with 13,000 kWh. The annual average inverter output was found to be 322,612 kWh. The ratio of total PV power (216 kWp) to total inverter power (4 × 49.5 kWac) is 1.091. The inverter efficiency is 98.6% on average per year when the inverter is active.

Table 4.
Amounts of energy produced, used and supplied to the grid by the PV system.
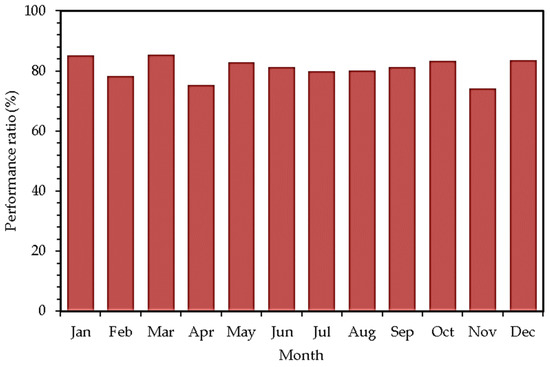
Figure 9.
Performance ratio (PR) of the system.
An annual average of 45,327 kWh of the energy generated is used for the consumption of the farm, while 294,838 kWh is supplied to the grid. When the PV system does not produce enough energy, the farm will meet the energy it needs from the grid and will offset with the electricity distribution company at the end of the month. According to the results of the analysis, the amount of energy to be taken from the grid was found to be 25,013 kWh/year. In this case, the ratio of the energy used by the farm to the energy from the sun is 0.448 per year. The analysis results of the useful energy (inverter output) and loss values that can be obtained from the rooftop solar energy system with a rated power of 216 kWp are given in Figure 10.
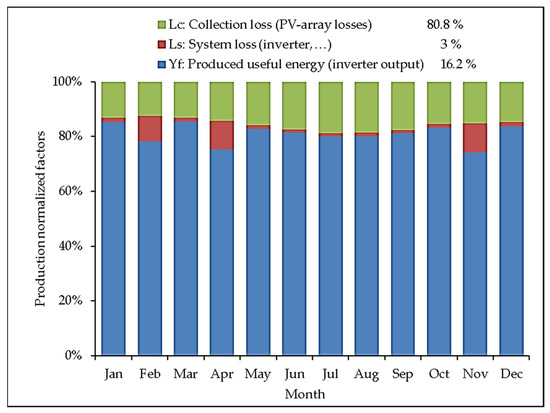
Figure 10.
Generated energy and loss factors.
According to the results, the useful energy produced reaches 80.9% on average per year, the highest in June with an average of 6.33 kWh/kWp/day, and the lowest in December with an average of 1.94 kWh/kWp. The daily average value of useful energy is 4 kWh/kWp. On the other hand, the lowest electrical loss in PV panel arrays is carried out in January with 3.28%, and the highest is carried out in July with 14.45%. The annual average loss in panels is 7.97%. When the electrical loss in the inverters is analyzed, it is seen that the annual average loss is 1.4% (Figure 11). The technical analysis results of the PV system are given in Table 5.
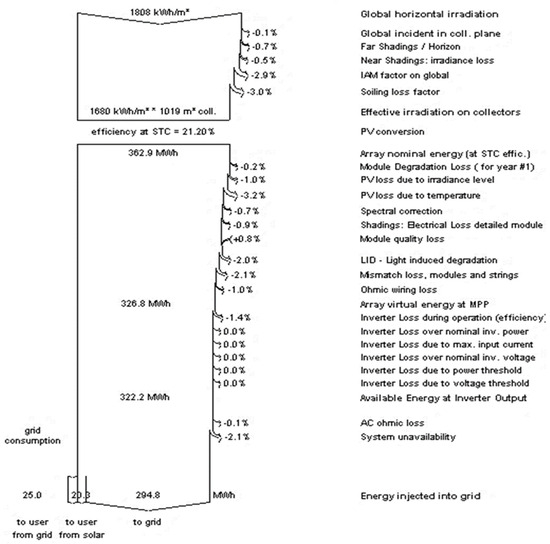
Figure 11.
Diagram of losses.

Table 5.
Technical analysis results of the PV system.
3.2. Economic Analysis of Rooftop PV Systems
The total installation cost of the system is calculated as approximately $145,400. It is assumed that the company will meet all of this calculated cost with its own resources. Panel manufacturers generally determine an economic life between 20–25 years considering the warranty periods [59]. In the analyses, the lifetime of the system is assumed to be 25 years [60], and an annual efficiency decrease at a rate of 3% is assumed due to the effect of contamination in the panels [44]. The annual inflation rate is 14.6%, the Central Bank of the Republic of Türkiye (CBRT) discount rate is 15.75%, the grid energy unit price (low voltage, for farms) is 0.151 $/kWh [61], and 70% of the investment cost consists of PV panels and construction. According to the data obtained from the market research in the first quarter of 2022, the unit price of the panels was determined to be in the range of 0.38–0.45 $/W on average. The NPV of the system was calculated as $36,463.39, and the LCOE was calculated as 0.065 $/kWh. The calculated LCOE corresponds to other research studies. Rodríguez-Martinez and Rodríguez-Monroy [62] modelled photovoltaic systems in Spain. They found that their LCOE ranged from 0.035 $/kWh to 0.071 $/kWh. An average of $900 is allocated for the annual maintenance of the system. It can be assumed that the recovery value of the investment after the end of its economic life will be 30% of the equipment costs [63].
The accumulated cash flow of the 216 kW solar power plant Investment obtained as a result of the financial analysis based on the CBRT February 2022 exchange rate data [64] is given in Figure 12.
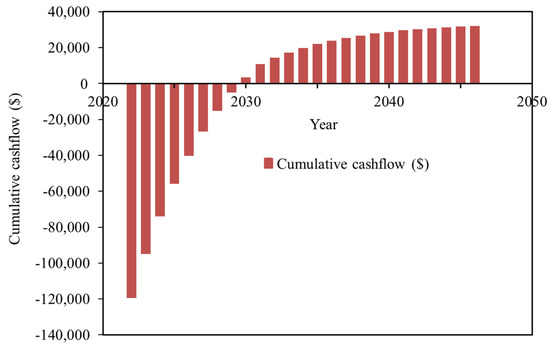
Figure 12.
Accumulated cash increase.
According to the graph, the return on investment is estimated to be 8.2 years. The payback period of the solar energy system is influenced by the power of the panel, regional climatic conditions, and economic factors such as exchange rate and inflation. Some studies explained that the payback period of solar energy 4.9 [65], 6.2 [66], 6 [67], and 5.9 [68] is 4 years if the investment is made with equity capital, and 9 years if the investment is made with credit [53]. The reason for the longer payback period in this study compared to similar studies can be explained by the increase in the exchange rate and inflation rate. The average monthly invoiced electricity consumption cost of the farm is 3777.25 kWh, which was calculated as $581.70 per month and $6980 per year. The monthly and annual production amounts of the PV system are 26,296 kWh and 315,152 kWh, respectively (Figure 13).
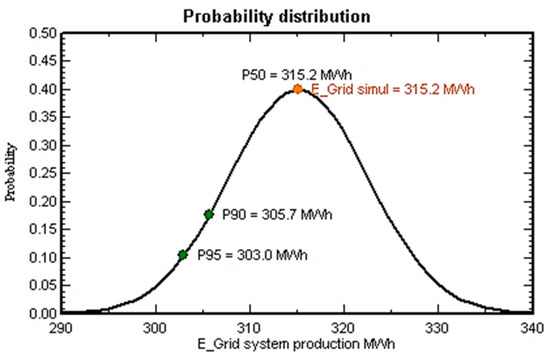
Figure 13.
Production amount of the PV system.
Surplus electricity energy given to the grid in each invoice period as a result of monthly offsetting by unlicensed producers based on renewable energy resources is purchased by the supply company for 10 years at retail single-time active energy prices of the subscriber group [69]. Accordingly, an annual amount of 295,240 kWh of the energy to be generated can be sold to the grid for 10 years, and an average annual income of $29,819 can be generated from this sale. At the end of the purchase guarantee period, electricity sales can continue at half the price for the remaining 15 years. The results of the economic analysis of the rooftop PV system are given in Table 6.

Table 6.
Economic analysis results of the rooftop PV system.
3.3. Environmental Impact of Rooftop PV Systems
According to an International Energy Agency (IEA) analysis, global emissions from energy reached 36.3 billion tons in 2021, increasing by 6%. Coal was reported to account for more than 40% of the total increase in global CO2 emissions in 2021, reaching 15.3 billion tons. CO2 emissions from natural gas, on the other hand, exceeded 2019 levels and increased to 7.5 billion tons [70]. Considering that thermal power plants emit 0.94 kg of CO2 gas into the atmosphere to generate 1 kWh of electricity [67], these power plants emit approximately 100 million tons of CO2 per year. In this case, the most important way to reduce the amount of carbon is to increase the use of renewable energy sources. According to 2019 data, energy-related emissions accounted for the largest share of total greenhouse gas emissions in terms of CO2 equivalents at 72%. In 2020, with 0.53 billion tons of CO2-equivalent emissions, Türkiye alone accounted for 1% of the world’s emissions and became the country with the 16th highest emissions in the world. In terms of per capita emissions, Türkiye’s emissions amounted to 6.29 tons. On the other hand, the share of the energy sector among other sectors emitting carbon emissions was 24.17% [71].
In order to reduce the environmental damage caused by the excessive use of fossil fuels, it is necessary to focus on renewable energy sources and use them effectively not only in cities, but also in agricultural farms. Türkiye imports 73% of its energy. In order to reduce this rate, the share of renewable energy sources in electricity production is aimed to be at least 30% in 2023. Considering that there are around 1,124,000 officially registered dairy farms [72] in Türkiye, it is hoped that providing support for the establishment of rooftop solar energy systems can make significant contributions to achieving this goal. Additionally, idle building roofs on the farm will be utilized, and thus the occupation of valuable lands and agricultural areas can be prevented. Therefore, rooftop solar energy systems are seen as an environmentally friendly choice for dairy farms, as well as sustainable regarding economic and agricultural activities [73,74]. The availability of rooftops can be exploited by farmers while respecting the environmental and landscape equilibrium of land for the benefit of a new environmentally sustainable image of their agricultural activity, reducing energy demand [75,76] and contributing to the sustainable management of natural resources. Efforts to develop renewable energy sources in agriculture are necessary for various reasons. This necessity results from the need to reduce the dependence of agricultural activities on fossil fuels and to achieve objectives related to the reduction in greenhouse gas emissions. This also provides an opportunity to improve the multifunctionality of agriculture and to draw agricultural production to a larger extent from ecological solutions [77].
Considering that the annual electricity generation amount of the rooftop PV system evaluated within the scope of the study is 315,152 kWh, it is estimated that 127.419 tCO2 per year, and a total of 3185.48 tCO2 emissions will be prevented for 25 years, which is the economic life of the system. In addition, the amount of CO2 prevented per kW was found to be 14.748 tons. The amount of carbon emissions prevented by the PV system is given in Figure 14.
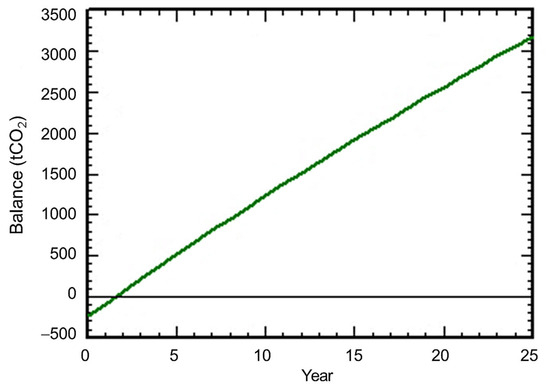
Figure 14.
Amount of carbon emissions prevented by the PV system.
4. Conclusions
In this study, a technical and economic analysis of a grid-connected rooftop PV system was carried out to meet the energy needs of a dairy farm with 127 cattle in the Elmali district of Antalya Province. The largest share in the total electrical load of the farm is milk cooling and storage, at 43%. The average invoiced monthly energy consumption of 3777.25 kWh was calculated as 581.70 $/month and 6980 $/year. The cost per Wp of the PV system, which is planned to be installed on the roof of the farm building with a grid connection, is calculated as 0.67 $/Wp, and the total cost is calculated as $145,400. It is estimated that 295,240 kWh of the energy generated by the system can be sold to the grid for 10 years, and an average annual income of $29,819 can be obtained from this sale. The NPV of the plant is calculated as $36,463.39, and the LCOE is calculated as 0.065 $/kWh. Considering that the annual electricity production amount of the solar energy system to be installed in the plant is 315,152 kWh, it is estimated that 127.419 tCO2 emissions will be prevented annually. The PV system is an environmentally friendly investment because it prevents CO2 emissions and provides economic gain for the farm.
Increases in energy prices in recent years have been effective in helping farms move toward direct solar energy systems. The increase in the number of companies producing panels and other system components in Türkiye and supplying them from abroad in recent years has enabled small farms to access these systems. Meeting the electrical energy needs of agricultural farms from the sun will reduce energy costs and provide additional income by selling energy to the grid. To make use of solar energy widespread in Türkiye, which has a high solar energy potential, it is important to pave the way for farms to use renewable energy, to provide advantages by increasing the necessary incentives, and to protect the environment and economic sustainability.
Funding
This research received no external funding.
Data Availability Statement
The data presented in this study are available in this article.
Conflicts of Interest
The author declares no conflict of interest. The funders had no role in the design of the study; in the collection, analyses, or interpretation of data; in the writing of the manuscript; or in the decision to publish the results.
References
- Gül, S.E.; İzgi, E. Analysis of an industrial plant with intelligent or conventional panels connected to wind and solar energy systems. In Proceedings of the 2018 Power Systems Conference, Ankara, Türkiye, 15–16 November 2018; pp. 59–63. [Google Scholar] [CrossRef]
- Veerendra Kumar, D.J.; Deville, L.; Ritter, K.A., III; Raush, J.R.; Ferdowsi, F.; Gottumukkala, R.; Chambers, T.L. Performance Evaluation of 1.1 MW Grid-Connected Solar Photovoltaic Power Plant in Louisiana. Energies 2022, 15, 3420. [Google Scholar] [CrossRef]
- Global Market Outlook for Solar Power 2023–2027. Solar Power Europa. Available online: https://api.solarpowereurope.org/uploads/Global_Market_Outlook_2023_2027_report_18b86a4568.pdf (accessed on 2 July 2023).
- Solarist. Available online: https://www.solar.ist/gunder-2023-yilinda-turkiyenin-gunes-enerjisi-kapasitesi-en-az-12-gwa-ulasacak/ (accessed on 2 July 2023). (In Turkish).
- ARDSI. Call for Application Announcements. Available online: https://www.tkdk.gov.tr/ProjeIslemleri/CagriIlanArsiv?lang=en (accessed on 14 September 2023). (In Turkish)
- SMEDOT. Supports. Small and Medium Enterprises Development Organization of Türkiye. Available online: https://en.kosgeb.gov.tr/ (accessed on 14 September 2023). (In Turkish)
- TURSEFF. Türkiye Sustainable Energy Financing Facility. Available online: https://www.stantec.com/en/projects/turkey-projects/turkey-sustainable-energy-financing-facility (accessed on 14 September 2023). (In Turkish).
- Investment Office. Invest in Turkish Energy Sector. Available online: https://www.invest.gov.tr/de/library/publications/lists/investpublications/energy-industry.pdf (accessed on 13 September 2023).
- Anadolu Agency. Economy. In An Application Example on Meeting the Energy Needs of Modern Milk Production Facilities in Turkey. Available online: https://www.aa.com.tr/tr/ekonomi/kirklarelinde-modern-sut-uretim-tesislerinin-enerji-ihtiyaci-gunesten-karsilaniyor-/2911915 (accessed on 27 June 2023). (In Turkish).
- Entegro Energy. Available online: https://entegro.com.tr/referanslarimiz/megasut-ges/ (accessed on 17 June 2023). (In Turkish).
- Sunvital Energy. Available online: https://www.sunvital.com.tr/urun/erma-sut-491-kwp-gunes-enerji-santrali-bursa/ (accessed on 17 June 2023). (In Turkish).
- ST Industry. Available online: https://www.stendustri.com.tr/enerjisini-ureten-fabrikalar/cw-enerji-burpa-sut-urunleri-fabrikasina-ges-kurdu-h115379.html (accessed on 17 June 2023). (In Turkish).
- Enerji Günlüğü. Available online: https://www.enerjigunlugu.net/akdeniz-sutun-serik-fabrikasina-cati-ges-kuruldu-51614h.htm (accessed on 17 June 2023). (In Turkish).
- PVsyst, S.A. Software User Manual (ver. 7.2). Available online: https://www.pvsyst.com/pdf-tutorials/ (accessed on 10 June 2023).
- Ngan, M.S.; Tan, C.W. Assessment of economic viability for PV/wind/diesel hybrid energy system in southern Peninsular Malaysia. Renew. Sustain. Energy Rev. 2012, 16, 634–647. [Google Scholar] [CrossRef]
- Yadav, P.; Kumar, N.; Chandel, S.S. Simulation, and performance analysis of a 1 kWp photovoltaic system using PVsyst. In Proceedings of the International Conference on Computation of Power, Energy, Information and Communication (ICCPEIC), Melmaruvathur, India, 22–23 April 2015; pp. 0358–0363. [Google Scholar] [CrossRef]
- Pundir, K.S.S.; Varshney, N.; Singh, G.K. Comparative study of performance of grid connected solar photovoltaic power system in IIT Roorkee campus. In Proceedings of the International Conference on Innovative Trends in Science, Engineering and Management, New Delhi, India, 5 May 2016; pp. 422–431. Available online: http://ijirse.com/wp-content/upload/2016/02/168ijirse.pdf (accessed on 12 June 2023).
- Shukla, A.K.; Sudhakar, K.; Baredar, P. Simulation and performance analysis of 110 kWp grid-connected photovoltaic system for residential building in India: A comparative analysis of various PV technology. Energy Rep. 2016, 2, 82–88. [Google Scholar] [CrossRef]
- Sharma, V.; Chandel, S.S. Performance analysis of a 190 kWp grid interactive solar photovoltaic power plant in India. Energy 2013, 55, 476–485. [Google Scholar] [CrossRef]
- Sharma, R.; Goel, S. Performance Analysis of A 11.2 kWp Roof Top Grid-Connected PV system in Eastern India. Energy Rep. 2017, 3, 76–84. [Google Scholar] [CrossRef]
- Wittkopf, S.; Valliappan, S.; Liu, L.; Ang, K.S.; Cheng, S.C.J. Analytical performance monitoring of a 142.5 kWp grid-connected rooftop BIPV system in Singapore. Renew. Energy 2012, 47, 9–20. [Google Scholar] [CrossRef]
- Ayompe, L.M.; Duffy, A.; McCormack, S.J.; Conlon, M. Measured performance of a 1.72 kW rooftop grid connected photovoltaic system in Ireland. Energy Convers. Manag. 2011, 52, 816–825. [Google Scholar] [CrossRef]
- Okello, C.; Pindozzi, S.; Faugno, S.; Boccia, L. Development of bioenergy technologies in Uganda: A review of progress. Renew. Sustain. Energy Rev. 2013, 18, 55–63. [Google Scholar] [CrossRef]
- Kymakis, E.; Kalykakis, S.; Papazoglou, T.M. Performance analysis of a grid connected photovoltaic park on the island of Crete. Energy Convers. Manag. 2009, 50, 433–438. [Google Scholar] [CrossRef]
- Chaita, A.; Kluabwang, J. Performance evaluation of 3.5 kWp rooftop solar PV plant in Thailand. In Proceedings of the International Multi Conference of Engineers and Computer Scientists, Hong Kong, China, 16–18 March 2016; pp. 572–575. Available online: https://www.iaeng.org/publication/IMECS2016/IMECS2016_pp572-575.pdf (accessed on 10 June 2023).
- Drif, M.; Pérez, P.; Aguilera, J.; Almonacid, G.; Gómez, P.; Casa, J.D.; Aguilar, J.D. Univer Project. A grid connected photovoltaic system of 200 kWp at Jaén University. Overview and performance analysis. Sol. Energy Mater. Sol. Cells 2007, 91, 670–683. [Google Scholar] [CrossRef]
- Sharma, S.; Kurian, C.P.; Paragond, L.S. Solar PV system design using Pvsyst: A case study of an academic Institute. In Proceedings of the International Conference on Control, Power, Communication and Computing Technologies (ICCPCCT), Kannur, India, 23–24 March 2018; pp. 123–128. [Google Scholar] [CrossRef]
- Morshed, M.S.; Ankon, S.M.; Chowdhury, M.T.H.; Rahman, M.A. Designing of a 2 kW stand-alone PV system in Bangladesh using Pvsyst, Homer and SolarMAT. In Proceedings of the 2015 3rd International Conference on Green Energy and Technology (ICGET), Dhaka, Bangladesh, 11 September 2015; pp. 1–6. [Google Scholar] [CrossRef]
- Nirwan, D.; Thakur, T. Performance evaluation of grid connected solar PV plant using Pvsyst. Int. Res. J. Eng. Technol. (IRJET) 2017, 4, 3190–3194. Available online: https://www.ijert.org/research/performance-evaluation-of-grid-connected-solar-photovoltic-plant-using-pvsyst-software-IJERTV9IS100035.pdf (accessed on 28 June 2023).
- Kumar, N.M.; Kumar, M.R.; Rejoice, P.R.; Mathew, M. Performance analysis of 100 kWp grid connected Si-poly photovoltaic system using PVsyst simulation tool. Energy Procedia 2017, 117, 180–189. [Google Scholar] [CrossRef]
- Caglayan, N. Technical and financial optimization of an autonomous renewable power system for a medium-sized dairy farm. Fresenius Environ. Bull. 2020, 29, 1600–1611. [Google Scholar]
- Mutlu, G. Parametric Investigation of the Effect of Environmental Parameters on the Efficiency of Solar Plants. Master’s Thesis, Uludag University, Bursa, Türkiye, October 2021. [Google Scholar]
- Das, M.R. Effect of different environmental factors on performance of solar panel. Int. J. Innov. Technol. Explor. Eng. (IJITEE) 2019, 8, 15–18. [Google Scholar] [CrossRef]
- Skoplaki, E.; Palyvos, J.A.N. On the temperature dependence of photovoltaic module electrical performance: A review of efficiency/power correlations. Sol. Energy 2009, 83, 614–624. [Google Scholar] [CrossRef]
- Dumrul, H.; Yılmaz, S.; Kaya, M.; Ceylan, I. Energy analysis of concentrated photovoltaic/thermal panels with nanofluids. Int. J. Thermodyn. 2021, 24, 227–236. [Google Scholar] [CrossRef]
- Piyatida, T.; Chumnong, S.; Dhirayut, C. Estimating operating cell temperature of BIPV surfaces in Thailand. Renew. Energy 2009, 4, 2515–2523. [Google Scholar] [CrossRef]
- Sahay, A.; Sethi, V.K.; Tiwari, A.C.; Pandey, M. A review of solar photovoltaic panel cooling systems with special reference to ground coupled central panel cooling system (GC-CPCS). Renew. Sustain. Energy Rev. 2015, 42, 306–312. [Google Scholar] [CrossRef]
- Daher, D.H.; Gaillard, L.; Amara, M. and Ménézo, C. Impact of tropical desert maritime climate on the performance of a PV grid-connected power plant. Renew. Energy 2018, 125, 729–737. [Google Scholar] [CrossRef]
- Huld, T.; Šúri, M.; Dunlop, E.D. Comparison of potential solar electricity output from fixed-inclined and two-axis tracking photovoltaic modules in Europe. Prog. Photovolt. 2008, 16, 47–59. [Google Scholar] [CrossRef]
- Kenny, R.P.; Ioannides, A.; Müllejans, H.; Zaaiman, W.; Dunlop, E.D. Performance of thin film PV modules. Thin Solid Films 2006, 511–512, 663–672. [Google Scholar] [CrossRef]
- Ciulla, G.; Lo Brano, V.; Di Dio, V.; Cipriani, G. A comparison of different one-diode models for the representation of I–V characteristic of a PV cell. Renew. Sustain. Energy Rev. 2014, 32, 684–696. [Google Scholar] [CrossRef]
- Ma, T.; Yan, H.; Lu, L. Solar photovoltaic system modeling and performance prediction. Renew. Sustain. Energy Rev. 2014, 36, 304–315. [Google Scholar] [CrossRef]
- Lo Brano, V.; Orioli, A.; Ciulla, G. On the experimental validation of an improved five-parameter model for silicon photovoltaic modules. Sol. Energy Mater. Sol. Cells 2012, 105, 27–39. [Google Scholar] [CrossRef]
- Marion, B.; Adelstein, J.; Boyle, K.; Hayden, H.; Hammond, B.; Fletcher, T.; Canada, B.; Narang, D.; Kimber, A.; Mitchell, L.; et al. Performance parameters for grid-connected PV systems. In Proceedings of the Conference Record of the Thirty-First IEEE Photovoltaic Specialists Conference, Lake Buena Vista, FL, USA, 3–7 January 2005; pp. 1601–1606. [Google Scholar] [CrossRef]
- Aste, N.; Del Pero, C.; Leonforte, F. The first installation under the Italian PV Rooftop Programme: A performance analysis referred to 11 years of operation. In Proceedings of the International Conference on Clean Electrical Power, Alghero, Italy, 11–13 June 2013; pp. 628–633. Available online: https://ieeexplore.ieee.org/document/6586951 (accessed on 8 May 2023).
- Milosavljević, D.D.; Pavlović, T.M.; Piršl, D.S. Performance analysis of A grid-connected solar PV plant in Niš, republic of Serbia. Renew. Sustain. Energy Rev. 2015, 44, 423–435. [Google Scholar] [CrossRef]
- Öztürk, H.H.; Küçükerdem, K.; Gökalp, Y. Research on use of solar energy in agricultural irrigation. In Proceedings of the International Multidisciplinary Congress of Eurasia, Odessa, Ukraina, 11–13 July 2016; Volume 1, pp. 537–543. Available online: http://www.imcofe.org/2016/images/cilt1.pdf (accessed on 8 May 2023).
- Gedik, T.; Akyüz, K.C.; Akyüz, İ. Preparation and evaluation of the investment projects (Analyzing the methods of internal return and net present value). J. Bartin Fac. For. (BAROFD) 2005, 7, 51–61. Available online: https://dergipark.org.tr/tr/pub/barofd/issue/3407/46885 (accessed on 8 May 2023).
- Yalılı, M. Financial analysis of licensed solar PV investment: A case study of Van province. BEU J. Sci. 2021, 10, 1055–1074. [Google Scholar] [CrossRef]
- Bilgili, M.E.; Akyüz, A. Techno-economic design of photovoltaic systems in agricultural enterprises in Cukurova conditions. Soil Water J. 2019, 8, 61–69. [Google Scholar] [CrossRef]
- Somasundaram, S.; Tay, A.A.O. Performance study and economic analysis of photovoltaic thermal system under real-life thermal loads in tropical climate. Sustain. Environ. Res. 2019, 29, 34. [Google Scholar] [CrossRef]
- NREL. A Manual for the Economic Evaluation of Energy Efficiency and Renewable Energy Technologies. Available online: https://www.nrel.gov/docs/legosti/old/5173.pdf (accessed on 3 March 2023).
- TSMS. Data Set for Year-Round Climate and Weather in Elmali Region. Turkish State Meteorological Service 1998–2022. Available online: https://www.mgm.gov.tr/eng/forecast-cities.aspx (accessed on 3 March 2023).
- GEPA. Solar Energy Potential Atlas. Available online: https://gepa.enerji.gov.tr/MyCalculator/ (accessed on 20 August 2022).
- Solar resource map Solargis. Solar resource maps of Europe. Available online: https://solargis.com (accessed on 15 September 2023).
- CW. Solar Panel (600 Wp 120PM M12 HC-MB). Available online: https://www.cw-enerji.com/tr/urun/cw-enerji-600wp-120pm-m12-hc-mb-gunes-paneli-764.html (accessed on 22 August 2022).
- Sungrow. Inverter Technical Guide (49.5 kW SG49K5J). Available online: https://pdf.directindustry.com/pdf/sungrow/sg49k5j/182915-683761.html (accessed on 22 August 2022).
- Mondol, J.D.; Yohanis, Y.; Smyth, M.; Norton, B. Long term performance analysis of a grid connected photovoltaic system in Northern Ireland. Energy Convers. Manag. 2006, 47, 2925–2947. [Google Scholar] [CrossRef]
- Ondraczek, J. Are we there yet? Improving solar PV economics and power planning in developing countries: The case of Kenya. Renew. Sustain. Energy Rev. 2014, 30, 604–615. [Google Scholar] [CrossRef]
- Taktak, F.; Ili, M. Solar power plant (SPP) development: An example of Usak. J. Geomat. 2018, 3, 1–21. [Google Scholar] [CrossRef][Green Version]
- EMRA. Tariff Tables Based on Electricity Bills. Available online: https://www.epdk.gov.tr/Detay/Icerik/3-1327/elektrik-faturalarina-esas-tarife-tablolari (accessed on 23 August 2022).
- Rodríguez-Martinez, Á.; Rodríguez-Monroy, C. Economic Analysis and Modelling of Rooftop Photovoltaic Systems in Spain for Industrial Self-Consumption. Energies 2021, 14, 7307. [Google Scholar] [CrossRef]
- Kahraman, M.Ü. Kütahya Area’s Solar and Wiınd Energies Potentials’ Techno-Economic Analysis. Master’s Thesis, Dumlupinar University, Kutahya, Türkiye, August 2018. [Google Scholar]
- CBRT. Türkiye Central Bank Rates. Available online: https://www.tcmb.gov.tr/kurlar/kurlar_tr.html (accessed on 23 August 2022).
- Kumruoğlu, L.C.; Ateş, S.B. Turkey’s solar energy potential and sample production projection for İskenderun. Cukurova Univ. J. Fac. Eng. 2022, 37, 293–305. [Google Scholar]
- Öztürk, H. Comparison of Production and Simulation Values of a Solar Power Plant and Loss Analysis: Case of Beştepe Energy Company. Master’s Thesis, Hasan Kalyoncu University, Gaziantep, Türkiye, January 2021. [Google Scholar]
- Atakul, Ş.; Kalender, M.A.; Gezici, M.; Eliçin, A.K. Solar field setup. J. Agric. Mach. Sci. 2015, 11, 55–60. Available online: https://dergipark.org.tr/tr/pub/tarmak/issue/36242/408292 (accessed on 15 June 2023).
- Eremkere, M.; Aktaş, T. Analysis of technical, economic, and environmental aspects of photovoltaic designs: A case study on Tekirdağ viticulture research institute grape juice processing building roof. El-Cezerî J. Sci. Eng. (ECJSE) 2020, 7, 275–294. [Google Scholar] [CrossRef]
- MENR. Unlicensed Electricity Generation. Available online: https://enerji.gov.tr/eigm-yenilenebilir-enerji-uretim-faaliyetleri-lisassiz-elektrik-uretimi (accessed on 14 June 2022).
- IEA. Electricity Market Report. Available online: https://www.iea.org/reports/electricity-market-report-july-2022 (accessed on 25 August 2022).
- Turkish Statistical Institute. Greenhouse Gas Emission Statistics. Available online: https://data.tuik.gov.tr/Bulten/Index?p=Sera-Gazi-Emisyon-Istatistikleri-1990-2019-37196 (accessed on 25 August 2022).
- Anonymous. Dairy Sector Statistics in the World and Turkey. National Milk Council. 2020. Available online: https://ulusalsutkonseyi.org.tr/wp-content/uploads/Sut-Sektor-Istatistikleri-2020.pdf (accessed on 28 May 2023).
- Messineo, A.; Volpe, R.; Marvuglia, A. Ligno-cellulosic biomass exploitation for power generation: A case study in Sicily. Energy 2012, 45, 613–625. [Google Scholar] [CrossRef]
- Messineo, A.; Panno, D. Municipal waste management in Sicily: Practices and challenges. Waste Manag. 2008, 28, 1201–1208. [Google Scholar] [CrossRef]
- Mekhilef, S.; Faramarzi, S.Z.; Saidur, R.; Salam, Z. The application of solar technologies for sustainable development of agricultural sector. Renew. Sustain. Energy Rev. 2013, 18, 583–594. [Google Scholar] [CrossRef]
- Asdrubali, F.; Cotana, F.; Messineo, A. On the Evaluation of solar greenhouse efficiency in building simulation during the heating period. Energies 2012, 5, 1864–1880. [Google Scholar] [CrossRef]
- Wazed, S.M.; Hughes, B.R.; O’Connor, D.; Kaiser, J.; Calautit, J. Solar Driven Irrigation Systems for Remote Rural Farms. Energy Procedia 2017, 142, 184–191. [Google Scholar] [CrossRef]
Disclaimer/Publisher’s Note: The statements, opinions and data contained in all publications are solely those of the individual author(s) and contributor(s) and not of MDPI and/or the editor(s). MDPI and/or the editor(s) disclaim responsibility for any injury to people or property resulting from any ideas, methods, instructions or products referred to in the content. |
© 2023 by the author. Licensee MDPI, Basel, Switzerland. This article is an open access article distributed under the terms and conditions of the Creative Commons Attribution (CC BY) license (https://creativecommons.org/licenses/by/4.0/).